development and application of new psychophysical …
TRANSCRIPT

THROUGH SCIENCE WE DEFEND
TECHNICAL REPORT AD
NATICK/TR-02/022
DEVELOPMENT AND APPLICATION OF NEW PSYCHOPHYSICAL METHODS FOR THE
CHARACTERIZATION OF THE HANDFEEL AND COMFORT PROPERTIES OF MILITARY CLOTHING
FABRICS
by Armand V. Cardello Howard G. Schutz
And Carole Winterhalter
August 2002
Final Report October 1998 - September 2001
Approved for public release; distribution is unlimited
U.S. Army Soldier and Biological Chemical Command Soldier Systems Center
Natick, Massachusetts 01760-5020
20020910 007

'■» ■■ ■*■
DISCLAIMERS
The findings contained in this report are not to
be construed as an official Department of the Army
position unless so designated by other authorized
documents.
Citation of trade names in this report does not
constitute an official endorsement or approval of
the use of such items.
DESTRUCTION NOTICE
For Classified Documents:
Follow the procedures in DoD 5200.22-M, Industrial
Security Manual, Section D-19 or DoD 5200.1-R,
Information Security Program Regulation, Chapter DC.
For Unclassified/Limited Distribution Documents:
Destroy by any method that prevents disclosure of
contents or reconstruction of the document.

REPORT DOCUMENTATION PAGE Form Approved OMB No. 0704-0188
The public reporting burden for this collection of information is estimated to average 1 hour per response, including the time for reviewing instructions, searching existing data sources.
subject to any penalty for failing to comply with a collection of information if it does not display a currently valid OMB control number. PLEASE DO NOT RETURN YOUR FORM TO THE ABOVE ADDRESS. 1. REPORT DATE (DD-MM-YYYY)
14-08-2002 2. REPORT TYPE
Final 4. TITLE AND SUBTITLE DEVELOPMENT AND APPLICATION OF NEW PSYCHOPHYSICAL METHODS FOR THE CHARACTERIZATION OF THE HANDFEEL AND COMFORT PROPERTIES OF MILITARY CLOTHING FABRICS
6. AUTHOR(S) Armand V. Cardello, Howard G. Schutz, and Carole Winterhalter
3. DATES COVERED (From - To) October 1998-September 2001
5a. CONTRACT NUMBER
5b. GRANT NUMBER
5c. PROGRAM ELEMENT NUMBER
5d. PROJECT NUMBER
5e. TASK NUMBER
5f. WORK UNIT NUMBER 908BAG
7. PERFORMING ORGANIZATION NAME(S) AND ADDRESS(ES) U.S. Army Soldier and Biological Chemical Command (SBCCOM) U.S. Army Soldier Center, Product Optimization and Evaluation Team Kansas St. ATTN: AMSSB-RSS-P(N) Natick, MA 01760-5020 ATTN: Armand V. Cardello
8. PERFORMING ORGANIZATION REPORT NUMBER
NATICK/TR-02/022
9. SPONSORING/MONITORING AGENCY NAME(S) AND ADDRESS(ES) 10. SPONSOR/MONITORS ACRONYM(S)
11. SPONSOR/MONITORS REPORT NUMBER(S)
12. DISTRIBUTION/AVAILABILITY STATEMENT Approved for public release: distribution is unlimited
13. SUPPLEMENTARY NOTES
14. ABSTRACT The analysis of fabric characteristics that contribute to military clothing comfort was addressed in a series of studies. Trained panel sensory descriptive data on 13 military fabrics were obtained using a standardized handfeel evaluation method. A labeled magnitude scale of comfort was developed from consumer magnitude estimates of the semantic meaning of 26 verbal phrases denoting different levels of comfort/discomfort. This scale was used by 36 consumers to rate the handfeel comfort of the 13 test fabrics. The descriptive sensory data and comfort data were then combined with Kawabata data obtained on a subset of the test fabrics and the data were analyzed using principal components analysis. Multiple regression analyses were performed on the component scores to predict consumer comfort from the sensory and instrumental data. The results showed a high degree of predictability of comfort responses from a combination of sensory and Kawabata parameters.
15. SUBJECT TERMS PSYCHOPHYSICAL METHODS MILITARY CLOTHING SENSORY ANALYSIS CONSUMER PRF.FFRF.MrFS
COMFORT COMFORT INDEX COMFORT TESTS CTOTHTNT, COMFORT
FABRICS TEXTILES
TEXTILE PROPERTIES HITMAN FACTORS KNOINEEBTNn
16. SECURITY CLASSIFICATION OF: a. REPORT
U b. ABSTRACT
U c. THIS PAGE
U
17. LIMITATION OF ABSTRACT
SAR
18. NUMBER OF PAGES
62
19a. NAME OF RESPONSIBLE PERSON Armand V. Cardello
19b. TI_rPHONE NUMBER (Include area code) (508) 233-4720
Standard Form 298 (Rev. 8/98) Prescribed by ANSI Std. Z39.18

TABLE OF CONTENTS
List of Figures List of Tables Preface Acknowledgements
INTRODUCTION
OBJECTIVES PHASE 1
PHASE 2
PHASE 3
PHASE 4
PHASE 5
DISCUSSION AND CONCLUSIONS
REFERENCES APPENDIX
Genera] Background Recent Developments in Descriptive Handfeel Analysis Comfort and Comfort Scaling
Methods Results/Discussion
Methods Results/Discussion
Experiment 1 Methods Results/Discussion
Experiment 2 Methods Results/Discussion
Experiment 3 Methods Results/Discussion
Methods Results/Discussion
Methods Results/Discussion
Page iv iv vi vi
1 3 4 7 7 7 8 12 12 15 20 21 21 22 27 27 28 30 30 30 31 31 32 35 35 37
43 46 51
in

List of Figures
Figure 1. View of sensory panel testing facility 13
Figure 2. Mean panel ratings of handfeel attributes obtained on each of several different test sessions for poly/wool serge (a), Tencel ripstop poplin (b), and a jersey knit fabric (c).Panel d shows the ratings for each fabric averaged over test sessions 14
Figure 3. Mean panel ratings of handfeel attributes averaged over three replicates for four of the eight fabrics tested in Phase 2 16
Figure 4. Mean panel ratings of handfeel attributes averaged over three replicates for the remaining four of the eight fabrics tested in Phase 2 17
Figure 5. The Comfort Affective Labeled Magnitude (CALM) scale 26
List of Tables
Table 1. Definitions of fabric handfeel attributes 9
Table 2. Operational techniques for the evaluation of handfeel attributes 10
Table 3. Fabric reference standards defining intensity scales for each handfeel attribute 11
Table 4. Fabrics used in Phase 2 and Phase 5 research 15
Table 5. F values, p values, and number of significant subsets of the 8 test fabrics for each of the 17 handfeel attributes 19
Table 6. Pearson correlation coefficients (>.90) among all pairs of handfeel attributes 21
Table 7. Word phrases, geometric mean magnitude estimates, and standard errors Divided by the geometric means for the data from Phase 3 (n=35) 23
Table 8. The six written comfort scenarios used in Phase 2, Experiment 2 28
Table 9. Means and standard deviations of comfort ratings for the 8 scenarios used in Experiment 2, Phase 3 (n=26) 29
IV

Table 10. Means, standard deviations, and standard errors of comfort ratings for the 3 gloves used in Phase 2, Experiment 3 (n=37) 31
Table 11. Mean comfort ratings for the 13 fabrics used in Experiment 3, Phase 3 (n=35) 33
Table 12. Pearson product-moment correlation coefficients for individual handfeel attributes and the mean intensity across all attributes with judged comfort 34
Table 13. Kawabata parameters and associated units of measure 36
Table 14. Definitions of Kawabata primary hand expressions 36
Table 15. Pearson correlation coefficients (>.50) between Kawabata hand values and handfeel attributes evaluated by the HSDA method 38
Table 16. Rotated PCA matrix for Kawabata mechanical parameters 39
Table 17. Rotated PC A matrix for HSDA handfeel attributes 39
Table 18. Rotated PCA matrix for HSDA handfeel attributes plus comfort 40
Table 19. Rotated PCA matrix for Kawabata mechanical parameters plus comfort 41

Preface
This report details joint studies undertaken by the Science and Technology Directorate
and the Individual Protection Directorate of the Natick Soldier Center as part of the Center's
overall program on military clothing comfort. With the change from material specifications of
military uniforms and equipment to performance specifications of these items, the need arose to
be able to index clothing comfort using an objective and standardized method of evaluation. To
meet this need, the Industry-Government Working Group on Military Clothing Comfort was
established to provide recommendations and guidance on how best to predict clothing comfort
using standardized sensory or instrumental methods. As a result of these working group
deliberations, a strategy was developed to assess a wide range of fabrics used by U.S. and other
NATO countries for battledress uniforms. The first phase of this strategy involved the evaluation
of selected fabrics for their sensory handfeel properties, their physical (instrumental) properties,
and their perceived handfeel comfort using standardized methods of measurement. Using these
data, predictive equations could be developed to predict uniform comfort from these standardized
tests. The second phase of research would extend this predictive methodology to the comfort of
battledress uniforms made from these fabrics and worn by soldiers in controlled wear trials.
This report describes the development of methods and procedures for use in the first
phase of this research, as well as the results of testing conducted on the selected fabrics and the
predictive relationships obtained between the sensory, instrumental and comfort properties of the
fabrics. Based on the results of this research, fabrics have been selected for use in wear trials that
are now being planned as part of the second phase of the overall research program.
Acknowledgments
The authors would like to thank Jim Whitworth of Milliken Research Corporation,
Spartanburg, SC for conducting the Kawabata analyses, Larry Lesher of GEO-CENTERS, INC.
for help with statistical analysis of the data, and the Industry/Government Working Group on
Military Clothing Comfort and the Technical Cooperative Panel for their technical input
concerning the British, Australian, and Canadian military fabrics.
vi

DEVELOPMENT AND APPLICATION OF NEW PSYCHOPHYSICAL METHODS
FOR THE CHARACTERIZATION OF THE HANDFEEL AND COMFORT
PROPERTIES OF MILITARY CLOTHING FABRICS
Introduction
General Background
The United States Department of Defense (DoD) procures over 1.1 billion dollars of
clothing and individual equipment each year. A large portion of these expenditures goes toward
the purchase of Battle Dress Uniforms (BDU), the two-piece, camouflage uniforms worn by
troops in combat, training and garrison situations. While the comfort of these garments has been
a major consideration in their design and development, much of the research to date has focussed
on the thermal comfort of the garments, because thermal stress is a major contributing factor to
human performance degradation. More recently, focus has turned toward the less studied area of
tactile comfort. This refocusing has been precipitated both by the knowledge that the BDU is
worn on a daily basis in garrison situations, where heat stress is less of an issue than in combat,
and the fact that procurement policy changes have moved DoD away from specifications of
fabric composition and toward specifications based on functional or performance characteristics,
e.g., durability and comfort criteria. In order to better understand and quantify the tactile comfort
of military clothing and to determine predictive relationships between fabric properties, sensory
experiences and consumer comfort, a research program was initiated to identify and define the
critical factors contributing to the tactile comfort of military fabrics and to apply and/or develop
advanced psychophysical methodologies by which to measure both fabric tactile properties and
the comfort of fabrics and garments.
Although the sensory and comfort properties of textiles have influenced consumer
clothing choices since man first sought protection from the elements, scientific study of the
perceptual and affective responses to clothing did not originate until the early years of the past
century. It was during this time that early investigators, such as Binns, Pierce, Winslow,
Houghton and Yaglou, and others, began the systematic analysis of the subjective responses to
textiles and clothing [1-5]. From these early efforts evolved the conceptual bases for the study of
fabric "hand" and the analysis of the determinants of sensory, thermal, and overall clothing
1

comfort. While the next 50 years produced a growing volume of literature on these topics, the
study of the human responses to clothing materials suffered from a lack of theoretical models to
guide research in the field. As a result, the field was plagued by idiosyncratic and undefined
terminology, a lack of operational constructs, confusion over the type of panelists to use, failure
to adopt modern psychophysical techniques, and general confusion in communication about
fabric attributes and qualities [6-9].
Beginning with the work of Fourt and Hollies [10], a better conceptualization of clothing
comfort began to emerge, one that placed focus on three important components of clothing
comfort: the person, the clothing, and the environment. Subsequent theoretical work by Slater
[11,12], Rohles [13,14], Pontrelli [15], and Sontag [16] drew finer conceptual and empirical
distinctions among the physical factors of both the garment and the environment, the
physiological and sensory responses of the individual, psychological "filters" by which these
latter responses are modified prior to conscious awareness, and the final affective response that
we call comfort (see Branson and Sweeney [17] for a more detailed review of these theoretical
developments). Within the context of this evolving theoretical framework, it became possible to
better isolate the variables contributing to clothing comfort and to begin the refinement of
techniques for measuring both these antecedent variables and the primary dependent variable of
clothing comfort itself.
Measuring the subjective responses associated with clothing comfort, whether purely
sensory (tactile) or affective (comfort) in nature, and whether felt on the body surfaces during
wear of the garment or felt by the hand in response to handling of the fabrics, falls within the
disciplinary areas of sensory psychology and psychophysics. In addition, when considering the
sensations that arise from the contact of clothing fabrics with the skin, there are two fundamental
psychological dimensions that must be considered. The first is qualitative (descriptive) and
relates to the specific sensory quality or attribute that is being judged, e.g. roughness, stiffness,
etc. The second is quantitative (intensive) in nature and relates to the perceived intensity of that
sensation, e.g. very rough, slightly stiff, etc. Both dimensions of experience are involved in the
perception of fabrics on the skin, and the methodologies used to identify and define these
dimensions are critical elements determining the validity of the data and the types of conclusions
that can be drawn from the data.

Recent Developments in Sensory Descriptive Handfeel Analysis
Civille and Dus [9] reviewed previously published studies on the development of sensory
handfeel attributes, terminology, and systems. Confirming several earlier analyses [6,7,18] they
concluded that there were significant deficiencies in the published methods in terms of the
development of primary (discrete and independent) tactile characteristics, the operationalization
of terminology and evaluation procedures, proper scaling methodology, subject/panelist training,
and general test protocols and controls. In response to this lack of standardization, Civille and
Dus [9] developed the Handfeel Spectrum Descriptive Analysis (HSDA) method as a more
analytical, comprehensive, and controlled approach to the sensory analysis of woven and non-
woven fabrics. This method is modeled after similar and highly successful descriptive methods
used for sensory analysis of other consumer products, e.g. foods, perfumes and skin care products
[19,20]. The attribute terms and protocols for the HSDA method have been reviewed and refined
by the Other Senses Task Group (El8.02.06.03) of ASTM Committee E-18 and the use of the
method for the descriptive analysis of textiles has been reported previously [21,22].
The development of the HSDA method significantly enhanced the capability to define
and study the qualitative aspects of sensory handfeel experience by establishing operationally
defined terminology for primary attributes of sensory experience that are free of affective
(good/bad) associations. Furthermore, by avoiding idiosyncratic terminology and the unnatural
separation of the visual component of handfeel [6,23,24], the method minimizes differences
between trained panelist ratings and consumer perceptions, significantly improving the likelihood
of developing predictive relationships with consumer comfort. Since a major goal of the HSDA
methodology is inter-laboratory standardization, the psychophysical scaling method that is used
utilizes physical fabric standards as reference points along a 15-pt intensity scale for each
handfeel attribute (the use of bipolar scales introduces confounding of attributes, as defined by
the polar adjectives). So, for example, the intensity scale for fabric "stiffness" is anchored at the
upper end by a cotton organdy standard, having a stiffness rating of 14.0, and at the lower end by
a 50/50% polyester/cotton single knit fabric, having a stiffness rating of 1.3. Other fabrics define
intermediate points on the stiffness continuum, while other sets of fabric standards define the
intensity scales for other attributes [9,25]. Such stimulus-referenced or "learned" rating scales
are widely used in commercial sensory evaluation and are particularly effective in helping to

conceptualize and define the stimulus dimension of interest. In addition, these scales have been
shown to reduce intersubject variability [26], and can be easily transferred from one subject
group to another, thereby ensuring high inter-laboratory reliability.
Comfort and Comfort Scaling
Although a valid and reliable system for quantifying the descriptive handfeel attributes of
fabrics is a logical prerequisite for identifying the fabric attributes that contribute to clothing
comfort, no less important is a reliable and valid measure of comfort itself. Unlike tactile
attributes, comfort is not a sensory dimension. It is not associated directly with any single human
sense organ. Rather, it is an evaluative or affective dimension, similar to liking. Thus, there is
no underlying physical dimension of the stimulus that varies continuously and is monotonic with
the perception of comfort. The same stimulus can elicit different comfort responses from
different individuals. For example, one individual may feel that a particular fabric, e.g., wool, is
comfortable, while another person might deem it extremely uncomfortable. As a result, it is not
possible to define a scale of comfort based on physical standards that are meaningful to all users.
In addition, comfort is an affective dimension, and is only appropriately judged by untrained
consumers. This requires a method for scaling comfort that is simple and unencumbered by the
necessity for training or complex instructions.
In mathematics there are four discrete levels of measurement that can be used to index the
quantitative relationships among objects. In increasing order of mathematical refinement, they
are 1) nominal scaling (naming with numbers), 2) ordinal scaling (assigning rank), 3) interval
scaling (intervals between numbers define equal quantities of the measured object/dimension),
and 4) ratio scaling (there is a true zero point and the ratios among the numbers have meaning in
terms of the measured objects/dimension). For the purpose of rating the sensory or affective
experiences of individuals, a type of scale known as a category scale is the most common. These
scales are characterized by a series of labeled points or categories. Individuals rate their
subjective sensations by placing them into one of several available descriptive categories. Since
less than five categories can result in a loss of discrimination sensitivity, the number of
categories is typically around 9-10 [27], but can be much greater [25]. Several of the best known
category scales for evaluating clothing sensations and/or comfort are Hollies' Subjective Comfort
Rating Chart [28, 29], which uses both a category scale of intensity (partially, mildly, definitely,
totally) and the 13 point McGinnis category scale of comfort, and Gagge, et al.'s, [30] scale of
comfort sensation (comfortable, slightly uncomfortable, uncomfortable, very uncomfortable).
The reasons for the widespread use of category scales to measure not only subjective comfort,
but a variety of other psychological dimensions, include their simplicity, versatility, ease of use
by subjects, and their good reliability.
In spite of these advantages, there are significant problems associated with the use of
category scales. Although it is often assumed that the points on a numbered category scale
represent equal subjective intervals, that is, the perceived difference in comfort (stiffness, etc.)
between a rating of 1 and 3 on the scale is equal to the perceived difference in comfort (stiffness,
etc.) between a rating of 3 and 5 on the scale, this is not always the case [31]. On labeled
category scales, subjects attend primarily to the word labels and not to the numbers [32]. In these
cases, unless the verbal labels are chosen on the basis of extensive testing to verify that such
differences as those between "slightly comfortable" and "moderately comfortable" are the same
as those between "moderately comfortable" and "extremely comfortable", then the scale cannot
be considered an interval scale, but merely an ordinal scale. This has implications for the type of
statistics to be applied to the data (non-parametric vs. parametric). In addition, both the range and
frequency of stimuli to be evaluated can significantly influence category scale ratings [33, 34].
Another common problem with category scales is that subjects tend not to use the end
categories, because they fear that if they use them to describe one sensation and then they
experience an even more extreme sensation, they will have no rating left to assign to the more
extreme sensation [31, 35]. As a result of this "category end effect," seven-point category scales
are essentially reduced to five-point scales, five-point scales to three-point scales, etc. A further
complication occurs in those cases where the category scale is bi-directional and utilizes a
"neutral" category. The use of such categories has been shown to encourage subjects to be non-
committal in their responses, i.e., they overly rely on this "safe" category [36]. Elimination of
the neutral category has been shown to increase the efficiency of category scales [37].
An alternative approach to the psychophysical scaling of perceived intensity that avoids
the above problems, while providing ratio level data, was developed by S.S. Stevens [38].
Stevens believed that sensory intensity could only be measured accurately using ratio scales.
Working on this assumption, he developed a ratio method in which subjects were allowed to

assign their own internal numbers to represent the magnitude of their sensations. He named the
method "magnitude estimation" [38, 39]. Magnitude estimation avoids the major problems of
category scaling by providing an unbounded upper limit for ratings. In addition, because
magnitude estimation uses a true zero point of sensation and because all judgments are made
relative to one another in a ratio manner (e.g., stimulus X is three times (one-half, etc.) as stiff
(comfortable, etc.) as stimulus Y), the resultant data provide a ratio scale of the subjective
dimension being evaluated, allowing for valid parametric analyses of the data.
In several studies examining the human sensory and comfort responses to clothing and
textiles, magnitude estimation has been successfully used as a ratio scale measure of tactile
responses [40-43]. Although this technique significantly increases the ability to accurately
quantify subjective sensations, magnitude estimation requires that sensations be directly
compared to one another, thereby precluding judgments that must be made over extended time
periods. In addition, magnitude estimation requires detailed instruction for proper use and time-
consuming normalization of the data prior to statistical analysis. More recently, these practical
limitations of magnitude estimation have been eliminated by the development of semantic ratio
scales (often called "labeled magnitude scales"). These scales commonly take the form of visual
analogue or "line" scales, but they posses anchored verbal labels that define a ratio scale of
sensory magnitude. This stands in contrast to unlabeled visual analogue scales, e.g., [44], which
rely on the instructional set to create the ratio scale, but constrain ratings by having a
circumscribed line length. The first such scale of this type was the "Borg" scale of perceived
exertion [45]. However, similar labeled magnitude scales have been developed for both sensory
[46] and affective [47] continua.
The above developments in psychophysical methodology that enable better quantification
of both the descriptive aspects of handfeel sensations and the quantification of the affective
dimension of handfeel experience open the possibility of a more well-grounded psychophysical
approach to the study of the sensory and comfort characteristic of clothing fabrics. Combining
these new sensory methodologies with established instrumental measures of fabric
characterization, e.g., the Kawabata [48-50] system now makes it possible to develop better
predictive relationships between sensory, instrumental, and comfort measures of fabrics.

Objectives
With this in mind, a multiphase research program was initiated to (1) establish a
standardized methodology for the assessment of the sensory tactile characterization of military
fabrics, (2) to develop a labeled affective magnitude scale specific for rating fabric/clothing
comfort, (3) to apply the methods developed in (1) and (2) to the characterization of a variety of
military fabrics, and (4) to develop predictive relationships between the tactile attributes of the
fabrics, their instrumental properties, and their perceived comfort.
Phase 1: Establishment of a Descriptive Profile Panel for Assessing Fabric Handfeel: Descriptive Profiles and Panel Reliability/Sensitivity
The ability to reliably describe the sensory handfeel properties of clothing fabrics is
essential to understanding the contribution of fabric characteristics to clothing comfort. In order
to acquire these data on a continuing basis, the U.S. Army Natick Soldier Center (NATICK) took
the necessary steps to train, develop, and maintain an in-house, sensory descriptive handfeel
panel. Upon completion of training, the sensitivity and reliability of the panel was assessed.
Methods: Fifteen panelists (10 females, 5 males) were selected from volunteer
employees at NATICK. Panelists were chosen on the basis of interest, availability, and
successful completion of a screening test to establish minimum tactile acuity i.e., the ability to
detect differences in the magnitude of selected tactile attributes [9]. Such screening was
necessary because tactile acuity/sensitivity has been shown to vary as a function of age [51],
degree of skin hydration/wettedness [52], dermatitis, and other factors. The selected panelists
included both individuals working in the area of materials and textiles, as well as others.
Panelists participated in a six month training program that consisted of 1) a one-week
training program on the basic methodology and evaluation techniques employed in the Handfeel
Spectrum Descriptive Analysis Method [9] and exposure and practice with operational attribute
definitions and a series of fabric intensity scales for each of 17 different sensory handfeel
attributes (4 related to fabric and surface geometry, 10 related to mechanical properties and 2 to
sound properties), 2) two months of twice-weekly panel meetings to reinforce these concepts,
attribute definitions, and rating scales, 3) a second one-week training period in which the 17
attribute definitions were tailored to the specific nature of the military clothing fabrics to be used
7

in subsequent testing (Table 1), the final list of operational techniques of evaluation for each
attribute were developed (Table 2), and a new set of fabrics were selected to serve as physical
standards to define intensity scales for each attribute (Table 3), and 4) 3 months of bi-weekly
practice sessions to solidify definitions and reduce between-panelist variability.
In order to assess the reliability and sensitivity of the HSDA method in combination with
the panel training procedures, a test-retest reliability study was conducted at the completion of
training. Three fabrics were selected for evaluation: a jersey knit fabric, a polyester/wool serge
fabric (MDDL-C-823), and a Tencel® ripstop poplin fabric. Choice of fabrics was based on the
desire to represent as wide a range of tactile attributes as might be encountered in future testing
and to include two similar and one dissimilar (jersey knit) fabric. The 3 test fabrics were
evaluated by the panel on two separate occasions separated by a two-week interval. In addition,
two of the test fabrics (Tencel® ripstop poplin and polyester/wool surge fabric) were tested
again, six months later to assess long term reliability. All testing was conducted in a textile
conditioning room at a temperature of 70 ±1.4 F and at 65% ±1.3 RH. Testing was conducted at
large open tables with smooth, black, stone-top surfaces (Figure 1). Panelists evaluated test
samples on their "face" (labeled) surface, independently, and in random order using the 17
attribute definitions (Table 1) and intensity standards (Table 3) developed during training. All
fabrics were laundered five times in accordance with American Association of Textile Chemists
and Colorists (AATCC) test method #96, test condition Hie, tumble dry (option A). After
laundering the fabric was cut into 30cm x30cm swatches, with edges parallel to the fabric warp
and filling directions. All edges were serrated to prevent raveling.
Results/Discussion: Figs 2a, b & c show the descriptive attribute ratings for the two
samples that were evaluated during all 3 test sessions (a, b) and the one fabric tested during two
separate sessions (c). Fig 2d shows the average panel data for all three fabrics. Looking at the
fabric profiles in Fig 2, one can observe significant differences in the attribute profiles between
different fabrics (Figure 2d), but a high degree of similarity in the profiles obtained for the same
fabrics on different dates of testing (Figs 2a, b, c). For example, in Fig. 2d, it can be observed
that the poly/wool serge fabric differed greatly from the Tencel® ripstop on such attributes as
"grainy," "gritty," "thickness," "force to gather," "stiffness," and the "intensity of compressive

Table 1. Definitions of fabric handfeel attributes *
Grainy
Gritty
Fuzziness
Thickness
Tensile Stretch
Hand Friction
The amount of small, round particles in the surface of the sample.
The amount of small, abrasive, picky particles in the surface of the sample.
The amount of pile, fiber, fuzz on the surface of the sample.
The perceived distance between the thumb and index finger (when the sample is placed between the two).
The degree to which the sample stretches from its original shape.
The force required to move the palm of the hand across the surface of the sample.
Fabric-Fabric Friction The force required to move the fabric over itself.
Depression Depth The amount that the sample depresses when downward force is applied.
Springiness
Force to Gather
Stiffness
Force to Compress
Fullness/Volume
Compression Resilience Intensity
Compression Resilience Rate
Noise Intensity
Noise Pitch
The rate at which the sample returns to its original position after the downward force is released.
The amount of force required to compress the gathered sample into the palm.
The degree to which the sample feels pointed, ridged and cracked; not pliable.
The amount of force required to compress the gathered sample into the palm.
The amount of material felt in the hand .
The perceived force with which the sample exerts resistive pressure against the cupped hands.
The rate at which the sample returns to its original shape or the rate at which the sample opens after compression.
The loudness of the noise.
The pitch (frequency) of the noise.
* See Table 2 for the specific operational techniques by which each attribute is evaluated.
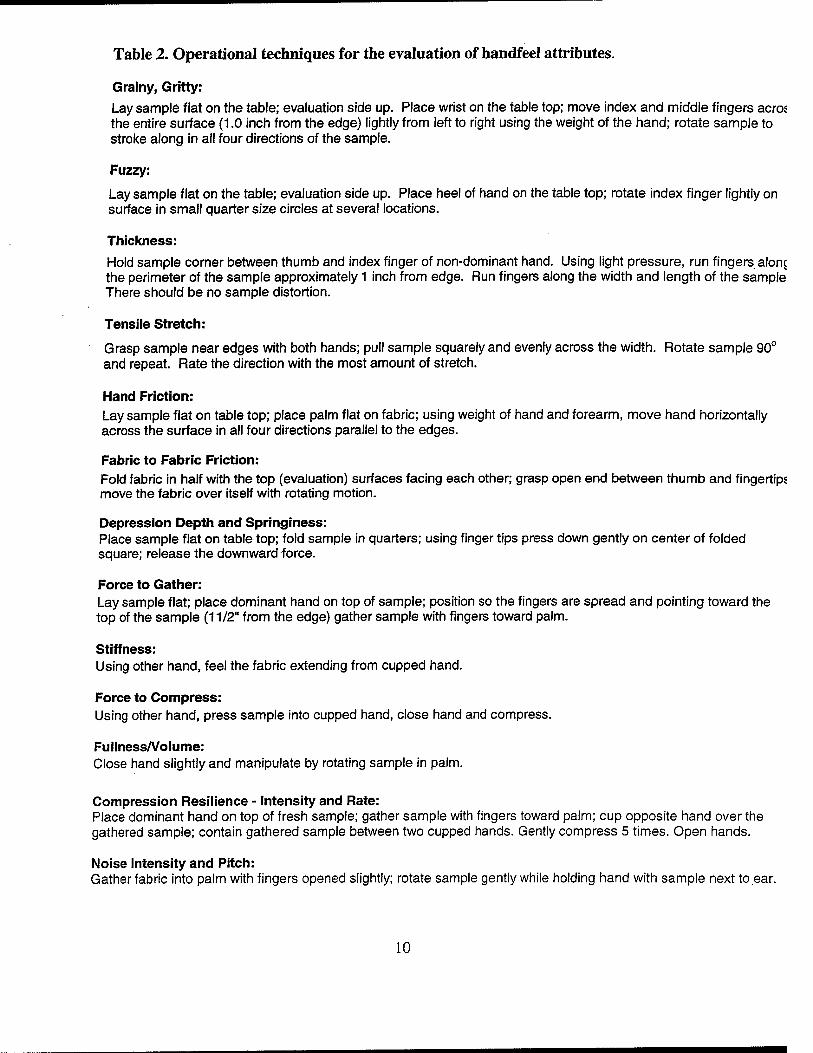
Table 2. Operational techniques for the evaluation of handfeel attributes.
Grainy, Gritty:
Lay sample flat on the table; evaluation side up. Place wrist on the table top; move index and middle fingers acros the entire surface (1.0 inch from the edge) lightly from left to right using the weight of the hand; rotate sample to stroke along in all four directions of the sample.
Fuzzy:
Lay sample flat on the table; evaluation side up. Place heel of hand on the table top; rotate index finger lightly on surface in small quarter size circles at several locations.
Thickness:
Hold sample corner between thumb and index finger of non-dominant hand. Using light pressure, run fingers alone the perimeter of the sample approximately 1 inch from edge. Run fingers along the width and length of the sample There should be no sample distortion.
Tensile Stretch:
Grasp sample near edges with both hands; pull sample squarely and evenly across the width. Rotate sample 90° and repeat. Rate the direction with the most amount of stretch.
Hand Friction: Lay sample flat on table top; place palm flat on fabric; using weight of hand and forearm, move hand horizontally across the surface in all four directions parallel to the edges.
Fabric to Fabric Friction: Fold fabric in half with the top (evaluation) surfaces facing each other; grasp open end between thumb and fingertip« move the fabric over itself with rotating motion.
Depression Depth and Springiness: Place sample flat on table top; fold sample in quarters; using finger tips press down gently on center of folded square; release the downward force.
Force to Gather: Lay sample flat; place dominant hand on top of sample; position so the fingers are spread and pointing toward the top of the sample (11/2" from the edge) gather sample with fingers toward palm.
Stiffness: Using other hand, feel the fabric extending from cupped hand.
Force to Compress: Using other hand, press sample into cupped hand, close hand and compress.
Fullness/Volume: Close hand slightly and manipulate by rotating sample in palm.
Compression Resilience - Intensity and Rate: Place dominant hand on top of fresh sample; gather sample with fingers toward palm; cup opposite hand over the gathered sample; contain gathered sample between two cupped hands. Gently compress 5 times. Open hands.
Noise Intensity and Pitch: Gather fabric into palm with fingers opened slightly; rotate sample gently while holding hand with sample next to ear.
10

Table 3. Fabric reference standards defining intensity scales for each handfeel attribute.
FABRIC REFERENCE STANDARDS
R1 R2 R3 R4 R5 R6 ATTRIBUTE
Grainy 1.3 4.0 6.5 13.1 12.2 4.6
Gritty 0.0 1.3 1.2 4.2 14.3 4.8
Fuzzy 16.6 14.3 0.0 1.5 4.7 7.0
Thickness 13.0 28.0 2.0 7.0 8.0 4.5
Tensile Stretch 12.9 16.0 0.0 0.0 0.0 1.0
Hand Friction 13.3 12.0 3.0 5.5 8.0 10.5
Fabric to Fabric Friction 10.5 13.0 1.0 2.5 5.0 9.0
Depression Depth 13.3 18.3 0.0 0.0 0.8 3.6
Springiness 10.5 13.7 0.0 0.0 0.3 4.0
Force to Gather 3.5 7.5 1.6 5.7 13.0 6.0
Stiffness 1.0 3.4 1.6 6.6 13.5 5.3
Force to Compress 5.0 12.0 1.1 5.0 13.5 5.0
Compression Resil: Int. 3.0 5.5 1.3 7.4 14.0 6.5
Compression Resil: Rate 1.4 2.3 6.3 9.4 11.2 9.8
Fullness/Volume 11.5 16.0 1.5 7.1 11.5 7.1
Noise Intensity 1.5 1.0 6.4 12.0 15.0 5.0
Noise Pitch 1.5 1.0 7.9 7.0 13.0 3.0
Reference Fabric Codes: R1 100 Series Polar Fleece-double velour, 100% polyester, 5.7 ounces/sq.yd, source: Maiden Mills, Inc. R2 300 Series Polar Fleece-double velour, 100% polyester, 10 ounces/sq.yd, source: Maiden Mills, Inc. R3 2oz Nylon (parachute fabric) - MIL-C-7020, cloth, parachute, nylon, ripstop and twill weave R4 Ballistic Nylon - MIL-C-44043, cloth, ballistic, nylon, lightweight, water repellent treated R5 1000 Denier Cordura Nylon - MIL-C-43734, cloth, duck, textured nylon R6 Nomex, Oxford Weave - MIL-C 43842
11

resistance." Even larger differences can be seen in comparing the jersey knit fabric to the other
two fabrics. Yet ratings of attributes for each fabric evaluated on multiple occasions (Figs 2a, b,
c) were very similar. Pearson product-moment correlations were calculated across mean attribute
ratings for each fabric rated on the different test days. The correlation coefficients between
fabrics tested two weeks apart were .98 (poly/wool serge), .93 (Tencel® ripstop) and .98 (jersey
knit). Correlations of panel ratings for the same fabrics by attribute ranged from .93 -.98,
depending upon the attribute examined.
For the two fabrics tested again six months later, the correlation coefficients between
each of the first two sessions and the third were .94 and .95 (poly/wool serge) and .89 and .93
(Tencel® ripstop), indicating only a minor drop in test-retest reliability over the six-month
period.
From these data it was concluded that the HSDA methods, in conjunction with the panel
training program outlined above, resulted in a sensory handfeel evaluation method that was
highly sensitive and reliable over extended periods of time. Having established this capability to
reliably index the sensory handfeel attributes of test fabrics, Phase 2 research commenced.
Phase 2: Descriptive Analysis of Military Fabrics
As discussed in the Introduction, a wide variety of fabrics are used in military clothing by
different forces within the U.S. Department of Defense, as well as by different foreign military
forces. While durability and other functional criteria are important in selecting fabrics for use in
military garments, the comfort of the garment to the wearer is also an important criterion. As
part of a larger program to establish performance criteria for military clothing comfort, 13 fabrics
used in U.S., British, Canadian and Australian military garments were assembled. The purpose of
this phase of research was to quantify the handfeel attributes of these fabrics in order to
characterize differences among them and to establish a sensory data base from which fabric
attributes could be analyzed for their contribution to the handfeel comfort of the fabrics (see
Phase 4).
Methods: The descriptive analytic handfeel methods and panel described in Phase 1
were utilized to characterize the test fabrics. Thirteen military test fabrics (Table 4) were
evaluated over the course of several months of testing. The fabrics were chosen to represent a
12

13

3SN0dS3UNV3H 3SNOdS3UNV3n
i i s s s a 5 S S
s § s
If
•S c o
e Ü C ü
«ö ,0 ^ «S ■a ■■§
u St* 'S " 52 O 4) C o
d » o
«3
•ö g-8 C C Ö
'S ° T3 ?? o< SP -Ö ST 2
_g « § 'B •£? rt
■*"■ * CJ
IP "S &£
■■a o •& So«
S. s « 9 si HI . o _i
<u w S S CO PH
.2f « ^
§
3SNMS3bNV3>l 3SN0dS3UNV3n
14

Table 4. Fabrics used in Phase 2 and Phase 5 research.
Fabric Composition Sample Code
50%/50% Nylon/Combed Cotton, Ripstop Poplin Weave 10R
50%/50% Nylon/Polyester, Oxford Weave (Australian) 11A
50%/50% Nylon/Cotton, Twill Weave 12T
92%/5%/3% Nomex, KevJar, P140, Plain Weave 13P
100% Cotton, Twill Weave (Former Flame Retardant Treated) 14N
77%/33% Cotton Sheath/Synthetic Core, Twill (U.K.) 15B
100% Combed Cotton, Ripstop Poplin (Former Hot Weather BDU) 16C
65%/35% Wool/Polyester, Plain Weave. (Canada-Unlaundered) 17C
65%/35% Wool/Polyester, Plain Weave. (Canada-Laundered) 18L
92%/5%/3% Nomex, Kevlar, P140, Oxford Weave 19N
Carded Cotton Sheath/Nylon Core, Plain Weave (Canada) 20J
100% Pima Cotton Ripstop Poplin (experimental) 124
50%/50% Nylon Carded Cotton Ripstop Poplin Weave 176
wide range of tactile (and likely comfort) characteristics to be found in U.S. and foreign military
uniforms. Of these 13, 8 fabrics had also been down-selected for use in future wear trials and for
subsequent evaluation of their mechanical properties using the Kawabata (KES-F) system of
fabric testing. Due to the large number of samples and the desire for multiple replicates, a
maximum of four fabrics were evaluated during any panel session. Each fabric evaluation was
replicated 3 times under the same testing conditions as described in Phase 1.
Results/Discussion: Figs. 3 and 4 show the sensory handfeel profiles for 8 of the 13 test
fabrics. These eight were selected for graphical representation, since they are the same fabrics
that were targeted to be examined in subsequent phases of testing. Fig. 3 shows four of these
eight fabrics. Two of the fabrics are currently used in military battle dress uniforms (BDU).
15

Q m
S £ Q S QQ <c ID """* 15 I (0
CD
CO
E 5 CD E
to
C Q. - 2
Ü
>
X" CD
E o
CO Q. iT P
O o
Q.
o o ■a <D ja E o Ü
Hi
_ qojy SSION
_ /usuajui esio(\|
|_ auin|o/\/sseu||ry
. sjca :ssu diuoo
A}|SU9)U| :say duioo
ss9jdiuoo 0} eojoj
ssaujjijs
J3LHBO 0} SOJOJ
_ ssau.i6u.uds
_ qidaa uojssejdaa
uoipiy ouqej oj ouqej
_ UOIJOUJ puBH
_ upjejjs aiisuai
ssaißpim
-1~
ca o
OH
> o
o
I CO <U
■*—i 3 ,0
cd
äs u
e co a ?F
00 "Ö 00 cu
.S 00 t« £ TO ■*-•
*" CO
*■§ o,<£ ö -a ca J3
Si's äs
CM 1 o
asNOdsaa NvaiAi
16

CO ■■)
ID > <D
.2 as ^
^ U) ~l
< — ra a. 4
£ o
■a o
a. a. o
> a ID
10 c 10 O
V) a. U > rr O £ n o O
(D c is 0-
O o CO ,J- w ^
■D ffi x:
E o id
o ü
■— CO a. c c
o ■^.
o "5 o o
O o Ü $
Z ^9 v° A? o in |
o CO CO I to ^ — —
If
_ ipiid asiON
_ /(isuejui espN
oain|OA/ss8U||nj
ejey :say diuoQ
_ A]isue}U| :say duioo
ssajdaioo o; aojoj
ssaums
_ jaij)B9 0} aojoj
_ ssauißuuds
4jdaa uo.issejdaa
_ uojpuj ouqej 0} ouqej
uojp.uj PUBH
L)0}3J}S a|isuaj.
_ ssau>)0!L(i
C3 U
P 0)
> o X) 1) 60 ca u > CO
'S <0 3 c/j .O C3
£ OH CO g
«a 2 "O c/J C U CO *■•
»C C/D
O C
ll H.llj» c w ca £ o^ a o CO j_,
* if <u '3 3 g M S
3SNOdS3H NV31AI
17

One is used in the U.S. Army Aircrew BDU (black circles), the other is used in the
Temperate BDU (black squares). The other two fabrics for which data are depicted are materials
formerly used in U.S. Navy coveralls (gray squares) and in the U.S. Army Hot Weather BDU
(gray circles).
As can be seen, the sensory differences between the fabrics currently used in the Army
Aircrew and the Temperate BDUs (black circles/squares) are relatively small. The fabric •
formerly used in the Army Hot Weather BDU (gray circles) is somewhat similar, but differs
greatly from the former two in "fuzziness" and tends to be lower on several other attributes, e.g.,
"hand friction," "depression depth" and "springiness". On the other hand, the Navy fabric (gray
squares) is quite different in its handfeel characteristics from each of the other fabrics. In
particular, the Navy material is "thicker," has greater "force to gather," "stiffness," "compressive
resilience" and "fullness/volume," than any of the other fabrics. The Army flame-resistant fabric
exhibits some similar sensory properties, e.g. in terms of "fuzziness", "tensile stretch", "hand
friction", "depression depth" and "springiness", but is a thinner, much smoother (less grainy)
fabric, has lower "force to gather", "stiffness", and "compressive resistance" characteristics than
the Navy material.
Fig. 4 shows a different combination of fabrics. Again, large differences can be seen in
the handfeel profiles for the various fabrics. Table 5 shows the results of ANOVAs conducted on
each handfeel attribute for the eight fabrics shown in Figs 3 and 4, along with the number of
statistically significant subsets of samples (based on Newman-Keuls test of differences among
means). As can be seen by the highly significant F values, all of the 17 handfeel attributes
discriminated, among the test fabrics. Several of the attributes, such as "hand friction," "force to
compress," and both the "intensity and rate of compression resilience," significantly
differentiated the eight fabrics into as many as five distinct subsets of fabrics. Several other
attributes differentiated three or four subsets. Of the three attributes with somewhat lower F
values, "tensile stretch," noise intensity" and "noise pitch," an examination of Figs 3 and 4
reveals that few of the eight fabrics showed any tensile stretch. In contrast, the intensity of the
sound attributes for these fabrics, although low, were as high or higher than other attributes that
showed better discrimination among the fabrics, e.g., depression depth.
18
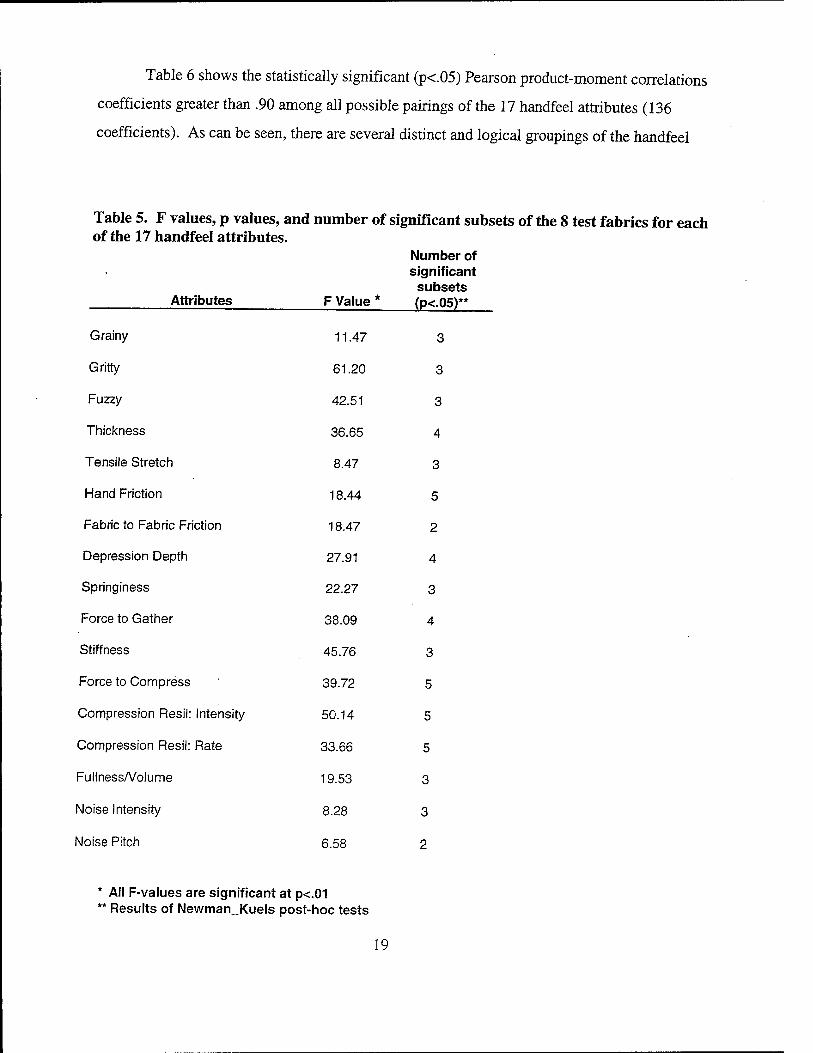
Table 6 shows the statistically significant (p<.05) Pearson product-moment correlations
coefficients greater than .90 among all possible pairings of the 17 handfeel attributes (136
coefficients). As can be seen, there are several distinct and logical groupings of the handfeel
Table 5. F values, p values, and number of significant subsets of the 8 test fabrics for each of the 17 handfeel attributes.
Number of significant subsets
Attributes F Value * (p<.05)**
Grainy 11.47 3
Gritty 61.20 3
Fuzzy 42.51 3
Thickness 36.65 4
Tensile Stretch 8.47 3
Hand Friction 18.44 5
Fabric to Fabric Friction 18.47 2
Depression Depth 27.91 4
Springiness 22.27 3
Force to Gather 38.09 4
Stiffness 45.76 3
Force to Compress 39.72 5
Compression Resil: Intensity 50.14 5
Compression Resil: Rate 33.66 5
Fullness/Volume 19.53 3
Noise Intensity 8.28 3
Noise Pitch 6.58 2
* All F-values are significant at p<.01 ** Results of Newman_Kuels post-hoc tests
19
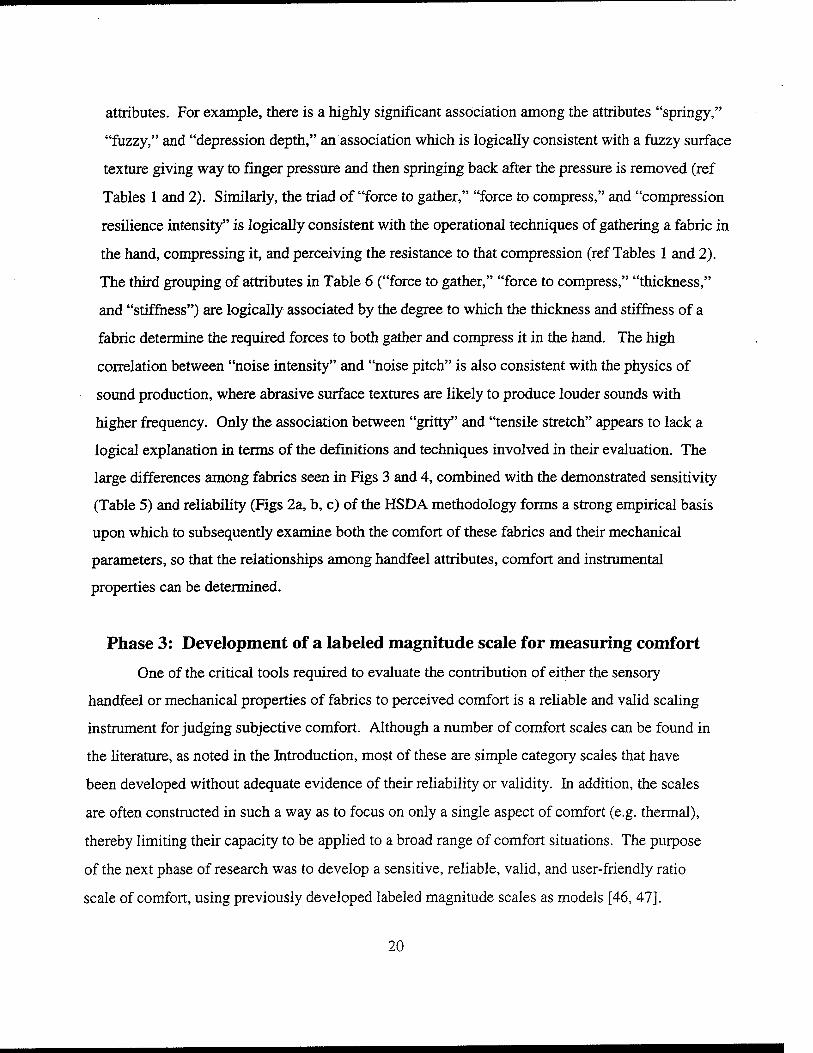
attributes. For example, there is a highly significant association among the attributes "springy,"
"fuzzy," and "depression depth," an association which is logically consistent with a fuzzy surface
texture giving way to finger pressure and then springing back after the pressure is removed (ref
Tables 1 and 2). Similarly, the triad of "force to gather," "force to compress," and "compression
resilience intensity" is logically consistent with the operational techniques of gathering a fabric in
the hand, compressing it, and perceiving the resistance to that compression (ref Tables 1 and 2).
The third grouping of attributes in Table 6 ("force to gather," "force to compress," "thickness,"
and "stiffness") are logically associated by the degree to which the thickness and stiffness of a
fabric determine the required forces to both gather and compress it in the hand. The high
correlation between "noise intensity" and "noise pitch" is also consistent with the physics of
sound production, where abrasive surface textures are likely to produce louder sounds with
higher frequency. Only the association between "gritty" and "tensile stretch" appears to lack a
logical explanation in terms of the definitions and techniques involved in their evaluation. The
large differences among fabrics seen in Figs 3 and 4, combined with the demonstrated sensitivity
(Table 5) and reliability (Figs 2a, b, c) of the HSDA methodology forms a strong empirical basis
upon which to subsequently examine both the comfort of these fabrics and their mechanical
parameters, so that the relationships among handfeel attributes, comfort and instrumental
properties can be determined.
Phase 3: Development of a labeled magnitude scale for measuring comfort
One of the critical tools required to evaluate the contribution of either the sensory
handfeel or mechanical properties of fabrics to perceived comfort is a reliable and valid scaling
instrument for judging subjective comfort. Although a number of comfort scales can be found in
the literature, as noted in the Introduction, most of these are simple category scales that have
been developed without adequate evidence of their reliability or validity. In addition, the scales
are often constructed in such a way as to focus on only a single aspect of comfort (e.g. thermal),
thereby limiting their capacity to be applied to a broad range of comfort situations. The purpose
of the next phase of research was to develop a sensitive, reliable, valid, and user-friendly ratio
scale of comfort, using previously developed labeled magnitude scales as models [46, 47].
20

Table 6. Pearson correlation coefficients (>.90) among all pairs of handfeel attributes.
Attribute 1 Attribute 2 Pearson r *
Springiness Fuzzy .98 Springiness Depression Depth .98 Fuzzy Depression Depth .96
Force to Compress Force to Gather .96 Force to Compress Compression Resilience .92 Force to Gather Compression Resilience .91
Force to Compress Stiffness .96 Force to Gather Stiffness .93 Force to Gather Thickness .94 Force to Compress Thickness .92
Noise Intensity Noise Pitch .96
Gritty Tensile Stretch .93
* All coefficients are statistically significant (p<.05)
Experiment 1
Methods: Thirty-five NATICK employees, none of whom were members of the
descriptive handfeel panel, were recruited from a random list of volunteer consumer panelists
and participated as subjects.
Word adjectives that could be used to modify the terms "comfortable" and
"uncomfortable" in order to reflect differences in the magnitude of the comfort-discomfort
dimension were compiled from previous scaling literature and from standard English language
resources. The adjectives "greatest imaginable" and "greatest possible" were included to define
scale values commensurate to a common fixed end-point of positive and negative affective
experience, as utilized in previously developed labeled magnitude scales [45, 46, 47]. These
adjectives were used to create forty-one word phrases, which in combination with two non-polar
terms ("neutral" and "neither comfortable nor uncomfortable"), resulted in a total of 43 phrases
to be used in scale development. These phrases appear in the left-hand column of Table 7.
21

The forty-three phrases were printed on 8 x 20 cm sheets of paper and assembled in
random order into testing booklets. Testing was conducted in a large room with open tables.
Prior to the start of testing, subjects were provided with written instructions on the procedure to
be used in scaling the semantic meaning of the phrases (see Appendix). Oral instructions with an
example were also given to insure that all subjects were aware of and understood the instructions.
Subjects sequentially rated each of the phrases appearing in the booklet to indicate the
magnitude of comfort or discomfort connoted by the phrase using a modulus-free magnitude
estimation procedure. In this procedure, subjects assign an arbitrary number to indicate the
magnitude of comfort or discomfort reflected by the first phrase (positive numbers used for
comfort, negative numbers for discomfort). Subjects then make all subsequent judgments
relative to the first, so that if the second phrase denotes twice as much comfort as the first, a
number twice as large would be assigned; if it denotes 1/3 as much comfort, a number 1/3 as
large as the first would be assigned, etc. (See Appendix). All ratings were made in spaces
provided directly on the individual pages of the testing booklet.
Results/Discussion: The geometric means and standard errors of the assigned magnitude
estimates were calculated for each of the comfort/discomfort phrases after an equalization
procedure [53] was applied. These data are shown in Table 7. Geometric means were used
because magnitude estimates have been shown to be log-normally distributed [54]. As can be
seen, the geometric mean magnitude estimates ranged from -351 for "greatest imaginable
discomfort" to +367 for "greatest imaginable comfort," with the other phrases distributed
between these two extremes. (The phrases "neutral" and "neither comfortable nor
uncomfortable" were assigned zero ratings by all subjects).
Examination of the data in Table 7 reveals the ratings to have general construct validity,
because the rank order of geometric mean magnitude estimates corresponds to the generally
understood and accepted semantic meaning of the phrases. Also, in keeping with previous
findings concerning the non-equivalence of intervals between the labeled points on category
scales, the data in Table 7 clearly demonstrate that the phrases used in Gagge's et al. [30]
comfort sensation scale (asterisked) are not perceptually equivalent. For example, while the
interval between the phrases "uncomfortable" and "very uncomfortable" is 113 units, the interval
between the phrases "uncomfortable" and "slightly uncomfortable" is only 43 units. The data
22

also a reveal slight asymmetry between the ratings of comfort and discomfort. Examining
common adjective phrases above and below the "neutral" and "neither comfortable nor
uncomfortable" categories in Table 7 reveals that discomfort initially grows more quickly than
comfort, i.e., "barely comfortable" = 15.42, "barely uncomfortable" = -27.61, "a little
comfortable" = 28.77, "a little uncomfortable" = 40.90, "somewhat comfortable" = 59.98, and
"somewhat uncomfortable" = -71.56. With some exceptions this difference can be observed
throughout the scale. It is only at the highest levels of comfort/discomfort, i.e., "greatest
possible" and "greatest imaginable", that comfort ratings achieve the same levels of magnitude as
ratings of discomfort.
Table 7. Word phrases, geometric mean magnitude estimates, and standard errors divided by the geometric means for the data from Phase 3 (n=35).
Comfort/Discomfort Word Phrases Geom. Mean Maa.
Est Standard Error Standard Error/G.M
Greatest Imaginable Comfort 366.72 34.88 0.10
Greatest Possible Comfort 345.28 28.76 0.08
Exceptionally Comfortable 280.20 16.03 0.06
Superior Comfort 279.71 19.27 0.07
Intensely Comfortable 268.44 19.82 0.07
Extremely Comfortable 260.75 23.51 0.09
Highly Comfortable 224.01 15.80 0.07
Very Comfortable 203.99 13.96 0.07
Terribly Comfortable 135.93 48.72 0.36
Moderately Comfortable 130.18 10.51 0.08
Comfortable * 109.22 10.81 0.10
Satisfactory Comfort 86.11 11.68 0.14
Fairly Comfortable 85.16 8.62 0.10
Average Comfort 77.58 17.30 0.22
Acceptable Comfort 72.17 8.85 0.12
Somewhat Comfortable 59.98 9.07 0.15
23

Slightly Comfortable 38.26 9.96 0.06
A Little Comfortable 28.77 7.82 0.27
Mediocre Comfort 22.63 9.60 0.42
Barely Comfortable 15.42 4.77 0.31
Neutral 0 0 N.A.
Neither Comfortable nor Uncomfortable 0 0 N.A.
Barely Uncomfortable -27.61 4.38 0.16
A Little Uncomfortable -40.90 5.05 0.12
Slightly Uncomfortable * -52.95 5.73 0.11
Somewhat Uncomfortable -71.56 6.74 0.09
Average Discomfort -76.64 13.55 0.18
Mediocre Discomfort -79.56 10.96 0.14
Uncomfortable * -96.34 8.21 0.09
Fairly Uncomfortable -99.38 10.07 0.10
Moderately Uncomfortable -145.63 7.23 0.05
Very Uncomfortable * -209.86 11.00 0.05
Awfully Uncomfortable -228.96 10.71 0.05
Highly Uncomfortable -231.80 11.42 0.05
Terribly Uncomfortable -257.78 14.51 0.06
Exceptionally Uncomfortable -272.76 12.41 0.05
Intensely Uncomfortable -274.34 18.28 0.07
Oppressively Uncomfortable -279.70 15.71 0.06
Horribly Uncomfortable -283.88 22.86 0.08
Extremely Uncomfortable -290.84 15.57 0.05
Unbearably Uncomfortable -298.44 21.79 0.07
Greatest Possible Discomfort -345.82 24.29 0.07
Greatest Imaginable Discomfort -350.67 35.85 0.10
24

Based on the data in Table 7, a sub-set of phrases were chosen to construct a labeled
magnitude scale of comfort. The criteria for selection of terms were: 1) low variability in
perceived semantic meaning; 2) creation of an equal number of comfortable and uncomfortable
terms (a decision based on evidence from the preference scaling literature that shows that
balanced scales are better for differentiating products); 3) the inclusion of a neutral term; and 4)
parallelism in the adjectives used to qualify comfort and discomfort.
Examination of the standard errors of the geometric means (SEGM) for each of the
phrases (Table 7) led to the elimination of several phrases (e.g., "mediocre comfort," "barely
comfortable," "a little comfortable") due to their variable semantic meaning to subjects. Other
phrases were eliminated because of a lack of bipolarity (e.g., "superior comfort," "oppressively
uncomfortable"). Applying the remaining criteria to the phrases resulted in the selection of 11
phrases: five associated with comfort, five with discomfort, and one neutral term (neither
comfortable nor uncomfortable). The geometric mean magnitude estimates of the positive and
negative phrases were transformed to range from 0 to +100 (positive phrases) and 0 to -100
(negative phrases). The phrases were then placed along a 100mm vertical analogue line scale in
accordance with their transformed values. The resultant scale of comfort is shown in Fig. 5.
The comfort affective labeled magnitude (CALM) scale shown in Fig. 5 has several
advantages over other comfort scales used previously in the literature. Using this scale, the level
of comfort or discomfort experienced by an individual can be easily indexed by simply placing a
hash mark somewhere on the vertical line. This stands in contrast to the difficulty often
encountered by subjects using magnitude estimation procedures. However, by having placed the
phrases of comfort/discomfort along the analogue line scale at positions that represent the
magnitude of their semantic meaning as determined by a magnitude estimation procedure, it
becomes possible to treat the measured distances along the scale as ratio level data. This stands
in stark contrast to category scales of comfort which provide only ordinal data. It also enables
statements to be made about whether a particular sample is 20%, 40%, 3 times, etc. as
comfortable (or uncomfortable) as another sample, but without requiring the normalization of
data as with magnitude estimates. Lastly, by using the "greatest imaginable" comfort (or
discomfort) as end-points on the scale, the scale enables better discrimination among
samples/conditions that are either very high or very low in comfort/discomfort and establishes a
common ruler by which comfort/discomfort ratings of different subjects can be compared.
25

100 -r GREATEST IMAGINABLE COMFORT
• EXTREMELY COMFORTABLE
• VERY COMFORTABLE
MODERATELY COMFORTABLE
t SLIGHTLY COMFORTABLE 0 4 NEITHER COMFORTABLE NOR UNCOMFORTABLE
-20-f SLIGHTLY UNCOMFORTABLE
-40
-60-+
MODERATELY UNCOMFORTABLE
VERY UNCOMFORTABLE
-80-
-100-
- EXTREMELY UNCOMFORTABLE
GREATEST IMAGINABLE DISCOMFORT
Figure 5. The Comfort Affective Labeled Magnitude (CALM) scale.
26

Experiment 2
Creating a labeled magnitude scale of comfort from the psychophysically determined
semantic meaning of phrases is only the first step in creating an improved scale of comfort. The
scale must also be shown to be valid, reliable, and sensitive to differences among stimuli that
vary along the comfort/discomfort dimension. In order to evaluate the reliability, validity and
sensitivity of the comfort affective labeled magnitude (CALM) scale that was developed in
Experiment 1, a study was conducted in which subjects used the scale to index the
comfort/discomfort associated with a variety of image-based clothing and environmental
scenarios. The use of image-based stimuli in psychophysical scaling has been shown to produce
similar data patterns as actual stimuli [55] and is a convenient approach for testing of such scale
properties as validity, sensitivity and reliability.
Methods: Twenty-seven NATICK volunteer employees served as subjects. All were
drawn from the same general subject pool as those used in Experiment 1. In order to establish a
clear and unambiguous set of distinct comfort levels for testing the sensitivity of the scale,
written comfort scenarios were developed that described a wide range of clothing and
environmental conditions, using clothing type, ambient temperature, humidity, wind speed, and
the activity of the subject as text variables. These six written scenarios are shown in Table 8. As
can be seen, each scenario described a particular type of fabric (for a shirt or blouse) and a set of
environmental/activity conditions in which the garment would be worn. The purpose of the
scenarios was to create realistic, image-based stimuli that would be associated with discrete and
distinct levels of perceived comfort/discomfort among all subjects. A meaningful scale of
comfort should be able to discriminate among the levels of comfort/discomfort induced by the
image-based stimuli and should be reliable from one judgment time to the next.
Subjects were tested in individual consumer testing booths. Each subject was given a self-
administered questionnaire that included written instructions and a set of eight stimulus/response
sheets (in random order) with the six scenarios (plus two repeated scenarios in order to obtain a
measure of reliability) printed on them. Subjects were asked to rate the comfort or discomfort
associated with each written scenario by simply placing a hash mark somewhere on the comfort
affective labeled magnitude (CALM) scale (Fig. 5). However, since previous research has shown
that the numerical labels placed along labeled affective magnitude scales do not affect ratings
27

(subjects attend to the verbal labels and extrapolate between them) [46,47], the scale points
were rescaled to range from 0 ("greatest imaginable discomfort") to +100 ("greatest imaginable
comfort") so that subjects would not be unduly influenced to assign negative numerical ratings to
negatively valenced scenarios and positive numerical ratings to positively valenced scenarios,
independently of a considered evaluation of the comfort/discomfort levels evoked by the
scenarios and the semantic implications of the verbal scale labels.
Results/Discussion: Data were analyzed by measuring the distances of the hash marks
from the zero point along the rating scale. Frequency distributions for each scenario, analysis of
variance (with Newman-Kuels post-hoc tests) across scenarios, and correlation coefficients
between the replicated scenarios were computed.
Table 8. The six written comfort scenarios used in Phase 2, Experiment 2.
Shirt/blouse Type Conditions of Wear
Hot Denim garment * ,l is 100°F and 60% humidity, no wind. Your are outside walking to the grocery store for 10 minutes.
Light Wool garment * |t js 0°F and 20% humidity, no wind. You are outside standing for 1/2 hour.
Clingy Cotton/polyester It is 80°F and 50% humidity, no wind. You are garment outside mowing the lawn for 20 minutes.
Thin Polyester garment It is 78°F and 30% humidity. You are inside and have been playing table tennis for 1/2 hour.
Light Cotton garment It is 95°F and 20% humidity. You are driving a car, air conditioner blowing directly on you, sun shining through driver's window, for one hour.
Absorbent Cotton garment It is 72°F and 30% humidity, no wind. You are outside sitting in the shade.
* Scenarios that were evaluated twice to assess reliability of the CALM scale.
Examining the frequency distributions for the different scenarios revealed no unusual or
unexpected distribution of values for any of the stimuli. The means and standard deviations of
28

the comfort ratings for the eight scenarios are shown in Table 9, along with the results of the
Newman-Kuels post-hoc tests of differences between means. The mean comfort ratings of
subjects differed significantly across scenarios (F=83.77, df=7,175, p<.001), ranging from below
"very uncomfortable" (the hot/denim scenario) to above "moderately comfortable" (the two
cotton scenarios). Mean comfort ratings for the two replicated scenarios (hot/denim and
light/wool) were nearly identical (Table 9). In addition, the Pearson product-moment correlation
coefficient calculated across subjects for the two "hot denim" scenarios was 0.84 and between
the two "light wool" scenarios was 0.94, both significantly different from zero at p<.0001 level.
Table 9. Means and standard deviations of comfort ratings for the 8 scenarios used in Experiment 2, Phase 3 (n=26).
Scenarios Mean* Standard Deviation
Hot Denim (initial) 15.7 a 7.8
Hot Denim (repeated) 16.1 a 9.0
Light Wool (initial) 19.3a 14.4
Light Wool (repeated) 20.4 a 15.4
Clingy Cott/Poly 28.6 b 16.5
Thin Polyester 41.4° 16.7
Light Cotton 70.8 d 18.2
Absorbent Cotton 75.5 d 16.3
* Means with different letter superscripts are significantly different at p<.05.
Examining the tables and considering the r's between replicated scenarios it can be
concluded that 1) there was a wide range of comfort ratings assigned to the different comfort
scenarios and that these ratings are consistent with the logically expected levels of comfort
defined by the scenario, 2) there are significant differences among pairs of scenarios that would
be expected to differ; and 3) the correlations among the replicated scenarios are very high. Taken
together, these data show a high degree of sensitivity of the CALM scale to image-based
scenarios that would normally be considered to generate differences in comfort levels, a high
degree of construct validity because the mean comfort ratings of the scenarios are logically
29
ordered, and good test-retest reliability.
Experiment 3
The results of Experiment 2 support the sensitivity, validity and reliability of using the
CALM scale to rate the comfort/discomfort of image-based stimuli. However, before applying
the CALM scale to the evaluation of the test fabrics for which sensory handfeel attributes were
characterized in Phase 1, a study was conducted to assess the reliability and sensitivity of the
CALM scale when used to rate the comfort of gloves made from different fabrics. Gloves were
chosen as stimuli because they are the item of clothing that generates comfort responses most
similar to what would be experienced in handling fabric swatches.
Methods: Thirty-seven volunteer consumer panelists served as subjects. Consumer
subjects came from the same pool of subjects described previously. All were naive to the testing
of the handfeel and comfort parameters of clothing and fabrics. The stimuli consisted of 3 gloves
that differed in both fabric and construction. One was an 8-ounce jersey fabric glove with a knit
wrist, clute cut (Dickey brand, general utility Williamson-Dickey Mfg Co.). The second was an
8 oz blended canvas glove with a knit wrist (Wells-Lamont "Basics" work glove, 65% polyster,
35% cotton, Wells-Lamont, Inc. Niles, IL), and the third was a U.S. military glove insert made of
70% wool and 30% nylon.
All testing was done in the same consumer testing booth (70°F) used in Experiment 2, in
order to ensure sample constancy and to avoid potential influences of temperature variability on
comfort ratings [52, 56]. Glove samples were presented sequentially in restricted random order
(the same glove could not be presented sequentially) in two repeated series. Subjects were
instructed to place the glove on their preferred hand (determined in advance) and to rate its
comfort after clenching their fist 3 times. Subjects were specifically instructed to ignore fit in
their evaluation of the glove's comfort. Comfort ratings were made using the CALM scale
(labeled -100 to +100). After evaluating the comfort of the three gloves in one series, ratings
were repeated in a second test series using the same three gloves.
Results/Discussion: Table 10 shows the means and standard deviations of the comfort
ratings for each replicate of the three gloves. As can be seen, the rank order of comfort ratings
for the three gloves in increasing order was wool glove < canvas glove < jersey glove. Analysis
30

of variance showed a significant glove effect (F=52.23, df = 2,72, p<.001). In addition, there was
a significant session (replication) effect (F=13.17, df = 1,36, p<.001) and a significant session x
glove effect (F=17.96, df = 2,72, p<.001). The latter effects can be attributed entirely to the
difference in mean comfort ratings for the wool glove between replicates. This effect may be due
to a greater variability in comfort sensation around the neutral point (neither comfortable nor
uncomfortable), as reflected in the absolute comfort ratings and associated standard deviations in
Table 10. Surprisingly, in spite of this session effect, the Pearson correlation coefficient across
subjects for the two replicates of the wool glove was .93 (p<.01). The correlation coefficient
between replicates for the jersey glove was .88 (p<.01) and for the canvas glove was .91 (p<.01).
The results of this study show the CALM scale to be a sensitive measure of the perceived
comfort of fabrics/clothing worn on the hand. The correlation coefficients between replicates
also show good reliability of the scale for this purpose, although the reliability may be reduced
when comfort ratings fall near the neutral point.
Table 10. Means, standard deviations, and standard errors of comfort ratings for the 3 gloves used in Phase 2, Experiment 3 (n=37).
Standard Std Error of
Mean Deviation Mean Replicate 1 - Jersey Glove 64.97 15.55 2.56
Replicate 2 - Jersey Glove 66.92 15.98 2.63
Riplicate 1 - Wool Glove 6.00 38.94 6.4
Replicate 2 - Wool Glove -7.78 43.33 7.12
Replicate 1 - Canvas Glove 37.30 27.36 4.50
Replicate 2 - Canvas Glove 36.28| 25.95 4.271
Phase 4: Comfort Scaling of Military Fabrics: Reliability Measures and the Relationship to Sensory Handfeel Characteristics
In order to examine the relationship of sensory handfeel attributes to clothing comfort, the
same 13 fabrics for which descriptive handfeel data were generated in Phase 2 were evaluated for
their handfeel comfort by naive consumers.
Methods: Forty civilian employees of NATICK who had no formal training in textiles
31
were recruited as subjects from the same population pool described previously. The same 30cm
x 30cm swatches of each of the fabrics that were used in Phase 2 (see Table 4) were used as
stimuli. All samples were stored under controlled climatic conditions (70° ±1.4 F / 65 ±1.3 % RH)
until just prior to testing. Testing was conducted in the same temperature controlled, individual
sensory testing booths used in previous consumer tests.
All 13 samples were presented in random order during a single test session. Each sample
was evaluated for its comfort using the same version of the CALM scale used in Experiment
3/Phase 3. Subjects were instructed that they could "hold, touch, feel or squeeze the material in
any manner" so long as they only felt and evaluated the coded (face) side of the fabric. After
evaluating each sample for its comfort as felt by the hand, the sample and the rating form were
returned through the hood and the next sample was presented. Testing was repeated in exactly the
same manner with the same subjects 5 days after initial testing in order to assess the reliability of
subject ratings.
Results/Discussion; The sensory data from Phase 2 were used to correlate with the
consumer comfort data collected here. In addition, for each fabric, the mean descriptive attribute
intensity rating across all attributes was calculated from the Phase 2 data. This was done to
create an index of the overall salience of the fabric's handfeel, in order to test the hypothesis that
clothing comfort is related to the absence of tactile sensation^ Such an hypothesis derives from
such studies as those of Gwosdow, et al. (52) in which increased perception of fabric texture
significantly decreased fabric acceptability. In order to test this hypothesis, the calculated index
was correlated with consumer comfort ratings.
Table 11 shows the mean comfort ratings for each of the 13 test fabrics and the results of
ANOVA and post-hoc tests conducted on the differences in mean comfort ratings. It is evident
from examination of Table 11 that the CALM scale significantly differentiated among the
comfort levels of the fabrics. In terms of absolute comfort levels, the fabrics had a range of
perceived comfort/discomfort that varied from slight discomfort to above moderately
comfortable. (Note that these fabrics were all selected from materials already in use in military
garments, so very uncomfortable fabrics would not be expected to be part of the stimulus set).
A Pearson product-moment correlation coefficient calculated between comfort ratings
obtained during the initial test session and the replication conducted five days later had a value of
32

.68 (p<.01). Although not as high as the test-retest correlation coefficients found for the CALM
scale when applied to image-based stimuli (Experiment 2, Phase 3) and gloves (Experiment 3,
Phase 3), in those experiments judgments were repeated within a single session, whereas, in this
experiment judgments were separated by a 5-day interval.
Table 11. Mean comfort ratings for the 13 fabric used in Experiment 3, Phase 3 (n=45).
Fabric Mean Comfort Ratina*
-9.8 a Standard Deviation
18L 44.8
17C -1.4ab 40.3
176 2.4 ab 29.4
124 9.8 bc 25.0
20J 10.9 bcd 31.0
16C 22.0 cde 26.2
12T 23.6 cde 27.1
14N 24.2 cde 30.8
19N 28.5 cdef 36.1
10R 28.9 def 25.7
13P 37.4 ef 25.3
15B 46.4 f 22.5
11A 47.2' 27.8
* Means with different letter superscripts are significantly different at p<0.5.
Table 12 gives the Pearson correlation/coefficients of both the individual sensory
handfeel attributes and the mean of all attribute intensity ratings for each sample (Phase 2) with
the mean consumer comfort ratings obtained in the present experiment. It is evident from the data
in Table 12 that many of the sensory attributes are significantly correlated with consumer comfort
ratings. These include "gritty," "tensile stretch," "hand friction," "depression depth," and
"springiness". Also evident is the fact that all 17 of the descriptive handfeel attributes are
33

negatively correlated with comfort, suggesting that the higher the salience of any fabric attribute,
the lower the perceived comfort. It is not surprising then, that the mean attribute intensity rating
across all attributes accounts for about 50% of the variance in comfort (r = -.70), even though it
was not high enough to reach statistical significance.
Table 12. Pearson product-moment correlation coefficients for individual handfeel attributes and for the mean intensity across all attributes with judged comfort.
Handfeel Attribute r with Comfort
Grainy -.41
Gritty -.92**
Fuzzy -.60
Thickness -.32
Tensile Stretch -.92**
Hand Friction -.77*
Fabric to Fabric Friction -.36
Depression Depth -.71*
Springiness -.72*
Force to Gather -.17
Stiffness -.17
Force to Compress -.17
Compression Resilience/Intensity -.42
Compression Resilience/Rate -.53
Fullness/Volume -.17
Noise Intensity -.25
Noise Pitch -.03
Mean Intensity Over All Attributes -.70
* p<.05 **p<.01
34

Phase 5: Sensory-Instrumental (Kawabata) -Comfort Correlations
From a purely logical standpoint, the sensory handfeel attributes of a fabric should be a
better predictor of the comfort of the fabric than any mechanical measure performed on the
fabric, because the human observer can only be basing his comfort judgment on perceptual
experiences not any actual physical parameter of the fabric. Of course, mechanical measures of
fabric properties are extremely convenient, and it would be desirable to find one or more
mechanical measures that correlate well with either perceived sensory experience or comfort.
For this reason the relationship of the mechanical parameters of fabrics to the sensory and
comfort responses that they give rise to in humans is an area of continuing interest to textile
researchers. This area of inquiry is also important as a potential aid in clothing and materials
development, to enable the prediction of the effects of changes in fabric composition, weave and
finish characteristics on perceived comfort. One instrumental technique that has achieved
particular popularity in textile measurement is the Kawabata Evaluation System for Fabrics
(KES-F) [48-50]. This technique consists of a set of measures of various mechanical parameters
of fabrics that can then be combined, using regression formulas developed by Kawabata, to
predict "hand" attributes. In particular, the methodology generates predictions for the following
"hand" attributes: "stiffness", "anti-stiffness", "crispness", "fullness and softness",
"smoothness", and "total hand value".
Methods: To assess the relationship between Kawabata parameters and the descriptive
handfeel and comfort data generated previously, the eight fabrics listed in Table 4 were
submitted to Kawabata mechanical testing. The testing was conducted by Milliken Research,
Corp., under standardized textile testing conditions. Table 13 lists the Kawabata parameters that
were tested and their associated units of measure. All testing was conducted on the reverse side
of the fabric swatches. Due to the large number of mechanical properties tested (17) and the
equally large number of descriptive handfeel attributes in the HSDA method (17), it is
impractical to examine correlations among individual mechanical and handfeel.properties.
However, the Kawabata system enables the prediction of five "hand values" and a "total hand
value" based on predictive equations from the mechanical parameters. These five "primary hand
expressions" are based on the end-use of the fabrics and are listed in Table 14 as they apply to
men's winter and summer suit fabrics.
35

Table 13. Kawabata parameters and associated units of measure.
Kawabata Mechanical Parameters
Blocked Property Symbol Characteristic Value Unit
Tensile KEMT K LT K WT K_RT
Extensibility Linearity Tensile energy Resilience
gf - Dimensionless Dimensionless gf-cm/cm2
%
Bending K B K_HB
Bending rigidity Hysteresis
gf-cm2/cm gf-cm2/cm
Shearing K G K HG K HG5
Shear stiffness Hysteresis at 0 = 0.5° Hysteresis at 0 = 5°
gf/ cm - degree gf/ cm gf/cm
Compression K-LC K WC K_RC
Linearity Compressional energy Resilience
Dimensionless gf-cm/cm2
%
Surface K MIU K MMD K_SMD
Coefficient of friction Mean deviation of MIU Geometrical roughness
Dimensionless Dimensionless micron
Weight & Thickness
K_W K T
Weight per unit Thickness at 0.5 gf/cm2
mg/cm2
mm
Table 14. Definitions of primary hand expressions in the Kawabata system for the standard and analysis of hand evaluation.
Primary Hand Expression Definition Stiffness A feeling related with bending stiffness. Springy property promotes this feeling.
The fabric having compact weaving density and woven by springy and elastic yarn makes this feeling strong.
Anti-drape stiffness
Fullness and softness
Anti-drape stiffness, no matter whether the fabric is springy or not. (This work means "spreading").
A feeling comes from bulky, rich and well formed feeling. Springy property in compression and thickness accompanied with warm feeling are closely related with this feeling. (Fukurami means "swelling").
Crispness A feeling comes from crisp and rough surface of fabric. This feeling is brought by hard and strongly twisted yarn. This feeling brings us a cool feeling. (This word means a crisp, dry and sharp sound arisen by that the fabric is rubbed with itself).
Smoothness A mixed feeling comes from smooth, limber and soft feeling. The fabric woven from cashmere fiber gives this feeling strongly.
36

Results/Discussion: Table 15 shows Pearson correlation coefficients between the
Kawabata hand parameter predictions and the handfeel attributes ratings obtained on the same
fabrics in Phase 2. Only correlation coefficients greater than .50 are listed.
Comparing the definitions of the primary hand expressions in Table 14 with the obtained
correlations of these hand values with HDS A handfeel attributes, reveals good conceptual
agreement. For example, both stiffness and anti-drape stiffness are correlated with the same six
HSDA handfeel attributes, and the correlation with sensory "stiffness" is very high for both
primary hand expressions, (r = .80, .84). Similarly, for fullness/softness, the HSDA handfeel
attributes that correlate highly with it are those related to "bulky", "rich" and "springy"
sensations. Lastly, smoothness, which is defined as "limber" and "soft" like "cashmere fiber", is
correlated most highly with "fuzzy" and "fabric to fabric friction", both of which would be
expected to increase with softer pile fabrics.
While the Kawabata method predicts hand values from independent mechanical
properties of the fabrics, they are based on predictive equations derived from quite different
fabrics than were tested here. A more direct approach to reduce the number of Kawabata
mechanical properties to a manageable number for correlation with sensory or comfort data is to
use Principal Component Analysis (PCA) to derive the component (factor) structure in the data.
Such an approach can also be used to reduce the redundancy in the sensory handfeel data.
A PCA analysis was conducted on the Kawabata data obtained on the eight fabrics. A
Varimax rotation with Kaiser normalization and an Eigen value criterion of 1.0 to stop extracting
factors resulted in a five component solution (Table 16). An analysis of the variable loadings
resulted in an interpretation of these components as being related to "shear properties"
(Component 1), "binding properties" (Component 2), "compression/friction" (Component 3),
"tensile properties" (Component 4) and "surface roughness" (Component 5). These five
components accounted for 98% of the variance in the data.
37

Table 15. Pearson correlation coefficients (> .50) between Kawabata hand values and handfeel attributes evaluated by the HSDA method.
Stiffness
Anti-drape stiffness
Fu llness/softness
Smoothness
Crispness
Force to compress .83* Stiffness .80* Force to gather .79* Compression resilience intensity .71 Thickness .68 Fullness/volume .63
Force to compress .87* Stiffness .84* Force to gather .80* Compression resilience intensity .73* Fullness/volume .71* Thickness .67
Springiness .87* Depression depth .85* Fuzzy .85* Hand Friction .77* Gritty .76* Tensile stretch .67
Fuzzy .55 Fabric to fabric friction .50
No correlation > .50 p<.05
38

Table 16. Rotated PCA matrix for Kawabata mechanical parameters.*
Components 1 2 3 4 5
Linearity Resilience
.926 -.915
Hysteresis at 0 = 0.5° .901 Hysteresis at 0 = 5° Compressionai energy
.871 -.87C
Thickness at 0.5 gf/cm2
Shear stiffness -.832 .810
Resilience -.775 .566 Weight per unit area Bending rigidity Hysteresis Linearity Coefficient of friction
.933
.862
.844 .949 .931
Tensile energy Extensibility Mean deviation of MIU
.953
.948 .924
Geometrical roughness .812
* Rotation converged in 9 iterations.
Table 17. Rotated PCA matrix for HSDA handfeel attributes.*
Component! 3
1 2 3 Gritty .971 Springiness .94^ [ Depression Depth .926 Fuzzy .895 Tensile Stretch .898 Hand Friction .887 Compression Resilience: Rate .717 Fabric to Fabric Friction .676 Force to Compress .973 Force to Gather .954 Fullness/volume .935 Stiffness .908 Compression Resilience: Intensity .904 Thickness .900 Noise Intensity .919 Noise Pitch .839 Grainy .809|
^Rotation converged in 7 iterations.
39

A similar PCA was conducted on the sensory descriptive handfeel data obtained during
Phase 1 testing. This analysis resulted in the 3 component solution depicted in Table 17. The
three components accounted for 92% of the variance in the data set. Analysis of the attribute
loadings on each component resulted in the identification of the three components as "surface
texture/depth" (Component 1), "volume" (Component 2) and "noise" (Component 3).
In order to assess the relationship of sensory attributes to comfort ratings, a PCA was
conducted using both the sensory attributes and "comfort" ratings. The results showed comfort
ratings to load heavily (negative weight) on Component 1 (Table 18), suggesting that comfort is
inversely related to perceived surface texture/depth. This is consistent with the data in Table 12
showing that the more salient is any attribute, the lower is the perceived comfort of the fabric.
Table 18. Rotated PCA matrix resulting ffor HSDA handfeel attributes plus comfort.
Components 1 2 3
Gritty .99( J Tensile Stretch .93: ? COMFORT -.91 £ ) Springiness .901 Depression Depth .87S Hand Friction .862 Fuzzy .835 -.527 Compression Resilience: Rate .660 Fabric to Fabric Friction .589 Force to Compress .975 Force to Gather .962 Fullness/volume .931 Thickness .917 Compression Resilience: Intensity .915 Stiffness .908 Noise Intensity .923 Noise Pitch .883 Grainy .780
* Rotation converged in 8 iterations.
40

able 19. Rotated PCA matrix for Kawabata mechanical parameters Components
1 2 3 4 5 Hysterisis at 0 = 0.5° .939 Resilience -.923 Linearity .898 Hysterisis at 0 = 5° .86^ I Shear Stiffness .83£ Compressional energy -.826 Thickness of 0.5 gf/cm2 -.786 Resilience -.749 .592 Weight per unit area .918 Bending rigidity .881 Hysteresis .848 Extensibility .961 Tensile energy .932 COMFORT .594 -.748 Linearity .957 Coefficient of friction .926 Mean deviation of MIU .927 Geometric roughness | I .819|
plus comfort.*
* Rotation converged in 8 iterations.
Lastly, a PCA was conducted using both the Kawabata data and the comfort ratings. The
PCA, which again accounted for 98% of the variance in the data, revealed comfort to be
positively loaded on Component 1 (shear), but negatively loaded on Component 4
(compression/friction) (Table 19). (Note that Component 4 in this PCA is the same in terms of
loading variables as Component 3 in Table 16).
With independent component scores established from the principal component analysis
for both the Kawabata and sensory handfeel data it was possible to predict perceived comfort
from either the sensory component scores, the Kawabata component scores, or both. First, by
including all three sensory components into a multiple regression of component scores on
comfort ratings, the following regression equation (1) was determined:
COMFORT = -15.6 (surface texture/depth) -1.07 (volume) - 7.67 (noise) + 27.5
(constant) (R= .96; R2Adj=.87). (1)
41
The weightings of the components in this regression model support the findings observed
from the PCA of sensory attributes plus comfort, which showed the comfort variable to be loaded
highly on Component 1 (resilience). In addition, the fact that all the component weightings are
negative again supports the notion put forth earlier, that comfort is inversely related to the
average perceived intensity of all handfeel attributes.
A multiple regression using the Kawabata component scores to predict comfort produced
the following regression equation (2):
COMFORT = 11.8 (shear) -3.1 (bending) -0.3 (compression/friction) -11.9 (tensile) +
0.4 (surface roughness) +27.5 (constant) (R = .94; R2 Adj =.60) (2)
While producing as good a predictive model as the sensory component scores, the
Kawabata regression model utilized all five factors. Since there were only eight fabrics for
purposes of prediction, it is not as compelling or as useful a model. In addition, none of the
components were significant at the p<.05 level, as compared to the sensory regression model in
which only Component 2 (volume) was not statistically significant.
Combining both the sensory component scores and the Kawabata component scores into
a stepwise multiple regression model to predict comfort resulted in the following equation (3):
COMFORT = -16.3 (sensory surface texture/depth) -8.7 (sensory noise) -4.3
(Kawabata surface texture) +27.5 (constant) (R = .99; R2 Adj =.96) (3)
where all three components contributed significantly (p<.05) to the model. This three variable
solution was chosen, because including more variables resulted in solutions that were
overdetermined. As might well be expected, given that the comfort ratings were made by
consumers who held the fabrics in their hands, both sensory surface texture and Kawabata
surface texture factors were important predictors of comfort in the model. In addition, the noise
factor was important sensory predictor of comfort due to its unique contribution to the model
variance.
The reader may have noted that all of the sensory handfeel data collected and reported in
Phases 1-4 were obtained for the face surface of the test fabrics, whereas, the Kawabata data was
obtained from the reverse side of the fabrics. Although there were no obvious tactile differences
between the face and reverse surfaces of these fabrics, in order to ensure that any possible such
differences would not alter the basic findings of the research, the descriptive handfeel panel
evaluated the reverse surfaces of all 8 test fabrics used in Kawabata comparisons. Each fabric
42
swatch was evaluated for 8 attributes that could potentially vary between face and reverse
surfaces. Of the 64 possible differences between face and reverse (8 fabrics x 8 attributes), only
7 significant differences were found. The absolute magnitude of these differences were small
(the largest was equal to one-half a scale point) and did not change the overall tactile profile for
any fabric. It should be noted that for any other types of fabrics, differences between face and
reverse surfaces could contribute more importantly to the interpretation of such data.
DISCUSSION AND CONCLUSIONS
The research reported here forms the basis for a standardized approach to the
characterization of clothing fabrics and the analysis of the contribution of their sensory and
mechanical properties to perceived comfort. Although developed and applied for the
characterization and analysis of military fabrics, the approach and techniques can be utilized for
any clothing fabrics. The approach is predicated on the use of sound psychophysical principles
for assessing both the qualitative and quantitative aspects of sensory handfeel and comfort
experience.
The adaptation of the HSDA method of handfeel analysis to military fabrics constitutes a
significant advance in enabling the sensory characterization of fabrics using a set of well-defined,
independent attributes, each with a detailed operational technique for their evaluation. These
standardized operational techniques enable ready transfer of the methodology to other
laboratories. This, combined with the use of stimulus-referenced intensity scales for each
attribute, establishes a unique, standard protocol for use in inter-laboratory studies or for use in
establishing functional performance-based specifications for military (or other) clothing fabrics.
In addition, the extremely high reliability of the method ensures that data collected over long
periods of time, e.g., during storage trials, can be readily compared.
The experiments reported here have also detailed the development of an alternative scale
for the assessment of comfort; one that is modeled after the category ratio scale of Borg [45] and
the labeled magnitude scales of Green, et al. [46] and Schutz and Cardello [47]. While the latter
scales were developed for the purpose of scaling perceived exertion, oral sensation intensity, and
liking/disliking, the present CALM (Comfort Affective Labeled Magnitude) scale was developed
specifically for the purpose of scaling perceived comfort/discomfort.
43

The CALM scale developed here has several important advantages over simple category
scales of comfort. First, the CALM scale enables statements to be made about the ratios of
perceived comfort among samples (at least to the same degree that magnitude estimation enables
this). However, it avoids a major disadvantage of magnitude estimation; namely, the inability to
index and compare absolute levels of liking among different individuals. The CALM scale
avoids this problem by using the word phrases "greatest imaginable comfort" and "greatest
imaginable discomfort" to anchor the scales to a common ruler of perceptual experience [45].
Another related advantage of the CALM scale is its potential greater sensitivity to differences
among very comfortable (or uncomfortable) stimuli. This is a logical consequence of the CALM
scale end-points ("greatest imaginable liking/disliking) that enable more extreme ratings than
"extremely comfortable (or uncomfortable)". Thus, these end-points labels serve not only to
anchor different subject ratings to a common scale, but also to foster better discrimination of very
comfortable (or uncomfortable) fabrics or items of clothing. This can be an important advantage,
because in most product development and evaluation situations the samples being tested are near
optimal comfort. The CALM scale has the potential to enable better discrimination among
fabrics and clothing items that fall in this "near optimal" category.
From both a sensitivity and reliability standpoint, the data obtained in Phases 3 and 4
show the CALM scale to be sensitive to a wide variety of comfort-related stimuli, including
image-based stimuli, fabrics, and garments (gloves), and to have good reliability both within and
across test sessions. In addition, a practical aspect of the scale is that a simple arithmetic mean
can be used as a measure of central tendency. This stands in contrast to magnitude estimation,
where medians, geometric means, or log transformations of the data must be calculated to arrive
at a measure of central tendency. Also, because the scale produces ratio level data, standard
parametric statistics can be used for analysis of the data.
Lastly, of some additional importance is the fact that the specific numerical labels that
appear on the CALM scale are somewhat arbitrary. In previous research it has been shown that a
scale with no numbers produces equivalent data to scales labeled with numbers that range from 0
to 100 or -100 to +100 [47]. Thus, it appears that subjects pay relatively little attention to the
numbers on the scale, as suggested previously by Green, et al. [46]. It may well be the case that
no numbers is the best option in certain cases. This is particularly true if the data from the scale
are to be compared among users who differ significantly in their knowledge or use of numbers
44
(children versus adults) or where cultural or practical concerns may make the numbers more of a
distraction. When no numbers are used, data from the scale can simply be transcribed from
measurements made with a ruler on the 100mm analogue line scale and then transformed to a -
100 to +100 scale. Of course, if it is desired to make ratio statements about liking/disliking, the
scale must conform to the numerical values that were originally used to locate the semantic
labels, (Fig 5), or to a multiplicative transformation of these values.
The approach to uncovering sensory instrumental-comfort relationships outlined in Phase
5 is also a valuable approach to understanding the complex factors that contribute to the
perceived comfort of fabrics and clothing. By reducing the multitude of sensory and mechanical
properties that can be measured for fabrics to a small number of independent components, it is
possible to derive regression models to predict the perceived comfort of the fabrics. The results
of this research, as reported here, show that a judicious combination of sensory and instrumental
factors can be used to predict the handfeel comfort of fabrics, while accounting for >95% of the
variance in the comfort ratings.
Further research is now being conducted to determine the extent to which the sensory,
instrumental, and handfeel comfort data collected here can be used to predict the dynamic
comfort of users wearing garments constructed from these same fabrics in controlled wear trials.
'Ihis document reports research undertaken at the U.S. Army Soldier and Biological Chemical Command, Soldier Systems Center, and has been assigned No. NATICK/TR-<72/*?22- i» a series of reports approved for publication.
45

REFERENCES
1. Binns, H. The discrimination of wool fabrics by the sense touch. Br. J. Psychol. 16, 237- 247 (1926).
2. Pierce, F. T. The "handle" of cloth as a measurable quantity. /. Tex. Inst. 21, T377-416 (1930).
3. Houghton, F. C, and Yaglou, C.P. Determining lines of equal comfort. ASHRAE Trans. 28, 163-176 and 361-384 (1923).
4. Winslow, C-E. A., Herrington, L.P., and Gagge, A. P. Physiological reactions of the human body to varying environmental temperature. Am. J. Physiol. 120, 1-20 (1937a).
5. Winslow, C-E. A., Herrington, L.P., and Gagge, A. P. Relations between atmospheric conditions, physiological reactions and sensations of pleasantness. Am. J. Hyg. 26,103-115.
6. Brand, R. H. Measurement of fabric aesthetics. Tex. Res. /., 34, 791-804 (1964).
7. Winakor, G., Kim, C. J., & Wolins, L. Fabric hand: Tactile sensory assessment. Tex. Res. J. 50, 601-610 (1980).
8. Yick, K.L. Cheng, K.P.S. and How, Y.L. Subjective and objective evaluation of men's shirting fabrics. Int. J. of Cloth. Sei. Technol. 7 (4), 17-29 (1995).
9. Civille, G. V., and Dus, C. A. Development of terminology to describe the handfeel properties of paper and fabrics, /. Sens. Stud. 5, 19-32 (1990).
10. Fourt, L. and Hollies, N.R.S. "Clothing: Comfort and function". New York: Marcel Dekker (1970).
11. Slater, K. Comfort properties of textiles. Tex. Prog. 9, 1-71 (1977).
12. Slater, K. "Human comfort". Springfield, IL: Charles C. Thomas (1985).
13. Rohles, F.H. Psychological aspects of thermal comfort. ASHREJ., 13, 86-90 (1971).
14. Rohles, F. H. Comfort and the man-enviroment system, in "Proceedings of the clothing and energy resources workshop", East Lansing, MI: Michigan State University (pp. 22-35) (1978).
46

15. Pontrelli, G.J. Partial analysis of comfort's gestalt, in N.R.S. Hollies & R. F. Goldman (Eds.), "Clothing comfort: Interaction of thermal, ventilation, construction and assessment factors", Ann Arbor, MI: Ann Arbor Science Publishers Inc., pp. 71-80 (1977).
16. Sontag, M.S. Comfort dimensions of actual and ideal insulative clothing for older women Cloth. Tex. Res. J. 4, 9-17 (1985-1986).
17. Branson, D. H., and Sweeney, M. Conceptualization and measurement of clothing comfort: Toward a metatheor, in S. Kaiser & M. L. Damhorst (Eds.), "Critical linkages in textiles and clothing: Theory, method and practice". Monument, CO: International Textile and Apparel Association, pp. 94-105 (1991).
18. Vaughn, E. A., and Kim, C. J. Definition and Assessment of Fabric Hand, in "Book of Papers, AATCC Conference", American Association of Textile Chemists and Colorists, Research Triangle Park, NC, USA, pp.66-77 (1975).
19. Brandt, M. A., Skinner, E. Z. and Coleman, J. A. Texture profile method. J. Food Sei 28 404-409 (1963).
20. Schwartz, N. O. Adaptation of the sensory texture profile method to skin care products J Texture Stud. 6, 33-42 (1975).
21. Robinson, K. J., Gatewood, B. M., and Chambers, E. Influence of Domestic Fabric Softeners on the Appearance, Soil Release, Absorbency, and Hand of Cotton Fabrics, in "Book of Papers, 1994 International conference and Exhibition," American Association of Textile Chemists and Colorists, Charlotte, NC, pp. 58-66 (1994).
22. Robinson, K. J., Chambers, E., and Gatewood, B. M. Influence of pattern design and fabric type on the hand characteristics of pigment prints. Tex. Res. J. 61 (11), 837-845 (1997).
23. Laughlin, J. Int. J. Cloth. Sei. Technol., 3 (1), 28 - (1991).
24. Burns, L. D., Brown, D. M., Cameron, B., Chandler, J., Dallas, M. J. and Kaiser, S. B., Sensory interaction and descriptions of fabric hand. Percept. Mot. Skills 81, 120-122 (1995).
25. Meilgaard, M.C., Civille, G.V., & Carr, B.T. "Sensory evaluation techniques" (2nd ed.). Boca Raton, FL: CRC Press (1991).
26. West, R. L., Ward, L. M. and Khosla, R. Constrained scaling - The effect of learned psychophysical scales on the idiosyncratic responses bias. Percept. &Psychophys 62(1) 137-151 (2000).
47

27. Burgard, D.R. & Kuznicki, J.T. "Chemometrics: Chemical and sensory data". Boca Raton, EL: CRC Press (1990).
28. Hollies, N.R. Investigation of the factors influencing comfort in cotton apparel fabrics. Contract 12-14-100-7183 (72), US Dept. of Agriculture, New Orleans. [Referenced in Hollies et al., 1979] (1965).
29. Hollies, N. R., Custer, A. G., Morin, C. J., & Howard, M. E. A human perception analysis approach to clothing comfort. Tex. Res. J. 49, 557-564 (1979).
30. Gagge, A.P., Stolwijk, J.A.J. & Hardy, J.D. Comfort and thermal sensations and associated physiological responses at various ambient temperatures. Environ. Res. 1, 1-20 (1967).
31. Stevens, S.S. & Galanter, E.H. Ratio scales and category scales for a dozen perceptual continua. J. Exp. Psychol. 54,377-411 (1957).
32. Green, B. G., Dalton, P., Cowart, B., Shaffer, G., Rankin, K. and Higgins, J. Evaluating the "Labeled Magnitude Scale" for measuring sensations of taste and smell. Chem. Senses 21, 3, 323-335 (1996).
33. Parducci, A. Contextual effects: A range-frequency analysis in E.C. Carterette and M.P. Friedman (Eds.), "Handbook of perception" (Vol. 3.). New York: Academic Press (1974).
34. Riskey, D.r. Uses and abuses of category scales in sensory measurement. /. Sens. Stud. 1, 217-236 (1986).
35. Guilford, J.P. & Dingman, H.F. A modification of the method of equal-appearing intervals. Am. J. Psychol., 68,450-454 (1955).
36. Gridgeman, N.T. A comparison of some test methods. J. Food Sei. 26, 171-177 (1961).
37. Jones, L.V., Peryam, D.R. and Thurstone, L.L. Development of a scale for measuring soldiers' food preferences. Food Res., 20, 512-520 (1955).
38. Stevens, S.S. On the psychophysical law. Psychol. Rev. 64: 153 (1957).
39. Stevens, S.S. "Psychophysics". New York: Wiley (1975)..
40. Elder, H. M., Fisher, S., Armstrong, K., and Hutchinson, G. J. Tex. Inst. 75, 37-46, 1984.
41. Elder, H. M., Fisher, S., Armstrong, K., and Hutchinson, G. J. Tex. Inst., 75, 99-106, 1984.
48
42. Sweeney, M.M. & Branson, D.H. Sensorial comfort. Part II: A magnitude estimation approach for assessing moisture sensation. Tex. Res. J. 60,477-452 (1990).
43. Ali, S. I., and Begum, S. Fabric softeners and softness perception. Ergonomics 37 (5), 801- 806 (1994).
44. Mackay, C. "Effect of Laundering on the Sensory and Mechanical Properties of 1 x 1 Rib Knitwear Fabrics" M. Phil. Thesis, Bolton Institute of Higher Education, Bolton, England p.63 1992.
45. Borg, G. A category scale with ratio properties for intermodal and interindividual comparisons, in Geissler, H-G. and Petxoid P. (eds), "Psychophysical Judgment and the Process of Perception". VEB Deutxcher Veriag der Wissenschaften, Berlin, pp. 25-34 (1982).
46. Green, B.G., Shaffer, G.S. & Gilmore, M.M. Derivation and evaluation of a semantic scale of oral sensation magnitude with apparent ratio properties. Chem. Senses 18, 683-702 (1993).
47. Schutz, H. G. and Cardello, A. V. A labeled affective magnitude (LAM) scale for assessing food liking/disliking. 7. Sens. Stud. 16, 117-159 (2001).
48. Kawabata, S., & Niwa, M. Analysis of hand evaluation of wool fabrics for men's suit using data of thousand samples and computation of hand from the physical properties, in "Proceedings of the 5th International Wool Textile Research Conference", 5,413-424 (1975).
49. Kawabata, S., "Standardization and Analysis of Hand Evaluation", (2nd ed.), Osaka: The Textile Machinery Society of Japan (1980).
50. Kawabata, S., Postle, R. and Niwa, M., Eds. "Objective Specification of Fabric Quality, Mechanical Properties and Performance", The Textile Machinery Society of Japan Osaka (1982).
51. Stevens, J.C. Aging and spatial acuity of touch. J. Gerontol. 47 (1) 35-40 (1992).
52. Gwosdow, A. R., Stevens, J. C, Berglund, L. G. and Stolwijk, J. A. J. Skin friction and fabric sensations in neutral and warm environments. Tex. Res. J. 56 (9), 574-580 (1986).
53. Lane, H. L., Catania, A. C. and Stevens, S. SVoice level: Autophonic scale, perceived loudness and effect of side tone. J. Acoust. Soc. Am. 33, 160-167 (1961).
54. Stevens, J.C. A comparison of ratio scales for the loudness of white noise and the brightness of white light. Ph.D. Dissertation, Harvard University (1957).
49

55. Baird, J. C. and Harder, K. A. The psychophysics of imagery. Percept. & Psychophys. 62 (1), 113-126(2000).
56. Marks, L. E. and Gonzales, R. R. Skin temperature modifies the pleasantness of thermal stumuli. Nature, 247 (5441), 473-475 (1974).
50

Appendix
Instructions used to collect magnitude estimation data in Phase 3, Experiment 1
51

Instructions
In this test we would like to obtain your opinion about the meaning of different words and
phrases that could be used to describe one's feelings about the comfort or discomfort of clothing.
In order to obtain your opinions about these words and phrases, we are going to use a special
method that allows you to indicate the magnitude of comfort or discomfort associated with each
word/phrase by assigning numbers to them.
On each of the pages that follow, you will find a word/phrase that is/are used to describe
comfort/discomfort feelings towards clothing. Next to it will appear two blank lines as in the
following example:
+, -, 0 How Much
Extremely Comfortable
After reading the phrase, the first thing you must do is assess whether the phrase is
positive (+), negative (-), or neutral (0) in terms of the comfort - discomfort dimension. If you
feel that the phrase suggests some degree comfort toward clothing, you would place a positive
sign (+) on the first line after the phrase. If on the other hand, you feel that the phrase suggests
some degree of discomfort for clothing, you would put a negative sign (-) on the first line after
the phrase. If the phrase does not strike you as suggesting either comfort or discomfort, but
rather is a "neutral" phrase, you should put a zero (0) on this line.
After having determined whether the phrase is positive, negative or neutral and writing
the appropriate symbol (+, -, 0) on the first line, you will then assess the strength or magnitude of
the comfort or discomfort reflected by the phrase. You will do this by placing a number on the
second blank line (under "How Much"). For the first phrase that you rate, you can write any
number you want on the line. We suggest you do not use a small number for this word/phrase.
The reason for this is that subsequent words/phrases may reflect much lower strengths of comfort
or discomfort. Aside from this restriction, you can use any number you want. For each
subsequent word/phrase, your numerical judgment should be made proportionally and in
comparison to the first number. That is, if you assigned the number 800 to index the strength of
the comfort/discomfort denoted by the first word/phrase and the strength of comfort/discomfort
52

denoted by the second word/phrase twice as great, you would assign it the number 1600. If it
were three times as great, you would assign it the number 2400, etc. Similarly, if the second
word/phrase denoted only 1/10 the magnitude of comfort/discomfort as the first, you would
assign it the number 80 and so forth. If any word/phrase is judged to be "neutral" (zero (0) on the
first line), it should also be given a zero for its magnitude rating.
Remember: Proceed through each word/phrase by first judging whether it is positive
(+), negative (-), or neutral (0) in nature, and then rate the strength of liking or disliking reflected
by the word/phrase by assigning a number to it that stands in the same ratio to the number
assigned to the first work/phrase as is its magnitude of comfort/discomfort to the magnitude of
comfort/discomfort for the first word/phrase.
If you have any questions, please ask them before you begin. Thank you.
53