development and application of quality index method …uwohxjxf/images/thesis_-_jullan_defoe.pdf ·...
TRANSCRIPT

PO Box 1390, Skulagata 4 Final Project 2014
120 Reykjavik, Iceland
Development and Application of Quality Index Method Scheme for Fresh
Farmed Atlantic Salmon (Salmo salar) Fillets and Whole Fish
Jullan Defoe
Fisheries Division, Ministry of Agriculture & Fisheries
Roseau Fisheries Complex, Roseau, Dominica
Supervisor
Kolbrun Sveinsdottir
MATIS
ABSTRACT
The overall goal of this project is to learn how sensory evaluation may be applied in the artisanal
fisheries industry in Dominica. This was done through the development and application of a
sensory evaluation method to evaluate fish freshness, the Quality Index Method (QIM), in a full
scale shelf life study.
In this study a QIM scheme was developed for salmon (Salmo salar) fillets and evaluated in a shelf
life study. Further, the application of a QIM scheme for whole salmon (Salmo salar) was evaluated.
Salmon fillets were stored up to 15 days, but whole salmon for up to 21 days in a cooling chamber
at -1.6°C and evaluated with sensory evaluation (QIM for salmon fillets and Generic descriptive
analysis for cooked salmon (GDA)) by a trained sensory panel, and at the same time the total viable
counts (TVC) and H2S producing bacteria counts were measured. Similar results were observed
for the QI of the whole salmon and the QI score of the salmon fillets. The QI showed only slight
increase with storage time even though the correlation was high. Sensory evaluation of cooked
samples from fillets and whole fish showed no detection of spoilage characteristics hence, a point
of rejection was not reached at the end of the experiment. Temperature during the storage of fillets
and whole fish was very low and seemed to be a key factor in the long shelf life of the whole
salmon and the salmon fillets. Microbial counts (TVC) were 5.6x10⁶ and 1.1x10⁶ cfu/g in flesh of
fillets and whole fish respectively, but H2S producing bacteria 2.4x10⁶ and 7x10⁴ cfu/g
respectively. A QIM scheme for salmon fillets has been developed but it is recommended that the
scheme should be evaluated at slightly higher temperatures.

J. Defoe
2
TABLE OF CONTENTS
1 Introduction ............................................................................................................................. 5
1.1 Fisheries in Dominica....................................................................................................... 5
1.2 Fish freshness ................................................................................................................... 6
1.3 Shelf Life .......................................................................................................................... 7
1.4 Sensory evaluation of fish ................................................................................................ 8
1.5 Aim ................................................................................................................................. 10
2 METHODS ........................................................................................................................... 10
2.1 Development of a QIM scheme for salmon fillets and application of QIM for whole
salmon ....................................................................................................................................... 10
2.1.1 Sample Preparation ................................................................................................. 12
2.2 Sensory Evaluation of raw salmon fillets ....................................................................... 13
2.2.1 Sensory evaluation of cooked fillets ....................................................................... 14
2.3 Application of QIM and GDA on whole salmon in Shelf Life Study............................ 14
2.3.1 Shelf life study using QIM ...................................................................................... 14
2.3.2 Shelf life study using GDA ..................................................................................... 15
2.4 Microbial counts ............................................................................................................. 15
3 RESULTS ............................................................................................................................. 16
3.1 Temperature ................................................................................................................... 16
3.2 Development of a QIM scheme for Salmon Fillets........................................................ 16
3.2.1 Sensory evaluation of raw fillets............................................................................. 17
3.2.2 Evaluation using the QIM scheme in shelf life study ............................................. 18
3.2.3 Evaluation of cooked fillets in shelf life study ....................................................... 21
3.2.4 Microbiological analysis ......................................................................................... 24
3.3 Sensory Evaluation of Whole Salmon ........................................................................... 25
3.3.1 Sensory evaluation using QIM scheme in shelf life study ...................................... 25
3.3.2 Evaluation of cooked whole fish in shelf life study ................................................ 28
3.3.3 Microbiological analysis ......................................................................................... 31
4 DISCUSSION ....................................................................................................................... 32
4.1 Development of a QIM scheme and evaluation for salmon fillets ................................. 32
4.2 Application of QIM scheme for whole salmon .............................................................. 33
J. Defoe
3
5 CONCLUSION ..................................................................................................................... 34
ACKNOWLEDGEMENT ............................................................................................................ 35
LIST OF REFERENCE ................................................................................................................ 36
APPENDIX ................................................................................................................................... 38
Appendix 1 ................................................................................................................................ 38
Appendix 2 ................................................................................................................................ 39
Appendix 3: Pictures of panellist at QIM and GDA training sessions ..................................... 40
LIST OF FIGURES
Figure 1.Relationship between quality and freshness (Olafsdottir, et al., 1997) ............................ 7
Figure 2: Experiment design for the development and application of QIM scheme for salmon fillets
stored at 0°C .................................................................................................................................. 11
Figure 3: Experiment design for QIM application for whole salmon stored at 0°C for up to 21 days
....................................................................................................................................................... 11
Figure 4. Table prepared for QIM evaluation of whole fish ......................................................... 12
Figure 5. Preparation of cooked samples for GDA ....................................................................... 13
Figure 6.Temperature log of storage room and storage temperature of salmon fillet and whole fish
....................................................................................................................................................... 16
Figure 7. Changes in appearance of raw salmon fillets in cold storage from day 3 to day 15 ..... 19
Figure 8.Average score for each quality attribute evaluated with QIM scheme for salmon fillets
....................................................................................................................................................... 20
Figure 9.Quality Index of salmon fillet over days in cold storage................................................ 21
Figure 10.Distribution of QI with time in cold storage of the sensory panel ............................... 21
Figure 11.Non spoilage (A) and Spoilage (B) odor attribute scores of cooked salmon fillets in cold
storage ........................................................................................................................................... 22
Figure 12.Non spoilage (A) and Spoilage (B) flavor attributes of cooked salmon fillets in cold
storage ........................................................................................................................................... 23
Figure 13.Changes in the appearance of cooked salmon fillets in cold storage ........................... 23
Figure 14.Changes in the texture of cooked salmon fillets in cold storage .................................. 24
Figure 15.Total viable counts and selective count of H2S producing bacterial in salmon fillets in
cold storage ................................................................................................................................... 24
Figure 16.Correlation between bacteria and quality index of salmon fillets in cold storage........ 25
Figure 17.QI score against days in cold storage of each parameter in QIM scheme for whole salmon
....................................................................................................................................................... 27
Figure 18.Quality index of whole salmon over days in cold storage............................................ 27
Figure 19.Distribution of QI score with time in cold storage of sensory panel ............................ 28
Figure 20.Non spoilage (A) and Spoilage (B) attributes of cooked whole salmon in cold storage
....................................................................................................................................................... 29

J. Defoe
4
Figure 21.Non spoilage (A) and Spoilage (B) flavour attributes of cooked salmon in cold storage
....................................................................................................................................................... 29
Figure 22.Changes in the appearance of cooked salmon in cold storage ..................................... 30
Figure 23.Changes is the texture of cooked salmon in cold storage ............................................. 30
Figure 24.Total viable counts and selective counts of H2S producing bacteria in whole salmon on
cold storage ................................................................................................................................... 31
Figure 25.Correlation between bacteria and the quality index of whole salmon in cold storage . 31
LIST OF TABLES
Table 1 Storage time of salmon fillets used for QIM training of sensory evaluation panel and shelf
life study........................................................................................................................................ 14
Table 2 Storage time of cooked salmon fillets used in GDA training session and shelf life study
....................................................................................................................................................... 14
Table 3 Storage times of whole fish used for QIM training of sensory evaluation panel and shelf
life study........................................................................................................................................ 15
Table 4 Storage times of cooked whole fish used in GDA training session and shelf life study . 15
Table 5 Quality Index Method scheme developed for salmon fillets (salmo salar) ..................... 17

J. Defoe
5
1 INTRODUCTION
Fisheries in Dominica
The fisheries industry in Dominica is comprised of about 800 fisher folks (Dominica Fisheries
Division, 2011) from a total population of 71,293 people (Dominica Central Statistic Office, 2011).
They operate from fishing communities around the island, fishing from small open vessels in an
artisanal fashion. There are about 32 landing sites scattered along the coastline, the majority of
which are on the west coast or Caribbean Sea side. The East Coast is far more difficult to operate
from due to the harsh Atlantic Ocean conditions and limited infrastructure. However, a few
sheltered bays (both natural and man-made) allow for fishing communities to exist and thrive.
Over the past few years there has been a number of important developments in the fisheries sector.
These include a mandatory basic fisherman training course, improved fishing boats, gear
technology, safety and navigation devices and availability of micro financing so the strategy going
forward is to build on these. Today there are three modern fisheries facilities constructed through
Japanese Grant Aid assistance designed to offer services such as ice, vending stall, locker rooms
and fuel and docking services. These facilities also provide floor space and some amenities for
basic processing opportunities.
In the past decade average total yearly catch is about 690 MT with the greatest percentage of the
catch being off-shore pelagic fish species (yellowfin tuna, mahi-mahi, wahoo) (Dominica Fisheries
Division, 2014). Fisheries contribution to Gross Domestic Product (GDP) in 2012 was 0.33%
(Government of Dominica, 2012). It is anticipated that the fisheries sector will make a greater
contribution to GDP, through creation of employment and income earnings opportunities in the
sector, providing greater social and economic stability at the community level, poverty reduction,
and food security (Government of Dominica, 2012).
The most common way fish is consumed and marketed in Dominica is fresh. The marketing of the
fish is conducted through various avenues such as at the beach or landing site, roadside, open
vehicles, push carts or the catch can be sold directly to a wholesale buyer. The price of fish is
determined by supply and demand. However, many fishers are now being trained in better hygiene
and handling practices and also making investments to upgrade their boats to demonstrate Good
Manufacturing Practices (GMP's) in their fishing operation. GMP's are the basis for determining
safety at sea and food safety. These fishers are now creating a stronger market position to allow
for fish quality to be of greater influence on fish price. Instead, they would rather that quality grade
be incorporated as a factor so that they can be fairly rewarded for their effort investment to provide
higher quality product. Consumers are the main group in this small chain that could have the
greatest influence on change and currently there is inadequate public information to educate
consumers on the characteristics of good quality fish.
The Bureau of Standards is the Government agency with responsibility of establishing standards
as prescribed by the Codex Alimentarius. A draft Code of Practice for the sale of fresh fish was
developed by the fish and fishery products subcommittee under the auspices of the Food and Food
Product technical committee (Dominica Bureau of Standards, 2006). The aim of this standard is

J. Defoe
6
to assist fishers, retailers and vendors in providing safe and good quality wholesome fish to the
consumer. A Quality index based on sensory evaluation in the draft code of practice for sale of
fresh fish is identified as the means by which attributes of fish should be assessed to determine
freshness. However, the attributes in the code are not species specific and individuals engaged in
fish marketing and handling have no training in sensory evaluation. Therefore, it is critical for
personnel involved in the industry both as suppliers and regulators to be properly trained in sensory
evaluation methods to ensure acceptable quality and freshness to consumers. The results of this
initiative will create economic opportunities to help increase and sustain livelihoods in fisheries
which is vital in a small island developing state.
Fish freshness
In order to ensure the safety of food it is important to keep the quality of fish at a high level in each
link of the whole complex chain from catch to consumer. Botta (1995) cites 15 different definitions of
quality. These range from general statements to consumer definitions (Hyldig & Nielsen, 2004).
Quality cannot be defined in a simple manner, as the definition changes with the particular context
where it is applied, is dependent on the multitude of species and the influence of biological (season,
spawning period) and technological ( handling, temperature, time) parameters (Hyldig & Nielsen,
2004). Seafood is a very perishable product. From the moment the seafood is caught, the deterioration
process starts and its quality for use as a food product is affected. Changes occur in composition and
structure caused by biochemical, physical, enzymatic and bacterial processes, negatively affecting the
sensory quality of the product (Martinsdóttir 2002).
One general definition of quality is that it is the degree to which products meet certain needs under
specified conditions. This means that the definition depends on the particular context in which it
is applied. Quality is also a multidimensional concept since generally many different parameters
affect a product’s quality (Bremner, 2000). A product with excellent quality is a product that meets
the buyer's highest expectations whereas a product with unsatisfactory quality is a product that
does not meet the buyers and users minimum expectations (Botta, 1995). However in the
production of high quality food today more detailed information is needed on the quality of the
raw materials and products. Using sensory methods for the evaluation of food gives valuable
information on the food quality (Martinsdottir E. , 2004).
Freshness is a key element in the quality assessment of fish by consumers. Fish is perishable and
has a limited storage life. The keeping quality is highly dependent on various factors during
handling and storage of fish from catch to consumer (Martinsdóttir et al., 2001).
“Freshness” is another difficult concept about which there is no set agreement. It is a term widely
used in more than one context. At times, it refers to the fact that the fish in the wild and at times it
is used in the context of unfrozen or unprocessed but sometimes “fresh frozen” is used (Bremmer,
2002). Fresh, defined only in terms of time, without defining how the seafood must be handled
and/or stored, can be very confusing to any buyer or user since the manner in which any specific
seafood item is handled or stored can greatly affect the acceptability of that item. Consequently
the practical usefulness of the term “freshness”, when defined only in terms of time, is often limited
(Botta, 1995).

J. Defoe
7
Quality is a function of freshness; freshness is essential for quality but it is not a priori a quality
factor. In Figure 1 the upper ‘quality’ circle comprises the factors that contribute to quality, and
the lower ‘freshness’ circle details the various approaches used to evaluate fish freshness. It depicts
the relationship between quality and freshness, focusing on the different characteristics of
freshness. Freshness can be explained to some extent by some objective sensory, (bio) chemical,
microbial and physical parameters’, and can therefore be defined as an objective attribute
(Howgate, 1985).
Figure 1.Relationship between quality and freshness (Olafsdottir, et al., 1997)
Shelf Life
Shelf life of food is the length of time it is fit for human consumption. Spoilage due to microbial
activity is the main limitation of the shelf life. Another cause of the spoilage may be rancidity,
especially in fat fish species. The flesh of newly caught fish is usually free of bacteria normally
ranging from 102 to 107 cfu/ cm2 (Liston, 1980). However, considerable amount of bacteria may

J. Defoe
8
be in the viscera, the gills and on the skin. The flesh of newly slaughtered salmon was around TVC
10 CFU/g but after 20 days of ice storage TVC was 105 CFU/g (Sveinsdottir, et al., 2002). When
the fish is stored whole in ice, the deterioration caused by bacteria is minimal for the first days of
storage. The flavour and compounds that characterize newly caught fish decrease and disappear in
the first few days during storage in ice, and the fish flesh becomes almost flavourless and odourless
for a while. The number of bacteria increases rapidly in the flesh, using various compounds to
grow, resulting in increasingly bad-smelling sulphur and nitrogenous volatiles until most people
evaluate the fish unfit for human consumption (Martinsdóttir, et al., 2001).
There are a number of factors that can influence the estimated shelf life but handling of the fish is
critical. Also quick cooling after catch, bleeding technique, fishing gear, temperature fluctuation
in storage, seasonality and fishing grounds have an effect, if fish kept in ice under optimum
conditions (Martinsdóttir, et al., 2001).
Experiments conducted by Bonilla et al., (2005) on cod fillets and Olafsdottir, et al., (2006) on
haddock fillets, both revealed that they had a shorter shelf life than whole fish. For haddock the
end of shelf life based on Torry sensory score of 5.5 was estimated after 13.5 days from fillet
samples stored at 0°C (Olafsdottir, et al., 2006). The estimated shelf life of whole Haddock was
15 days (Martinsdóttir, et al., 2001) and estimated shelf life for whole farmed Atlantic salmon was
20 days (Sveinsdottir, et al., 2002).
Sensory evaluation of fish
Sensory evaluation is a scientific method by which through the five human senses of sight, smell,
taste, touch and hearing specific characteristics of seafood can be measured, analysed and
interpreted. Sensory evaluation systematically assesses odour, flavour and texture of food which
must be performed scientifically under carefully controlled conditions to minimize the influence
of personal bias and the test environment (Martinsdóttir, et al., 2001).
Sensory evaluation is one of the most important methods for assessing freshness and quality in the
fishing sector and in fish-inspection services (Hyldig & Pettersen, 2004). There are different types
of methods however, the choice of the method depends on the purpose of the application and
whether it is used for product development, quality control, consumer studies or research. In
Europe the most used method that is mandatory in EU states for the quality assessment of raw fish
is the EU grading scheme according to council regulation (EC) 2406/26. The grading of raw fillets
in more commonly done by cooking before sensory evaluation and the Torry scheme is the scale
which is most commonly used for freshness evaluation in the fishing industry (Olafsdottir, et al.,
1997). Descriptive analyses such as Quantitative descriptive analysis (QDA) and Generic
descriptive analysis (GDA) are also used to evaluate cooked samples (Stone & Sidel, 2004).This
method can be time consuming and expensive as evaluations has be conducted in a standardized
environment. Panellists need training and retraining under the supervision of experienced panel
leaders using fish samples of known freshness stage (Martinsdóttir, 2002)a.
Sensory evaluation of fish is used by commercial seafood companies as part of the quality control
management to ensure that their products will meet the expectations of both buyers and regulatory
agencies. Seafood buyers use sensory evaluation to ensure that the product meets their expectation.

J. Defoe
9
Seafood regulatory agencies use it to confirm that the seafood produced meets the set standards
(Botta, 1995).
Quality Index Method
The Quality Index Method (QIM) is a sensory evaluation method based upon a scheme originally
developed by the Tasmanian Food Research Unit in Australia. The method is based on
characteristic changes that occur in raw fish. QIM is based on significant, well defined
characteristic changes of outer appearance attributes (eyes, skin, gills, smell) for raw fish and a
score system from 0 to 3 demerit index points. The scores for all the characteristics are summarized
to give an overall sensory score, the so called quality index. The scientific development of QIM
for various species aims at having quality index increase linearly with time in ice (Martinsdóttir,
2002)b.
Today QIM is a now a leading reference method for quick and reliable assessment of fish freshness
and it is als0 useful in providing feedback to the fishers regarding the quality of their catch. This
method is inexpensive because it require no costly equipment, quick, reliable and do not affect
integrity of the fish. Because it is easy to use, it is an ideal method for training of individuals such
as fishers and buyers involved in fisheries industry in developing countries where application of
more sophisticated methods are not possible. There has been an increasing interest in the Quality
Index Method and schemes have been developed for various species such as cod, haddock, redfish,
saithe, shrimp, salmon, brill, plaice, sole, turbot, herring, Atlantic mackerel, horse mackerel,
European sardine, dab, gilthead bream, frozen hake, Mediterranean hake, frigate tuna, octopus,
flounder, maatjes herring, Mediterranean anchovies, cuttlefish, short-fin squid, farmed Atlantic
halibut, tub gurnard and pollock. (Martinsdóttir, et al., 2001). QIM schemes have also been
developed for other types of fish products. The use of a QIM scheme developed for fresh cod fillets
showed a clear linear relationship to storage time on ice. The QIM scheme consisted of eight
parameters which gave a total of 18 demerit points. The maximum storage time was estimated at
8 days on ice based on counts of H2S-producing bacteria and sensory evaluation with Quantitative
Descriptive Analysis (QDA) (Bonilla, et al., 2005).
The Quality Index Method was recommended as an EU initiative to harmonize and standardize
the sensory evaluation of fish (Martinsdottir, et al, 2003). It is foreseen that the QIM will be
useful to give feedback to fishermen concerning the quality of their catch, which may in turn
influence better handling on board. The method allows for quick and reliable assessment of the
freshness of fish (Hyldig & Nielsen, 2004).
Generic Descriptive Analyses
Descriptive analysis is a methodology that provides quantitative description of products, based on
perceptions from a group of qualified panellist. It is a total sensory description, taking into account
all sensations that are perceived- sight, sound, odour, flavour, etc. - when the product is evaluated.
The descriptive test is a very dynamic system in which the panel leader must make numerous

J. Defoe
10
decisions when organizing a panel through screening, training and product evaluation. Without
sufficient knowledge, inadequate or incorrect product decisions will be reached (Stone & Sidel,
2004).
A basic strength of the GDA method is the ability to independently verify (after each test) that
persons perceive differences among products on attributes in a reliable manner. This is directly
measure with one way analyses of variance from each panellist for each attribute. The need to
monitor the performance of each panellist in each test reflects the awareness of the sensory
limitation of man (Stone & Sidel, 2004) .
When applying GDA a line scale is used without any numbers to indicate numerical value on the
line to avoid biases. The line scale which is 15cm long contains descriptive words at both end with
the intensity of the description moving from left to right. A vertical mark will then be place on the
line to identify the intensity of the attribute by the assessor (Stone & Sidel, 2004) . In addition to
giving a detailed description of the sensory profile of a product, the maximum storage time of fish
can be determined by using GDA (Sveinsdottir, et al., 2002).
Aim
The main aim of this project is to learn how sensory evaluation may be applied in the artisanal
fisheries industry in Dominica. This will be done through the development of a Quality Index
Method (QIM) and Generic Descriptive Analysis (GDA) scheme using salmon fillets and whole
fish. The methodology will then be applied to the Dominica fisheries industry.
Specific objectives of the Project experiment:
1. Develop a Quality Index Method Scheme for raw farmed Atlantic salmon fillets
2. Training of panellists to assess fillets cooked and raw
3. Conduct self-life study with fillets stored on ice using developed QIM scheme
4. Determine maximum storage time of Salmon fillets
5. Conduct shelf life study of whole raw farmed Atlantic salmon using established QIM
scheme
2 METHODS
Development of a QIM scheme for salmon fillets and application of QIM for whole
salmon
The methodology for this experiment will be guided by the previous work of Bonilla (2005) on
developing a QIM scheme for fresh cod fillets and the work of Sveinsdottir, et al., (2002) on the
development of QIM scheme for whole salmon.

J. Defoe
11
Experimental design
Figure 2: Experiment design for the development and application of QIM scheme for salmon fillets
stored at 0°C
Figure 3: Experiment design for QIM application for whole salmon stored at 0°C for up to 21
days
Shelf life study
Pre-observation of fillets
conducted to establish a quality
index scheme
Development and application
of QIM for salmon fillets
Shelf life study
Sensory panel training
Sensory panel training
QIM application in whole
salmon
Storage days 2,5,8,11,15
Cold storage 0°C
QIM on raw fillets, GDA on
cooked fillets Storage days 3,
5,8,9,12,15
QIM on raw fillets, GDA on
cooked fillets, Microbial
analysis, Storage days 3, 6, 8,
11, 12, 15
QIM on raw fish, GDA on
cooked fish
Storage days 10, 19 Cold storage
0°C
QIM on raw fish, GDA on
cooked fish, Microbial analysis
Storage days 2, 8, 10, 16, 19, 21

J. Defoe
12
2.1.1 Sample Preparation
Atlantic salmon farmed at Silfurstjarnan Oxarfirdi, was acquired through a supplier. The supplier
was capable of supplying whole fish and fillets one to two days after slaughter. This consistency
was very important as the sample materials were needed to be evaluated at different time periods
in storage. The whole fish and fillets were delivered on ice and were stored in a cold storage at 0-
1°C at MATIS.
Temperature Loggers
iButton temperature loggers (DS1922L/T) were used to measure and record temperature every 15
minutes. Two temperature loggers were placed in the storage room about 50 cm from the floor at
the centre and near the door. Two temperature loggers each were placed in two containers
containing salmon fillets and whole fish delivered on January 6, 2015. The loggers in the fillet
container were retrieved on January 19, 2015 at the end of shelf life study for fillets. The loggers
in the whole fish container and cold storage room were retrieved on January 29, 2015 at the end
of shelf life study of whole salmon.
Sensory evaluation of raw fillets
Samples of raw fillets were placed on a clean white Table 15 minutes and whole fish 30 minutes
before the evaluation. Each sample was coded with a three digit random number. All observation
were conducted under standardized conditions, with as little interruption as possible, at room
temperature, and under white fluorescent light. For whole fish the side where gill was cut was
placed facing down depicted in Figure 4.
Figure 4. Table prepared for QIM evaluation of whole fish
Sensory evaluation of cooked fillets and whole fish
For the GDA training and sensory evaluation during the shelf life study, samples weighing about 40–
50 g were taken from the loin part of the fillets and whole fish then placed in aluminium boxes coded
with three-digit random number. The samples were cooked at 100°C for six minutes in a pre-warmed
Convostar oven with air circulation and steam.

J. Defoe
13
Figure 5. Preparation of cooked samples for GDA
Sensory Evaluation of raw salmon fillets
Pre-observation
The objective of the pre-observation of raw fillets was to get an idea about the changes in quality
parameters with storage time. Two persons observed two fish fillets at six pre-establish data points
ranging from 2 to 14 days. Based on these observations, the sensory parameters were recorded and
analysed. Each description received a score in which 0 corresponded to very fresh fillets. Then the
scores increased according to spoilage with a maximum score of 3 for each parameter. Based on
the results acquired a preliminary QIM scheme for the sensory evaluation of fresh salmon fillets
was established.
Shelf life study using QIM
Ten panellists from MATIS participated in two training sessions as they were not familiar with
conducting QIM evaluation of salmon fillets. Two fillets from six different storage days were
evaluated. In the first session information about the storage time was shown, for the second session
the fillets were identified by a three digit random number. At the end of the second session panellist
were informed of the storage time corresponding to the number.
For the training sessions, the panel applied the QIM scheme which was developed during the pre-
observation of the salmon fillets. The panel leader instructed the panel of how to use the scheme
and how to evaluate each quality parameter. Then the panel proceeded to evaluate the fillets and
gave feedback during the process. After each training session, a discussion was held between the
panel and panel leader to exchange ideas and give suggestion for improvement of the scheme. For
the final training session the panel was informed of all relevant changes made to the scheme base
on their prior discussion and feedback.
The QIM scheme developed was used to evaluate the salmon fillets by the sensory panel. The
panellist evaluated 3 fillets from the six different storage days in two sessions as show in Table 1.
The fillets were coded with a random 3 digit number.

J. Defoe
14
Table 1. Storage time of salmon fillets used for QIM training of sensory evaluation panel and shelf
life study
Type of session Date of session Session
number
Number of fillets
evaluated
Storage days
Training January 13, 2015 1 2 5,9,15
January 16, 2015 1 2 3,8,12
Shelf life study January 16, 2015 1 3 3,8,12
January 19, 2015 1 3 6,11,15
2.2.1 Sensory evaluation of cooked fillets
Shelf life study using GDA
The panellist were trained during two training session to evaluate the cooked salmon fillets using
GDA method according to Stone & Sidel, (2004). They made observations of differences in
appearance, odour, texture and flavour of the cooked fillet as with a list of specific words to
describe the intensity of each attribute for a given sample using an unstructured scale from 0 to
100%. Each panellist evaluated duplicate samples for four storage times.
The GDA of cooked fillets during the main trial were conducted in parallel to the QIM evaluation
sessions. The panel evaluated 3 samples of cooked salmon fillets in duplicate from six storage
times shown in table 2 describing the intensity of the attributes utilized during training.
Table 2. Storage time of cooked salmon fillets used in GDA training session and shelf life study
Type of session Date of session Session
number
Storage days
Training January 13, 2015 1 2,8,15
January 16, 2015 1 2,8,12
Shelf life study January 16, 2015 2 3,8,12
January 19, 2015 2 6,11,15
Application of QIM and GDA on whole salmon in Shelf Life Study
2.3.1 Shelf life study using QIM
The shelf life study of raw farmed Atlantic salmon in this experiment was guided by the procedure
on Sveinsdottir, et al, (2002) which is published in the Sensory evaluation for fish freshness
manual (Martinsdóttir, et al., 2001).
The panellist conducted one training session to evaluate whole salmon with QIM for three known
different storage times. This session only served as a refresher since the panel was already trained

J. Defoe
15
and had experience in the application of the QIM scheme for this species prior to this study. The
panel used the established scheme developed for this species to evaluate 3 fish at six different
storage times which were identified by a 3 digit random code during two sessions as shown in
Table 3.
Table 3. Storage times of whole fish used for QIM training of sensory evaluation panel and shelf
life study
Type of session Date of session Number of
sessions
Number of fillets
evaluated
Storage days
Training January 21, 2015 1 2 10,19
Shelf life study January 23, 2015 1 3 2,10,19
January 29, 2015 1 3 8,16,21
2.3.2 Shelf life study using GDA
The GDA, introduced by (Stone & Sidel, 2004), was used to assess cooked samples of salmon. An
unstructured scale (0 to 100%) was used to describe specific attributes odour, flavour, appearance,
and texture. Since the panel was already trained and has experience only one training session was
conducted as a refresher.
The sensory evaluation of the cooked salmon were performed parallel to the QIM evaluation of
whole fish. Each panellist evaluated 3 samples in triplicate from six different storage times shown
in Table 4 where, each sample was coded with a 3 digit random number.
Table 4. Storage times of cooked whole fish used in GDA training session and shelf life study
Type of session Date of session Number of
session
Storage days
Training January 21, 2015 1 10,19
Shelf life study January 23, 2015 2 2,10,19
January 29, 2015 2 8,16,21
Microbial counts
Flesh samples for the microbiological analysis were collected from fillets in storage time of 3, 6,
8,11,12,15 days and whole fish 2, 8, 10, 16, 19, 21 days, before commencing sensory evaluation.
Total Viable Counts (TVC) and counts of H2S-producing bacteria were performed on Iron Agar
by the pour-plate method. 20 g of each sample was minced in a laboratory warring blender. The
mince was then diluted with 200 ml cooled Maximum Recovery Diluent (MRD, Oxoidi, UK) and
homogenized in a stomacher bag for one minute. Serial 10-fold dilutions were performed for the
9 ml cooled MRD that was prepared before. After completing the 10-fold method, the solution of
the iron agar plate was spread onto the plate and then the plates were incubated at 17°C for 5 days.
The spoilage bacteria were identified as black colonies on this medium. Total number of colonies
J. Defoe
16
were counted by a colony counter and calculated the total viable bacteria and H2S producing
bacteria by CFU/g (spoilage bacteria).
3 RESULTS
Temperature
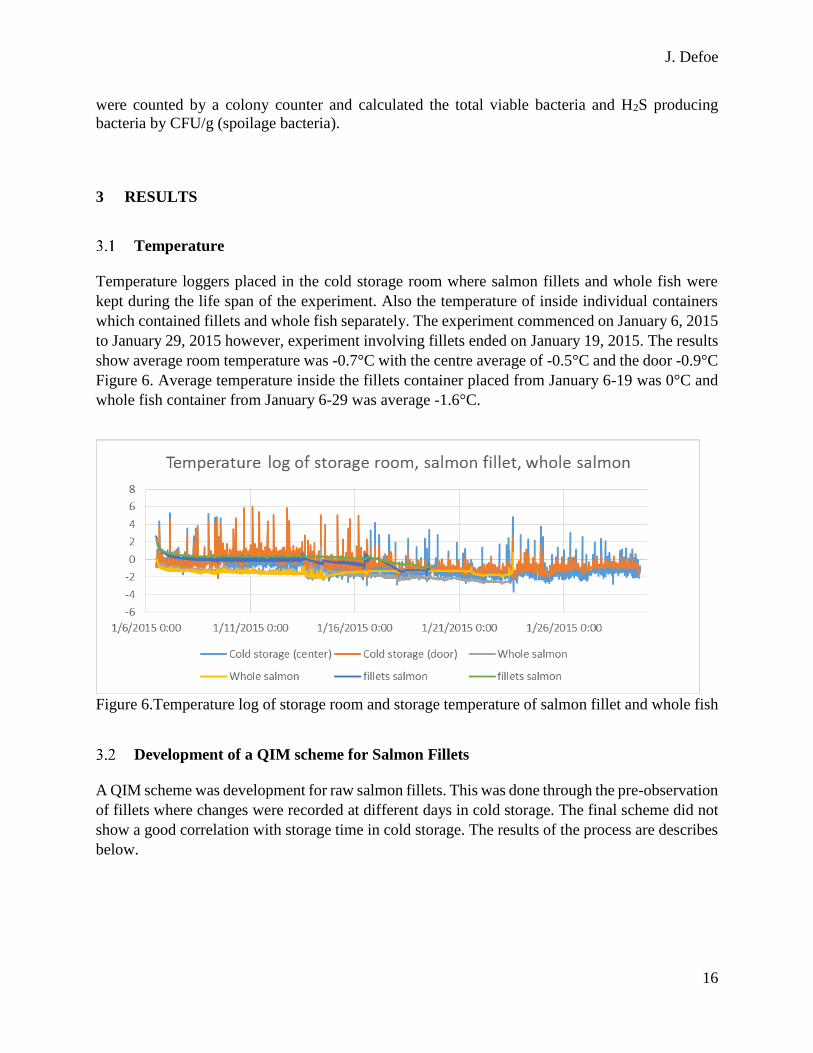
Temperature loggers placed in the cold storage room where salmon fillets and whole fish were
kept during the life span of the experiment. Also the temperature of inside individual containers
which contained fillets and whole fish separately. The experiment commenced on January 6, 2015
to January 29, 2015 however, experiment involving fillets ended on January 19, 2015. The results
show average room temperature was -0.7°C with the centre average of -0.5°C and the door -0.9°C
Figure 6. Average temperature inside the fillets container placed from January 6-19 was 0°C and
whole fish container from January 6-29 was average -1.6°C.
Figure 6.Temperature log of storage room and storage temperature of salmon fillet and whole fish
Development of a QIM scheme for Salmon Fillets
A QIM scheme was development for raw salmon fillets. This was done through the pre-observation
of fillets where changes were recorded at different days in cold storage. The final scheme did not
show a good correlation with storage time in cold storage. The results of the process are describes
below.

J. Defoe
17
3.2.1 Sensory evaluation of raw fillets
Pre-observation
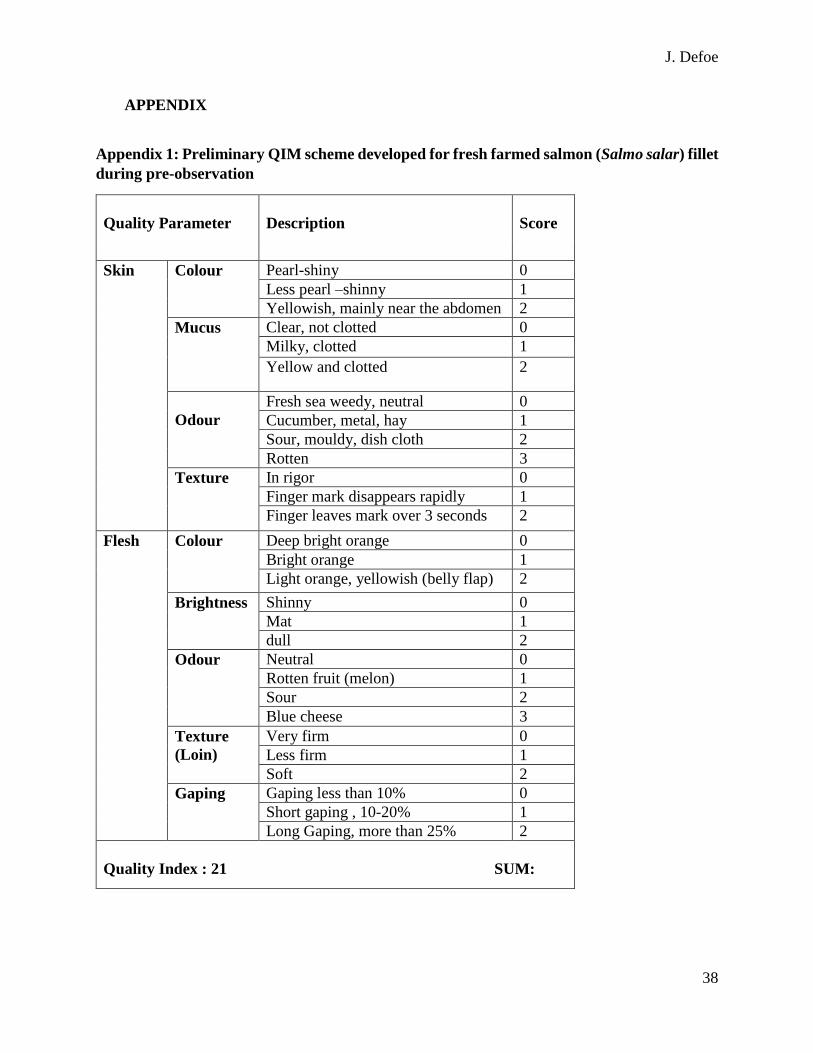
In the preliminary scheme shown in two parameters skin and flesh with nine attributes were listed
during pre-observations of raw salmon fillets (Appendix 1). The maximum sum of the quality index
points was 18.
Training Sessions
The sensory panel during the training sessions made modification to the description of some
attributes. More suitable descriptive words were used to describe flesh attributes of colour, odour
and gaping. The scheme was finalized after the last session of training which contained two
parameters for skin and flesh with nine attributes. The total sum of quality index points was 21
shown in (Table 5).
Table 5. Quality Index Method scheme developed for salmon fillets (Salmo salar)
Quality Parameter
Description
Score
Skin
Colour
Pearl-shiny 0
Less pearl –shiny 1
Yellowish, mainly near the abdomen 2
Mucus
Clear, not clotted 0
Milky, clotted 1
Yellow, clotted 2
Odour
Fresh sea weedy, neutral 0
Cucumber, metal, hay 1
Sour, mouldy, dish cloth 2
Rotten 3
Texture In rigor 0
Finger mark disappears rapidly 1
Finger leaves mark over 3 seconds 2
Flesh Colour
Normal salmon colour* 0
Slightly grey hue 1
Grey hue, yellowish near the abdomen 2
Brightness
Shiny 0
Slightly mat 1
dull 2
Odour
Neutral, cucumber 0
Melon 1
Slight sour, slightly overripe fruit 2

J. Defoe
18
Blue cheese, overripe fruit, spoilage sour 3
Texture
(Loin)
Very firm 0
Less firm 1
Soft 2
Gaping
Gaping less than 10% 0
Gaping , 10-20% 1
Gaping, 25-50% 2
Gaping more than 50% 3
Quality Index (0-21) SUM:
3.2.2 Evaluation using the QIM scheme in shelf life study
Raw salmon fillets were evaluated stored at 0°C in cold storage. In the parameter describing skin
attribute of colour at the first point of evaluation on day 3 shown in figure 10 was pearl-shiny with the
presence of mucus. However at the last point of evaluation day 15 was less peal shiny with milky and
clotted mucus shown in Figure 7. Odour was detected as having a cucumber smell that progressed to
hay while, the texture remained consistent throughout storage with finger marks disappearing quickly
within 3 seconds. In the flesh parameter the attributes of colour appeared to be normal throughout
while brightness progressed from shinny to slightly mat at the end. The flesh odour started with a
neutral, cucumber smell which increase linearly with storage time to slightly sour, slightly overripe
fruit smell. The flesh texture went from firm to less while gaping observed at the beginning progressed
from less than 10% to 10-20% at the end storage.

J. Defoe
19
Figure 7. Changes in appearance of raw salmon fillets in cold storage from day 3 to day 15
The QI scores for each quality parameter did not show a linear increase with time in cold storage
(Figure 8). The QI score of fillets at 3 days did not receive a lowest score for none of the quality
parameters. Fillets at storage of 15 days did not receive the highest QI score for parameters skin colour,
flesh brightness and gaping. QI scores of parameters for fillets stored 8 days received a lower score for
fillets on storage for 3 and 6 days.

J. Defoe
20
Figure 8.Average score for each quality attribute evaluated with QIM scheme for salmon fillets
The quality index was calculated for each storage day in the main trial which did not indicate a
clear linear relationship to time in cold storage (Figure 9). There was a low to moderate correlation
(R2
=0.4879) between the average quality index and days in cold storage. Fillet stored at 8 and 11 days
received a lower quality index score than 2 and 6 days.

J. Defoe
21
Figure 9.Quality Index of salmon fillet over days in cold storage
Figure 10 shows the distribution of quality index score with time in cold storage of the sensory panel
for salmon fillets. In the two sessions conducted for shelf life study, 7-9 panellist evaluated but some
were not present for both sessions. The total number of panellist who participated was 11but not
everyone took part in the training session prior to the main trial.
Figure 10.Distribution of QI with time in cold storage of the sensory panel
3.2.3 Evaluation of cooked fillets in shelf life study
The sensory panel used Generic descriptive analysis (GDA) to evaluated parameters odour, flavour,
appearance and texture with each containing key attributes. Non spoilage attributes remained dominant

J. Defoe
22
throughout and attributes with spoilage characteristic were just slightly detected up to the final day of
storage. At the end of the evaluation of cooked fillets, end of shelf life was not reached.
Attributes with non-spoilage odour characteristics sweet, oil, metallic and earthy were constant with
slight fluctuation throughout the days in cold storage (Figure 14). The detection of attribute sweet was
dominant throughout the storage days Figure 11(a). Figure 11(b) show attributes sour, rancid, queasy
and putrid which are indicate spoilage characteristics. Detection of these attributes were constantly
very lower to undetected throughout the storage days of the fillet below a GDA score of 10. The odour
attribute putrid was never detected and there was no clear relationship between attributes scores and
storage time.
Figure 11.Non spoilage (A) and Spoilage (B) odor attribute scores of cooked salmon fillets in cold
storage
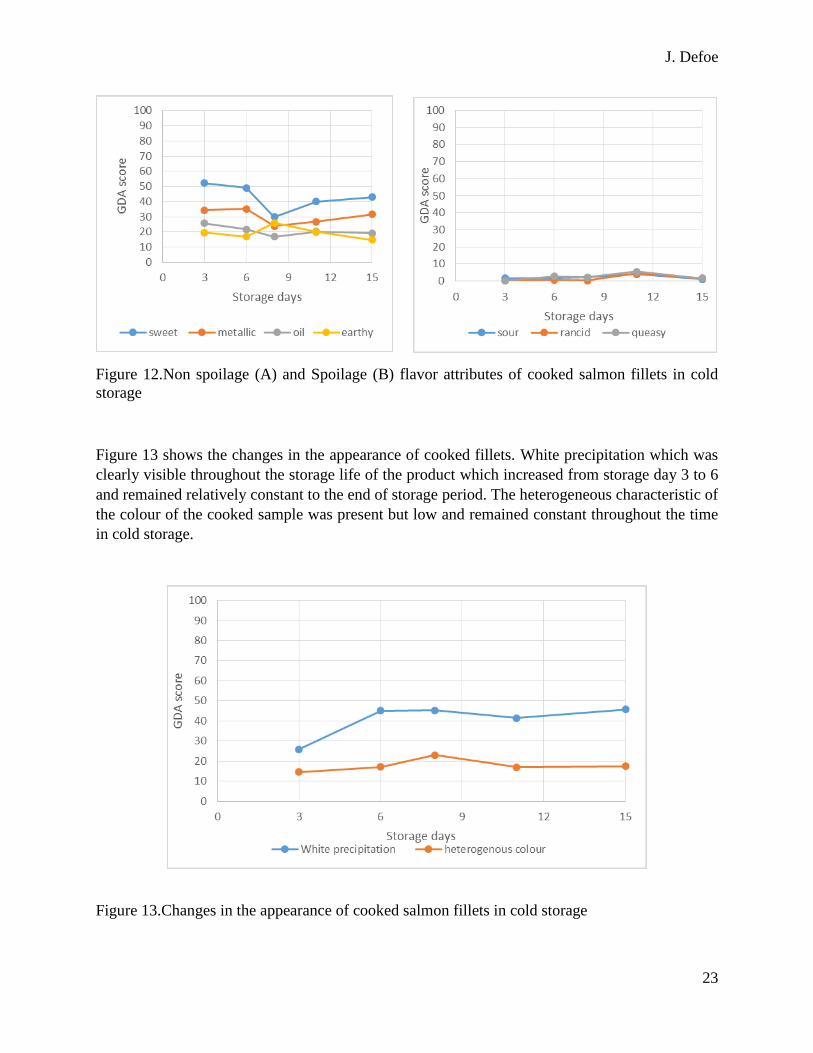
The attributes of positive characteristics shown in sweet, metallic, oil and earthy remained
relatively constant throughout the storage days with and there were no clear indication of the GDA
score decreasing with storage time (Figure12(a)). Sweet flavour attribute scored the highest
throughout the storage days. Flavour attributes of sour, rancid and queasy which are indicative of
spoilage characteristic. Their detection level were very low and constant throughout the storage
days (Figure 12 (b)).
J. Defoe
23
Figure 12.Non spoilage (A) and Spoilage (B) flavor attributes of cooked salmon fillets in cold
storage
Figure 13 shows the changes in the appearance of cooked fillets. White precipitation which was
clearly visible throughout the storage life of the product which increased from storage day 3 to 6
and remained relatively constant to the end of storage period. The heterogeneous characteristic of
the colour of the cooked sample was present but low and remained constant throughout the time
in cold storage.
Figure 13.Changes in the appearance of cooked salmon fillets in cold storage

J. Defoe
24
The changes in the appearance of cooked salmon fillets are shown in Figure 14. Positive attributes
of soft, juicy and tender were well detected throughout the storage time expect for a decrease from
storage day 6 to 11. The less desirable attribute of mushy was least detected but the level was
constant throughout the days in storage.
Figure 14.Changes in the texture of cooked salmon fillets in cold storage
3.2.4 Microbiological analysis
The microbial counts increased with storage time however, fillets of 6 days of storage recorded
higher counts than that of day 8 and 11 in storage shown in Figure 15. At the first point of storage
which is day 3, the total viable count (TVC) was around 103 CFU/g and H2S producing bacteria
was less than 20 CFU/g. At the end of storage at day 15 TVC was around 107 CFU/g and H2S
producing bacterial was about 106 CFU/g.
Figure 15.Total viable counts and selective count of H2S producing bacterial in salmon fillets in
cold storage
J. Defoe
25
There was a good correlation between the quality index and total viable counts and selective counts
of H2S producing bacteria shown in Figure 16.
Figure 16. Correlation between bacteria and quality index of salmon fillets in cold storage
Sensory Evaluation of Whole Salmon
3.3.1 Sensory evaluation using QIM scheme in shelf life study
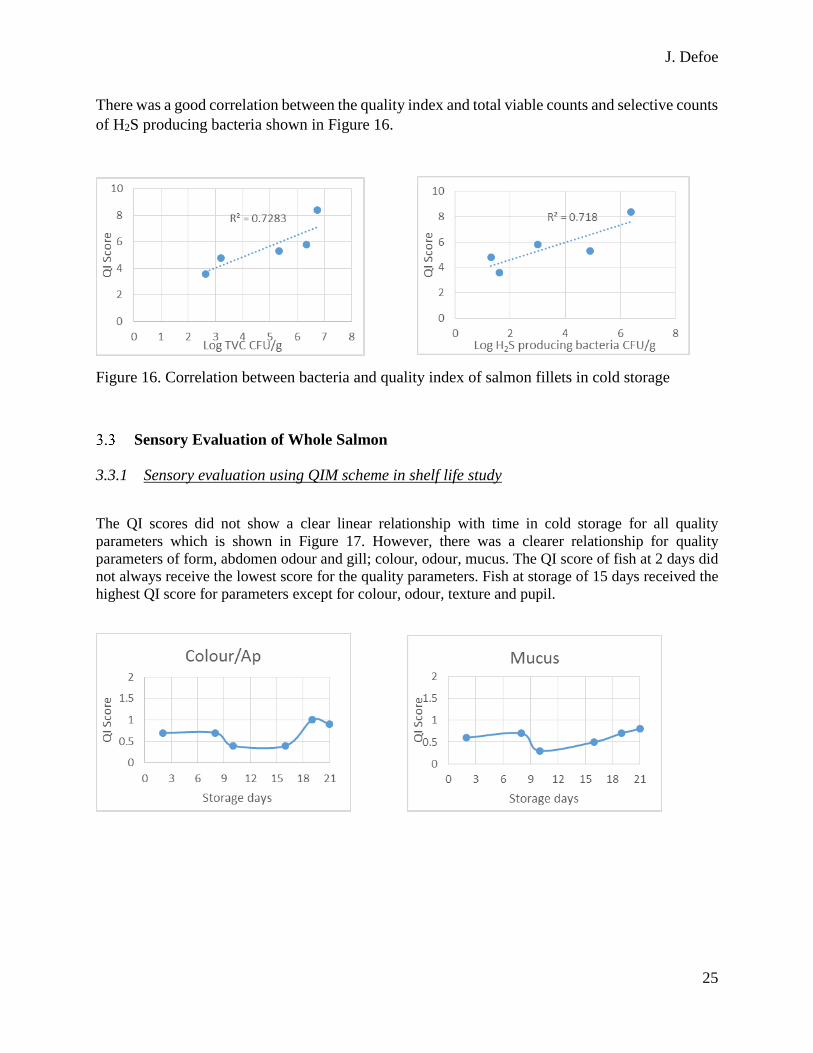
The QI scores did not show a clear linear relationship with time in cold storage for all quality
parameters which is shown in Figure 17. However, there was a clearer relationship for quality
parameters of form, abdomen odour and gill; colour, odour, mucus. The QI score of fish at 2 days did
not always receive the lowest score for the quality parameters. Fish at storage of 15 days received the
highest QI score for parameters except for colour, odour, texture and pupil.

J. Defoe
26
J. Defoe
27
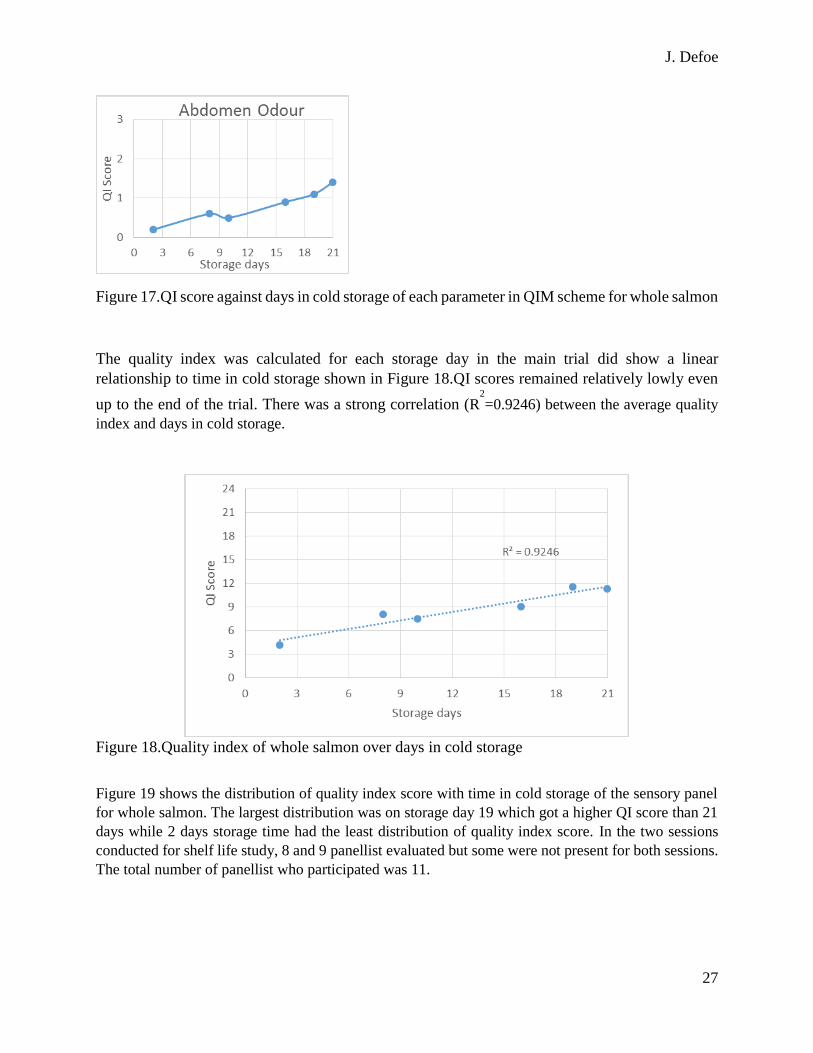
Figure 17.QI score against days in cold storage of each parameter in QIM scheme for whole salmon
The quality index was calculated for each storage day in the main trial did show a linear
relationship to time in cold storage shown in Figure 18.QI scores remained relatively lowly even
up to the end of the trial. There was a strong correlation (R2
=0.9246) between the average quality
index and days in cold storage.
Figure 18.Quality index of whole salmon over days in cold storage
Figure 19 shows the distribution of quality index score with time in cold storage of the sensory panel
for whole salmon. The largest distribution was on storage day 19 which got a higher QI score than 21
days while 2 days storage time had the least distribution of quality index score. In the two sessions
conducted for shelf life study, 8 and 9 panellist evaluated but some were not present for both sessions.
The total number of panellist who participated was 11.

J. Defoe
28
Figure 19.Distribution of QI score with time in cold storage of sensory panel
3.3.2 Evaluation of cooked whole fish in shelf life study
The sensory panel used Generic descriptive analysis (GDA) to evaluated parameters odour, flavour,
appearance and texture with each containing descriptive attributes. Detection of non-spoilage attributes
were more dominant throughout storage days rather than attributes with spoilage characteristic which
were just slightly detected up to the final day of storage. At the end of the evaluation of cooked whole
fish, a rejection point was not detected therefore end of shelf life was not reached.
Odour attributes with non-spoilage characteristics of sweet, oil, metallic and earthy were detected at a
constant level with slight fluctuation throughout the days in cold storage in. The attribute of sweet was
dominant throughout the storage days Figure 20(a). Figure 20(b) show attributes sour, rancid, queasy
and putrid which are negative and indicate spoilage characteristics. Detection of these attributes were
very lower to undetected throughout the storage days below a GDA score of 10. Positive and negative
attributes score did not shore any relationship with storage time.

J. Defoe
29
Figure 20.Non spoilage (A) and Spoilage (B) attributes of cooked whole salmon in cold storage
Flavour attributes which do indicate spoilage characteristics sweet, metallic, oil and earthy
remained were detected throughout the storage days (Figure 21 (a)). Flavour attribute of sweet
received the highest detection throughout the storage days. Flavour attributes of sour, rancid and
queasy which are indicative of spoilage characteristic (Figure 21 (b)). Their detection level were
constantly low throughout the storage days. While there are slight fluctuation in detection both
non spoilage and spoilage attribute however relationship between GDA score and storage time are
not clear.
Figure 21.Non spoilage (A) and Spoilage (B) flavour attributes of cooked salmon in cold storage
White precipitation on or in the flake of the cooked were detected throughout days in storage
(Figure 22). However, detection was low at the beginning which increase gradually with storage

J. Defoe
30
time before decrease at the end of storage time. Changes in the heterogeneous colour characteristic
are constantly low throughout days in storage.
Figure 22.Changes in the appearance of cooked salmon in cold storage
The changes in the texture of cooked salmon are shown in (Figure 23). Non spoilage attributes of
soft, juicy and tender were well detected and maintained throughout the days in storage with a
steep increase from storage day 8 to 10. Detection of spoilage attribute mushy was low but
constant throughout days in storage. There was no clear relationship between GDA score of
attributes and time in storage.
Figure 23.Changes is the texture of cooked salmon in cold storage

J. Defoe
31
3.3.3 Microbiological analysis
The microbial counts increased with storage time (Figure 24). At the first point of measurement
on storage day 2, the total viable count (TVC) was around 103 CFU/g and H2S producing bacteria
was less than 20 CFU/g. At the end of storage at day 21 TVC was around 106 CFU/g and H2S
producing bacteria was about 105 CFU/g.
Figure 24.Total viable counts and selective counts of H2S producing bacteria in whole salmon on
cold storage
There was a good correlation between the quality index and total viable counts. However, for
selective counts of H2S producing bacteria the correlation was moderate (Figure 25).
Figure 25.Correlation between bacteria and the quality index of whole salmon in cold storage

J. Defoe
32
4 DISCUSSION
Development of a QIM scheme and evaluation for salmon fillets
The experiment is based on the evaluation of fresh salmon fillets and whole fish in cold storage of
0-4°C. Temperatures loggers placed to capture room temperature recorded an average of -0.7°C.
Average temperature recorded for fillets in Styrofoam boxes was 0°C and whole fish was -1.6°C.
Temperature control is the most important factor in controlling the speed of spoilage. However, it
is not possible to keep unfrozen fish at temperatures that stops the actions of bacteria completely
because freezing will commence at about -1°C (Graham, et al., 1992). The best situation is to keep
the temperature close enough to reduce spoilage to a very slow rate. Based on the temperature
results it clearly showed that the whole fish being monitored were frozen or super chilled contrary
to preferred temperature in the experimental design.
In the pre-observation sessions of salmon fillets on cold storage changes due to deterioration were
visible. Changes which were observed occurred in the skin parameter were the same as those
included in the QIM scheme for whole salmon skin parameters conducted by Sveinsdottir, et al.,
(2002). Therefore, the skin parameter which included four attributes colour, odour, mucus and
texture were incorporated into the preliminary scheme of the fillets. Regarding the parameter of
flesh five attributes colour, brightness, establish, odour, texture and gaping were considered. For
flesh texture consideration was given as to whether evaluation of this attribute could be divided
into loin and tail. However, it is very important for the panellist to be consistent with area evaluated
for texture and in Martinsdóttir, et al., (2001) guidance was given to press along the spine muscle
and notice how long the flesh takes to recover so tail section was omitted before the finalization
of the preliminary scheme. The preliminary scheme at the end of pre-observation contained two
quality parameters, nine attributes and total quality index score of 21.
In the training sessions panellist gave recommendations which resulted in the modification of four
flesh attributes; colour, brightness, odour and gaping. Flesh colour was a difficult parameter to
evaluate since change of the normal orange salmon colour differ very slightly with storage time
hence new descriptors were included. Slight adjustments were also made to descriptors of
attributes brightness and odour. An additional descriptor was added for descriptions of gaping
since there appear to have been more severe gaping present during the training session than in pre-
observation. Botta, (1995) describes gaping as when the flakes that are originally connected to
each other by connective tissues separate and the fillet loses appearance of a continuous muscle.
While this is a natural occurrence with time there appear to be other factors such as handling or
filleting method prior to receiving the fillets. The final scheme at the end of training retained the
same number of parameters and attributes but the quality index score increased to 24.
In the main trial a moderate correlation was found between the total quality index score (sum of
all attributes) and time in cold storage. The results were not as expected since the aim is to have
the quality index score increase linearly with storage time as indicated in manual for sensory
evaluation of fish freshness (Martinsdóttir, et al., 2001). Also none of the individual attributes
analysed did not indicate any clear linear relationship with time in storage. Generally scores were

J. Defoe
33
relatively low as 15 storage days fillet scored a QI of 8.4 which indicates minimal detection of
increasing spoilage characteristics. This scenario was well supported by the results obtained from
sensory evaluation of the cooked fillet. The results indicate that the fillet did not reach the point of
rejection during the experiment as spoilage sensory attributes were not detected throughout.
Therefore, it could be suggested that the observation time of the fillets be increased past 15 days
in cold storage. However, there are other factors which must be taken into consideration which
may have an effect on the performance of the sensory panel. Since the QIM scheme was new the
sensory panel had no prior experience evaluating with this scheme excluding the training sessions.
In the development of a QIM scheme for cod fillet by Bonilla., (2004) three training sessions were
conducted evaluating 9 storage days compared to this experiment where two training session were
conducted evaluating 6 storage days. Therefore, the sensory panel may have been insufficiently
trained which is supported by the wide distribution pattern in QI score for fillets of same storage
days. A plausible factor that can could explain also why the QI did not increase linearly with
storage time and as expected and end of shelf life was not reached are the effects of storage
temperature being too low. Sensory panel sometimes commented that fillets were too cold
notwithstanding that they were out of storage no less than 15 minutes before evaluation as describe
by Bonilla (2005) and better control of the evaluation environment needs to be asserted. However,
fillets were allowed to thaw for longer since they were subjected to lower temperatures.
Microbiological results showed similar growth pattern for TVC and H2S producing bacteria for
the days in cold storage. The growth increase exponentially with storage time except for storage
day 6 TVC was higher than storage day 8 and 11 and H2S producing bacteria higher than day 8.
TVC was around 106-107 CFU/g dominated by H2S producing bacteria in the flesh of fillet at the
end of storage at 15 days. Compared to 105 CFU/g in the flesh of whole salmon at the point of
rejection at 20 days in Sveinsdottir, et al., (2002). There are no factors during the experiment that
could explain the high occurrence of bacteria counts however, it could be related to handling prior
to receiving the fillets.
Application of QIM scheme for whole salmon
Overall, the total quality index score showed a strong correlation with the whole fish time in cold
storage as reported by (Sveinsdottir, et al., 2002) previous study on application of QIM for
evaluation whole salmon. A linear relationship between QI and storage time was observed as
indicated in the sensory evaluation manual for fish freshness (Martinsdóttir E., et al., 2001) but for
some individual attributes the relationship was less clear. At the end of 21 days in cold storage for
this experiment total QI score was 11.3 while the experiment conducted by Sveinsdottir, et al.,
(2002) the QI was around 20. In sensory evaluation manual for fish freshness by Martinsdottir et
al., 2001 a QI score of 11 has a prediction of 14 days in storage and remaining shelf-life of 6 days
while a QI 15 of indicate the end of shelf life. The end of storage time was not reached in this
experiment at 21 days in storage while in Sveinsdottir et al., (2002) cooked sample was rejected
at 20 days. Temperature log in a box containing whole fish averaged -1.6°C which is evidence that
the fish was super chilled or frozen instead of chill. Hence, there were comments from panellist of

J. Defoe
34
the fish being too cold for evaluation. Internal temperature of the fish was -1.5°C therefore, fish
was allowed to thaw beyond the 30 minutes mentioned in Sveinsdottir, et al., (2002).
In this experiment the positive attributes of the cooked sample were always more detectable and
did not decrease with time which could explain the difference in results of the two experiments.
The variation among the panellist indicates that there was greater consensus when evaluating
fresher fish at the earliest point of storage compared to fish whose freshness has been reduced at
the end of storage time. It is of note that the QIM for whole salmon is an established scheme and
the sensory panel has experience in its use in conducting sensory evaluations however, some panel
members were new and had no experience with this scheme. Temperature control is deemed to
have been a key factor in explaining why end of shelf life was not reached and QI score remain
low even past 8 days in storage thus making loss of freshness characteristic less detectable.
Microbiological results showed similar growth pattern for TVC and H2S producing bacteria for
the days in cold storage. The growth increase linearly with storage time except for storage day 10
TVC and H2S producing bacteria was lower than day 8 and H2S producing bacteria decreased
towards the end of storage time from day 16. This occurrence was consistent with the pattern in
other results such as QI score and Panel distribution scoring against storage time. On storage day
21 TVC in the flesh was around 106 CFU/g dominated by H2S producing bacteria of around 105
CFU/g. This result is similar TVC and H2S producing bacteria of flesh in Sveinsdottir, et al., (2002)
when the point of rejection was reached at 20 days however, in this case end point of rejection was
not reached.
5 CONCLUSION
The use of the QIM scheme developed for fresh farmed Atlantic salmon fillet for this experiment
did not show a clear relationship between the QI score and time in cold storage and there was a
low correlation. QI score is expected to increase linearly with storage time. The QIM scheme
consisted of two parameters with nine attributes which total to a quality index score of 21 points.
To develop a new QIM scheme the experiment must be well controlled. However, this experiment
experience some unforeseen situations which may have negatively affected the scheme.
Notwithstanding the limitation of this experiment, the objective of developing and application of
a QIM scheme was achieved. Hence, QIM is deemed as a practical tool which could be developed
to evaluated fish fresh for key fish species in Dominica but number of attributes evaluated may
vary based on species. Sensory evaluation of cooked fillets using GDA did not indicate the end of
storage time even though fillets in storage for 15 days was evaluated. Spoilage attributes were not
detected.
In the application of a QIM scheme for fresh farmed whole Atlantic salmon overall there was a
linear relationship between the QI and storage time however, for some individual attributes there

J. Defoe
35
was a relationship but QI score remained low up to the end of trial. Also there was strong
correlation between QI and storage time. Nevertheless, the end of shelf of whole salmon was not
reached during this experiment as the sensory evaluation of cooked sample using GDA did not
reveal a point of rejection. Spoilage attributes in cooked samples were not detected throughout the
storage period. Microbial counts were high dominated by spoilage bacteria therefore, it is not
certain why a rejection point was not detected through sensory evaluation of cooked samples. In
the application of the QIM scheme for whole salmon there were problems associated with low
temperatures during storage which may have influence the results QIM and GDA specifically.
ACKNOWLEDGEMENT
I would like to thank foremost my supervisor Kolbrun Sveinsdottir for her exceptional advice and
guidance rendered to me during my study. I wish to recognize the commitment of the sensory
panel at MATIS who were integral part throughout my experiment. To the staff of UNU-FTP
Sigridur Kr. Ingvarsd, Mary Francis Davidson, Thor Asgeirsson and Tumi Tomasson for their
periodical review and comments on my project report which was most helpful. I am also grateful
to the fellows who have in one way or another assisted me during this project. Finally I wish
express my sincere appreciation to the Institutions; Dominica Fisheries Division, CRFM, UNU-
FTP and the Government of Iceland who have made my participation in UNU-FTP 2014 possible.

J. Defoe
36
LIST OF REFERENCE
Banja, B. (2002). Shelf life trial on cod (Gadus morhua L.) and haddock
(Melanogrammus aeglefinus L.) stored on ice around 0°C. UNU-FTP.
Bonilla, A. C. (2004). Development of a quality index method for fresh cod fillet and
consumer acceptance of different cod products. UNU-FTP 2004 Final Project.
Bonilla, A., Sveinsdottir, K., & Martinsdottir, E. (2005). Development of Quality Index
Method (QIM) scheme for fresh cod. Science direct.
Botta, J. (1995). Evaluation of Seafood Freshness Quality. New York: VCH Publishers,
Inc.
Bremner, H. (2000). Towards Practical Definitions of Quality for Food Science. In
Critical Reviews in Food Science and Nutrition (pp. 83-90).
Bremner, A. (2002). Safety and quality issues in fish processing. Woodhead publishing in
Food Science and Technology.
Chebet, L. (2010). "Rapid" (Alternative) methods for evaluating fish freshness quality.
Akureyri: University of Akureyri.
Dominica Bureau of Standards. (2006). Code of Practice for the sale of fresh fish.
Roseau.
Dominica Central Statistic Office, Ministry of Finance. (2011). Population and Housing
Census. Roseau, Dominica.
Dominica Fisheries Division. (2014). Fisheries catch estimate.
Dominica Fisheries Division, Ministry of Agriculture and Fisheries. (2011). Fisheries
Industry Census. Roseau, Dominica.
FAO. (2012). Fisheries and Aquaculture (Atlantic salmon).
Government of Dominica. (2012). Growth and Social Protection Strategy. Roseau.
Graham, J., & Johnston, W. A. (1992). Ice in Fisheries. Rome: FAO.
Howgate, P. (1985). Approaches to the definition and measurement of the storage life of
chilled and frozen fish. Refrigeration and Science technology.
Hyldig, & Pettersen, D. G. (2004). Quality Index Method–An Objective Tool for
Determination. Journal of aquatic food product technology.
Hyldig, G., & Nielsen, J. (2004). QIM- A Tool for Determination of Freshness.
Liston, J. (1980). Microbiology in fishery science. In JJ Connell (ed), Advances in Fish
Science and Technology. (J. Connell, Ed.) Farnham: Fishing News Books.

J. Defoe
37
Martinsdóttir E., S. K.-S., Martinsdottir, E., Sveinsdottir, K., Luten, J., Schelvis-Smit, R.,
& Hyldig. (2001). Reference manual for the Fish sector: Sensory evaluation of fish
freshness. The. Netherland: QIM Eurofish.
Martinsdottir, E. (2002)a. In H. Bremner (Ed.), Safety and quality issues in fish
processing (pp. 360-378). Cambridge: Woodhead publishing limited.
Martinsdóttir, E. (2002)b. Quality management of stored fish. In H. A. Bremner, & H. A.
Bremner (Ed.), Safety and quality issues in fish processing (pp. 360-378). London:
Woodhead Publishing in Food Science and Technology.
Martinsdottir, E., Luten, J., Schelvis-Smit, A., & Hyldig, G. (2003). Quality of Fish from
Catch to Consumer;QIM Past and Future. Wageningen: Wageningen Academic
Publishers.
Martinsdottir, E. (2004). QIM for evaluating fish freshness. INFO Fish Inernational.
Nilsen, H., Esaiassen, M., Heia, K., & Sigernes, F. (2002). Visible/Near-Infrared
Spectroscopy:A New Tool for the Evaluation of Fish Freshness? JOURNAL OF FOOD
SCIENCE—Vol. 67, Nr. 5, 2002, 1821 - 1826.
Olafsdottir, G., Martinsdottir, E., Oehlenscbger, J., Dalgaard, P., Jensen, B., Undeland, I.,
. . . Nilsen, H. (1997). Methods to evaluate fish freshness in research and industry. Trends
in Food Science and Technology.
Olafsdottir, G., Nesvadba, P., Corrado, D., Careche, M., Oehlencbeger, J., Tryggvadottir,
S., . . . Jorgensen, B. (2004). Multisenor for fish quality determination. Trends in Food
Science & Technology ), 86–93.
Olafsdottir, G., Lauzon, H., Martinsdottir, E., & Kristbergsson, K. (2006). Influence of
storage temperature on microbial spoilage characteristics. International journal of food
microbiology.
Stone, J., & Sidel, L. (2004). Sensory Evaluation Practices. London: Elsevier Academic
Press.
Sveinsdottir, K., Martinsdottir, E., Hyldig, G., Jorgensen, B., & Krisbergsson, K. (2002).
Application of Quality Index Method (QIM) Scheme in Shelf-life Study of Farmed
Atlantic Salmon (Salmo salar). Journal of food science.
J. Defoe
38
APPENDIX
Appendix 1: Preliminary QIM scheme developed for fresh farmed salmon (Salmo salar) fillet
during pre-observation
Quality Parameter
Description
Score
Skin
Colour
Pearl-shiny 0
Less pearl –shinny 1
Yellowish, mainly near the abdomen 2
Mucus
Clear, not clotted 0
Milky, clotted 1
Yellow and clotted 2
Odour
Fresh sea weedy, neutral 0
Cucumber, metal, hay 1
Sour, mouldy, dish cloth 2
Rotten 3
Texture In rigor 0
Finger mark disappears rapidly 1
Finger leaves mark over 3 seconds 2
Flesh Colour
Deep bright orange 0
Bright orange 1
Light orange, yellowish (belly flap) 2
Brightness
Shinny 0
Mat 1
dull 2
Odour
Neutral 0
Rotten fruit (melon) 1
Sour 2
Blue cheese 3
Texture
(Loin)
Very firm 0
Less firm 1
Soft 2
Gaping
Gaping less than 10% 0
Short gaping , 10-20% 1
Long Gaping, more than 25% 2
Quality Index : 21 SUM:

J. Defoe
39
Appendix 2: QIM scheme for farmed salmon (Salmo salar)
Quality parameters
Description
Poin
ts
Skin: Colour/
appearance
Pearl-shiny all over the skin 0
The skin is less pearl-shiny 1
The fish is yellowish, mainly near the abdomen 2
Mucus
Clear , not clotted 0
Milky, clotted 1
Yellow and clotted 2
Odour
Fresh sea weedy, neutral 0
Cucumber, metal, hey 1
Sour, dish cloth 2
Rotten 3
Texture In Rigor 0
Finger mark disappears rapidly 1
Finger leaves mark over 3 seconds 2
Eyes:
Pupils
Clear and black, metal shiny 0
Dark grey 1
Mat, grey 2
Form
Convex 0
Flat 1
Sunken 2
Gills1: Colour/
appearance
Red/dark brown 0
Pale red, pink/light brown 1
Grey-brown, brown, grey, green 2
Mucus Transparent 0
Milky, clotted 1
Brown, clotted 2
Odour Fresh, seaweed 0
Metal, cucumber 1
Sour, mouldy 2
Rotten 3
Abdomen: Blood in
abdomen
Blood red/not present 0
Blood more brown, yellowish 1
Odour
Neutral 0
Cucumber, melon 1
Sour, reminds of fermentation 2
Rotten/rotten cabbage 3
Quality Index (0 - 24) Sum:

J. Defoe
40
Appendix 3: Pictures of panellist at QIM and GDA training sessions