development and characterization of herbal smoothie
TRANSCRIPT
www.ijcrt.org © 2021 IJCRT | Volume 9, Issue 5 May 2021 | ISSN: 2320-2882
IJCRT2105020 International Journal of Creative Research Thoughts (IJCRT) www.ijcrt.org a133
Development and characterization of Herbal
Smoothie
Mohd Shoaib Khan, Rupanjali Dubey, Anjali Gulati, Shubham Kumar, Sonia Alam, Pragya Pandey*
Lovely professional university, Punjab- 144411
ABSTRACT
A smoothie is a beverage of thicker consistency prepared by blending fresh fruits, vegetables, and dairy
products usually. In this experiment, an attempt was made to develop herbal smoothie by using carrot,
cucumber, strawberry and Shankhpushpi (herb) with different compositions including 0g, 0.75g, 1g, 1.25g in
the final product and optimize on the basis of sensory analysis. The sample with 1.25g concentration was
finalized on the basis of equality found on the various parameters i.e. color, odour, taste and mouthfeel as
22% in both color and taste and 28% in mouthfeel and odor respectively. The raw material and final product
was analysed for its proximate composition and other parameters such as acidity, pH and TSS (total soluble
solids). The results showed that the moisture content and ash content of the carrot, cucumber, strawberry and
Shankhpushpi herb were calculated as 89.95%, 96.45%, 93.17%, 4.73% respectively were 3.33%, 6.3%,
1.65%, 13.1% respectively. The Titrable acidity of carrot, cucumber, strawberry, control and sample with
1.25g Shankhpushpi herb were 0.12%, 0.12%, 0.17%, 0.17%, 0.213% respectively. The pH of carrot,
cucumber, strawberry, control and sample with 1.25g Shankhpushpi herb were 5.69, 5.05, 3.40, 3.83, and
3.92 respectively. The TSS of carrot, cucumber, strawberry, control and sample with 1.25g Shankhpushpi
herb were 4°brix, 2°brix, 6°brix, 5°brix, 18°brix respectively. Storage of control and sample was done at room
temperature as well as at 3°- 5°C.

www.ijcrt.org © 2021 IJCRT | Volume 9, Issue 5 May 2021 | ISSN: 2320-2882
IJCRT2105020 International Journal of Creative Research Thoughts (IJCRT) www.ijcrt.org a134
1. INTRODUCTION
A smoothie is a beverage consisting of thicker consistency made from raw fruits, vegetables, and dairy
products like milk, yoghurt and ice cream can also be used, in which all the materials are blended together.
Smoothies can also be made using other ingredients such as water, ice, fruit juice, whey powder (for
people who need extra protein content), plant milk, nuts, seeds, chocolates, herbs, or nutritional
supplements. Smoothies made from raw fruits and vegetables consist of more dietary fiber and so they are
of thicker consistency than fruit juices. (Derbyshire E, 2017) stated that smoothies (blended beverages
that typically contain multiple ingredients) are popular dietary products with the potential to assist
individuals in incorporating more fruit and vegetables into their diets.
Smoothies age back to the year 1940 when it was invented by Mabel stegner on June 23, 1940. He was
working in Waring Corporation when he published a recipe book called ‘Recipes to make your Waring –
Go-Round’ and it described 12 milk smoothies. Those with blenders at that time were the ones who made
smoothies. In the late 1960’s, blenders were popular in the US. Smoothies became even more popular in
the 1990’s and 2000’s by being sold at coffee shops.
Health smoothies were first invented by Steve Kuhnau who was experimenting on his health and it worked
for him. It enabled him open a health food store named “Smoothie King”, where he was selling smoothie
drinks and later it has grown to a chain of other stores. More than 30 years the founder of Smoothie King
has expanded to Seoul, Korea and all over US. Smoothies originate back in the 1920s and were invented
by Julius Freed who had stomach health problems. He made this drink and shared it with friends who
named it “Orange Julius”.
www.ijcrt.org © 2021 IJCRT | Volume 9, Issue 5 May 2021 | ISSN:
2320-2882
IJCRT2105020 International Journal of Creative Research Thoughts (IJCRT) www.ijcrt.org a135
O’Connor L et al. (2016) is talking about intake of smoothies, then during the early years amongst
those up to the age of 4 years, intakes of smoothies, fruit juices and purees daily are less than 96
ml.
(Pinket AS et al, 2015) reviewed that smoothie data is extracted and analysed separately, intakes
become lower–37 ml daily amongst 3½ to 5½ years old. Unfortunately, smoothie intake data
amongst UK adults is not reported in Years 5 and 6 of the UK National Diet and Nutrition Survey
(NDNS). Fruit juice intake data, however, is included for which intakes are 46 ml per day amongst
UK adults aged 19 to 64 years, declining to an average of 34 ml per day amongst those aged 65
years and over.
Variety of Smoothies
There are many different types of smoothies which can be easily made in home with a few
ingredients. Different types of smoothies are:
Herbal smoothies– herbal smoothies are the ones made with the combination of herbs and using
fruits as base or use of milk, and blending them all together to provide extra nutritional value.
Herbs like shankhpushpi, parsley, sage, aloe vera, basil etc, can be used. Addition of herbs in
smoothie is a great way to enhance its nutritive value as more antioxidants are added to it.
Green smoothies (Vegetable –Based smoothies)- green smoothie are the one consisting of kales,
cauliflowers, cabbage, spinach, carrots, broccoli in base whole milk or any nut milk. They are rich
in minerals and vitamins. Incorporating antioxidants, they help in maintaining weight and blood
glucose level of body.
Energy-Boosting smoothies - These smoothies contain extra energy benefits in them. Eg. oat meals
have carbohydrates, nuts and seeds like almonds, pistachios, flax seeds, chia seeds, melon seeds,
that assist you in enhancing your energy levels.

www.ijcrt.org © 2021 IJCRT | Volume 9, Issue 5 May 2021 | ISSN:
2320-2882
IJCRT2105020 International Journal of Creative Research Thoughts (IJCRT) www.ijcrt.org a136
Tropical smoothies- Tropical fruit juices from mangoes, pineapple, coconut water, watermelon
juice, sweet lychee are the favourable ones for a tropical smoothie. Dairy products are added to
create a creamy texture.
Protein Packed smoothie - These are low fat drinks that assist in weight loss. Low sugar fruits,
milk, whey protein, soy milk, soy powder and vegetables are recommendable to provide
sustainable energy.
Fruit smoothie- Fruits are mixed together with a combination of milk or yogurt in a blender.
Liquid base - Liquids like yogurt, milk, almond milk, coconut water, water are a good choice to
enhance the taste and flavour of a smoothie.
Benefits of smoothie
Chronic diseases are among the leading causes of death globally, and as much as 80% of these
deaths are reported to be preventable with proper diet and lifestyle. Although extensive research
has demonstrated that the increased consumption of fruits and vegetables offers protective health
effects from many diet related non-communicable diseases, populations in both developed and
developing nations consistently fall short of the recommended intake of 5 or more servings a day.
By consumption of smoothie, improvement was found in waist circumference, waist-to-hip ratio
and symptoms of burden linked to diet, small intestine, large intestine, and mineral needs. Despite
the lack of statistically significant reductions in blood pressure, the trend toward improvements in
waist circumference and waist-to-hip ratio are considered to be useful and informative of health
risk. Thus, the results of this study provide preliminary support for the consumption of Green
Smoothies as a possible primary prevention effort for chronic conditions.
www.ijcrt.org © 2021 IJCRT | Volume 9, Issue 5 May 2021 | ISSN:
2320-2882
IJCRT2105020 International Journal of Creative Research Thoughts (IJCRT) www.ijcrt.org a137
It may also help to reduce health risks or even reverse the effects of chronic conditions. (Source:
Emiko maeda, 2013)
In our capstone work, we have incorporated herb shankhpushpi into smoothie and done its quality
evaluation and research on its physico-chemical properties. Herbal smoothie made by us is with
the combination of herb shankhpushpi and using carrot, cucumber and strawberry and blending
them all together to provide extra nutritional value. Addition of herbs in smoothie is a great way
to enhance its nutritive value as more antioxidants are added to it.
Benefits of fruits and vegetables
Benefits of carrot
Carrot (Daucus carota L.) is the most important crop of Apiaceae family. Carrot is one of the vital
root vegetables rich in bioactive compounds like carotenoids and dietary fibres with considerable
levels of several other useful components having remarkable health-advancing properties. The
colors of the carrot root flesh may be white, yellow, orange, red, purple, or very dark purple.

www.ijcrt.org © 2021 IJCRT | Volume 9, Issue 5 May 2021 | ISSN:
2320-2882
IJCRT2105020 International Journal of Creative Research Thoughts (IJCRT) www.ijcrt.org a138
2. MATERIAL AND METHODS
3.1. Procurement of raw material
The raw material carrot, cucumber, strawberry free from blemishes was procured from the local
market of Phagwara, Punjab (India). Carrot is a seasonal crop which remains available during the
month of November to March. Cucumbers are warm season crop; they are difficult to grow during
foggy, damp and summer season. Strawberry is a seasonal fruit that grows in October- November
and April-May. The Herb (Shankhpushpi) was not available in the local market so we procured it
from online site. It was a sealed packet. All the vegetables and fruit were used in fresh condition.
3.2. Standardization of process for production of herbal smoothie
Smoothie was prepared according to the flowchart (Fig 1). Control sample was standarized
through preliminary trials and total four treatments of herbal smoothie was developed. Their
composition is presented in table no. 1.
Fig 1 Flowchart of smoothie preparation process.
Table 1 Composition of smoothie
Sample
No.
Carrot Cucumber Strawberry Honey Herbs
1. 30g 30g 40g 15g 0 g
2. 30g 30g 40g 15g 0.5g
3. 30g 30g 40g 15g 1g
4. 30g 30g 40g 15g 1.25g
3.3. Nutritional analysis
Fresh fruits and vegetables.
Peeled and Washed.
Chopped and washed again.
Ground it together in mixer
Herb was added at determined
proportion
Honey was added and mixed again.
Smoothie was stored in airtight
plastic cups at 40C
www.ijcrt.org © 2021 IJCRT | Volume 9, Issue 5 May 2021 | ISSN:
2320-2882
IJCRT2105020 International Journal of Creative Research Thoughts (IJCRT) www.ijcrt.org a139
Determination of moisture, fat, ash and content was done according to standard method, AOAC,
2000. Titrable acidity was determined by Standard Method given by AOAC, 2000.
3.3.1. TSS & pH
Total Soluble Solid is done by ‘Refractometer’. Refractometer is present in three ranges: 0– 30;
30–60; 60–90. To estimate the TSS of sample, few drops of sample is put in the measuring prism
and covered with daylight plate and note down the reading (° Brix).
Determination of pH is done by using pH meter. To estimate the pH of any sample, rinse the pH
electrode with distilled water and then with buffer to be used for calibration (i.e. pH- 4.01). Then
dip the pH electrode into the next buffer of pH-4.01. The pH electrode should be dip in the
sample and then the meter display should be locked on the buffer value, when the reading is stable,
Press “Enter” to accept.
3.4. Sensory analysis
Sensory parameter is of great importance to both the processor and consumer. To the processor,
since it attracts consumer; to the consumer since it satisfies his aesthetic and gustatory sense.
Sensory quality is a combination of different sense of perception coming into play in choosing and
eating a food. Appearance, which can be judged by the eye, e.g. colour, size, shape, uni- formaity
and absence of defects, is of first importance in food selection. Flavor embraces the sense of taste,
smell and feeling. It is generally agreed that the sense of taste is limited to sweet, sour, salty, bitter
and umami. Odour, a vastly complex sensation, is the most important factor in flavor.
3.5. Chemical analysis
3.5.1. Estimation of Beta-Carotene
Estimation of β-Carotene is done by a method given by Kemmerer et al, (1943), Acetone,
Petroleum Ether, Anhydrous Sodium Sulphate (Na2SO4) is used as reagent. To prepare
Absorbent, mix one part of Supercel. Eluent is prepared by mixing 3% acetone in petroleum

www.ijcrt.org © 2021 IJCRT | Volume 9, Issue 5 May 2021 | ISSN:
2320-2882
IJCRT2105020 International Journal of Creative Research Thoughts (IJCRT) www.ijcrt.org a140
ether. Weigh 25g of sample and dissolve in 25ml of chloroform and make up the volume to
250ml with petroleum ether. Then take 10ml of solution and dilute to 100ml with petroleum
ether. Pipette 5, 10, 15, 20, 25 and 30ml of this solution in 100ml of volumetric flask. Add 3ml
of acetone and dilute the mask with petroleum ether. The concentration will be 0.5, 1.0, 1.5, 2.0,
2.5, 3.0 μg/ml. Measure the color at 452nm using 3% acetone as blank using spectrophotometer.
μg of Carotene per 100g =
Conc. of carotene in solution (standard curve) (μg/ml) X Final vol. X Dilution X 100 Weight of
Sample

www.ijcrt.org © 2021 IJCRT | Volume 9, Issue 5 May 2021 | ISSN:
2320-2882
IJCRT2105020 International Journal of Creative Research Thoughts (IJCRT) www.ijcrt.org a141
3.5.2. Estimation of L ascorbic acid
Estimation of L-ascorbic acid content is done by method given by Johnson, B.C. et al (1948). 3%
Metaphosphoric acid ( HPO3), Ascorbic acid Standard, Dye solution used as a reagent to estimate
L-ascorbic acid Standard. Procedure for estimation of L-ascorbic acid is performed by 5ml
standard ascorbic acid with addition of HPO3. Then, fill the burette with dye and titration is done
after that. For semi-solid sample take 10g sample, blend with 3% HPO3 and makeup the volume
100ml with HPO3. Then, filter and centrifuge and titration are performed.
Mg of Ascorbic acid per 100g or ml =
Titre X Dye Factor X Volume made up X 100
Aliquot of extract taken for estimation X Weight or volume of sample taken for estimation
3.5.3. Determine the total phenolic content
Estimation of Total Phenolic content was done by method of Nabavi et al. Two hundred microlitres
of extract were mixed with 2.5ml of 10% folin Cio Calteau’s reagent and 2ml of 7.5% Sodium
Carbonate. The reaction mixture is incubated at 45° C for 40 minutes and absorbance was
measured at 700nm. Phenol is used as Standard. Standard curve is prepared.
Total Phenolic content (T) = C X V
(as gallic acid) M
Where,
T = Total phenolic content in mg
C = Concentration of gallic acid
V = Volume of the extract solution in ml
M = Weight of extract in g

www.ijcrt.org © 2021 IJCRT | Volume 9, Issue 5 May 2021 | ISSN:
2320-2882
IJCRT2105020 International Journal of Creative Research Thoughts (IJCRT) www.ijcrt.org a142
3.5.4. Estimation of flavonoids
The estimation of flavonoid content is determined by using a colorimeter assay developed by Bao
et al., with some modification. Aliquot (0.2ml) of extract was added to 0.3ml of 5% NaNO2 and
wait for 5 minutes. After that, 0.6ml of 10% AlCl3 was added followed by the addition of 2ml of
1M NaOH, then after 6minutes, add 2.1ml of distilled water. Absorbance was taken at 510nm
against the reagent blank and flavonoid content was expressed as (mg rutin equivalent)
3.6. Storage condition & shelf life
For storage studies smoothie was made and packed into glass containers. These containers were
previously sterilized by proper washing followed by autoclaving at 121°C. This process was
carried out to remove any bacterial load present on the container. Freshly prepared smoothie was
poured into the container leaving a minimal headspace so as to prevent bacterial contamination.
These containers were placed under 2 different temperature conditions. The storage study was
performed for 6 days as fruits and vegetables is highly perishable component if it is not preserved
in sterilized conditions. Proximate analysis, including and microbiological analysis were done after
3 days’ interval.
3.6.1. Titrable acidity
Determination of Titrable acidity is done by Standard Method given by AOAC, 2000. Dilute the
aliquot of sample with distilled water and then titrate with 0.1 N NaOH solutions by using few
drops of 1% phenolphthalein solution as an indicator and then note down the ml of NaOH used
and calculate the result as percent anhydrous citric acid or other acid.

www.ijcrt.org © 2021 IJCRT | Volume 9, Issue 5 May 2021 | ISSN:
2320-2882
IJCRT2105020 International Journal of Creative Research Thoughts (IJCRT) www.ijcrt.org a143
Titrable acidity(%) = [ml of NaOH used]X[0.1 N NaOH]X[Milliequivalent Factor] X 100
Gram of Sample
3.6.2. pH & TSS
Total Soluble Solid is done by ‘Refractometer’. Refractometer is present in three ranges: 0– 30;
30–60; 60–90. To estimate the TSS of sample, few drops of sample is put in the measuring prism
and covered with daylight plate and note down the reading (° Brix).
Determination of pH is done by using pH meter. To estimate the pH of any sample, rinse the pH
electrode with distilled water and then with buffer to be used for calibration (i.e. pH- 4.01). Then
dip the pH electrode into the next buffer of pH-4.01. The pH electrode should be dip in the sample
and then the meter display should be locked on the buffer value, when the reading is stable, Press
“Enter” to accept

www.ijcrt.org © 2021 IJCRT | Volume 9, Issue 5 May 2021 | ISSN:
2320-2882
IJCRT2105020 International Journal of Creative Research Thoughts (IJCRT) www.ijcrt.org a144

www.ijcrt.org © 2021 IJCRT | Volume 9, Issue 5 May 2021 | ISSN:
2320-2882
IJCRT2105020 International Journal of Creative Research Thoughts (IJCRT) www.ijcrt.org a145
.4. RESULTS AND DISCUSSION
4.1. Proximate analysis of raw material
Moisture content
Carrot- The moisture content of native and modified carrots samples is shown in table that varies
from 90.7-89.95%. The moisture content of the carrots 9.31% whereas with the moisture content
of carrot samples are shown in table that varies from 90.7 – 89.95%. The moisture content of the
native carrot was 90.7% whereas with the continuation of the test it gradually decreased to 89.95%.
The mean of these samples was calculated to be 89.97% as shown in
Figure 4-7 Carrot sample
Cucumber- As shown in (table no. 5) the readings are partially same which varies from 96.44 –
96.6%. The data shows that cucumber has higher moisture content as compared to carrots.
Technically, the mean as calculated is 96.45% as shown in table. The reason for this may be due
to carrots contain high amount of dietary fibers, increasing its moisture level. Not only are they
high in water content, they also contain important nutrients that play a part in hydration like
magnesium and potassium.
www.ijcrt.org © 2021 IJCRT | Volume 9, Issue 5 May 2021 | ISSN:
2320-2882
IJCRT2105020 International Journal of Creative Research Thoughts (IJCRT) www.ijcrt.org a146
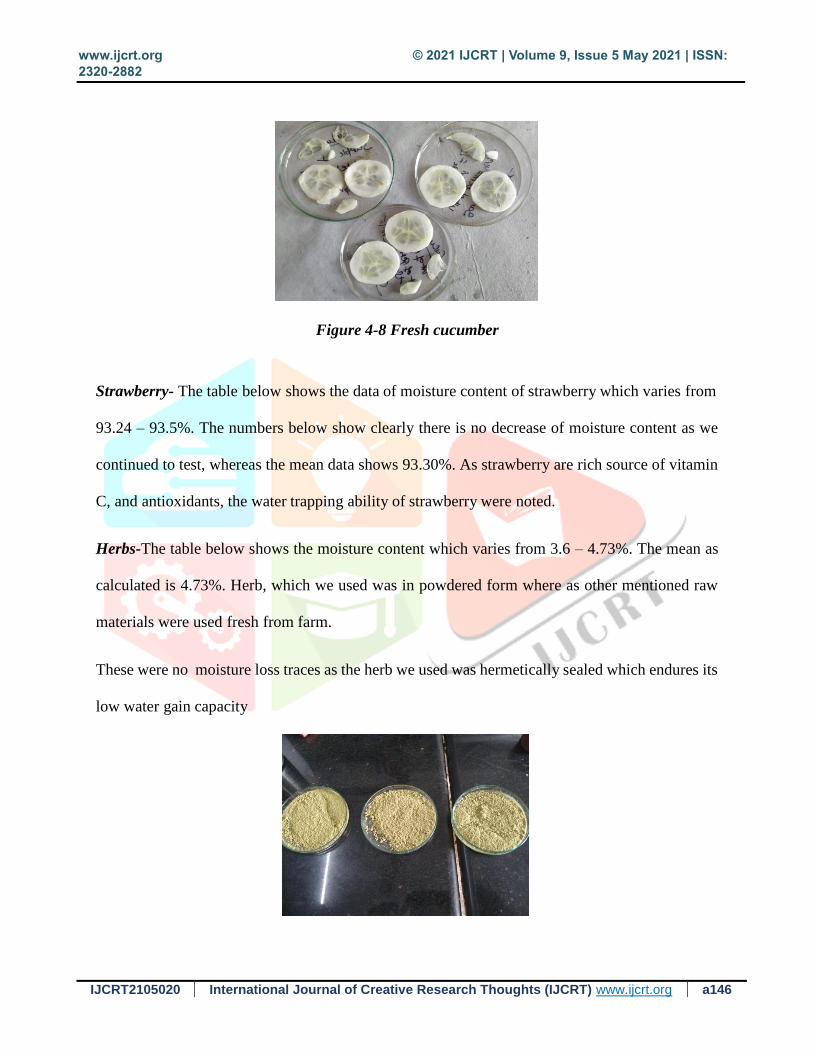
Figure 4-8 Fresh cucumber
Strawberry- The table below shows the data of moisture content of strawberry which varies from
93.24 – 93.5%. The numbers below show clearly there is no decrease of moisture content as we
continued to test, whereas the mean data shows 93.30%. As strawberry are rich source of vitamin
C, and antioxidants, the water trapping ability of strawberry were noted.
Herbs-The table below shows the moisture content which varies from 3.6 – 4.73%. The mean as
calculated is 4.73%. Herb, which we used was in powdered form where as other mentioned raw
materials were used fresh from farm.
These were no moisture loss traces as the herb we used was hermetically sealed which endures its
low water gain capacity

www.ijcrt.org © 2021 IJCRT | Volume 9, Issue 5 May 2021 | ISSN:
2320-2882
IJCRT2105020 International Journal of Creative Research Thoughts (IJCRT) www.ijcrt.org a147
Figure 4-9 Moisture analyzed herb sample
Table 4-2 Moisture content of Raw material
Sr. No. Sample Moisture content %
1. Cucumber 96.453%
2. Carrots 89.97%
3. Strawberry 93.30%
4. Herbs 4.73%
www.ijcrt.org © 2021 IJCRT | Volume 9, Issue 5 May 2021 | ISSN:
2320-2882
IJCRT2105020 International Journal of Creative Research Thoughts (IJCRT) www.ijcrt.org a148
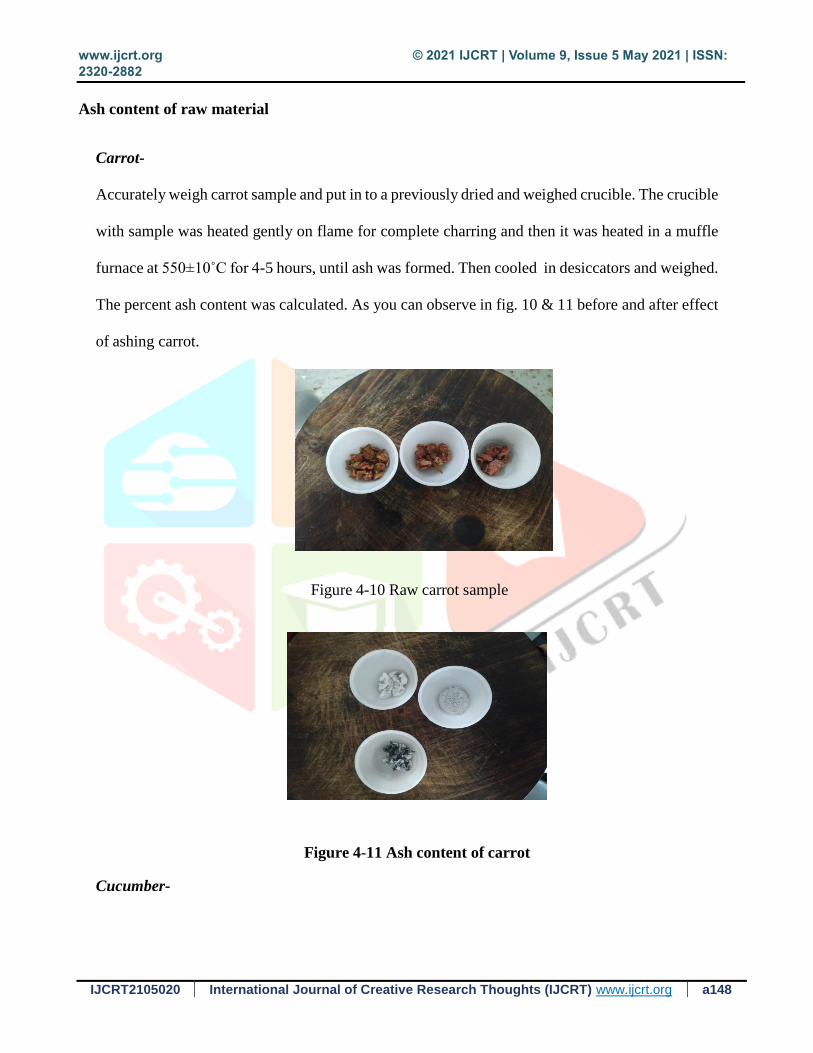
Ash content of raw material
Carrot-
Accurately weigh carrot sample and put in to a previously dried and weighed crucible. The crucible
with sample was heated gently on flame for complete charring and then it was heated in a muffle
furnace at 550±10˚C for 4-5 hours, until ash was formed. Then cooled in desiccators and weighed.
The percent ash content was calculated. As you can observe in fig. 10 & 11 before and after effect
of ashing carrot.
Figure 4-10 Raw carrot sample
Figure 4-11 Ash content of carrot
Cucumber-
www.ijcrt.org © 2021 IJCRT | Volume 9, Issue 5 May 2021 | ISSN:
2320-2882
IJCRT2105020 International Journal of Creative Research Thoughts (IJCRT) www.ijcrt.org a149
Ash is composed of minerals and because they are rudiments, they will always exist in the exact
form as they are. The crucible was weighed before keeping it in the muffle furnace at 550±10˚C
for 4-5 hours, until ash was formed. Then the sample was kept in the desiccator for cooling and
then the weight of taken and the ash content was calculated.
Strawberry-
The amount of ash present in the strawberry flour ranged from 1.47%-2%. We can observe that
the strawberry has less ash content than the cucumber; this may have been due to the quantities
of seeds present in the residues. The same procedure was followed to calculate the mineral content.
Herb-
Content of mineral significantly depends on macro and microelements. In the case of herbs, the
degree of increase of minerals in leaves which are eaten directly or subjected to drying methods
is of significant meaning. The analyzed herbal plants differ in macronutrient content due to
differences in species. The ash content in herb was in range of 13% - 13.5%. Similar procedure
was followed to analyze the ash content.
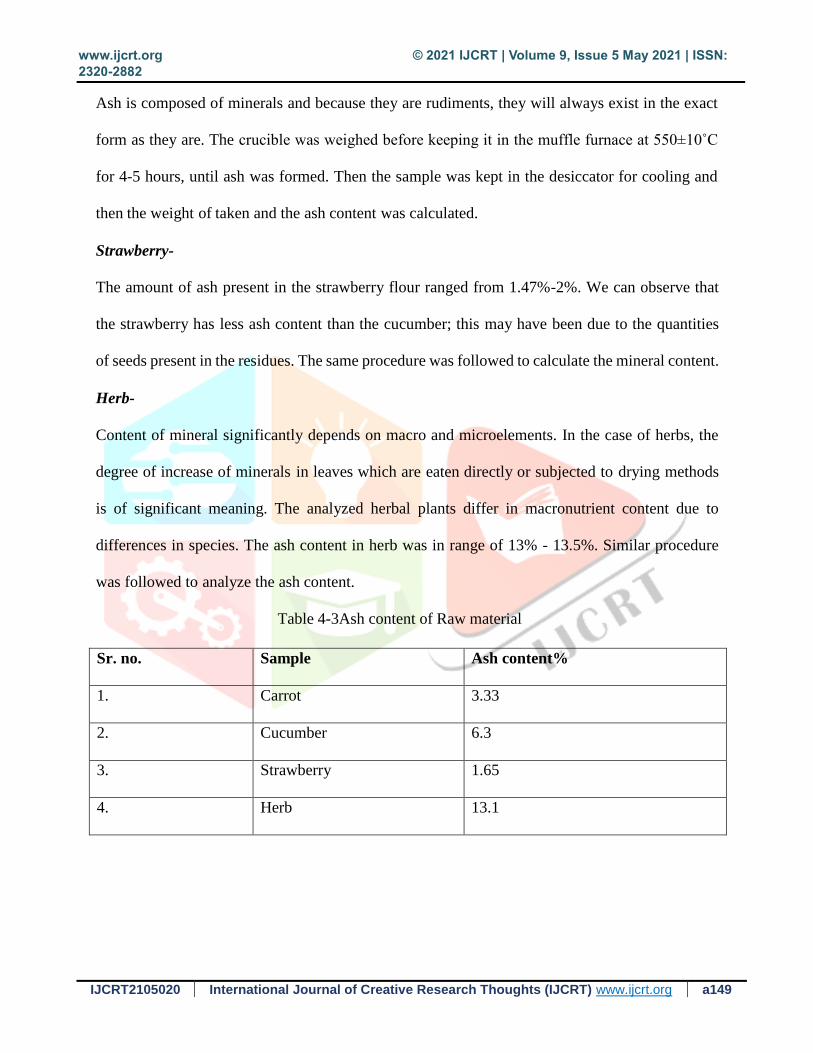
Table 4-3Ash content of Raw material
Sr. no. Sample Ash content%
1. Carrot 3.33
2. Cucumber 6.3
3. Strawberry 1.65
4. Herb 13.1
www.ijcrt.org © 2021 IJCRT | Volume 9, Issue 5 May 2021 | ISSN:
2320-2882
IJCRT2105020 International Journal of Creative Research Thoughts (IJCRT) www.ijcrt.org a150
Titrable acidity of raw material
Carrot-
As per our testing results we have three samples of carrot. The sample 1 shows reading, 0.12% of
titrable acidity. Sample 2 shows value of 0.11% and sample 3 shows value of 0.12%. Titrable
acidity increased with days of storage. Total titrable acidity of the samples increased with days of
storage, with the sample stored at ambient temperature recording higher range of total titrable
acidity. Increase in titrable acidity of the carrot juice may possibly be due to reactions between the
carrot juice components and chemicals at low temperature.
Cucumber-
We tested titrable acidity for cucumber also three samples, sample 1 shows reading of 0.12%,
sample 2 showed value of 0.12% and 0.12% for sample 3 also. Decline in Titrable Acidity is an
important outcome during ripening, as it renders the fruit less acidic and sour. Since organic acids,
such as malic or citric acid, are primary substrates for respiration, a reduction in acidity is expected
in respiring fruits. As compared to the carrot results, cucumber showed no difference in the results,
as it may be due to the factor that cucumber was fresh and equally ripened.
Strawberry-
The results of strawberry came out to be, sample 1 showed value of 0.28%, sample 2 showed value
of 0.12% and sample 3 results was 012%. The titrable acidity (TA) of strawberry was significantly
affected by harvesting the fruits at different stages of maturity. The acidity in fruit is an important
factor in determining fruit maturity and quality. The acidity of strawberry fruit, generally, increases
to upmost in mature fruit before declining more quickly in the later stages of ripening. The drop
in acidity is attributed to increasing consumption of organic acids in the

www.ijcrt.org © 2021 IJCRT | Volume 9, Issue 5 May 2021 | ISSN:
2320-2882
IJCRT2105020 International Journal of Creative Research Thoughts (IJCRT) www.ijcrt.org a151
process of respiration consequential decreased acidity as the fruit advances from one stage of
development to another.
Figure 4-12 acidity analysis
This study was conducted to increase the nutritional value of smoothie by incorporating
Shankhpushi herb. With increasing health awareness people are becoming more inclined towards
functional food products. Therefore an attempts has been made to optimize the ratio of herbs which
respect to their sensory profile. Further, the product was analyzed for its proximate value, physic-
chemical value, sensory attributes and storage qualities of the same. The Fig 2 and 3 pictorial
representation of the samples.
Fig 2 smoothie samples

www.ijcrt.org © 2021 IJCRT | Volume 9, Issue 5 May 2021 | ISSN:
2320-2882
IJCRT2105020 International Journal of Creative Research Thoughts (IJCRT) www.ijcrt.org a152
Fig 3 control and herbal (1.25g) smoothie
4.2. Sensory analysis
The results of sensory analysis are represented in fig 3. The sensory analysis revealed that sample
1 showed 36% taste and 31% of mouth feel and the sensory results were acceptable but not very
much liked. The liking percentage increased to 42% in sample 2 and taste was acceptable. It was
observed that sample 2 has less than half percentage of color and appearance which is 11% and it
contain 0.5g of herbs. Sample 4 showed highly acceptable percentage for all sensory
characteristics. Therefore sample 4 was selected for further analysis. In sample 4, 1.25g of herb
was added which was interestingly acceptable and encouraged profoundly. It has been noticed that
all the criteria were purely taken into consideration and sample 4 was the product which as
compared to other three samples was highly accepted. So we can say that sample 4 was our perfect
product which, as the data says, has 28% of colour and appearances, 28% of odour, 22% of taste
and lastly, 22% of mouth feel, which is 100% acceptable.

www.ijcrt.org © 2021 IJCRT | Volume 9, Issue 5 May 2021 | ISSN:
2320-2882
IJCRT2105020 International Journal of Creative Research Thoughts (IJCRT) www.ijcrt.org a153
Fig 4 Sensory Profile of developed Smoothie
4.3 Physicochemical properties of developed herbal smoothie-
Titrable acidity of controlled as results showed were, sample 1 was 0.128%, sample 2 was 0.142%
and sample 3 was 0.192% controlled sample just contain carrot, strawberry and cucumber. Sample
titrable acidity showed results like, sample 1 showed 0.214%, sample 2 showed 0.192% and
sample 3 showed 0.230% sample contain carrot, strawberry and cucumber plus herb too.
Figure 4-13 Acidity analysis of control Figure 4-14acidity of herbal smoothie
0
20
40
60
80
100
120
1 2 3 4
Sample No.
Sen
sory
sco
re
Herb incorporation (g) Colour & Appearance Odour Taste Mouthfeel

www.ijcrt.org © 2021 IJCRT | Volume 9, Issue 5 May 2021 | ISSN:
2320-2882
IJCRT2105020 International Journal of Creative Research Thoughts (IJCRT) www.ijcrt.org a154
Table 4-4 Acidity content of Raw and Herbal Smoothie
Sr. no. Sample Titrable acidity
1. Carrot 0.12
2. Cucumber 0.12
3. Strawberry 0.17
4. Controlled 0.17
5. Sample 0.213
pH & TSS
In pH as we calculate with the help of pH meter, the results we got are, for carrot pH is 5.69,
cucumber is 5.05, strawberry is 3.40, for control pH is 3.83 and for sample is 3.92. The relatively
high pH of carrot juice (pH ∼ 6) makes it unique among popular commercial juices, such as orange
or apple juices, which have pH values below 4.5. The low-acid nature of carrot juice makes it more
susceptible to spoilage and pathogenic organisms, which can be countered by acidification. This
issue is of particular interest in fresh carrot juice products that require refrigeration. In addition,
carrot juice can be subjected to lower pH conditions when it is mixed with fruit juices in juice
blend products. For strawberry the right pH media needed to provide the best conditions for most
agricultural plants to absorb the nutrients efficiently. For hydroponic cucumbers (5.5–6.0) and
nitrification (7.5–9.0) requires reconciliation to improve systems integration. Controlled showed
optimum pH value as it was the mixture of all the ingredients. The sample pH showed higher
value due to presence of herb.
www.ijcrt.org © 2021 IJCRT | Volume 9, Issue 5 May 2021 | ISSN:
2320-2882
IJCRT2105020 International Journal of Creative Research Thoughts (IJCRT) www.ijcrt.org a155
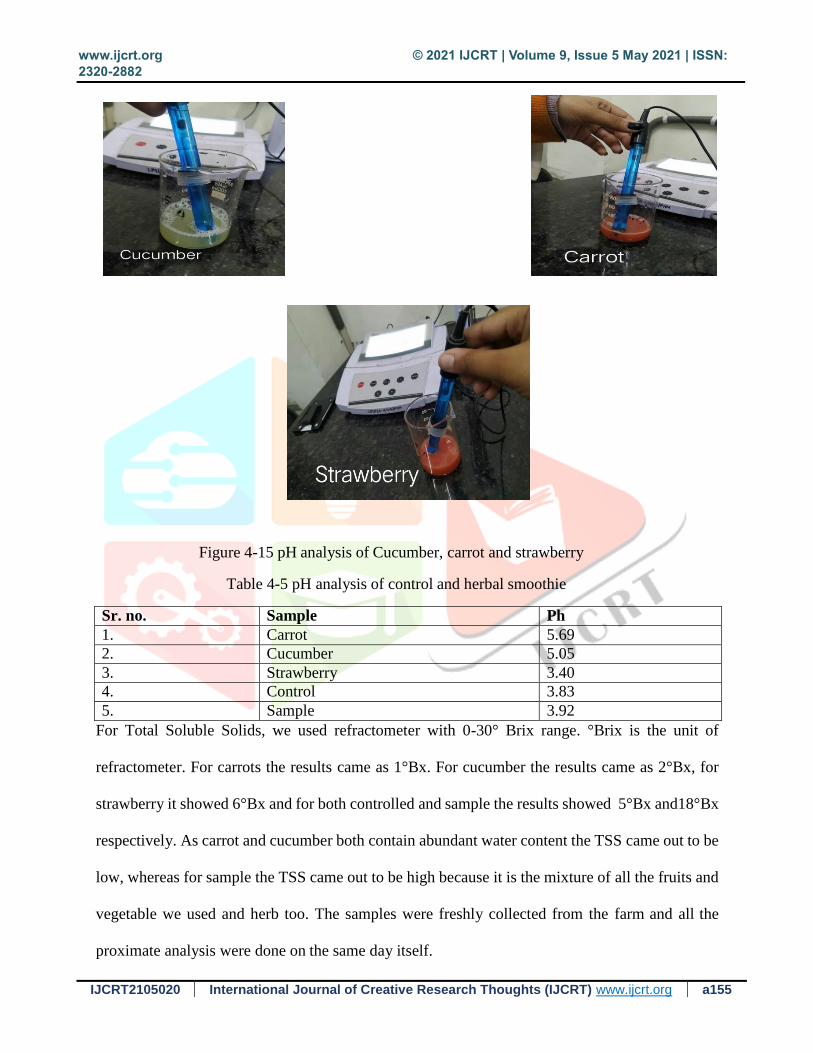
Figure 4-15 pH analysis of Cucumber, carrot and strawberry
Table 4-5 pH analysis of control and herbal smoothie
Sr. no. Sample Ph
1. Carrot 5.69
2. Cucumber 5.05
3. Strawberry 3.40
4. Control 3.83
5. Sample 3.92
For Total Soluble Solids, we used refractometer with 0-30° Brix range. °Brix is the unit of
refractometer. For carrots the results came as 1°Bx. For cucumber the results came as 2°Bx, for
strawberry it showed 6°Bx and for both controlled and sample the results showed 5°Bx and18°Bx
respectively. As carrot and cucumber both contain abundant water content the TSS came out to be
low, whereas for sample the TSS came out to be high because it is the mixture of all the fruits and
vegetable we used and herb too. The samples were freshly collected from the farm and all the
proximate analysis were done on the same day itself.
www.ijcrt.org © 2021 IJCRT | Volume 9, Issue 5 May 2021 | ISSN:
2320-2882
IJCRT2105020 International Journal of Creative Research Thoughts (IJCRT) www.ijcrt.org a156
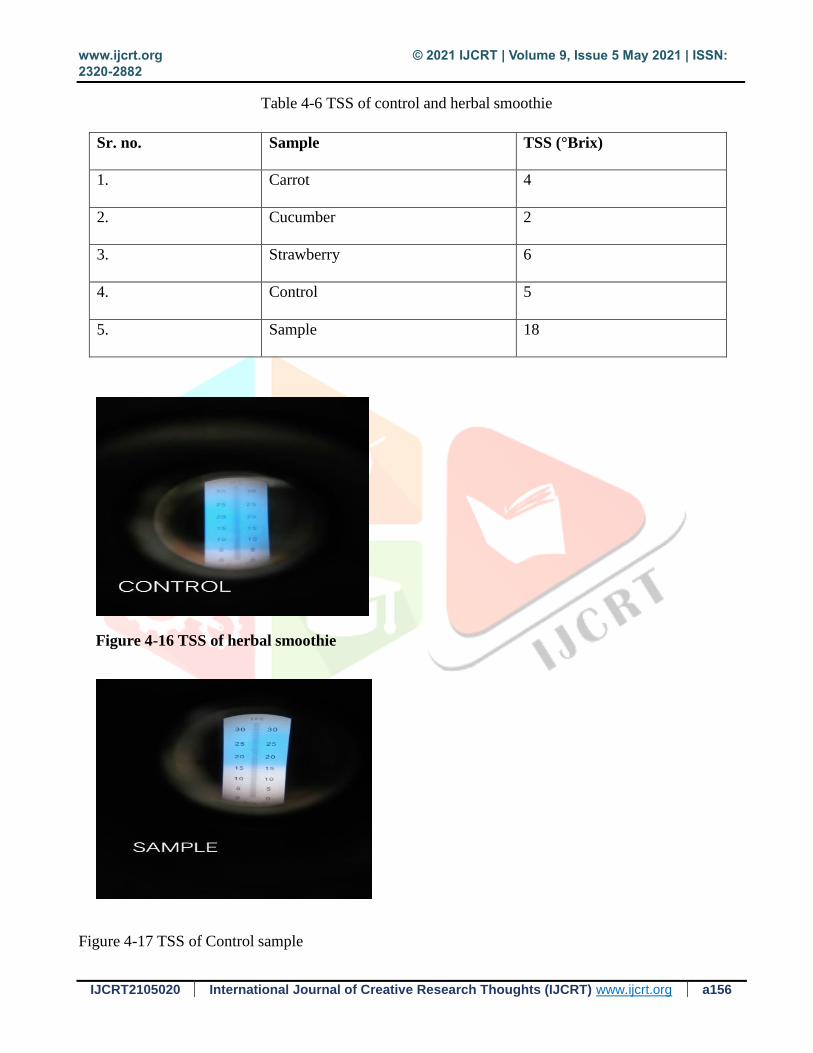
Table 4-6 TSS of control and herbal smoothie
Sr. no. Sample TSS (°Brix)
1. Carrot 4
2. Cucumber 2
3. Strawberry 6
4. Control 5
5. Sample 18
Figure 4-16 TSS of herbal smoothie
Figure 4-17 TSS of Control sample
www.ijcrt.org © 2021 IJCRT | Volume 9, Issue 5 May 2021 | ISSN:
2320-2882
IJCRT2105020 International Journal of Creative Research Thoughts (IJCRT) www.ijcrt.org a157
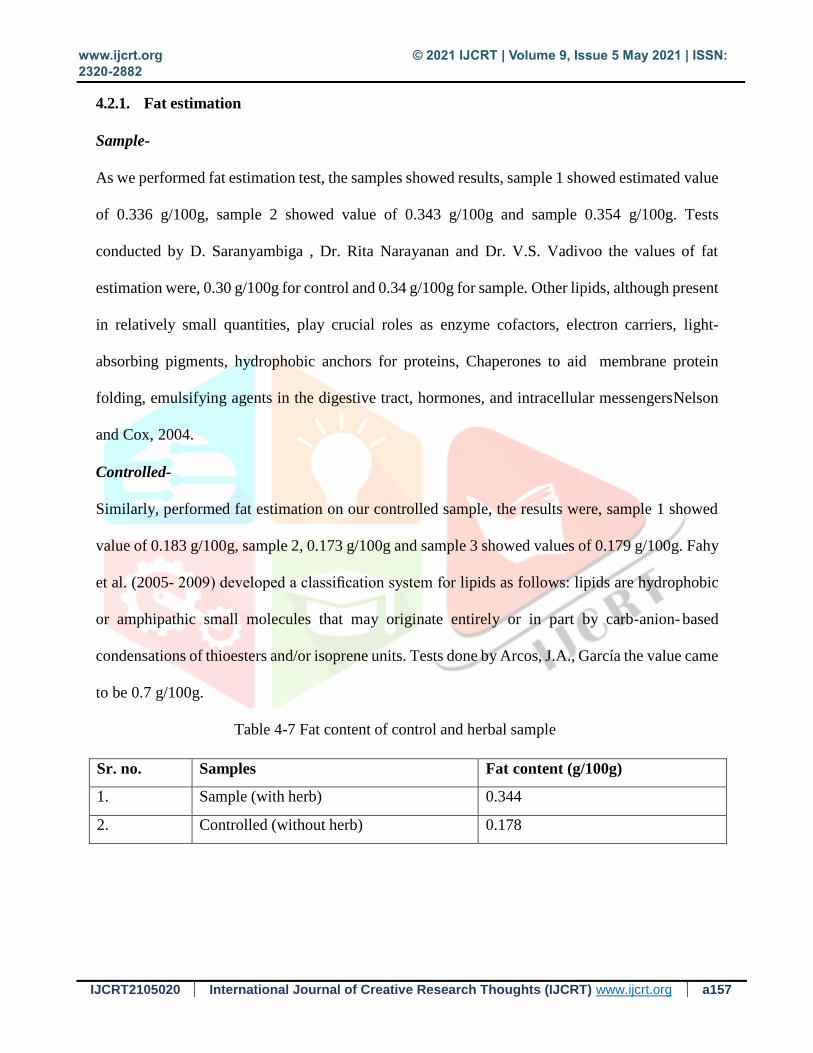
4.2.1. Fat estimation
Sample-
As we performed fat estimation test, the samples showed results, sample 1 showed estimated value
of 0.336 g/100g, sample 2 showed value of 0.343 g/100g and sample 0.354 g/100g. Tests
conducted by D. Saranyambiga , Dr. Rita Narayanan and Dr. V.S. Vadivoo the values of fat
estimation were, 0.30 g/100g for control and 0.34 g/100g for sample. Other lipids, although present
in relatively small quantities, play crucial roles as enzyme cofactors, electron carriers, light-
absorbing pigments, hydrophobic anchors for proteins, Chaperones to aid membrane protein
folding, emulsifying agents in the digestive tract, hormones, and intracellular messengers Nelson
and Cox, 2004.
Controlled-
Similarly, performed fat estimation on our controlled sample, the results were, sample 1 showed
value of 0.183 g/100g, sample 2, 0.173 g/100g and sample 3 showed values of 0.179 g/100g. Fahy
et al. (2005- 2009) developed a classification system for lipids as follows: lipids are hydrophobic
or amphipathic small molecules that may originate entirely or in part by carb-anion- based
condensations of thioesters and/or isoprene units. Tests done by Arcos, J.A., García the value came
to be 0.7 g/100g.
Table 4-7 Fat content of control and herbal sample
Sr. no. Samples Fat content (g/100g)
1. Sample (with herb) 0.344
2. Controlled (without herb) 0.178
www.ijcrt.org © 2021 IJCRT | Volume 9, Issue 5 May 2021 | ISSN:
2320-2882
IJCRT2105020 International Journal of Creative Research Thoughts (IJCRT) www.ijcrt.org a158
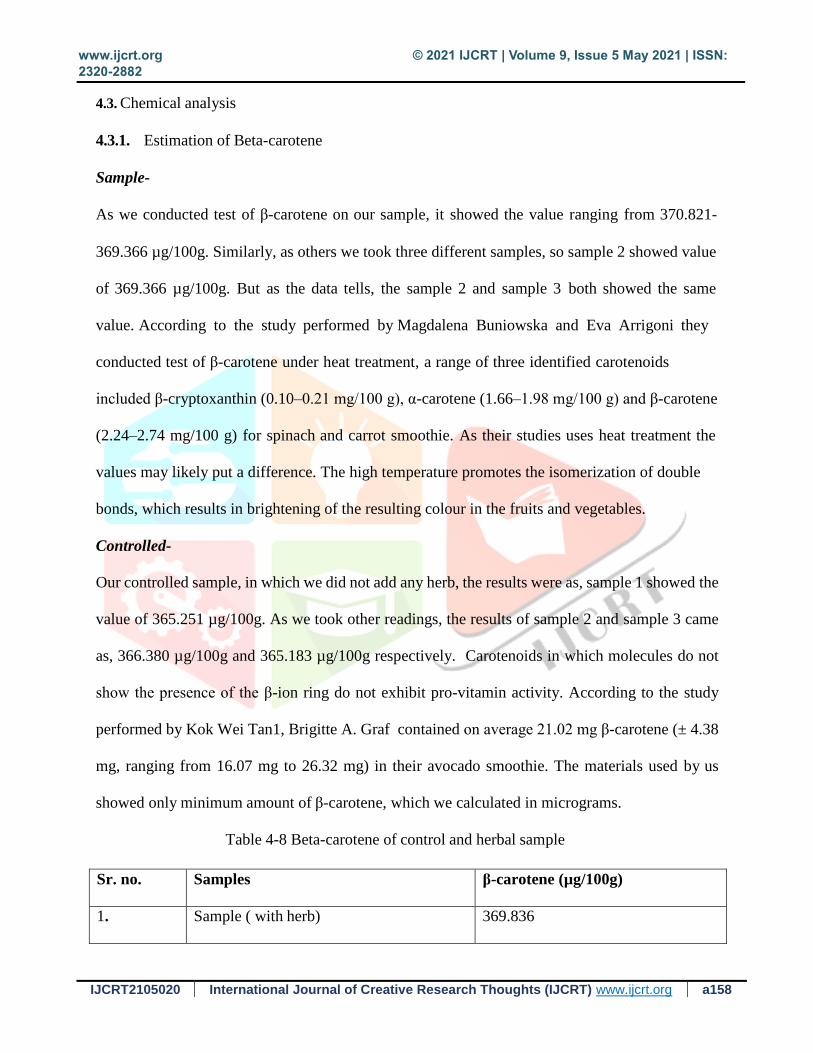
4.3. Chemical analysis
4.3.1. Estimation of Beta-carotene
Sample-
As we conducted test of β-carotene on our sample, it showed the value ranging from 370.821-
369.366 µg/100g. Similarly, as others we took three different samples, so sample 2 showed value
of 369.366 µg/100g. But as the data tells, the sample 2 and sample 3 both showed the same
value. According to the study performed by Magdalena Buniowska and Eva Arrigoni they
conducted test of β-carotene under heat treatment, a range of three identified carotenoids
included β-cryptoxanthin (0.10–0.21 mg/100 g), α-carotene (1.66–1.98 mg/100 g) and β-carotene
(2.24–2.74 mg/100 g) for spinach and carrot smoothie. As their studies uses heat treatment the
values may likely put a difference. The high temperature promotes the isomerization of double
bonds, which results in brightening of the resulting colour in the fruits and vegetables.
Controlled-
Our controlled sample, in which we did not add any herb, the results were as, sample 1 showed the
value of 365.251 µg/100g. As we took other readings, the results of sample 2 and sample 3 came
as, 366.380 µg/100g and 365.183 µg/100g respectively. Carotenoids in which molecules do not
show the presence of the β-ion ring do not exhibit pro-vitamin activity. According to the study
performed by Kok Wei Tan1, Brigitte A. Graf contained on average 21.02 mg β-carotene (± 4.38
mg, ranging from 16.07 mg to 26.32 mg) in their avocado smoothie. The materials used by us
showed only minimum amount of β-carotene, which we calculated in micrograms.
Table 4-8 Beta-carotene of control and herbal sample
Sr. no. Samples β-carotene (µg/100g)
1. Sample ( with herb) 369.836

www.ijcrt.org © 2021 IJCRT | Volume 9, Issue 5 May 2021 | ISSN:
2320-2882
IJCRT2105020 International Journal of Creative Research Thoughts (IJCRT) www.ijcrt.org a159
2. Controlled ( without herb) 365.61
4.3.2. Estimation of L-ascorbic
Sample-
As of our sample we performed L-ascorbic test, the results were, sample showed value of 5.836
mg/100g. Similarly, we took two more readings, sample 1 showed the value of 5.812 mg/100g and
sample 3 showed the value of 5.861 mg/100g. This research work shows that carrots and
cucumbers contain an appreciable amount of antioxidant properties, vitamins, minerals and
macronutrients which are required for the proper functioning of the body. Tests performed by
Taiwo Ayodele Aderinola and Kemi Elizabeth Abaire shows value of 14.48 ± 0.32 mg/100 mg ,
21.07 ± 0.26 mg/100 mg and 24.48 ± 1.11 mg/100 mg respectively basically of smoothie made up
of lemon, kale and celery and parsley herb. With results it has been clearly shown that the ascorbic
acid present in lemon is more than carrot and cucumber.
Controlled-
In controlled as we did not add any herb, the results were, sample 15.946 mg/100g, as of sample
2 the results were, 5.796 mg/100g and sample 3 the results estimated to be 5.782 mg/100g.
Experiments done by Canan Ece TAMER and Fatma Zehra YEKELER the results were 1.10708
mg/100g and 0.53526 mg/100g as they used orange extract, milk, and ascorbic acid concentrate.
Ascorbic acid determination results obtained by cyclic voltammetry were compared with those
obtained by the volumetric method with dichlorophenol indophenol. The addition of herbal
extracts allows the production of cold beverages of high nutritional value, which are preferred by
consumers for their sensory properties. It also helps to serve these products for consumption across
all seasons.
Table 4-9 L-ascorbic acid of control and herbal smoothie

www.ijcrt.org © 2021 IJCRT | Volume 9, Issue 5 May 2021 | ISSN:
2320-2882
IJCRT2105020 International Journal of Creative Research Thoughts (IJCRT) www.ijcrt.org a160
Sr. no. Samples L-ascorbic acid (mg/100g)
1. Sample (with herb) 5.83
2. Controlled (without herb) 5.842
4.3.3. Total phenolic content
Sample-
Smoothie was also tested for total phenolic content and the results were calculated to be, sample 1
shows reading of 1278.3 mg/L, sample 2 showed the result, 1285.76 mg/L and sample 3, 1285.78
mg/L. according to the study performed by Sushant Aryal, Manoj Kumar Baniya the estimated
value for their vegetable smoothie, the results were, 292.65 ± 0.42 mg/L and 287.73 ±
0.16 mg/L. As fruits have higher antioxidants, the results vary. Phenolic compounds are important
plant constituents with redox properties responsible for antioxidant activity.
Controlled-
The results for controlled sample was, sample 1 showed value 1269.81 mg/L. sample 2 showed
value estimated to be, 1268.33 mg/L and lastly, sample 3 showed value of 1279.33 mg/L. More
research done by Keskin-Šašić, Tahirović, their result for total phenolic content of fruit smoothie
was estimated to be, 1086.60 mg/L. The reason behind this decrease in total phenolic content was,
it was non-centrifuged, and proteins residing in solutions of non-centrifuged samples increased the
antioxidant capacity of those fruits.
Table 4-10 Total Phenol content of control and herbal smoothie
Sr. no. Sample Total Phenolic content (mg/L)
1. Sample (with herb) 1283.7
2. Controlled (without herb) 1272.49

www.ijcrt.org © 2021 IJCRT | Volume 9, Issue 5 May 2021 | ISSN:
2320-2882
IJCRT2105020 International Journal of Creative Research Thoughts (IJCRT) www.ijcrt.org a161
Figure 4-18 TPC estimation of sample
4.3.4. Estimation of flavonoids
Carrot-
For flavonoids, sample 1 estimated value ranges from 3.7-4.4 (mg/g). Sample 2 showed value of
3.1 mg/g and sample 3 showed the value of 4.4 mg/g. Carrots are also a good source of disease-
fighting flavonoids that provide antioxidants that neutralize free radicals in our bodies. The value
ranges from 3.7 mg/g but it can be seen that it increases to 4.4 mg/g. As carrots were grinded for
smoothie preparation, the minor losses on flavonoids can affect the values.
Cucumber-
The flavonoids tests we conducted in Cucumis sativus, the results were, sample 1 showed value of
2.14 mg/g, sample 2 values came to be 2.73 mg/g and sample 3 values was 1.56 mg/g. As cucumber
constitutes more amounts of carotenoids, flavonoids and phenolic content, these parameters may
differ due to the species also. According to Saxena, et al., flavonoids have been reported to exert
multiple biological property including antimicrobial, antioxidant, cytotoxicity, anti-inflammatory,
as well as antitumor activity.
Strawberry-
As compared to carrots and cucumber, strawberries contain high amount of flavonoids content.
Sample 1 showed value of 7.04 mg/g, sample 2 showed value of 7.54 mg/g and sample 3 have
www.ijcrt.org © 2021 IJCRT | Volume 9, Issue 5 May 2021 | ISSN:
2320-2882
IJCRT2105020 International Journal of Creative Research Thoughts (IJCRT) www.ijcrt.org a162
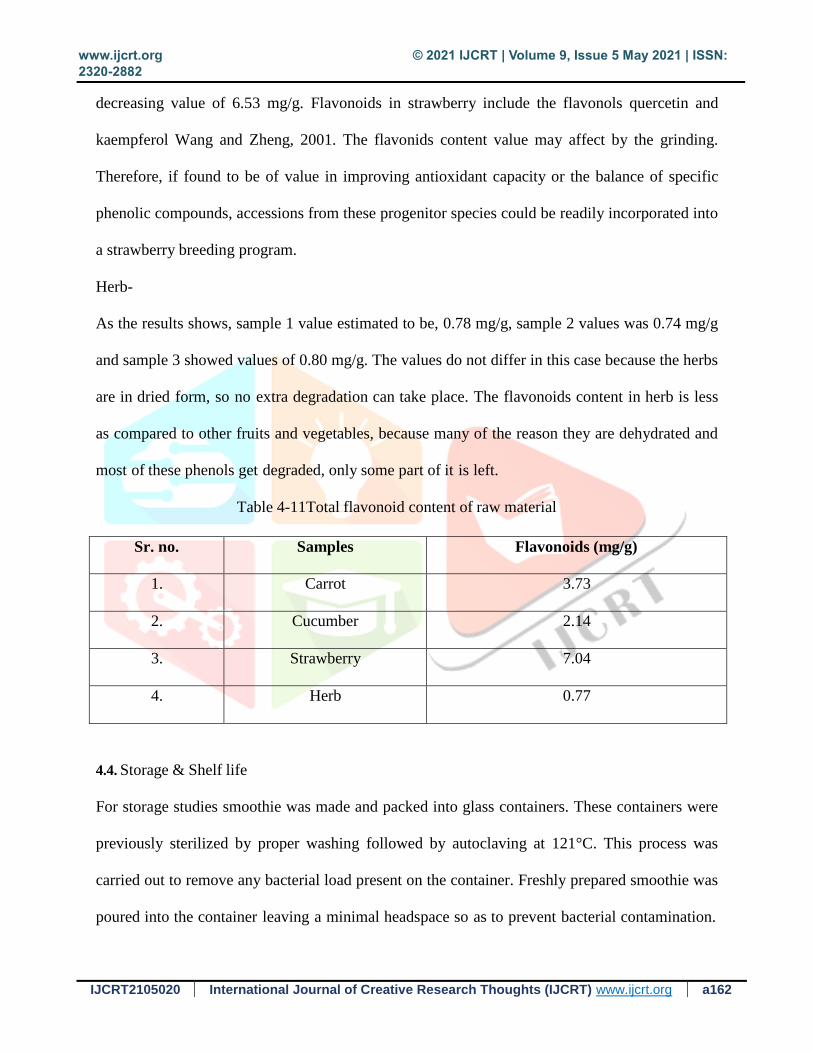
decreasing value of 6.53 mg/g. Flavonoids in strawberry include the flavonols quercetin and
kaempferol Wang and Zheng, 2001. The flavonids content value may affect by the grinding.
Therefore, if found to be of value in improving antioxidant capacity or the balance of specific
phenolic compounds, accessions from these progenitor species could be readily incorporated into
a strawberry breeding program.
Herb-
As the results shows, sample 1 value estimated to be, 0.78 mg/g, sample 2 values was 0.74 mg/g
and sample 3 showed values of 0.80 mg/g. The values do not differ in this case because the herbs
are in dried form, so no extra degradation can take place. The flavonoids content in herb is less
as compared to other fruits and vegetables, because many of the reason they are dehydrated and
most of these phenols get degraded, only some part of it is left.
Table 4-11Total flavonoid content of raw material
Sr. no. Samples Flavonoids (mg/g)
1. Carrot 3.73
2. Cucumber 2.14
3. Strawberry 7.04
4. Herb 0.77
4.4. Storage & Shelf life
For storage studies smoothie was made and packed into glass containers. These containers were
previously sterilized by proper washing followed by autoclaving at 121°C. This process was
carried out to remove any bacterial load present on the container. Freshly prepared smoothie was
poured into the container leaving a minimal headspace so as to prevent bacterial contamination.
www.ijcrt.org © 2021 IJCRT | Volume 9, Issue 5 May 2021 | ISSN:
2320-2882
IJCRT2105020 International Journal of Creative Research Thoughts (IJCRT) www.ijcrt.org a163
These containers were placed under 2 different temperature conditions. The storage study was
performed for 6 days as fruits and vegetables is highly perishable component if it is not preserved
in sterilized conditions. Proximate analysis, including and microbiological analysis were done after
3 days’ interval.
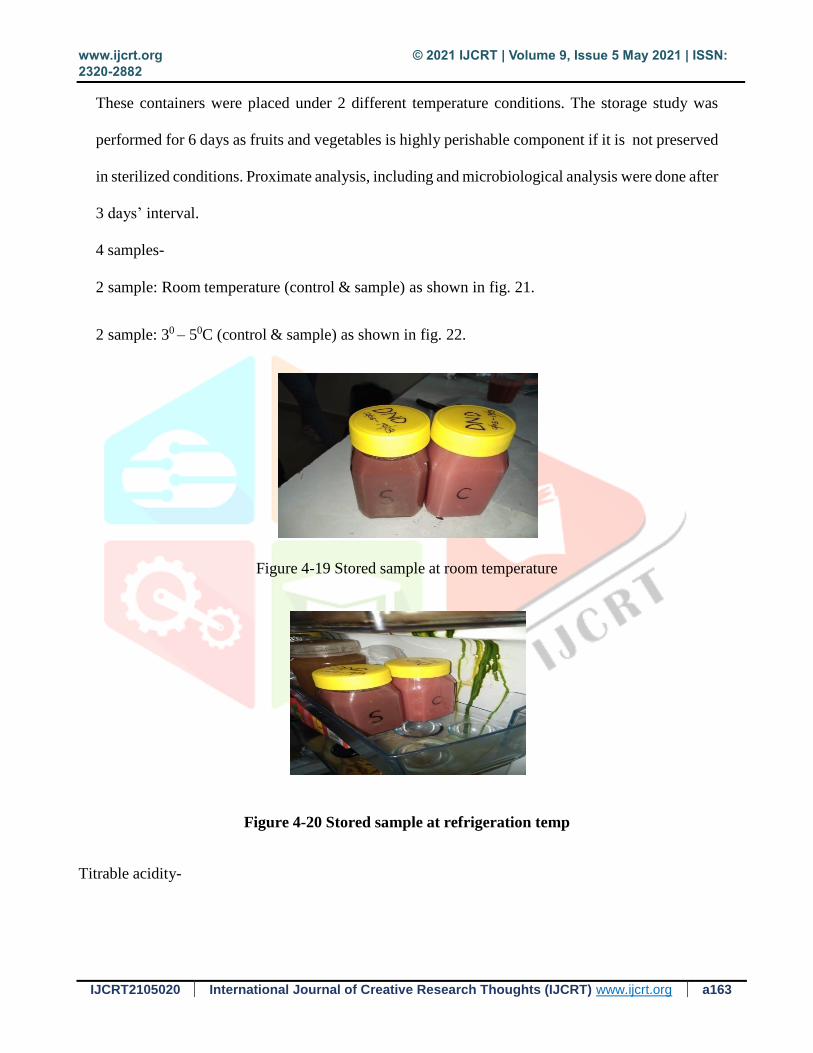
4 samples-
2 sample: Room temperature (control & sample) as shown in fig. 21.
2 sample: 30 – 50C (control & sample) as shown in fig. 22.
Figure 4-19 Stored sample at room temperature
Figure 4-20 Stored sample at refrigeration temp
Titrable acidity-

www.ijcrt.org © 2021 IJCRT | Volume 9, Issue 5 May 2021 | ISSN:
2320-2882
IJCRT2105020 International Journal of Creative Research Thoughts (IJCRT) www.ijcrt.org a164
We have observed the Titrable acidity of control before keeping it for the shelf life the titrable
acidity of our control sample is 0.17% but we prepared the fresh sample again before keeping if
for the shelf to observe the acidity before & after shelf life. Therefore, before keeping it for the
shelf life the titrable acidity was about 0.302% but after the shelf life period of 5 days the acidity
of the control increased due to the spoilage of the smoothie.
We have observed the Titrable acidity of control before keeping it for the shelf life the titrable
acidity of our sample is 0.213% but we prepared the fresh sample again before keeping if for the
shelf to observe the acidity before & after shelf life. Therefore, before keeping it for the shelf life
the titrable acidity was about 0.379% but after the shelf life period of 5 days the acidity of the
control increased due to the spoilage of the smoothie.
pH-
We have observed the pH of control before keeping it for the shelf life the pH of our control sample
is 3.83 but we prepared the fresh sample again before keeping if for the shelf to observe the pH
before & after shelf life. Therefore, before keeping it for the shelf life the pH was about
3.83 but after the shelf life period of 5 days the pH of the control decreased due to the spoilage of
the smoothie. The pH after the shelf life was 2.1.
S.No. Before storage After Storage
1 3.83 2.1
We have observed the pH of control before keeping it for the shelf life the pH of our control sample
is 3.83 but we prepared the fresh sample again before keeping if for the shelf to observe the pH
before & after shelf life. Therefore, before keeping it for the shelf life the pH was about
3.92 but after the shelf life period of 5 days the pH of the control decreased due to the spoilage of
the smoothie. The pH after the shelf life was 1.84 this is because of herbs present in it.

www.ijcrt.org © 2021 IJCRT | Volume 9, Issue 5 May 2021 | ISSN:
2320-2882
IJCRT2105020 International Journal of Creative Research Thoughts (IJCRT) www.ijcrt.org a165
Figure 1-4-21 Spoiled sample
S. No. Before storage After Storage
1 3.92 1.84
Total soluble solid-
We have observed the TSS of control before keeping it for the shelf life the TSS of our control
sample is 50 Brix but we prepared the fresh sample again before keeping if for the shelf to observe
the pH before & after shelf life. Therefore, before keeping it for the shelf life the TSS was about
50 Brix but after the shelf life period of 5 days the TSS of the control increased due to the spoilage
of the smoothie. The brix after the shelf life was 100 Brix. As you can observe the after the spoilage
the increment of the brix was about 50.
S. No. Before storage After storage
1 50 Brix 100 Brix
We have observed the TSS of control before keeping it for the shelf life the TSS of our control
sample is 180 Brix the brix is high in the sample due to herbs present in it, as we prepared the fresh
sample again before keeping if for the shelf to observe the pH before & after shelf life. Therefore,
before keeping it for the shelf life the TSS was about 150 Brix but after the shelf life period on 5
days the TSS of the control increased due to the spoilage of the smoothie. The brix after the shelf
life was 250 Brix. As you can observe the after the spoilage the increment of the brix was about
100.
S. No Before storage After storage
1 150 Brix 250 Brix

www.ijcrt.org © 2021 IJCRT | Volume 9, Issue 5 May 2021 | ISSN:
2320-2882
IJCRT2105020 International Journal of Creative Research Thoughts (IJCRT) www.ijcrt.org a166
3. CONCLUSION
Smoothies are popular dietary products with the potential to assist individuals in incorporating
more fruit and vegetables into their diets. As the title suggests we developed a herbal smoothie
with the herb Shankhpushpi with different compositions including 0g, 0.75g, 1g, 1.25g in the final
product and optimize on the basis of sensory analysis. The control was in the ratio of 30:30:40 in
which 30g carrot, 30g cucumber and 40g of strawberry are added. The sample with 1.25g
concentration of herb was finalized on the basis of equality found on the various parameters. With
the addition of the herb Shankhpushpi, it served enormous benefits including the improvement in
the function of nervous system, boosting memory, helps in the treatment of disorders/syndromes
such as hypertension, hypotension, anxiety neurosis, stresses etc. whereas with the addition of
carrot, cucumber and strawberry in the smoothie, the anti-oxidative, antacid, anti-inflammatory
and anti-carcinogenic properties increased significantly. Carrot being a good source of beta
carotene, fiber, vitamin K1, potassium, and antioxidants, helps in lowering cholesterol levels and
improved eye health. Cucumber being rich in vitamin C, vitamin K, magnesium helps in promoting
hydration, prevents ulcerative colitis, and lowers blood sugar level. While strawberry being a
sodium-free, fat-free, cholesterol-free, low-calorie food, is rich in vitamin C, fiber, manganese,
potassium, and antioxidant (polyphenols), which helps in increasing HDL (good) cholesterol,
lowering your blood pressure, and guard against cancer. So with the introduction of herbal
smoothie into the regular diet, it may have a greater impact on the health quality of life for
individuals.

www.ijcrt.org © 2021 IJCRT | Volume 9, Issue 5 May 2021 | ISSN:
2320-2882
IJCRT2105020 International Journal of Creative Research Thoughts (IJCRT) www.ijcrt.org a167
REFERENCES
Derbyshire E. Where are we with Smoothies? A Review of the Latest Guidelines, Nutritional
Gaps and Evidence. Journal of Nutrition & Food Sciences. 2017; 7(5):1-5.
O’Connor L, Walton J, Flynn A (2016) Fruit and vegetable intakes, sources and contribution
to total diet in very young children (1-4 years): The Irish National Pre-School Nutrition
Survey. Br J Nutr 115: 2196-2202.
Pinket AS, De Craemer M, Maes L, De Bourdeaudhuij I, Cardon G (2015) Water intake and
beverage consumption of pre-schoolers from six European countries and associations with
socio- economic status: the ToyBox-study. Public Health Nutr 19: 2315-2325.
Chu J, Igbetar BD, Orfila C (2017) Fibrous cellular structures are found in a commercial fruit
smoothie and remain intact during simulated digestion. J Nutr Food Sci 7: 1-5.
Ruxton, C.H.S. (2008) ‘Smoothies: One Portion or Two?’ British Nutrition Foundation
Bulletin Emiko maeda (2013) The Effects of Green Smoothie Consumption on Blood
Pressure and Health-Related Quality of Life: A Randomized Controlled Trial.
Rogers PJ, Shahrokni R (2017) a comparative study of the satiety effects of an Innocent
smoothie versus other drinks and fruit. Appetite.
Saltaouras G, Shaw PK, Fraser AC, Hawes C, Smith H, et al. (2017) The fibre content
and impact on glycaemic response of two commercially available fruit smoothies. J Nutr Food
Sci.
Castillejo N, Martínez-Hernández GB, Gómez PA, Artés F, Artés-Hernández F (2016) Red
fresh vegetables smoothies with extended shelf life as an innovative source of health-
promoting compounds. J Food Sci Technol 53: 1475-1486.
www.ijcrt.org © 2021 IJCRT | Volume 9, Issue 5 May 2021 | ISSN:
2320-2882
IJCRT2105020 International Journal of Creative Research Thoughts (IJCRT) www.ijcrt.org a168
Balaswamy, K., Prabhakara Rao, P.G., Nagender, A., Narsing Rao, G., Sathiya Mala, K.,
Jyothirmayi, T., Math, R.G. and Satyanarayana, A. Development of smoothies from selected
fruit pulps/juices.
Walking, R. M., Noci, F., Cronin, D. A., Lyng, J. G. and Morgan, D. J. 2010. Shelf life and
sensory attributes of a fruit smoothie – type beverage processed with moderate heat and pulsed
electric fields. LWT Food Science and Technology.
Taiwo Ayodele Aderinola Nutritional, Antioxidant and Quality Acceptability of Smoothies
Supplemented with Moringa oleifera Leaves.
Fatima A, Agrawal P, Singh PP. Herbal option for diabetes: an overview. Asian Pac J Trop
Dis. 2012;2(suppl 1):S536–S544.
Int J Yoga. 2015 Jul-Dec; 8(2): 109–116. doi: 10.4103/0973-6131.158473 PMCID:
PMC4479887 Nootropic efficacy of Satvavajaya Chikitsa and Ayurvedic drug therapy: A
comparative clinical exposition Hetal Amin and Rohit Sharma.
Parul Agarwa, Bhawna Sharma, Amreen Fatima, and Sanjay Kumar Jain (2014) An update
on Ayurvedic herb Convolvulus pluricaulis Choisy
Neeraj K.Sethiya, AlokNahata, Pawan KumarSingh, S.H.Mishra. (2017)
Neuropharmacological evaluation on four traditional herbs used as nervine tonic and
commonly available as Shankhpushpi in India.
Verma S, Sinha R, Kumar P, Amin F, Jain J, Tanwar S. (2012) Study of Convolvulus
pluricaulis for antioxidant and anticonvulsant activity
Debjit Bhowmik, K.P.Sampath Kumar, Shravan Paswan, Shweta Srivatava, Akhilesh pd.
Yadav, Amitsankar Dutta (2012) Traditional Indian Herbs Convolvulus pluricaulis and Its
Medicinal Importance.
www.ijcrt.org © 2021 IJCRT | Volume 9, Issue 5 May 2021 | ISSN:
2320-2882
IJCRT2105020 International Journal of Creative Research Thoughts (IJCRT) www.ijcrt.org a169
Hurtado A, Guàrdia MD, Picouet P, Jofré A, Ros JM,, Bañón S (2016) Stabilisation of red
fruit- based smoothies by high-pressure processing. Part II: effects on sensory quality and
selected nutrients.
Taiwo Ayodele Aderinola and Kemi Elizabeth Abaire (2019) Quality Acceptability,
Nutritional Composition and Antioxidant Properties of Carrot-Cucumber Juice
Harsha Hirdyani (2015) Quality Evaluation of Herbal Juice Developed from Traditional
Indian Medicinal Plants Using Citrus limetta as Base
Khammash Gatsinzi, James P. Habyarimana, Augustine Gatsinzi (2016) Nutritional quality
of carrot (Daucus carota L.) as influenced by farm yard manure
Surbhi S, Verma RC, Deepak R, Jain HK and Yadav KK (2018) Food, chemical composition
and utilization of carrot (Daucus carota L.) pomace
Ullah N, Ullah S, Khan A, Ullah L and Badshah S (2018) Preparation and Evaluation of
Carrot and Apple Blended Jam
Andrew S Potter, Shahrzad Foroudi, Alexis Stamatikos, Bhimanagouda S Patil & Farzad
Deyhim (2011) Drinking carrot juice increases total antioxidant status and decreases lipid
peroxidation in adults.
A.Sood, P. Kaur and R. Gupta (2012) Phytochemical Screening And Antimicrobial Assay Of
Various Seeds Extract Of Cucurbitaceae Family.International Journal of Applied Biology and
Pharmaceutical Technology, 3(3): 401-409,.
T. Keerthika, C. S. Devaki, F. Suma and A. Urooj (2016) Studies on the Nutritional and
Quality Characteristics of CucumisSativusVarieties .Agricultural Science Research Journal
Vol. 6(4): 79
– 85.

www.ijcrt.org © 2021 IJCRT | Volume 9, Issue 5 May 2021 | ISSN:
2320-2882
IJCRT2105020 International Journal of Creative Research Thoughts (IJCRT) www.ijcrt.org a170
L. Kumaraswamy (2016) A comparative study on antioxidant activities of three cultivars of
Cucumissativas (Linn). International Journal of Research in Biotechnology and Biochemistry.
S. Sharma., J.Dwivedi., S.Paliwal (2012) Evaluation of antacid and carminative properties of
Cucumissativus under simulated conditions. Scholars Research Library Der Pharmacia Lettre,
4(1): 234-239.
K.Patil., A Kandhare., D Bhise (2012) Effect of aqueous extract of Cucumissativus Linn. fruit
in ulcerative colitis in laboratory animals. Asian Pacific Journal of Tropical Biomedicine:962-
969. H.Heidari, M.Kamalinejad, M.Eskandari (2012) Hepatoprotective activity of
Cucumissativus against cumenehydroperoxide induced-oxidative stress. Research in
Pharmaceutical Sciences,; 7(5): 936-939.
Sumirah budi pertami, Budiono, Dian yuniar syanti rahayu (2017) effect of cucumber
(cucumis sativus) juice on lowering blood pressure in elderly.
Mohd Syazni Ruslan (2016) Development of vegetable-flavoured ice cream.
Rehman Ullah Khan, Shamsur Rehman Afridi, Muhammad Ilyas, Muhammad Sohail and
Hamida Abid (2012) Development of strawberry jam and its quality evaluation during
storage.
Muhammad Ayub, Javid Ullah, Ali Muhammad and Alam Zeb (2009) Evaluation of
strawberry juice preserved with chemical preservatives at refrigeration temperature
Umair arshad bajwa, Nuzhat huma, Babar ehsan, Kashif jabbar and Ayaz khurram (2003)
Effect of Different Concentrations of Strawberry Pulp on the Properties of Ice Cream.
Joseph, J.A., B. Shukitt-Hale, N.A. Denisova, R.L. Prior, G. Cao, A. Martin, G. Taglialatela,
and
P.C. Bickford (1998) Long-term dietary strawberry, spinach, or vitamin E supplementation
retards the onset of age-related neuronal signal-transduction and cognitive behavioral deficits.

www.ijcrt.org © 2021 IJCRT | Volume 9, Issue 5 May 2021 | ISSN:
2320-2882
IJCRT2105020 International Journal of Creative Research Thoughts (IJCRT) www.ijcrt.org a171
J. Neurosci. 18:8047-8055

www.ijcrt.org © 2021 IJCRT | Volume 9, Issue 5 May 2021 | ISSN: 2320-2882
IJCRT2105020 International Journal of Creative Research Thoughts (IJCRT) www.ijcrt.org a172
Shukitt-Hale, B., D.E. Smith, M. Meydani, and J.A. Joseph (1999) The effects of dietary antioxidants
on psychomotor performance in aged mice. Exp Gerontol. 34(6):797-808.
Wang, S.Y., R. Feng, Y. Lu, L. Bowman, and M. Ding (2005) Inhibitory Effect on Activator Protein-
1, Nuclear Factor-Kappa B, and Cell Transformation by Extracts of Strawberries (Fragaria X ananassa
Duch). J. Agric. Food Chem. 53:4187-4193.
Arpita Basu, Angel Nguye, Nancy M. Betts & Timothy J. Lyons (2014) Strawberry As a Functional
Food: An Evidence-Based Review.