development and use of a velocity prediction program...
TRANSCRIPT

Development and use of a Velocity Prediction Program to compare the effects of
changes to foil arrangement on a hydro-foiling Moth dinghy
M W Findlay, S R Turnock, School of Engineering Sciences, University of Southampton, UK
SUMMARY The International Moth dinghy is a 3.355m long single handed, una-rigged monohull dinghy. The class rules allow the
use of hydrofoil that in certain wind conditions can significantly reduce resistance. A new velocity prediction program
(VPP) has been developed to evaluate the impact of hydrofoil design and set-up on the performance of a Moth dinghy by
simulating racing on a windward - leeward course. The VPP generates polar diagrams indicating the speed of the craft
in a range of true wind strengths and angles. Sail force and windage are modelled using aerofoil theory. The drag
model includes hull skin friction and residuary resistance, profile and induced drag for every foil, wavemaking drag of
the lifting foils and spray drag of the surface piercing foils. Using an iterative process the VPP determines the boat
speed that balances resistive forces with drive force, heeling moment and righting moment and vertical lift forces with
weight. A series of case studies demonstrate the use of the VPP by examining the effects of changing the span of the
forward foil, adding end plates, and using different foil geometries on performance.
NOMENCLATURE
)1( k+ Form factor [-]
GA Geometric Aspect ratio [-]
gAR Geometric Aspect ratio [-]
aβ Apparent wind angle [deg]
b Breadth of sail [m]
c Chord of foil [m]
DC Coefficient of drag [-]
iDC Coefficient of induced drag [-]
fDC Coefficient of skin friction [-]
pDC Coefficient of profile drag [-]
rDC Drag coefficient of rth
component [-]
DsprayC Coefficient of spray drag [-]
LC Coefficient of lift [-]
1LC Coefficient of lift on foil 1 [-]
2LC Coefficient of lift on foil 2 [-]
WC Coefficient of wavemaking drag [-]
D Drag [N]
SprayD Spray drag [N]
WD Drag due to windage [N]
e∆ Effective hull displacement [N]
xf Side force (body axis system) [N]
yf Drive force (body axis system) [N]
g Acceleration due to gravity; 9.81 [m/s2]
h Depth of submergence [m]
1κ Constant for end plates efficiency [-]
2κ Constant for taper ratio [-]
k Induced drag slope [-]
0k Wavenumber [m-1
]
L Length scale (in context of RN) [m]
L Sail lift [N]
1L Lift from forward foil [N]
2L Lift from aft foil [N]
M Heeling moment [Nm]
crewm Mass of helmsperson [kg]
airρ Density of air [kg/m3]
ρ Density of water [kg/m3]
NR Reynolds number [-]
MaxRM Maximum righting moment [Nm]
S Area of foil [m2]
rS Area of rth
component [m2]
sailS Sail area [m2]
t Thickness of foil [m]
U Velocity scale [m/s]
ν Kinematic viscosity [m2/s]
av Apparent wind speed [m/s]
Sv Craft speed through water [m/s]
vT True wind speed [knots]
W Total weight of craft and crew [N]
x Lever arm of righting moment [m]
1x Hor. dist. CG to CE of foil 1 [m]
2x Hor. dist. CG to CE of foil 2 [m]
z Lever arm of heeling moment [m]
*z Vert. dist. CE yf to CE RTot [m]
1 INTRODUCTION
Hydrofoils have traditionally been fitted to power craft to
reduce drag and therefore power requirements at a given
operating speed. The application of hydrofoils to sailing
craft has been more problematic for two main reasons.
Firstly, the power to weight ratio of most sailing boats is
relatively small because sailing craft need to carry ballast

in order to provide righting moment against the heeling
moment from the sails. This limits the application of
hydrofoils to catamarans and dinghies which can extend
the crew weight on racks or trapezes to provide the
necessary righting moment.
Secondly, the operating speed of sailing craft is highly
variable, being a function of apparent wind speed and
direction, and so the use of hydrofoils is also largely a
problem of developing suitable control systems to
account for these fluctuations. Most yachts racing
classes prohibit surface piercing hydrofoils with the
consequence that the effective use of hydrofoils relies on
the implementation of mechanical control systems to
control fully submerged hydrofoils.
Traditionally the motivation behind retro-fitting
hydrofoils to sailing craft has been to increase maximum
speed for time trial events such as Weymouth speed
week. Developments in this area have been ongoing
since the launch of Gordon Baker’s ‘Monitor’ in the
1950s and Don Nigg’s ‘Flying Fish’ in the 1960s. [1]
Chapman [2] developed a number of hydrofoiling sailing
craft that were used to make performance measurements,
along with foil and strut loadings. The measured force
data was used in combination with wind tunnel test data
to write velocity prediction programs for two
hydrofoiling catamarans when in fully foil-borne mode
only. The VPP was subsequently used to make design
decisions pertaining to the size of the hydrofoils fitted to
the craft to increase average speed around a course.
Recently, with the development of hydrofoils for the
International Moth class of dinghy, it been demonstrated
that hydrofoils provide a performance gain in a large
enough range of conditions that ‘foilers’ would now be
expected to outperform ‘non foilers’ over a series of
races. In 2005 foilers won both the World and European
championships.
The International Moth dinghy is a 3.355m long single
handed, una-rigged monohull dinghy. The class rules do
not limit hull shape, materials or weight, but limitations
are placed on length, beam and sail area. As a result the
craft have evolved to have extremely narrow waterlines
(~0.3m), to be extremely lightweight (<30kg fully
rigged) and to have large wings from which the helm
hikes. This gives them very good power to weight ratios
and makes the class a great platform for the use and
development of hydrofoils.
Due to limitations imposed by the class rules these craft
use a bi-foil airplane configuration utilising daggerboard
and rudder mounted, fully submerged T-foils. An active
control mechanism is required to maintain a consistent
ride height over a range of speeds which is achieved
through the use of a bow-mounted wand sensor
controlling a trailing edge flap on the forward
(daggerboard-mounted) foil. It is possible to adjust the
aft (rudder-mounted) foil manually by either altering the
angle of attack or the position of another trailing edge
flap, depending on the system. Figure 1 shows an
example of a hydrofoiling Moth dinghy.
Figure 1 Hydrofoiling Moth dinghy. [3]
In general the foil design and configuration is selected by
the designer based on experience and an empirical
understanding of the general effects of parameter
changes on performance such as take-off speed and
maximum speed. However, as the goal is to deliver
performance gains in a range of conditions it is important
to also consider the effects of different foil designs under
sub-optimal operating conditions, such as in non- and
partial foil-borne regimes.
In this paper a computational velocity prediction program
(VPP) for hydro-foiling sailboats is developed and used
to predict the performance of hydro-foiling Moth
dinghies. Input parameters for the VPP are the physical
dimensions of the foils, hull and sail, and the output is a
series of polar plots that describe the speed of the craft
for each true wind angle and strength.
The VPP incorporates both displacement and
hydrofoiling modes and uses standard models for all
major drag components sail-force. The magnitude of
each component of drag may be inspected at any given
point which helps the designer to understand why one
configuration performs better than another. The polar
data may be analysed in the context of a race around a
course to determine how different configurations perform
in different wind conditions.

2 MODELLING APPROACH AND
ASSUMPTIONS
2.1 Overview of Velocity Prediction Program
The VPP determines the boat speed for a given true wind
angle and speed using the iterative process shown in
Figure 2 and described below.
The apparent wind direction and speed are determined
from the boat speed and true wind direction and speed,
and then the lift and drag forces due to the sail and
structural windage are calculated. These forces are
resolved into drive force and side force and the drive
force is then maximised under the constraint that the
heeling moment may not exceed the maximum available
righting moment.
Figure 2 Flow Chart of VPP
The hydrodynamic force model calculates the drag forces
due to the hull and foils under the condition that the craft
adopts a leeway angle such that the foils provide
sufficient lift to counter the sailing side force.
The total hydrodynamic drag varies depending on the
trim angles of the foils and whether the boat is in a fully
foil-borne or non foil-borne mode. The trim tab angles
are varied at each time step until the total hydrodynamic
drag is minimised.
The craft is accelerated in accordance with the resulting
net drive force and this leads to the next iterative step,
beginning with the new hull speed. Once successive
time steps result in changes to hull speed that are within a
convergence limit the ship speed is deemed to have
converged for that true wind condition.
The following sections describe how each force
component is modelled in the VPP.
2.2 Windage
Windage is the drag due to zero-lift components such as
hull, wings, crew and rigging and wing bar tubing. The
mast is not included in the calculation of windage
because the pressure distribution over the sail modifies
the windage due to the mast. In the case of the foiling
moth using a pocket luff and camber induced sails, the
windage of the mast is neglected and assumed to be
accounted for in the sail profile drag.
∑=r
DraairW rCSvD )(5.0 2ρ (1)
The diameter and area of each physical component
included in the windage model was estimated from
measurements of a Mistress design of foiling Moth. The
drag coefficient for each physical component was
estimated from Hoerner [4], based on the sectional shape
of the component.
2.3 Sail Force Model
The extremely narrow waterline beam of the
International Moth implies that virtually no righting
moment is derived from the movement of the centre of
buoyancy due to heeling; it is all due to the action of the
crew hiking. The effect of heel on righting moment is
therefore neglected and the maximum righting moment
is:
gxmRM crewMax = (2)
A value of x=1.425m is used for the Moth, based on the
distance of the wing edge from the centreline (1.125m)
and the effect of hiking moving the centre of effort of the
crew outboard by 0.3m. This was determined using a
‘hiking bench’ supported on a thin metal rod to find the
distance outboard of the bench at which the centre of
effort acts. For this paper the mass of the crew was
assumed to be constant at 70kg.
The drag force on the sail is assumed to be due to skin-
friction, pressure form drag and the induced drag. The
total effect of skin friction and pressure form drag is
known as profile drag and is calculated based on a skin
friction coefficient and a form factor. The form factor
modifies the skin friction to account for the alteration of
the boundary layer due to the pressure distribution across
the sail.
The skin friction coefficient for the sail is calculated
based on the Reynolds number of the flow and the ITTC
‘57 skin friction correlation line.
True wind speed
True wind direction
Ship speed
Sail settings
Apparent wind speed
Apparent wind direction
Maximised drive force
Drive force
Heeling moment
Windage Lift
Drag
Side force
Foil settings
Minimised hydrodynamic
resistance
Hydrodynamic
resistance
Net driving force
Acceleration or
convergence
End:
Return Ship speed
νUL
RN = (3)
2)2)((
075.0
−=
N
DRLog
Cf
(4)
Profile drag is calculated from skin friction plus a form
factor:
)1(2 kCCfp DD += (5)
A value of 1.05 was chosen for the form factor, 1+k, on
the basis that the sail is thin and relatively efficient as a
result of the pocket luff and cam inducers.
Sail CL is determined by increasing iteratively from zero
to CLmax and calculating the resulting lift, drag, drive
force, side fore and heeling moment. The operating lift
coefficient, CL, is the one that maximises drive force
under the constraint that the heeling moment may not
exceed the righting moment.
Induced drag is calculated in accordance with lifting line
theory [5]:
2
LD kCCi= (6)
GAk
π1
= (7)
with the geometric aspect ratio, AG, defined:
S
bAG
2
= (8)
Marchaj [6] recommends a value of approximately 1.3
for CLMax but this was increased to CLMax = 1.5 for the
simulation in light of the developments for modern sails
flown from wingmasts which more closely approximate
the Moth sail than the tests of Dacron sails flown from
masts in [6].
The total aerodynamic drag force is calculated as
follows:
pi DDD CCC += (9)
WDasailair DCvSD += 2
2
1ρ (10)
and total aerodynamic lift is given by:
Lasailair CvSL 2
2
1ρ= (11)
Lift and drag are then resolved into body axis system:
)cos()sin( aay DLf ββ −= (12)
)sin()cos( aax DLf ββ += (13)
and heeling moment is calculated:
zfM x= (14)
The value of z in the heeling moment equation is
determined from the weighted sum of the perpendicular
distances of each contributing heeling force from the
centre of effort of the daggerboard.
The centre of effort of the daggerboard is assumed to act
at 0.5 times the distance between the free surface and the
tip of the daggerboard on account of the rectangular
planform of the daggerboard and the end plate effects of
both the free surface and the hydrofoil [7].
The centre of effort of the sail is assumed to coincide
approximately with the geometric centre of area; at a
height of 0.4 times the luff length above the boom.
2.4 Hydrodynamic Force Model
It is assumed that the sailing side force, fX, is countered
entirely by the action of the daggerboard and that the
craft adopts whatever lee-way angle necessary to
generate this reaction force for the given ship speed. The
induced drag on the daggerboard is then calculated
accordingly (see 2.4.3)
The VPP searches for the minimum hydrodynamic drag
for every combination of ship speed and side force by
iterating through the possible foil CLs, up to their defined
CLmax values, and evaluating the total hydrodynamic drag
in each case.
2.4.1 Flying Condition
The vertical force balance that must be satisfied is:
WLL e =∆++ 21 (15)
where e∆ is the effective displacement of the craft and
L1 and L2 are the lift contributions from the forward and
aft lifting foils.
Once the craft becomes fully foil-borne ( 0=∆ e ), L1
and L2 must satisfy an additional criteria; that there is no
net pitching moment.
WLL =+ 21 (16)
*2211 zfxLxL y=− (17)

where *z is the vertical distance between the centre of
effort of drive forces and the centre of effort of resistive
forces.
These two simultaneous equations are solved for L1 and
L2 in order to explicitly define L1 and L2 for the fully foil
borne case. From this CL1 and CL2 are determined. This
approach is analogous to physical adjustment of the foil
trim tabs (which is done automatically by the wand
sensor) and relies on the assumption that these balances
are achieved solely by the control systems applied to the
foils. Implicitly the fore-aft position of the helms-person
is assumed to be fixed and constant so that the centre of
gravity of the craft does not change position.
The hydrodynamic drag components that are included in
the model are the following: Hull residuary and viscous
resistance (when 0>∆ e ), daggerboard spray drag
(when 0=∆ e ), rudder spray drag, daggerboard
induced drag, daggerboard and rudder profile drag, foil 1
and foil 2 induced, profile and wavemaking drag and
end-plate profile drag (if end plates are fitted.)
2.4.2 Hull Resistance
Hull residuary resistance is calculated based upon the
DELFT regression formula [8] using the effective
displacement as the scaling parameter to determine the
resistance at a given speed and flying condition.
It is assumed that the residuary resistance varies only as a
function of effective displacement, i.e. that the
underwater shape of the hull does not change
significantly as the effective displacement varies.
The typical hard box shape of a Moth hull means that the
shape of the submerged portion of the hull does not
change significantly with changes in heave which is a
feature that supports this approach.
Hull viscous resistance is calculated using the ITTC ‘57
skin friction correlation line and a form factor. The
scaling factor is the effective wetted surface area which
is calculated based on the change in heave necessary to
account for the required effective displacement.
2.4.3 Daggerboard Induced Drag
The lift coefficient of the daggerboard is determined by
non-dimensionalising the sailing side force, fX, with
respect to the daggerboard wetted area and the ship
speed. The wetted area refers to the area of the
daggerboard that is below the free-surface. This
necessarily reduces when foiling.
In reality the flying height is determined by the control
system but in the VPP it is specified by the user. This
value is used to determine the span of the daggerboard
and rudder remaining below the free surface.
The induced drag of the daggerboard is modelled using
the same approach as for the sail (6), but modifying (7),
to:
GAk
π21
= (18)
where a factor of 0.5 accounts for the hull (or free surface
when foiling) and lifting foil acting as efficient end plates
for the daggerboard [4].
2.4.4 Foil Profile Drag
The calculation of profile drag is the same whether
applied to daggerboard, rudder, forward foil, aft foil or
end-plates. The skin friction correlation line is used to
calculate the skin friction coefficient based on Reynolds
number using the mean chord length of the foil as the
representative length (3) and (4).
The coefficient of profile drag is calculated as in Hoerner
[4, 9] and uses a form factor (Claughton et al. [10]) to
allow for the effect of pressure form drag.
4)(6021)1(c
t
c
tk ++=+ (19)
fD CkCp
)1(2 += (20)
The profile drag is then calculated by dimensionalising
with respect to the wetted area, S, of the foil and the
dynamic head.
2
2
1swaterDp SvCD
pρ= (21)
The wetted area is modified according to the effective
draught of the craft; continuously in the case of the
transom hung rudder, and only once fully foil borne in
the case of the daggerboard which extends from the
underside of the hull.
2.4.5 Foil Induced Drag
The main aim of the VPP is to enable detailed
investigation of how variations in foil design affect
performance. The drag model for the hydrofoils is
therefore more detailed than for the daggerboard, rudder
or hull. In particular the induced drag model for the
hydrofoils incorporates the effects of taper ratio and end
plates (sometimes termed ‘winglets’) that affect the
effective aspect ratio of the foil. The induced drag is
calculated as previously:
2
LD kCCi= (22)
But in this case k is defined using a series of constants to
more accurately reflect the changes in effective aspect

ratio of the foil due to the distribution of lift. This is an
amalgamation and modification of the results presented
in Hoerner [4].
( )g
g
ARAR
k 21 11
κκπ
+= (23)
The constant 1κ reflects the efficiency of the end-plates
[4] and is given by:
b
h21
11
+=κ (24)
According to Hoerner [4] the driver of end-plate
efficiency is their area. The end-plates are assumed to be
optimally shaped and positioned, and the end-plate is
therefore defined solely by its height. The optimal end-
plate planform appears to be elliptical with the root chord
of the end plate equal to the tip chord of the foil.
The constant 2κ has the effect of modifying the effective
aspect ratio of the foil in accordance with its planform.
Thus as the planform approaches an elliptical shape, the
effective aspect ratio is maximised. The formula
for 2κ is based on the taper ratio of the foil since it is
assumed that, for convenience of manufacture, foils are
designed with straight, or near-straight, edges. The data
for variation of 2κ comes from testing carried out by
Hoerner [4, 9] on foils with different taper ratios.
Regression fitting gives the equation of this relationship
in terms of the ratio of tip chord to root chord:
0122.00725.01758.0
1678.00624.0
2
34
2
+
−
+
−
=
r
t
r
t
r
t
r
t
c
c
c
c
c
c
c
cκ
(25)
2.4.6 Foil Spray Drag
When foiling both the rudder and daggerboard are
surface piercing struts and as a consequence both
experience a drag due to the formation of spray. When
not ‘foiling’ the rudder is still a surface piercing strut as
it is hung from a gantry some distance behind the
transom of the craft. Therefore the hydrodynamic force
model always includes the component of spray drag due
to the rudder, and does the same for the daggerboard only
when fully foil-borne.
This is calculated using a formula due to Chapman [11]
that modifies a formula of Hoerner [4] and is based on
the thickness – chord ratio.
+=c
tCDspray 013.0009.0 (26)
DspraySSpray CtcvD ρ2
2
1= (27)
2.4.7 Foil Wavemaking Resistance
The lifting foil in proximity to the free surface creates a
wavemaking effect that carries energy away from the
craft in the wave train, and this is manifest as an
additional drag component known as wavemaking drag.
Although it is claimed by Martin [12] and Chen [13] that
hydrofoil wavemaking resistance is negligible in
comparison with the profile and induced drag, it is
relatively easy to calculate analytically the form of the
wavemaking drag coefficient and foil wavemaking
resistance is therefore included in the model for
completeness. The coefficient of wavemaking drag can
be shown to be related to the wave number, chord length
and depth of submersion as follows [14]:
hk
LW ecCkC 022
02
1 −= (28)
with wavenumber 20
U
gk = (29)
Tip loss drag, associated with the acceleration of flow
across the tip of a foil, and junction drag, associated with
the interaction of boundary layers at intersecting sections
are considered negligible in this model. Added
resistance due to waves is also neglected on the basis that
waves are associated with wind and in conditions that
generate significant waves the craft will almost certainly
be fully foil-borne. Modern hydrofoil Moths will
typically be fully foil-borne in 5 knots of true wind and
above.
3 DISCUSSION OF MODELLING APPROACH
AND LIMITATIONS
3.1 Modelling Assumptions
The major simplifications that have been made in the
model are:
� The use of the Delft regression formula for hull
residuary resistance and the assumption that the
change in displacement occurring as the foils
generate lift can be modelled simply as a change
in heave with negligible impact on waterline
beam or length.
� That the position of the centre of effort of sail
force is constant (unaffected by twist.)
� Sailing sideforce is generated solely by the
daggerboard, and not the hull or rudder.
� No interaction between windage components
and that the total windage is equal to the sum of
the constituent parts.
Use of the Delft series for residuary resistance is a
modelling assumption that is weakest just prior to take-
off when the underwater shape of the hull has its greatest
distortion from the modelled shape. However, at this
speed the effective displacement is very small and the
residuary resistance is an almost negligible component of
the drag.
The centre of effort of sail force is relatively constant
until the craft becomes overpowered at which point
increasing amounts of luff tension help the leech of the
sail to open and ‘twist off’ thereby reducing the height of
the centre of effort. This effect becomes significant in
true wind speeds of approximately 18 knots, but in these
conditions boat handling is a more significant factor in
speed around the course in comparison to foil design.
This wind speed is therefore viewed as an approximate
upper limit when considering foil design.
3.2 Model Limitations
Technique aspects of sailing the International Moth that
are not captured by the VPP include the tendency to heel
the boat to windward when foiling upwind (known
colloquially as ‘Veal heel’), the fore-aft movement of
body weight with changes in speed and apparent wind
angle, and techniques such as pumping and ‘hotting up’
to overcome the drag hump associated with foiling.
3.2.1 Veal heel
Named after the proponent of the technique and multiple
foiling Moth world champion, Rohan Veal, ‘Veal heel’
gives the sailor a greater ability to respond to gusts and
lulls, but also has important consequences for the VPP:
� The weight of hull and rig contribute to the
righting moment,
� Windward heel causes the lifting foil to share
some of the sailing side force, and
� There is a component of sail force acting
vertically upwards that contributes to the lifting
force from the foils.
The increase in available righting moment due to the
positive contribution of the weight of the craft could be
up to 10%, based on the lengths and weights
recommended for use above and a windward heel angle
of 20 degrees. This is probably the most significant
effect neglected in the model.
The influence of Veal heel on the re-distribution of
sailing side-force between the daggerboard and the lifting
hydrofoils has not been investigated but it is likely that
the effect will be small for small changes in roll angle:
The induced drag of the daggerboard will reduce with
increasing windward roll and the induced drag of the
hydrofoils will increase. The net change in drag ought to
be negligible for small deviations from upright. This
aspect of sailing the hydrofoil Moths is a potential area
for exploration in future work.
A third important effect of sailing the boat heeled to
windward is that the sail force has an upwards
component which contributes to the lift from the
hydrofoils and thus reduces the induced drag. The
complementary effect is that the component of sail force
in the drive direction is also reduced, and so it is assumed
that for small changes in roll angle the change in net
force is negligible.
3.2.2 Fore-aft movement of Ballast
An important aspect of sailing these craft that is not
modelled are the fore- and aft- movements made by the
sailor to adjust the LCG of the craft in order to achieve
the moment balance described in (17). Using the VPP,
the position of the LCG of the craft may be varied
through a series of cases to examine the effects on
performance through the speed range, however it is
proposed that this process is incorporated into the VPP
automatically so that the optimal position for the sailor
(within pre-defined limits) is identified at each time step.
The effect of neglecting variations in the position of the
LCG will be most significant at around take-off speed
because if not well balanced one foil will still be at max
CL while the other is trimmed back to satisfy the pitch
moment condition.
3.2.3 Pumping and ‘Hotting up’
There is a drag hump associated with hydrofoil sailing
which occurs near take-off speed. At this speed the hull
still contributes to the hydrodynamic resistance and is
approaching maximum wavemaking resistance, and the
foils are at maximum trim to attain maximum lift, which
results in large components of induced drag. Once the
craft speed increases enough that the craft becomes fully
foil-borne, the hull drag disappears and the foils are
trimmed back in proportion to the square of the velocity.
This reduces the induced drag on the foils, while at the
same time the apparent wind speed experienced by the
craft increases, giving rise to higher sail forces. Sailors
have therefore evolved techniques to help them
overcome this drag hump whenever possible and these
include pumping and ‘footing off’ or ‘hotting up’.
‘Pumping’ is a technique of rapidly trimming and
releasing the sail in order to generate higher sail force
than can be achieved in a steady state.
‘Pumping’ is not modelled in the VPP but is worth
bearing in mind when comparing predicted and measured
results, particularly at speeds near to take-off speed.
‘Footing off’ is the term given to the act of bearing-away
from a close hauled course to increase the drive
component of sail force. This is used by Moth sailors to
overcome the drag hump and they are then able to
resume their original windward course (‘luff up’) once
fully foil borne. ‘Hotting up’ is the analogous process
applied when running downwind.
In both cases the craft attains a state that could not have
been attained without the course alteration. These
techniques are relevant in cases where the craft will foil
at some true wind angles but not at others for a given true
wind speed. Initially, modelling these techniques is not a
primary concern for foil designers, but as the ability of
sailors to utilise these techniques increases and the
differences between different foil configurations
becomes more subtle, these effects will become
increasingly important considerations in foil design.
4 IMPLEMENTATION
The VPP algorithm is implemented in Visual Basic and
uses Microsoft Excel to supply user-interaction and to
output and store results.
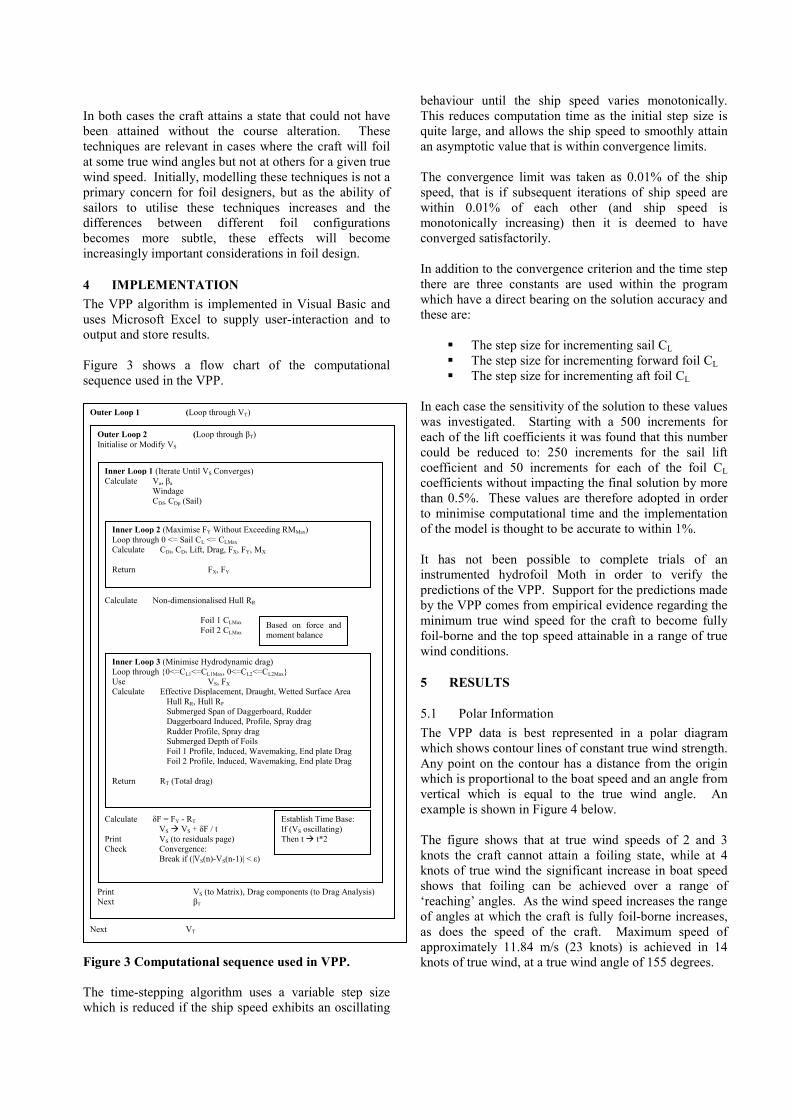
Figure 3 shows a flow chart of the computational
sequence used in the VPP.
Figure 3 Computational sequence used in VPP.
The time-stepping algorithm uses a variable step size
which is reduced if the ship speed exhibits an oscillating
behaviour until the ship speed varies monotonically.
This reduces computation time as the initial step size is
quite large, and allows the ship speed to smoothly attain
an asymptotic value that is within convergence limits.
The convergence limit was taken as 0.01% of the ship
speed, that is if subsequent iterations of ship speed are
within 0.01% of each other (and ship speed is
monotonically increasing) then it is deemed to have
converged satisfactorily.
In addition to the convergence criterion and the time step
there are three constants are used within the program
which have a direct bearing on the solution accuracy and
these are:
� The step size for incrementing sail CL
� The step size for incrementing forward foil CL
� The step size for incrementing aft foil CL
In each case the sensitivity of the solution to these values
was investigated. Starting with a 500 increments for
each of the lift coefficients it was found that this number
could be reduced to: 250 increments for the sail lift
coefficient and 50 increments for each of the foil CL
coefficients without impacting the final solution by more
than 0.5%. These values are therefore adopted in order
to minimise computational time and the implementation
of the model is thought to be accurate to within 1%.
It has not been possible to complete trials of an
instrumented hydrofoil Moth in order to verify the
predictions of the VPP. Support for the predictions made
by the VPP comes from empirical evidence regarding the
minimum true wind speed for the craft to become fully
foil-borne and the top speed attainable in a range of true
wind conditions.
5 RESULTS
5.1 Polar Information
The VPP data is best represented in a polar diagram
which shows contour lines of constant true wind strength.
Any point on the contour has a distance from the origin
which is proportional to the boat speed and an angle from
vertical which is equal to the true wind angle. An
example is shown in Figure 4 below.
The figure shows that at true wind speeds of 2 and 3
knots the craft cannot attain a foiling state, while at 4
knots of true wind the significant increase in boat speed
shows that foiling can be achieved over a range of
‘reaching’ angles. As the wind speed increases the range
of angles at which the craft is fully foil-borne increases,
as does the speed of the craft. Maximum speed of
approximately 11.84 m/s (23 knots) is achieved in 14
knots of true wind, at a true wind angle of 155 degrees.
Outer Loop 1 (Loop through VT)
Next VT
Outer Loop 2 (Loop through βT)
Initialise or Modify VS
Print VS (to Matrix), Drag components (to Drag Analysis)
Next βT
Inner Loop 1 (Iterate Until VS Converges)
Calculate Va, βa
Windage
CDf, CDp (Sail)
Calculate Non-dimensionalised Hull RR
Foil 1 CLMax
Foil 2 CLMax
Calculate δF = FY - RT
VS � VS + δF / t
Print VS (to residuals page)
Check Convergence:
Break if (|VS(n)-VS(n-1)| < ε)
Inner Loop 2 (Maximise FY Without Exceeding RMMax)
Loop through 0 <= Sail CL <= CLMax
Calculate CDi, CD, Lift, Drag, FX, FY, MX
Return FX, FY
Inner Loop 3 (Minimise Hydrodynamic drag)
Loop through {0<=CL1<=CL1Max, 0<=CL2<=CL2Max}
Use VS, FX
Calculate Effective Displacement, Draught, Wetted Surface Area
Hull RR, Hull RF
Submerged Span of Daggerboard, Rudder
Daggerboard Induced, Profile, Spray drag
Rudder Profile, Spray drag
Submerged Depth of Foils
Foil 1 Profile, Induced, Wavemaking, End plate Drag
Foil 2 Profile, Induced, Wavemaking, End plate Drag
Return RT (Total drag)
Based on force and
moment balance
Establish Time Base:
If (VS oscillating)
Then t � t*2

5.2 Drag Analysis
An analysis can be made of the magnitude of each drag
component by taking “snapshots” of the resistance
components at a variety of true wind conditions and
hence a range of ship speeds. The aim of this feature is
to give the designer insight into the effect that parameter
selection is having on total drag and target strategies at
improving this.
It was necessary to take ‘snapshots’ of the drag
components from the polar information (as opposed to
simply prescribing the craft speed and calculating the
magnitude of each component) in order to capture the
influence of sailing side force on daggerboard induced
drag and attain the correct balance of lift forces from the
hydrofoils. An example of the drag analysis can be seen
in Figure 6.
In order to avoid the contribution due to windage,
snapshots were taken at every true wind speed and at
apparent wind angles as close to 90 degrees as possible.
Nevertheless it can be seen that there is some
contribution from windage in some of the ‘snapshots’. In
Figure 6 this is most noticeable at the highest speed when
the apparent wind is marginally aft of the beam and a
component of windage acts in the drive direction.
The drag analysis is discussed in more detail in the next
section in context of comparison between two different
foil set-ups.
5.3 Race analysis
The polar data from the VPP is used to make
comparative assessments of craft performance around a
race course. In this simulation the race course is
assumed to be a windward – leeward course consisting of
2 full laps and a final windward leg to the finish.
It is assumed that boats are sailed at their optimum
velocity made good (VMG) towards the next mark. By
resolving the polar information into a Cartesian
coordinate system, the upwind VMG in a given true wind
strength is the maxima of the contour and the downwind
VMG is the minima of the contour. The wind is assumed
to be steady and the boats spend equal time on each tack
as they progress both upwind and downwind.
It is then possible to compare the relative strengths and
weaknesses of different foil configurations across the
range of true wind conditions both upwind, downwind
and in total around the race course.
The ‘better’ design may be determined using the
technique of Oliver et al. [15] whereby if the win-margin
line crosses the equilibrium point only once, at vT = vT*
(so that one yacht would win in true wind conditions of
vT < vT*, while the other would win if vT > vT
*), the better
design is the design that would win in the expected
average wind condition for the regatta. See Figure 8 for
an example of a win-loss graph.
It has been found for the hydrofoiling Moths that there
are frequently cases in which the win-margin line crosses
the equilibrium line twice. In this case the same
configuration may prove to be slow in light airs and in
heavy airs, but fast in medium conditions. The
philosophy of Oliver et al. [15] still seems like a sensible
one, but requires care in its application.
6 CASE STUDIES
The use of the VPP, drag inspection and race analysis as
a design tool is illustrated by some examples. Example 1
examines the effect of changing the span of the forward
foil, while keeping all other parameters the same.
6.1 Example 1: Effect of Changing the Span of the
Forward Foil
Figure 4 Polar diagram for hydrofoil moth with
forward foil of span 1.2m
Figure 5 Polar diagram for hydrofoil Moth with
forward foil span of 0.85m
Wind Speed
[knots]
-12
-11
-10
-9
-8
-7
-6
-5
-4
-3
-2
-1
0
1
2
3
4
5
0 1 2 3 4 5 6 7 8 9 10 2
3
4
6
8
10
12
14
Wind Speed
[knots]
Polar Diagram for Hydrofoil Moth from VPP
-12
-11
-10
-9
-8
-7
-6
-5
-4
-3
-2
-1
0
1
2
3
4
5
0 1 2 3 4 5 6 7 8 9 10 2
3
4
6
8
10
12
14
Drag Analysis of hydrofoil moth
-50
0
50
100
150
200
250
300
350
1.386643958 2.052583441 2.256903966 5.143427142 6.807201064 8.772545722 10.57477044 11.56343996
Speed m/s
Resistance N
F2 Rw
F1 Rw
W
F2e Df
F2 Dp
F2 Di
F1e Df
F1 Dp
F1 Di
R Dspray
R Dp
D Dspray
D Dp
D Di
H Rf
H Rr
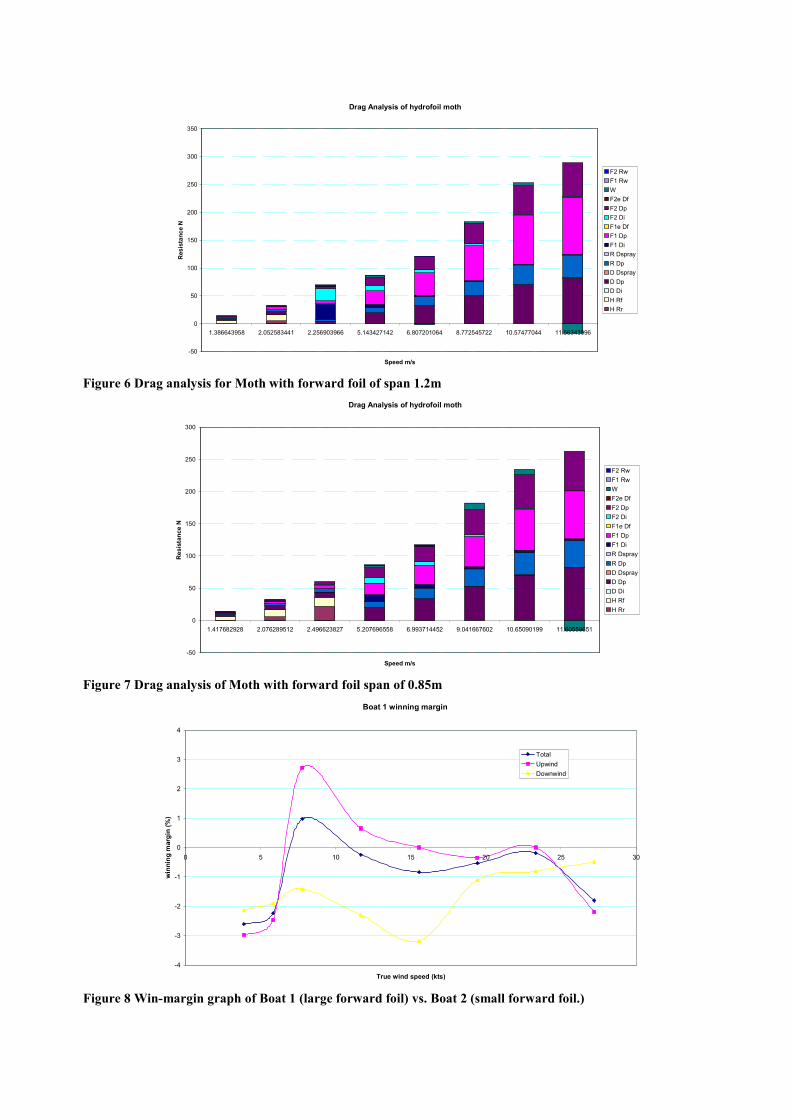
Figure 6 Drag analysis for Moth with forward foil of span 1.2m
Drag Analysis of hydrofoil moth
-50
0
50
100
150
200
250
300
1.417682928 2.076289512 2.496623827 5.207696558 6.993714452 9.041667602 10.65090199 11.60559651
Speed m/s
Resistance N
F2 Rw
F1 Rw
W
F2e Df
F2 Dp
F2 Di
F1e Df
F1 Dp
F1 Di
R Dspray
R Dp
D Dspray
D Dp
D Di
H Rf
H Rr
Figure 7 Drag analysis of Moth with forward foil span of 0.85m
Boat 1 winning margin
-4
-3
-2
-1
0
1
2
3
4
0 5 10 15 20 25 30
True wind speed (kts)
winning margin (%)
Total
Upwind
Downwind
Figure 8 Win-margin graph of Boat 1 (large forward foil) vs. Boat 2 (small forward foil.)

Figure 4 and Figure 5 show the polar diagrams for two
identical Moths differing only in the span of the forward
foil. In the first instance the Moth has a forward foil
span of 1.2m, while in the second the span is reduced to
0.85m. The polar diagrams show that the Moth with the
larger forward foil is able to become foil-borne sooner
than the other configuration as indicated by the larger
regions of high speed at the true wind speed of 4m/s.
Other than this, it is hard to make any other observations
from the polar diagrams.
Figure 6 and Figure 7 shows the drag analysis as
performed at apparent wind angles close to 90 degrees to
avoid as much as possible any contribution from
windage. Figure 6 is the drag analysis for the Moth with
a forward foil span of 1.2m. It can be seen that although
the total drag at speeds of just over 2 m/s is reduced due
to reduced hull resistance, there is a large increase in
drag at the higher speeds due to the large amount of
profile drag on foil 1. In addition the requirement to
satisfy the condition of zero-net trimming moment when
foil borne means that the aft foil is trimmed to its
maximum lift coefficient at a relatively low speed,
resulting in a high component of induced drag early on.
Upon inspection of the win-margin graph from the race
analysis (Figure 8), it can be seen that the configuration
using the forward foil with the largest span (Boat 1)
under-performs in conditions other than medium-light
winds of between 7 and 11 knots true. Boat 2, using the
foil with reduced area, performs better over a wider
range of conditions, particularly at around 15 knots of
true wind speed. Figure 7 shows the drag analysis of this
craft, from which it can be seen that the gain around the
course is probably due to the reduction in profile drag on
the forward foil.
6.2 Example 2: Effects of End-Plates
End-plates reduce induced drag while increasing skin
friction. In this example we examine the costs and
payoffs of adding end-plates to the standard foil
configuration. Boat 1 utilises end plates of height 0.1m
on both the fore- and aft- foils, and Boat 2 without end-
plates. Both are otherwise identical.
This example begins with an analysis of the win-margin
graph from the race-simulation (Figure 9.)
Boat 1 winning margin
-5
0
5
10
15
20
25
0 5 10 15 20 25 30
True wind speed (kts)
winning margin (%)
Total
Upwind
Downwind
Figure 9 Win-margin graph of Boat 1 (with end
plates) vs. Boat 2 (without.)
The race analysis shows that the configuration without
end-plates performs very slightly better around the race
track in wind speeds of less than about 6 knots and more
than about 12 knots.
In the light winds (less than 6 knots), the craft cannot
become fully foil borne and so the foils have been
feathered in order to remove the components of induced
drag. In this case the end-plates have no positive effect
on performance but the added surface area increases the
total resistance. This can be seen in Figure 10, showing
the drag analysis of this craft, which should be compared
with Figure 7, the drag analysis of the craft without end-
plates.
At the point at which the craft becomes fully foil-borne,
the foils are at maximum angle of attack and lift
coefficient and the component of induced drag becomes
very large (compare Figure 7 with Figure 10 at boat
speeds of around 5m/s.) In this case the end-plates play a
vital role by increasing the effective aspect ratio of the
foil and consequently reducing the induced drag
component. The overall effect is a leap in performance
such that the craft with end-plates beats the craft without
by a margin of around 10% in winds of 8 knots.
As the craft speed progressively increases with
increasing true wind speed, the lift coefficients of the
foils begin to reduce (the flaps are progressively
feathered back towards the zero angle of attack position),
and the corresponding component of induced drag
reduces. At the same time the skin-friction of the end
plates is becoming more significant (Figure 10.) The
beneficial effect of the end-plates is therefore reduced
and this is reflected in the slight reduction in
performance in true wind speeds above 12 knots.

Drag Analysis of hydrofoil moth
-50
0
50
100
150
200
250
300
1.396380411 2.061371403 2.49722172 5.181160664 6.873378166 8.86225207 10.60085275 11.57890132
Speed m/s
Resistance N
F2 Rw
F1 Rw
W
F2e Df
F2 Dp
F2 Di
F1e Df
F1 Dp
F1 Di
R Dspray
R Dp
D Dspray
D Dp
D Di
H Rf
H Rr
Figure 10 Drag analysis of Moth with end-plates of
height 0.1m
6.3 Example 3: Changes to Foil Geometry
In the final example tapered foils are introduced by
reducing the chord of the foils at their tips.
In addition the area of the forward foil is reduced by
reducing the span and the mean chord (thus maintaining
constant aspect ratio.) The motivation for doing this
comes from the drag breakdown of the original
configuration (Figure 7) which shows that the component
of induced drag is small relative to the component of
profile drag.
The results of example 2 suggest that end-plates give
good performance benefits in some regions without
having a particularly detrimental effect elsewhere. The
final hypothetical modification is therefore the addition
of end plates of height 0.1m on both the fore- and aft-
foils to reduce induced drag in the mid-range speeds.
Figure 11 shows the drag analysis of the modified set-up.
It can be seen that the induced drag components of both
the fore- and aft- foils have dropped significantly. As a
result of the decreased foil area the craft does not become
fully foil borne until slightly later, exhibiting a clear drag
hump at a speed of around 2.7 m/s. Drag Analysis of hydrofoil moth
-50
0
50
100
150
200
250
1.439847199 2.095816327 2.657290875 4.975680201 7.254638773 9.041667602 10.57853549 11.64210781
Speed m/s
Resistance N
F2 Rw
F1 Rw
W
F2e Df
F2 Dp
F2 Di
F1e Df
F1 Dp
F1 Di
R Dspray
R Dp
D Dspray
D Dp
D Di
H Rf
H Rr
Figure 11 Drag analysis of Moth using modified full
force foil set-up
The win-margin graph of the craft using the modified
configuration (Boat 1) racing against the existing
configuration (Figure 12) shows that the modified
configuration performs better across the range of true
wind speeds, achieving a winning margin of up to 8% in
winds of around 8 knots. The configuration is
particularly effective upwind as can be seen from the
graph. Boat 1 winning margin
0
2
4
6
8
10
12
0 5 10 15 20 25 30
True wind speed (kts)
winning margin (%)
Total
Upwind
Downwind
Figure 12 Win-margin graph of Boat 1 (modified foil
set-up) vs. Boat 2 (standard set-up.)
7 DISCUSSION
The major target areas for improvements to the program
follow from the limitations identified earlier:
� To include the effect of pumping by temporarily
‘borrowing’ sail force for a short time and
seeing if the resulting craft speed is
maintainable (apply a small positive disturbance
and check to see if a new stable solution
occurs.)
� To include ‘footing off’ and ‘hotting up’ to get
foiling by starting from a foiling condition and
moving towards the non-foiling condition while
checking for stability in the solution.
� To include fore-aft movement of ballast.
� To include the effects of windward heel.
In addition to these modifications some feedback from
the sailors regarding the boat set-up for light winds will
be incorporated into future versions of the VPP. In the
VPP as used in this paper the foils may be ‘feathered’ to
have minimum CL if this is the condition that minimises
total hydrodynamic resistance. This occurs in very light
winds when the craft moves very slowly and the cost (in
terms of induced drag) of high CL is not worth the benefit
of the lift generated to raise the hull. In reality the sailors
are not able to ‘feather’ their forward foil in this way and
so this behaviour should be constrained in the model.
Recent foil designs have removed the trailing edge flap
from the aft foil, opting instead to change the angle of
attack of the entire foil, usually by pivoting the rudder in
pitch on the rudder gantry. This means that the aft foil is
often set prior to sailing in a given wind condition
perhaps being adjusted (at most) between upwind and
downwind legs of the course. Control is achieved solely
through flap adjustment on the forward foil and the fore-
and aft- movement of body weight. This is the final
behaviour that would be incorporated into an upgraded
model.

8 CONCLUSIONS
The case studies give an indication of how the VPP may
be used as a tool to aid the designer when making
decisions regarding the foil configuration. Further
application of the VPP would be to evaluate candidates
in optimisation studies using parametric variations or
genetic algorithms. The final application of such a tool is
as a coaching aid to help the sailor understand in what
regions VMG occurs upwind and downwind and to
investigate the effects of different fore-aft body positions
on foil set-up and performance.
In the two and half years that have elapsed since this
research work was initially carried out, International
Moths, and in particularly their foils, have evolved a
great deal. Each iteration of foil design has increased
aspect ratio by increasing span and decreasing chord.
Foils have gone from being purely rectangular to first
tapered and now entirely elliptical in profile. In the
interim gains were made by fitting end-plates but these
are again redundant on elliptical profile, high aspect
modern foils. It is pleasing that this evolution in foil
shapes supports (empirically at least) the indications
from the VPP.
9 REFERENCES
[1] Johnston, ‘Historical Perspective’, 1975.
[2] Chapman, E. J. C. and Chapman G. C., ‘The Design
and Development of a 4.9m Hydrofoil Catamaran’,
2nd
Australian Sailing Conference, Hobart, 1999.
[3] Photo: James Boyd www.thedailysail.com Published
27/04/08
[4] Hoerner, S. F., ‘Fluid Dynamic Drag’, Hoerner,
1965.
[5] Abbot, I. H. and von Doenhoff, A. E., Theory of
Wing Sections, Dover Press, 1959.
[6] Marchaj, C. A., ‘Aero-hydrodynamics of Sailing’,
Granade, 1979.
[7] Molland, A. F. and Turnock, S. R., Marine Rudders
and Control Surfaces, Butterworth Heinnemann,
2007.
[8] Gerritsma, J., Keuning, J. A. and Onnink, R.,
‘Geometry, Resistance and Stability of the Delft
Systematic Yacht Hull Series’, Proceedings of the 5th
HISWA Symposium, Amsterdam, 1981.
[9] Hoerner, S. F., ‘Fluid Dynamic Lift’, Hoerner, 1975.
[10] Claughton, A. R., Shenoi, A. and Wellicome, J. F.,
‘Sailing Yacht Design – Theory’, Addison Wesley
Longman, 1998.
[11] Chapman, R. B., ‘Spray Drag of Surface Piercing
Struts’, 1972 AIAA/SNAME/USN Advanced
Marine Vehicles Meeting: Annapolis, MD, July 17-
19, 1972.
[12] Martin, M. ‘The Stability Derivatives of a Hydrofoil
Boat’, Hydronautics Incorporated, Technical Report
001-10, 1963.
[13] Chen, ‘Optimum Wing-Strut Systems for High
Speed Operation Near a Free Surface’, 1960.
[14] Wellicome, J. F., ‘Advanced Marine Vehicles;
Hydrofoils’, University of Southampton Ship
Science Lecture Notes Series, 1998.
[15] Oliver, J. C., Letcher, J. S. J. R. and Salvesen, N.,
‘Performance Predictions for Stars and Stripes’,
Transactions of SNAME, NY, 1987.
10 AUTHOR’S BIOGRAPHIES
Matt Findlay is an Engineering Doctorate student at the
Fluid Structure Interactions Research Group at the
School of Engineering Sciences, University of
Southampton. His research interests include yacht aero-
and hydrodynamics and engineering applications in high
performance sport.
Stephen Turnock is a senior lecturer in the School of
Engineering Sciences at the University of Southampton.
His research interests are in the area of maritime fluid
dynamics and its application to marine energy,
underwater vehicles and performance sports engineering.