development and use of greet 1.6 fuel-cycle … designed the greet graphic user interface features...
TRANSCRIPT
ANL/ESD/TM-163
Development and Use of GREET 1.6 Fuel-Cycle Model for Transportation Fuels and Vehicle Technologies
Center for Transportation Research Argonne National Laboratory Operated by The University of Chicago, under Contract W-31-109-Eng-38, for the
United States Department of Energy
Argonne National Laboratory Argonne National Laboratory, with facilities in the states of Illinois and Idaho, is owned by the United States Government and operated by The University of Chicago under the provisions of a contract with the Department of Energy.
This technical memorandum is a product of Argonne’s Energy Systems Division. For information on the division's scientific and engineering activities, contact:
Director, Energy Systems Division Argonne National Laboratory Argonne, Illinois 60439-4815 Telephone (630) 252-3724
Presented in this technical memorandum are preliminary results of ongoing work or work that is more limited in scope and depth than that described in formal reports issued by the ES Division.
Publishing support services were provided by Argonne’s Information and Publishing Division (for more information, see IPD’s home page: http://www.ipd.anl.gov/).
Disclaimer This report was prepared as an account of work sponsored by an agency of the United States Government. Neither the United States Government nor any agency thereof, nor The University of Chicago, nor any of their employees or officers, makes any warranty, express or implied, or assumes any legal liability or responsibility for the accuracy, completeness, or usefulness of any information, apparatus, product, or process disclosed, or represents that its use would not infringe privately owned rights. Reference herein to any specific commercial product, process, or service by trade name, trademark, manufacturer, or otherwise does not necessarily constitute or imply its endorsement, recommendation, or favoring by the United States Government or any agency thereof. The views and opinions of document authors expressed herein do not necessarily state or reflect those of the United States Government or any agency thereof, Argonne National Laboratory, or The University of Chicago.
Available electronically at http://www.doe.gov/bridge Available for a processing fee to U.S. Department of Energy
and its contractors, in paper, from: U.S. Department of Energy Office of Scientific and Technical Information P.O. Box 62 Oak Ridge, TN 37831-0062 phone: (865) 576-8401 fax: (865) 576-5728 email: [email protected]
ANL/ESD/TM-163
Development and Use of GREET 1.6 Fuel-Cycle Model for Transportation Fuels and Vehicle Technologies by M.Q. Wang Center for Transportation Research, Energy Systems Division, Argonne National Laboratory, 9700 South Cass Avenue, Argonne, Illinois 60439
June 2001 Work sponsored by United States Department of Energy, Assistant Secretary for Energy Efficiency and Renewable Energy, Office of Transportation Technologies

iii
CONTENTS ACKNOWLEDGMENTS ........................................................................................................ v
NOTATION.............................................................................................................................. vii
1 INTRODUCTION .............................................................................................................. 1
2 FUEL PATHWAYS AND VEHICLE TECHNOLOGIES INCLUDED IN GREET 1.6 ............................................................................................... 4
3 SIMULATIONS OF TRANSPORTATION OF ENERGY FEEDSTOCKS AND FUELS....................................................................................................................... 8
4 STOCHASTIC SIMULATIONS IN GREET 1.6............................................................... 10
5 DEVELOPMENT OF GREET GRAPHIC USER INTERFACES.................................... 11
5.1 Introduction................................................................................................................ 11 5.2 System Requirements................................................................................................. 11 5.3 Installation.................................................................................................................. 11 5.4 Running the Program ................................................................................................. 12
6 USE OF THE GREET MODEL IN EXCEL...................................................................... 14
7 GREET MODEL STRUCTURE ........................................................................................ 16
8 GREET 1.6 RESULTS ....................................................................................................... 21
9 REFERENCES ................................................................................................................... 27
FIGURES 1 Stages Covered in GREET Fuel-Cycle Analysis................................................................ 3
2 Fuel Pathways Included in GREET 1.6 .............................................................................. 5
3 Simulations of Energy Feedstocks and Fuel Transportation .............................................. 9
iv
TABLES 1 Near- and Long-Term Vehicle/Fuel Systems Included in GREET 1.6 .............................. 6
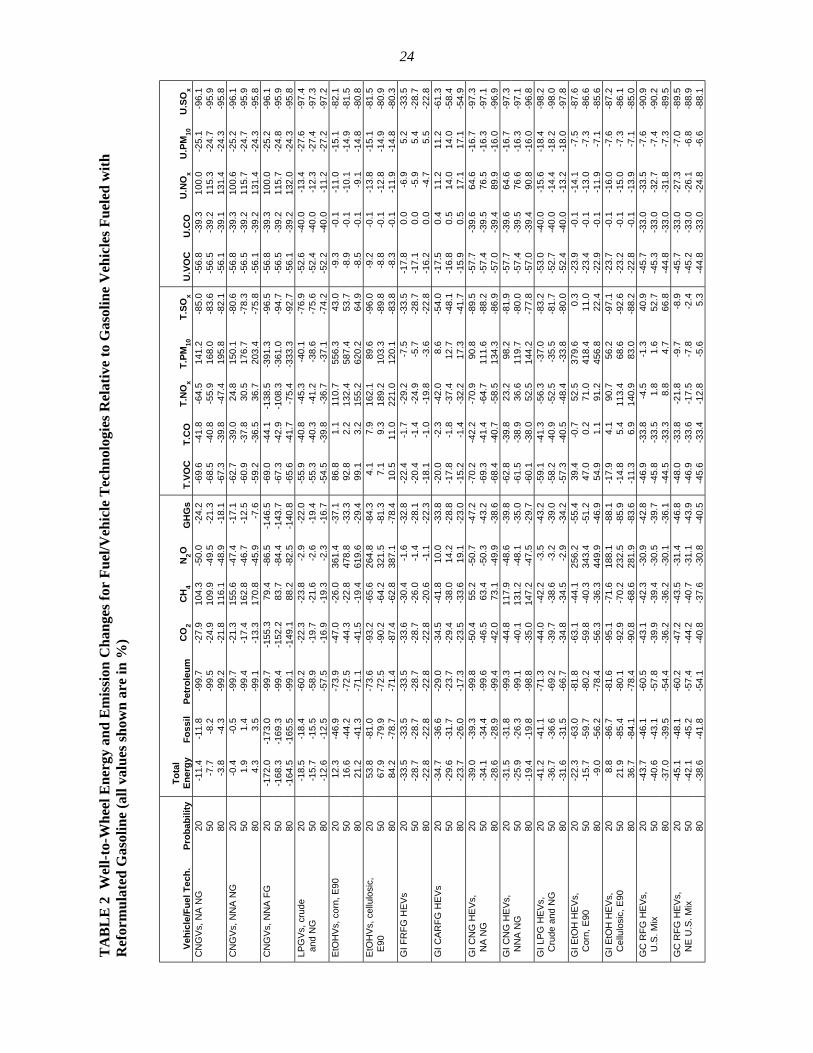
2 Well-to-Wheel Energy and Emission Changes of Fuel/Vehicle Technologies Relative to Gasoline Vehicles Fueled with Reformulated Gasoline................................... 22
v
ACKNOWLEDGMENTS
Development of the GREET model has been funded by the U.S. Department Energy, Office of Transportation Technologies (OTT), under Contract No. W-31-109-eng-38. I am grateful to Phil Patterson, David Rodgers, and Tien Nguyen of OTT for their support and guidance over the past six years.
Development of the GREET model was enhanced by two Argonne projects: one funded by the State of Illinois to evaluate the energy and emission effects of fuel ethanol and the other funded by General Motors Corporation’s Global Alternative Propulsion Center to evaluate fuels for advanced vehicle technologies.
Tony Finizza and Jim Wallace, General Motors’ consultants, suggested incorporation of Monte Carlo simulations into the GREET model to address uncertainty. John Alberts and Amgad Elgowainy of Purdue University at Calumet and Bo Lu of University of Illinois at Urbana-Champaign designed the GREET graphic user interface features for GREET 1.6. Within Argonne, Dan Santini provided critical review of and guidance for GREET development. Dongquan He helped develop the new framework of GREET 1.6. I would like to thank all these individuals for their contributions.

vi
vii
NOTATION
ACRONYMS AND ABBREVIATIONS BD biodiesel BD20 fuel mixture of 20% biodiesel and 80% conventional diesel CARFG California reformulated gasoline CD compact disk CH4 methane CIDI compression-ignition, direct-injection CNG compressed natural gas CNGV compressed natural gas vehicle CO carbon monoxide CO2 carbon dioxide DME dimethyl ether DOE U.S. Department of Energy EF emission factor EPA U.S. Environmental Protection Agency ETBE ethyl tertiary butyl ether EtOH ethanol EtOHV ethanol vehicle EV electric vehicle (battery-powered) E85 fuel mixture of 85% ethanol and 15% gasoline by volume E90 fuel mixture of 90% ethanol and 10% gasoline by volume FCV fuel-cell vehicle FFV flexible-fuel vehicle FG flared gas FRFG federal reformulated gasoline FT Fischer-Tropsch FTD Fischer-Tropsch diesel GC grid-connected (charge-depleting) G.H2 gaseous hydrogen GHG greenhouse gas GI grid-independent (charge-sustaining) GM General Motors Corporation GREET Greenhouse gases, Regulated Emissions, and Energy use in Transportation GUI graphic user interface GWP global warming potential H2 hydrogen HEV hybrid electric vehicle LDT1 light-duty truck 1 LDT2 light-duty truck 2 LF_Gas landfill gas L.H2 liquid hydrogen LNG liquefied natural gas LPG liquefied petroleum gas
viii
LPGV liquefied natural gas vehicle LS low-sulfur LT long-term MeOH methanol MTBE methyl tertiary butyl ether M85 fuel mixture of 85% methanol and 15% gasoline by volume M90 fuel mixture of 90% methanol and 10% gasoline by volume N2O nitrous oxide NA North American NE U.S. Northeast United States NG natural gas NGCC Natural gas combined cycle NNA non-North-American NOx nitrogen oxides NT near-term O2 oxygen OTT Office of Transportation Technologies PC personal computer PM10 particulate matter with a mean aerodynamic diameter of 10 um or less PTW pump to wheel RAM random access memory RFG reformulated gasoline SAE Society of Automotive Engineers SI spark-ignition SIDI spark-ignition, direct-injection SOx sulfur oxides SO2 sulfur dioxide T total T&D transportation and distribution TAME tertiary amyl methyl ether TTRDC Transportation Technology Research and Development Center U urban VOC volatile organic compound WTP well-to-pump WTW well-to-wheel UNITS OF MEASURE Btu British thermal unit(s) g gram(s) lb pound(s) MB megabyte(s) mi mile(s) mmBtu million British thermal units ppm part(s) per million µm micrometer(s)
1
DEVELOPMENT AND USE OF GREET 1.6 FUEL-CYCLE MODEL FOR TRANSPORTATION FUELS
AND VEHICLE TECHNOLOGIES
by
M.Q. Wang
1 INTRODUCTION
Since 1995, with funds from the U.S. Department of Energy’s (DOE’s) Office of Transportation Technologies (OTT), Argonne National Laboratory has been developing the Greenhouse gases, Regulated Emissions, and Energy use in Transportation (GREET) model. The model is intended to serve as an analytical tool for use by researchers and practitioners in estimating fuel-cycle energy use and emissions associated with alternative transportation fuels and advanced vehicle technologies. Argonne released the first version of the GREET model — GREET 1.0 — in June 1996. Since then, it has released a series of GREET versions with revisions, updates, and upgrades. In February 2000, the latest public version of the model — GREET 1.5a — was posted on Argonne’s Transportation Technology Research and Development Center (TTRDC) Web site (www.transportation.anl.gov/ttrdc/greet). Major publications that address GREET development include the following:
• Wang, M., 1999a, GREET 1.5 — Transportation Fuel-Cycle Model, Volume 1: Methodology, Development, Use, and Results, ANL/ESD-39, Vol. 1, Argonne National Laboratory, Argonne, Ill., Aug.
• Wang, M., 1999b, GREET 1.5 — Transportation Fuel-Cycle Model, Volume 2: Appendices of Data and Results, ANL/ESD-39, Vol. 2, Argonne National Laboratory, Argonne, Ill., Aug.
• Wang, M., and H.S. Huang, 1999, A Full Fuel-Cycle Analysis of Energy and Emissions Impacts of Transportation Fuels Produced from Natural Gas, ANL/ESD-40, Argonne National Laboratory, Argonne, Ill., Dec.
These reports document methodologies, development, key default assumptions, applications, and results of the GREET model. They are also posted, along with additional materials for the GREET model, on the TTRDC Web site.
2
For a given transportation fuel/technology combination, the GREET model separately calculates:
• Fuel-cycle energy consumption for the following three source categories:
1. Total energy (all energy sources),
2. Fossil fuels (petroleum, natural gas [NG], and coal), and
3. Petroleum.
• Fuel-cycle emissions of the following three greenhouse gases (GHGs):
1. Carbon dioxide (CO2) (with a global warming potential [GWP] of 1),
2. Methane (CH4) (with a GWP of 21), and
3. Nitrous oxide (N2O) (with a GWP of 310).
• Fuel-cycle emissions of the following five criteria pollutants (separated into total [T] and urban [U] emissions):
1. Volatile organic compounds (VOCs),
2. Carbon monoxide (CO),
3. Nitrogen oxides (NOx),
4. Particulate matter with a mean aerodynamic diameter of 10 µm or less (PM10), and
5. Sulfur oxides (SOx).
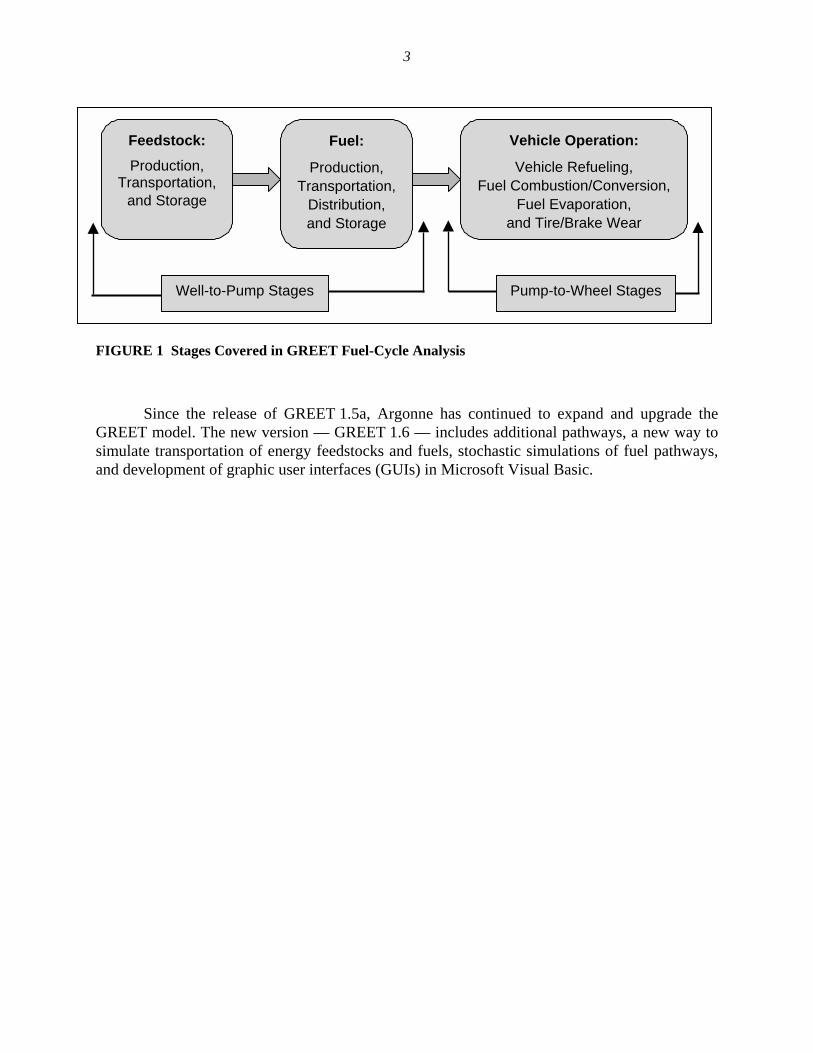
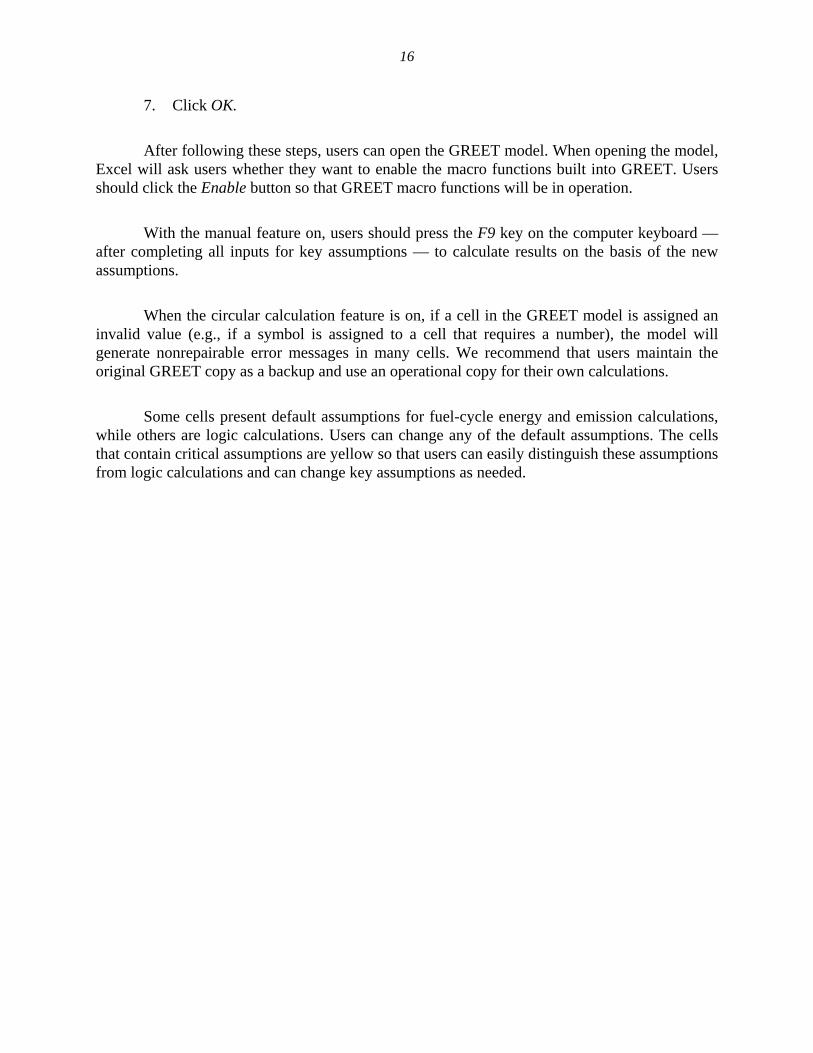
Figure 1 shows the stages and activities covered in GREET simulations of fuel cycles. A fuel-cycle analysis (also called a well-to-wheel [WTW] analysis) includes the feedstock, fuel, and vehicle operation stages. The feedstock stage and fuel stage together make up the well-to-pump (WTP), or upstream, stages. The vehicle operation stage is called the pump-to-wheel (PTW), or downstream, stage. In GREET, fuel-cycle energy and emissions results are presented separately for each of the three stages.
3
FIGURE 1 Stages Covered in GREET Fuel-Cycle Analysis
Since the release of GREET 1.5a, Argonne has continued to expand and upgrade the GREET model. The new version — GREET 1.6 — includes additional pathways, a new way to simulate transportation of energy feedstocks and fuels, stochastic simulations of fuel pathways, and development of graphic user interfaces (GUIs) in Microsoft Visual Basic.
Feedstock: Production,
Transportation, and Storage
Fuel:
Production, Transportation,
Distribution, and Storage
Vehicle Operation:
Vehicle Refueling, Fuel Combustion/Conversion,
Fuel Evaporation, and Tire/Brake Wear
Pump-to-Wheel Stages Well-to-Pump Stages

4
2 FUEL PATHWAYS AND VEHICLE TECHNOLOGIES INCLUDED IN GREET 1.6
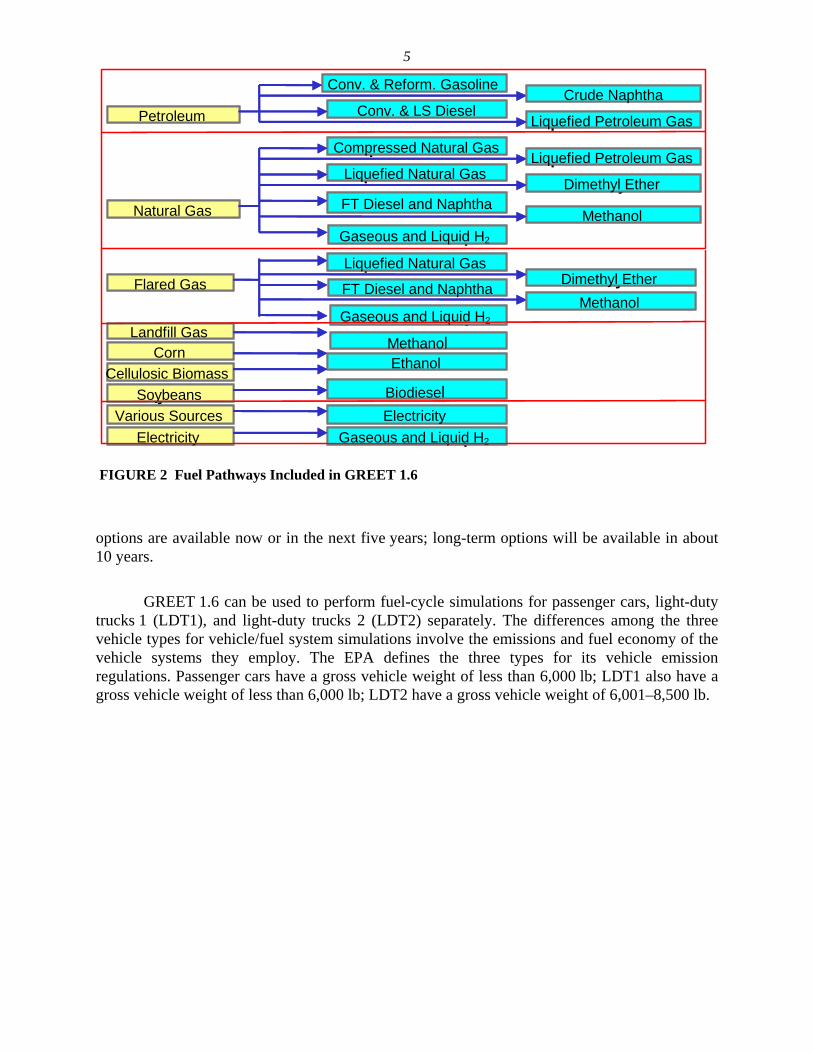
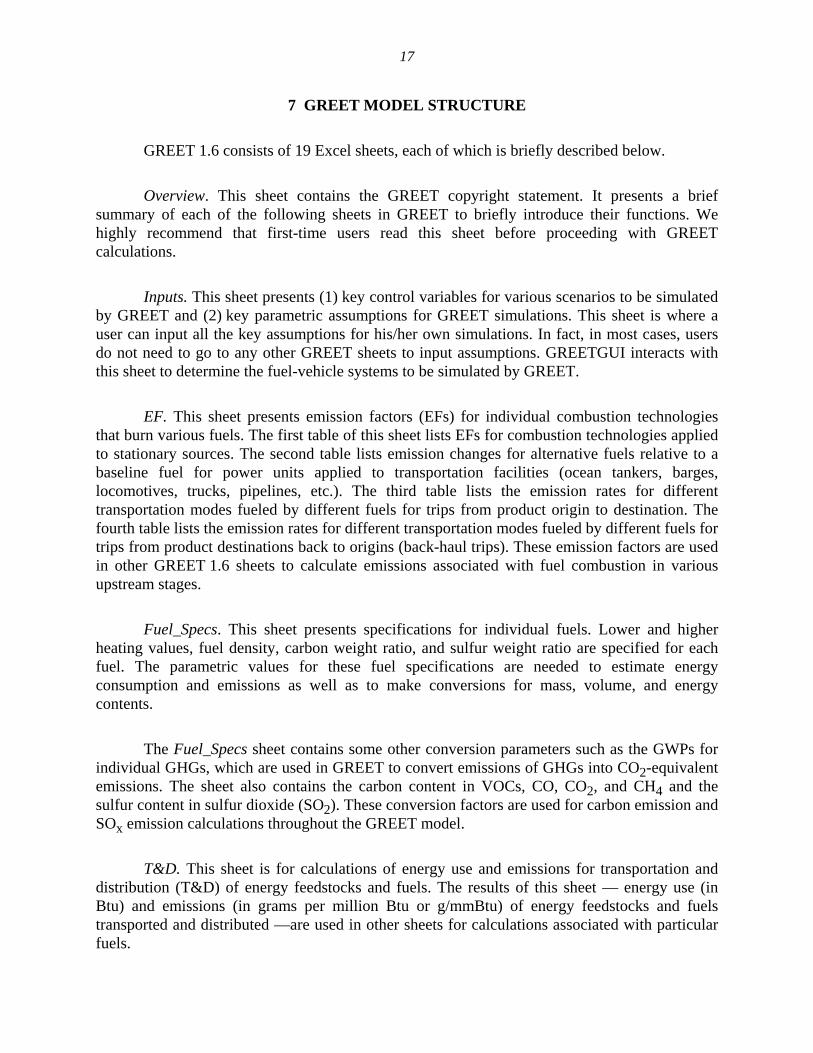
Figure 2 lists all of the fuel pathways in GREET 1.6; new pathways include petroleum to crude naphtha, NG to naphtha via the Fischer-Tropsch (FT) process, and electricity to gaseous hydrogen (G.H2) and liquid hydrogen (L.H2) via electrolysis. Electricity generation for electrolysis includes six options: U.S., California, and northeast U.S. (NE U.S.) generation mixes and hydroelectric, nuclear, and NG-fueled combined-cycle (NGCC) power plants.
For reformulated gasoline (RFG) pathways, GREET 1.6 includes California Phase 3 RFG, both with ethanol as the oxygenate and with no oxygenate. For federal RFG pathways, the model includes both the currently produced Phase 2 RFG and the new low-sulfur (LS) gasoline adopted by the U.S. Environmental Protection Agency (EPA) in its Tier 2 light-duty vehicle emission standards. Federal RFG (with a sulfur content of 30 parts per million [ppm]) can be produced with methyl tertiary butyl ether (MTBE), ethanol, or no oxygenate.
For diesel fuel pathways, GREET 1.6 includes conventional diesel and LS diesel with a sulfur content as low as 10 ppm.
For NG-based fuel pathways, GREET 1.6 can readily simulate fuel production from North American (NA) and non-North-American (NNA) gas. For NNA gas to gaseous fuel (e.g., compressed NG [CNG] and G.H2) pathways, liquefied natural gas (LNG) is produced in NNA locations and transported to North America; gaseous fuels are produced from the gasified NG and distributed to refueling stations.
For plants producing methanol, Fischer-Tropsch diesel (FTD), dimethyl ether (DME), and hydrogen, GREET 1.6 includes plant design options to produce (1) fuels only, (2) fuels and steam (for export), and (3) fuels and electricity (for export). For the second option, the energy and emission credits from cogenerated steam are estimated by using conventional steam generation with NG. For the third option, the energy and emission credits from cogenerated electricity are estimated by using conventional electricity generation with NGCC turbines.
Vehicle propulsion technologies in GREET 1.6 include the following: (1) conventional spark-ignition (SI) engines; (2) spark-ignition, direct-injection (SIDI) engines; (3) compression-ignition, direct-injection (CIDI) engines; (4) grid-independent (GI; charge-sustaining) hybrid electric vehicles (HEVs) powered by SI engines; (5) grid-connected (GC; charge-depleting) HEVs powered by SI engines; (6) GI HEVs powered by CIDI engines; (7) GC HEVs powered by CIDI engines; (8) battery-powered electric vehicles (EVs); and (9) fuel-cell vehicles (FCVs).
Table 1 lists the combinations of fuels and vehicle propulsion systems included in GREET 1.6. The model separates technology options into near- and long-term options: near-term
5
FIGURE 2 Fuel Pathways Included in GREET 1.6
options are available now or in the next five years; long-term options will be available in about 10 years.
GREET 1.6 can be used to perform fuel-cycle simulations for passenger cars, light-duty trucks 1 (LDT1), and light-duty trucks 2 (LDT2) separately. The differences among the three vehicle types for vehicle/fuel system simulations involve the emissions and fuel economy of the vehicle systems they employ. The EPA defines the three types for its vehicle emission regulations. Passenger cars have a gross vehicle weight of less than 6,000 lb; LDT1 also have a gross vehicle weight of less than 6,000 lb; LDT2 have a gross vehicle weight of 6,001–8,500 lb.
Petroleu
Conv. & Reform. Conv. & LS Liquefied Petroleum
Compressed Natural Liquefied Natural Dimethyl
MethanoFT Diesel and Natural Gaseous and Liquid
EthanoBiodiese
Corn Cellulosic
SoybeanVarious Electricit
Flared
Landfill
Crude
Liquefied Petroleum
Liquefied Natural Dimethyl FT Diesel and
MethanoGaseous and Liquid
Methano
Electricit Gaseous and Liquid
Petroleum
Conv. & Reform. Gasoline
Conv. & LS Diesel Liquefied Petroleum Gas
Compressed Natural Gas
Liquefied Natural Gas Dimethyl Ether
Methanol FT Diesel and Naphtha Natural Gas
Gaseous and Liquid H2
Ethanol
Biodiesel
Corn Cellulosic Biomass
Soybeans Various Sources Electricity
Flared Gas
Landfill Gas
Crude Naphtha
Liquefied Petroleum Gas
Liquefied Natural Gas Dimethyl Ether FT Diesel and Naphtha
Methanol Gaseous and Liquid H2
Methanol
Electricity Gaseous and Liquid H2

6
TABLE 1 Near- and Long-Term Vehicle/Fuel Systems Included in GREET 1.6a
Near-Term Options
Long-Term Options
Conventional SI engines: Conventional gasoline Federal RFG CARFG Bi-fuel CNG Dedicated CNG Dedicated LPG Flexible-fuel E85 Flexible-fuel M85 CIDI engines: Conventional diesel GI, SI engine HEVs: RFG GC, SI engine HEVs: CARFG GI, CIDI engine HEVs: Conventional diesel Battery-powered EVs
Conventional SI engines: Conventional gasoline Federal RFG CARFG Dedicated CNG Dedicated LNG Dedicated LPG Dedicated E90 Dedicated M90 SIDI engines: Conventional gasoline Federal RFG CARFG Dedicated E90 Dedicated M90 CIDI engines: LS diesel DME FTD blended with crude diesel (50 - 100% FTD) Biodiesel blended with crude diesel (20 - 50% biodiesel) GI, SI engine HEVs: Federal RFG CARFG Dedicated E90 Dedicated M90 Dedicated CNG Dedicated LNG Dedicated LPG GI, CIDI engine HEVs: LS diesel DME FTD blended with crude diesel (50 - 100% FTD) Biodiesel blended with crude diesel (20 - 50% biodiesel)
7
TABLE 1 (Cont.)
Near-Term Options
Long-Term Options
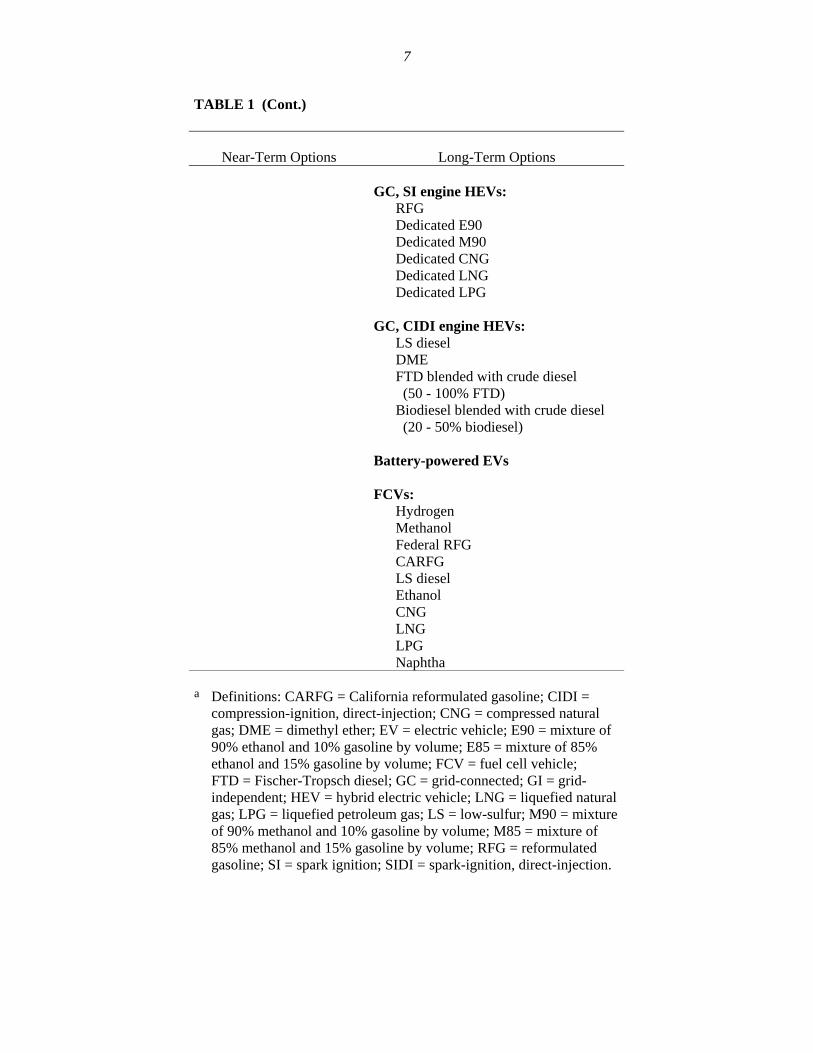
GC, SI engine HEVs: RFG Dedicated E90 Dedicated M90 Dedicated CNG Dedicated LNG Dedicated LPG GC, CIDI engine HEVs: LS diesel DME FTD blended with crude diesel (50 - 100% FTD) Biodiesel blended with crude diesel (20 - 50% biodiesel) Battery-powered EVs FCVs: Hydrogen Methanol Federal RFG CARFG LS diesel Ethanol CNG LNG LPG Naphtha
a Definitions: CARFG = California reformulated gasoline; CIDI =
compression-ignition, direct-injection; CNG = compressed natural gas; DME = dimethyl ether; EV = electric vehicle; E90 = mixture of 90% ethanol and 10% gasoline by volume; E85 = mixture of 85% ethanol and 15% gasoline by volume; FCV = fuel cell vehicle; FTD = Fischer-Tropsch diesel; GC = grid-connected; GI = grid-independent; HEV = hybrid electric vehicle; LNG = liquefied natural gas; LPG = liquefied petroleum gas; LS = low-sulfur; M90 = mixture of 90% methanol and 10% gasoline by volume; M85 = mixture of 85% methanol and 15% gasoline by volume; RFG = reformulated gasoline; SI = spark ignition; SIDI = spark-ignition, direct-injection.
8
3 SIMULATIONS OF TRANSPORTATION OF ENERGY FEEDSTOCKS AND FUELS
In previous GREET versions, energy use and emissions from transporting energy feedstocks and fuels were simulated by using energy efficiencies as inputs to different transportation activities — similar to simulations of feedstock and fuel production activities. In the new version, transportation-related activities are simulated by using input parameters, such as transportation modes, transportation distances, energy use intensities for various transportation modes, and other factors.
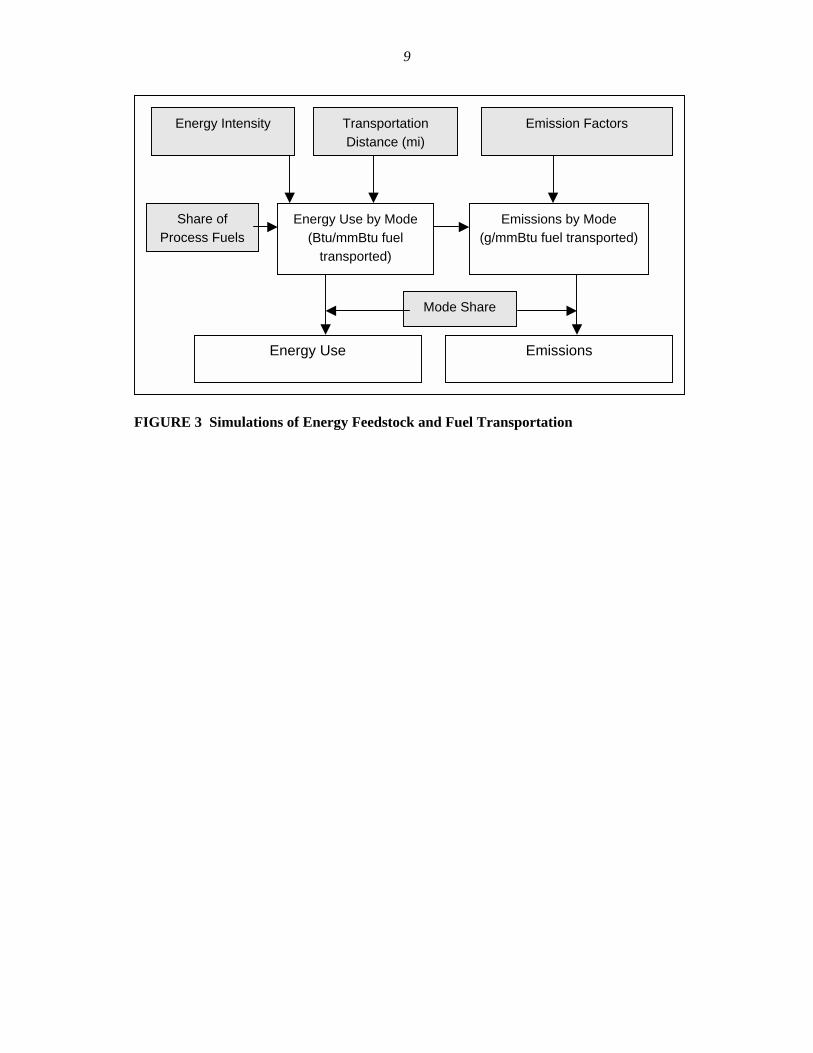
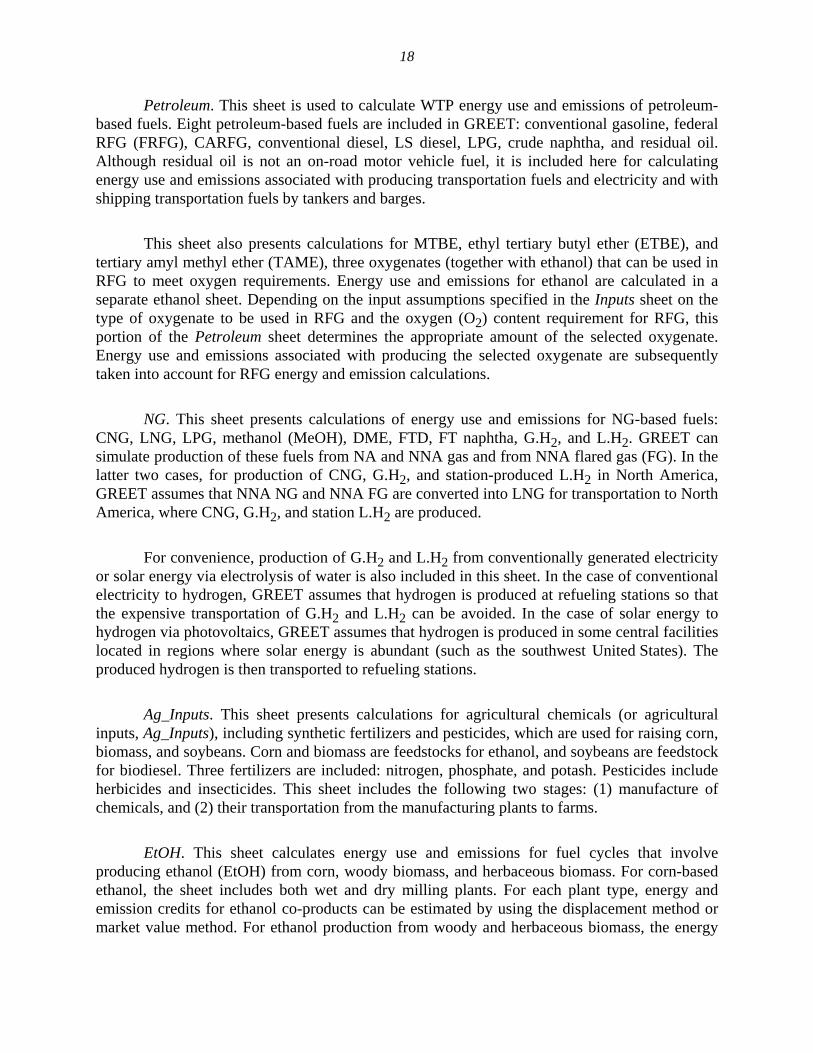
Figure 3 shows the logic in GREET 1.6 for simulating transportation-related activities. As the figure shows, the new approach requires data for five input parameters: energy intensity (in Btu/ton-mi) for each transportation mode, transportation distance for a product by a given mode, emission factors of the transportation mode, share of process fuels powering a given mode, and share of different modes for a given product. Details of the new simulation approach, data, and input assumptions associated with simulations of transportation activities are documented in a Society of Automotive Engineers (SAE) technical paper (He and Wang 2000).
Transportation modes in GREET 1.6 include the following:
• Ocean tankers for crude oil, gasoline, diesel, liquefied petroleum gas (LPG), crude naphtha, residual oil, LNG, methanol, DME, FTD, FT naphtha, and L.H2;
• Barges for crude oil, gasoline, diesel, LPG, crude naphtha, residual oil, LNG, methanol, DME, FTD, FT naphtha, L.H2, ethanol, biodiesel, corn, soybeans, agricultural chemicals, and coal;
• Pipelines for crude oil, gasoline, diesel, LPG, FTD, biodiesel, naphtha, NG, and G.H2;
• Rails for gasoline, diesel, LPG, crude naphtha, residual oil, LNG, methanol, ethanol, DME, FTD, FT naphtha, L.H2, biodiesel, corn, soybeans, agricultural chemicals, and coal; and
• Trucks for delivering liquid fuels from bulk terminals to refueling stations.
9
FIGURE 3 Simulations of Energy Feedstock and Fuel Transportation
Energy Intensity Transportation Distance (mi)
Emission Factors
Share of Process Fuels
Energy Use by Mode (Btu/mmBtu fuel
transported)
Energy Use Emissions
Emissions by Mode (g/mmBtu fuel transported)
Mode Share
10
4 STOCHASTIC SIMULATIONS IN GREET 1.6
The parametric assumptions made in the GREET model involve uncertainties. To address the uncertainties, GREET 1.6 incorporates Monte Carlo simulations to take into account the probability distributions of key input parameters. This feature was developed during a project that Argonne conducted for General Motors Corporation’s (GM’s) Global Alternative Propulsion Center (Well-to-Wheel Energy Use and Greenhouse Gas Emissions of Advanced Fuel/Vehicle Systems — North American Analysis).
During the GM project, Argonne worked closely with three energy companies (BP, ExxonMobil, and Shell) and with GM to develop probability distribution functions for key GREET input parameters. Because the GM project focused on energy use and GHG emissions, distribution functions were established primarily for energy efficiencies of key WTP stages included in GREET 1.6, such as feedstock recovery and fuel production.
In developing probability distribution functions for a given input parameter, we first developed parametric values for the parameter with probabilities of 20% and 80%. We then assumed a distribution curve (the normal distribution curve in most cases) and input the distribution functions into the draft version of GREET 1.6. By using a commercial software — Crystal Ball™ developed by Decisioneering, Inc., users can run GREET 1.6 to generate stochastic results. Rather than a point estimate for a given energy or emission item, stochastic simulations provide the results for the item with a distribution curve. In this way, users can obtain results with probabilities of 20%, 50%, 80%, etc. Details regarding development and application of stochastic simulations within GREET 1.6 are documented in a report that Argonne delivered to GM (Wang and He 2001).
The distribution functions built into GREET 1.6 are available if the user has the Crystal Ball software and Microsoft Excel. The Crystal Ball software is also required to conduct stochastic simulations within GREET 1.6. Without Crystal Ball, users can conduct only point estimates of energy use and emissions.
11
5 DEVELOPMENT OF GREET GRAPHIC USER INTERFACES1
5.1 INTRODUCTION
The simulation program GREETGUI was developed in a user-friendly format to simulate energy efficiencies and emissions for different transportation fuels and vehicle technologies.
The program is a graphical user interface (GUI) that takes input from the user in the form of option buttons, check boxes and input text boxes, and communicates these inputs (in the background) to the GREET 1.6 spreadsheet. Then, GREETGUI runs the GREET model to generate the output results, which are automatically displayed in the form of tables created in another Excel file, SessionOut.xls. User inputs are displayed in a separate Excel file entitled SessionIn.xls. GREETGUI allows the user to save the session run in “.gaf” format. The following paragraphs describe the system requirements to install and run the GREETGUI simulation program and instructions for input and output along with the user-friendly features.
5.2 SYSTEM REQUIREMENTS
GREETGUI works on IBM compatible PCs running Microsoft's Windows 95, Windows 98, Windows 2000, Windows Millennium Edition (ME), Windows NT, or Windows XP. This application cannot run on the Windows 3.1 operating system.
Absolute minimum hardware requirements: Pentium processor at 166 MHz or higher; at least 64 MB RAM; and at least 30 MB of free space on the hard drive.
Recommended hardware profile: Pentium processor at 400 MHz or higher, 128MB or more of RAM, 100MB of free hard disk space or more.
5.3 INSTALLATION
It is recommended that the user close all other applications before attempting to install GREETGUI. To begin installation, double-click on GREETGUI_install.exe, which will extract the setup files. Run the installation program setup.exe from the location on your PC to which GREETGUI_install.exe was extracted. Follow the on-screen instructions. If prompted, please restart your computer to allow the installation process to fully complete. The installation program will create a shortcut to GREETGUI on the desktop displaying the program icon (the green Argonne National Laboratory triangle) and its name. 1 Written with Dr. Amgad Elgowainy of Purdue University at Calumet.
12
5.4 RUNNING THE PROGRAM
The GREETGUI program first seeks input from the user for the fuel pathways and vehicle technologies scenarios and simulation options. Then it proceeds to displaying the default assumptions of GREET input parameters for the selected fuel pathways. Finally, GREETGUI runs the main Excel program in the background and displays the output results in the form of tables. The following are the main steps involved in running the GREETGUI program:
1. Double-click on the program icon on your desktop. 2. Hit “New Session” to start a new simulation session
OR Hit “Open Existing Session” to work from a previously saved session.
3. If you have chosen to open a new session, type in a file name for the output or accept the default name.
4. Select either a near term or long term simulation. Select the vehicle type, then select the
fuel options which you would like to simulate.
5. For each fuel option you’ve selected, view that option’s blue tab and pick the fuel pathways options desired. Petroleum and Natural Gas have several groups of fuel pathways, divided into convenient tabs. You must choose at least one vehicle technology for each fuel pathway you would like to have results for. GREETGUI will remind you of this.
6. Pick vehicle simulation options based upon the pathways you’ve selected. 7. After the desired simulation scenarios have been completed, a dialog box will pop up
offering three options:
-Continue: This will take the user into the next phase of GREETGUI. The program will proceed to ask the user to view and/or change parametric assumptions for the scenario options selected.
-Review selected scenario options: This allows the user to return to pathway options. Here they can make any changes to previous selections by clicking on the appropriate blue pathway tab and making the selections desired.
-Start a new session without saving: This allows the user to abort the current GREETGUI session and restart from the beginning. Note: this option will discard any selections and/or changes the user has already made in the current session.
8. Use the Continue button to proceed to the key assumptions. The key assumptions will be
listed in table format. The yellow cells can be edited to modify the assumptions as desired.
13
9. After all key assumptions have been shown and/or edited, another pop-up dialog box will present three options:
- Continue: The option will allow the user to proceed to the completion of the GREET simulation. GREETGUI will take the user’s selected scenario options together with the parametric assumptions and will generate sessionout.xls, which displays the results of the GREET model simulation.
- Review parametric assumptions: This option will allow the user to return to the beginning of the parametric assumptions and review his or her selections and/or make any changes.
- Start a new session without saving: This allows the user to abort the current GREETGUI session and restart from the beginning. Note: this option will discard any selections the user has already made in the current session.
10. As GREETGUI closes, you will be prompted to save this session as a “.gaf” file. If you
would like to run GREETGUI again based off current selections, or would like to later modify these inputs and rerun GREETGUI, please save the prompted file. This may take several seconds.

14
15
6 USE OF THE GREET MODEL IN EXCEL
The GREET model is a multidimensional spreadsheet model developed in Microsoft Excel 97. GREET 1.6 is designed so that users can run it either from GREETGUI or directly in Excel. Although users can run the GREET model from the GREETGUI program without going to Excel (see Section 5), experienced Excel users may prefer to run GREET in Excel. Moreover, other users may find it easier to run GREET 1.6 in Excel; that process is described in this section.
In order to run the model, Excel 97 (or later versions) must be installed on a user’s computer. GREET 1.6 requires about 3.7 MB of memory. If a user receives the model in a zipped format, it must be unzipped by means of zip/unzip software. The model can then be stored on a computer and opened and run in Excel 97 (or later versions such as the one in the Microsoft Office 2000 Suite).
GREET employs the circular calculation feature in Excel to account for the energy use and emissions associated with producing the process fuels that are used to make transportation fuels. Before running the model, the user must ensure that the circular feature in Excel is turned on. This setting is already incorporated in GREET 1.6; however, if a user already has a different Excel file open with the circular calculation feature off, opening GREET 1.6 with the feature off will prevent the model from executing circular calculations. We recommend that users open GREET 1.6 before any other Excel files in order to prevent this problem.
Sometimes, the circular calculation feature is not turned on automatically by opening the GREET model. In this case, the user can open Excel first and then follow the steps outlined below to turn the feature on. Also, Excel can conduct simulations instantly when the value in one cell is changed. We recommend that users conduct GREET simulations after all their changes are made. To do this, users need to turn on the manual calculation feature in Excel by following the steps below (which also turn the circular calculation feature on).
1. Go to Tools button on the task bar.
2. Select Options.
3. Select Calculations.
4. Check Iteration.
5. Enter 100 in the box for Maximum Iterations.
6. Check Manual button.
16
7. Click OK.
After following these steps, users can open the GREET model. When opening the model, Excel will ask users whether they want to enable the macro functions built into GREET. Users should click the Enable button so that GREET macro functions will be in operation.
With the manual feature on, users should press the F9 key on the computer keyboard — after completing all inputs for key assumptions — to calculate results on the basis of the new assumptions.
When the circular calculation feature is on, if a cell in the GREET model is assigned an invalid value (e.g., if a symbol is assigned to a cell that requires a number), the model will generate nonrepairable error messages in many cells. We recommend that users maintain the original GREET copy as a backup and use an operational copy for their own calculations.
Some cells present default assumptions for fuel-cycle energy and emission calculations, while others are logic calculations. Users can change any of the default assumptions. The cells that contain critical assumptions are yellow so that users can easily distinguish these assumptions from logic calculations and can change key assumptions as needed.
17
7 GREET MODEL STRUCTURE
GREET 1.6 consists of 19 Excel sheets, each of which is briefly described below.
Overview. This sheet contains the GREET copyright statement. It presents a brief summary of each of the following sheets in GREET to briefly introduce their functions. We highly recommend that first-time users read this sheet before proceeding with GREET calculations.
Inputs. This sheet presents (1) key control variables for various scenarios to be simulated by GREET and (2) key parametric assumptions for GREET simulations. This sheet is where a user can input all the key assumptions for his/her own simulations. In fact, in most cases, users do not need to go to any other GREET sheets to input assumptions. GREETGUI interacts with this sheet to determine the fuel-vehicle systems to be simulated by GREET.
EF. This sheet presents emission factors (EFs) for individual combustion technologies that burn various fuels. The first table of this sheet lists EFs for combustion technologies applied to stationary sources. The second table lists emission changes for alternative fuels relative to a baseline fuel for power units applied to transportation facilities (ocean tankers, barges, locomotives, trucks, pipelines, etc.). The third table lists the emission rates for different transportation modes fueled by different fuels for trips from product origin to destination. The fourth table lists the emission rates for different transportation modes fueled by different fuels for trips from product destinations back to origins (back-haul trips). These emission factors are used in other GREET 1.6 sheets to calculate emissions associated with fuel combustion in various upstream stages.
Fuel_Specs. This sheet presents specifications for individual fuels. Lower and higher heating values, fuel density, carbon weight ratio, and sulfur weight ratio are specified for each fuel. The parametric values for these fuel specifications are needed to estimate energy consumption and emissions as well as to make conversions for mass, volume, and energy contents.
The Fuel_Specs sheet contains some other conversion parameters such as the GWPs for individual GHGs, which are used in GREET to convert emissions of GHGs into CO2-equivalent emissions. The sheet also contains the carbon content in VOCs, CO, CO2, and CH4 and the sulfur content in sulfur dioxide (SO2). These conversion factors are used for carbon emission and SOx emission calculations throughout the GREET model.
T&D. This sheet is for calculations of energy use and emissions for transportation and distribution (T&D) of energy feedstocks and fuels. The results of this sheet — energy use (in Btu) and emissions (in grams per million Btu or g/mmBtu) of energy feedstocks and fuels transported and distributed —are used in other sheets for calculations associated with particular fuels.
18
Petroleum. This sheet is used to calculate WTP energy use and emissions of petroleum-based fuels. Eight petroleum-based fuels are included in GREET: conventional gasoline, federal RFG (FRFG), CARFG, conventional diesel, LS diesel, LPG, crude naphtha, and residual oil. Although residual oil is not an on-road motor vehicle fuel, it is included here for calculating energy use and emissions associated with producing transportation fuels and electricity and with shipping transportation fuels by tankers and barges.
This sheet also presents calculations for MTBE, ethyl tertiary butyl ether (ETBE), and tertiary amyl methyl ether (TAME), three oxygenates (together with ethanol) that can be used in RFG to meet oxygen requirements. Energy use and emissions for ethanol are calculated in a separate ethanol sheet. Depending on the input assumptions specified in the Inputs sheet on the type of oxygenate to be used in RFG and the oxygen (O2) content requirement for RFG, this portion of the Petroleum sheet determines the appropriate amount of the selected oxygenate. Energy use and emissions associated with producing the selected oxygenate are subsequently taken into account for RFG energy and emission calculations.
NG. This sheet presents calculations of energy use and emissions for NG-based fuels: CNG, LNG, LPG, methanol (MeOH), DME, FTD, FT naphtha, G.H2, and L.H2. GREET can simulate production of these fuels from NA and NNA gas and from NNA flared gas (FG). In the latter two cases, for production of CNG, G.H2, and station-produced L.H2 in North America, GREET assumes that NNA NG and NNA FG are converted into LNG for transportation to North America, where CNG, G.H2, and station L.H2 are produced.
For convenience, production of G.H2 and L.H2 from conventionally generated electricity or solar energy via electrolysis of water is also included in this sheet. In the case of conventional electricity to hydrogen, GREET assumes that hydrogen is produced at refueling stations so that the expensive transportation of G.H2 and L.H2 can be avoided. In the case of solar energy to hydrogen via photovoltaics, GREET assumes that hydrogen is produced in some central facilities located in regions where solar energy is abundant (such as the southwest United States). The produced hydrogen is then transported to refueling stations.
Ag_Inputs. This sheet presents calculations for agricultural chemicals (or agricultural inputs, Ag_Inputs), including synthetic fertilizers and pesticides, which are used for raising corn, biomass, and soybeans. Corn and biomass are feedstocks for ethanol, and soybeans are feedstock for biodiesel. Three fertilizers are included: nitrogen, phosphate, and potash. Pesticides include herbicides and insecticides. This sheet includes the following two stages: (1) manufacture of chemicals, and (2) their transportation from the manufacturing plants to farms.
EtOH. This sheet calculates energy use and emissions for fuel cycles that involve producing ethanol (EtOH) from corn, woody biomass, and herbaceous biomass. For corn-based ethanol, the sheet includes both wet and dry milling plants. For each plant type, energy and emission credits for ethanol co-products can be estimated by using the displacement method or market value method. For ethanol production from woody and herbaceous biomass, the energy
19
and emission credits for cogenerated electricity in cellulosic ethanol plants are estimated by using the displacement method.
BD. This sheet calculates energy use and emissions associated with producing biodiesel (BD) from soybeans. The sheet includes soybean farming and transportation, soyoil extraction, and soyoil transesterification to biodiesel. Energy use and emissions are allocated between biodiesel and by-products according to the market value method.
Coal. The purpose of this sheet is to calculate energy use and emissions for coal mining, cleaning, and transportation. The results are used for other fuel cycles in which coal is used as a process fuel. For example, in calculating energy use and emissions associated with electricity generation in coal-fired power plants, GREET accounts for energy use and emissions associated with coal mining, cleaning, and transportation as calculated in this sheet.
Uranium. This sheet is used to calculate energy use and emissions associated with uranium mining, transportation, and enrichment. The results are used in the electric sheet for calculating energy use and emissions associated with nuclear electric power plants. That is, even though nuclear power plants have zero operational energy use and emissions, the upstream processing and transportation of uranium consume energy and generate emissions.
LF_Gas. This sheet presents energy use and emission calculations for the fuel cycle that consists of producing methanol from landfill gases (LF_Gas). We assume in GREET that without methanol production, landfill gases would otherwise be flared. Flaring the gases generates a significant amount of emissions. The emissions offset by producing methanol are taken into account as emission credits for methanol production; emissions from methanol combustion are taken into account during vehicle operation.
Electric. This sheet is used to calculate energy use and emissions associated with the generation of electricity to produce transportation fuels (where electricity is used) and to operate EVs and GC HEVs. In this sheet, GREET can calculate emission factors for electric power plants according to combustion emission factors incorporated in the model, or it can take emission factors directly from the user. Energy use and emissions during processing and transportation of power plant fuels, as well as during power plant electricity generation, are taken into account. The results in this sheet are provided in Btu or g/mmBtu of electricity available at user sites. That is, electricity loss during transmission and distribution of electricity from power plants to user sites is taken into account in GREET.
Vehicles. This sheet is designed to calculate energy use and emissions associated with vehicle operations. The sheet is constructed in three sections.
In the first (Scenario Control) section, for methanol and ethanol flexible-fuel vehicles (FFVs) and dedicated methanol and ethanol vehicles, a user can specify the content of methanol or ethanol in fuel blends. For FTD and biodiesel blended with diesel, a user can specify the
20
content of FTD or biodiesel in fuel blends. Furthermore, a user can specify whether conventional gasoline or RFG is blended with methanol or ethanol and whether conventional diesel or LS diesel is blended with FTD or biodiesel. The split for vehicle miles traveled that are powered with grid electricity and onboard internal combustion engines for GC HEVs is also presented in the Scenario Control section.
The second section of the Vehicles sheet (Vehicle Fuel Economy and Emission Changes) presents fuel economy and emission changes associated with alternative-fueled vehicles and advanced technology vehicles relative to baseline gasoline or diesel vehicles. Because the fuel economy and emissions of baseline vehicles are different for near- and long-term technology options, fuel economy and emission changes for near- and long-term technologies are presented separately in this section.
The third section (Per-Mile Fuel Consumption and Emissions) in the Vehicles sheet calculates energy use and emissions associated with vehicle operations for individual vehicle types. The fuel economy of baseline gasoline vehicles is input in this section.
NT_Results. This sheet presents near-term (NT) results for fuel/vehicle combinations. The sheet is constructed in three sections.
In the first section (Well-to-Pump Energy Use and Emissions), energy and emission results from wells to refueling station pumps (in Btu or g/mmBtu of fuel available at fuel pumps) are presented. In the second section (Well-to-Wheel Energy Use and Emissions), fuel-cycle (well-to-wheel) energy use and emissions for each vehicle type are calculated. For each vehicle type, energy use and emissions are presented separately for three stages: feedstock (including recovery, transportation, and storage), fuel (including production, transportation, storage, and distribution), and vehicle operation. Shares of energy use and emissions for each of the three stages are also presented in this section. For the five criteria pollutants, both urban (U) emissions (emissions occurring in urban areas) and total (T) emissions (emissions occurring everywhere) are calculated in this section.
In the third section (Well-to-Wheel Energy and Emission Changes) of this sheet, changes in fuel-cycle energy use and emissions for individual alternative-fueled vehicle type/advanced vehicle technology type are calculated. The changes for fuel/vehicle technologies are calculated against conventional gasoline vehicles fueled with conventional gasoline for near-term technology options.
LT_Results. This sheet presents long-term (LT) results for fuel/vehicle combinations. The structure of this sheet is the same as that for the NT_Results sheet. The separation of near- and long-term results enables the GREET model to generate near- and long-term results separately. The design of two separate sheets helps users avoid going to a wrong sheet for simulation results.
21
In the third section of the LT_Results sheet, changes for alternative-fueled and advanced vehicle technologies relative to conventional gasoline vehicles powered with federal RFG are calculated.
NT_Graphs. This sheet graphically presents shares of energy use and emissions by feedstock, fuel, and vehicle operation for each near-term fuel/vehicle type. Furthermore, it shows changes in energy use and emissions for near-term individual vehicle technologies relative to baseline gasoline vehicles powered by conventional gasoline.
LT_Graphs. This sheet graphically presents shares of energy use and emissions by feedstock, fuel, and vehicle operations for each long-term fuel/vehicle type. Furthermore, it shows reductions in energy use and emissions for long-term individual vehicle technologies relative to baseline gasoline vehicles powered by federal RFG.

22
23
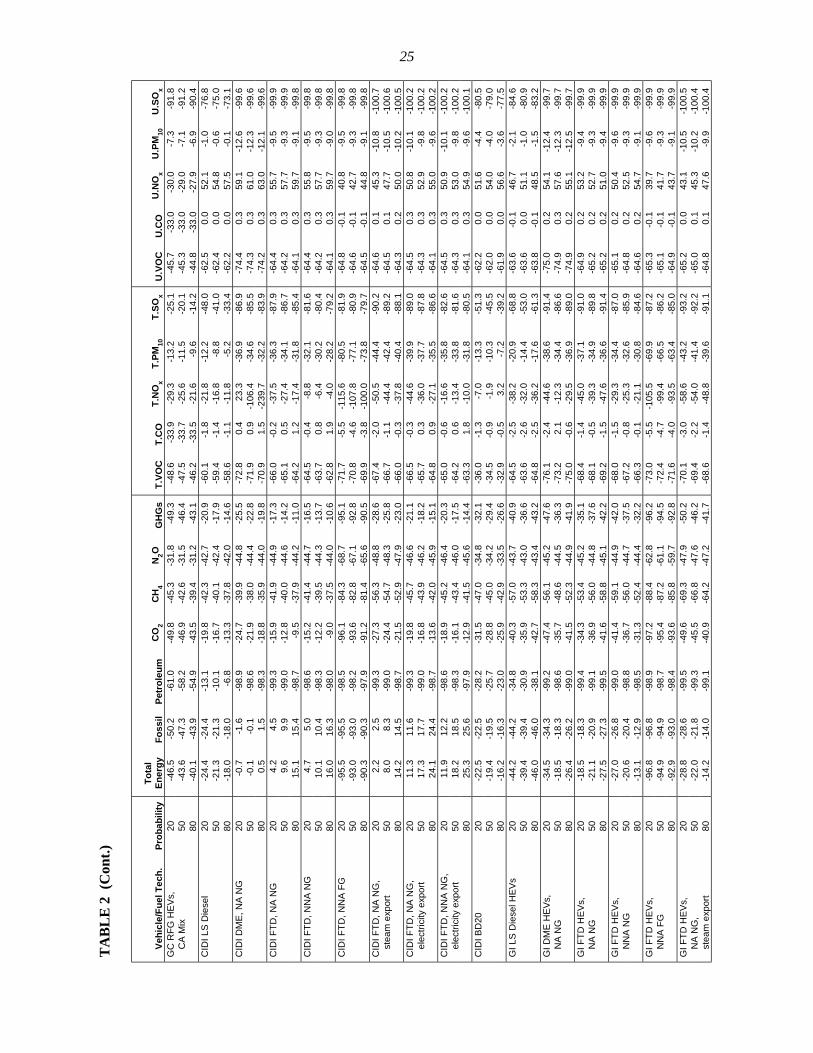
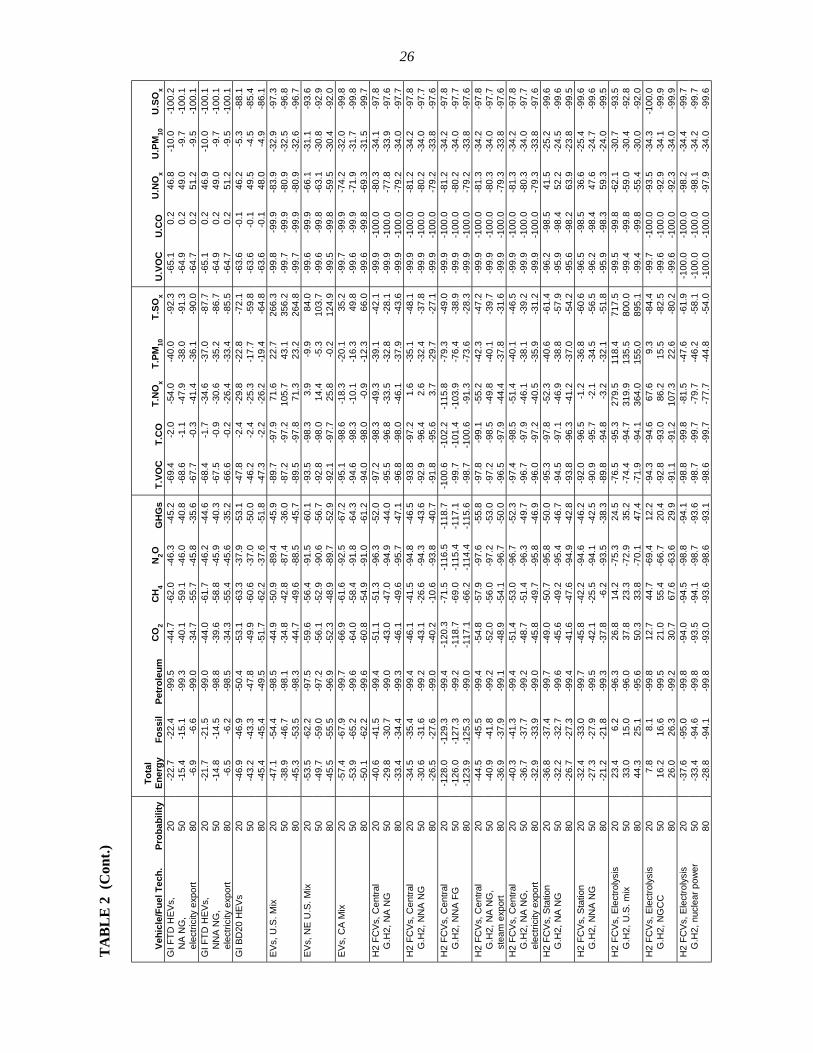
8 GREET 1.6 RESULTS
Argonne has been conducting research to obtain technical information for GREET model development. Through its research efforts and its applications of the GREET model, Argonne has established a set a default assumptions that are embedded in the GREET model. These assumptions reflect Argonne’s up-to-date understanding of issues involved in different transportation fuel pathways. These assumptions continue to evolve.
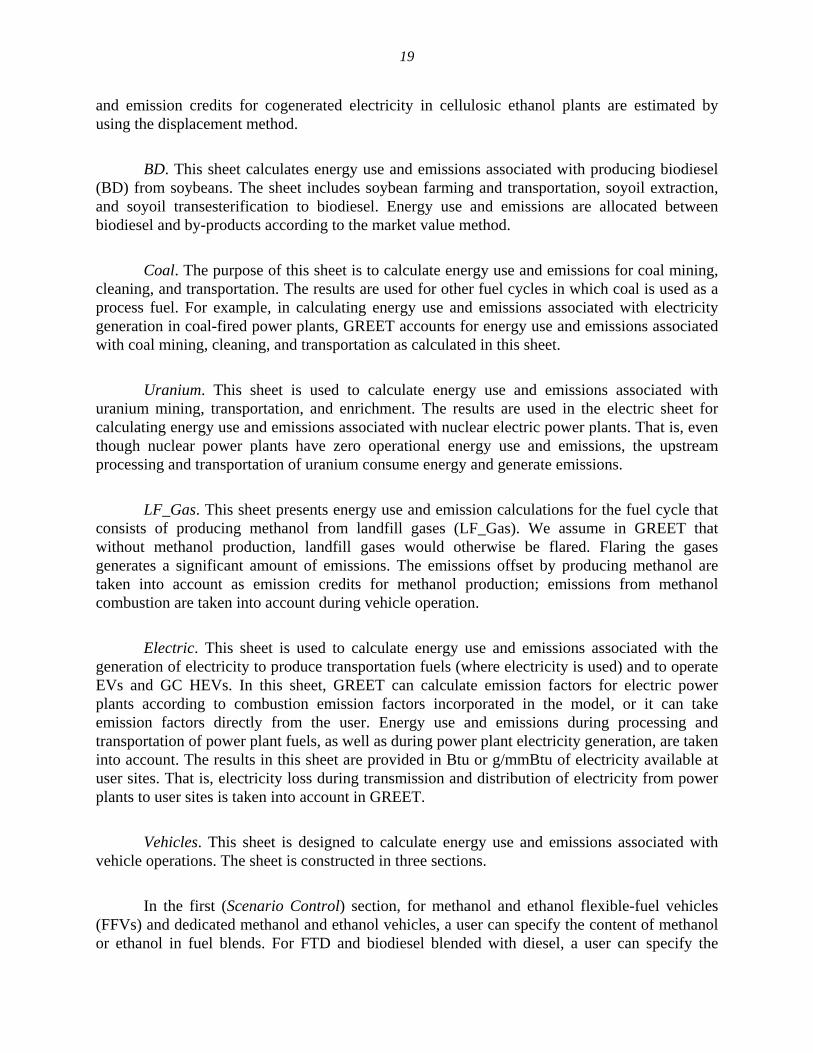
On the basis of default assumptions in the draft version of GREET 1.6, Argonne calculated energy use and emissions of various fuel/vehicle systems. In its simulations with GREET 1.6, Argonne used the new Monte Carlo simulation feature. Monte Carlo simulations, requiring use of the Crystal Ball software, generate stochastic results. Table 2 presents WTW stochastic energy and emission changes for various fuel/vehicle systems. The Crystal Ball software generates results at different probability levels. Because of space limitations in this report, results are presented at probabilities of 20%, 50%, and 80%.
24
TA
BL
E 2
Wel
l-to-
Whe
el E
nerg
y an
d E
mis
sion
Cha
nges
for
Fuel
/Veh
icle
Tec
hnol
ogie
s Rel
ativ
e to
Gas
olin
e V
ehic
les F
uele
d w
ith
Ref
orm
ulat
ed G
asol
ine
(all
valu
es sh
own
are
in %
)
Vehi
cle/
Fuel
Tec
h.
Prob
abili
ty
To
tal
Ener
gy
Foss
il Pe
trol
eum
C
O2
CH
4 N
2O
GH
Gs
T.VO
C
T.C
O
T.N
Ox
T.PM
10
T.SO
x U
.VO
C
U.C
O
U.N
Ox
U.P
M10
U
.SO
x C
NG
Vs, N
A N
G
20
-11.
4 -1
1.8
-99.
7 -2
7.9
104.
3 -5
0.0
-24.
2 -6
9.6
-41.
8 -6
4.5
141.
2 -8
5.0
-56.
8 -3
9.3
100.
0 -2
5.1
-96.
1
50
-7.7
-8
.2
-99.
5 -2
4.9
109.
9 -4
9.5
-21.
3 -6
8.5
-40.
8 -5
5.9
168.
0 -8
3.6
-56.
5 -3
9.2
115.
3 -2
4.7
-95.
9
80
-3.8
-4
.3
-99.
2 -2
1.8
116.
1 -4
8.9
-18.
1 -6
7.3
-39.
8 -4
7.4
195.
8 -8
2.1
-56.
1 -3
9.1
131.
4 -2
4.3
-95.
8 C
NG
Vs, N
NA
NG
20
-0
.4
-0.5
-9
9.7
-21.
3 15
5.6
-47.
4 -1
7.1
-62.
7 -3
9.0
24.8
15
0.1
-80.
6 -5
6.8
-39.
3 10
0.6
-25.
2 -9
6.1
50
1.
9 1.
4 -9
9.4
-17.
4 16
2.8
-46.
7 -1
2.5
-60.
9 -3
7.8
30.5
17
6.7
-78.
3 -5
6.5
-39.
2 11
5.7
-24.
7 -9
5.9
80
4.
3 3.
5 -9
9.1
-13.
3 17
0.8
-45.
9 -7
.6
-59.
2 -3
6.5
36.7
20
3.4
-75.
8 -5
6.1
-39.
2 13
1.4
-24.
3 -9
5.8
CN
GVs
, NN
A FG
20
-1
72.0
-1
73.0
-9
9.7
-155
.3
79.4
-8
6.5
-146
.5
-69.
0 -4
4.1
-138
.5
-391
.3
-96.
5 -5
6.8
-39.
3 10
0.0
-25.
2 -9
6.1
50
-1
68.3
-1
69.3
-9
9.4
-152
.2
83.7
-8
4.4
-143
.7
-67.
3 -4
2.9
-108
.3
-361
.0
-94.
7 -5
6.5
-39.
2 11
5.7
-24.
8 -9
5.9
80
-1
64.5
-1
65.5
-9
9.1
-149
.1
88.2
-8
2.5
-140
.8
-65.
6 -4
1.7
-75.
4 -3
33.3
-9
2.7
-56.
1 -3
9.2
132.
0 -2
4.3
-95.
8 LP
GVs
, cru
de
20
-18.
5 -1
8.4
-60.
2 -2
2.3
-23.
8 -2
.9
-22.
0 -5
5.9
-40.
8 -4
5.3
-40.
1 -7
6.9
-52.
6 -4
0.0
-13.
4 -2
7.6
-97.
4 a
nd N
G
50
-15.
7 -1
5.5
-58.
9 -1
9.7
-21.
6 -2
.6
-19.
4 -5
5.3
-40.
3 -4
1.2
-38.
6 -7
5.6
-52.
4 -4
0.0
-12.
3 -2
7.4
-97.
3
80
-12.
6 -1
2.5
-57.
5 -1
6.9
-19.
3 -2
.3
-16.
7 -5
4.5
-39.
8 -3
6.7
-37.
1 -7
4.2
-52.
2 -4
0.0
-11.
2 -2
7.2
-97.
2 Et
OH
Vs, c
orn,
E90
20
12
.3
-46.
9 -7
3.9
-47.
0 -2
6.0
361.
4 -3
7.1
86.8
1.
1 11
0.7
556.
3 43
.0
-9.3
-0
.1
-11.
0 -1
5.1
-82.
1
50
16.6
-4
4.2
-72.
5 -4
4.3
-22.
8 47
8.8
-33.
3 92
.8
2.2
132.
4 58
7.4
53.7
-8
.9
-0.1
-1
0.1
-14.
9 -8
1.5
80
21
.2
-41.
3 -7
1.1
-41.
5 -1
9.4
619.
6 -2
9.4
99.1
3.
2 15
5.2
620.
2 64
.9
-8.5
-0
.1
-9.1
-1
4.8
-80.
8 Et
OH
Vs, c
ellu
losi
c,
20
53.8
-8
1.0
-73.
6 -9
3.2
-65.
6 26
4.8
-84.
3 4.
1 7.
9 16
2.1
89.6
-9
6.0
-9.2
-0
.1
-13.
8 -1
5.1
-81.
5 E
90
50
67.9
-7
9.9
-72.
5 -9
0.2
-64.
2 32
1.5
-81.
3 7.
1 9.
3 18
9.2
103.
3 -8
9.8
-8.8
-0
.1
-12.
8 -1
4.9
-80.
9
80
84.2
-7
8.7
-71.
4 -8
7.4
-62.
8 38
7.1
-78.
4 10
.5
11.0
22
1.0
120.
1 -8
3.8
-8.3
-0
.1
-11.
9 -1
4.8
-80.
3 G
I FR
FG H
EVs
20
-33.
5 -3
3.5
-33.
5 -3
3.6
-30.
4 -1
.6
-32.
8 -2
2.4
-1.7
-2
9.2
-7.5
-3
3.5
-17.
8 0.
0 -6
.9
5.2
-33.
5
50
-28.
7 -2
8.7
-28.
7 -2
8.7
-26.
0 -1
.4
-28.
1 -2
0.4
-1.4
-2
4.9
-5.7
-2
8.7
-17.
1 0.
0 -5
.9
5.4
-28.
7
80
-22.
8 -2
2.8
-22.
8 -2
2.8
-20.
6 -1
.1
-22.
3 -1
8.1
-1.0
-1
9.8
-3.6
-2
2.8
-16.
2 0.
0 -4
.7
5.5
-22.
8 G
I CAR
FG H
EVs
20
-34.
7 -3
6.6
-29.
0 -3
4.5
-41.
8 10
.0
-33.
8 -2
0.0
-2.3
-4
2.0
8.6
-54.
0 -1
7.5
0.4
11.2
11
.2
-61.
3
50
-29.
6 -3
1.7
-23.
7 -2
9.4
-38.
0 14
.2
-28.
8 -1
7.8
-1.8
-3
7.4
12.7
-4
8.1
-16.
8 0.
5 14
.0
14.0
-5
8.4
80
-2
3.7
-26.
0 -1
7.3
-23.
5 -3
3.6
19.1
-2
3.0
-15.
2 -1
.4
-32.
2 17
.3
-41.
7 -1
5.9
0.5
17.1
17
.1
-54.
9 G
I CN
G H
EVs,
20
-3
9.0
-39.
3 -9
9.8
-50.
4 55
.2
-50.
7 -4
7.2
-70.
2 -4
2.2
-70.
9 90
.8
-89.
5 -5
7.7
-39.
6 64
.6
-16.
7 -9
7.3
NA
NG
50
-3
4.1
-34.
4 -9
9.6
-46.
5 63
.4
-50.
3 -4
3.2
-69.
3 -4
1.4
-64.
7 11
1.6
-88.
2 -5
7.4
-39.
5 76
.5
-16.
3 -9
7.1
80
-2
8.6
-28.
9 -9
9.4
-42.
0 73
.1
-49.
9 -3
8.6
-68.
4 -4
0.7
-58.
5 13
4.3
-86.
9 -5
7.0
-39.
4 89
.9
-16.
0 -9
6.9
GI C
NG
HEV
s,
20
-31.
5 -3
1.8
-99.
3 -4
4.8
117.
9 -4
8.6
-39.
8 -6
2.8
-39.
8 23
.2
98.2
-8
1.9
-57.
7 -3
9.6
64.6
-1
6.7
-97.
3 N
NA
NG
50
-2
5.9
-26.
3 -9
9.1
-40.
1 13
1.2
-48.
1 -3
5.0
-61.
5 -3
8.9
36.6
11
9.7
-80.
0 -5
7.4
-39.
5 76
.6
-16.
3 -9
7.1
80
-1
9.4
-19.
8 -9
8.8
-35.
0 14
7.2
-47.
5 -2
9.7
-60.
1 -3
8.0
52.5
14
4.2
-77.
8 -5
7.0
-39.
4 90
.8
-16.
0 -9
6.8
GI L
PG H
EVs,
20
-4
1.2
-41.
1 -7
1.3
-44.
0 -4
2.2
-3.5
-4
3.2
-59.
1 -4
1.3
-56.
3 -3
7.0
-83.
2 -5
3.0
-40.
0 -1
5.6
-18.
4 -9
8.2
Cru
de a
nd N
G
50
-36.
7 -3
6.6
-69.
2 -3
9.7
-38.
6 -3
.2
-39.
0 -5
8.2
-40.
9 -5
2.5
-35.
5 -8
1.7
-52.
7 -4
0.0
-14.
4 -1
8.2
-98.
0
80
-31.
6 -3
1.5
-66.
7 -3
4.8
-34.
5 -2
.9
-34.
2 -5
7.3
-40.
5 -4
8.4
-33.
8 -8
0.0
-52.
4 -4
0.0
-13.
2 -1
8.0
-97.
8 G
I EtO
H H
EVs,
20
-2
2.3
-63.
0 -8
1.8
-63.
1 -4
4.1
256.
2 -5
5.4
39.4
-0
.7
52.5
37
9.6
0.3
-23.
9 -0
.1
-14.
1 -7
.5
-87.
6 C
orn,
E90
50
-1
5.7
-59.
7 -8
0.2
-59.
8 -4
0.3
343.
4 -5
1.2
47.0
0.
2 71
.0
418.
4 11
.0
-23.
4 -0
.1
-13.
0 -7
.3
-86.
6
80
-9.0
-5
6.2
-78.
4 -5
6.3
-36.
3 44
9.9
-46.
9 54
.9
1.1
91.2
45
6.8
22.4
-2
2.9
-0.1
-1
1.9
-7.1
-8
5.6
GI E
tOH
HEV
s,
20
8.8
-86.
7 -8
1.6
-95.
1 -7
1.6
188.
1 -8
8.1
-17.
9 4.
1 90
.7
56.2
-9
7.1
-23.
7 -0
.1
-16.
0 -7
.6
-87.
2 C
ellu
losi
c, E
90
50
21.9
-8
5.4
-80.
1 -9
2.9
-70.
2 23
2.5
-85.
9 -1
4.8
5.4
113.
4 68
.6
-92.
6 -2
3.2
-0.1
-1
5.0
-7.3
-8
6.1
80
36
.7
-84.
1 -7
8.4
-90.
8 -6
8.6
281.
9 -8
3.6
-11.
3 6.
9 14
0.9
83.0
-8
8.2
-22.
8 -0
.1
-13.
9 -7
.1
-85.
0 G
C R
FG H
EVs,
20
-4
3.7
-46.
1 -6
0.5
-43.
1 -4
2.3
-30.
9 -4
2.8
-46.
9 -3
3.8
-4.5
-1
.3
40.9
-4
5.7
-33.
0 -3
3.5
-7.6
-9
0.9
U.S
. Mix
50
-4
0.6
-43.
1 -5
7.8
-39.
9 -3
9.4
-30.
5 -3
9.7
-45.
8 -3
3.5
1.8
1.6
52.7
-4
5.3
-33.
0 -3
2.7
-7.4
-9
0.2
80
-3
7.0
-39.
5 -5
4.4
-36.
2 -3
6.2
-30.
1 -3
6.1
-44.
5 -3
3.3
8.8
4.7
66.8
-4
4.8
-33.
0 -3
1.8
-7.3
-8
9.5
GC
RFG
HEV
s,
20
-45.
1 -4
8.1
-60.
2 -4
7.2
-43.
5 -3
1.4
-46.
8 -4
8.0
-33.
8 -2
1.8
-9.7
-8
.9
-45.
7 -3
3.0
-27.
3 -7
.0
-89.
5 N
E U
.S. M
ix
50
-42.
1 -4
5.2
-57.
4 -4
4.2
-40.
7 -3
1.1
-43.
9 -4
6.9
-33.
6 -1
7.5
-7.8
-2
.4
-45.
2 -3
3.0
-26.
1 -6
.8
-88.
9
80
-38.
6 -4
1.8
-54.
1 -4
0.8
-37.
6 -3
0.8
-40.
5 -4
5.6
-33.
4 -1
2.8
-5.6
5.
3 -4
4.8
-33.
0 -2
4.8
-6.6
-8
8.1
25
TA
BL
E 2
(C
ont.)
Vehi
cle/
Fuel
Tec
h.
Prob
abili
ty
To
tal
Ener
gy
Foss
il Pe
trol
eum
C
O2
CH
4 N
2O
GH
Gs
T.VO
C
T.C
O
T.N
Ox
T.PM
10
T.SO
x U
.VO
C
U.C
O
U.N
Ox
U.P
M10
U
.SO
x G
C R
FG H
EVs,
20
-4
6.5
-50.
2 -6
1.0
-49.
8 -4
5.3
-31.
8 -4
9.3
-48.
6 -3
3.9
-29.
3 -1
3.2
-25.
1 -4
5.7
-33.
0 -3
0.0
-7.3
-9
1.8
C
A M
ix
50
-43.
6 -4
7.3
-58.
2 -4
6.9
-42.
6 -3
1.5
-46.
4 -4
7.5
-33.
7 -2
5.6
-11.
5 -2
0.1
-45.
3 -3
3.0
-29.
0 -7
.1
-91.
2
80
-40.
1 -4
3.9
-54.
9 -4
3.5
-39.
4 -3
1.2
-43.
1 -4
6.2
-33.
5 -2
1.6
-9.6
-1
4.2
-44.
8 -3
3.0
-27.
9 -6
.9
-90.
4 C
IDI L
S D
iese
l 20
-2
4.4
-24.
4 -1
3.1
-19.
8 -4
2.3
-42.
7 -2
0.9
-60.
1 -1
.8
-21.
8 -1
2.2
-48.
0 -6
2.5
0.0
52.1
-1
.0
-76.
8
50
-21.
3 -2
1.3
-10.
1 -1
6.7
-40.
1 -4
2.4
-17.
9 -5
9.4
-1.4
-1
6.8
-8.8
-4
1.0
-62.
4 0.
0 54
.8
-0.6
-7
5.0
80
-1
8.0
-18.
0 -6
.8
-13.
3 -3
7.8
-42.
0 -1
4.6
-58.
6 -1
.1
-11.
8 -5
.2
-33.
4 -6
2.2
0.0
57.5
-0
.1
-73.
1 C
IDI D
ME,
NA
NG
20
-0
.7
-1.6
-9
8.9
-24.
7 -3
9.9
-44.
8 -2
5.5
-72.
8 0.
4 23
.3
-36.
9 -8
6.9
-74.
4 0.
3 59
.1
-12.
6 -9
9.6
50
-0
.1
-0.1
-9
8.6
-21.
9 -3
8.0
-44.
4 -2
2.8
-71.
9 0.
9 -1
06.4
-3
4.6
-85.
5 -7
4.3
0.3
61.0
-1
2.3
-99.
6
80
0.5
1.5
-98.
3 -1
8.8
-35.
9 -4
4.0
-19.
8 -7
0.9
1.5
-239
.7
-32.
2 -8
3.9
-74.
2 0.
3 63
.0
-12.
1 -9
9.6
CID
I FTD
, NA
NG
20
4.
2 4.
5 -9
9.3
-15.
9 -4
1.9
-44.
9 -1
7.3
-66.
0 -0
.2
-37.
5 -3
6.3
-87.
9 -6
4.4
0.3
55.7
-9
.5
-99.
9
50
9.6
9.9
-99.
0 -1
2.8
-40.
0 -4
4.6
-14.
2 -6
5.1
0.5
-27.
4 -3
4.1
-86.
7 -6
4.2
0.3
57.7
-9
.3
-99.
9
80
15.1
15
.4
-98.
7 -9
.5
-37.
9 -4
4.2
-11.
0 -6
4.2
1.2
-17.
4 -3
1.8
-85.
4 -6
4.1
0.3
59.7
-9
.1
-99.
8 C
IDI F
TD, N
NA
NG
20
4.
7 5.
0 -9
8.6
-15.
2 -4
1.4
-44.
7 -1
6.5
-64.
5 -0
.4
-8.8
-3
2.1
-81.
6 -6
4.4
0.3
55.8
-9
.5
-99.
8
50
10.1
10
.4
-98.
3 -1
2.2
-39.
5 -4
4.3
-13.
7 -6
3.7
0.8
-6.4
-3
0.2
-80.
4 -6
4.2
0.3
57.7
-9
.3
-99.
8
80
16.0
16
.3
-98.
0 -9
.0
-37.
5 -4
4.0
-10.
6 -6
2.8
1.9
-4.0
-2
8.2
-79.
2 -6
4.1
0.3
59.7
-9
.0
-99.
8 C
IDI F
TD, N
NA
FG
20
-95.
5 -9
5.5
-98.
5 -9
6.1
-84.
3 -6
8.7
-95.
1 -7
1.7
-5.5
-1
15.6
-8
0.5
-81.
9 -6
4.8
-0.1
40
.8
-9.5
-9
9.8
50
-9
3.0
-93.
0 -9
8.2
-93.
6 -8
2.8
-67.
1 -9
2.8
-70.
8 -4
.6
-107
.8
-77.
1 -8
0.9
-64.
6 -0
.1
42.7
-9
.3
-99.
8
80
-90.
3 -9
0.3
-97.
9 -9
1.2
-81.
4 -6
5.6
-90.
5 -6
9.9
-3.8
-1
00.0
-7
3.8
-79.
7 -6
4.5
-0.1
44
.8
-9.1
-9
9.8
CID
I FTD
, NA
NG
, 20
2.
2 2.
5 -9
9.3
-27.
3 -5
6.3
-48.
8 -2
8.6
-67.
4 -2
.0
-50.
5 -4
4.4
-90.
2 -6
4.6
0.1
45.3
-1
0.8
-100
.7
st
eam
exp
ort
50
8.0
8.3
-99.
0 -2
4.4
-54.
7 -4
8.3
-25.
8 -6
6.7
-1.1
-4
4.4
-42.
4 -8
9.2
-64.
5 0.
1 47
.7
-10.
5 -1
00.6
80
14.2
14
.5
-98.
7 -2
1.5
-52.
9 -4
7.9
-23.
0 -6
6.0
-0.3
-3
7.8
-40.
4 -8
8.1
-64.
3 0.
2 50
.0
-10.
2 -1
00.5
C
IDI F
TD, N
A N
G,
20
11.3
11
.6
-99.
3 -1
9.8
-45.
7 -4
6.6
-21.
1 -6
6.5
-0.3
-4
4.6
-39.
9 -8
9.0
-64.
5 0.
3 50
.8
-10.
1 -1
00.2
elec
trici
ty e
xpor
t 50
17
.3
17.7
-9
9.0
-16.
8 -4
3.9
-46.
2 -1
8.2
-65.
7 0.
3 -3
6.0
-37.
7 -8
7.8
-64.
3 0.
3 52
.9
-9.8
-1
00.2
80
24.1
24
.4
-98.
7 -1
3.6
-42.
0 -4
5.9
-15.
1 -6
4.8
0.9
-27.
1 -3
5.5
-86.
6 -6
4.1
0.3
55.0
-9
.6
-100
.2
CID
I FTD
, NN
A N
G,
20
11.9
12
.2
-98.
6 -1
8.9
-45.
2 -4
6.4
-20.
3 -6
5.0
-0.6
-1
6.6
-35.
8 -8
2.6
-64.
5 0.
3 50
.9
-10.
1 -1
00.2
elec
trici
ty e
xpor
t 50
18
.2
18.5
-9
8.3
-16.
1 -4
3.4
-46.
0 -1
7.5
-64.
2 0.
6 -1
3.4
-33.
8 -8
1.6
-64.
3 0.
3 53
.0
-9.8
-1
00.2
80
25.3
25
.6
-97.
9 -1
2.9
-41.
5 -4
5.6
-14.
4 -6
3.3
1.8
-10.
0 -3
1.8
-80.
5 -6
4.1
0.3
54.9
-9
.6
-100
.1
CID
I BD
20
20
-22.
5 -2
2.5
-28.
2 -3
1.5
-47.
0 -3
4.8
-32.
1 -3
6.0
-1.3
-7
.0
-13.
3 -5
1.3
-62.
2 0.
0 51
.6
-4.4
-8
0.5
50
-1
9.4
-19.
5 -2
5.7
-28.
8 -4
5.0
-34.
2 -2
9.4
-34.
5 -0
.9
-1.9
-1
0.3
-45.
5 -6
2.0
0.0
54.0
-4
.0
-79.
0
80
-16.
2 -1
6.3
-23.
0 -2
5.9
-42.
9 -3
3.5
-26.
6 -3
2.9
-0.5
3.
2 -7
.2
-39.
2 -6
1.9
0.0
56.6
-3
.6
-77.
5 G
I LS
Die
sel H
EVs
20
-44.
2 -4
4.2
-34.
8 -4
0.3
-57.
0 -4
3.7
-40.
9 -6
4.5
-2.5
-3
8.2
-20.
9 -6
8.8
-63.
6 -0
.1
46.7
-2
.1
-84.
6
50
-39.
4 -3
9.4
-30.
9 -3
5.9
-53.
3 -4
3.0
-36.
6 -6
3.6
-2.6
-3
2.0
-14.
4 -5
3.0
-63.
6 0.
0 51
.1
-1.0
-8
0.9
80
-4
6.0
-46.
0 -3
8.1
-42.
7 -5
8.3
-43.
4 -4
3.2
-64.
8 -2
.5
-36.
2 -1
7.6
-61.
3 -6
3.8
-0.1
48
.5
-1.5
-8
3.2
GI D
ME
HEV
s,
20
-34.
5 -3
4.3
-99.
2 -4
7.4
-56.
1 -4
5.2
-47.
6 -7
6.1
-2.4
-4
4.6
-38.
6 -9
1.4
-75.
0 0.
2 54
.1
-12.
4 -9
9.7
N
A N
G
50
-18.
5 -1
8.3
-98.
6 -3
5.7
-48.
6 -4
4.5
-36.
3 -7
3.2
2.1
-12.
3 -3
4.4
-86.
6 -7
4.9
0.3
57.6
-1
2.3
-99.
7
80
-26.
4 -2
6.2
-99.
0 -4
1.5
-52.
3 -4
4.9
-41.
9 -7
5.0
-0.6
-2
9.5
-36.
9 -8
9.0
-74.
9 0.
2 55
.1
-12.
5 -9
9.7
GI F
TD H
EVs,
20
-1
8.5
-18.
3 -9
9.4
-34.
3 -5
3.4
-45.
2 -3
5.1
-68.
4 -1
.4
-45.
0 -3
7.1
-91.
0 -6
4.9
0.2
53.2
-9
.4
-99.
9
NA
NG
50
-2
1.1
-20.
9 -9
9.1
-36.
9 -5
6.0
-44.
8 -3
7.6
-68.
1 -0
.5
-39.
3 -3
4.9
-89.
8 -6
5.2
0.2
52.7
-9
.3
-99.
9
80
-27.
5 -2
7.3
-99.
5 -4
1.6
-58.
8 -4
5.1
-42.
2 -6
9.2
-1.5
-4
7.6
-36.
6 -9
1.4
-65.
2 0.
2 51
.0
-9.4
-9
9.9
GI F
TD H
EVs,
20
-2
7.0
-26.
8 -9
9.0
-41.
4 -5
9.1
-44.
9 -4
2.0
-68.
0 -1
.5
-29.
3 -3
4.4
-87.
0 -6
5.1
0.2
50.4
-9
.6
-99.
9
NN
A N
G
50
-20.
6 -2
0.4
-98.
8 -3
6.7
-56.
0 -4
4.7
-37.
5 -6
7.2
-0.8
-2
5.3
-32.
6 -8
5.9
-64.
8 0.
2 52
.5
-9.3
-9
9.9
80
-1
3.1
-12.
9 -9
8.5
-31.
3 -5
2.4
-44.
4 -3
2.2
-66.
3 -0
.1
-21.
1 -3
0.8
-84.
6 -6
4.6
0.2
54.7
-9
.1
-99.
9 G
I FTD
HEV
s,
20
-96.
8 -9
6.8
-98.
9 -9
7.2
-88.
4 -6
2.8
-96.
2 -7
3.0
-5.5
-1
05.5
-6
9.9
-87.
2 -6
5.3
-0.1
39
.7
-9.6
-9
9.9
N
NA
FG
50
-94.
9 -9
4.9
-98.
7 -9
5.4
-87.
2 -6
1.1
-94.
5 -7
2.4
-4.7
-9
9.4
-66.
5 -8
6.2
-65.
1 -0
.1
41.7
-9
.3
-99.
9
80
-92.
9 -9
3.0
-98.
4 -9
3.6
-85.
8 -5
9.7
-92.
8 -7
1.6
-4.0
-9
3.5
-63.
4 -8
5.0
-64.
9 -0
.1
43.7
-9
.1
-99.
9 G
I FTD
HEV
s,
20
-28.
8 -2
8.6
-99.
5 -4
9.6
-69.
3 -4
7.9
-50.
2 -7
0.1
-3.0
-5
8.6
-43.
2 -9
3.2
-65.
2 0.
0 43
.1
-10.
5 -1
00.5
NA
NG
, 50
-2
2.0
-21.
8 -9
9.3
-45.
5 -6
6.8
-47.
6 -4
6.2
-69.
4 -2
.2
-54.
0 -4
1.4
-92.
2 -6
5.0
0.1
45.3
-1
0.2
-100
.4
st
eam
exp
ort
80
-14.
2 -1
4.0
-99.
1 -4
0.9
-64.
2 -4
7.2
-41.
7 -6
8.6
-1.4
-4
8.8
-39.
6 -9
1.1
-64.
8 0.
1 47
.6
-9.9
-1
00.4
26
TA
BL
E 2
(C
ont.)
Vehi
cle/
Fuel
Tec
h.
Prob
abili
ty
To
tal
Ener
gy
Foss
il Pe
trol
eum
C
O2
CH
4 N
2O
GH
Gs
T.VO
C
T.C
O
T.N
Ox
T.PM
10
T.SO
x U
.VO
C
U.C
O
U.N
Ox
U.P
M10
U
.SO
x G
I FTD
HEV
s,
20
-22.
7 -2
2.4
-99.
5 -4
4.7
-62.
0 -4
6.3
-45.
2 -6
9.4
-2.0
-5
4.0
-40.
0 -9
2.3
-65.
1 0.
2 46
.8
-10.
0 -1
00.2
NA
NG
, 50
-1
5.4
-15.
1 -9
9.3
-40.
1 -5
9.1
-46.
0 -4
0.8
-68.
6 -1
.1
-47.
9 -3
8.0
-91.
3 -6
4.9
0.2
49.0
-9
.7
-100
.1
el
ectri
city
exp
ort
80
-6.9
-6
.6
-99.
0 -3
4.7
-55.
7 -4
5.8
-35.
6 -6
7.7
-0.3
-4
1.4
-36.
1 -9
0.0
-64.
7 0.
2 51
.2
-9.5
-1
00.1
G
I FTD
HEV
s,
20
-21.
7 -2
1.5
-99.
0 -4
4.0
-61.
7 -4
6.2
-44.
6 -6
8.4
-1.7
-3
4.6
-37.
0 -8
7.7
-65.
1 0.
2 46
.9
-10.
0 -1
00.1
NN
A N
G,
50
-14.
8 -1
4.5
-98.
8 -3
9.6
-58.
8 -4
5.9
-40.
3 -6
7.5
-0.9
-3
0.6
-35.
2 -8
6.7
-64.
9 0.
2 49
.0
-9.7
-1
00.1
elec
trici
ty e
xpor
t 80
-6
.5
-6.2
-9
8.5
-34.
3 -5
5.4
-45.
6 -3
5.2
-66.
6 -0
.2
-26.
4 -3
3.4
-85.
5 -6
4.7
0.2
51.2
-9
.5
-100
.1
GI B
D20
HEV
s 20
-4
6.9
-46.
9 -5
0.4
-53.
1 -6
3.3
-37.
9 -5
3.1
-47.
8 -2
.4
-29.
8 -2
2.8
-72.
1 -6
3.6
-0.1
46
.2
-5.3
-8
8.1
50
-4
3.2
-43.
3 -4
7.8
-49.
9 -6
0.6
-37.
0 -5
0.0
-46.
2 -2
.4
-25.
3 -1
7.7
-59.
8 -6
3.6
-0.1
49
.5
-4.5
-8
5.4
80
-4
5.4
-45.
4 -4
9.5
-51.
7 -6
2.2
-37.
6 -5
1.8
-47.
3 -2
.2
-26.
2 -1
9.4
-64.
8 -6
3.6
-0.1
48
.0
-4.9
-8
6.1
EVs,
U.S
. Mix
20
-4
7.1
-54.
4 -9
8.5
-44.
9 -5
0.9
-89.
4 -4
5.9
-89.
7 -9
7.9
71.6
22
.7
266.
3 -9
9.8
-99.
9 -8
3.9
-32.
9 -9
7.3
50
-3
8.9
-46.
7 -9
8.1
-34.
8 -4
2.8
-87.
4 -3
6.0
-87.
2 -9
7.2
105.
7 43
.1
356.
2 -9
9.7
-99.
9 -8
0.9
-32.
5 -9
6.8
80
-4
5.3
-53.
5 -9
8.3
-44.
7 -4
9.6
-88.
5 -4
5.7
-89.
5 -9
7.8
71.3
23
.2
264.
8 -9
9.7
-99.
9 -8
0.9
-32.
6 -9
6.7
EVs,
NE
U.S
. Mix
20
-5
3.5
-62.
2 -9
7.5
-59.
6 -5
6.4
-91.
5 -6
0.1
-93.
5 -9
8.3
3.9
-9.9
84
.0
-99.
6 -9
9.9
-66.
1 -3
1.1
-93.
6
50
-49.
7 -5
9.0
-97.
2 -5
6.1
-52.
9 -9
0.6
-56.
7 -9
2.8
-98.
0 14
.4
-5.3
10
3.7
-99.
6 -9
9.8
-63.
1 -3
0.8
-92.
9
80
-45.
5 -5
5.5
-96.
9 -5
2.3
-48.
9 -8
9.7
-52.
9 -9
2.1
-97.
7 25
.8
-0.2
12
4.9
-99.
5 -9
9.8
-59.
5 -3
0.4
-92.
0 EV
s, C
A M
ix
20
-57.
4 -6
7.9
-99.
7 -6
6.9
-61.
6 -9
2.5
-67.
2 -9
5.1
-98.
6 -1
8.3
-20.
1 35
.2
-99.
7 -9
9.9
-74.
2 -3
2.0
-99.
8
50
-53.
9 -6
5.2
-99.
6 -6
4.0
-58.
4 -9
1.8
-64.
3 -9
4.6
-98.
3 -1
0.1
-16.
3 49
.8
-99.
6 -9
9.9
-71.
9 -3
1.7
-99.
8
80
-50.
1 -6
2.2
-99.
6 -6
0.8
-54.
9 -9
1.0
-61.
2 -9
4.0
-98.
0 -0
.9
-12.
3 66
.0
-99.
6 -9
9.8
-69.
3 -3
1.5
-99.
7 H
2 FC
Vs, C
entra
l 20
-4
0.6
-41.
5 -9
9.4
-51.
1 -5
1.3
-96.
3 -5
2.0
-97.
2 -9
8.3
-49.
3 -3
9.1
-42.
1 -9
9.9
-100
.0
-80.
3 -3
4.1
-97.
8
G.H
2, N
A N
G
50
-29.
8 -3
0.7
-99.
0 -4
3.0
-47.
0 -9
4.9
-44.
0 -9
5.5
-96.
8 -3
3.5
-32.
8 -2
8.1
-99.
9 -1
00.0
-7
7.8
-33.
9 -9
7.6
80
-3
3.4
-34.
4 -9
9.3
-46.
1 -4
9.6
-95.
7 -4
7.1
-96.
8 -9
8.0
-46.
1 -3
7.9
-43.
6 -9
9.9
-100
.0
-79.
2 -3
4.0
-97.
7 H
2 FC
Vs, C
entra
l 20
-3
4.5
-35.
4 -9
9.4
-46.
1 -4
1.5
-94.
8 -4
6.5
-93.
8 -9
7.2
1.6
-35.
1 -4
8.1
-99.
9 -1
00.0
-8
1.2
-34.
2 -9
7.8
G
.H2,
NN
A N
G
50
-30.
6 -3
1.6
-99.
2 -4
3.1
-26.
6 -9
4.3
-43.
6 -9
2.9
-96.
4 2.
6 -3
2.4
-37.
8 -9
9.9
-100
.0
-80.
2 -3
4.0
-97.
7
80
-26.
5 -2
7.6
-99.
0 -4
0.2
-10.
6 -9
3.8
-40.
7 -9
1.8
-95.
6 3.
7 -2
9.7
-27.
1 -9
9.9
-100
.0
-79.
2 -3
3.8
-97.
6 H
2 FC
Vs, C
entra
l 20
-1
28.0
-1
29.3
-9
9.4
-120
.3
-71.
5 -1
16.5
-1
18.7
-1
00.6
-1
02.2
-1
15.8
-7
9.3
-49.
0 -9
9.9
-100
.0
-81.
2 -3
4.2
-97.
8
G.H
2, N
NA
FG
50
-126
.0
-127
.3
-99.
2 -1
18.7
-6
9.0
-115
.4
-117
.1
-99.
7 -1
01.4
-1
03.9
-7
6.4
-38.
9 -9
9.9
-100
.0
-80.
2 -3
4.0
-97.
7
80
-123
.9
-125
.3
-99.
0 -1
17.1
-6
6.2
-114
.4
-115
.6
-98.
7 -1
00.6
-9
1.3
-73.
6 -2
8.3
-99.
9 -1
00.0
-7
9.2
-33.
8 -9
7.6
H2
FCVs
, Cen
tral
20
-44.
5 -4
5.5
-99.
4 -5
4.8
-57.
9 -9
7.6
-55.
8 -9
7.8
-99.
1 -5
5.2
-42.
3 -4
7.2
-99.
9 -1
00.0
-8
1.3
-34.
2 -9
7.8
G
.H2,
NA
NG
, 50
-4
0.9
-41.
8 -9
9.2
-52.
0 -5
6.0
-97.
2 -5
3.0
-97.
2 -9
8.5
-49.
8 -4
0.1
-39.
7 -9
9.9
-100
.0
-80.
3 -3
4.0
-97.
7
stea
m e
xpor
t 80
-3
6.9
-37.
9 -9
9.1
-48.
9 -5
4.1
-96.
7 -5
0.0
-96.
5 -9
7.9
-44.
4 -3
7.8
-31.
6 -9
9.9
-100
.0
-79.
3 -3
3.8
-97.
6 H
2 FC
Vs, C
entra
l 20
-4
0.3
-41.
3 -9
9.4
-51.
4 -5
3.0
-96.
7 -5
2.3
-97.
4 -9
8.5
-51.
4 -4
0.1
-46.
5 -9
9.9
-100
.0
-81.
3 -3
4.2
-97.
8
G.H
2, N
A N
G,
50
-36.
7 -3
7.7
-99.
2 -4
8.7
-51.
4 -9
6.3
-49.
7 -9
6.7
-97.
9 -4
6.1
-38.
1 -3
9.2
-99.
9 -1
00.0
-8
0.3
-34.
0 -9
7.7
el
ectri
city
exp
ort
80
-32.
9 -3
3.9
-99.
0 -4
5.8
-49.
7 -9
5.8
-46.
9 -9
6.0
-97.
2 -4
0.5
-35.
9 -3
1.2
-99.
9 -1
00.0
-7
9.3
-33.
8 -9
7.6
H2
FCVs
, Sta
tion
20
-36.
8 -3
7.4
-99.
7 -4
9.0
-50.
7 -9
5.8
-50.
0 -9
5.3
-97.
8 -5
2.3
-40.
6 -6
1.4
-96.
2 -9
8.5
41.5
-2
5.2
-99.
6
G.H
2, N
A N
G
50
-32.
2 -3
2.7
-99.
6 -4
5.6
-49.
2 -9
5.4
-46.
7 -9
4.5
-97.
1 -4
6.9
-38.
8 -5
7.9
-95.
9 -9
8.4
52.2
-2
4.5
-99.
6
80
-26.
7 -2
7.3
-99.
4 -4
1.6
-47.
6 -9
4.9
-42.
8 -9
3.8
-96.
3 -4
1.2
-37.
0 -5
4.2
-95.
6 -9
8.2
63.9
-2
3.8
-99.
5 H
2 FC
Vs, S
tatio
n 20
-3
2.4
-33.
0 -9
9.7
-45.
8 -4
2.2
-94.
6 -4
6.2
-92.
0 -9
6.5
-1.2
-3
6.8
-60.
6 -9
6.5
-98.
5 36
.6
-25.
4 -9
9.6
G
.H2,
NN
A N
G
50
-27.
3 -2
7.9
-99.
5 -4
2.1
-25.
5 -9
4.1
-42.
5 -9
0.9
-95.
7 -2
.1
-34.
5 -5
6.5
-96.
2 -9
8.4
47.6
-2
4.7
-99.
6
80
-21.
2 -2
1.8
-99.
3 -3
7.8
-6.2
-9
3.5
-38.
3 -8
9.8
-94.
8 -3
.2
-32.
1 -5
1.8
-95.
9 -9
8.3
59.3
-2
4.0
-99.
5 H
2 FC
Vs, E
lect
roly
sis
20
23.4
6.
2 -9
6.3
26.8
14
.2
-75.
3 24
.5
-76.
5 -9
5.3
279.
5 11
8.4
717.
5 -9
9.5
-99.
8 -6
2.1
-30.
7 -9
3.5
G
.H2,
U.S
. mix
50
33
.0
15.0
-9
6.0
37.8
23
.3
-72.
9 35
.2
-74.
4 -9
4.7
319.
9 13
5.5
800.
0 -9
9.4
-99.
8 -5
9.0
-30.
4 -9
2.8
80
44
.3
25.1
-9
5.6
50.3
33
.8
-70.
1 47
.4
-71.
9 -9
4.1
364.
0 15
5.0
895.
1 -9
9.4
-99.
8 -5
5.4
-30.
0 -9
2.0
H2
FCVs
, Ele
ctro
lysi
s 20
7.
8 8.
1 -9
9.8
12.7
44
.7
-69.
4 12
.2
-94.
3 -9
4.6
67.6
9.
3 -8
4.4
-99.
7 -1
00.0
-9
3.5
-34.
3 -1
00.0
G.H
2, N
GC
C
50
16.2
16
.6
-99.
5 21
.0
55.4
-6
6.7
20.4
-9
2.8
-93.
0 86
.2
15.5
-8
2.5
-99.
6 -1
00.0
-9
2.9
-34.
1 -9
9.9
80
26
.0
26.3
-9
9.2
30.7
67
.6
-63.
6 29
.9
-91.
1 -9
1.2
107.
3 22
.6
-80.
2 -9
9.6
-100
.0
-92.
3 -3
4.0
-99.
9 H
2 FC
Vs, E
lect
roly
sis
20
-37.
6 -9
5.0
-99.
8 -9
4.0
-94.
5 -9
8.8
-94.
1 -9
8.8
-99.
8 -8
1.5
-47.
6 -6
1.9
-100
.0
-100
.0
-98.
2 -3
4.4
-99.
7
G.H
2, n
ucle
ar p
ower
50
-3
3.4
-94.
6 -9
9.8
-93.
5 -9
4.1
-98.
7 -9
3.6
-98.
7 -9
9.7
-79.
7 -4
6.2
-58.
1 -1
00.0
-1
00.0
-9
8.1
-34.
2 -9
9.7
80
-2
8.8
-94.
1 -9
9.8
-93.
0 -9
3.6
-98.
6 -9
3.1
-98.
6 -9
9.7
-77.
7 -4
4.8
-54.
0 -1
00.0
-1
00.0
-9
7.9
-34.
0 -9
9.6
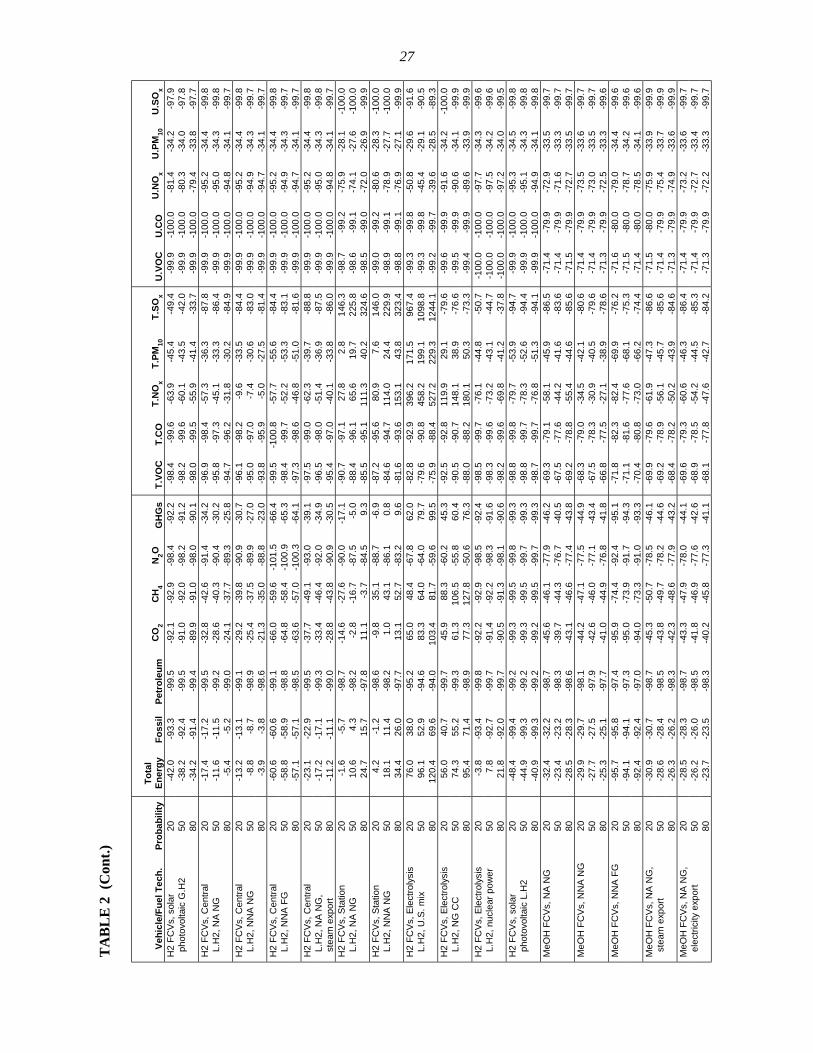
27
TA
BL
E 2
(C
ont.)
Vehi
cle/
Fuel
Tec
h.
Prob
abili
ty
To
tal
Ener
gy
Foss
il Pe
trol
eum
C
O2
CH
4 N
2O
GH
Gs
T.VO
C
T.C
O
T.N
Ox
T.PM
10
T.SO
x U
.VO
C
U.C
O
U.N
Ox
U.P
M10
U
.SO
x H
2 FC
Vs, s
olar
20
-4
2.0
-93.
3 -9
9.5
-92.
1 -9
2.9
-98.
4 -9
2.2
-98.
4 -9
9.6
-63.
9 -4
5.4
-49.
4 -9
9.9
-100
.0
-81.
4 -3
4.2
-97.
9 p
hoto
volta
ic G
.H2
50
-38.
2 -9
2.4
-99.
5 -9
1.0
-92.
0 -9
8.2
-91.
2 -9
8.2
-99.
6 -6
0.1
-43.
5 -4
2.0
-99.
9 -1
00.0
-8
0.3
-34.
0 -9
7.8
80
-3
4.2
-91.
4 -9
9.4
-89.
9 -9
1.0
-98.
0 -9
0.1
-98.
0 -9
9.5
-55.
9 -4
1.4
-33.
7 -9
9.9
-100
.0
-79.
4 -3
3.8
-97.
7 H
2 FC
Vs, C
entra
l 20
-1
7.4
-17.
2 -9
9.5
-32.
8 -4
2.6
-91.
4 -3
4.2
-96.
9 -9
8.4
-57.
3 -3
6.3
-87.
8 -9
9.9
-100
.0
-95.
2 -3
4.4
-99.
8 L
.H2,
NA
NG
50
-1
1.6
-11.
5 -9
9.2
-28.
6 -4
0.3
-90.
4 -3
0.2
-95.
8 -9
7.3
-45.
1 -3
3.3
-86.
4 -9
9.9
-100
.0
-95.
0 -3
4.3
-99.
8
80
-5.4
-5
.2
-99.
0 -2
4.1
-37.
7 -8
9.3
-25.
8 -9
4.7
-96.
2 -3
1.8
-30.
2 -8
4.9
-99.
9 -1
00.0
-9
4.8
-34.
1 -9
9.7
H2
FCVs
, Cen
tral
20
-13.
2 -1
3.1
-99.
1 -2
9.2
-39.
8 -9
0.9
-30.
7 -9
6.1
-98.
2 -9
.6
-33.
5 -8
4.4
-99.
9 -1
00.0
-9
5.2
-34.
4 -9
9.8
L.H
2, N
NA
NG
50
-8
.8
-8.7
-9
8.9
-25.
4 -3
7.5
-89.
9 -2
7.0
-95.
0 -9
7.0
-7.4
-3
0.6
-83.
0 -9
9.9
-100
.0
-94.
9 -3
4.3
-99.
7
80
-3.9
-3
.8
-98.
6 -2
1.3
-35.
0 -8
8.8
-23.
0 -9
3.8
-95.
9 -5
.0
-27.
5 -8
1.4
-99.
9 -1
00.0
-9
4.7
-34.
1 -9
9.7
H2
FCVs
, Cen
tral
20
-60.
6 -6
0.6
-99.
1 -6
6.0
-59.
6 -1
01.5
-6
6.4
-99.
5 -1
00.8
-5
7.7
-55.
6 -8
4.4
-99.
9 -1
00.0
-9
5.2
-34.
4 -9
9.8
L.H
2, N
NA
FG
50
-58.
8 -5
8.9
-98.
8 -6
4.8
-58.
4 -1
00.9
-6
5.3
-98.
4 -9
9.7
-52.
2 -5
3.3
-83.
1 -9
9.9
-100
.0
-94.
9 -3
4.3
-99.
7
80
-57.
1 -5
7.1
-98.
5 -6
3.6
-57.
0 -1
00.3
-6
4.1
-97.
3 -9
8.6
-46.
8 -5
1.0
-81.
6 -9
9.9
-100
.0
-94.
7 -3
4.1
-99.
7 H
2 FC
Vs, C
entra
l 20
-2
3.1
-22.
9 -9
9.5
-37.
7 -4
9.1
-93.
0 -3
9.1
-97.
5 -9
9.0
-62.
3 -3
9.7
-88.
8 -9
9.9
-100
.0
-95.
2 -3
4.4
-99.
8 L
.H2,
NA
NG
, 50
-1
7.2
-17.
1 -9
9.3
-33.
4 -4
6.4
-92.
0 -3
4.9
-96.
5 -9
8.0
-51.
4 -3
6.9
-87.
5 -9
9.9
-100
.0
-95.
0 -3
4.3
-99.
8 s
team
exp
ort
80
-11.
2 -1
1.1
-99.
0 -2
8.8
-43.
8 -9
0.9
-30.
5 -9
5.4
-97.
0 -4
0.1
-33.
8 -8
6.0
-99.
9 -1
00.0
-9
4.8
-34.
1 -9
9.7
H2
FCVs
, Sta
tion
20
-1
.6
-5.7
-9
8.7
-14.
6 -2
7.6
-90.
0 -1
7.1
-90.
7 -9
7.1
27.8
2.
8 14
6.3
-98.
7 -9
9.2
-75.
9 -2
8.1
-100
.0
L.H
2, N
A N
G
50
10.6
4.
3 -9
8.2
-2.8
-1
6.7
-87.
5 -5
.0
-88.
4 -9
6.1
65.6
19
.7
225.
8 -9
8.6
-99.
1 -7
4.1
-27.
6 -1
00.0
80
24.7
15
.7
-97.
8 11
.1
-3.7
-8
4.5
9.3
-85.
5 -9
5.1
111.
3 40
.2
324.
6 -9
8.5
-99.
0 -7
2.0
-26.
9 -9
9.9
H2
FCVs
, Sta
tion
20
4.
2 -1
.2
-98.
6 -9
.8
35.1
-8
8.7
-6.9
-8
7.2
-95.
6 80
.9
7.6
146.
0 -9
9.0
-99.
2 -8
0.6
-28.
3 -1
00.0
L
.H2,
NN
A N
G
50
18.1
11
.4
-98.
2 1.
0 43
.1
-86.
1 0.
8 -8
4.6
-94.
7 11
4.0
24.4
22
9.9
-98.
9 -9
9.1
-78.
9 -2
7.7
-100
.0
80
34
.4
26.0
-9
7.7
13.1
52
.7
-83.
2 9.
6 -8
1.6
-93.
6 15
3.1
43.8
32
3.4
-98.
8 -9
9.1
-76.
9 -2
7.1
-99.
9 H
2 FC
Vs, E
lect
roly
sis
20
76
.0
38.0
-9
5.2
65.0
48
.4
-67.
8 62
.0
-82.
8 -9
2.9
396.
2 17
1.5
967.
4 -9
9.3
-99.
8 -5
0.8
-29.
6 -9
1.6
L.H
2, U
.S. m
ix
50
96.1
52
.9
-94.
6 83
.3
64.0
-6
4.0
79.7
-7
9.6
-90.
8 45
8.2
199.
1 10
98.8
-9
9.3
-99.
8 -4
5.4
-29.
1 -9
0.5
80
12
0.4
69.6
-9
4.0
103.
4 81
.7
-59.
6 99
.5
-75.
9 -8
8.4
527.
2 22
9.3
1244
.1
-99.
2 -9
9.7
-39.
6 -2
8.5
-89.
3 H
2 FC
Vs, E
lect
roly
sis
20
56
.0
40.7
-9
9.7
45.9
88
.3
-60.
2 45
.3
-92.
5 -9
2.8
119.
9 29
.1
-79.
6 -9
9.6
-99.
9 -9
1.6
-34.
2 -1
00.0
L
.H2,
NG
CC
50
74
.3
55.2
-9
9.3
61.3
10
6.5
-55.
8 60
.4
-90.
5 -9
0.7
148.
1 38
.9
-76.
6 -9
9.5
-99.
9 -9
0.6
-34.
1 -9
9.9
80
95
.4
71.4
-9
8.9
77.3
12
7.8
-50.
6 76
.3
-88.
0 -8
8.2
180.
1 50
.3
-73.
3 -9
9.4
-99.
9 -8
9.6
-33.
9 -9
9.9
H2
FCVs
, Ele
ctro
lysi
s
20
-3.8
-9
3.4
-99.
8 -9
2.2
-92.
9 -9
8.5
-92.
4 -9
8.5
-99.
7 -7
6.1
-44.
8 -5
0.7
-100
.0
-100
.0
-97.
7 -3
4.3
-99.
6 L
.H2,
nuc
lear
pow
er
50
7.8
-92.
7 -9
9.7
-91.
4 -9
2.2
-98.
3 -9
1.6
-98.
3 -9
9.6
-73.
2 -4
3.1
-44.
7 -1
00.0
-1
00.0
-9
7.5
-34.
2 -9
9.6
80
21
.8
-92.
0 -9
9.7
-90.
5 -9
1.3
-98.
1 -9
0.6
-98.
2 -9
9.6
-69.
8 -4
1.2
-37.
8 -1
00.0
-1
00.0
-9
7.2
-34.
0 -9
9.5
H2
FCVs
, sol
ar
20
-48.
4 -9
9.4
-99.
2 -9
9.3
-99.
5 -9
9.8
-99.
3 -9
8.8
-99.
8 -7
9.7
-53.
9 -9
4.7
-99.
9 -1
00.0
-9
5.3
-34.
5 -9
9.8
pho
tovo
ltaic
L.H
2 50
-4
4.9
-99.
3 -9
9.2
-99.
3 -9
9.5
-99.
7 -9
9.3
-98.
8 -9
9.7
-78.
3 -5
2.6
-94.
4 -9
9.9
-100
.0
-95.
1 -3
4.3
-99.
8
80
-40.
9 -9
9.3
-99.
2 -9
9.2
-99.
5 -9
9.7
-99.
3 -9
8.7
-99.
7 -7
6.8
-51.
3 -9
4.1
-99.
9 -1
00.0
-9
4.9
-34.
1 -9
9.8
MeO
H F
CVs
, NA
NG
20
-3
2.4
-32.
2 -9
8.7
-45.
6 -4
6.1
-77.
9 -4
6.2
-69.
3 -7
9.1
-58.
1 -4
5.9
-86.
5 -7
1.4
-79.
9 -7
2.9
-33.
5 -9
9.7
50
-2
3.4
-23.
2 -9
8.3
-39.
7 -4
4.3
-76.
7 -4
0.5
-67.
5 -7
7.6
-44.
2 -4
1.6
-83.
6 -7
1.4
-79.
9 -7
1.6
-33.
3 -9
9.7
80
-2
8.5
-28.
3 -9
8.6
-43.
1 -4
6.6
-77.
4 -4
3.8
-69.
2 -7
8.8
-55.
4 -4
4.6
-85.
6 -7
1.5
-79.
9 -7
2.7
-33.
5 -9
9.7
MeO
H F
CVs
, NN
A N
G
20
-29.
9 -2
9.7
-98.
1 -4
4.2
-47.
1 -7
7.5
-44.
9 -6
8.3
-79.
0 -3
4.5
-42.
1 -8
0.6
-71.
4 -7
9.9
-73.
5 -3
3.6
-99.
7
50
-27.
7 -2
7.5
-97.
9 -4
2.6
-46.
0 -7
7.1
-43.
4 -6
7.5
-78.
3 -3
0.9
-40.
5 -7
9.6
-71.
4 -7
9.9
-73.
0 -3
3.5
-99.
7
80
-25.
3 -2
5.1
-97.
7 -4
1.0
-44.
9 -7
6.8
-41.
8 -6
6.8
-77.
5 -2
7.1
-38.
9 -7
8.6
-71.
3 -7
9.9
-72.
5 -3
3.3
-99.
6 M
eOH
FC
Vs, N
NA
FG
20
-95.
7 -9
5.8
-97.
4 -9
5.9
-74.
4 -9
2.4
-95.
1 -7
1.8
-82.
3 -8
2.4
-69.
9 -7
6.2
-71.
6 -8
0.0
-79.
0 -3
4.4
-99.
6
50
-94.
1 -9
4.1
-97.
3 -9
5.0
-73.
9 -9
1.7
-94.
3 -7
1.1
-81.
6 -7
7.6
-68.
1 -7
5.3
-71.
5 -8
0.0
-78.
7 -3
4.2
-99.
6
80
-92.
4 -9
2.4
-97.
0 -9
4.0
-73.
3 -9
1.0
-93.
3 -7
0.4
-80.
8 -7
3.0
-66.
2 -7
4.4
-71.
4 -8
0.0
-78.
5 -3
4.1
-99.
6 M
eOH
FC
Vs, N
A N
G,
20
-30.
9 -3
0.7
-98.
7 -4
5.3
-50.
7 -7
8.5
-46.
1 -6
9.9
-79.
6 -6
1.9
-47.
3 -8
6.6
-71.
5 -8
0.0
-75.
9 -3
3.9
-99.
9 s
team
exp
ort
50
-28.
6 -2
8.4
-98.
5 -4
3.8
-49.
7 -7
8.2
-44.
6 -6
9.2
-78.
9 -5
6.1
-45.
7 -8
5.6
-71.
4 -7
9.9
-75.
4 -3
3.7
-99.
9
80
-26.
3 -2
6.2
-98.
3 -4
2.3
-48.
6 -7
7.9
-43.
2 -6
8.4
-78.
2 -5
0.2
-43.
9 -8
4.6
-71.
3 -7
9.9
-74.
9 -3
3.6
-99.
9 M
eOH
FC
Vs, N
A N
G,
20
-28.
5 -2
8.3
-98.
7 -4
3.3
-47.
9 -7
8.0
-44.
1 -6
9.6
-79.
3 -6
0.6
-46.
3 -8
6.4
-71.
4 -7
9.9
-73.
2 -3
3.6
-99.
7 e
lect
ricity
exp
ort
50
-26.
2 -2
6.0
-98.
5 -4
1.8
-46.
9 -7
7.6
-42.
6 -6
8.9
-78.
5 -5
4.2
-44.
5 -8
5.3
-71.
4 -7
9.9
-72.
7 -3
3.4
-99.
7
80
-23.
7 -2
3.5
-98.
3 -4
0.2
-45.
8 -7
7.3
-41.
1 -6
8.1
-77.
8 -4
7.6
-42.
7 -8
4.2
-71.
3 -7
9.9
-72.
2 -3
3.3
-99.
7
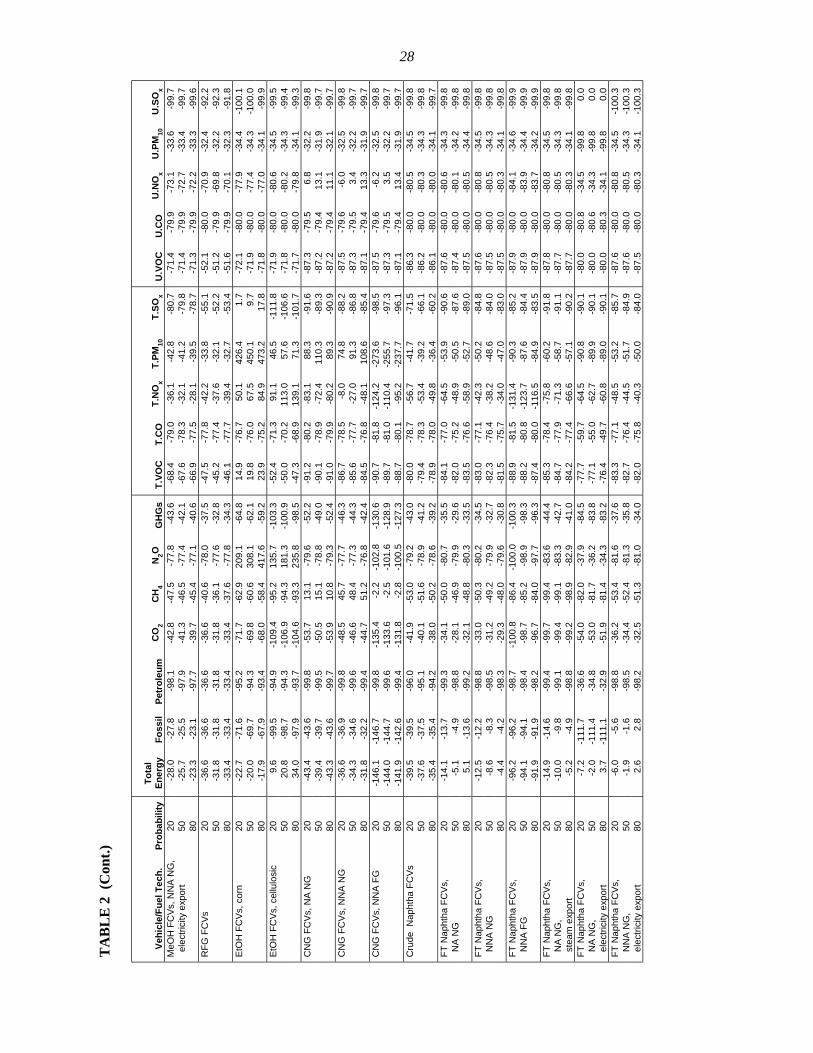
28
TA
BL
E 2
(C
ont.)
Vehi
cle/
Fuel
Tec
h.
Prob
abili
ty
To
tal
Ener
gy
Foss
il Pe
trol
eum
C
O2
CH
4 N
2O
GH
Gs
T.VO
C
T.C
O
T.N
Ox
T.PM
10
T.SO
x U
.VO
C
U.C
O
U.N
Ox
U.P
M10
U
.SO
x M
eOH
FC
Vs, N
NA
NG
, 20
-2
8.0
-27.
8 -9
8.1
-42.
8 -4
7.5
-77.
8 -4
3.6
-68.
4 -7
9.0
-36.
1 -4
2.8
-80.
7 -7
1.4
-79.
9 -7
3.1
-33.
6 -9
9.7
ele
ctric
ity e
xpor
t 50
-2
5.7
-25.
5 -9
7.9
-41.
3 -4
6.5
-77.
4 -4
2.1
-67.
6 -7
8.3
-32.
1 -4
1.2
-79.
8 -7
1.4
-79.
9 -7
2.7
-33.
4 -9
9.7
80
-2
3.3
-23.
1 -9
7.7
-39.
7 -4
5.4
-77.
1 -4
0.6
-66.
9 -7
7.5
-28.
1 -3
9.5
-78.
7 -7
1.3
-79.
9 -7
2.2
-33.
3 -9
9.6
RFG
FC
Vs
20
-36.
6 -3
6.6
-36.
6 -3
6.6
-40.
6 -7
8.0
-37.
5 -4
7.5
-77.
8 -4
2.2
-33.
8 -5
5.1
-52.
1 -8
0.0
-70.
9 -3
2.4
-92.
2
50
-31.
8 -3
1.8
-31.
8 -3
1.8
-36.
1 -7
7.6
-32.
8 -4
5.2
-77.
4 -3
7.6
-32.
1 -5
2.2
-51.
2 -7
9.9
-69.
8 -3
2.2
-92.
3
80
-33.
4 -3
3.4
-33.
4 -3
3.4
-37.
6 -7
7.8
-34.
3 -4
6.1
-77.
7 -3
9.4
-32.
7 -5
3.4
-51.
6 -7
9.9
-70.
1 -3
2.3
-91.
8 Et
OH
FC
Vs, c
orn
20
-22.
7 -7
1.6
-95.
2 -7
1.7
-62.
9 20
9.1
-64.
8 14
.9
-76.
7 50
.1
426.
4 1.
7 -7
2.1
-80.
0 -7
7.9
-34.
4 -1
00.1
50
-20.
0 -6
9.7
-94.
3 -6
9.8
-60.
6 30
8.1
-62.
1 19
.8
-76.
0 67
.5
450.
1 9.
7 -7
1.9
-80.
0 -7
7.4
-34.
3 -1
00.0
80
-17.
9 -6
7.9
-93.
4 -6
8.0
-58.
4 41
7.6
-59.
2 23
.9
-75.
2 84
.9
473.
2 17
.8
-71.
8 -8
0.0
-77.
0 -3
4.1
-99.
9 Et
OH
FC
Vs, c
ellu
losi
c 20
9.
6 -9
9.5
-94.
9 -1
09.4
-9
5.2
135.
7 -1
03.3
-5
2.4
-71.
3 91
.1
46.5
-1
11.8
-7
1.9
-80.
0 -8
0.6
-34.
5 -9
9.5
50
20
.8
-98.
7 -9
4.3
-106
.9
-94.
3 18
1.3
-100
.9
-50.
0 -7
0.2
113.
0 57
.6
-106
.6
-71.
8 -8
0.0
-80.
2 -3
4.3
-99.
4
80
34.0
-9
7.9
-93.
7 -1
04.6
-9
3.3
235.
8 -9
8.5
-47.
3 -6
8.9
139.
1 71
.3
-101
.7
-71.
7 -8
0.0
-79.
8 -3
4.1
-99.
3 C
NG
FC
Vs, N
A N
G
20
-43.
4 -4
3.6
-99.
8 -5
3.7
13.1
-7
9.6
-52.
2 -9
1.2
-80.
2 -8
3.1
88.3
-9
1.6
-87.
3 -7
9.5
6.8
-32.
2 -9
9.8
50
-3
9.4
-39.
7 -9
9.5
-50.
5 15
.1
-78.
8 -4
9.0
-90.
1 -7
8.9
-72.
4 11
0.3
-89.
3 -8
7.2
-79.
4 13
.1
-31.
9 -9
9.7
80
-4
3.3
-43.
6 -9
9.7
-53.
9 10
.8
-79.
3 -5
2.4
-91.
0 -7
9.9
-80.
2 89
.3
-90.
9 -8
7.2
-79.
4 11
.1
-32.
1 -9
9.7
CN
G F
CVs
, NN
A N
G
20
-36.
6 -3
6.9
-99.
8 -4
8.5
45.7
-7
7.7
-46.
3 -8
6.7
-78.
5 -8
.0
74.8
-8
8.2
-87.
5 -7
9.6
-6.0
-3
2.5
-99.
8
50
-34.
3 -3
4.6
-99.
6 -4
6.6
48.4
-7
7.3
-44.
3 -8
5.6
-77.
7 -2
7.0
91.3
-8
6.8
-87.
3 -7
9.5
3.4
-32.
2 -9
9.7
80
-3
1.8
-32.
2 -9
9.4
-44.
7 51
.2
-76.
8 -4
2.4
-84.
5 -7
6.8
-48.
1 10
8.6
-85.
4 -8
7.1
-79.
4 13
.3
-31.
9 -9
9.7
CN
G F
CVs
, NN
A FG
20
-1
46.1
-1
46.7
-9
9.8
-135
.4
-2.2
-1
02.8
-1
30.6
-9
0.7
-81.
8 -1
24.2
-2
73.6
-9
8.5
-87.
5 -7
9.6
-6.2
-3
2.5
-99.
8
50
-144
.0
-144
.7
-99.
6 -1
33.6
-2
.5
-101
.6
-128
.9
-89.
7 -8
1.0
-110
.4
-255
.7
-97.
3 -8
7.3
-79.
5 3.
5 -3
2.2
-99.
7
80
-141
.9
-142
.6
-99.
4 -1
31.8
-2
.8
-100
.5
-127
.3
-88.
7 -8
0.1
-95.
2 -2
37.7
-9
6.1
-87.
1 -7
9.4
13.4
-3
1.9
-99.
7 C
rude
Nap
htha
FC
Vs
20
-39.
5 -3
9.5
-96.
0 -4
1.9
-53.
0 -7
9.2
-43.
0 -8
0.0
-78.
7 -5
6.7
-41.
7 -7
1.5
-86.
3 -8
0.0
-80.
5 -3
4.5
-99.
8
50
-37.
6 -3
7.5
-95.
1 -4
0.1
-51.
6 -7
8.9
-41.
2 -7
9.4
-78.
3 -5
3.4
-39.
2 -6
6.1
-86.
2 -8
0.0
-80.
3 -3
4.3
-99.
8
80
-35.
4 -3
5.4
-94.
2 -3
8.0
-50.
2 -7
8.6
-39.
2 -7
8.9
-78.
0 -4
9.8
-36.
4 -6
0.2
-86.
1 -8
0.0
-80.
0 -3
4.1
-99.
7 FT
Nap
htha
FC
Vs,
20
-14.
1 -1
3.7
-99.
3 -3
4.1
-50.
0 -8
0.7
-35.
5 -8
4.1
-77.
0 -6
4.5
-53.
9 -9
0.6
-87.
6 -8
0.0
-80.
6 -3
4.3
-99.
8 N
A N
G
50
-5.1
-4
.9
-98.
8 -2
8.1
-46.
9 -7
9.9
-29.
6 -8
2.0
-75.
2 -4
8.9
-50.
5 -8
7.6
-87.
4 -8
0.0
-80.
1 -3
4.2
-99.
8
80
5.1
-13.
6 -9
9.2
-32.
1 -4
8.8
-80.
3 -3
3.5
-83.
5 -7
6.6
-58.
9 -5
2.7
-89.
0 -8
7.5
-80.
0 -8
0.5
-34.
4 -9
9.8
FT N
apht
ha F
CVs
, 20
-1
2.5
-12.
2 -9
8.8
-33.
0 -5
0.3
-80.
2 -3
4.5
-83.
0 -7
7.1
-42.
3 -5
0.2
-84.
8 -8
7.6
-80.
0 -8
0.8
-34.
5 -9
9.8
NN
A N
G
50
-8.6
-8
.3
-98.
5 -3
1.2
-49.
2 -7
9.9
-32.
7 -8
2.3
-76.
4 -3
8.2
-48.
6 -8
4.0
-87.
5 -8
0.0
-80.
5 -3
4.3
-99.
8
80
-4.4
-4
.2
-98.
3 -2
9.3
-48.
0 -7
9.6
-30.
8 -8
1.5
-75.
7 -3
4.0
-47.
0 -8
3.0
-87.
5 -8
0.0
-80.
3 -3
4.1
-99.
8 FT
Nap
htha
FC
Vs,
20
-96.
2 -9
6.2
-98.
7 -1
00.8
-8
6.4
-100
.0
-100
.3
-88.
9 -8
1.5
-131
.4
-90.
3 -8
5.2
-87.
9 -8
0.0
-84.
1 -3
4.6
-99.
9 N
NA
FG
50
-94.
1 -9
4.1
-98.
4 -9
8.7
-85.
2 -9
8.9
-98.
3 -8
8.2
-80.
8 -1
23.7
-8
7.6
-84.
4 -8
7.9
-80.
0 -8
3.9
-34.
4 -9
9.9
80
-9
1.9
-91.
9 -9
8.2
-96.
7 -8
4.0
-97.
7 -9
6.3
-87.
4 -8
0.0
-116
.5
-84.
9 -8
3.5
-87.
9 -8
0.0
-83.
7 -3
4.2
-99.
9 FT
Nap
htha
FC
Vs,
20
-14.
9 -1
4.6
-99.
4 -9
9.7
-99.
4 -8
3.6
-44.
4 -8
5.3
-78.
4 -7
5.8
-60.
2 -9
1.8
-87.
8 -8
0.0
-80.
8 -3
4.5
-99.
8 N
A N
G,
50
-10.
0 -9
.8
-99.
1 -9
9.4
-99.
1 -8
3.3
-42.
7 -8
4.7
-77.
9 -7
1.3
-58.
7 -9
1.1
-87.
7 -8
0.0
-80.
5 -3
4.3
-99.
8 s
team
exp
ort
80
-5.2
-4
.9
-98.
8 -9
9.2
-98.
9 -8
2.9
-41.
0 -8
4.2
-77.
4 -6
6.6
-57.
1 -9
0.2
-87.
7 -8
0.0
-80.
3 -3
4.1
-99.
8 FT
Nap
htha
FC
Vs,
20
-7.2
-1
11.7
-3
6.6
-54.
0 -8
2.0
-37.
9 -8
4.5
-77.
7 -5
9.7
-64.
5 -9
0.8
-90.
1 -8
0.0
-80.
8 -3
4.5
-99.
8 0.
0 N
A N
G,
50
-2.0
-1
11.4
-3
4.8
-53.
0 -8
1.7
-36.
2 -8
3.8
-77.
1 -5
5.0
-62.
7 -8
9.9
-90.
1 -8
0.0
-80.
6 -3
4.3
-99.
8 0.
0 e
lect
ricity
exp
ort
80
3.7
-111
.1
-32.
9 -5
1.9
-81.
4 -3
4.3
-83.
2 -7
6.4
-49.
7 -6
0.8
-89.
0 -9
0.1
-80.
0 -8
0.3
-34.
1 -9
9.8
0.0
FT N
apht
ha F
CVs
,
20
-6.0
-5
.6
-98.
8 -3
6.2
-53.
4 -8
1.6
-37.
6 -8
3.3
-77.
1 -4
8.5
-53.
2 -8
5.7
-87.
6 -8
0.0
-80.
8 -3
4.5
-100
.3
NN
A N
G,
50
-1.9
-1
.6
-98.
5 -3
4.4
-52.
4 -8
1.3
-35.
8 -8
2.7
-76.
4 -4
4.5
-51.
7 -8
4.9
-87.
6 -8
0.0
-80.
5 -3
4.3
-100
.3
ele
ctric
ity e
xpor
t 80
2.
6 2.
8 -9
8.2
-32.
5 -5
1.3
-81.
0 -3
4.0
-82.
0 -7
5.8
-40.
3 -5
0.0
-84.
0 -8
7.5
-80.
0 -8
0.3
-34.
1 -1
00.3
29
9 REFERENCES
He, D., and M.Q. Wang, 2000, Contribution of Feedstock and Fuel Transportation to Total Fuel-Cycle Energy Use and Emissions, SAE Technical Paper 2000-01-2976, Society of Automotive Engineers, Warrendale, Penn.
Wang, M., 1999a, GREET 1.5 — Transportation Fuel-Cycle Model, Volume 1: Methodology, Development, Use, and Results, ANL/ESD-39, Vol. 1, Argonne National Laboratory, Argonne, Ill., Aug.
Wang, M., 1999b, GREET 1.5 — Transportation Fuel-Cycle Model, Volume 2: Appendices of Data and Results, ANL/ESD-39, Vol. 2, Argonne National Laboratory, Argonne, Ill., Aug.
Wang, M., and H.S. Huang, 1999, A Full Fuel-Cycle Analysis of Energy and Emissions Impacts of Transportation Fuels Produced from Natural Gas, ANL/ESD-40, Argonne National Laboratory, Argonne, Ill., Dec.
Wang, M., and D. He, 2001, Well-to-Tank Energy Use and Emissions of Transportation Fuels, prepared by Argonne National Laboratory, Argonne, Ill., for General Motors Corporation, Global Alternative Propulsion Center, Warren, Mich., Feb. 27.

30