development and validation of a clinical prediction tool
TRANSCRIPT

Development and validation of a clinical prediction tool for the diagnosis of tuberculous
meningitis
A DISSERTATION
SUBMITTED TO THE FACULTY OF THE UNIVERSITY OF MINNESOTA
BY
Anna M. Stadelman
IN PARTIAL FULFILLMENT OF THE REQUIREMENTS
FOR THE DEGREE OF
DOCTOR OF PHILOSOPHY
Advisor: David R. Boulware, MD MPH
Co-Advisor: Claudia Munoz-Zanzi, DVM PhD
March 2021

©Anna M Stadelman 2021

i
ACKNOWLEDGEMENTS
I want to first thank my advisor, David R Boulware. David believed in my potential from
the beginning and opened doors for me in my academic journey. David has been a
continuous source of support, providing his expertise and guidance at every step of this
dissertation. I have benefitted immensely from his network and the ongoing and
productive collaboration with the Infectious Diseases Institute in Kampala, Uganda.
I would like to thank the Fogarty International Center and National Institute of Allergy
and Infectious Diseases for the opportunity to conduct this research in Uganda. My co-
advisor Claudia Munoz-Zanzi and committee members, Darin Erickson and Erika
Helgeson.
I am forever indebted to my colleagues at the Infectious Disease Institute, Makerere
University, and Mbarara University of Science and Technology, all of whom made a
considerable impact on my development as a scientist and public health practitioner. I
would like to thank, in no particular order, David Meya, Conrad Muzoora, Edwin
Nuwagira, Joseph Baluku, Kenneth Ssebambulidde, Laura Nsangi, Mucunguzi Atukunda,
Matthew Pullen, Darlisha Williams, Joshua Rhein, as well as all of the members of the
meningitis team.
I would be remiss not to thank my beloved Data Team: Kathy Huppler Hullsiek, Ananta
Bangdiwala, and Nicole Engen, who taught me what it means to be a data champion.
My mentors, Bridget Griffith, Fiona Cresswell, and Jayne Ellis who I admire and am
lucky to call my friends. My collaborators, Tom Boyles and Nikki Tiffin who contributed
to this research and welcomed me to their team. Fellow PhD students, Waruiru Mburu,
Emily Groene, Shanna Miko, Kimberly Bonner, Sruthi Valluri who enriched my life and
made this experience one I will cherish. My darling friend, Marin Phelps, whose
friendship nurtures my soul.

ii
Finally, I would like to thank my family: to my mom Mary and my dad Stephen who
always encouraged my dreams and ambitions no matter how outlandish they were; to my
sister Sarah and my brothers Joseph, James, and Luke who have given me the gift of
being their sister; to my late Uncle Ron who supported me from the beginning of my
academic journey; to my vast, loving extended family who have brought so much joy into
my life. I am grateful to each and every one of you.

iii
DEDICATION
This research is dedicated to the participants, without whom this research would not be
possible.

iv
ABSTRACT
Introduction: Tuberculous (TB) meningitis is the most lethal and disabling form of TB.
A disproportionate burden of TB meningitis is in resource-limited settings. There is
considerable variation in mortality and neurological sequelae reported for TB meningitis
across available studies, the reasons for which remain unclear. Delayed diagnosis and
treatment, which is a risk factor for poor outcomes, is caused in part by lack of
availability of diagnostic tests that are both rapid and accurate. Several attempts have
been made to develop clinical prediction tools to fill this gap, but none have performed
sufficiently well to be broadly implemented.
Purpose: We aimed to (1) ascertain heterogeneity in TB meningitis outcomes; (2)
develop and validate a clinical prediction tool for diagnosing TB meningitis; and (3)
externally validate this clinical prediction tool to determine the overall accuracy of
classification.
Methods: We conducted two systematic reviews: one to identify studies reporting TB
meningitis mortality and neurological sequelae and another to identify studies that
undertook diagnostic testing for TB meningitis to obtain individual participant data (IPD)
from. From the first systematic review, we conducted a meta-analysis of TB meningitis
mortality and neurological sequelae from studies that met the inclusion criteria. We
assessed heterogeneity in mortality by conducting stratified analyses by time of reported
outcome, HIV status, geographic location, and year published. From the second
systematic review, we contacted the authors and attained permission to use IPD from
studies that met the inclusion criteria. We harmonized the data and imputed for missing
values when possible. Three multivariate prediction model (MPM) development

v
strategies were employed to develop the clinical prediction tool for TB meningitis cases.
First, an IPD meta-analysis using a logistic regression MPM with stratified intercepts for
each country was fitted with key predictors. Then, we developed classification and
regression tree (CART) and random forest MPMs with machine learning methods. All
three MPMs were internally validated and assessed for performance using all available
data in a k-fold internal-external cross-validation (IECV) approach. In our final analysis,
we externally validated all three MPMs in a dataset that was not used in the development
stage.
Results: In our first systematic review and meta-analysis, pooled six-month mortality
was 24% and showed significant heterogeneity (I2 >95%; p<0.01). Physical disability was
reported in 32% (95%CI; 22-43%) of TB meningitis survivors. The heterogeneity in
mortality was partly explained by HIV status and geographic location. Mortality ranged
from 2% to 67% in Asian studies and from 23% to 80% in sub-Saharan African studies.
Mortality was significantly worse in HIV-positive persons and in persons from studies
conducted in sub-Saharan Africa. In our second systematic review, we identified and
obtained IPD from 15 studies with a total of 3,671 individual participants. All three
MPMs indicated cerebrospinal fluid (CSF) white blood cell (WBC) count, WBC
differential, CSF glucose, CSF cryptococcal antigen, and blood glucose as significant
predictors of TB meningitis. IECV revealed significant heterogeneity in performance
between IPD studies, which varied based on the prevalence of HIV in the IPD study.
Overall, the machine learning MPMs were not superior in performance to the logistic
MPM; however, random forest performed slightly better than the logistic MPM. In
external validation, the logistic MPM outperformed both CART and random forest.

vi
Discussion: Results from these studies indicate the significant contribution HIV co-
infection has on outcomes and clinical prediction tool performance for TB meningitis.
MPMs based on clinical and lab values more readily accessible in resource-limited
settings yield well-performing clinical prediction tools. The logistic MPM had the best
performance and external validity in an HIV-prevalent setting for TB meningitis.
Conclusion: Heterogeneity in TB meningitis outcomes and diagnostic performance
persist. HIV-status and geographic location are major contributors to variation in TB
meningitis outcomes. We were successful in developing a model that can better account
for this heterogeneity. The logistic MPM poses a generalizable clinical prediction tool
with the potential to reduce the delay in diagnosis, and subsequent poor outcomes, in TB
meningitis.

vii
TABLE OF CONTENTS
ACKNOWLEDGEMENTS ........................................................................................................................... I
DEDICATION ............................................................................................................................................. III
ABSTRACT.................................................................................................................................................. IV
LIST OF TABLES ....................................................................................................................................... IX
LIST OF FIGURES ...................................................................................................................................... X
LIST OF ABBREVIATIONS ..................................................................................................................... XI
CHAPTER 1. OVERVIEW OF TUBERCULOUS MENINGITIS DIAGNOSTICS ............................. 1
EPIDEMIOLOGY OF TUBERCULOUS MENINGITIS ...................................................................................... 1
CHALLENGES IN TUBERCULOUS MENINGITIS DIAGNOSTICS .................................................................. 3
MULTIVARIATE PREDICTION MODELS & CLINICAL PREDICTION TOOLS ............................................. 5
CONCEPTUAL MODEL: DIAGNOSIS TO DEATH ......................................................................................... 7
CHAPTER 2. MANUSCRIPT 1: TUBERCULOSIS MENINGITIS MORTALITY ............................. 9
INTRODUCTION ........................................................................................................................................... 9
METHODS ................................................................................................................................................. 10
Literature search strategy .................................................................................................................... 10
Study selection ...................................................................................................................................... 10
Data extraction and data synthesis ...................................................................................................... 11
Quality assessment ............................................................................................................................... 13
RESULTS ................................................................................................................................................... 13
Search results, studies, and participants included ............................................................................... 13
Mortality assessment and outcomes ..................................................................................................... 20
Mortality endpoints by HIV status ....................................................................................................... 22
Mortality endpoints by geographical region........................................................................................ 23
Temporal variation in mortality endpoints .......................................................................................... 24
Neurological disability ......................................................................................................................... 24
DISCUSSION .............................................................................................................................................. 25
CHAPTER 3. MANUSCRIPT 2: DEVELOPMENT AND VALIDATION OF A CLINICAL
PREDICTION TOOL FOR TUBERCULOUS MENINGITIS .............................................................. 31
INTRODUCTION ......................................................................................................................................... 31
METHODS: ................................................................................................................................................ 33
Literature Search Strategy ................................................................................................................... 33
Multiple Imputation .............................................................................................................................. 35

viii
Data Analysis ....................................................................................................................................... 36
RESULTS ................................................................................................................................................... 38
Search results, studies, and participants included ............................................................................... 38
Multivariable Prediction Models ......................................................................................................... 43
Internal-External Cross-Validation ..................................................................................................... 44
DISCUSSION .............................................................................................................................................. 51
CHAPTER 4. MANUSCRIPT 3: EXTERNAL VALIDATION OF CLINICAL PREDICTION
TOOL FOR TUBERCULOUS MENINGITIS ......................................................................................... 55
INTRODUCTION ......................................................................................................................................... 55
METHODS ................................................................................................................................................. 56
Data Analysis ....................................................................................................................................... 57
RESULTS ................................................................................................................................................... 57
Participants Included ........................................................................................................................... 57
Model Performance .............................................................................................................................. 59
DISCUSSION .............................................................................................................................................. 62
REFERENCES ............................................................................................................................................ 66
APPENDICES .............................................................................................................................................. 73
APPENDIX A: MANUSCRIPT 1 SEARCH STRATEGY .................................................................................... 73
APPENDIX B: TUBERCULOUS MENINGITIS MORTALITY BY STEROID USE ................................................ 74
APPENDIX C: MANUSCRIPT 2 SEARCH STRATEGY .................................................................................... 75
APPENDIX D: QUADAS-2 ........................................................................................................................ 76
APPENDIX E: LOGISTIC REGRESSION COEFFICIENTS WITH AVERAGE INTERCEPT .................................... 77
APPENDIX F: VARIABLE IMPORTANCE IN RANDOM FOREST MODEL ........................................................ 78

ix
LIST OF TABLES
Table 1.1. Uniform TBM Case Definition ......................................................................... 4
Table 1.2. Published Clinical Prediction Tools for TB Meningitis .................................... 6
Table 2.1. Characteristics of Studies Meeting Inclusion Criteria .................................... 15
Table 3.1. Individual Patient Data Requested from Authors and Included in Model
Development ..................................................................................................................... 35
Table 3.2. Characteristics of Studies Included in Analysis Dataset ................................. 41
Table 3.3. Univariate analysis of clinical, hematological, and CSF data of individual
participants with and without TB meningitis. ................................................................... 42
Table 3.4. Logistic Regression Coefficients .................................................................... 43
Table 3.5. Internal-External Cross-Validation Multivariable Prediction Model
Performance in Test Dataset ............................................................................................. 45
Table 3.6. Overall Performance of Logistic, CART, and Random Forest MPMs ........... 46
Table 3.7. Logistic Regression Diagnostic Performance in IECV by Probability Cutoff 48
Table 3.8. CART Diagnostic Performance in IECV by Probability Cutoff ..................... 49
Table 3.9. Random Forest Diagnostic Performance in IECV by Probability Cutoff ....... 50
Table 4.1. Univariate Analysis, clinical, hematological, and CSF data of individual
participants in external validation dataset ......................................................................... 58
Table 4.2. Performance of Logistic, CART, and Random Forest MPMs ........................ 59
Table 4.3. Logistic Regression Diagnostic Performance in External Validation by
Probability Cutoff ............................................................................................................. 61
Table 4.4. CART Diagnostic Performance in External Validation by Probability Cutoff61
Table 4.5. Random Forest Diagnostic Performance in External Validation by Probability
Cutoff ................................................................................................................................ 62

x
LIST OF FIGURES
Figure 1.1. Dissertation Conceptual Model ....................................................................... 8
Figure 2.1. Flow Diagram of Study Selection Process .................................................... 14
Figure 2.2. Tuberculous Meningitis Mortality by Country .............................................. 19
Figure 2.3. Tuberculous Meningitis Mortality by Outcome Reporting Timepoint ......... 21
Figure 2.4. Tuberculous Meningitis Mortality by HIV Status ......................................... 22
Figure 2.5. Tuberculous Meningitis Mortality by Year Published .................................. 23
Figure 2.6. Physical Disability by Modified Rankin Scale and Barthel Index ................ 25
Figure 3.1. PRISMA IPD Flow Diagram of Study Selection Process ............................. 38
Figure 3.2. Meningitis Etiologies of Participants ............................................................ 42
Figure 3.3. Classification and Regression Tree (CART) ................................................. 44
Figure 3.4. ROC Curves for Logistic, CART, and Random Forest MPMs ..................... 45
Figure 3.5. Calibration Plot for Logistic, CART, and Random Forest MPMs ................ 46
Figure 4.1. Meningitis Etiologies in External Validation Dataset ................................... 58
Figure 4.2. ROC Curves for Logistic, CART, and Random Forest MPMs ..................... 59
Figure 4.3. Calibration Plot for Logistic, CART, and Random Forest MPMs ................ 60

xi
LIST OF ABBREVIATIONS
• TB : Tuberculosis or Tuberculous
• HIV : Human Immunodeficiency Virus
• ART : Antiretroviral therapy
• WHO : World Health Organization
• CSF : Cerebrospinal fluid
• WBC : White blood cell
• MPM : Multivariable prediction model
• UTBMCD : Uniform TB Meningitis Case Definition
• NAATs : Nucleic acid amplification tests
• CPT : Clinical prediction tool
• DNA : Dioxyribonucleic acid
• MRC : Medical Research Council
• IPD : Individual participant data
• IECV : Internal-external cross-validation
• CrAg : Cryptococcal antigen
• ROC : Receiver operating characteristic

1
CHAPTER 1. OVERVIEW OF TUBERCULOUS MENINGITIS DIAGNOSTICS
This dissertation aims to improve the diagnostic strategy for tuberculous (TB)
meningitis. In Manuscript 1, we aim to ascertain heterogeneity in TB meningitis mortality
and neurological sequelae via systematic review and meta-analysis. In Manuscript 2, we
aim to build a clinical prediction tool using machine learning methods. Our goal is to
address the underlying heterogeneity observed in Manuscript 1 as well as account for
case-mix variation so that the clinical prediction tool is built to perform well in any
population or setting. For Manuscript 3, we aim to externally validate the clinical
prediction tool developed in Manuscript 2 in a population in Uganda. This chapter
describes the epidemiology of TB meningitis, the context of TB meningitis diagnostic
challenges, clinical prediction tools, and machine learning methods.
Epidemiology of Tuberculous Meningitis
Tuberculosis (TB) is a disease caused by the infection of the bacillus
Mycobacterium tuberculosis.1 M. tuberculosis is spread by small airborne droplets
generated when a person with pulmonary TB coughs, sneezes, or otherwise expels
bacteria into the air.1 These droplets can remain airborne for up to a few hours after
expectoration. Introduction of M. tuberculosis into the lungs leads to infection of the
respiratory system (pulmonary TB) but the infection can also spread to other sites in the
body (extrapulmonary TB) including the brain and central nervous system.1 TB
meningitis is caused when M. tuberculosis enters the cerebrospinal fluid (CSF), leading
to inflammation of the meninges, causing meningitis.2

2
Globally, 10 million cases of TB were reported in 2019, and TB is currently the
leading cause of mortality from a single infectious agent worldwide.1 According to the
World Health Organization (WHO), about a quarter of the world’s population is infected
with M. tuberculosis.1 TB is a disease of poverty, economic distress, vulnerability, and
marginalization. Consequently, 90% of cases are derived from 30 high-TB burden
countries.1 TB meningitis accounts for 1-5% of global TB cases, and at least 100,000
cases are estimated annually.3 The proportion of TB meningitis in people living with TB
varies considerably by TB prevalence, age, and HIV. HIV co-infection is the most
significant risk factor for TB meningitis in adults.4 However, our understanding of the
global burden of TB meningitis is poor. Many cases of TB meningitis remain
undiagnosed due to inadequate diagnostic test performance and lack of available testing
availability, so population-based estimates of TB meningitis incidence are often not
reported and challenging to determine.3,4
Although TB meningitis disproportionately impacts resource-limited settings, TB
meningitis accounts for the highest proportion of TB deaths in both resource-rich and -
limited settings.3 TB meningitis is the most devastating form of TB, with an estimated
mortality of 16% (95% Confidence Interval (CI): 10-24%) among HIV-negative patients,
and 57% (95% CI; 48-67%) among HIV-positive patients.3,5 In the absence of treatment,
TB meningitis is uniformly fatal.4 Up to 50% of survivors suffer from long-term
neurologic sequelae such as blindness, stroke, and seizures.4 Delays in diagnosis and
treatment initiation are major contributing factors to the high morbidity and mortality in
TB meningitis patients, particularly in resource-limited settings.3,4

3
Challenges in Tuberculous Meningitis Diagnostics
Identifying the etiology of meningitis is challenging since many of the
discriminating clinical symptoms are often nonspecific and subacute.2,6 Adults with TB
meningitis commonly present with stiff neck, headache, fever and vomiting, which are
symptoms commonly seen with other forms of bacterial meningitis.6 However, patients
with TB meningitis typically report longer symptom duration—up to 1 month–with
symptoms that are consistent with pulmonary TB infection such as cough, night sweats,
and weight loss.6,7 TB meningitis presentation is also characterized by a higher
likelihood of neurologic symptoms such as altered mental status, personality changes,
cranial nerve neuropathy (typically cranial nerve IV), and coma.7 Routine evaluation of
cerebrospinal fluid (CSF) may help elucidate meningitis etiology. TB meningitis is
generally thought of as causing an increase in lymphocytic white blood cell (WBC)
count with elevated protein and low glucose in CSF.8 However, there is no typical
pattern of CSF values that can reliably distinguish TB meningitis from other meningitis
etiologies, particularly in the presence of HIV co-infection.8
Diagnostic tests aimed at identifying M. tuberculosis in CSF are lengthy, have
poor diagnostic performance, and/or unavailable in resource-limited settings. While
recently introduced nucleic acid amplification tests (NAATs) that test for the DNA of
TB have the potential to improve timeliness of diagnosis, the moderate sensitivity (50-
70%) means that negative tests cannot fully exclude disease.9 This is largely
attributable to the pauci-bacillary nature of TB meningitis. Due to significant
inflammation in the brain and subsequent poor CSF circulation, it is possible to have
TB meningitis with very low or no M. tuberculosis in the CSF.8 Diagnostic approaches

4
that rely on microbiologic confirmation will inevitably miss cases of TB meningitis,
further delaying treatment. Delayed treatment is the main risk factor for death for TB
meningitis.3 Thus, diagnostic approaches for TB meningitis must include a combination
of microbiologic and clinical assessments that can better encompass pauci-bacillary and
bacillary case types of TB meningitis.
A major stumbling block in TB
meningitis research had been the absence
of a single reference standard test or
criteria for the diagnosis of TB meningitis.
In 2010, a committee of 41 international
TBM experts developed a standardized
criteria, known as a case definition, for the
diagnosis of TB meningitis to use in future
clinical research called the Uniform TB
Meningitis Case Definition (UTBMCD)
(Table 1.1).10 The UTBMCD has helped
to standardize research, but it cannot be
used as an immediate clinical diagnostic
tool because it depends on delayed results,
such as mycobacterial culture, which can
take up to 8 weeks for growth to occur.3
The UTBMCD also includes brain
imaging to define the diagnosis of TB
Table 1.1. Uniform TBM Case Definition

5
meningitis, which is not available in many resource-limited settings.3 Having a rapid
diagnostic test ensures that the patient can begin treatment at the earliest possible time.
Due to the brain damage that TB meningitis causes and high risk of long-term disability
and death, TB meningitis is a medical emergency.3 Availability of a diagnostic method
that facilitates early diagnosis and prompt treatment could save lives and reduce
neurologic disability in survivors. Improving the strategies for rapid and efficient TB
meningitis diagnosis is an urgent need.3
Multivariate Prediction Models & Clinical Prediction Tools
Another approach to improving rapid TB meningitis diagnosis, particularly in
resource-limited settings, is to develop a clinical prediction tool based on a multivariate
prediction model (MPM). A MPM is a mathematical algorithm based on several inputs,
or variables, formulated with the aid of statistical modeling that predicts the probability
of having a disease. The statistical modeling determines which criteria are most
predictive of the presence of a disease, typically patient characteristics (such as age or
sex) or biological markers found in human specimens that can be measured in a clinical
laboratory.
The advantage of a MPM is that the prediction of TB meningitis is based on
patient characteristics and biological markers that differentiate TB meningitis from
other types of meningitis. This is a novel approach to the diagnosis of TB meningitis
that overcomes the challenge of prior diagnostic methods, such as the UTBMCD and
NAATs, which focus on identifying the pathogen.

6
At least ten clinical prediction tools have been published for the diagnosis of TB
meningitis (see Table 1.2).
Table 1.2. Published Clinical Prediction Tools for TB Meningitis Citation Population Case comparison Predictors of TB Meningitis
Kumar 11 Children from
India
TBM versus other
meningitis
Symptoms ≥7 days
Optic atrophy
Focal neurological deficit
Extrapyramidal movements
CSF leukocytes <50% neutrophils
Thwaites 12 Adults from
Vietnam
TBM versus
bacterial meningitis
Age <36 years
Blood leukocytes <15 × 109/l
Symptoms ≥6 days
CSF leukocytes <750/mm3
CSF neutrophils <90%
Youssef.13 Children and
adults from
Egypt
TBM versus
bacterial meningitis
Symptoms >5 days
CSF leukocytes <1000/mm3
Clear CSF
CSF lymphocytes >30%
CSF protein >100 mg/L
Cohen14 Adults from
Malawi (77%
HIV-positive)
TBM versus
cryptococcal
meningitis
Low CSF opening pressure
Neck stiffness
Raised CSF leukocytes
Low Glasgow Coma Scale score
High fever
Patel15 Adults from
South Africa
(84% HIV+)
TBM versus other
meningitis
CSF:blood glucose ratio ≤0.2
CSF lymphocytes >200/mm3
CD4+ cell count <200 × 106/L
Negative cryptococcal antigen test
Hristea16 Adults from
Turkey
TBM versus viral
meningitis
Symptoms ≥5 days
MRC grade II or III
CSF:blood glucose ratio <0.5
CSF protein >100 mg/dL
Vibha17 Adults from
India
TBM versus
bacterial meningitis
Living in a rural area
Symptoms ≥6 days
Cranial nerve palsy
Hemiplegia
Clear CSF
CSF neutrophils <75%
Dendane18 Adults from
Morocco
TBM versus
bacterial meningitis
Female sex
Symptoms ≥0 days
Focal neurological deficits
Blood leukocytes <15 × 109/L
Plasma sodium <130 mmol/L
CSF leukocytes <400/mm3
Zhang 19 Adults from
China (all HIV-
uninfected)
TBM versus
cryptococcal
meningitis
Female sex
Reduced consciousness
No visual or hearing loss
Evidence of extraneural tuberculosis
CSF leukocytes ≥68/mm3
CSF protein >0.91 mg/dL
Qamar 20 Children from
Pakistan
TBM versus
bacterial meningitis
Hydrocephalus on brain CT
CSF leukocytes <800/mm3
CSF protein:glucose ratio ≥2
CSF, cerebrospinal fluid; MRC, Medical Research Council; TBM, tuberculous meningitis.

7
A major limitation of prior clinical prediction tools is that their performance is variable
in different populations and settings. Only a few of these scoring systems have been
externally validated.3 External validation refers to the ability for a statistical model to
perform well in a dataset or population separate from the dataset or population in which
it was developed. Thus, if a tool or model is ‘externally validated’, then it performs
well in any setting, population, or dataset. The primary contributing factor of varied
model performance across different settings and populations is case-mix variation,
which refers to the distribution of important population characteristics such as HIV
status, age, and the population prevalence of TB. Case-mix variation across different
settings can lead to genuine differences in the performance of a prediction model, even
when the criteria truly predict the disease.25 Prior clinical prediction tools were
developed from a single site, including the tool developed by Thwaites et al.,12 and
therefore have not adequately accounted for case-mix variation. This impacts accuracy
and clinical utility when applied to other populations and settings.
Conceptual Model: Diagnosis to Death
We have designed a conceptual model to illustrate the objectives of this
dissertation, challenges in TB meningitis research, and pathways that we will explore in
the three manuscripts (Figure 1.1). This conceptual model is based on the several key
gaps in TB meningitis knowledge and research highlighted by experts in the TB
Meningitis International Research Consortium.2,3 The conceptual model depicts the
timeline from TB meningitis infection to death. The challenges highlighted along the
timeline are limited to the scope of this dissertation’s objectives and are not exhaustive.

8
Manuscript 1, indicated by the blue arrows, examines the heterogeneity in outcomes of
TB meningitis that inform important factors of case-mix variation, ultimately
highlighting high-risk groups for infection, missed diagnosis, and death. Manuscript 2
aims to reduce the time between TB meningitis infection and diagnosis by using MPMs
developed from a diverse dataset to develop a clinical prediction tool to improve
diagnostics. In Manuscript 3, we will externally validate the clinical prediction tool
developed in Manuscript 2 and ascertain diagnostic performance.
Figure 1.1. Dissertation Conceptual Model
Diagnosis Treatment Death
Maximize available resources
Reduce time to treatment
DelayAvailability
Expense
Time
TB Meningitis
Infection
Time Text
Ascertain
heterogeneity
Heterogeneity
Objectives
Challenges
Manuscript 1
Manuscript 2
Manuscript 3

9
CHAPTER 2. MANUSCRIPT 1: TUBERCULOSIS MENINGITIS MORTALITY
Introduction
In 2018, ten million cases of tuberculosis (TB) were reported globally;26 and TB
meningitis accounts for 1-5% of these cases.27 TB meningitis is the most severe form of
tuberculosis and is responsible for a considerable burden of neurological sequelae and
mortality; a systematic review of treatment outcomes in 1,636 children with TB
meningitis estimated 19.3% mortality.28 There is considerable variation in the reported
outcomes for adult TB meningitis across available studies, the reasons for which remain
unclear. Two recent systematic reviews of adult TB meningitis outcomes reported
substantial heterogeneity in mortality, with pooled estimates of 22.8% and 24.7%.29,30
However, neither review attempted to explain the variation in treatment outcomes by
stratifying studies by HIV status and geographical location. In addition, Wen and
colleagues excluded all investigational treatment studies effectively excluding major
treatment randomized controlled trials (RCTs) investigating regimens that have now
become the standard of care (e.g., adjunctive steroids and delayed antiretroviral therapy
(ART) for those with HIV-associated TB meningitis). Furthermore, there is a paucity of
data in recent meta-analyses on drug resistance rates, treatment regimens, and steroid use.
HIV co-infection has been shown to be a risk factor for death (Hazard Ratio 2.5; 95% CI
1.9-3.4) in Vietnamese adults with TB meningitis,31 but this remains to be explored
systematically in other regions.32-34 Similarly, neurological disability in adult TB
meningitis survivors has not been studied in detail in meta-analyses. In two recent
systematic reviews, prevalence of disability in adult TB meningitis survivors varied

10
between 29% and 50%.29,30 However neither review provided data on the nature and
severity of neurological sequelae in TB meningitis survivors.
We performed a systematic review and meta-analysis to characterize treatment
outcomes, namely all-cause mortality and neurological sequelae, for adult TB meningitis
across a range of epidemiological settings. We endeavored to perform a definitive review
by including the best quality data available and performing a robust quality assessment of
the studies included.
Methods
Literature search strategy
This review followed the Preferred Reporting Items for Systematic Reviews and
Meta-Analyses (PRISMA) statement for the reporting of systematic reviews and meta-
analyses.35 A systematic electronic search was conducted using MEDLINE and
EMBASE with the aim of identifying all studies reporting treatment outcomes in adult
TB meningitis from 1988 to present. This time period corresponds to the WHO
recommendation of standard quadruple therapy for the treatment of TB.26 Controlled and
natural language terms identified key search concepts such as: “tuberculosis”,
“meningitis”, “mortality”, “complications” and “outcome.” Full search strategies are
presented in Appendix A. Searches were conducted on 9 July 2018.
Study selection
A two-stage sifting process was employed: (1) at title and abstract; and (2) at full
text level according to eligibility criteria as detailed below. Sifting was performed in
duplicate independently by two reviewers and any unresolved disagreements were

11
resolved by a third, independent reviewer. Reference and citation checking were
conducted for included articles.
Studies were eligible for inclusion if they (i) included adults (aged ≥ 15 years)
with confirmed or suspected TB-meningitis; (ii) utilized diagnostic criterion to
systematically evaluate patients for TB meningitis; (iii) reported on at least one of the
following outcome measures: neurological sequelae, in-hospital mortality, mortality at
the end of follow-up (v) employing any of the following study designs: consecutive case
series, case control study, cohort study, randomized controlled study, systematic review,
or meta-analysis.
The following exclusion criteria were applied: (i) studies with fewer than 10
participants; (ii) studies limited to specific complications or comorbidities (e.g.
hydrocephalus, tuberculoma, or surgical intervention); (iii) studies not providing at least a
backbone of standard fixed dose combination anti- TB therapy; (iv) studies not specifying
treatment given; (v) studies published before 1988; (vi) studies not written in English;
(vii) any systematic review superseded by an updated systematic review; (viii) narrative
reviews not adding new data or new analysis of data to existing knowledge.
Data extraction and data synthesis
Two authors independently extracted data on study characteristics, recruitment
populations, and treatment outcomes from eligible studies using a standardized, piloted
electronic data capture database (REDCap, Vanderbilt University, USA). We captured
data on geographical region, number of HIV-positive participants, British Medical
Research Council (MRC) TB meningitis grade at presentation, treatment regimens
utilized, use of corticosteroids, and outcomes reported at specified time points for each

12
study. Any unresolved disagreements in extraction were resolved by a third, independent
reviewer.
We used each study’s definition of neurological sequelae as reported in the study.
For articles that utilized the modified Rankin Scale or the Barthel index, “disability” was
defined as ‘any disability that impeded the patient’s ability to carry out tasks they once
performed’. This is was represented as a score of >2 on the modified Rankin Scale or <80
on the Barthel Index.
For systematic reviews, individual study level data were not extracted or
analyzed, only the summary estimates were recorded for comparison, and citation
checking was performed to ensure all relevant source manuscripts had been identified.
Data analysis
We used the proportion of all-cause deaths and neurological sequelae within each
study to define outcomes of TB meningitis for the meta-analyses. As such, all meta-
analyses used random effects models and employed the DerSimonian and Laird method
on Freeman-Tukey transformed proportions, which is the established approach for this
type of analysis.36-38 We graphically displayed data in forest plots, which display point
estimates of TB meningitis outcomes in each study, with 95% confidence intervals. We
generated pooled effect estimates by inverse-variance weighting each individual point
estimate such that the estimates with lower variances contributed more to the pooled
estimate.38 The overall pooled estimate for mortality was stratified by follow-up outcome
reporting time. Inter-study and sub-group heterogeneity were assessed with the I2
statistic. All analyses were conducted in Stata version 15.1 (StataCorp, College Station,
TX, USA) with the “metaprop” command.39

13
Quality assessment
The 39 articles included in the meta-analysis were assessed for study quality using
the Downs and Black tool, a 27-item quality assessment checklist.40 Each study was
scored on a 32-point scale for items that examined quality of reporting, external validity,
internal validity (bias and confounding), and study power. Study power was estimated
according to sample size methodology. Studies were scored as follows; 0 if no sample
size calculation was made or reported in the manuscript (given for observational studies);
3 if a power calculation was done but there were insufficient numbers of patients
recruited; 5 if the power calculation was done and sufficiently powered. Systematic
reviews meeting the inclusion criteria were not assessed for risk of bias. As treatment
outcomes were of interest in these analyses and not treatment or intervention efficacy, we
included all studies regardless of quality assessment score.
Results
Search results, studies, and participants included
Our searches yielded 2,562 reports, after removal of duplicates (n=365), 2,197
studies underwent title and abstract screening, and 264 full texts were reviewed (Figure
2.1). 39 studies met our eligibility criteria for inclusion and analysis (Table 2.1). These
39 studies were published between 1995 and 2018 of which: 10 (26%) were case series,
21 (54%) were cohort studies, and eight (21%) were randomized controlled trials. Studies
arose from 18 countries including a range of epidemiological settings; 24 (62%) were
from high-TB burden settings and 15 (38%) were from low-TB burden settings.

14
Figure 2.1. Flow Diagram of Study Selection Process
Records identified through
database searching
(n = 2562)
Additional records identified
through other sources
(n = 3)
Records after duplicates removed
(n = 2197)
Records screened
(n = 2197) Records excluded
(n = 1934)
Full-text articles assessed
for eligibility
(n = 264)
Full-text articles excluded (n = 225)
Non-tuberculous meningitis (n=13)
No systematic diagnostic criteria for diagnosing
tuberculous meningitis (n=25)
Did not report at least one outcome of interest (n=9) Ineligible study type or study type not specified (n=10)
Fewer than 10 study participants (n=3)
Non-English articles (n=27)
Study conducted before 1988 (n=8)
Study sample limited to patients with specific complications or comorbidities (n=5)
Full text unable to be located (n=27)
No disaggregated tuberculous meningitis data (n=6)
No disaggregated adult data (n=58)
No specified treatment drugs, doses, and duration (n=30)
Narrative reviews or new analysis of existing data (n=2)
Any systematic review superseded by an updated
systematic review (n=2)
Studies included in
qualitative synthesis
(n = 42)
Studies included in
quantitative synthesis
(meta-analysis)
(n = 39)

15
First Author Yea
r
Study
Design Country N
Diagnostic
Criteria1 HIV
Confirme
d TBM
Suspected
TBM2
Antituberculous
treatment3 Steroids3 Outcome(s) and Time
point reported
AFRICA
Luma 41 2013 Case Series
Cameroon 54 2
a b 54
(100%) 1 (2%) 53 (98%) 2RHZE/6-8RH
All received steroids:
unspecified drug(s), dose, &
duration
In-hospital mortality
Marais 42 2011 Cohort South Africa 120 2
a b c d e f
106
(88%) 47 (39%) 73 (61%) RHZE Not specified
In-hospital and 6-
month mortality
Thinyane 43 2015 Case
Series Lesotho 22
2
a b e f
15
(68%) 0 (0%) 22 (100%) RHZE Not given
Mortality at the end of
follow up
Cresswell 44 2018 Cohort Uganda 195 2
a b c d 106
(54%) 74 (38%) 93 (48%) RHZE Not specified In-hospital mortality
Raberahona 45
2017 Case Series
Madagascar 75 1 3
(4%) 8 (11%)
44 (59%)
probable 23 (31%)
possible
2RHZE/6RH + S if prior TB (n=2)
Not given Mortality at 8 months
SOUTH AMERICA
Gonzalez-Duarte 46
2011 Cohort Mexico 64 2
a c f 14
(22%) 44 (69%) 20 (31%)
2RHZE/RH - mean
time of therapy was
11.9 ± 7 months
57 (78%) received steroids,
unspecified drug(s), dose &
duration
Mortality and
neurological outcomes
at 5 months
Alarcon 47 2013 Cohort Ecuador 310
2
a b d e f g
h
2 (1%)
140 (45%) 170 (55%)
2RHZ + E or S or
quinolone / 10RH (quinolone given to
some)
Steroids given to patients
with severe disease, unspecified drug(s), dose &
duration
Mortality and
neurological outcomes
at 12 months
ASIA
Torok 48 2008 Cohort Vietnam 58 2
b d e f
58
(100%) 54 (93%) 4 (7%)
3RHZE + S if prior
TB/6RH
D (0.3-0.4mg/kg) tapered
over 6-8 weeks
Mortality at 9 months
Torok 49 2011 RCT Vietnam 253 2
a b d e f
253
(100%) 158 (62%) 95 (38%)
3RHZE + S if prior
TB/6RH
D (0.3-0.4mg/kg) tapered
over 6-8 weeks
Mortality and
neurological outcomes at 9 and 12 months
Heemskerk 31 2016 RCT Vietnam 817 1 349
(43%) 407 (50%)
214 (26%)
174 (21%)
2RHZE/6RH
+ S if prior TB
+ L in one trial arm
D (0.3-0.4mg/kg) for 6-8
weeks Mortality at 9 months
Table 2.1. Characteristics of Studies Meeting Inclusion Criteria

16
First Author Yea
r Study
Design Country N
Diagnostic
Criteria1 HIV
Confirme
d TBM Suspected
TBM2 Antituberculous
treatment3 Steroids3
Outcome(s) and Time
point reported
Thwaites 50 2002 Cohort Vietnam 56 2
a b d 11
(20%) 56 (100%) 0 (0%)
3RHZE/6RHZ if HIV+ 3RHZS/6RHZ if HIV-
Not given Mortality at 3 months
Thwaites 51 2004 RCT Vietnam 545 2
a b d e f
98
(18%) 187 (34%)
358
(66%)
3RHZS/6RHZ
3RHZE/6RHZ if HIV+ or prior history of TB
D (0.3-0.4mg/kg) tapered over 4 weeks, then oral
treatment (4mg/day) tapered
for 4 weeks
Mortality and
neurological outcomes at 9 months
van
Laarhoven 33*
2017 Cohort Indonesia 608 2
a b c d
93
(15%) 336 (55%)
272
(45%)
RHZE
(n=47: high dose R) (n=25: M instead of E)
91% received steroids
Drug, dose, and duration not specified
Mortality at 12 months
Singh 52 2016 Cohort India 141 1 13
(9%) 54 (38%) 87 (62%) 2RHZS/7HE
D (0.3-0.4mg/kg) tapered over 4 weeks, then oral
treatment (4mg/day) tapered
for 4 weeks
Neurological outcomes
at 9 months
Tai 53 2016 Cohort Malaysia 36 1 3 (8%) 23 (64%) 13 (36%) 2RHZE/10RH Not specified Neurological outcomes
at 3 months
Chen 54 2014 Cohort Taiwan 38 2
b d f g 2 (5%)
not reported
not reported
2RHZE/10-16RHE
D (12-16mg)
P (60-80mg)
tapered 6-8 weeks
Mortality and
neurological outcomes
at 18 months
Kalita 55+ 2014 RCT India 60 2
a b c d e f 3 (5%) 24 (40%) 36 (60%) RHZE
P (0.5 mg/kg/day) for 1
month, tapered over 4 weeks
Mortality and
neurological outcomes
at 6 months
Sheu 56 2012 Case
Series Taiwan 91
2
b c d e f g 3 (3%)
not
specified
not
specified RHZE +/- S
Either D 12-16mg/day
or P 60-80mg/day over 1.5-2 months
In-hospital mortality
and neurological outcomes
Wasay 57 2014 Case
Series Pakistan 404
2 a b d e f g
h
1
(0.2%) 35 (9%)
369
(91%)
RHZE + 8% (n=34) received
S
unspecified regimen given to
all
Mortality and neurological outcomes
at 2 months
Chotmongkol 58
1996 RCT Thailand 59 2 a 0 (0%) 6 (10%) 53 (90%) 2RHZS/4RH 29 (52%) P 60mg tapered
over 5 weeks
Mortality and neurological outcomes
at 6 and 18 months

17
First
Author Yea
r Study
Design Countr
y N
Diagnostic
Criteria1 HIV
Confirme
d TBM Suspected
TBM2 Antituberculous
treatment3 Steroids3
Outcome(s) and Time
point reported
Lu 59 2001 Cohort China 36 2
a c d e f
0
(0%) 23 (64%) 13 (36%)
RHZE +/- C and/or S for drug
toxicity
Unspecified steroid given to patients
with clinical deterioration
Mortality and neurological outcomes
at 3 and 6 months
Wang 60 2002 Cohort China 41 2
a d f g
0
(0%) 22 (54%) 19 (46%) RHZE
Unspecified steroid given to 9
patients Mortality at 6 months
Chotmongkol 61~ 2003 Cohort
Thailand
45 2
a b d 0
(0%) 2 (4%) 42 (93%) 2RHZS/4RH Not given Mortality at 6 months
Thwaites 62 2003 Cohort Vietnam 21 2
a b d e f g 0
(0%) 15 (71%) 6 (29%) 3RHZS/6RHZ Not given
Mortality and
neurological outcomes
at 9 months
Malhotra 63 2009 RCT India 91 2
a b e f
0
(0%) 18 (20%) 73 (80%) 2RHZE or S/7RH
D (0.3-0.4mg/kg) tapered over 4
weeks, then oral treatment
(4mg/day) tapered for 4 weeks OR
MP 5 days OD of either 1 g (weight>50 kg) or 20 mg/kg
(<50kg).
Mortality and
neurological outcomes
at 6 and 18 months
Hsu 64 2010 Case
Series Taiwan 108
2
a d c e f g
h
0
(0%) 46 (43%) 62 (57%)
6RHZ,+ S, C, or L in case
of toxicity or side
effects
P (minimum 20mg) for >7 days
given for 1 to >4 weeks in n=106 Mortality at 9 months
Sharma 65 2013 Case
Series India 42
2 a e f g
0 (0%)
4 (10%) 38 (90%) RHZE Six weeks of steroids, unspecified
drug(s) & dose
Mortality and
neurological outcomes
at 6 months
Sun 66 2014 Cohort China 33 2
a d e f h
0
(0%) 7 (21%) 26 (79%)
RHZE +/- PAS +
L if in trial arm 2 D 1.5 - 15 mg/d for 1.5-6 weeks
In-hospital
neurological outcomes
Kalita 67 2014 Case
Series India 34
2 a b c d e f
h
0
(0%) 34 (34%) 0 (0%) 9RHZE/9RH
P (0.8mg/kg, max 40mg) for 1
month
Mortality and neurological outcomes
at 6 months
Imam 68 2015 Case
Series Qatar 80
2
a b c d e f
g h
0
(0%) 35 (44%) 45 (56%)
RHZE
+ 4% received S,
M, and A
D (med 21mg/day)
P (med 40mg/day) over 3-9 weeks
Mortality and
neurological outcomes
at 12 months
Zhang 69 2016 Cohort China 401 1 0
(0%) 131 (33%) 202 (50%) RHZE + L Not specified 5-year mortality

18
First
Author
Yea
r
Study
Design Country N
Diagnosti
c Criteria1 HIV
Confirme
d TBM
Suspected
TBM2
Antituberculous
treatment3 Steroids3
Outcome(s) and
Time point reported
Kalita 70 201
6 RCT India 57
2
a b d e f h
0
(0%) 18 (32%) 39 (68%
6RHZE
+ L in trial arm/12RH for following year
P (0.5 mg/kg/day) for 1
month tapered over 1 month
Mortality and
neurological outcomes at 3 and 6 months
Li 71 201
7
Case
Series China 154 1
0
(0%) 18 (12%)
98 (61%)
probable
42 (27%)
possible
2-4RHZE/6-12RH
D
(early treatment), unspecified dose & duration
Mortality and
neurological outcomes at 8 months
Mai 72 201
8 RCT Vietnam 120 1
0
(0%) 92 (77%) 26 (22%) 3RHZES/6RH
D (0.3-0.4mg/kg) tapered
over 4 weeks, then oral
treatment (4mg/day) tapered
for 4 weeks
Mortality and
neurological outcomes at 2 and 8 months
EUROPE
Cagatay 73 2004
Cohort Turkey 42
2
a b d e f g
h
2 (5%)
10 (24%) 32 (76%) 3-6RHZE
D (8mg) for 4-6 weeks
given to patients who were
stage II or III
Mortality at 12 months
Doganay 74 199
5 Cohort Turkey 72
2
a b d f
0
(0%) 72 (100%)
51%: 2RHZS/6RH
49%: various
combinations 12-16 months R, H, Z, E, S
P or D 4-6 weeks if MRC
stage 3 diseases / signs of
raised ICP
Mortality at 2 years
Sutlas 75 2003
Cohort Turkey 61 2
b d e f g h 0
(0%) 19 (31%) 42 (69%)
1RHZES/2-3RHZE/4-
9RHZ (if no tuberculoma
present)/10-12RH
P (1mg/kg/day) for 1 month, tapered for 4 months
Mortality at 12 months
Sengoz 76 200
8 Cohort Turkey 121
2
a b d e f g
h
0
(0%) 52 (43%) 69 (57%) 2RHZ + E or S/7-10RH
2D (16 mg/day) for those
with
neurological deficits
Mortality at the end of
follow up
Miftode 77 201
5 Cohort Romania 127 1
0
(0%) 25 (20%)
35 (28%) probable
70 (55%)
possible
2-3RHZE/7-9RH All received: unspecified
drug, dose, & duration
In-hospital mortality
and neurological
outcomes
1 Diagnostic Criteria Legend;
1= Uniform case definition
2= Other criteria used to diagnose and categorize patients including: a=suggestive CSF picture, b=microscopy, c=Xpert / PCR, d=culture, f=evidence of extra-neural, TB, g=response to treatment, h=other (history of
TB or contact with a TB-infected individual, positive mantoux reaction, IGM AB in the CSF, biopsy, etc.) 2 Some participants were considered 'suspected' as well as 'confirmed' TBM 3 TB treatment (given to all unless specified otherwise): Number of months placed in front of regimen code: R=rifampicin, H=isoniazid, Z=pyrazinamide, E=ethambutol, S=streptomycin, L=levofloxacin,
M=moxifloxacin, C=ciprofloxacin, A=amikacin, PAS=paraaminosalacylic acid, P=prednisolone, D=dexamethasone, MP=methylprenisolone. Where no duration of antituberculosis therapy or steroids is stated it means
it was not clearly specified in the paper. * van Laarhoven et al. includes some data from 3 clinical trials in Indonesia (Ruslami R, Lancet Infect Dis, 2013, Yunivita V, Int J Intimicrob, 2016. Dian S, Antimicrob Agents Chemother. 2018). The primary studies
were excluded from the review to avoid duplication of data. + Only included participants that were treated with RHZE ~Treatment information was taken from Chotmongkol 1996 as they were from the same authors, hospital, and decade.

19
A total of 26 (67%) studies were conducted in Asia, and five (13%), five (13%),
and two (5%) in Europe, Africa, and the Americas, respectively (Figure 2.2). Study
quality scores ranged from eight to 32, with a score of 32 indicating the highest quality.
Median quality score for included articles was 18 (IQR; 15-20). Our meta-analysis
includes reported treatment outcomes for 5,752 adults with TB meningitis. Participant
age ranged from 15 to 88 years. Seven studies included 1,078 HIV-positive patients: 302
(28%) from Africa, and 776 (72%) from Asia. MRC TB meningitis grade was reported in
29 studies, in which 28% (1354/4761) of participants presented with MRC grade I
disease, 48% (2302/4761) with grade II, and 20% (967/4761) with grade III. A total of 37
studies (n=5,623 participants) reported the classification or uniform case definition of
enrolled participants. Of those, 40% (2,243/5,623) were microbiologically-confirmed TB
meningitis, 49% (2,741/5,623) were suspected TB meningitis, the latter of which
included 21% (1,013/5,623) with probable TB meningitis and 12% (663/5,623) with
possible TB meningitis according to the uniform case definition.10
Figure 2.2. Tuberculous Meningitis Mortality by Country
Tuberculous Meningitis Mortality by Country
Po o led Mo rtalit y
o.o70.10
0.20
0.30
0.50
0.80

20
The most common treatment regimen was standard four-drug therapy of
rifampicin, isoniazid, pyrazinamide, and ethambutol (RHZE) with no additional anti-TB
drugs (n=17 studies). Seven studies used streptomycin in addition or in replacement for
ethambutol (Table 2.1). Median treatment duration was nine months (IQR; 9-12 months).
Corticosteroids were given to all patients in 19 studies, and to some participants in 10
studies (Table 2.1). Treatment outcomes by corticosteroid use was examined in a meta-
analysis with included studies, but this was not the aim nor design of our meta-analysis
and a significant amount of heterogeneity in mortality between studies was unexplained
(Appendix B). A Cochrane meta-analysis on corticosteroid use in TB meningitis was
published in 2016.78
Mortality assessment and outcomes
A wide range of mortality endpoints were reported: 15% (6/39) studies reported
one-month mortality, 5% (2/39) studies reported two-month mortality, 8% (3/39) studies
reported three-month mortality, 18% (7/39) studies reported six-month mortality, 13%
(5/39) studies reported 12-month mortality, and 2% (1/39) reported five-year mortality.
Other reported outcomes included in-hospital mortality (n=6 studies) and median-time to
death (n=4 studies). In the six studies which reported on ‘in-hospital mortality’, only one
study reported on the length of hospitalization which ranged from 4-10 days until death
or discharge. Five studies did not define the ‘in-hospital mortality’ in terms of time
frame.
To investigate time-specific mortality, articles were grouped by follow-up
outcome reporting time point. Articles that reported outcomes less than or equal to three
months were included in the three-month reporting category to summarize ‘early’

21
mortality. Articles that reported outcomes greater than three months to six months were
included in the six-month reporting category. Articles that reported outcomes greater than
six months were included in the 12-month reporting category. Of articles reporting
outcomes at three, six, and 12 months, pooled mortality was 23% (95% CI; 14-35%),
23% (95% CI; 14-33%), and 25% (95% CI; 17-33%), respectively (Figure 2.3). There
was significant heterogeneity (I2 = 95%; p<0·01) for all outcome reporting timepoints.
Figure 2.3. Tuberculous Meningitis Mortality by Outcome Reporting Timepoint

22
There was no marked heterogeneity in mortality between outcome reporting timepoints
(p=0·60), but it was included in the pooled analysis resulting in a pooled mortality of
24% (95% CI; 19-29%).
Mortality endpoints by HIV status
Seven studies reported mortality for HIV-positive adults. For HIV positive adults,
pooled mortality was 57% (95% CI; 48-67%), compared with 16% (95% CI; 10-24%) in
HIV-negative adults (Figure 2.4). HIV status explained a significant amount of the
observed heterogeneity in TB meningitis mortality (p< 0·01).
Figure 2.4. Tuberculous Meningitis Mortality by HIV Status

23
Mortality endpoints by geographical region
Most studies reporting on TB meningitis mortality were conducted in India and
the Asian continent (n=27; 70%) where pooled mortality ranged from 2-67% (Figure
2.2). The countries reporting the highest TB meningitis mortality were located in sub-
Saharan Africa where mortality ranged from 23-80%. Continent (Africa vs. Asia)
explained a significant amount of the observed heterogeneity in TB meningitis mortality
(p=0.02).
Figure 2.5. Tuberculous Meningitis Mortality by Year Published

24
Temporal variation in mortality endpoints
To investigate changes in TB meningitis treatment outcomes over time, we
conducted a temporal analysis in which individual studies were allocated to one of five
time periods and stratified analyses conducted. Time periods were sub-divided into five-
year windows from 1995 onwards, and pooled mortality analyzed within each time
window. Highest pooled mortality was 31% (95% CI; 14-51%) in articles published from
2006-2010, though there was no significant variation by time window (Figure 2.5). In
earlier time periods, the heterogeneity in survival was greatest and heterogeneity appears
to have reduced in the more recent time periods.
Neurological disability
Functional outcomes among survivors was a pre-specified endpoint in 24 studies;
10 studies reported on functional outcomes using the modified Rankin Scale score (n=6)
or the Barthel index (n=5), and 10 studies reported on neurocognitive disability without
using a specified scale or measurement tool, and five studies reported using “clinical
assessments”.
The timing and method of neurological assessments varied between studies; the
most commonly used outcome assessment being physical disability conducted at the end
of follow up. In this analysis, participants were considered disabled if there was any
indication of functional disability as reported by the modified Rankin Scale or Barthel
Index. Of the studies utilizing the modified Rankin Scale, the pooled proportion of
patients experiencing some level of physical disability was 26% (95% CI; 18-35%) with
considerable heterogeneity (Figure 2.6). Of the studies using the Barthel Index the
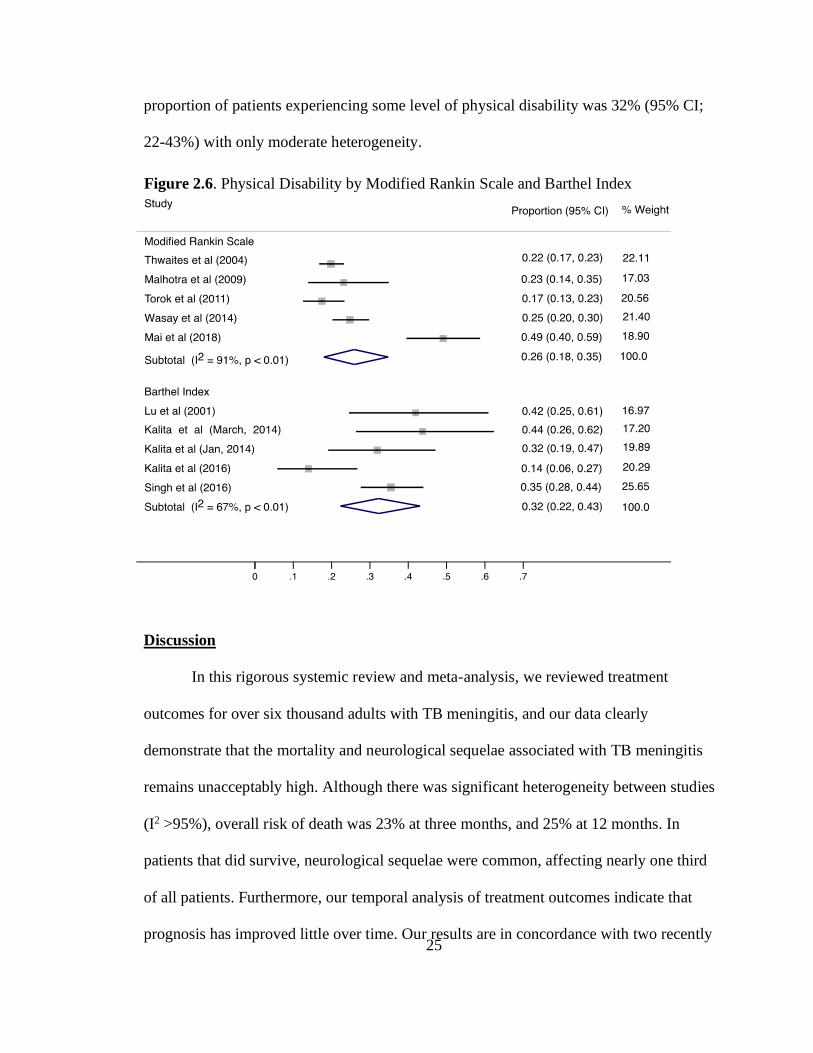
25
proportion of patients experiencing some level of physical disability was 32% (95% CI;
22-43%) with only moderate heterogeneity.
Discussion
In this rigorous systemic review and meta-analysis, we reviewed treatment
outcomes for over six thousand adults with TB meningitis, and our data clearly
demonstrate that the mortality and neurological sequelae associated with TB meningitis
remains unacceptably high. Although there was significant heterogeneity between studies
(I2 >95%), overall risk of death was 23% at three months, and 25% at 12 months. In
patients that did survive, neurological sequelae were common, affecting nearly one third
of all patients. Furthermore, our temporal analysis of treatment outcomes indicate that
prognosis has improved little over time. Our results are in concordance with two recently
Figure 2.6. Physical Disability by Modified Rankin Scale and Barthel Index

26
published systematic reviews which reported overall morality associated with adult TB
meningitis to be 23% and 25%, and risk of neurological sequelae to be 29% and 50%,
respectively. Our study expands on the current literature through sub-group meta-
analyses to evaluate differential treatment outcomes by HIV status and geographical
region.
We have demonstrated that patients with HIV-associated TB meningitis have
three-fold higher mortality compared to HIV-negative cohorts; mortality in HIV-negative
cohorts ranged between 10-24% compared to 48-67% in HIV-positive cohorts (p< 0.01).
Pathogenesis research is urgently needed to investigate the disproportionate mortality
associated with HIV co-infection in TB meningitis, and to identify potential interventions
or preventative measures.
Secondly, our data demonstrate that despite adoption of standardized treatment
regimens for TB meningitis, considerable global disparities in treatment outcomes exist.
Pathogenesis work has shown that even within a Vietnamese population a single genetic
polymorphism significantly impacts on corticosteroid responsiveness and survival from
TBM.79 The extent of the heterogeneity observed in this meta-analysis raises the
possibility that genetic or other latent factors may contribute to outcome and the current
one-size-fits all approach to treatment may be effective in some individuals/populations
and less effective in others. Our sub-group meta-analyses indicate that patients in the
African continent have a higher mortality compared to all other continents. This may in
part be explained by the higher co-prevalence of HIV. However, given the considerable
resource limitations including a lack of intensive care facilities typical of many settings in
sub-Saharan Africa, it is likely that the management of commonly encountered

27
complications of TB meningitis including hyponatremia, raised intracranial pressure,
hydrocephalus, stroke, and nosocomial infections are suboptimal. Further research is
needed to determine the attributable mortality due to a lack of supportive or critical care
in sub-Saharan Africa. Our systematic literature review highlights the historical paucity
of clinical studies published from this continent. In order to address the devastatingly
poor outcomes from HIV-associated meningitis, particularly for those in sub-Saharan
Africa, we need to design, fund and deliver more clinical research.
Our meta-analyses of follow-up time-specific mortality at three, six, and twelve
months, highlight that over 90% of TB meningitis deaths occur in the first three months.
This may justify that three-month mortality is a reasonable RCT endpoint, potentially
making study trial follow-up shorter and cheaper, and therefore accelerating research
outputs. However, the considerable heterogeneity found in these analyses as well as
inconsistencies in reporting outcomes, indicates that further evidence is needed to justify
a three-month clinical trial endpoint. Clinical studies to identify drivers of early mortality
in TB meningitis may inform the design of treatment intensification strategies and other
adjunctive interventions.
Concerningly, our results demonstrate that minimal improvements in survival
have been made over time. There are a number of temporal factors which may have
affected outcomes in certain time periods including the height of the HIV epidemic in the
1990-2005 period, ART rollout in the 1995 to 2010 windows, the increasing availability
of more rapid diagnostics in the form of the Xpert MTB/Rif assay in 2010 to 2020
windows facilitating the diagnosis of TB meningitis where it was previously

28
unconfirmed, and lastly gradually increasing rates of anti-TB drug resistance worldwide.
Reporting bias, which may have varied over time, must also be considered.
Our analysis has several limitations. Firstly, although we only included studies
which employed a pre-specified diagnostic criterion for TB meningitis, there was
considerable variation in the quality of diagnostic criteria used, and diagnostics have
changed over time. We chose not to restrict diagnostic criteria to microbiologically
confirmed TB meningitis, because doing so would have restricted our meta-analysis to
40% (n=2,243) of adults, and furthermore we wanted our results to be generalizable to
real world clinical settings where confirmation rates are often only moderate. We do
however recognize that misclassification of undifferentiated meningitis cases as TB
meningitis is common, especially when left to physician discretion; as may have been the
case in some of the patients included in our meta-analysis and therefore this would
undermine the accuracy of our outcome estimates. Secondly, in the spirit of
generalizability we chose to include case-series, which are primarily descriptive and not
wholly representative of the populations they are drawn from. Although this may have
posed some unmeasurable bias, we believe that this would not have substantially
impacted our results since mortality and neurological sequelae, our outcomes of interest,
would not have measured differently or changed based on study design. Thirdly, the
specific anti-TB regimen utilized and drug resistance rates within the cohorts was
inconsistently reported in studies therefore we were unable to conduct stratified meta-
analyses based on drug resistance patterns. The International Tuberculous Meningitis
Research Consortium paper on standardized methods for enhanced quality and
comparability of TB meningitis studies, specify that it is essential to document the dose,

29
route of administration, and duration of all anti-TB drugs used in TB meningitis studies.80
There remain several outstanding questions concerning the optimal treatment of TB
meningitis, and therefore to facilitate cross study comparisons and interrogate differences
in study outcomes basic information about the treatment provided is essential.
Finally, there was a considerable lack of standardization of reporting on treatment
outcomes. This was particularly marked with respect to reporting of neurological
sequelae; firstly, neurological sequalae were rarely reported (only 10/39 (26%) studies
including any data on neurological sequalae), the tools used were inconsistent (nine tools
in total) and the time-points for assessment were rarely reported. This inconsistent
reporting hampered comparison of data across studies. Given the importance of
neurological disability in TB meningitis and the importance of developing a standardized
evidence base against which to assess new treatments, the International Tuberculous
Meningitis Research Consortium recommend that the modified Rankin Score should be
used as the first line tool, which should be recorded at 12 months from antituberculosis
treatment initiation in all adults.80 We support this recommendation, and in addition
would suggest that mortality be routinely reported on at three, six, and 12 months if
possible, to improve study comparability.
The strengths of this work include its size, with 39 individual studies included
studies from Asia, Africa, Europe and the Americas making our estimates broadly
generalizable to a range of settings. Our systematic review is larger than two previously
published systematic reviews of adult TB meningitis.29,30 In comparison to Wen et al,29
we decided to include randomized control trials in our systematic review which enable us
to include the highest quality of trial evidence, and we also reported drug resistance rates

30
within each included study. In comparison to Wang et al,30 we ascertained variation in
treatment outcomes geographically, and reported on the nature and severity of reported
neurological sequelae. Overall, we assessed a wide range of co-variates to investigate the
heterogeneity in treatment outcomes observed. To our knowledge, this is the most
extensive critical appraisal of TB meningitis outcomes to date.
In conclusion, adult TB meningitis is associated with considerable neurological
morbidity and mortality and remains a major challenge in TB endemic regions. The worst
outcomes are observed by those with HIV co-infection in sub-Saharan Africa where risk
of death is three-fold higher. Our study was limited by suboptimal reporting on diagnostic
criteria utilized, drug resistance rates, details of treatment regimens used, as well highly
variable outcome reporting. Adoption of standardized reporting systems across TB
meningitis studies would not only facilitate across study comparisons, but overall would
also improve the quality of research outputs and support collaborative research across
centers with an aim of improving TB meningitis outcomes globally.

31
CHAPTER 3. MANUSCRIPT 2: DEVELOPMENT AND VALIDATION OF A
CLINICAL PREDICTION TOOL FOR TUBERCULOUS MENINGITIS
Introduction
Tuberculosis remains a major global health problem, and tuberculous (TB)
meningitis is the most lethal and disabling form, representing more than 100,000 new
cases each year.81 Current diagnostic evaluations are lengthy, inaccessible, or insensitive
leading to delayed diagnosis and treatment – significant risk factors for poor outcomes.81
Ziehl-Neelsen staining of CSF has low sensitivity in most settings, and mycobacterial
culture is typically too slow to inform treatment decisions. While recently introduced
nucleic acid amplification tests (NAATs) have the potential to speed up diagnosis,
variable sensitivity in clinical settings means that negative tests are often insufficient to
justify withholding treatment.9 Furthermore, there is a disproportionate burden of TB
meningitis in low-resource settings, where access to NAATs is limited. An additional
barrier to increased knowledge regarding the true prevalence, incidence, and mortality of
TB meningitis as well as the evaluation of novel diagnostics is the lack of an agreed
reference standard that is 100% accurate in all settings.9
One approach to improving rapid diagnosis of TB meningitis is to develop and
validate multivariable prediction models (MPM) for clinical use. At least 10 MPM for TB
meningitis have been developed, which tend to perform well in internal validation but
poorly when externally validated in different settings or populations. The primary
contributing factor of heterogeneous model performance across different settings and
populations is case mix variation, which refers to the distribution of important predictor
variables such as HIV status, age, and the prevalence of TB meningitis. Case mix
variation across different settings or populations can lead to genuine differences in the

32
performance of a prediction model, even when the true predictor effects are consistent
(that is, when the effect of a particular predictor on outcome risk is the same regardless of
the study population).25 Prior MPMs for the diagnosis of TB meningitis were all
developed from a single study or population, and therefore have not adequately
accounted for case-mix variation, compromising external validity and clinical utility.
Furthermore, most approaches to MPM development utilized logistic regression
with stepwise (backwards or forwards) selection of variables into the model, which were
retained if they significantly predicted TB meningitis diagnosis (determined a priori with
a set p-value threshold). This methodological approach has many limitations including
overfitting and the inability to model non-linear associations, including interactions,
without pre-specifications.82-84 Using this approach does not adequately model case-mix
variation, which can also lead to overfitting.83
To overcome these limitations, we collected individual participant data (IPD)
from multiple studies in a variety of geographical locations and evaluated alternative
modeling approaches. IPD is preferred to aggregate data meta-analysis as multiple
individual level factors related to the disease can be examined in combination.85 The
coalition and synthesis of IPD offers a novel and natural opportunity to overcome the
challenge of external validation of previously published MPMs. Recent studies have
shown how big data can be used by researchers to examine heterogeneity and improve
the predictive performance of a model across different populations, settings, and
subgroups.86-88 Therefore, in addition to logistic regression we also analyzed the data
using machine learning techniques, classification and regression tree (CART) and

33
random forest models. Our findings are reported in accordance with the transparent
reporting of a MPM for individual prognosis or diagnosis (TRIPOD) statement.89
Methods:
Literature Search Strategy
This review was carried out according to the Preferred Reporting Items for
Systematic review and Meta-Analysis of IPD (PRISMA) guidelines.90 Our protocol is
available on Wellcome Open Research
(https://doi.org/10.12688/wellcomeopenres.15056.2). A systematic electronic search was
conducted using MEDLINE and EMBASE with the aim of identifying all studies
reporting treatment outcomes in adult tuberculous meningitis from 1990 to present. This
time period corresponds to the WHO recommendation of standard quadruple therapy for
the treatment of tuberculosis.26 Controlled and natural language terms identified key
search concepts such as: “tuberculosis”, “meningitis”, “mortality”, “complications” and
“outcome.” Full search strategies are presented in Appendix C. Searches were conducted
on 26 September 2018.
Study Selection
The following exclusion criteria were applied; (i) studies published before 1990;
(ii) case-control studies and case-series of patients with confirmed TBM (iii) studies not
written in English; (iv) studies where IPD are not available; (v) mathematical modeling
studies; (vi) any systematic review superseded by an updated systematic review; (vii)
studies which collected insufficient data on lab and clinical variables known to predict
TB meningitis (viii) studies of participants less than 5 years old.

34
Studies were eligible for inclusion if they both (i) employed any of the following
study designs: cross-sectional study, cohort study, randomized controlled study; (ii)
systematically evaluated a sample of patients with suspected TB meningitis with at least
one of, Ziehl–Neelsen stain, commercial NAAT for mycobacterium tuberculosis, or
mycobacterial culture of CSF.
A two-stage screening process was employed: title and abstracts were screened
for eligibility by two researchers; and those considered potentially eligible underwent full
review by one researcher.
Risk of bias of included studies was assessed by two independent reviewers using
QUADAS-2,91 discrepancies were resolved by a third reviewer.
Data Acquisition and Synthesis
Corresponding authors of studies identified as eligible after full text review were
contacted with a request to provide anonymized IPD. A data sharing agreement was
signed before eligible authors uploaded the IPD file to an encrypted and secure cloud
storage repository. Uploaded IPD files were harmonized, units were standardized, and
data were synthesized in R studio. Specific IPD variables requested are listed in Table
3.1 and were chosen to include as much information about the participants as possible. Of
these variables, we identified 11 target predictors based on prior studies (Table 1.2):
symptom duration, cerebral spinal fluid (CSF) white blood cell (WBC) count, CSF WBC
differential, CSF glucose, CSF protein, blood glucose, blood WBC count, HIV status,
age, and biological sex. Subjects who were missing more than 50% of target predictors
were excluded. Datasets were excluded if there was a clear pattern of missingness among
the target predictors that was based on diagnosis, age, sex, or some other participant
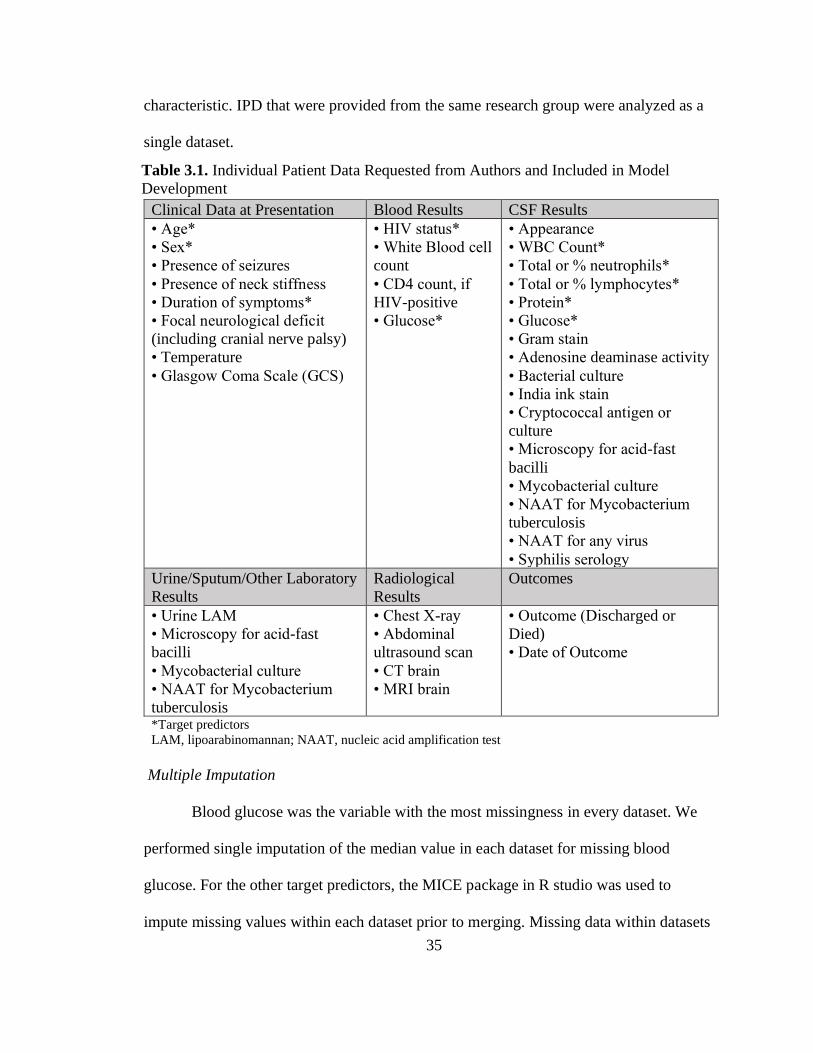
35
characteristic. IPD that were provided from the same research group were analyzed as a
single dataset.
Multiple Imputation
Blood glucose was the variable with the most missingness in every dataset. We
performed single imputation of the median value in each dataset for missing blood
glucose. For the other target predictors, the MICE package in R studio was used to
impute missing values within each dataset prior to merging. Missing data within datasets
Clinical Data at Presentation Blood Results CSF Results
• Age*
• Sex*
• Presence of seizures
• Presence of neck stiffness
• Duration of symptoms*
• Focal neurological deficit
(including cranial nerve palsy)
• Temperature
• Glasgow Coma Scale (GCS)
• HIV status*
• White Blood cell
count
• CD4 count, if
HIV-positive
• Glucose*
• Appearance
• WBC Count*
• Total or % neutrophils*
• Total or % lymphocytes*
• Protein*
• Glucose*
• Gram stain
• Adenosine deaminase activity
• Bacterial culture
• India ink stain
• Cryptococcal antigen or
culture
• Microscopy for acid-fast
bacilli
• Mycobacterial culture
• NAAT for Mycobacterium
tuberculosis
• NAAT for any virus
• Syphilis serology
Urine/Sputum/Other Laboratory
Results
Radiological
Results
Outcomes
• Urine LAM
• Microscopy for acid-fast
bacilli
• Mycobacterial culture
• NAAT for Mycobacterium
tuberculosis
• Chest X-ray
• Abdominal
ultrasound scan
• CT brain
• MRI brain
• Outcome (Discharged or
Died)
• Date of Outcome
*Target predictors
LAM, lipoarabinomannan; NAAT, nucleic acid amplification test
Table 3.1. Individual Patient Data Requested from Authors and Included in Model
Development

36
were assumed missing at random. A total of 50 imputations were used per missing
variable. The fraction of missing information (FMI) statistic was obtained in the
modeling step to assess efficiency gains.92
Data Analysis
We summarized IPD from each of the studies using medians and proportions for
continuous and dichotomous data, respectively. We defined ‘confirmed’ TB meningitis as
having any of the following positive tests in the CSF: Xpert MTB/RIF (Cepheid,
Sunnyvale, CA), Xpert Ultra MTB/RIF, other PCR, culture, acid fast bacilli (AFB), or
‘definite’ TB meningitis classification per the Uniform TBM case definition.10 We
defined ‘probable’ TB meningitis as having no alternate diagnoses and any CT, MRI, or
X-ray suggestive of TB meningitis or a ‘probable’ TB meningitis case classification per
the Uniform TB meningitis case definition.10 In these analyses, participants that fit the
criteria for confirmed or probable TB meningitis were considered a TB meningitis case.
Three algorithm development strategies were employed to predict a binary
outcome: TB meningitis cases vs. non-TB meningitis. First, an IPD meta-analysis using a
logistic regression model with stratified intercepts for each country was fitted with the
selected 11 target predictors.87 We employed a backwards stepwise method for predictor
selection using a p-value threshold of 0.1. We also fitted a logistic regression model
without stratified intercepts. Next, we developed CART and random forest models with
machine learning methods with the same 11 target predictors as well as a variable for
country.
All models were internally validated using an k-fold internal-external cross-
validation (IECV) approach, which is a multiple validation approach that accounts for

37
multiple datasets by rotating which are used toward model development and validation.87
We amalgamated IPD from studies that originated from the same working group into a
single IPD dataset. During the IECV process, each IPD dataset was excluded from the
available set, and the remainder was used to develop the MPMs; the excluded dataset was
then used to validate the model externally. This process was repeated with each dataset
being omitted in turn, allowing the consistency and performance of the developed MPM
to be examined across multiple datasets. We measured performance in each study (fold)
using the calibration ratio of predicted (expected) to observed outcomes (denoted by
E/O), calibration plots (intercept and slope), the area under the receiver operating
characteristic (ROC) curve, and the Brier Score.87,93,94 Good model performance is
reflected by the E/O ratio, calibration slope, and ROC values being close to one. We
summarized overall MPM internal validity by averaging the values of ROC and
amalgamating calibration across the folds in addition to calculating the Brier score. The
Brier score is a measure of the accuracy of probabilistic predictions where a value close
to 0 indicates perfect accuracy.
Additionally, we calculated sensitivity (SE), specificity (SP), positive predictive
value (PPV), negative predictive value (NPV), false positive rate (FPR), false negative
rate (FNR), positive likelihood ratio (LR+), negative likelihood ratio (LR-), and
proportion correctly classified (PCC) in each IPD dataset fold along different prediction
thresholds. All analyses were conducted in R studio.

38
Results
Search results, studies, and participants included
After removal of duplicates, our searches yielded 2179 reports that underwent title
and abstract screening, and 121 full texts were reviewed (Figure 3.1). 34 studies met our
eligibility criteria for inclusion, and we acquired IPD from 19 studies (18 datasets) with a
total of 6,147 individual participants. Four datasets (N=796 individual participants) were
excluded after evaluation of missingness revealed either missingness based on diagnosis
Ide
nti
fica
tio
n
An
aly
zed
Da
taA
vail
ab
le D
ata
Ob
tain
ing
Da
taE
lig
ibil
ity
Scre
en
ing
Studies iden fied through database
searching
(n = 2192)
Studies a er duplicates removed
(n= 2179)
Studies excluded a er tle and
abstract screening
(n = 2058)
Studies Screened(n = 2197)
Full-text studies assessed for
eligibility (n = 121)
Full-text studies excluded (n = 87)Inadequate clinical data collection (n = 73)
Case-controlled study (n = 10)Case series of confirmed TBM only (n = 2)Did not perform reference standard tests (n = 1)Data republished in subsequent paper (n = 1)
Studies for which IPD was sought(n = 34)
Individuals for which IPD wassought
(n = 10607)
Studies (n = 15) for which IPD (n = 4460) was notprovidedCorresponding author did not respond to emails (n = 15)(IPD = 4460)
Studies for which IPD was provided(n = 19)
Individual participants
(n = 6147)
Studies excluded after evaluation of the dataprovided (n = 4)Clear pattern of missingness (n = 2)Key predictors missing >50% of data (n = 2)
Individuals excluded after evaluation of dataprovided (n = 1671)Less than 5 years old (n = 82)Missing >50% of key predictors (n = 1589)
Studies included in analysis (n = 15)
Individuals included in analysis (n = 3671)
Figure 3.1. PRISMA IPD Flow Diagram of Study Selection Process

39
or target predictors were missing >50% of their data. An additional 82 participants less
than five years old and 1,589 participants missing >50% of key predictors were excluded.
The final analysis dataset included 3,671 individual participants from 15 different
studies (Table 3.2). Four studies originated in Brazil95-98 (N= 101, 321, 289, and 92),
three from Vietnam99-101 (N=160, 303, and 204), two from South Africa (N=93 and 36)
102,103, and one each from Uganda104 (N=611) Botswana105 (N=138), Indonesia33
(N=761), Morocco18 (N=414), Peru106 (N=37), and Romania107 (N=111). The studies
conducted by Nhu,99 Heemskerk,100 and Donovan101 in Vietnam, and the studies
conducted by Boulware103 and Rhein104 in Uganda originated from the same working
groups. Most were cohort studies (n=9) or cross-sectional studies (n=4), and two were
randomized controlled trials. The risk of bias assessment is summarized in Appendix D.
No study showed high risk of bias.
A total of 1148 (31%) participants met the case definition for confirmed TB
meningitis and 104 (3%) met the case definition for probable TB meningitis. Of the non-
TB meningitis cases, 13% had cryptococcal, 6% had bacterial, and 3% had viral
meningitis. Most participants had an unknown diagnosis (Figure 3.2). The age range of
participants was between 5 to 90 years old and was statistically significantly different
between TB and non-TB meningitis groups (Table 3.3). Among datasets that disclosed
biological sex or gender, 58% (n=1746) of participants were men. There was no
difference in biological sex or gender between TB and non-TB meningitis groups. With
the exception of the dataset provided by Dendane et al.18, at least 10% of participants
were HIV-positive in each study. The final analysis dataset included 1644 (45%) HIV

40
positive individuals. There was a higher proportion of HIV-positive individuals in the
non-TB meningitis group compared to the TB meningitis group (p<0.001).

41
Author/Owner Year Country TB
Burden
Study
Design* N
Age
(range) Men (%) HIV (%)
Probable
Cases (%)
Confirmed
Cases (%)
Anselmo95 2017 Brazil High Cross-
Sectional 289 43 (6-84) 163 (56) 142 (49) 10 (3.5) 39 (13)
Gualberto96 2017 Brazil High Cohort 92 37 (8-64) 65 (71) 92 (100) 6 (6.5) 8 (8.7)
Azevedo97 2018 Brazil High Cohort 101 40 (17-73) 62 (61) 101 (100) 0 (0) 12 (12)
de Almeida98 2019 Brazil High Cross-
Sectional 321 40 (5-86) 188 (59) 177 (55) 13 (4.0) 13 (4.0)
Nhu99 2014 Vietnam High Cross-
Sectional 160 NA NA 64 (40) 24 (15) 132 (83)
Heemskerk100 2018 Vietnam High Cohort 303 NA NA 38 (13) 0 (0) 70 (23)
Donovan101 2020 Vietnam High Cohort 204 NA NA 43 (21) 0 (0) 113 (55)
Jarvis105 2019 Botswana Low Cross-
Sectional 138 38 (5-90) 80 (58) 97 (70) 3 (2.2) 7 (5.1)
van Laarhoven33 2017 Indonesia High Cohort 761 30 (14-78) 460 (60) 146 (19) 0 (0) 339 (45)
Dendane18 2013 Morocco Low Cohort 414 32 (14-84) 221 (53) 1 (0.2) 0 (0) 246 (60)
Metcalf106 2018 Peru Low Cohort 37 40 (19-77) 27 (73) 23 (62) 11 (30) 8 (22)
Jipa107 2017 Romania Low Cohort 111 34 (18-75) 57 (51) 32 (29) 0 (0) 20 (18)
Bateman102 2012 South Africa High Cohort 93 32 (15-71) 43 (46) 49 (53) 9 (9.7) 30 (32)
Boulware103 2014 South Africa,
Uganda
High,
Low RCT 61 35 (19-75) 37 (61) 58 (95) 4 (7) 31 (51)
Rhein104 2019 Uganda Low RCT 586 34 (14-75) 343 (59) 581 (99) 24 (4) 98 (17)
TOTAL 3671 35 (5-90) 1746 (58) 1644 (45) 104 (2.8) 1148 (31)
*RCT = Randomized controlled trial
Table 3.2. Characteristics of Studies Included in Analysis Dataset

42
Table 3.3. Univariate analysis of clinical, hematological, and CSF data of individual
participants with and without TB meningitis.
non-TBM
(N=2419)
TBM
(N=1252)
p-
value*
Median (IQR)
or N (%)
Median (IQR)
or N (%)
Age, years 35 (27-46) 32 (25-43) <0.001
Men 1,229 (59) 517 (57) 0.260
Symptom Duration, days 7 (4-21) 11 (6-20) <0.001
Fever 1,298 (54%) 871 (70%) <0.001
HIV-positive 1,225 (51%) 419 (34%) <0.001
Blood Glucose, mg/dL 103 (94-113) 104 (84-120) 0.477
CSF WBC count, cells/mm3 8 (2.5-139) 140 (40-319) <0.001
WBC Differential <0.001
WBC < 5 cells/mm3 1,105 (46) 125 (10)
Neutrophilic Dominance 373 (15) 332 (27)
Lymphocytic Dominance 941 (39) 795 (64)
CSF Protein, mg/dL 60 (31-134) 154 (86-267) <0.001
CSF Glucose, mg/dL 53 (37-68) 23 (5.5-41) <0.001
CSF CrAg Positive 455 (19) 13 (1) <0.001 *p-value based on chi-square or Kruskal-Wallis Rank Sum test
Figure 3.2. Meningitis Etiologies of Participants

43
Multivariable Prediction Models
Backwards stepwise predictor selection revealed CSF WBC count, CSF WBC
differential, CSF glucose, blood glucose, HIV status, and CSF cryptococcal antigen
(CrAg) as significant predictors of TB meningitis (Table 3.4). Stratified intercepts for
each country (with Brazil as
the reference group) indicated
significant heterogeneity in
predictors from Indonesia,
Morocco, Peru, South Africa,
Uganda, and Vietnam, with an
overall increased odds of TB
meningitis in these countries
(Table 3.4). A logistic
regression model without
stratified intercepts for
country is presented in
Appendix E.
With the exception of symptom duration, blood WBC count, age, and biological
sex, all key predictors were used in the development of both CART and random forest
models. Symptom duration, blood WBC count, age, and biological sex were excluded
due to complete missingness within datasets, which could not be imputed. The resulting
CART decision tree is shown in Figure 3.3. The color gradient corresponds to predictive
Table 3.4. Logistic Regression Coefficients
Covariate Odds Ratio (95% CI)
CSF WBC count,
100/mm3 0.91 (0.90-0.93)
WBC < 5 cells/mm3 0.25 (0.16-0.40)
Neutrophilic Dominance 0.96 (0.59-1.56)
Lymphocytic Dominance 1.00 (0.64-1.57)
CSF Glucose, 10 mg/dL 0.67 (0.64-0.71)
Blood Glucose, 10 mg/dL 1.07 (1.03-1.10)
HIV-positive 1.43 (1.13-1.82)
CSF CrAg Positive 0.02 (0.01-0.04)
Botswana 0.62 (0.32-1.29)
Indonesia 2.77 (2.02-3.80)
Morocco 5.04 (3.15-8.09)
Peru 2.68 (1.26-5.72)
Romania 0.89 (0.50-1.60)
South Africa 2.41 (1.43-4.07)
Uganda 4.93 (3.44-7.08)
Vietnam 5.52 (3.98-7.64)
Brazil (ref)

44
probability of TB meningitis with
green representing higher
probability of TB meningitis and red
representing lower probability of TB
meningitis. The random forest model
indicated that CSF glucose, CSF
WBC count, CSF protein, and blood
glucose were the most important
variables used in model
development (Appendix F).
Internal-External Cross-Validation
Model performance was assessed in each of the 12 datasets (folds) left out in the
IECV process. All MPMs demonstrated poor calibration in each fold (Table 3.5). The
CART MPM had the widest range of E/O and ROC values, indicating inconsistent
performance across the study IPD. Additionally, CART had the lowest range of ROC
values (0.60-0.84), indicating a weaker discriminatory power than logistic and random
forest models. Performance was worst across all three models for Metcalf.106
Performance was consistent across all three MPMs for Azevedo,97 Gualberto,96
Dendane,18 and the Uganda dataset103,104 indicating clearer distinction between TB and
non-TB meningitis cases (lower heterogeneity). Performance was most inconsistent in
Figure 3.3. Classification and Regression Tree
(CART)
csf_gluc >= 37
csf_wbc < 33
csf_prot < 141
Vietnam1 = 0
csf_gluc >= 51
blood_gl < 109
CrAgPosC = 1
csf_wbc >= 981
Brazil1 = 1
< 37
>= 33
>= 141
= 1
< 51
>= 109
= 0
< 981
= 0
nonTBM
nonTBM
nonTBM nonTBM
nonTBM
nonTBM nonTBM
nonTBM TBM
nonTBM
nonTBM TBM
TBM
nonTBM TBM
nonTBM TBM
nonTBM TBM

45
van Laarhoven,33 Bateman,102 Jipa,107 the Vietnam dataset99-101 indicating more
heterogeneity in TB meningitis cases and non-cases.
Overall discriminatory
power measured by the mean
area under the ROC curve
was similar across MPMs,
with a ROC value of 0.79
(95% CI; 0.75-0.83) for
logistic, 0.76 (95% CI; 0.71-
0.80) for CART, and 0.81
(95% CI; 0.76-0.85) for
random forest (Figure 3.4).
Test Dataset Logistic CART Random Forest
E/O Slope ROC E/O Slope ROC E/O Slope ROC
van
Laarhoven33 0.07 -0.45 0.77
1.15 0 0.60
0.98 0.49 0.89
Bateman102 1.87 0.73 0.79 1.03 0.23 0.73 0.90 0.35 0.83
Jipa107 0.05 -0.22 0.90 2.75 0.07 0.79 1.85 0.70 0.66
Azevedo97 0.17 -0.20 0.79 0.08 -0.30 0.84 0.42 0.09 0.86
de Almeida98 0.58 0.05 0.74 2.15 0.06 0.79 1.31 0.19 0.72
Anselmo95 0.04 -0.44 0.66 0 -0.39 0.80 0.02 -0.44 0.84
Gualberto96 0.50 -0.02 0.88 0.29 -0.07 0.77 0.71 -0.03 0.89
Metcalf106 0.21 -0.59 0.64 1.00 -0.33 0.61 0.84 -0.09 0.65
Dendane18 0.05 -0.23 0.85 1.28 0.06 0.83 1.21 0.35 0.82
Vietnam99-101 0.08 -0.33 0.84 0.73 0.17 0.68 0.64 0.54 0.85
Uganda103,104 0.24 0.06 0.85 0.60 0.04 0.79 0.49 0.29 0.83
Jarvis105 0.40 -0.09 0.78 2.30 0.09 0.83 2.00 0.05 0.85
Figure 3.4. ROC Curves for Logistic, CART, and
Random Forest MPMs
Table 3.5. Internal-External Cross-Validation Multivariable Prediction Model
Performance in Test Dataset
Specificity
Se
nsitiv
ity
1.0 0.8 0.6 0.4 0.2 0.0
0.0
0.2
0.4
0.6
0.8
1.0
Model − ROC (95% CI)
Logistic − 0.79 (0.75−0.83)
CART − 0.76 (0.71−0.80)
Random Forest − 0.81 (0.76−0.85)

46
The Brier score was also similar across the three models with the logistic model
performing only 0.03 points above the CART MPM. Conversely, calibration was varied
between the MPMs. The logistic MPM had the worst calibration with the E/O ratio and
slope values furthest from one compared to the CART and random forest MPMs (Table
3.6). Of the three models, calibration slope was closest to one for the random forest
model (0.59). Visual inspection of the calibration plots for all three MPMs shows a clear
hierarchy of calibration performance with random forest outperforming both logistic and
CART MPMs (Figure
3.5). Random forest
had the most bin
midpoints falling along
a 45-degree line (grey
dotted line),
demonstrating that the
number of TB
meningitis cases
increases as prediction
probability increases.
Table 3.6. Overall Performance of Logistic, CART, and Random Forest MPMs
MPM Overall Calibration Brier
Score ROC (95% CI)
Ratio (E/O)1 Intercept Slope
Logistic 0.16 30.6 0.45 0.19 0.79 (0.75-0.83)
CART 0.99 18.4 0.32 0.16 0.76 (0.71-0.80)
Random
Forest 0.86 14.9 0.59 0.15 0.81 (0.76-0.85)
1E/O = Expected (predicted) case classification / observed case classification
0
25
50
75
100
0 25 50 75 100
Bin Midpoint
Observ
ed E
ve
nt
Pe
rce
nta
ge
Model
Logistic
CART
RF
Figure 3.5. Calibration Plot for Logistic, CART, and
Random Forest MPMs

47
CART was the most poorly calibrated model with the widest confidence intervals and no
observed events falling in the 50-bin midpoint (Figure 3.5).
Diagnostic utility of each MPM is summarized in Tables 3.7-3.9. At the pre-
determined prediction probability cutoff of 0.1, sensitivity and specificity were 0.84 (95%
CI; 0.76-0.92) and 0.52 (95% CI; 0.41-0.64) for logistic regression, 0.77 (95% CI; 0.68-
0.87) and 0.59 (95% CI;0.45-0.73) for CART, and 0.89 (95% CI; 0.82-0.97) and 0.36
(95% CI; 0.24-0.48) for random forest, respectively. The random forest MPM missed the
fewest number of TB meningitis cases with a FNR of 0.11 (95%CI; 0.03-0.18), compared
to the logistic, 0.16 (95%CI; 0.08-0.24), and CART, 0.23 (95%CI; 0.13-0.32), MPMs. In
the presence of a negative test, the logistic and random forest MPMs decreased the
probability of TB meningitis disease by approximately 30% (LR- = 0.25, 95%CI; 0.13-
0.35 and LR- = 0.23, 95%CI; 0.11-0.35, respectively). The CART model had the highest
proportion correctly classified with 0.69 (95%CI; 0.61-0.77) of predictions correctly
classifying IPD as either TB or non-TB meningitis followed by logistic, 0.65 (95%CI;
0.59-0.72), and random forest, 0.56 (95%CI; 0.49-0.62).

48
Cutoff
for T+
Proportion
T+
Sensitivity
(T+|D+)
Specificity
(T-|D-)
Positive
Predictive
Value
(D+|T+)
Negative
Predictive
Value (D-|T-)
False
Positive
Rate (T+|D-)
False
Negative
Rate (T-|D+)
LR+
(T+|D+)/
(T+|D-)
LR-
(T-|D+)/
(T-|D-)
Proportion
Correctly
Classified
0
1
(1-1)
1
(1-1)
0
(0-0)
0.29
(0.19-0.39) NA
1
(1-1)
0
(0-0)
1
(1-1) NA
0.29
(0.19-0.39)
0.1
0.58
(0.45-0.71)
0.84
(0.76-0.92)
0.52
(0.41-0.64)
0.41
(0.31-0.52)
0.93
(0.90-0.96)
0.48
(0.36-0.59)
0.16
(0.08-0.24)
2.2
(1.6-2.7)
0.25
(0.15-0.35)
0.65
(0.59-0.72)
0.2
0.43
(0.29-0.56)
0.74
(0.64-0.85)
0.70
(0.58-0.82)
0.51
(0.40-0.62)
0.90
(0.86-0.94)
0.30
(0.18-0.42)
0.26
(0.15-0.36)
3.6
(2.4-4.9)
0.33
(0.22-0.44)
0.76
(0.71-0.81)
0.3
0.32
(0.18-0.46)
0.62
(0.50-0.74)
0.79
(0.68-0.91)
0.60
(0.49-0.71)
0.85
(0.78-0.93)
0.21
(0.09-0.32)
0.38
(0.26-0.50)
7
(3-11)
0.45
(0.32-0.57)
0.78
(0.72-0.84)
0.4
0.22
(0.1-0.34)
0.41
(0.28-0.53)
0.86
(0.76-0.97)
0.62
(0.52-0.73)
0.80
(0.72-0.88)
0.14
(0.03-0.24)
0.59
(0.47-0.72)
7.8
(4.3-11)
0.65
(0.52-0.78)
0.77
(0.7-0.84)
0.5
0.10
(0-0.22)
0.19
(0-0.33)
0.93
(0.83-1)
0.69
(0.57-0.81)
0.75
(0.65-0.85)
0.07
(0-0.17)
0.81
(0.67-0.94)
11
(1.8-20)
0.83
(0.71-0.95)
0.72
(0.63-0.82)
0.6
0.07
(0-0.17)
0.11
(0-0.24)
0.94
(0.87-1)
0.42
(0.24-0.61)
0.74
(0.64-0.84)
0.06
(0-0.13)
0.89
(0.76-1)
6.1
(1.1-11)
0.91
(0.78-1)
0.71
(0.62-0.81)
0.7
0.05
(0-0.12)
0.07
(0-0.19)
0.97
(0.92-1)
0.41
(0.15-0.67)
0.73
(0.63-0.83)
0.03
(0-0.08)
0.93
(0.81-1.1)
0.79
(0.07-1.5)
0.94
(0.84-1)
0.72
(0.62-0.82)
0.8
0.03
(0-0.09)
0.05
(0-0.14)
0.98
(0.96-1)
0.71
(0.62-0.80)
0.72
(0.63-0.82)
0.02
(0-0.04)
0.95
(0.86-1)
3.3
(2.7-5.2)
0.96
(0.88-1)
0.72
(0.63-0.82)
0.9
0.01
(0-0.03)
0.02
(0-0.048)
0.99
(0.98-1)
0.67
(0.61-0.70)
0.71
(0.61-0.81)
0.01
(0-0.02)
0.98
(0.95-1)
2.8
(1.3-4.2)
0.99
(0.97-1)
0.71
(0.62-0.81)
1
0
(0-0)
0
(0-0)
1
(1-1) NA
0.71
(0.61-0.81)
0
(0-0)
1
(1-1) NA
1
(1-1)
0.71
(0.61-0.81)
Table 3.7. Logistic Regression Diagnostic Performance in IECV by Probability Cutoff

49
Cutoff
for T+
Proportion
T+
Sensitivity
(T+|D+)
Specificity
(T-|D-)
Positive
Predictive
Value
(D+|T+)
Negative
Predictive
Value (D-|T-)
False
Positive
Rate (T+|D-)
False
Negative
Rate (T-|D+)
LR+
(T+|D+)/
(T+|D-)
LR-
(T-|D+)/
(T-|D-)
Proportion
Correctly
Classified
0
1
(1-1)
1
(1-1)
0
(0-0)
0.29
(0.19-0.39) NA
1
(1-1)
0
(0-0)
1
(1-1) NA
0.29
(0.19-0.39)
0.1
0.51
(0.37-0.64)
0.77
(0.68-0.87)
0.59
(0.45-0.73)
0.44
(0.34-0.54)
0.87
(0.8-0.94)
0.41
(0.27-0.55)
0.23
(0.13-0.32)
2.5
(1.8-3.2)
0.39
(0.27-0.51)
0.69
(0.61-0.77)
0.2
0.43
(0.31-0.54)
0.72
(0.63-0.82)
0.70
(0.6-0.8)
0.48
(0.37-0.60)
0.88
(0.81-0.94)
0.30
(0.20-0.40)
0.28
(0.18-0.37)
3
(2.3-3.8)
0.38
(0.27-0.49)
0.73
(0.66-0.80)
0.3
0.35
(0.23-0.46)
0.66
(0.57-0.76)
0.79
(0.71-0.86)
0.55
(0.44-0.66)
0.87
(0.81-0.93)
0.21
(0.14-0.29)
0.34
(0.24-0.43)
4.3
(3-5.7)
0.41
(0.31-0.51)
0.78
(0.74-0.83)
0.4
0.30
(0.17-0.43)
0.52
(0.34-0.69)
0.81
(0.72-0.9)
0.49
(0.34-0.64)
0.84
(0.78-0.91)
0.19
(0.10-0.28)
0.48
(0.31-0.66)
3.4
(1.9-4.9)
0.56
(0.39-0.73)
0.78
(0.73-0.83)
0.5
0.30
(0.17-0.43)
0.52
(0.34-0.69)
0.81
(0.72-0.9)
0.49
(0.34-0.64)
0.84
(0.78-0.91)
0.19
(0.10-0.28)
0.48
(0.31-0.66)
3.4
(1.9-4.9)
0.56
(0.39-0.73)
0.78
(0.73-0.83)
0.6
0.30
(0.17-0.43)
0.51
(0.33-0.69)
0.81
(0.73-0.90)
0.54
(0.42-0.67)
0.84
(0.78-0.91)
0.19
(0.10-0.27)
0.49
(0.31-0.67)
3.8
(2.3-5.4)
0.56
(0.39-0.74)
0.78
(0.73-0.83)
0.7
0.25
(0.13-0.38)
0.48
(0.30-0.66)
0.86
(0.78-0.93)
0.62
(0.51-0.74)
0.84
(0.77-0.91)
0.14
(0.07-0.22)
0.52
(0.34-0.7)
5.2
(3.5-6.9)
0.57
(0.40-0.75)
0.80
(0.75-0.85)
0.8
0.04
(0-0.11)
0.07
(0-0.18)
0.98
(0.95-1)
0.83
(0.76-0.91)
0.73
(0.64-0.83)
0.02
(0-0.05)
0.93
(0.82-1)
8.2
(4.7-12)
0.94
(0.83-1)
0.73
(0.64-0.83)
0.9
0
(0-0)
0
(0-0)
1
(1-1) NA
0.71
(0.61-0.81)
0
(0-0)
1
(1-1) NA
1
(1-1)
0.71
(0.61-0.81)
1
0
(0-0)
0
(0-0)
1
(1-1) NA
0.71
(0.61-0.81)
0
(0-0)
1
(1-1) NA
1
(1-1)
0.71
(0.61-0.81)
Table 3.8. CART Diagnostic Performance in IECV by Probability Cutoff

50
Cutoff
for T+
Proportion
T+
Sensitivity
(T+|D+)
Specificity
(T-|D-)
Positive
Predictive
Value
(D+|T+)
Negative
Predictive
Value (D-|T-)
False
Positive
Rate (T+|D-)
False
Negative
Rate (T-|D+)
LR+
(T+|D+)/
(T+|D-)
LR-
(T-|D+)/
(T-|D-)
Proportion
Correctly
Classified
0
1
(1-1)
1
(1-1)
0
(0-0)
0.29
(0.19-0.39) NA
1
(1-1)
0
(0-0)
1
(1-1) NA
0.29
(0.19-0.39)
0.1
0.70
(0.57-0.82)
0.89
(0.82-0.97)
0.36
(0.24-0.48)
0.35
(0.26-0.45)
0.93
(0.88-0.98)
0.64
(0.52-0.76)
0.11
(0.03-0.18)
1.5
(1.3-1.8)
0.23
(0.11-0.35)
0.56
(0.49-0.62)
0.2
0.51
(0.36-0.66)
0.80
(0.70-0.91)
0.58
(0.43-0.73)
0.46
(0.37-0.55)
0.90
(0.84-0.97)
0.42
(0.27-0.57)
0.20
(0.09-0.30)
3
(1.9-4.1)
0.30
(0.16-0.44)
0.70
(0.64-0.77)
0.3
0.41
(0.27-0.56)
0.72
(0.61-0.83)
0.69
(0.54-0.84)
0.54
(0.43-0.65)
0.84
(0.76-0.92)
0.31
(0.16-0.46)
0.28
(0.17-0.39)
6.2
(1.4-11)
0.42
(0.31-0.52)
0.75
(0.69-0.81)
0.4
0.34
(0.20-0.47)
0.62
(0.49-0.75)
0.78
(0.67-0.89)
0.60
(0.48-0.73)
0.87
(0.80-0.93)
0.22
(0.11-0.33)
0.38
(0.25-0.51)
4.9
(2.9-6.9)
0.44
(0.31-0.58)
0.78
(0.73-0.83)
0.5
0.27
(0.15-0.38)
0.52
(0.39-0.66)
0.86
(0.79-0.92)
0.65
(0.52-0.77)
0.84
(0.78-0.90)
0.14
(0.08-0.21)
0.48
(0.34-0.61)
5.9
(3.9-8)
0.53
(0.40-0.66)
0.80
(0.77-0.84)
0.6
0.16
(0.09-0.24)
0.35
(0.23-0.47)
0.93
(0.89-0.96)
0.66
(0.55-0.77)
0.78
(0.71-0.86)
0.07
(0.04-0.11)
0.65
(0.53-0.77)
8.8
(4.4-13)
0.69
(0.58-0.80)
0.79
(0.73-0.84)
0.7
0.06
(0-0.10)
0.17
(0-0.26)
0.98
(0.97-0.99)
0.64
(0.45-0.82)
0.74
(0.64-0.83)
0.02
(0.01-0.03)
0.83
(0.74-0.93)
6.4
(3.7-9.2)
0.85
(0.76-0.94)
0.75
(0.66-0.83)
0.8
0
(0-0.02)
0.02
(0-0.05)
1
(1-1)
0.79
(0.58-1)
0.72
(0.62-0.81)
0
(0-0.01)
0.98
(0.95-1)
8.9
(2.7-15)
0.98
(0.95-1)
0.72
(0.62-0.82)
0.9
0
(0-0)
0
(0-0)
1
(1-1) NA
0.71
(0.61-0.81)
0
(0-0)
1
(1-1) NA
1
(1-1)
0.71
(0.61-0.81)
1
0
(0-0)
0
(0-0)
1
(1-1) NA
0.71
(0.61-0.81)
0
(0-0)
1
(1-1) NA
1
(1-1)
0.71
(0.61-0.81)
Table 3.9. Random Forest Diagnostic Performance in IECV by Probability Cutoff

51
Discussion
In this systematic review and IPD meta-analysis we developed and internally
validated three unique MPMs using IPD from over three thousand adults spanning nine
countries. Our data clearly demonstrates that heterogeneity in clinical and subacute TB
meningitis case presentation impacts performance of MPMs for TB meningitis. Although
we accounted for this heterogeneity in every step of MPM development – from the data
we used to the analytical methods employed – IECV revealed that performance of the
three MPMs varied considerably in different populations and settings. Random forest, a
machine learning based MPM, had slightly more promise in reducing the number of
missed TB meningitis cases with a sensitivity of 0.89 (95% CI; 0.82-0.97) and a false
negative rate of 0.11 (95%CI; 0.03-0.18) at a threshold of 0.1. Our MPMs and internal
validation results are in concordance with the 10 published clinical prediction tools based
on MPMs, which showed similar significant predictors of TB meningitis and
performance, respectively. Our study expands on the current literature through the use of
IPD from multiple populations and settings and machine learning modeling approaches to
improve the timeliness and efficiency of TB meningitis diagnosis.
We have demonstrated that machine learning approaches to MPM development
are not superior to classic MPM development approaches such as logistic regression. In
fact, the CART MPM performed substantially worse than the logistic MPM and the
random forest MPM performance was no different than the logistic regression MPM.
Machine learning algorithms have been gaining popularity as an alternative approach to
prediction and classification algorithms in clinical contexts. However, a recent systematic
review indicates that there is, on average, no difference in the performance between

52
logistic regression and machine learning approaches.108 The strong predictive ability of
machine learning models increase the susceptibility of over-calibration to the
development dataset and thus impact performance external validity.108 This phenomenon
was demonstrated in the CART MPM where over-calibration was observed in seven out
of the twelve folds and had the worst overall performance compared to the logistic and
random forest MPMs. Additionally, machine learning approaches tend to perform better
when the amount of relevant information is greater than the amount of non-relevant
information, otherwise known as the signal-to-noise ratio. In in the case of TB
meningitis, there is a considerable amount of observed “noise” due to case-mix variation,
lowering the overall signal-to-noise ratio. The non-inferiority in the performance of the
logistic MPM compared to the random forest MPM demonstrates that the two machine
learning approaches evaluated in this study do not improve prediction for TB meningitis,
which is already challenging to diagnose.
Secondly, our data demonstrates the significant contribution HIV-infection makes
to case-mix variation. HIV prevalence has been identified as a significant contributor to
heterogenous outcomes in TB meningitis and is thought to modulate pathogenesis of TB
meningitis disease.5 All three MPMs developed in this study performed most consistently
in IPD studies that had the entire sample either comprised of HIV-positive96,97,103,104 or -
negative persons.18 Conversely, the MPMs were most inconsistent in IPD studies with an
HIV-prevalence range from 13-53%. Although HIV status was included in the MPMs as
an independent predictor of TB meningitis, there remains significant heterogeneity in
performance in IPD datasets with a mix of HIV-positive and -negative persons. In a
separate analysis we excluded the country intercepts and found that HIV-status was no

53
longer an independent predictor of TB meningitis. This finding suggests that the country
intercepts in the logistic regression model attempt to explain the heterogeneity induced by
the presence of HIV-infection. Further research is needed to elucidate the relationship
between HIV prevalence, geographic location, and TB meningitis prediction.
While this analysis has many strengths that make it an important contribution to
TB meningitis diagnostics, there are some limitations. It is possible that TB meningitis
cases were misclassified as non-cases. This limitation stems from the fact that there is no
“gold-standard” for diagnosing TB meningitis and the current diagnostic procedures have
variable sensitivity and specificity, which is the primary motivation behind this study. We
attempted to account for this limitation by standardizing our TB case definitions across
the IPD studies and including cases of probable TB meningitis in the outcome. These
steps likely captured the majority of TB cases.
Another limitation to our analysis is missing data, including a lack of outcome
data on all participants. Due to complete missingness of symptom duration, age, and
biological sex in some IPD studies, these variables could not be imputed and had to be
excluded from MPM development. Each of these variables have been indicated in prior
MPMs as significant predictors of TB meningitis but could not be explored in this
analysis. The lack of outcome data prevents us from conducting an efficacy validation on
survival, which would have illustrated any reduction in mortality as a result of early
identification of TB meningitis. Although not a limiting factor in terms of MPM
development, it does limit our ability to show how the implementation of the MPMs
could be useful in preventing adverse outcomes.

54
In conclusion, a machine learning based MPM does not substantially improve TB
diagnostics over logistic regression. TB meningitis remains a difficult disease to diagnose
with HIV status contributing to underlying heterogeneity and case-mix variation. Our
study was limited by the available data and extensive missingness. Prioritizing the
collection of data important to predicting TB meningitis such as CSF WBC count,
differential, and CSF glucose could be used to better inform a MPM and are rapid, cost-
effective ways better predict TB meningitis.

55
CHAPTER 4. MANUSCRIPT 3: EXTERNAL VALIDATION OF CLINICAL
PREDICTION TOOL FOR TUBERCULOUS MENINGITIS
Introduction
As discussed in prior sections, a major limitation to the clinical prediction tools based
on multivariable prediction models (MPMs) that have been developed for TB meningitis
diagnosis is that performance is variable in different populations81 (See Table 1.2 for full
list of prior clinical prediction tools). A clinical prediction tool developed with data from
a Vietnamese population is currently the only one to be tested for external validity.12 This
clinical prediction tool was originally described to be 86% sensitive and 79% specific for
TB meningitis diagnosis in Vietnamese adults,12 and subsequent studies in Turkey,21
Vietnam,111 India,17 China,22 and Colombia23 reported sensitivities >90% and specificities
ranging from 50–90%.81 However, the performance of the Vietnamese clinical prediction
tool was not generalizable to an HIV-positive cohort in Malawi, where the tool was only
78% sensitive and 43% specific, with cryptococcal meningitis accounting for most of the
false-positive results.24 The Uniform TB Meningitis Case Definition (UTBMCD) has
been published to help standardize diagnostics in TB meningitis clinical research and
enable direct comparison of studies.10 However, the UTBMCD was not designed to be
used as a clinical prediction tool and was shown to perform poorly when used in non-
research settings.112
In the past, clinical prediction tools have been developed with relatively small
datasets, which likely does not capture the complexities of predictor selection, limits the
types of model approaches that are feasible, and/or leads to the model overfitting the
data.113 This not only has implications for internal validity but also impacts the ability for
a model to be externally valid. To overcome this challenge, we have addressed sources of

56
bias in every step of model development from inclusion of data from different
populations/settings to internally-externally cross-validating (IECV) the model with each
external dataset we include (Manuscript 2). Externally validating the clinical prediction
tool can further evaluate its diagnostic performance and demonstrate its clinical utility in
various settings and populations.
The aim of this study is to assess performance of the MPMs developed in
Manuscript 2 with data from an external cohort not used in the development of the
MPMs. Additionally, we evaluated performance along different prediction probability
thresholds to accomplish two different goals. First, we determined the prediction
probability threshold that maximizes sensitivity in order to more efficiently rule out TB
meningitis. This is important because most confirmatory diagnostic tests for TB
meningitis lack sensitivity to rule out TB meningitis, which can miss cases of TB
meningitis and further delay treatment. Secondly, we identified the probability thresholds
for which we could categorize clinically actionable next steps, such as the threshold for
which TB meningitis can be ruled out, when clinicians should seek confirmatory testing
(e.g., Gene Xpert, TB culture, etc.), and the threshold for which clinicians can
immediately begin anti-TB meningitis treatment. This will also improve efficiency and
help guide clinical decision making.
Methods
We attained screening data from a multisite, observational cohort based in Uganda
entitled, Improving Diagnostics and Neurocognitive Outcomes in HIV/AIDS-related
Meningitis (DINEOUT). Participants were included if they had complete data for the
predictors included in the clinical prediction tool developed in Manuscript 2: cerebral

57
spinal fluid (CSF) white blood cell (WBC) count, CSF WBC differential, CSF glucose,
CSF protein, blood glucose, HIV status, and CSF cryptococcal antigen (CrAg) test
results. We performed single imputation of the median value for missing blood glucose.
We defined ‘confirmed’ TB meningitis as having any of the following positive tests
in the CSF: Xpert MTB/RIF (Cepheid, Sunnyvale, CA), Xpert Ultra MTB/RIF, other
PCR, culture, acid fast bacilli (AFB), or ‘definite’ TB meningitis classification per the
Uniform TBM case definition.10 We defined ‘probable’ TB meningitis as having no
alternate diagnoses and any CT, MRI, or X-ray suggestive of TB meningitis or a
‘probable’ TB meningitis case classification per the UTBMCD.10
Data Analysis
Baseline clinical characteristics and demographic data was compared by TB
meningitis case status using chi-squared or non-parametric methods as indicated. We
assessed diagnostic performance using calibration ratio of predicted (expected) to
observed outcomes (denoted by E/O), calibration plots (intercept and slope), the area
under the receiver operating characteristic (ROC) curve, and the Brier Score.87,93,94 We
calculated sensitivity (SE), specificity (SP), positive predictive value (PPV), negative
predictive value (NPV), false positive rate (FPR), false negative rate (FNR), positive
likelihood ratio (LR+), negative likelihood ratio (LR-), and proportion correctly classified
(PCC) along different prediction thresholds. All analyses were conducted in R studio.
Results
Participants Included
A total of 404 participants were included in the external validation dataset from
DINEOUT (Table 4.1). Of those, 32 (8%) participants met the case definition for

58
confirmed TB meningitis and 28 (7%) met the case definition for probable TB meningitis
(Figure 4.1). The dominant meningitis etiology was cryptococcal meningitis (58%). The
age range of participants was between 18 to 80 years old and was statistically
Table 4.1. Univariate Analysis, clinical, hematological, and CSF data of individual
participants in external validation dataset
Figure 4.1. Meningitis Etiologies in External Validation Dataset
non-TBM
(N=344)
TBM
(N=60)
p-value*
Median (IQR)
or N (%)
Median (IQR)
or N (%)
Age, years 36 (30-43) 33 (27-39) 0.015
Men 214 (62) 33 (55) 0.361
Fever 155 (45) 55 (92) <0.001
HIV-positive 332 (97) 54 (90) 0.055
Blood Glucose, mg/dL 120 (120-120) 120 (120-120) <0.001
CSF WBC count, cells/mm3 2.5 (2.5-31) 33 (2.5-178) <0.001
WBC Differential <0.001
WBC < 5 cells/mm3 228 (66) 23 (38)
Neutrophilic Dominance 4 (1) 3 (5)
Lymphocytic Dominance 112 (33) 34 (57)
CSF Protein, mg/dL 84 (40-119) 11 (60-169) 0.008
CSF Glucose, mg/dL 70 (47-90) 40 (20-76) <0.001
CSF CrAg Positive 235 (68) 0 (0) <0.001 *p-value based on chi-square or Kruskal-Wallis Rank Sum test

59
significantly different between TB and non-TB meningitis groups (Table 4.1). There
was no difference in biological sex or gender between groups. Most participants were
HIV-positive (N=386, 96%) and there was no significant difference in the proportion of
HIV-positive individuals between the non-TB and TB meningitis groups (p<0.055).
Model Performance
The discriminatory power measured by the mean area under the ROC curve was
highest for logistic regression
(0.92), followed by random
forest (0.90) and CART (0.85)
(Figure 4.2). All models were
under-calibrated with E/O ratio
values less than one (Table
4.2). Of the three models,
calibration slope was closest to
one for the logistic regression
model (0.94). Visual inspection
of the calibration plots for all three MPMs shows that logistic regression has the most bin
midpoints falling along a 45-degree line (grey dotted line) of observed event percentage
indicating that logistic regression is the best calibrated MPM (Figure 4.3). CART
Figure 4.2. ROC Curves for Logistic, CART, and
Random Forest MPMs
Table 4.2. Performance of Logistic, CART, and Random Forest MPMs
Specificity
Se
nsitiv
ity
1.0 0.8 0.6 0.4 0.2 0.0
0.0
0.2
0.4
0.6
0.8
1.0
Model − ROC (95% CI)
Logistic − 0.92
CART − 0.82
Random Forest − 0.91
MPM Overall Calibration Brier
Score
ROC
Ratio (E/O)1 Intercept Slope
Logistic 0.73 0.46 0.94 0.07 0.92
CART 0.93 21.8 -0.02 0.09 0.82
Random
Forest
0.70 -2.66 1.11 0.06 0.91
1E/O = Expected (predicted) case classification / observed case classification

60
remained the least calibrated
model. Brier scores were
very similar across the
three MPMs (Table 4.2).
Diagnostic
utility of each MPM is
summarized in Tables 4.3-
4.5. At the pre-determined
prediction probability
cutoff of 0.1, sensitivity
and specificity were 0.90
and 0.79 for logistic regression, 0.70 and 0.81 for CART, and 0.87 and 0.73 for random
forest, respectively. The logistic MPM missed the fewest number of TB meningitis cases
with a FNR of 0.10 compared to the CART (FNR=0.30) and random forest (FNR=0.13)
MPMs. In the presence of a negative test, the logistic MPM decreased the probability of
TB meningitis disease by approximately 87% (LR- = 0.13) compared to ~40% and ~80%
in the CART and random forest MPMs, respectively. The logistic model had the highest
proportion correctly classified with 80% of predictions correctly classifying IPD as either
TB or non-TB meningitis followed by CART, 79%, and random forest, 75%.
Figure 4.3. Calibration Plot for Logistic, CART, and
Random Forest MPMs
0
25
50
75
100
0 25 50 75 100
Bin Midpoint
Observ
ed E
ve
nt
Pe
rce
nta
ge
Model
Logistic
CART
RF

61
Table 4.3. Logistic Regression Diagnostic Performance in External Validation by
Probability Cutoff
Table 4.4. CART Diagnostic Performance in External Validation by Probability Cutoff
Cutoff
for T+
%
T+
SE
(T+|D+)
SP
(T-|D-)
PPV
(D+|T+)
NPV
(D-|T-)
FPR
(T+/D-)
FNR
(T-|D+)
LR+
(T+|D+)/
(T+|D-)
LR-
(T-|D+)/
(T-|D-) PCC
0 1 1 0 0.15 NA 1 0 1 NA 0.15
0.1 0.31 0.90 0.79 0.43 0.98 0.21 0.10 4.24 0.13 0.80
0.2 0.19 0.75 0.90 0.58 0.95 0.10 0.25 7.82 0.28 0.88
0.3 0.16 0.70 0.94 0.67 0.95 0.06 0.30 11.47 0.32 0.90
0.4 0.14 0.68 0.96 0.73 0.95 0.04 0.32 15.67 0.33 0.92
0.5 0.11 0.58 0.97 0.80 0.93 0.03 0.42 22.3 0.43 0.92
0.6 0.10 0.53 0.98 0.82 0.92 0.02 0.47 26.21 0.48 0.91
0.7 0.08 0.42 0.98 0.81 0.91 0.02 0.58 23.89 0.59 0.90
0.8 0.05 0.28 0.99 0.89 0.89 0.01 0.72 48.73 0.72 0.89
0.9 0.02 0.13 0.99 0.80 0.87 0.01 0.87 22.93 0.87 0.87
1 0 0 1 NA 0.85 0 1 NA 1 0.85 SE, Sensitivity; SP, Specificity; PPV, positive predictive value; NPV, negative predictive value; FPR, false
positive rate; FNR, false negative rate; LR+, positive likelihood ratio; LR- negative likelihood ratio; PCC,
proportion correctly classified
Cutoff
for T+
%
T+
SE
(T+|D+)
SP
(T-|D-)
PPV
(D+|T+)
NPV
(D-|T-)
FPR
(T+|D-)
FNR
(T-|D+)
LR+
(T+|D+)/
(T+|D-)
LR-
(T-|D+)/
(T-|D-) PCC
0 1 1 0 0.15 NA 1 0 1 NA 0.15
0.1 0.26 0.70 0.81 0.39 0.94 0.19 0.30 3.7 0.37 0.79
0.2 0.14 0.57 0.93 0.60 0.93 0.07 0.43 8.48 0.46 0.88
0.3 0.14 0.57 0.93 0.60 0.93 0.07 0.43 8.48 0.46 0.88
0.4 0.14 0.55 0.93 0.59 0.92 0.07 0.45 8.23 0.48 0.88
0.5 0.14 0.55 0.93 0.59 0.92 0.07 0.45 8.23 0.48 0.88
0.6 0.08 0.45 0.99 0.84 0.91 0.01 0.55 30.96 0.56 0.91
0.7 0.08 0.45 0.99 0.84 0.91 0.01 0.55 30.96 0.56 0.91
0.8 0 0 1 NA 0.85 0 1 NA 1 0.85
0.9 0 0 1 NA 0.85 0 1 NA 1 0.85
1 0 0 1 NA 0.85 0 1 NA 1 0.85 SE, Sensitivity; SP, Specificity; PPV, positive predictive value; NPV, negative predictive value; FPR, false
positive rate; FNR, false negative rate; LR+, positive likelihood ratio; LR- negative likelihood ratio; PCC,
proportion correctly classified

62
Discussion
In this external validation study, we assessed the performance of three unique
MPMs using IPD derived from a high HIV-prevalent setting. Our analysis clearly
demonstrates predictive superiority of the logistic regression MPM compared to the
CART and random forest machine learning approaches. The logistic MPM had better
classification ability (ROC=0.92) and was better calibrated (slope=0.94) to the external
validation dataset from DINEOUT. Although, the random forest MPM initially showed
slightly more promise in reducing the number of missed TB meningitis cases in internal
validation, poor calibration ultimately impacted external validity. Our MPMs performed
as well as the 10 published clinical prediction tools based on MPMs, if not better.
This analysis identified important prediction thresholds that could be used to
guide clinical practice for diagnosing TB meningitis. Across all three MPMs, the
Table 4.5. Random Forest Diagnostic Performance in External Validation by Probability
Cutoff
Cutoff
for T+
%
T+
SE
(T+|D+)
SP
(T-|D-)
PPV
(D+|T+)
NPV
(D-|T-)
FPR
(T+|D-)
FNR
(T-|D+)
LR+
(T+|D+)/
(T+|D-)
LR-
(T-|D+)/
(T-|D-) PCC
0 1 1 0 0.15 NA 1 0 1 NA 0.15
0.1 0.36 0.87 0.73 0.36 0.97 0.27 0.13 3.17 0.18 0.75
0.2 0.17 0.73 0.93 0.64 0.95 0.07 0.27 10.09 0.29 0.90
0.3 0.14 0.68 0.96 0.75 0.95 0.04 0.32 16.79 0.33 0.92
0.4 0.12 0.65 0.97 0.80 0.94 0.03 0.35 22.36 0.36 0.92
0.5 0.10 0.57 0.98 0.81 0.93 0.02 0.43 24.37 0.44 0.92
0.6 0.09 0.53 0.98 0.84 0.92 0.02 0.47 30.58 0.47 0.92
0.7 0.07 0.43 0.99 0.93 0.91 0.01 0.57 74.53 0.57 0.91
0.8 0.04 0.25 1 1 0.88 0 0.75 NA 0.75 0.89
0.9 0.01 0.07 1 1 0.86 0 0.93 NA 0.93 0.86
1 0 0 1 NA 0.85 0 1 NA 1 0.85 SE, Sensitivity; SP, Specificity; PPV, positive predictive value; NPV, negative predictive value; FPR, false
positive rate; FNR, false negative rate; LR+, positive likelihood ratio; LR- negative likelihood ratio; PCC,
proportion correctly classified

63
predetermined prediction probability threshold of 0.10 was the best cutoff for excluding
non-cases while maintaining a low false negative rate across all three MPMs. The logistic
MPM performed best at this threshold with an NPV=0.98 and LR- = 0.13, indicating that
a negative test (predicted probability <0.1) had substantially reduced the likelihood of a
false negative test. The optimal threshold for ‘ruling in’ TB meningitis appeared to be
0.4, where the FPR = 0.04 and LR+ = 15.67, indicating that persons who had a positive
test (predicted probability 0.4) substantially increased the likelihood of actually having
TB meningitis. In practice, these predictive thresholds could be used as a guide to inform
diagnostic approaches to meningitis. Anyone with a predictive probability less than 0.1
could be evaluated for another etiology and anyone with a predictive probability 0.4
could be started on anti-TB treatment immediately. Persons with a predictive probability
between 0.1 and 0.4 could be referred for rapid confirmatory testing, such as an NAAT.
In this diagnostic approach, there is a strong potential to reduce the delay between
identification and treatment by increasing efficiency and maximizing resources.
A major strength of this analysis is the generalizability of our MPMs. Our MPMs
showed good performance utilizing lab and clinical evaluations that are readily available
in resource-limited settings, where the burden of TB meningitis is greatest. According to
the WHO, blood glucose, HIV testing, and CrAg screenings are all considered essential
diagnostics and are typically supplied in most hospitals and clinics. A full CSF evaluation
may be harder to procure, but where there is capacity to attain a complete blood count
and blood glucose values, there is capacity to attain these for CSF samples. In the
absence of confirmatory diagnostic tests for TB meningitis, such as Gene Xpert or Gene

64
Xpert Ultra, our MPMs provide a tool to guide clinical decision making that can be
utilized in most settings.
While this study has many strengths that make it an important contribution to
improving TB meningitis diagnostics, there are some limitations. The limitation of
misclassification of TB meningitis persists due to inadequate diagnostics. TB meningitis
diagnosis is determined on a case-by-case basis by the clinical staff, including physicians,
and principal investigators, using all the available data. Thus, this limitation is mitigated
by experience and expertise of the clinical team who manages and treats the participants
in the DINEOUT cohort. We are confident in the case classification determined by the
DINEOUT team and anticipate that the proportion of misclassified cases would be
negligible and not significantly impact the overall findings of this study. Another
limitation to this study is representation from only one setting. Having data representing
different locations and settings to externally validate the MPMs would have provided a
more robust ascertainment of performance across different locations and settings.
Finally, the DINEOUT cohort was compromised of a majority of HIV-positive persons.
We observed in prior IECV that the MPMs performed best in cohort that were either
comprised of mostly HIV positive or negative persons. Thus, the performance
demonstrated in this analysis may be biased.
In conclusion, logistic regression prevailed over machine learning methods in
accurately predicting TB meningitis. Developing MPMs that account for case-mix
variation due to HIV-status and geographic location have improved the overall
performance of clinical predictions tools for TB meningitis. Our study was limited by the
available data for external validation. Incorporating the logistic MPM into clinical

65
evaluation for TB meningitis has the potential to be a cost-effective and efficient way to
improve TB diagnostics.

66
REFERENCES
1. WHO. Global Tuberculosis Report 2020: World Health Organization; 2020.
2. Seddon JA, Wilkinson R, van Crevel R, Figaji A, Thwaites GE, Tuberculous
Meningitis International Research C. Knowledge gaps and research priorities in
tuberculous meningitis. Wellcome Open Res 2019; 4: 188.
3. Wilkinson RJ, Rohlwink U, Misra UK, et al. Tuberculous meningitis. Nat Rev
Neurol 2017; 13(10): 581-98.
4. Seddon JA, Tugume L, Solomons R, Prasad K, Bahr NC, Tuberculous Meningitis
International Research C. The current global situation for tuberculous meningitis:
epidemiology, diagnostics, treatment and outcomes. Wellcome Open Res 2019; 4: 167.
5. Stadelman AM, Ellis J, Samuels THA, et al. Treatment Outcomes in Adult
Tuberculous Meningitis: A Systematic Review and Meta-analysis. Open Forum Infect
Dis 2020; 7(8): ofaa257.
6. Thwaites GE, van Toorn R, Schoeman J. Tuberculous meningitis: more questions,
still too few answers. Lancet Neurol 2013; 12(10): 999-1010.
7. Pehlivanoglu F, Yasar KK, Sengoz G. Tuberculous meningitis in adults: a review
of 160 cases. ScientificWorldJournal 2012; 2012: 169028.
8. Bahr NC, Meintjes G, Boulware DR. Inadequate diagnostics: the case to move
beyond the bacilli for detection of meningitis due to Mycobacterium tuberculosis. J Med
Microbiol 2019; 68(5): 755-60.
9. Boyles TH, Thwaites GE. Appropriate use of the Xpert (R) MTB/RIF assay in
suspected tuberculous meningitis. Int J Tuberc Lung D 2015; 19(3): 276-7.
10. Marais S, Thwaites G, Schoeman JF, et al. Tuberculous meningitis: a uniform
case definition for use in clinical research. The Lancet Infectious diseases 2010; 10(11):
803-12.
11. Kumar R, Singh SN, Kohli N. A diagnostic rule for tuberculous meningitis. Arch
Dis Child 1999; 81(3): 221-4.
12. Thwaites GE, Chau TT, Stepniewska K, et al. Diagnosis of adult tuberculous
meningitis by use of clinical and laboratory features. Lancet 2002; 360(9342): 1287-92.
13. Youssef FG, Afifi SA, Azab AM, et al. Differentiation of tuberculous meningitis
from acute bacterial meningitis using simple clinical and laboratory parameters. Diagn
Microbiol Infect Dis 2006; 55(4): 275-8.
14. Cohen DB, Zijlstra EE, Mukaka M, et al. Diagnosis of cryptococcal and
tuberculous meningitis in a resource-limited African setting. Trop Med Int Health 2010;
15(8): 910-7.
15. Patel VB, Singh R, Connolly C, et al. Comparison of a clinical prediction rule and
a LAM antigen-detection assay for the rapid diagnosis of TBM in a high HIV prevalence
setting. PLoS One 2010; 5(12): e15664.
16. Hristea A, Olaru ID, Baicus C, Moroti R, Arama V, Ion M. Clinical prediction
rule for differentiating tuberculous from viral meningitis. Int J Tuberc Lung Dis 2012;
16(6): 793-8.
17. Vibha D, Bhatia R, Prasad K, et al. Validation of diagnostic algorithm to
differentiate between tuberculous meningitis and acute bacterial meningitis. Clin Neurol
Neurosurg 2012; 114(6): 639-44.

67
18. Dendane T, Madani N, Zekraoui A, et al. A simple diagnostic aid for tuberculous
meningitis in adults in Morocco by use of clinical and laboratory features. Int J Infect Dis
2013; 17(6): e461-5.
19. Zhang B, Lv K, Bao J, Lu C, Lu Z. Clinical and laboratory factors in the
differential diagnosis of tuberculous and cryptococcal meningitis in adult HIV-negative
patients. Intern Med 2013; 52(14): 1573-8.
20. Qamar FN, Rahman AJ, Iqbal S, Humayun K. Comparison of clinical and CSF
profiles in children with tuberculous and pyogenic meningitis; role of CSF protein:
glucose ratio as diagnostic marker of tuberculous meningitis. J Pak Med Assoc 2013;
63(2): 206-10.
21. Sunbul M, Atilla A, Esen S, Eroglu C, Leblebicioglu H. Thwaites' diagnostic
scoring and the prediction of tuberculous meningitis. Med Princ Pract 2005; 14(3): 151-
4.
22. Zhang YL, Lin S, Shao LY, Zhang WH, Weng XH. Validation of thwaites'
diagnostic scoring system for the differential diagnosis of tuberculous meningitis and
bacterial meningitis. Jpn J Infect Dis 2014; 67(6): 428-31.
23. Saavedra JS, Urrego S, Toro ME, et al. Validation of Thwaites Index for
diagnosing tuberculous meningitis in a Colombian population. J Neurol Sci 2016; 370:
112-8.
24. Checkley AM, Njalale Y, Scarborough M, Zjilstra EE. Sensitivity and specificity
of an index for the diagnosis of TB meningitis in patients in an urban teaching hospital in
Malawi. Trop Med Int Health 2008; 13(8): 1042-6.
25. Riley RD, Ensor J, Snell KI, et al. External validation of clinical prediction
models using big datasets from e-health records or IPD meta-analysis: opportunities and
challenges. BMJ 2016; 353: i3140.
26. World Health Organization. Global tuberculosis report 2019. 2019.
27. Thao LTP, Heemskerk AD, Geskus RB, et al. Prognostic Models for 9-Month
Mortality in Tuberculous Meningitis. Clin Infect Dis 2018; 66(4): 523-32.
28. Chiang SS, Khan FA, Milstein MB, et al. Treatment outcomes of childhood
tuberculous meningitis: a systematic review and meta-analysis. Lancet Infect Dis 2014;
14(10): 947-57.
29. Wen L, Li M, Xu T, Yu X, Wang L, Li K. Clinical features, outcomes and
prognostic factors of tuberculous meningitis in adults worldwide: systematic review and
meta-analysis. J Neurol 2019; 266(12): 3009-21.
30. Wang MG, Luo L, Zhang Y, Liu X, Liu L, He JQ. Treatment outcomes of
tuberculous meningitis in adults: a systematic review and meta-analysis. BMC Pulm Med
2019; 19(1): 200.
31. Heemskerk AD, Bang ND, Mai NT, et al. Intensified Antituberculosis Therapy in
Adults with Tuberculous Meningitis. N Engl J Med 2016; 374(2): 124-34.
32. Woldeamanuel YW, Girma B. A 43-year systematic review and meta-analysis:
case-fatality and risk of death among adults with tuberculous meningitis in Africa. J
Neurol 2014; 261(5): 851-65.
33. van Laarhoven A, Dian S, Ruesen C, et al. Clinical Parameters, Routine
Inflammatory Markers, and LTA4H Genotype as Predictors of Mortality Among 608
Patients With Tuberculous Meningitis in Indonesia. J Infect Dis 2017; 215(7): 1029-39.

68
34. Thwaites GE, Nguyen DB, Nguyen HD, et al. Dexamethasone for the treatment of
tuberculous meningitis in adolescents and adults. N Engl J Med 2004; 351(17): 1741-51.
35. Moher D, Shamseer L, Clarke M, et al. Preferred reporting items for systematic
review and meta-analysis protocols (PRISMA-P) 2015 statement. Syst Rev 2015; 4: 1.
36. Freeman MF, Tukey JW. Transformations Related to the Angular and the Square
Root. Ann Math Stat 1950; 21(2): 305-.
37. Nyaga VN, Arbyn M, Aerts M. Metaprop: a Stata command to perform meta-
analysis of binomial data. Arch Public Health 2014; 72(1): 39.
38. DerSimonian R, Laird N. Meta-analysis in clinical trials. Control Clin Trials
1986; 7(3): 177-88.
39. Harris RJ, Bradburn MJ, Deeks JJ, Harbord RM, Altman DG, Sterne JAC. metan:
fixed- and random-effects meta-analysis. Stata J 2008; 8(1): 3-28.
40. Downs SH, Black N. The feasibility of creating a checklist for the assessment of
the methodological quality both of randomised and non-randomised studies of health care
interventions. J Epidemiol Community Health 1998; 52(6): 377-84.
41. Luma HN, Tchaleu BC, Ngahane BH, et al. Tuberculous meningitis: presentation,
diagnosis and outcome in hiv-infected patients at the douala general hospital, cameroon:
a cross sectional study. Aids Res Ther 2013; 10(1): 16.
42. Marais S, Pepper DJ, Schutz C, Wilkinson RJ, Meintjes G. Presentation and
outcome of tuberculous meningitis in a high HIV prevalence setting. PLoS One 2011;
6(5): e20077.
43. Thinyane KH, Motsemme KM, Cooper VJ. Clinical Presentation, Aetiology, and
Outcomes of Meningitis in a Setting of High HIV and TB Prevalence. J Trop Med 2015;
2015: 423161.
44. Cresswell FV, Bangdiwala AS, Bahr NC, et al. Can improved diagnostics reduce
mortality from Tuberculous meningitis? Findings from a 6.5-year cohort in Uganda.
Wellcome Open Res 2018; 3: 64.
45. Raberahona M, Rakotoarivelo RA, Razafinambinintsoa T, Andrianasolo RL,
Randria MJ. Clinical Features and Outcome in Adult Cases of Tuberculous Meningitis in
Tertiary Care Hospital in Antananarivo, Madagascar. Biomed Res Int 2017; 2017:
9316589.
46. Gonzalez-Duarte A, Ponce de Leon A, Osornio JS. Importance of differentiating
Mycobaterium bovis in tuberculous meningitis. Neurol Int 2011; 3(3): e9.
47. Alarcon F, Moreira J, Rivera J, Salinas R, Duenas G, Van den Ende J.
Tuberculous meningitis: do modern diagnostic tools offer better prognosis prediction?
Indian J Tuberc 2013; 60(1): 5-14.
48. Torok ME, Chau TT, Mai PP, et al. Clinical and microbiological features of HIV-
associated tuberculous meningitis in Vietnamese adults. PLoS One 2008; 3(3): e1772.
49. Torok ME, Yen NT, Chau TT, et al. Timing of initiation of antiretroviral therapy
in human immunodeficiency virus (HIV)--associated tuberculous meningitis. Clin Infect
Dis 2011; 52(11): 1374-83.
50. Thwaites GE, Chau TT, Caws M, et al. Isoniazid resistance, mycobacterial
genotype and outcome in Vietnamese adults with tuberculous meningitis. Int J Tuberc
Lung Dis 2002; 6(10): 865-71.
51. Thwaites GE, Caws M, Chau TT, et al. Comparison of conventional bacteriology
with nucleic acid amplification (amplified mycobacterium direct test) for diagnosis of

69
tuberculous meningitis before and after inception of antituberculosis chemotherapy. J
Clin Microbiol 2004; 42(3): 996-1002.
52. Singh AK, Malhotra HS, Garg RK, et al. Paradoxical reaction in tuberculous
meningitis: presentation, predictors and impact on prognosis. BMC Infect Dis 2016; 16:
306.
53. Tai MS, Sharma VK. Role of Transcranial Doppler in the Evaluation of
Vasculopathy in Tuberculous Meningitis. PLoS One 2016; 11(10): e0164266.
54. Chen CH, Chang YJ, Sy HN, Chen WL, Yen HC. Risk assessment of the outcome
for cerebral infarction in tuberculous meningitis. Rev Neurol (Paris) 2014; 170(8-9): 512-
9.
55. Kalita J, Misra UK, Prasad S, Bhoi SK. Safety and efficacy of levofloxacin versus
rifampicin in tuberculous meningitis: an open-label randomized controlled trial. J
Antimicrob Chemother 2014; 69(8): 2246-51.
56. Sheu JJ, Hsu CY, Yuan RY, Yang CC. Clinical characteristics and treatment
delay of cerebral infarction in tuberculous meningitis. Intern Med J 2012; 42(3): 294-300.
57. Wasay M, Farooq S, Khowaja ZA, et al. Cerebral infarction and tuberculoma in
central nervous system tuberculosis: frequency and prognostic implications. J Neurol
Neurosurg Psychiatry 2014; 85(11): 1260-4.
58. Chotmongkol V, Jitpimolmard S, Thavornpitak Y. Corticosteroid in tuberculous
meningitis. J Med Assoc Thai 1996; 79(2): 83-90.
59. Lu CH, Chang WN, Chang HW. The prognostic factors of adult tuberculous
meningitis. Infection 2001; 29(6): 299-304.
60. Wang JT, Hung CC, Sheng WH, Wang JY, Chang SC, Luh KT. Prognosis of
tuberculous meningitis in adults in the era of modern antituberculous chemotherapy. J
Microbiol Immunol Infect 2002; 35(4): 215-22.
61. Chotmongkol V, Panthavasit J, Tiamkao S, Jitpimolmard S. Tuberculous
meningitis in adults: a four-year review during 1997-2000. Southeast Asian J Trop Med
Public Health 2003; 34(4): 869-71.
62. Thwaites GE, Simmons CP, Than Ha Quyen N, et al. Pathophysiology and
prognosis in vietnamese adults with tuberculous meningitis. J Infect Dis 2003; 188(8):
1105-15.
63. Malhotra HS, Garg RK, Singh MK, Agarwal A, Verma R. Corticosteroids
(dexamethasone versus intravenous methylprednisolone) in patients with tuberculous
meningitis. Ann Trop Med Parasitol 2009; 103(7): 625-34.
64. Hsu PC, Yang CC, Ye JJ, Huang PY, Chiang PC, Lee MH. Prognostic factors of
tuberculous meningitis in adults: a 6-year retrospective study at a tertiary hospital in
northern Taiwan. J Microbiol Immunol Infect 2010; 43(2): 111-8.
65. Sharma SR, Lynrah KG, Sharma N, Lyngdoh M. Directly observed treatment,
short course in tuberculous meningitis: Indian perspective. Ann Indian Acad Neurol 2013;
16(1): 82-4.
66. Sun F, Ruan Q, Wang J, et al. Linezolid manifests a rapid and dramatic
therapeutic effect for patients with life-threatening tuberculous meningitis. Antimicrob
Agents Chemother 2014; 58(10): 6297-301.
67. Kalita J, Prasad S, Misra UK. Predictors of paradoxical tuberculoma in
tuberculous meningitis. Int J Tuberc Lung Dis 2014; 18(4): 486-91.

70
68. Imam YZ, Ahmedullah HS, Akhtar N, et al. Adult tuberculous meningitis in
Qatar: a descriptive retrospective study from its referral center. Eur Neurol 2015; 73(1-
2): 90-7.
69. Zhang J, Hu X, Hu X, et al. Clinical features, Outcomes and Molecular Profiles of
Drug Resistance in Tuberculous Meningitis in non-HIV Patients. Sci Rep 2016; 6: 19072.
70. Kalita J, Bhoi SK, Betai S, Misra UK. Safety and efficacy of additional
levofloxacin in tuberculous meningitis: A randomized controlled pilot study.
Tuberculosis (Edinb) 2016; 98: 1-6.
71. Li K, Tang H, Yang Y, et al. Clinical features, long-term clinical outcomes, and
prognostic factors of tuberculous meningitis in West China: a multivariate analysis of 154
adults. Expert Rev Anti Infect Ther 2017; 15(6): 629-35.
72. Mai NT, Dobbs N, Phu NH, et al. A randomised double blind placebo controlled
phase 2 trial of adjunctive aspirin for tuberculous meningitis in HIV-uninfected adults.
Elife 2018; 7.
73. Cagatay AA, Ozsut H, Gulec L, et al. Tuberculous meningitis in adults--
experience from Turkey. Int J Clin Pract 2004; 58(5): 469-73.
74. Doganay M, Calangu S, Turgut H, Bakir M, Aygen B. Treatment of tuberculous
meningitis in Turkey. Scand J Infect Dis 1995; 27(2): 135-8.
75. Sutlas PN, Unal A, Forta H, Senol S, Kirbas D. Tuberculous meningitis in adults:
review of 61 cases. Infection 2003; 31(6): 387-91.
76. Sengoz G, Yasar KK, Yildirim F. Evaluation of 121 adult cases of tuberculous
meningitis. Neurosciences (Riyadh) 2008; 13(4): 402-7.
77. Miftode EG, Dorneanu OS, Leca DA, et al. Tuberculous Meningitis in Children
and Adults: A 10-Year Retrospective Comparative Analysis. PLoS One 2015; 10(7):
e0133477.
78. Prasad K, Singh MB, Ryan H. Corticosteroids for managing tuberculous
meningitis. Cochrane Database Syst Rev 2016; 4: CD002244.
79. Thuong NTT, Heemskerk D, Tram TTB, et al. Leukotriene A4 Hydrolase
Genotype and HIV Infection Influence Intracerebral Inflammation and Survival From
Tuberculous Meningitis. J Infect Dis 2017; 215(7): 1020-8.
80. Marais BJ, Heemskerk AD, Marais SS, et al. Standardized Methods for Enhanced
Quality and Comparability of Tuberculous Meningitis Studies. Clin Infect Dis 2017;
64(4): 501-9.
81. Wilkinson RJ, Rohlwink U, Misra U.K., van Crevel R, Mai N.T.T., Dooley K.E.
et al. . Tuberculous Meningitis. Nature Reviews: Neurology 2017.
82. Tu JV. Advantages and disadvantages of using artificial neural networks versus
logistic regression for predicting medical outcomes. Journal of Clinical Epidemiology
1996; 49(11): 1225-31.
83. Harrell FE, Lee KL, Mark DB. Multivariable prognostic models: Issues in
developing models, evaluating assumptions and adequacy, and measuring and reducing
errors. Statistics in Medicine 1996; 15(4): 361-87.
84. Derksen S, Keselman HJ. Backward, Forward and Stepwise Automated Subset-
Selection Algorithms - Frequency of Obtaining Authentic and Noise Variables. Brit J
Math Stat Psy 1992; 45: 265-82.
85. Riley RD, Lambert PC, Abo-Zaid G. Meta-analysis of individual participant data:
rationale, conduct, and reporting. BMJ 2010; 340.

71
86. Ahmed I, Debray TP, Moons KG, Riley RD. Developing and validating risk
prediction models in an individual participant data meta-analysis. BMC Med Res
Methodol 2014; 14: 3.
87. Debray TP, Moons KG, Ahmed I, Koffijberg H, Riley RD. A framework for
developing, implementing, and evaluating clinical prediction models in an individual
participant data meta-analysis. Stat Med 2013; 32(18): 3158-80.
88. Jolani S, Debray TP, Koffijberg H, van Buuren S, Moons KG. Imputation of
systematically missing predictors in an individual participant data meta-analysis: a
generalized approach using MICE. Stat Med 2015; 34(11): 1841-63.
89. Collins GS, Reitsma JB, Altman DG, Moons KG. Transparent Reporting of a
multivariable prediction model for Individual Prognosis Or Diagnosis (TRIPOD). Ann
Intern Med 2015; 162(10): 735-6.
90. Stewart LA, Clarke M, Rovers M, et al. Preferred Reporting Items for Systematic
Review and Meta-Analyses of individual participant data: the PRISMA-IPD Statement.
JAMA 2015; 313(16): 1657-65.
91. Whiting PF, Rutjes AW, Westwood ME, et al. QUADAS-2: a revised tool for the
quality assessment of diagnostic accuracy studies. Ann Intern Med 2011; 155(8): 529-36.
92. Madley-Dowd P, Hughes R, Tilling K, Heron J. The proportion of missing data
should not be used to guide decisions on multiple imputation. J Clin Epidemiol 2019;
110: 63-73.
93. Steyerberg EW, SpringerLink (Online service). Clinical prediction models : a
practical approach to development, validation, and updating. New York: Springer; 2009.
94. Brier GW. Verification of Forecasts Expressed in terms of probability. 1950.
95. Anselmo LMP, Feliciano C, Mauad F, et al. A predictive score followed by
nucleic acid amplification for adult tuberculous meningitis diagnosis in Southern Brazil. J
Neurol Sci 2017; 379: 253-8.
96. Gualberto FAS, Goncalves MG, Fukasawa LO, et al. Performance of nested RT-
PCR on CSF for tuberculous meningitis diagnosis in HIV-infected patients. Int J Tuberc
Lung Dis 2017; 21(10): 1139-44.
97. Azevedo RG, Dinallo FS, de Laurentis LS, Boulware DR, Vidal JE. Xpert
MTB/RIF((R)) assay for the diagnosis of HIV-related tuberculous meningitis in Sao
Paulo, Brazil. Int J Tuberc Lung Dis 2018; 22(6): 706-7.
98. de Almeida SM, Borges CM, Santana LB, et al. Validation of Mycobacterium
tuberculosis real-time polymerase chain reaction for diagnosis of tuberculous meningitis
using cerebrospinal fluid samples: a pilot study. Clin Chem Lab Med 2019; 57(4): 556-
64.
99. Nhu NT, Heemskerk D, Thu do DA, et al. Evaluation of GeneXpert MTB/RIF for
diagnosis of tuberculous meningitis. J Clin Microbiol 2014; 52(1): 226-33.
100. Heemskerk AD, Donovan J, Thu DDA, et al. Improving the microbiological
diagnosis of tuberculous meningitis: A prospective, international, multicentre comparison
of conventional and modified Ziehl-Neelsen stain, GeneXpert, and culture of
cerebrospinal fluid. J Infect 2018; 77(6): 509-15.
101. Donovan J, Thu DDA, Phu NH, et al. Xpert MTB/RIF Ultra versus Xpert
MTB/RIF for the diagnosis of tuberculous meningitis: a prospective, randomised,
diagnostic accuracy study. Lancet Infect Dis 2020; 20(3): 299-307.

72
102. Botha H, Ackerman C, Candy S, Carr JA, Griffith-Richards S, Bateman KJ.
Reliability and diagnostic performance of CT imaging criteria in the diagnosis of
tuberculous meningitis. PLoS One 2012; 7(6): e38982.
103. Boulware DR, Meya DB. Antiretroviral therapy after cryptococcal meningitis.
New England Journal of Medicine 2014; 371(12): 1166-7.
104. Rhein J, Huppler Hullsiek K, Tugume L, et al. Adjunctive sertraline for HIV-
associated cryptococcal meningitis: a randomised, placebo-controlled, double-blind phase
3 trial. Lancet Infect Dis 2019; 19(8): 843-51.
105. Mitchell HK, Mokomane M, Leeme T, et al. Causes of Pediatric Meningitis in
Botswana: Results From a 16-Year National Meningitis Audit. Pediatr Infect Dis J 2019;
38(9): 906-11.
106. Metcalf T, Soria J, Montano SM, et al. Evaluation of the GeneXpert MTB/RIF in
patients with presumptive tuberculous meningitis. PLoS One 2018; 13(6): e0198695.
107. Jipa R, Olaru ID, Manea E, Merisor S, Hristea A. Rapid Clinical Score for the
Diagnosis of Tuberculous Meningitis: A Retrospective Cohort Study. Ann Indian Acad
Neurol 2017; 20(4): 363-6.
108. Christodoulou E, Ma J, Collins GS, Steyerberg EW, Verbakel JY, Van Calster B.
A systematic review shows no performance benefit of machine learning over logistic
regression for clinical prediction models. J Clin Epidemiol 2019; 110: 12-22.
109. Steyerberg EW, Bleeker SE, Moll HA, Grobbee DE, Moons KG. Internal and
external validation of predictive models: a simulation study of bias and precision in small
samples. J Clin Epidemiol 2003; 56(5): 441-7.
110. Kim JH. Estimating classification error rate: Repeated cross-validation, repeated
hold-out and bootstrap. Computational Statistics & Data Analysis 2009; 53(11): 3735-45.
111. Torok ME, Nghia HD, Chau TT, et al. Validation of a diagnostic algorithm for
adult tuberculous meningitis. Am J Trop Med Hyg 2007; 77(3): 555-9.
112. Solomons RS, Visser DH, Marais BJ, Schoeman JF, van Furth AM. Diagnostic
accuracy of a uniform research case definition for TBM in children: a prospective study.
Int J Tuberc Lung Dis 2016; 20(7): 903-8.
113. Steyerberg EW, Vedder MM, Leening MJ, et al. Graphical assessment of
incremental value of novel markers in prediction models: From statistical to decision
analytical perspectives. Biom J 2015; 57(4): 556-70.

73
APPENDICES
Appendix A: Manuscript 1 Search Strategy # Database Search term Results
1 Medline "TUBERCULOSIS, MENINGEAL"/ 6850
2 Medline ((TB OR tubercul*) ADJ2 mening*).ti,ab 6694
3 Medline ((TB OR tubercul*) ADJ2 (brain OR cerebral OR
neurological)).ti,ab
929
4 Medline (1 OR 2 OR 3) 9169
5 Medline exp MORTALITY/ 343596
6 Medline exp "TREATMENT OUTCOME"/ 876952
7 Medline exp "OUTCOME AND PROCESS ASSESSMENT
(HEALTH CARE)"/
968126
8 Medline exp "SURVIVAL ANALYSIS"/ 257144
9 Medline "TUBERCULOSIS, MENINGEAL"/mo 192
10 Medline "TUBERCULOSIS, MENINGEAL"/co 1175
11 Medline (sequalae OR sequelae OR complication* OR outcome* OR
death* OR mortality OR survival).ti,ab
3381437
12 Medline (5 OR 6 OR 7 OR 8 OR 9 OR 10 OR 11) 3965816
13 Medline (4 AND 12) 2762
14 Medline exp ADULT/ 6572439
15 Medline (adult* OR age OR aged).ti,ab 3017488
16 Medline (14 OR 15) 7975296
17 Medline (13 AND 16) 1593
18 EMBASE "TUBERCULOUS MENINGITIS"/ 6409
19 EMBASE ((TB OR tubercul*) ADJ2 mening*).ti,ab 5995
20 EMBASE ((TB OR tubercul*) ADJ2 (brain OR cerebral OR
neurological)).ti,ab
831
21 EMBASE (18 OR 19 OR 20) 8847
22 EMBASE exp *MORTALITY/ 129762
23 EMBASE exp *"TREATMENT OUTCOME"/ 69616
24 EMBASE exp *SURVIVAL/ 89772
25 EMBASE *FATALITY/ 4759
26 EMBASE exp *COMPLICATION/ 237190
27 EMBASE *"ADVERSE OUTCOME"/ 4524
28 EMBASE (sequalae OR sequelae OR complication* OR outcome* OR
death* OR mortality OR survival).ti,ab
4751087
29 EMBASE (22 OR 23 OR 24 OR 25 OR 26 OR 27 OR 28) 4928804
30 EMBASE (21 AND 29) 2534
31 EMBASE exp *ADULT/ 97301
32 EMBASE (adult* OR age OR aged).ti,ab 4369238
33 EMBASE (31 OR 32) 4393218
34 EMBASE (30 AND 33) 969

74
Appendix B: Tuberculous Meningitis Mortality by Steroid Use

75
Appendix C: Manuscript 2 Search Strategy
#1 Search tuberculosis meningitis Field: Title/Abstract
#2 Search “tuberculosis, meningeal”[MeSH ]
#3 Search cerebral tuberculosis Field: Title/Abstract
#4 Search “brain tuberculosis” Field: Title/Abstract
#5 Search TBM Field: Title/Abstract
#6 Search ((((tuberculosis meningitis) OR “tuberculosis, meningeal”[MeSH Terms])
OR “cerebral tuberculosis“) OR “brain tuberculosis”) OR TBM
#7 Search “Diagnosis”[Majr]
#8 Search diagnosis or diagnostic Field: Title/Abstract
#9 Search “clinical scores” or “clinical scoring” Field: Title/Abstract
#10 Search “Research Design”[Mesh]
#11 Search predictor* or predictive Filters: Field: Title/Abstract
#12 Search “clinical predict*” Field: Title/Abstract
#13 Search “clinical feature*” Field: Title/Abstract
#14 Search (((#13 OR ((#12) OR ((#11) OR ((#10) OR ((#9) OR #8 OR #7 Filters:
Humans
#15 Search #14 AND #6 Filters: Humans

76
Appendix D: QUADAS-2

77
Appendix E: Logistic Regression Coefficients with Average Intercept
Covariate Odds Ratio (95% CI) p-value
Intercept 0.53 (0.38-0.75) <0.001
CSF WBC count, 100/mm3 0.92 (0.91-0.94) <0.001
Neutrophilic Dominance 4.55 (3.37-6.14) <0.001
Lymphocytic Dominance 4.74 (3.74-6.01) <0.001
CSF Glucose, 10 mg/dL 0.67 (0.64-0.71) <0.001
Blood Glucose, 10 mg/dL 1.06 (1.04-1.09) <0.001
CSF CrAg Positive 0.03 (0.02-0.05) <0.001
Fever 1.06 (1.34-1.92) <0.001
HIV-positive 1.14 (0.94-1.37) 0.176

78
Appendix F: Variable Importance in Random Forest Model
Covariate Variable Importance*
CSF Glucose, mg/dL 367.27
CSF WBC count, cells/mm3 310.12
CSF Protein, mg/dL 230.48
Blood Glucose, 10 mg/dL 153.98
CSF CrAg Positive 99.20
Brazil 35.25
CSF Lymphocytic Dominance 32.71
HIV-Positive 31.29
Vietnam 26.64
Fever 24.94
CSF Neutrophilic Dominance 22.46
Morocco 18.39
Indonesia 17.33
High TB Burden Country 15.83
Uganda 12.86
Romania 9.41
Botswana 9.18
Peru 5.68
South Africa 5.48 *Mean Decrease in Gini