development and validation of a melanoma risk score based ......1 development and validation of a...
TRANSCRIPT

1
Development and validation of a melanoma risk score based on pooled data
from 16 case-control studies
John R Davies1, Yu-mei Chang1, D Timothy Bishop1, Bruce K Armstrong2, Veronique Bataille3,4, Wilma Bergman5, Marianne Berwick6, Paige M Bracci7 J Mark Elwood8, Marc S Ernstoff9*, Adele Green10, Nelleke A Gruis5, Elizabeth A Holly7, Christian Ingvar11, Peter A Kanetsky12, Margaret R Karagas13, Tim K Lee14, Loïc Le Marchand15, Rona M Mackie16, Håkan Olsson17, Anne Østerlind18, Timothy R Rebbeck19, Kristian Reich20, Peter Sasieni21, Victor Siskind10, Anthony J Swerdlow22,23, Linda Titus13, Michael S Zens13, Andreas Ziegler24,25 Richard P. Gallagher14, Jennifer H Barrett1, Julia Newton-Bishop1. 1. Section of Epidemiology and Biostatistics, Leeds Institute of Cancer and Pathology, University of Leeds, Leeds, United Kingdom 2. Sax Institute and Sydney School of Public Health, The University of Sydney, Sydney, Australia 3. Twin Research and Genetic Epidemiology Unit, St Thomas' Campus, Kings College London, London, United Kingdom 4. Dermatology Department, West Herts NHS Trust, Hemel Hempstead General Hospital, Herts, United Kingdom 5. Department of Dermatology, Leiden University Medical Centre, Leiden, the Netherlands
on May 10, 2020. © 2015 American Association for Cancer Research. cebp.aacrjournals.org Downloaded from
Author manuscripts have been peer reviewed and accepted for publication but have not yet been edited. Author Manuscript Published OnlineFirst on February 24, 2015; DOI: 10.1158/1055-9965.EPI-14-1062

2
6. Department of Internal Medicine, University of New Mexico, Albuquerque, NM, USA 7. Department of Epidemiology and Biostatistics, University of California San Francisco, San Francisco, CA, USA 8. Department of Epidemiology and Biostatistics, School of Population Health, University of Auckland, Auckland, New Zealand 9. Department of Medicine, Geisel School of Medicine and the Norris Cotton Cancer Center, Dartmouth University, Lebanon, NH, USA 10. Queensland Institute of Medical Research, PO Royal Brisbane Hospital, Brisbane, Australia 11. Department of Surgery, University Hospital, Lund, Sweden 12. Department of Cancer Epidemiology, H. Lee Moffitt Cancer Center & Research Institute, Tampa, FL, USA 13. Department of Community and Family Medicine, Geisel School of Medicine at Dartmouth, Norris Cotton Cancer Center, Lebanon, NH, USA 14. B.C. Cancer Research Centre, Vancouver, British Columbia, Canada 15. University of Hawaii Cancer Center, Honolulu, HI 16. Department of Public Health and Health Policy, University of Glasgow, United Kingdom 17. Department of Oncology, University Hospital, Lund, Sweden 18. Dermatologist, Kobenhaausevej 35, DK 3400 Hillerød, Denmark
on May 10, 2020. © 2015 American Association for Cancer Research. cebp.aacrjournals.org Downloaded from
Author manuscripts have been peer reviewed and accepted for publication but have not yet been edited. Author Manuscript Published OnlineFirst on February 24, 2015; DOI: 10.1158/1055-9965.EPI-14-1062

3
19. Department of Biostatistics and Epidemiology and Center for Clinical Epidemiology and Biostatistics, University of Pennsylvania, Philadelphia, PA, USA 20. Dermatologikum Hamburg, Stephansplatz 5, 20354 Hamburg, Germany 21. Wolfson Institute of Preventive Medicine, Barts & The London School of Medicine, London, United Kingdom 22. Division of Genetics and Epidemiology, Institute of Cancer Research, London, United Kingdom 23. Division of Breast Cancer Research, Institute of Cancer Research, London, United Kingdom 24. Institute of Medical Biometry and Statistics, University of Lübeck, University Hospital Schleswig-Holstein, Campus Lübeck, Ratzeburger Allee 160, 23562 Lübeck, Germany 25. Center for Clinical Trials, University of Lübeck, Ratzeburger Allee 160, 23562 Lübeck, Germany. *Current address Marc S. Ernstoff, MD Taussig Cancer Institute R-35 Cleveland Clinic Foundation 9500 Euclid Ave Cleveland, OH 44195 Running title: Development and validation of a melanoma risk score on May 10, 2020. © 2015 American Association for Cancer Research. cebp.aacrjournals.org Downloaded from
Author manuscripts have been peer reviewed and accepted for publication but have not yet been edited. Author Manuscript Published OnlineFirst on February 24, 2015; DOI: 10.1158/1055-9965.EPI-14-1062

4
Keywords: Melanoma, risk, imputation, pooled analysis Financial support: European Commission, 6th Framework Programme (LSHC-CT-2006-018702) to J. A Newton-Bishop, J. H. Barrett, D.T.Bishop; Cancer Research UK (C588/A4994, C569/A5030) to J. A Newton-Bishop, J. H. Barrett, D.T.Bishop; National Cancer Institute (RO1-CA52345 to E.A.Holly., P0-1 CA42101 to M.Berwick., RO1-CA66032 to L.Titus.); National Institutes of Health (R01-CA92428 to P.A.Kanetsky.); University of Sydney Medical Foundation Program Grant (to B.Armstrong.). Contact details: Dr John Richard Davies Research Fellow Section of Epidemiology and Biostatistics, Leeds Institute of Cancer and Pathology, Cancer Genetics Building, St James’s Hospital, Beckett Street, Leeds LS9 7TF, UK Tel +44 113 2066970 Fax +44 113 2340183 e-mail; [email protected] Requests for reprint should be directed to the corresponding author. Conflicts of interest: none Word count: 3984 Total number of figures and tables: 5
on May 10, 2020. © 2015 American Association for Cancer Research. cebp.aacrjournals.org Downloaded from
Author manuscripts have been peer reviewed and accepted for publication but have not yet been edited. Author Manuscript Published OnlineFirst on February 24, 2015; DOI: 10.1158/1055-9965.EPI-14-1062

5
Abstract Background We report the development of a cutaneous melanoma risk algorithm based upon 7 factors; hair colour, skin type, family history, freckling, nevus count, number of large nevi and history of sunburn, intended to form the basis of a self-assessment webtool for the general public. Methods Predicted odds of melanoma were estimated by analysing a pooled dataset from 16 case-control studies using logistic random coefficients models. Risk categories were defined based on the distribution of the predicted odds in the controls from these studies. Imputation was used to estimate missing data in the pooled datasets. The 30th, 60th and 90th centiles were used to distribute individuals into four risk groups for their age, sex and geographic location. Cross-validation was used to test the robustness of the thresholds for each group by leaving out each study one by one. Performance of the model was assessed in an independent UK case-control study dataset. Results Cross-validation confirmed the robustness of the threshold estimates. Cases and controls were well discriminated in the independent dataset (area under the curve 0.75, 95% CI 0.73-0.78). 29% of cases were in the highest risk group compared with on May 10, 2020. © 2015 American Association for Cancer Research. cebp.aacrjournals.org Downloaded from
Author manuscripts have been peer reviewed and accepted for publication but have not yet been edited. Author Manuscript Published OnlineFirst on February 24, 2015; DOI: 10.1158/1055-9965.EPI-14-1062

6
7% of controls, and 43% of controls were in the lowest risk group compared with 13% of cases. Conclusion We have identified a composite score representing an estimate of relative risk and successfully validated this score in an independent dataset. Impact This score may be a useful tool to inform members of the public about their melanoma risk.
on May 10, 2020. © 2015 American Association for Cancer Research. cebp.aacrjournals.org Downloaded from
Author manuscripts have been peer reviewed and accepted for publication but have not yet been edited. Author Manuscript Published OnlineFirst on February 24, 2015; DOI: 10.1158/1055-9965.EPI-14-1062

7
Introduction
Cutaneous melanoma continues to increase in incidence in white populations, especially in Europe (1) . There is evidence of stabilization in incidence rates in some countries within Europe (in Lithuania, Estonia, Slovakia, Ireland and Scotland) and notably outside Europe, in Israel, Australia, New Zealand, the USA and Canada, showing a marked cohort effect (1). The large increase in incidence over the past 50 years and more recent stabilization of rates in several countries suggest that behavioural factors, probably related to sun exposure, underlie the cohort-based trends. These observations reinforce the view that change in sun-related behaviour remains a desirable aim for melanoma prevention(2). Red hair, freckling and skin reported to burn rather than tan are unequivocally associated with increased risk for melanoma in meta-analyses and pooled data analyses (3, 4). A more potent phenotypic risk factor is the presence of many melanocytic nevi and large (or clinically atypical) nevi, as confirmed by meta-analyses (5) and pooled-data analyses (6). These phenotypes are strongly genetically determined, and genes associated both with nevus phenotype and pigmentation have been shown to be associated with melanoma risk in genome-wide association studies (7). It is therefore not surprising that family history of melanoma, defined as melanoma in a first degree relative, also has been consistently identified as a risk factor (3). on May 10, 2020. © 2015 American Association for Cancer Research. cebp.aacrjournals.org Downloaded from
Author manuscripts have been peer reviewed and accepted for publication but have not yet been edited. Author Manuscript Published OnlineFirst on February 24, 2015; DOI: 10.1158/1055-9965.EPI-14-1062

8
Although these phenotypic risk factors are well described in the medical literature, it is important that the general public is able to extrapolate an understanding of their own risk from the existing published evidence. We constructed a risk tool to allow individuals to assess their lifetime risk of melanoma that will benefit both those at average as well as at increased risk relative to the underlying risk in their population, using variables that can be reliably self reported by members of the general public. The aim of this analysis was to construct this risk algorithm based on our previous pooled data analyses of melanoma case-control studies performed at different latitudes (4, 6) and then to test the algorithm in an independent UK melanoma case-control study (8, 9).
on May 10, 2020. © 2015 American Association for Cancer Research. cebp.aacrjournals.org Downloaded from
Author manuscripts have been peer reviewed and accepted for publication but have not yet been edited. Author Manuscript Published OnlineFirst on February 24, 2015; DOI: 10.1158/1055-9965.EPI-14-1062

9
Materials and Methods We carried out a pooled data analysis of melanoma case-control data sets from studies conducted in Europe (temperate climate), North America (temperate and warmer climate), Australia and Hawaii (hotter climate) in the period 1979 to 1999. Previous analyses of these data are presented in two papers on sun-exposure patterns (4) and the nevus phenotype (6) associated with risk. These two papers comprehensively described the approaches taken to pooled data analysis. Since our model is designed to underpin a risk tool for public usage, we considered only variables that were deemed self-reportable by members of the public, even though other variables had been shown to be significantly associated with risk of melanoma (e.g. solar keratoses) and our model may have had better predictive value with their inclusion. Genetic data were excluded for the same reason. A summary is provided here. Data Collection Eligible studies were identified first as those reported in a systematic meta-analysis conducted by Gandini et al. containing analyses conducted prior to 2002 (3, 5, 10). Second, studies conducted between 2002 and 2007 were identified using a MEDLINE search. Twenty-six studies met the inclusion criteria, and all authors who could be traced were invited to participate. The authors of sixteen studies participated. The pooled dataset consisted of eight studies from Europe, five from North America, one from Hawaii and two from Australia. In each of these studies, on May 10, 2020. © 2015 American Association for Cancer Research. cebp.aacrjournals.org Downloaded from
Author manuscripts have been peer reviewed and accepted for publication but have not yet been edited. Author Manuscript Published OnlineFirst on February 24, 2015; DOI: 10.1158/1055-9965.EPI-14-1062

10
data had been collected on some or all of the following variables: nevus phenotype, hair color, sunburn history, Fitzpatrick skin type, freckling, family history of melanoma and age. Data on eye colour were also collected but this variable was found to be highly correlated with hair colour and was dropped from the final model. The variables were grouped into categories where it was clear that this was appropriate (table 1). These variables were established risk factors for melanoma as described above (3, 5, 10), further details can be found in the supplementary information. Generating estimates for the effect of covariates used in the risk algorithm The pooled data were analysed using a logistic random coefficients model to account for heterogeneity between studies. Pooled odds ratios (OR) were estimated for the effect of each categorical variable on melanoma risk adjusted for the other six variables (table 1), age and sex using winBUGS (a more detailed explanation can be found in (6)). The Western Canada study (Elwood et al. 1985) (11) was omitted from the final model as there were no nevus count data available. Creating the risk score The estimated odds of disease from the above model were used to define a “risk score”, formed by multiplicatively combining the estimates in table 1. This on May 10, 2020. © 2015 American Association for Cancer Research. cebp.aacrjournals.org Downloaded from
Author manuscripts have been peer reviewed and accepted for publication but have not yet been edited. Author Manuscript Published OnlineFirst on February 24, 2015; DOI: 10.1158/1055-9965.EPI-14-1062

11
composite estimated odds ratio (OR) was considered the estimated relative risk of an individual developing melanoma compared with an individual from the same population who had the lowest possible risk (black hair, fewer nevi than half the population, had not been sunburnt, had no freckles, no large nevi, had a Fitzpatrick skin type of III or IV and had no family history of melanoma). Categorisation of risk and calculation of thresholds To provide more stable and interpretable risk estimates, we used controls from the pooled analysis as a sample of the combined population and generated an estimate of the background population distribution of the risk score. Table 2 lists each of the included studies. Some variables were not recorded in all of the studies. In addition 1.5% of all data were missing at the individual level for recorded variables. Missing data rates are described in supplementary table 1. To calculate a risk score for individuals within these studies, we used imputation as described below to fill in the missing values. Imputation of missing data using Multiple Imputation by Chained Equations (MICE) We assumed that the data could be treated as missing at random (MAR) and implemented MICE to impute missing values using the “mice” library in R 3.0.2(12). We ran the imputation analysis in 30 chains over 15 iterations. Each ‘chain’ is a separate run of the analysis, with different random assignments of the missing data on May 10, 2020. © 2015 American Association for Cancer Research. cebp.aacrjournals.org Downloaded from
Author manuscripts have been peer reviewed and accepted for publication but have not yet been edited. Author Manuscript Published OnlineFirst on February 24, 2015; DOI: 10.1158/1055-9965.EPI-14-1062

12
points, upon which the imputation is performed independently of the chains. Further details of the imputation process can be found in the supplementary methods. The composite melanoma risk score was computed for each individual in each chain and the results from each of the 30 chains were merged together into one composite dataset. We used the 30th, 60th and 90th centiles to distribute individuals into four risk groups; Low, relative to peers, Medium-Low, relative to peers, Medium-High, relative to peers and High, relative to peers. Peers are defined as individuals of the same age and sex drawn from the same population. Attributable risk We calculated attributable risk using the cases in the Leeds case-control data set by imputed missing values as described above, calculating risk scores for each individual and applying the method of Bruzzi et al. (13). Robustness of thresholds We investigated the robustness of the threshold estimates by dropping each study in turn and recalculating the 20th, 30th, 40th, 50th, 60th, 80th and 90th centiles, using MICE to impute missing values as above. Large deviation from the threshold values computed using all data with data from a particular study omitted shows that the individual study has a large influence on the algorithm. Validation in independent data taken from the Leeds case-control study on May 10, 2020. © 2015 American Association for Cancer Research. cebp.aacrjournals.org Downloaded from
Author manuscripts have been peer reviewed and accepted for publication but have not yet been edited. Author Manuscript Published OnlineFirst on February 24, 2015; DOI: 10.1158/1055-9965.EPI-14-1062

13
To test the efficacy of the risk algorithm, we investigated its performance in data collected from 960 population-ascertained incident melanoma cases and 513 controls recruited to a case-control study performed in Leeds, UK (8, 9). Further details can be found in the supplementary information. Data on the variables used to build the risk tool were extracted from questionnaires and classified in the same manner as for the pooled data described above. Composite melanoma risk scores were calculated based on the phenotypic and environmental data recorded for these cases and controls. A receiver operator curve (ROC) was constructed and the area under the curve (AUC) was estimated using the ‘pROC’ library in R (14). 95% confidence intervals were computed for the ROC curves using DeLong’s method (15). Cases and controls were also grouped into risk categories using the threshold estimates calculated from the pooled data, and a difference between the risk classification of cases and controls was tested using a chi-square test. Most users of a risk tool aimed at the public will not have access to professional assessment of mole counts and freckling. We therefore assessed how using self-reported mole counts and freckling scores affected the classification of cases in the Leeds controls. Further details of the methods used to do this can be found in the supplementary material.
on May 10, 2020. © 2015 American Association for Cancer Research. cebp.aacrjournals.org Downloaded from
Author manuscripts have been peer reviewed and accepted for publication but have not yet been edited. Author Manuscript Published OnlineFirst on February 24, 2015; DOI: 10.1158/1055-9965.EPI-14-1062

14
Results
Calculating the risk score The composite risk score based on the seven variables has a theoretical approximate range of 1 to 233 (table 1). This score is the combined odds of developing melanoma compared to the combined odds for a person in the lowest theoretical category of risk for someone of the same sex and age. In the pooled data we observed the full range of theoretical risk score (1-233, supplementary figure 1). In the Leeds melanoma data we saw a reduced range of scores (1-188, supplementary figure 2). Risk categories Thresholds for the pre-defined risk categories derived from controls in the pooled data are shown in table 3. Individuals are classified as being low risk (< 3.32), medium-low risk (3.32-8.46), medium-high risk (8.46-32.80) or high risk (≥32.80) relative to the background risk in the population. For example, a person with red hair, Fitzpatrick skin type I, freckling, but has no large nevi, a low nevus count, who has not been severely sunburnt and has no family history of melanoma in a first-degree relative would have a risk score of 4.62 (1.76x1.66x1.58 from estimates in table 1) and would be categorized as “medium-low risk, relative to peers” (using the thresholds in table 3). on May 10, 2020. © 2015 American Association for Cancer Research. cebp.aacrjournals.org Downloaded from
Author manuscripts have been peer reviewed and accepted for publication but have not yet been edited. Author Manuscript Published OnlineFirst on February 24, 2015; DOI: 10.1158/1055-9965.EPI-14-1062

15
Testing the robustness of threshold estimates using ‘leave-one-study-out’ cross-validation To test the robustness of the thresholds we removed each study in turn, performed MICE using the same settings on the remaining data, and then recalculated threshold values. Table 3 shows the results of omitting each study on the threshold values at 7 different points in the distribution. There was no evidence that omitting any of the studies caused gross distortion of the threshold values. Validation using the Leeds case-control data The risk score was computed for each individual in the Leeds case-control study as above. Initially we used only complete cases to reduce the number of assumptions made about the data. ROC curve analysis showed that the raw composite score was capable of distinguishing cases from controls reasonably well (AUC=0.75, 95% CI 0.73-0.78 , figure 1). Cases and controls were also classified into four risk groups using the threshold values generated using the 30th, 60th and 90th centile values of the controls from the pooled data analysis. The proportion of cases and controls that fall into each of the four risk groups is shown in table 4. Cases and controls were well separated (chi-squared test: p<2.2 x10⁻¹⁶); 29% of cases are in the highest risk group compared with 7% of controls, and 43% of controls are in the lowest risk group compared with 13% of cases. However, the Leeds population had a greater on May 10, 2020. © 2015 American Association for Cancer Research. cebp.aacrjournals.org Downloaded from
Author manuscripts have been peer reviewed and accepted for publication but have not yet been edited. Author Manuscript Published OnlineFirst on February 24, 2015; DOI: 10.1158/1055-9965.EPI-14-1062

16
proportion of controls at “low risk, relative to peers” compared to pooled controls, as in the latter the controls were by definition approximately distributed in the risk groups as 30%, 30%, 30% and 10%. Finally, we imputed missing data in the Leeds cohort using MICE and repeated the above analyses. There was a small improvement in the model (AUC=0.77) but no difference in the distribution of controls (supplementary table 2). We estimated overall attributable risk from the Leeds dataset to be 87.8%. Agreement between self-reported and nurses’ counts of moles We assessed the reliability of self-reported versus nurse-assessed mole counts and freckling in the Leeds control group. Supplementary figure 3 shows a Bland-Altman plot comparing self-reported counts of moles on the back with nurse counts of the back in the Leeds controls. The mean difference between the two counts is 3 moles, and the 95% limits of agreement are wide (-23.5, 29.4). Larger discrepancies are seen for individuals as the average mole count increases; in the majority of these instances the patient has overestimated the number of moles on their back (difference > 0). Reasoning that laypersons might identify patterns of moles more accurately than individual moles, Leeds cohort participants were also asked which of four diagrams on May 10, 2020. © 2015 American Association for Cancer Research. cebp.aacrjournals.org Downloaded from
Author manuscripts have been peer reviewed and accepted for publication but have not yet been edited. Author Manuscript Published OnlineFirst on February 24, 2015; DOI: 10.1158/1055-9965.EPI-14-1062

17
best represented their mole count (supplementary figure 4). Their responses were compared to the nurse-assessed mole counts grouped using the centile thresholds implemented in the risk model (0-50%, 51-75%, 75-90%, >90%). 37% of individuals classified themselves in the same nevus score rank as the nurses (supplementary table 3) even though the measures are not equivalent. Finally, there was agreement about the presence of any freckling in 63% of controls although the two variables are still highly significantly associated (supplementary table 4, chi-squared test 3x10⁻⁵). With respect to risk classification in the pooled data, we compared how well individuals are classified when the self-reported counts or nurse counts are used (supplementary table 5) in both cases and controls. A good correlation between the two sets of measurements is seen using the self-reported counts; 97% of individuals are classified within one rank of the nurse counts, and 57% are classified in exactly the same group. However, there is a net improvement in the classification of cases into higher risk groups and controls into lower risk groups when the nurse counts are used (NRI=0.29); the majority of the improvement is due to increased classification of cases into higher risk groups (p(ranked higher | case) = 0.35). We also compared the performance of the model using self-reported measures to the nurse reported measures using ROC curve analysis. The discriminatory ability of the model is lower when self-reported mole counts are used (AUC=0.70, 95% CI 0.66-0.73), which is similar to an alternative model where mole count and freckling were omitted (AUC=0.69, 95% CI 0.66-0.73). on May 10, 2020. © 2015 American Association for Cancer Research. cebp.aacrjournals.org Downloaded from
Author manuscripts have been peer reviewed and accepted for publication but have not yet been edited. Author Manuscript Published OnlineFirst on February 24, 2015; DOI: 10.1158/1055-9965.EPI-14-1062

18
Absolute risk While we have presented our model to produce categories of risk relative to the underlying population risk for someone of a similar age and sex, with some small modifications it is possible to produce absolute risk estimates as well. Using data taken from the Cancer Research UK and UK Office for National Statistics websites (16-18), it is possible to estimate that the absolute risk for a 30-year old woman from the UK with the risk factors discussed earlier would be approximately 0.04% over the next 5 years. Further details can be found in the supplementary data.
on May 10, 2020. © 2015 American Association for Cancer Research. cebp.aacrjournals.org Downloaded from
Author manuscripts have been peer reviewed and accepted for publication but have not yet been edited. Author Manuscript Published OnlineFirst on February 24, 2015; DOI: 10.1158/1055-9965.EPI-14-1062

19
Discussion The leveling off of melanoma incidence rates in some countries, continued rise in others, and the effects of birth cohort on incidence (1) all suggest modifiable environmental exposures may affect incidence. There is strong evidence of effects of intermittent high exposure to the sun on melanoma risk (10). Therefore the need for melanoma prevention advice directed at sun protection is clear. Our study was designed to construct a risk algorithm based upon large melanoma case-control data sets to enable members of the public to estimate their own risk relative to that of others in their population. Use of this algorithm to motivate change in sun-related behavior is based on the theory that primary prevention advice is more effective when the targeted persons believe themselves to be at relatively high risk; a study of modification of the behavior of adolescents in the sun has provided empirical support for this theory(19). On the other hand, individuals who are told that they have relatively low risk may well decide that they can ignore sensible sun protection measures in the sun. Any tailored risk measurements must avoid underplaying the dangers of risky behavior in the sun for all individuals. Other melanoma risk tools have been implemented previously for public use. The tool provided by the NCI (20, 21) gives an estimate of absolute risk and focuses exclusively on one population (the United States). A recent study has similarly produced a model that predicts the absolute 5-year risk of melanoma for individuals in New Zealand but the authors recommend that external validation is performed before it is used for clinical practice(22). The online risk tool produced by the New on May 10, 2020. © 2015 American Association for Cancer Research. cebp.aacrjournals.org Downloaded from
Author manuscripts have been peer reviewed and accepted for publication but have not yet been edited. Author Manuscript Published OnlineFirst on February 24, 2015; DOI: 10.1158/1055-9965.EPI-14-1062

20
South Wales Government(23) produces no final estimate of risk but instead provides short explanations for why each question was asked to inform users of the risk factors. The Harvard School of Public Health web-tool produces an estimate of risk that is relative to peers of the same age and sex for individuals over 40 (24). Eiser et al have previously suggested that numerical information may be interpreted as more exact than it is (25, 26). The primary approach we have taken is to provide a classification of risk into categories relative to population risk, but we have also shown that our estimates can easily be used to produce an estimate of 10- or 5-year absolute risk by combining with local data. Similar classification systems to ours have been suggested in the past (27, 28). In one instance categorical groupings were used to assign rough estimates of 10-year risk(29). We propose that our algorithm, which is based on data taken from multiple case-control studies worldwide, may be applicable to more than just one population, although as yet we have only tested it on one (Leeds, UK). The distribution of controls in the Leeds study differs from that in the pooled case-control studies, and is weighted towards more controls being classified in lower risk groups. Conveying risk effectively is a difficult and complex issue (30) and beyond the scope of this paper to explore fully. In practical applications of our risk tool, ideally both risk relative to the baseline population and estimates of absolute risks would be provided. We have demonstrated that it is easy to adapt our model to output absolute risks, given appropriate local data on melanoma incidence and overall on May 10, 2020. © 2015 American Association for Cancer Research. cebp.aacrjournals.org Downloaded from
Author manuscripts have been peer reviewed and accepted for publication but have not yet been edited. Author Manuscript Published OnlineFirst on February 24, 2015; DOI: 10.1158/1055-9965.EPI-14-1062

21
mortality rates, although more sophisticated methods may be required to account for geographical variation in incidence rates in larger countries such as the USA(21). The beneficial effects of sun exposure include higher vitamin D levels, which are essential for bone health and might be important for many other aspects of health, such as prevention of cancer (31) and diseases associated with the metabolic syndrome (32) although this has not been proven. It may therefore be sub-optimal to recommend very high levels of sun protection for individuals at lower risk of melanoma, especially in temperate climates, where there is less sunshine. This project had the second aim of assisting members of the public to identify themselves as at lower risk than their peers, so that advice on sun avoidance could be better tailored to the individual. The data sets were built almost entirely from data from white-skinned individuals as they are the population most affected by melanoma. The incidence of melanoma in black and Asian populations is much lower, and likely our algorithm would not be applicable to these populations. A weakness of the study is that the risk algorithm was built and tested using case- control data. Consequently, the odds ratios that the risk score is built upon are potentially subject to the biases inherent to case-control designs, such as recall bias, selection bias, participation bias, and/or confounding. We have also made an assumption that since the odds ratio estimates for each factor used to build the risk score were derived from a multivariable joint analysis, they can be treated as independent and therefore can be combined multiplicatively. We have not on May 10, 2020. © 2015 American Association for Cancer Research. cebp.aacrjournals.org Downloaded from
Author manuscripts have been peer reviewed and accepted for publication but have not yet been edited. Author Manuscript Published OnlineFirst on February 24, 2015; DOI: 10.1158/1055-9965.EPI-14-1062

22
accounted for potential interactions between factors in this model. Interactions are notoriously difficult to show, and a model that included all potential interactions between the factors would contain too many variables to be practical. A strength of the study is that the data sets used were very large and detailed. As with all pooled data sets, the data are from disparate studies. Reassuringly, however, in the previously reported analyses the estimates of relative risk of melanoma in relation to sunburn (4) and nevus phenotype were remarkably consistent across all the studies (6). The point estimates of the odds of melanoma for an individual are highly imprecise, particularly at the extremes of the distribution. Therefore we have taken the approach of categorizing risk into broad groups. A challenging aspect of this analysis was that several variables were not recorded in all studies; this was addressed by imputation using MICE. Of particular concern is the large mole variable, which is only available for 7 of the 16 studies and is defined differently in different studies (e.g. large moles were defined by a research nurse as >8mm in Kanetsky 2001 but self-reported ≥ 5mm in LeMarchand 2006). However we did not see much perturbation in the threshold scores when each study was dropped in turn. The analyses carried out resulted in a composite score representing an estimate of relative risk for individuals compared with those with the lowest level of risk factors. The AUC in the ROC analysis was 0.75, suggesting that the measure explained a substantial proportion of the risk. Recently Vuong et al. identified 28 melanoma on May 10, 2020. © 2015 American Association for Cancer Research. cebp.aacrjournals.org Downloaded from
Author manuscripts have been peer reviewed and accepted for publication but have not yet been edited. Author Manuscript Published OnlineFirst on February 24, 2015; DOI: 10.1158/1055-9965.EPI-14-1062

23
prediction models generated from 19 studies published before April 2013, in which discrimination ranged from an AUC of 0.62 to 0.86(33) so our model is competitive in this regard. It is likely that we could have increased the AUC if we had used additional variables such as genetic factors. However, we hope ultimately to provide a tool that will be used by individuals reporting their own risk factors. Therefore, it was practical to use simple measures that can be self-reported. We generated 4 different risk groups based upon a distribution of risk estimates in the controls using the 30th, 60th and 90th centiles as cut-points. Cases and controls were well differentiated. Approximately 7% of controls in the Leeds data were found in the highest risk group compared with 29% of cases. We have shown evidence that risk prediction is more accurate when professionally measured freckling and mole count variables are used. This may be a potential weakness for developing a risk tool using this algorithm, as the results may be misleading in the presence of misclassification. Nonetheless the majority of individuals were classified in the same group irrespective of whether self-reported or professionally derived variables were used. For a risk tool aimed at the public it may be best to leave out these variables as there was evidence that models that omitted the self-reported variables lost no discriminatory power. However there was a substantial improvement in classification when professionally derived variables were used, particularly for ranking cases in higher risk groups, so ideally these variables should be incorporated in some form. We made a strong assumption on May 10, 2020. © 2015 American Association for Cancer Research. cebp.aacrjournals.org Downloaded from
Author manuscripts have been peer reviewed and accepted for publication but have not yet been edited. Author Manuscript Published OnlineFirst on February 24, 2015; DOI: 10.1158/1055-9965.EPI-14-1062

24
that the qualitative groups in the diagrams match well to the equivalent centile groups in the risk tool. However there is substantial variation in mole count distributions between populations so this assumption may well be violated. Diagrams which better matched users to the four quantile groups would presumably perform better; this argues for the need to tailor self-estimation of nevi to each individual population if diagrams are to be used. In summary we have generated an algorithm for use in white populations to predict risk of melanoma. Practical application of this algorithm to general use in the future will require several more steps including validation in other cohorts from other regions to test its generalisability. We hope to continue to refine the algorithm as additional data sets become available in low latitude and high latitude regions. Using simple measures, the algorithm can be used to help identify higher and lower risk individuals, relative to others of the same age and sex within a population, for whom the hazards of sun exposure would be different, and to produce estimates of absolute risk when combined with population-specific data. Acknowledgements The funds from NCI to E.A. Holly, PI (RO1-CA52345, RO1-CA34382, RO1-CA66032), L. Titus and M. Berwick, PI are acknowledged. The authors thank the funders of the contributing studies, who are acknowledged in the original study publications listed in the references to this paper, and other investigators for those studies, who are on May 10, 2020. © 2015 American Association for Cancer Research. cebp.aacrjournals.org Downloaded from
Author manuscripts have been peer reviewed and accepted for publication but have not yet been edited. Author Manuscript Published OnlineFirst on February 24, 2015; DOI: 10.1158/1055-9965.EPI-14-1062

25
authors of the original study publication. Dr J.N. Bouwes Bavinck is thanked for putting the melanoma database together for Leiden University Medical Center, the Netherlands. Lund Melanoma Study Group is thanked for compiling the Swedish data. Mr John Taylor is thanked for recoding the New Hampshire study for the pooled analysis. We thank also Dr M.R.K. who provided original data from the East Denmark, Scotland, East Midlands, San Francisco, Queensland and Western Australian studies, which she had compiled for pooled analysis of other variables.
on May 10, 2020. © 2015 American Association for Cancer Research. cebp.aacrjournals.org Downloaded from
Author manuscripts have been peer reviewed and accepted for publication but have not yet been edited. Author Manuscript Published OnlineFirst on February 24, 2015; DOI: 10.1158/1055-9965.EPI-14-1062

26
References 1. Erdmann F, Lortet-Tieulent J, Schuz J, Zeeb H, Greinert R, Breitbart EW, et al. International trends in the incidence of malignant melanoma 1953-2008-are recent generations at higher or lower risk? Int J Cancer. 2012. 2. Hill D, White V, Marks R, Borland R. Changes in sun-related attitudes and behaviours, and reduced sunburn prevalence in a population at high risk of melanoma. Eur J Cancer Prev. 1993;2:447-56. 3. Gandini S, Sera F, Cattaruzza MS, Pasquini P, Zanetti R, Masini C, et al. Meta-analysis of risk factors for cutaneous melanoma: III. Family history, actinic damage and phenotypic factors. Eur J Cancer. 2005;41:2040-59. 4. Chang YM, Barrett JH, Bishop DT, Armstrong BK, Bataille V, Bergman W, et al. Sun exposure and melanoma risk at different latitudes: a pooled analysis of 5700 cases and 7216 controls. Int J Epidemiol. 2009;38:814-30. 5. Gandini S, Sera F, Cattaruzza MS, Pasquini P, Abeni D, Boyle P, et al. Meta-analysis of risk factors for cutaneous melanoma: I. Common and atypical naevi. Eur J Cancer. 2005;41:28-44. 6. Chang YM, Newton-Bishop JA, Bishop DT, Armstrong BK, Bataille V, Bergman W, et al. A pooled analysis of melanocytic nevus phenotype and the risk of cutaneous melanoma at different latitudes. Int J Cancer. 2009;124:420-8. 7. Barrett JH, Iles MM, Harland M, Taylor JC, Aitken JF, Andresen PA, et al. Genome-wide association study identifies three new melanoma susceptibility loci. Nat Genet. 2011;43:1108-13. 8. Newton-Bishop JA, Chang YM, Elliott F, Chan M, Leake S, Karpavicius B, et al. Relationship between sun exposure and melanoma risk for tumours in different body sites in a large case-control study in a temperate climate. Eur J Cancer. 2011;47:732-41. 9. Newton-Bishop JA, Chang YM, Iles MM, Taylor JC, Bakker B, Chan M, et al. Melanocytic nevi, nevus genes, and melanoma risk in a large case-control study in the United Kingdom. Cancer Epidemiol Biomarkers Prev. 2010;19:2043-54. 10. Gandini S, Sera F, Cattaruzza MS, Pasquini P, Picconi O, Boyle P, et al. Meta-analysis of risk factors for cutaneous melanoma: II. Sun exposure. Eur J Cancer. 2005;41:45-60. 11. Elwood JM, Gallagher RP, Hill GB, Pearson JC. Cutaneous melanoma in relation to intermittent and constant sun exposure--the Western Canada Melanoma Study. Int J Cancer. 1985;35:427-33. 12. Buuren van S, Groothuis-Oudshoorn K. mice: Multivariate Imputation by Chained Equations in R. Journal of Statistical Software. 2011;45. 13. Bruzzi P, Green SB, Byar DP, Brinton LA, Schairer C. Estimating the population attributable risk for multiple risk factors using case-control data. Am J Epidemiol. 1985;122:904-14. 14. Robin X, Turck N, Hainard A, Tiberti N, Lisacek F, Sanchez JC, et al. pROC: an open-source package for R and S plus to analyze and compare ROC curves. BMC Bioinformatics. 2011;12. on May 10, 2020. © 2015 American Association for Cancer Research. cebp.aacrjournals.org Downloaded from
Author manuscripts have been peer reviewed and accepted for publication but have not yet been edited. Author Manuscript Published OnlineFirst on February 24, 2015; DOI: 10.1158/1055-9965.EPI-14-1062

27
15. DeLong ER, DeLong DM, Clarke-Pearson DL. Comparing the areas under two or more correlated receiver operating characteristic curves: a nonparametric approach. Biometrics. 1988;44:837-45. 16. Cancer Research UK. Skin cancer incidence statistics. 2014 22/04/2014 [cited 2014 8/12/2014]; Available from: http://www.cancerresearchuk.org/cancer-info/cancerstats/types/skin/incidence/uk-skin-cancer-incidence-statistics 17. Office for National Statistics. Death Registrations Summary Tables, England and Wales, 2013. 2013 16/07/2014 [cited 2014 8/12/2014]; Available from: http://www.ons.gov.uk/ons/rel/vsob1/death-reg-sum-tables/2013/index.html 18. Office for National Statistics. How have mortality rates by age changed over the last 50 years? 2014 13/10/2014 [cited 2014 8/12/2014]; Available from: http://www.ons.gov.uk/ons/rel/vsob1/death-reg-sum-tables/2013/sty-mortality-rates-by-age.html 19. Mermelstein RJ, Riesenberg LA. Changing knowledge and attitudes about skin cancer risk factors in adolescents. Health psychology : official journal of the Division of Health Psychology, American Psychological Association. 1992;11:371-6. 20. NIH. Melanoma Risk Assessment Tool. 2008 09/10/2008 [cited 2015 21/1/2015]; Available from: http://www.cancer.gov/melanomarisktool/ 21. Fears TR, Guerry Dt, Pfeiffer RM, Sagebiel RW, Elder DE, Halpern A, et al. Identifying individuals at high risk of melanoma: a practical predictor of absolute risk. J Clin Oncol. 2006;24:3590-6. 22. Sneyd MJ, Cameron C, Cox B. Individual risk of cutaneous melanoma in New Zealand: developing a clinical prediction aid. BMC Cancer. 2014;14:359. 23. Government NSW. Dark side of tanning. 2010 [cited 2015 21/1/2015]; Available from: http://www.darksideoftanning.com.au/reduce_risk/quiz.aspx 24. Health HSoP. Disease Risk Index. 2008 [cited 2015 21/1/2015]; Available from: http://www.diseaseriskindex.harvard.edu/update/hccpquiz.pl?lang=english&func=home&quiz=melanoma 25. Eiser JR. Communication and interpretation of risk. Br Med Bull. 1998;54:779-90. 26. Vahabi M. Verbal versus numerical probabilities: Does format presentation of probabilistic information regarding breast cancer screening affect women’s comprehension? Health Educ J. 2010;69:150-63. 27. MacKie RM, Freudenberger T, Aitchison TC. Personal risk-factor chart for cutaneous melanoma. Lancet. 1989;2:487-90. 28. Goldberg MS, Doucette JT, Lim HW, Spencer J, Carucci JA, Rigel DS. Risk factors for presumptive melanoma in skin cancer screening: American Academy of Dermatology National Melanoma/Skin Cancer Screening Program experience 2001-2005. J Am Acad Dermatol. 2007;57:60-6. 29. Whiteman DC, Green AC. A risk prediction tool for melanoma? Cancer Epidemiol Biomarkers Prev. 2005;14:761-3. 30. Berry DC, Knapp PR, Raynor T. Is 15 per cent very common? Informing people about the risks of medication side effects. International Journal of Pharmacy Practice. 2002;10:145-51. on May 10, 2020. © 2015 American Association for Cancer Research. cebp.aacrjournals.org Downloaded from
Author manuscripts have been peer reviewed and accepted for publication but have not yet been edited. Author Manuscript Published OnlineFirst on February 24, 2015; DOI: 10.1158/1055-9965.EPI-14-1062

28
31. Garland CF, Garland FC. Do sunlight and vitamin D reduce the likelihood of colon cancer? Int J Epidemiol. 1980;9:227-31. 32. Li HW, Brereton RE, Anderson RA, Wallace AM, Ho CK. Vitamin D deficiency is common and associated with metabolic risk factors in patients with polycystic ovary syndrome. Metabolism. 2011;60:1475-81. 33. Vuong K, McGeechan K, Armstrong BK, Cust AE. Risk prediction models for incident primary cutaneous melanoma: a systematic review. JAMA dermatology. 2014;150:434-44. 34. Bataille V, Bishop JA, Sasieni P, Swerdlow AJ, Pinney E, Griffiths K, et al. Risk of cutaneous melanoma in relation to the numbers, types and sites of naevi: a case-control study. Br J Cancer. 1996;73:1605-11. 35. Berwick M, Begg CB, Fine JA, Roush GC, Barnhill RL. Screening for cutaneous melanoma by skin self-examination. J Natl Cancer Inst. 1996;88:17-23. 36. Elwood JM, Whitehead SM, Davison J, Stewart M, Galt M. Malignant melanoma in England: risks associated with naevi, freckles, social class, hair colour, and sunburn. Int J Epidemiol. 1990;19:801-10. 37. Green A, Siskind V, Bain C, Alexander J. Sunburn and malignant melanoma. Br J Cancer. 1985;51:393-7. 38. Holly EA, Aston DA, Cress RD, Ahn DK, Kristiansen JJ. Cutaneous melanoma in women. I. Exposure to sunlight, ability to tan, and other risk factors related to ultraviolet light. Am J Epidemiol. 1995;141:923-33. 39. Holman CD, Armstrong BK, Heenan PJ. Relationship of cutaneous malignant melanoma to individual sunlight-exposure habits. J Natl Cancer Inst. 1986;76:403-14. 40. Kanetsky PA, Holmes R, Walker A, Najarian D, Swoyer J, Guerry D, et al. Interaction of glutathione S-transferase M1 and T1 genotypes and malignant melanoma. Cancer Epidemiol Biomarkers Prev. 2001;10:509-13. 41. Kennedy C, Bajdik CD, Willemze R, De Gruijl FR, Bouwes Bavinck JN. The influence of painful sunburns and lifetime sun exposure on the risk of actinic keratoses, seborrheic warts, melanocytic nevi, atypical nevi, and skin cancer. J Invest Dermatol. 2003;120:1087-93. 42. Le Marchand L, Saltzman BS, Hankin JH, Wilkens LR, Franke AA, Morris SJ, et al. Sun exposure, diet, and melanoma in Hawaii Caucasians. Am J Epidemiol. 2006;164:232-45. 43. Mossner R, Anders N, Konig IR, Kruger U, Schmidt D, Berking C, et al. Variations of the melanocortin-1 receptor and the glutathione-S transferase T1 and M1 genes in cutaneous malignant melanoma. Archives of dermatological research. 2007;298:371-9. 44. Osterlind A, Tucker MA, Stone BJ, Jensen OM. The Danish Case-Control Study of Cutaneous Malignant-Melanoma .2. Importance of Uv-Light Exposure. International Journal of Cancer. 1988;42:319-24. 45. Swerdlow AJ, English J, MacKie RM, O'Doherty CJ, Hunter JA, Clark J, et al. Benign melanocytic naevi as a risk factor for malignant melanoma. Br Med J (Clin Res Ed). 1986;292:1555-9.
on May 10, 2020. © 2015 American Association for Cancer Research. cebp.aacrjournals.org Downloaded from
Author manuscripts have been peer reviewed and accepted for publication but have not yet been edited. Author Manuscript Published OnlineFirst on February 24, 2015; DOI: 10.1158/1055-9965.EPI-14-1062

29
46. Titus-Ernstoff L, Perry AE, Spencer SK, Gibson JJ, Cole BF, Ernstoff MS. Pigmentary characteristics and moles in relation to melanoma risk. Int J Cancer. 2005;116:144-9. 47. Westerdahl J, Olsson H, Masback A, Ingvar C, Jonsson N, Brandt L, et al. Use of Sunbeds or Sunlamps and Malignant-Melanoma in Southern Sweden. American Journal of Epidemiology. 1994;140:691-9. 48. Westerdahl J, Ingvar C, Masback A, Jonsson N, Olsson H. Risk of cutaneous malignant melanoma in relation to use of sunbeds: further evidence for UV-A carcinogenicity. Brit J Cancer. 2000;82:1593-9.
on May 10, 2020. © 2015 American Association for Cancer Research. cebp.aacrjournals.org Downloaded from
Author manuscripts have been peer reviewed and accepted for publication but have not yet been edited. Author Manuscript Published OnlineFirst on February 24, 2015; DOI: 10.1158/1055-9965.EPI-14-1062

30
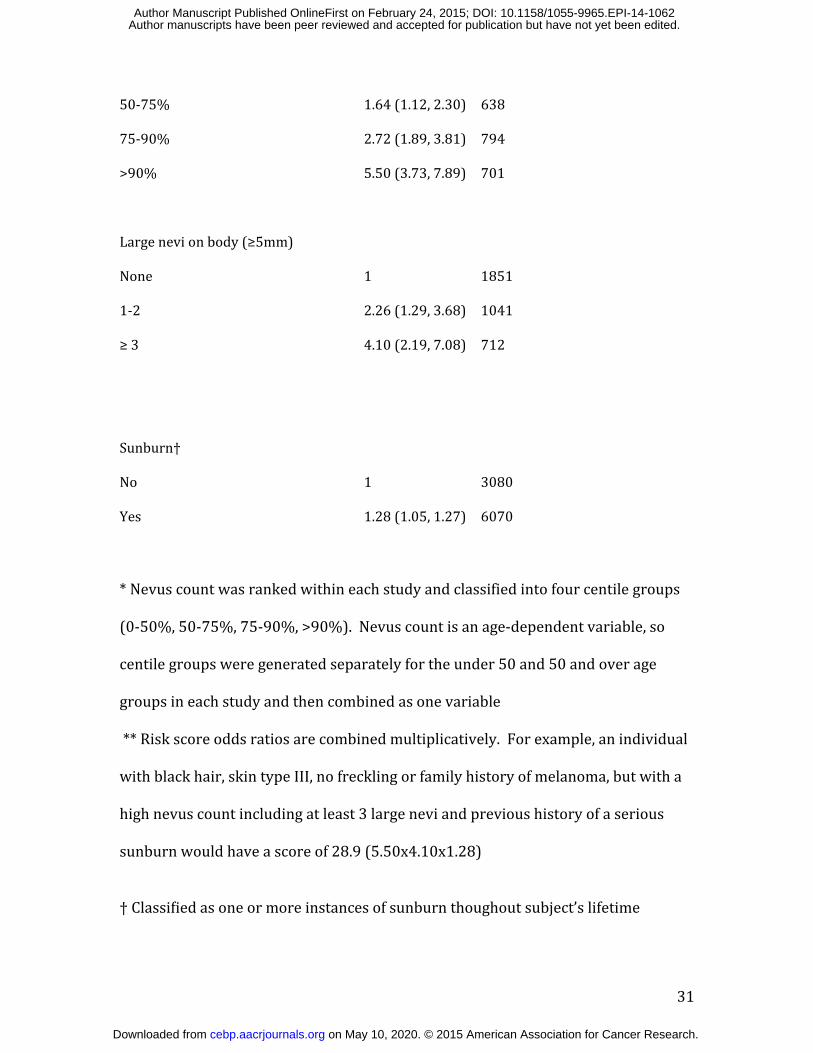
Table 1: Odds ratios for melanoma from a multivariable logistic random coefficients model including these factors, adjusted for age, sex, effect of study assessed in a pooled analysis of 15 case-control studies. Risk factor OR (95% CI)** n= 12387 n Hair color Brown/Black 1 7704Red 1.76 (1.41, 2.16) 3608Blond 1.41 (1.19, 1.67) 942 Skin type III+IV 1 7508I+II 1.66 (1.36, 2.01) 3666 Freckling No 1 5129Yes 1.58 (1.25, 2.01) 5050 Family history of melanoma No 1 9054Yes 1.74 (1.21, 2.46) 614 Total body nevus count distribution* 0-50% 1 1354
on May 10, 2020. © 2015 American Association for Cancer Research. cebp.aacrjournals.org Downloaded from
Author manuscripts have been peer reviewed and accepted for publication but have not yet been edited. Author Manuscript Published OnlineFirst on February 24, 2015; DOI: 10.1158/1055-9965.EPI-14-1062
31
50-75% 1.64 (1.12, 2.30) 638 75-90% 2.72 (1.89, 3.81) 794 >90% 5.50 (3.73, 7.89) 701 Large nevi on body (≥5mm) None 1 18511-2 2.26 (1.29, 3.68) 1041≥ 3 4.10 (2.19, 7.08) 712 Sunburn† No 1 3080Yes 1.28 (1.05, 1.27) 6070 * Nevus count was ranked within each study and classified into four centile groups (0-50%, 50-75%, 75-90%, >90%). Nevus count is an age-dependent variable, so centile groups were generated separately for the under 50 and 50 and over age groups in each study and then combined as one variable ** Risk score odds ratios are combined multiplicatively. For example, an individual with black hair, skin type III, no freckling or family history of melanoma, but with a high nevus count including at least 3 large nevi and previous history of a serious sunburn would have a score of 28.9 (5.50x4.10x1.28) † Classi ied as one or more instances of sunburn thoughout subject’s lifetime
on May 10, 2020. © 2015 American Association for Cancer Research. cebp.aacrjournals.org Downloaded from
Author manuscripts have been peer reviewed and accepted for publication but have not yet been edited. Author Manuscript Published OnlineFirst on February 24, 2015; DOI: 10.1158/1055-9965.EPI-14-1062

32
Table 2. Variables present in each study used in the Multiple Imputation by Chained Equations (MICE) imputation. Study Hair
colour
Skin
type
Freckling Family
history
Total nevus
count
Large nevi Sunburn Others
Bataille 1996(34) Yes Yes Yes Yes Body+Arms Arms Yes Atypical nevi Berwick 1996(35) Yes Yes Yes Yes Arms No Yes Raised nevi Elwood 1985(11) Yes Yes No* Yes No No Yes at 15 None Elwood 1990(36) Yes Yes Yes No Arms Arms Yes None Green 1985(37) Yes Yes Yes Yes Arms No Yes None Holly 1995(38) Yes Yes Yes Yes No Body Yes None Holman 1984(39) Yes Yes No Yes Arms No Yes Raised nevi Kanetsky 2001(40)
Yes Yes Yes Yes Body Body Yes Atypical nevi
Kennedy 2003(41) Yes Yes Yes No Body No Yes Atypical nevi LeMarchand 2006 (42) Yes Yes Yes Yes Body+Arms† Body+Arms Yes at 15 Raised nevi
on May 10, 2020. ©
2015 Am
erican Association for C
ancer Research.
cebp.aacrjournals.org D
ownloaded from
Author m
anuscripts have been peer reviewed and accepted for publication but have not yet been edited.
Author M
anuscript Published O
nlineFirst on F
ebruary 24, 2015; DO
I: 10.1158/1055-9965.EP
I-14-1062

33
Mössner 2007(43) Yes Yes No No Arms No No None Osterlind 1988(44) Yes Yes Yes Yes No Arms Yes at 15 Raised nevi
Swerdlow 1986(45) Yes Yes No Yes Body+Arms Body Yes at 20 None
Titus-Ernstoff 2005(46) Yes Yes Yes Yes Body+Arms No Yes Atypical nevi
Westerdahl 1994(47) Yes No Yes No Arms No Yes Raised nevi
Westerdahl 2000(48) Yes Yes Yes Yes Arms No Yes Raised nevi
† Trained interviewers counted moles on the arms, moles on the body were self-counted. * Freckling data was collected but not used due to freckling being assessed retrospectively to adolescence in this study.
on May 10, 2020. ©
2015 Am
erican Association for C
ancer Research.
cebp.aacrjournals.org D
ownloaded from
Author m
anuscripts have been peer reviewed and accepted for publication but have not yet been edited.
Author M
anuscript Published O
nlineFirst on F
ebruary 24, 2015; DO
I: 10.1158/1055-9965.EP
I-14-1062

34
Table 3: Sensitivity analysis. Estimates of threshold values omitting each study in turn. For each row the data from the indicated study is omitted and the risk score thresholds are calculated based on the data in the other 15 studies. Study Omitted Centile 20% 30% 40% 50% 60% 80% 90% Bataille 1996(34) 2.25 3.38 4.74 6.15 8.60 20.41 34.15 Berwick 1996(35) 2.02 2.87 3.65 5.25 7.04 15.84 28.00 Elwood 1985(11) 2.13 3.04 4.30 5.81 7.87 18.86 32.03 Elwood 1990(36) 2.02 2.89 3.72 5.50 7.50 17.65 29.48 Green 1985(37) 2.14 2.94 4.10 5.54 8.25 20.27 34.21 Holly 1995(38) 2.14 2.91 3.77 5.50 7.63 17.65 29.48 Holman 1984(39) 2.26 3.38 4.83 6.86 9.71 22.55 35.70 Kanetsky 2001(40) 2.24 3.04 4.56 5.88 8.29 19.44 32.25 Kennedy 2003(41) 2.10 2.89 3.75 5.50 7.81 18.58 32.47 LeMarchand 2006 (42) 2.26 3.38 4.80 6.49 9.13 22.03 35.63 Mössner 2007(43) 2.10 2.91 3.90 5.50 7.87 17.78 32.02 Osterlind 1988(44) 2.24 3.32 4.57 5.94 8.34 19.31 32.02 Swerdlow 1986(45) 2.14 3.04 4.57 5.94 8.61 20.69 35.63 Titus-Ernstoff 2005(46) 2.14 2.89 3.77 5.50 7.81 18.66 32.03 Westerdahl 1994(47) 2.14 3.32 4.57 6.15 8.69 21.88 35.63 Westerdahl 2000(48) 2.24 3.32 4.74 6.45 8.76 22.55 35.63 NONE† 2.24 3.32 4.57 5.94 8.46 19.66 32.80
on May 10, 2020. © 2015 American Association for Cancer Research. cebp.aacrjournals.org Downloaded from
Author manuscripts have been peer reviewed and accepted for publication but have not yet been edited. Author Manuscript Published OnlineFirst on February 24, 2015; DOI: 10.1158/1055-9965.EPI-14-1062

35
† Individuals are classified into the Low, Medium-Low, Medium-High and High groups based on the 30th, 60th and 90th percentiles.
on May 10, 2020. © 2015 American Association for Cancer Research. cebp.aacrjournals.org Downloaded from
Author manuscripts have been peer reviewed and accepted for publication but have not yet been edited. Author Manuscript Published OnlineFirst on February 24, 2015; DOI: 10.1158/1055-9965.EPI-14-1062

36
Table 4: Number and percentage of cases and controls in each risk band for the Leeds dataset†. Case (%) Control (%) Pooled controls* (%) Low, relative to peers** 93 (13) 181 (43) 128 (30) Medium-Low, relative to peers 160 (22) 137 (32) 128 (30) Medium-High, relative to peers 265 (36) 77 (18) 128 (30) High, Relative to peers 213 (29) 30 (7) 43 (10) *Expectation of how controls in the Leeds case-control data would be distributed if they followed the distribution pattern of the controls in the pooled analyses. ** Peers are defined as individuals of the same age and sex drawn from the same population. † Chi squared test p<2.2x10⁻¹⁶
on May 10, 2020. © 2015 American Association for Cancer Research. cebp.aacrjournals.org Downloaded from
Author manuscripts have been peer reviewed and accepted for publication but have not yet been edited. Author Manuscript Published OnlineFirst on February 24, 2015; DOI: 10.1158/1055-9965.EPI-14-1062

37
Figure legend Figure 1 ROC curve showing discrimination between cases and controls in the Leeds melanoma case-control study using the risk algorithm: (AUC=0.75, 95% CI 0.73-0.78).
on May 10, 2020. © 2015 American Association for Cancer Research. cebp.aacrjournals.org Downloaded from
Author manuscripts have been peer reviewed and accepted for publication but have not yet been edited. Author Manuscript Published OnlineFirst on February 24, 2015; DOI: 10.1158/1055-9965.EPI-14-1062

Published OnlineFirst February 24, 2015.Cancer Epidemiol Biomarkers Prev John R. Davies, Yu-mei Chang, D. Timothy Bishop, et al. pooled data from 16 case-control studiesDevelopment and validation of a melanoma risk score based on
Updated version
10.1158/1055-9965.EPI-14-1062doi:
Access the most recent version of this article at:
Material
Supplementary
http://cebp.aacrjournals.org/content/suppl/2015/02/25/1055-9965.EPI-14-1062.DC1
Access the most recent supplemental material at:
Manuscript
Authoredited. Author manuscripts have been peer reviewed and accepted for publication but have not yet been
E-mail alerts related to this article or journal.Sign up to receive free email-alerts
Subscriptions
Reprints and
To order reprints of this article or to subscribe to the journal, contact the AACR Publications
Permissions
Rightslink site. Click on "Request Permissions" which will take you to the Copyright Clearance Center's (CCC)
.http://cebp.aacrjournals.org/content/early/2015/02/24/1055-9965.EPI-14-1062To request permission to re-use all or part of this article, use this link
on May 10, 2020. © 2015 American Association for Cancer Research. cebp.aacrjournals.org Downloaded from
Author manuscripts have been peer reviewed and accepted for publication but have not yet been edited. Author Manuscript Published OnlineFirst on February 24, 2015; DOI: 10.1158/1055-9965.EPI-14-1062