development and validation of a reverse phase-high ... · wong & nasr: development and...
TRANSCRIPT
Malaysian Journal of Analytical Sciences, Vol 21 No 3 (2017): 605 - 618
DOI: https://doi.org/10.17576/mjas-2017-2103-10
605
MALAYSIAN JOURNAL OF ANALYTICAL SCIENCES
Published by The Malaysian Analytical Sciences Society
DEVELOPMENT AND VALIDATION OF A REVERSE PHASE-HIGH
PERFORMANCE LIQUID CHROMATOGRAPHY-ULTRAVIOLET METHOD
FOR SIMULTANEOUS DETECTION OF CAFFEINE AND
PHENOLPHTHALEIN IN WEIGHT REDUCING SUPPLEMENTS
(Pembangunan dan Pengesahsahihan Kaedah Fasa Terbalik-Kromatografi Cecair Prestasi Tinggi
Ultraungu bagi Pengesanan Kafein dan Fenolftalein Dalam Suplemen Pengurangan Berat
Badan)
Elham Mohammadi Nasr and Lai Chun Wong*
Department of Pharmaceutical Chemistry, School of Pharmacy,
International Medical University, 57000 Kuala Lumpur, Malaysia
*Corresponding author: [email protected]
Received: 13 May 2016; Accepted: 12 April 2017
Abstract
A reversed-phase high performance liquid chromatography analytical method with variable wavelength detection was developed
for the simultaneous detection of caffeine and phenolphthalein in weight reducing supplements. Chromatographic separation was
achieved with a C18 reversed-phase column using a gradient elution of methanol and an ammonium acetate buffer (pH 5; 25
mM), with the detector wavelength set at 254 nm. The method was validated according to The International Conference on
Harmonisation of Technical Requirements for Registration of Pharmaceuticals for Human Use guidelines. The method was
proven to be linear over a concentration of 10 – 100 μg/mL for both caffeine and phenolphthalein, with mean correlation
coefficients of 1.000 and 0.999, respectively. The limit of detection for caffeine and phenolphthalein was 0.77 μg/mL and 0.47
μg/mL respectively, while the limit of quantification for caffeine and phenolphthalein was 2.35 μg/mL and 1.44 μg/mL,
resspectively. The percentage relative standard deviation for both intra and inter-day precision was less than 2%. The mean
recovery values were calculated as 105.84% and 113.58% for caffeine and phenolphthalein. In addition, the method was proven
to be robust when deliberate changes in flow rate, buffer pH and organic mobile phase composition were tested.
Keywords: caffeine, phenolphthalein, high performance liquid chromatography, validation, weight reducing supplement
Abstrak
Satu kaedah analitikal kromatografi cecair prestasi tinggi (KCPT) fasa terbalik dengan pengesanan pada pelbagai panjang
gelombang telah dibangunkan untuk pengesahan kafein dan fenolftalein dalam suplemen pengurangan berat badan. Pemisahan
kromatografik dicapai dengan turus fasa terbalik C18 menggunakan kecerunan elusi metanol dan penampan ammonium asetat
(pH 5; 25 mM), pada panjang gelombong = 254 nm. Kaedah ini telah ditentusahkan mengikut garis panduan harmonisasi
persidangan antarabangsa keperluan teknikal untuk pendaftaran famaseutikal bagi pengunaan manusia. Kaedah ini dibuktikan
linear dalam julat kepekatan larutan piawai kafein dan fenolftalein di antara 10 – 100 μg/mL dengan nilai pekali korelasi (R2)
1.000 dan 0.999 untuk masing – masing bagi kafein dan fenolftalein. Had pengesanan bagi kafein dan fenolftalein masing-
masing ialah 0.77 μg/mL and 0.47 μg/mL. Keputusan had kuantifikasi bagi kafein dan fenolftalein masing-masing ialah 2.35
μg/mL and 1.44 μg/mL. Peratus relatif sisihan piawai bagi ketepatan intra dan antara hari yang diukur ialah kurang dari nilai 2%.
Nilai min pemulihan semula yang dikira bagi kafein dan fenolftalein masing-masing ialah 105.84 dan 113.58%. Kaedah ini juga
dibuktikan teguh apabila perubahan dalam kadar aliran, pH panampan dan komposisi fasa bergerak diuji.
ISSN
1394 - 2506
Wong & Nasr: DEVELOPMENT AND VALIDATION OF A REVERSE PHASE-HIGH PERFORMANCE
LIQUID CHROMATOGRAPHY-ULTRAVIOLET METHOD FOR SIMULTANEOUS
DETECTION OF CAFFEINE AND PHENOLPHTHALEIN IN WEIGHT REDUCING
SUPPLEMENTS
606
Kata kunci: kafein, fenolftalein, kromatografi cecair prestasi tinggi, pengesahsahihan, suplemen pengurangan berat badan
Introduction
Obesity is a worldwide health epidemic. It is reported that among adults aged 18 and above, 11% of men and 15%
of women were obese in 2014 [1]. Because of the health risks associated from being overweight, and also pressure
from society to have a slim and attractive body, weight reducing supplements are popular worldwide among both
men and women. The majority of these weight reducing supplements are marketed as being derived from
phytotherapeutic formulations and are advertised as being natural and safe. Unfortunately this is not the case in
reality, as there have been many reports worldwide of weight reducing supplements being adulterated with
undeclared prescription pharmaceuticals and banned substances to enhance their efficiency [2–11].
In the US, the Food and Drug Administration (FDA) has detected the presence of adulterants such as sibutramine,
fenproporex, fluoxetine, bumetanide, furosemide, phenytoin, rimonabant, cetilistat and phenolphthalein in various
weigh reducing products sold over the counter (OTC) and online [12]. We are interested in developing a simple and
fast HPLC method to quantify caffeine and phenolphthalein, as these compounds are popular choices as adulterants
due to their relatively cheap price and easy accessibility. Phenolphthalein, a synthetic compound, was a stimulant
laxative used for the treatment of constipation and for bowel evacuation until 1999, when the FDA reclassified the
drug as ‘not generally safe and effective’ after studies indicated that it presented a potential carcinogenic risk [13].
Since then, the United Kingdom has changed the status of phenolphthalein from OTC to prescription agent, while
European countries such as Italy and France have suspended the use of it in prescription and OTC pharmaceutical
preparations [14, 15].
Caffeine is a natural product found in the leaves, seeds, and fruits of more than 60 plants [16]. As a stimulant,
caffeine was reported to be one of the most used drugs for slimming purposes [3]. Consuming caffeine increases
energy expenditure, making the individual more alert and hence more active, leading to weight loss [17]. Caffeine
has also been proposed to counteract the decrease in metabolic rates, and may also act as an appetite suppressant.
Although complications due to caffeine toxicity are rare, excessive consumption of caffeine can lead to health
problems such as sleep disruption, headache, nausea, anxiety, and even caffeine-induced cardiac arrhythmia [18,19].
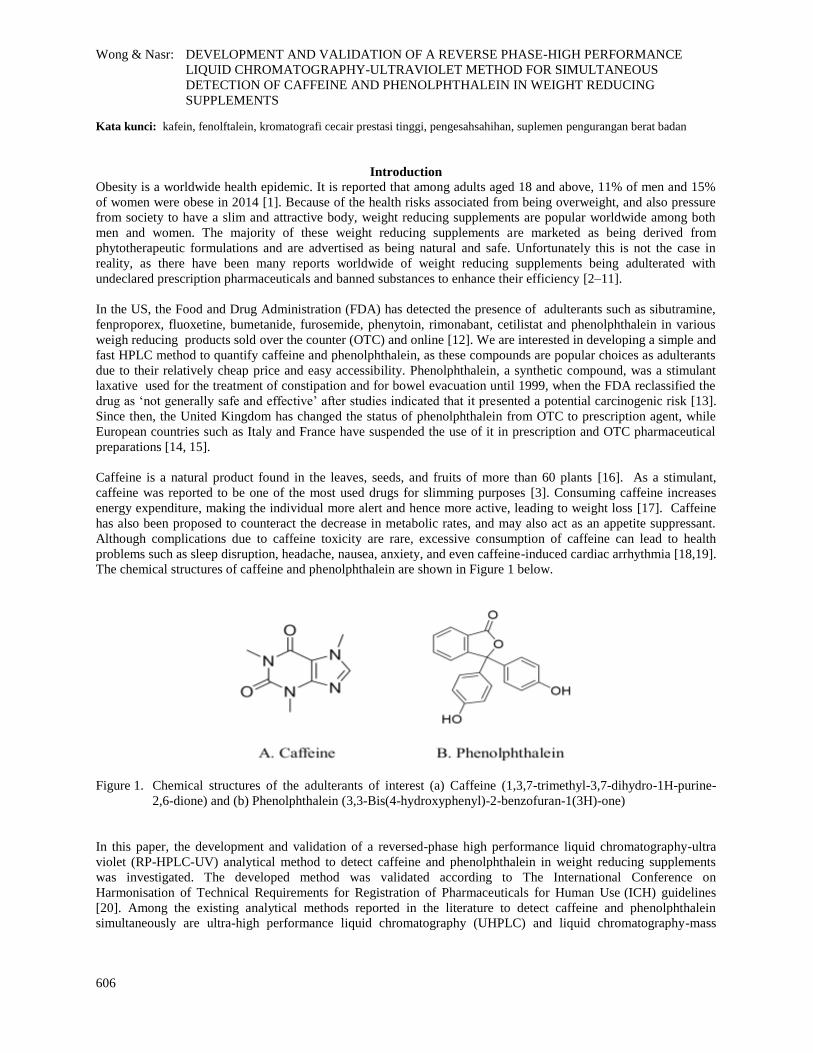
The chemical structures of caffeine and phenolphthalein are shown in Figure 1 below.
Figure 1. Chemical structures of the adulterants of interest (a) Caffeine (1,3,7-trimethyl-3,7-dihydro-1H-purine-
3,3-Bis(4-hydroxyphenyl)-2-benzofuran-1(3H)-one2,6-dione) and (b) Phenolphthalein ( )
In this paper, the development and validation of a reversed-phase high performance liquid chromatography-ultra
violet (RP-HPLC-UV) analytical method to detect caffeine and phenolphthalein in weight reducing supplements
was investigated. The developed method was validated according to The International Conference on
(ICH) guidelines Harmonisation of Technical Requirements for Registration of Pharmaceuticals for Human Use
[20]. Among the existing analytical methods reported in the literature to detect caffeine and phenolphthalein
simultaneously are ultra-high performance liquid chromatography (UHPLC) and liquid chromatography-mass

Malaysian Journal of Analytical Sciences, Vol 21 No 3 (2017): 605 - 618
DOI: https://doi.org/10.17576/mjas-2017-2103-10
607
spectroscopy (LC-MS) [9, 21]. Recently, an article was published reporting a HPLC-UV method for quantitative
determination of six adulterant drugs, including caffeine and phenolphthalein, in slimming supplements [22].
However, the published method uses different HPLC parameters from our study. The method which we have
developed can be applied to analytical laboratories in developing countries which are only equipped with HPLC-UV
instrumentation to screen and quantify for caffeine and phenolphthalein in weight reducing supplements.
Materials and Methods
Chemicals and reagents
Caffeine (≥99.0%) and phenolphthalein (ACS reagent), used as standards, were purchased from Sigma Aldrich and
Merck, respectively. HPLC-grade methanol and ammonium acetate (>99%) was obtained from Fischer Scientific.
The mobile phase was filtered through a 0.45 µm nylon membrane filter and ultrasonically degassed before use.
Other reagents, including glacial acetic acid, were of analytical grade. Ultrapure water was prepared using an
atrium® 611 Ultrapure Water System (Sartorius, Germany).
Instrumentation and chromatographic system
Method development and validation was performed on a 1200 series HPLC (Agilent Technologies, US), interfaced
with a binary pump (G1312A, Agilent Technologies, US), degasser (G1379B, Agilent Technologies, US), variable
wavelength detector (VWD) (Agilent Technologies, US) and manual injector (G1328B, Agilent Technologies, US).
The HPLC was interfaced to a Hewlett-Packard L1908 computer equipped with ChemStation System (version
2008) software.
The chromatography method was developed using a C18 Hypersil GOLD column (150 mm x 4.6 mm internal
diameter, 5 µm particle size) at room temperature. The mobile phase was composed of (A) an ammonium acetate
buffer 25 mM solution adjusted to pH 5 with glacial acetic acid and (B) methanol with a gradient elution
programme, as shown in Table 1. The mobile phase was delivered at a flow rate of 1.1 mL/min. The injection loop
volume was 20 µl. The detection wavelength was set at 254 nm.
Table 1. Gradient elution profile used in HPLC system
Time (min) 0 1 3 5 10
A (%) 90 90 60 45 45
B (%) 10 10 40 55 55
A = ammonium acetate buffer (pH 5; 25 mM); B = methanol
Preparation of stock standard solution
1 mg/mL prepared separately in HPLC grade Stock standard solutions of caffeine and phenolphthalein were
methanol. The resulting stock solutions were sonicated and filtered using a 0.2 μm nylon syringe filter.
Preparation of mixed standard and mixed working solution
Mixed standard solution in concentration 100 µg/mL was prepared from the stock standard solutions. Using this
tertiary solution, mixed working solutions of 10, 20, 40, 60 and 80 µg/mL were prepared by diluting with the
appropriate amount of methanol. All solutions were prepared in HPLC grade methanol, stored in a refrigerator
(4 ºC) and brought to room temperature before use.
Preparation of blank sample
The blank sample for validation of specificity was prepared according to methods modified from the literature
[5, 10]. A herbal weight reducing supplement purchased from a local pharmacy was considered as a blank sample.
The capsule was opened, and 0.1 g of powder was weighed. The powder was then extracted with 25 mL of HPLC
grade methanol by sonication for 10 minutes. The mixture was then centrifuged at 10 000 rpm for five minutes, and

Wong & Nasr: DEVELOPMENT AND VALIDATION OF A REVERSE PHASE-HIGH PERFORMANCE
LIQUID CHROMATOGRAPHY-ULTRAVIOLET METHOD FOR SIMULTANEOUS
DETECTION OF CAFFEINE AND PHENOLPHTHALEIN IN WEIGHT REDUCING
SUPPLEMENTS
608
the supernatant was then collected and filtered through a 0.2 µm nylon syringe filter. The blank sample was stored
at 4 ºC in the refrigerator and brought to room temperature before injection into the HPLC.
System suitability tests
System suitability tests were carried out before performing validation parameters. The following system suitability
tests were performed: peak symmetry, number of theoretical plates, resolution and capacity factor.
Method validation
The method validation was performed according to ICH guidelines for the following parameters: specificity,
linearity, limit of detection (LOD), limit of quantification (LOQ), accuracy, precision, and robustness. Stability of a
mixed working solution at a 50 μg/mL concentration was also investigated.
Specificity
Specificity is defined as the ability to assess unequivocally the analytes in the presence of components which may
be expected to be present. Specificity was determined by injecting blank samples into the HPLC system to test for
interference of a complex matrix of the blank samples with caffeine and phenolphthalein peaks. Blank samples used
were OTC weight reducing supplements.
Linearity of the calibration curve
The linearity of the calibration curves were constructed by analysing mixed working solutions of caffeine and
phenolphthalein. Six concentrations of mixed working solutions containing them ranging from 10 µg/mL to 100
µg/mL were prepared. The linearity was obtained by the injection of the mixed standard working solutions at each
and the results were expressed as the mean of the triplicates. concentration in triplicates (n = 3),
Limit of detection and limit of quantification
The LOD is defined as the lowest analyte concentration of a sample that can be detected by the analyst, while LOQ
is the lowest analyte concentration which can be quantitatively detected with accuracy and acceptable precision. The
LOD is expressed as 3.3δ/S, and LOQ is expressed as 10δ/S, where S refers to the slope of the calibration curve and
δ refers to the standard deviation of the response. The value of δ was determined from the residual standard
deviation of the calibration curve.
Accuracy
The accuracy of the method, expressed as percentage recovery (% recovery), was established via spiking studies.
The % recovery values were evaluated by spiking blank samples with low, medium and high levels of caffeine and
phenolphthalein standards. The concentrations of caffeine standard spiked into the samples were 11, 22 and 33
µg/mL, while the concentrations of phenolphthalein standard spiked were 10.44, 20.88 and 31.32 µg/mL. Each
standards of the same concentration was injected into the HPLC in triplicates (n = 3) and the results are expressed as
the mean of the triplicates. The % recovery values were established by calculating the ratio of the experimentally
determined concentration of each analytes spiked into the blank samples to its theoretical amount (equation 1):
% Recovery = (Recovered concentration of analytes)
(Theoretical concentration of analytes) x 100% (1)
Precision
Precision is the measure for the relative errors of the method and is expressed as the percentage relative standard
deviation (% RSD) for intra-day precision (repeatability) and inter-day precision (intermediate precision). To find
the intra-day precision, mixed working solutions at low, medium and high concentrations were injected
consecutively in the same day. Each sample of a similar concentration was injected in triplicates (n = 3), and the
results were expressed as the mean of the triplicates. To find the inter-day precision, the process to do so was
repeated where injections of mixed working standard solutions at low, medium and high concentrations were
performed over three consecutive days. Each sample of a similar concentration was injected in triplicates (n = 3),
and the results were expressed as the mean of the triplicates.
Malaysian Journal of Analytical Sciences, Vol 21 No 3 (2017): 605 - 618
DOI: https://doi.org/10.17576/mjas-2017-2103-10
609
Stability of mixed standard solution
A mixed working solution of concentration 50 was prepared fresh. The stability of this solution was checked µg/mL
after 24 hours under refrigerated conditions (4 °C).
Robustness
The robustness of the method was determined by analysing the mixed standard solution after deliberate changes in
flow rate (± 0.2 mL/min), buffer pH (± 0.2 units) and organic content of the mobile phase (± 2.0%). System
suitability was applied after each of the above mentioned changes. The method is considered robust for the
parameter tested if it conforms to the system suitability tests.
Preparation of representative samples
The representative samples were prepared according to similar method employed to prepare the blank sample. Five
weight reducing supplements in the form of capsules and powder were purchased from the Kuala Lumpur area
(products A, B, C, D and E). The filtered solution of product A was diluted by 10 times with HPLC grade methanol
before injection into the HPLC to obtain concentrations within the calibration range. No dilutions were required for
the other samples before injection into the HPLC. All solutions were injected in triplicate.
Liquid-liquid extraction (LLE)
To clean-up product E, 0.05 g of the product was weighed and dissolved in 20 mL sodium carbonate solution.
Solids were removed by filtering, and the filtrate collected into a separating funnel. The filtrate was extracted with
dichloromethane (20 mL x 3), the dichloromethane fractions pooled into a round bottom flask and the solvent
removed using a rotary evaporator. The residue left in the round bottom flask was reconstituted with 10 mL of
HPLC grade methanol and filtered through a 0.2 µm nylon syringe filter prior to injection into the HPLC.
Results and Discussion
Selection and optimisation of the method
The chromatographic method was optimised during the method developing stage by trying different mobile phase
compositions and flow rates. The final method was obtained using an ammonium acetate buffer (pH 5; 25 mM) as
an aqueous mobile phase and methanol as an organic mobile phase at a flow rate of 1.1 mL/min. The buffer was
used as an aqueous mobile phase to obtain good peak shape and a constant retention time, as caffeine and
phenolphthalein contains pH sensitive functional groups [23, 24]. Additional peaks were observed when ammonium
acetate buffer pH 5 was substituted with ammonium acetate buffer pH 3.8 and pH 5.8 (Figures 2a and 2b). The
optimum wavelength allowing for sensitive detection for both caffeine and phenolphthalein was set at 254 nm based
on literature [9, 10, 25].
The elution gradient begins with 10% methanol and 90% buffer. After one minute a linear gradient is started where
40% methanol composition is reached after 2 minutes from the time of gradient. A second linear gradient is then
applied where methanol composition increases to 55% after 2 minutes and kept constant for 5 minutes until caffeine
and phenolphthalein elutes out at 5.61 minutes and 8.78 minutes respectively. The separation achieved using the
experimental conditions described are presented in Figure 2c. The following system suitability test parameters were
performed: peak symmetry, number of theoretical plates, resolution and capacity factor (Table 2). All system
suitability test parameters were found to be within the ICH requirements.

Wong & Nasr: DEVELOPMENT AND VALIDATION OF A REVERSE PHASE-HIGH PERFORMANCE
LIQUID CHROMATOGRAPHY-ULTRAVIOLET METHOD FOR SIMULTANEOUS
DETECTION OF CAFFEINE AND PHENOLPHTHALEIN IN WEIGHT REDUCING
SUPPLEMENTS
610
Figure 2. The HPLC chromatogram of mixed working solution (50 ) under chromatographic conditions of µg/mL
the developed method with ammonium acetate buffer at (a) pH 3.8; (b) pH 5.8 and (c) pH 5
c
Malaysian Journal of Analytical Sciences, Vol 21 No 3 (2017): 605 - 618
DOI: https://doi.org/10.17576/mjas-2017-2103-10
611
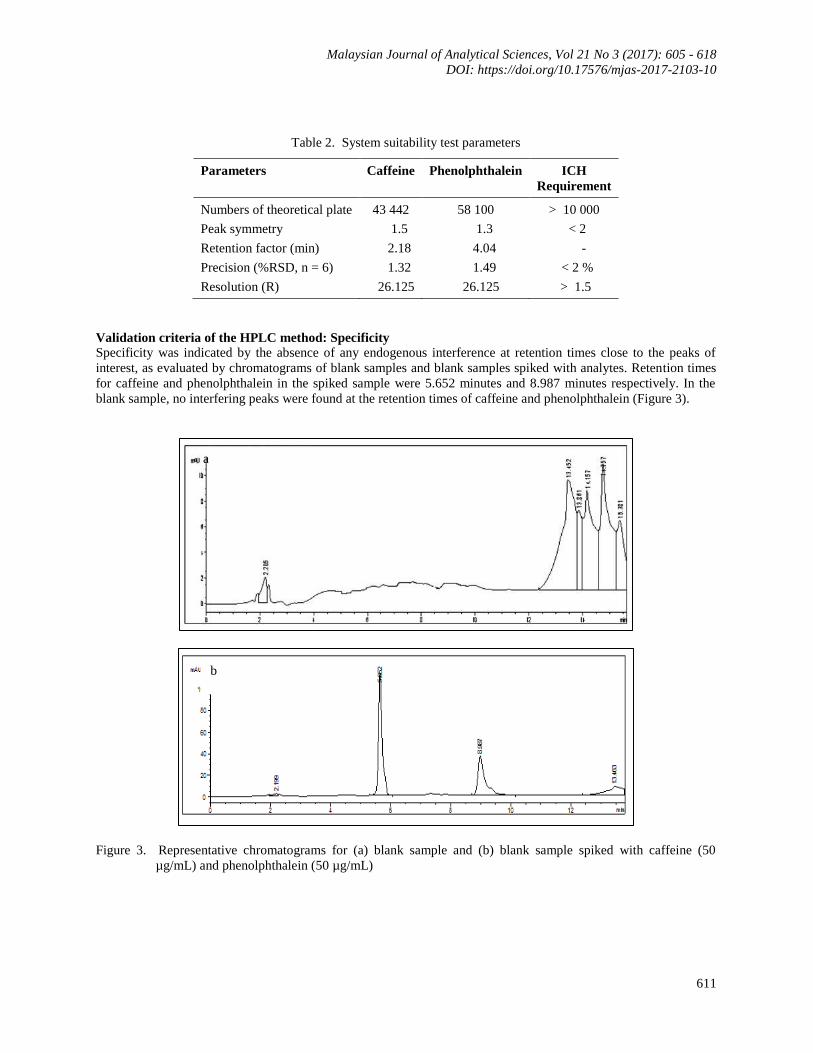
Table 2. System suitability test parameters
Parameters Caffeine Phenolphthalein ICH
Requirement
Numbers of theoretical plate 43 442 58 100 > 10 000
Peak symmetry 1.5 1.3 < 2
Retention factor (min) 2.18 4.04 -
Precision (%RSD, n = 6) 1.32 1.49 < 2 %
Resolution (R) 26.125 26.125 > 1.5
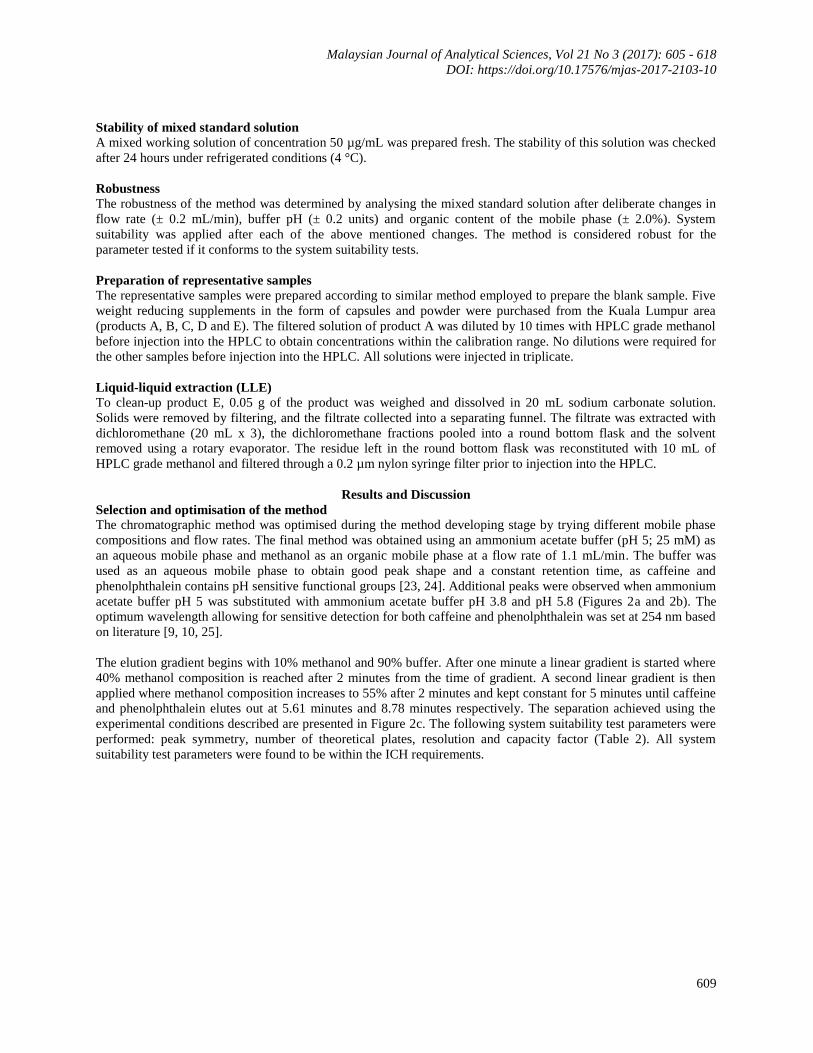
Validation criteria of the HPLC method: Specificity
Specificity was indicated by the absence of any endogenous interference at retention times close to the peaks of
interest, as evaluated by chromatograms of blank samples and blank samples spiked with analytes. Retention times
for caffeine and phenolphthalein in the spiked sample were 5.652 minutes and 8.987 minutes respectively. In the
blank sample, no interfering peaks were found at the retention times of caffeine and phenolphthalein (Figure 3).
Figure 3. Representative chromatograms for (a) blank sample and (b) blank sample spiked with caffeine (50
µg/mL) and phenolphthalein (50 µg/mL)
b
a
Wong & Nasr: DEVELOPMENT AND VALIDATION OF A REVERSE PHASE-HIGH PERFORMANCE
LIQUID CHROMATOGRAPHY-ULTRAVIOLET METHOD FOR SIMULTANEOUS
DETECTION OF CAFFEINE AND PHENOLPHTHALEIN IN WEIGHT REDUCING
SUPPLEMENTS
612
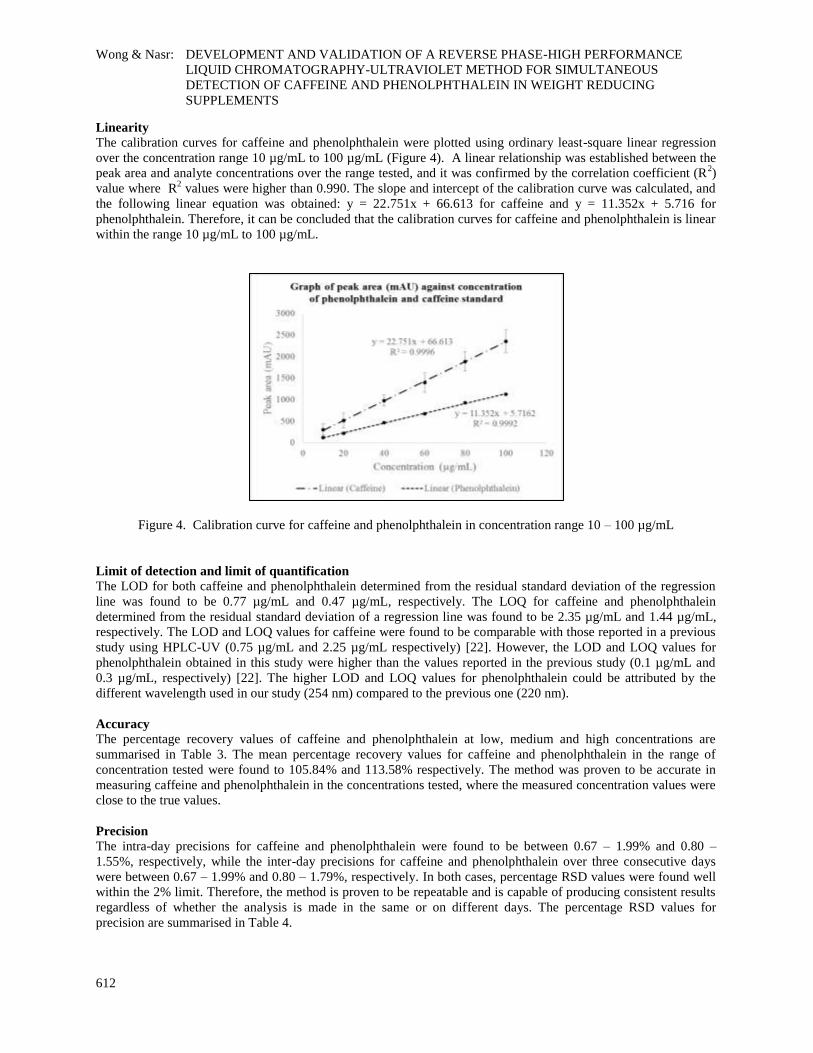
Linearity
The calibration curves for caffeine and phenolphthalein were plotted using ordinary least-square linear regression
over the concentration range (Figure 4). A linear relationship was established between the 10 µg/mL to 100 µg/mL
peak area and analyte concentrations over the range tested, and it was confirmed by the correlation coefficient (R2)
value where R2 values were higher than 0.990. The slope and intercept of the calibration curve was calculated, and
the following linear equation was obtained: y = 22.751x + 66.613 for caffeine and y = 11.352x + 5.716 for
phenolphthalein. Therefore, it can be concluded that the calibration curves for caffeine and phenolphthalein is linear
within the range 10 µg/mL to 100 µg/mL.
Figure 4. Calibration curve for caffeine and phenolphthalein in concentration range 10 – 100 µg/mL
Limit of detection and limit of quantification
The LOD for both caffeine and phenolphthalein determined from the residual standard deviation of the regression
0.47line was found to be 0.77 µg/mL and µg/mL, respectively. The LOQ for caffeine and phenolphthalein
1.44determined from the residual standard deviation of a regression line was found to be 2.35 µg/mL and µg/mL,
respectively. The LOD and LOQ values for caffeine were found to be comparable with those reported in a previous
study using HPLC-UV (0.75 µg/mL and 2.25 µg/mL respectively) [22]. However, the LOD and LOQ values for
phenolphthalein obtained in this study were higher than the values reported in the previous study (0.1 µg/mL and
0.3 µg/mL, respectively) [22]. The higher LOD and LOQ values for phenolphthalein could be attributed by the
different wavelength used in our study (254 nm) compared to the previous one (220 nm).
Accuracy
The percentage recovery values of caffeine and phenolphthalein at low, medium and high concentrations are
summarised in Table 3. The mean percentage recovery values for caffeine and phenolphthalein in the range of
concentration tested were found to 105.84% and 113.58% respectively. The method was proven to be accurate in
measuring caffeine and phenolphthalein in the concentrations tested, where the measured concentration values were
close to the true values.
Precision
The intra-day precisions for caffeine and phenolphthalein were found to be between 0.67 – 1.99% and 0.80 –
1.55%, respectively, while the inter-day precisions for caffeine and phenolphthalein over three consecutive days
In both cases, percentage RSD values were found well were between 0.67 – 1.99% and 0.80 – 1.79%, respectively.
within the 2% limit. Therefore, the method is proven to be repeatable and is capable of producing consistent results
regardless of whether the analysis is made in the same or on different days. The percentage RSD values for
precision are summarised in Table 4.
Malaysian Journal of Analytical Sciences, Vol 21 No 3 (2017): 605 - 618
DOI: https://doi.org/10.17576/mjas-2017-2103-10
613
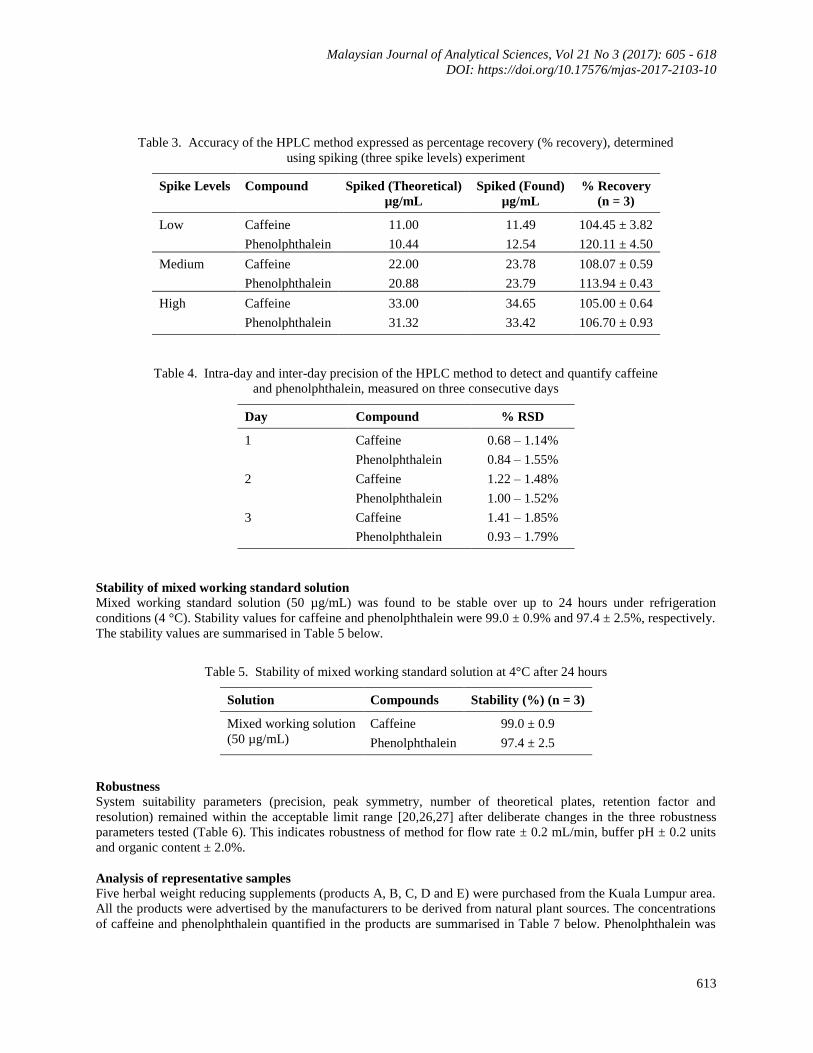
Table 3. Accuracy of the HPLC method expressed as percentage recovery (% recovery), determined
using spiking (three spike levels) experiment
Spike Levels Compound Spiked (Theoretical)
µg/mL
Spiked (Found)
µg/mL
% Recovery
(n = 3)
Low Caffeine 11.00 11.49 104.45 ± 3.82
Phenolphthalein 10.44 12.54 120.11 ± 4.50
Medium Caffeine 22.00 23.78 108.07 ± 0.59
Phenolphthalein 20.88 23.79 113.94 ± 0.43
High Caffeine 33.00 34.65 105.00 ± 0.64
Phenolphthalein 31.32 33.42 106.70 ± 0.93
Table 4. Intra-day and inter-day precision of the HPLC method to detect and quantify caffeine
and phenolphthalein, measured on three consecutive days
Day Compound % RSD
1 Caffeine 0.68 – 1.14%
Phenolphthalein 0.84 – 1.55%
2 Caffeine – 1.48%1.22
Phenolphthalein 1.00 – 1.52%
3 Caffeine – 1.85%1.41
Phenolphthalein – 1.79%0.93
Stability of mixed working standard solution
Mixed working standard solution (50 was found to be stable over up to 24 hours under refrigeration µg/mL)
conditions (4 °C). Stability values for caffeine and phenolphthalein were 99.0 ± 0.9% and 97.4 ± 2.5%, respectively.
The stability values are summarised in Table 5 below.
Table 5. Stability of mixed working standard solution at 4°C after 24 hours
Solution Compounds Stability (%) (n = 3)
Mixed working solution
(50 µg/mL)
Caffeine 99.0 ± 0.9
Phenolphthalein 97.4 ± 2.5
Robustness
System suitability parameters (precision, peak symmetry, number of theoretical plates, retention factor and
resolution) remained within the acceptable limit range [20,26,27] after deliberate changes in the three robustness
parameters tested (Table 6). This indicates ± 0.2 mL/min, buffer pH ± 0.2 units robustness of method for flow rate
and organic content ± 2.0%.
Analysis of representative samples Five herbal weight reducing supplements (products A, B, C, D and E) were purchased from the Kuala Lumpur area.
All the products were advertised by the manufacturers to be derived from natural plant sources. The concentrations
of caffeine and phenolphthalein quantified in the products are summarised in Table 7 below. Phenolphthalein was
Wong & Nasr: DEVELOPMENT AND VALIDATION OF A REVERSE PHASE-HIGH PERFORMANCE
LIQUID CHROMATOGRAPHY-ULTRAVIOLET METHOD FOR SIMULTANEOUS
DETECTION OF CAFFEINE AND PHENOLPHTHALEIN IN WEIGHT REDUCING
SUPPLEMENTS
614
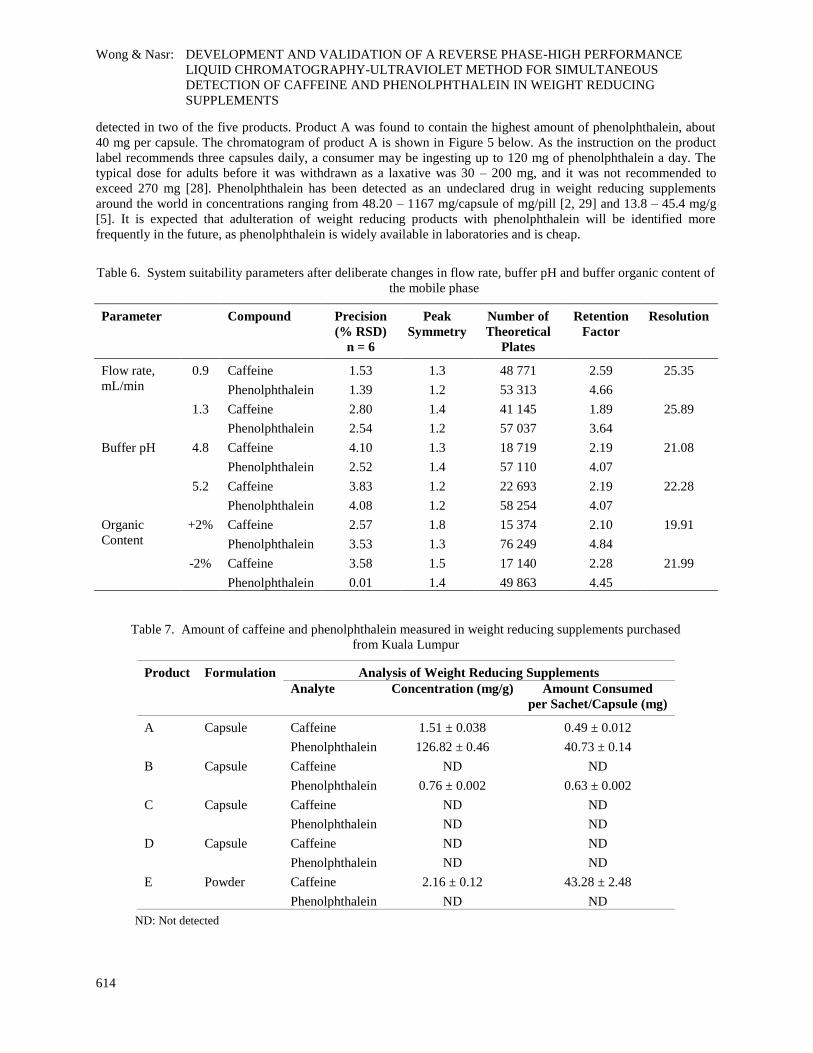
detected in two of the five products. Product A was found to contain the highest amount of phenolphthalein, about
40 mg per capsule. The chromatogram of product A is shown in Figure 5 below. As the instruction on the product
label recommends three capsules daily, a consumer may be ingesting up to 120 mg of phenolphthalein a day. The
typical dose for adults before it was withdrawn as a laxative was 30 – 200 mg, and it was not recommended to
exceed 270 mg [28]. Phenolphthalein has been detected as an undeclared drug in weight reducing supplements
around the world in concentrations ranging from 48.20 – 1167 mg/capsule of mg/pill [2, 29] and 13.8 – 45.4 mg/g
[5]. It is expected that adulteration of weight reducing products with phenolphthalein will be identified more
frequently in the future, as phenolphthalein is widely available in laboratories and is cheap.
Table 6. System suitability parameters after deliberate changes in flow rate, buffer pH and buffer organic content of
the mobile phase
Parameter Compound Precision
(% RSD)
n = 6
Peak
Symmetry
Number of
Theoretical
Plates
Retention
Factor
Resolution
Flow rate,
mL/min
0.9 Caffeine 1.53 1.3 48 771 2.59 25.35
Phenolphthalein 1.39 1.2 53 313 4.66
1.3 Caffeine 2.80 1.4 41 145 1.89 25.89
Phenolphthalein 2.54 1.2 57 037 3.64
Buffer pH 4.8 Caffeine 4.10 1.3 18 719 2.19 21.08
Phenolphthalein 2.52 1.4 57 110 4.07
5.2 Caffeine 3.83 1.2 22 693 2.19 22.28
Phenolphthalein 4.08 1.2 58 254 4.07
Organic
Content
+2% Caffeine 2.57 1.8 15 374 2.10 19.91
Phenolphthalein 3.53 1.3 76 249 4.84
-2% Caffeine 3.58 1.5 17 140 2.28 21.99
Phenolphthalein 0.01 1.4 49 863 4.45
Table 7. Amount of caffeine and phenolphthalein measured in weight reducing supplements purchased
from Kuala Lumpur
Product Formulation Analysis of Weight Reducing Supplements
Analyte Concentration (mg/g) Amount Consumed
per Sachet/Capsule (mg)
A Capsule Caffeine 1.51 ± 0.038 0.49 ± 0.012
Phenolphthalein 126.82 ± 0.46 40.73 ± 0.14
B Capsule Caffeine ND ND
Phenolphthalein 0.76 ± 0.002 0.63 ± 0.002
C Capsule Caffeine ND ND
Phenolphthalein ND ND
D Capsule Caffeine ND ND
Phenolphthalein ND ND
E Powder Caffeine 2.16 ± 0.12 43.28 ± 2.48
Phenolphthalein ND ND
ND: Not detected
Malaysian Journal of Analytical Sciences, Vol 21 No 3 (2017): 605 - 618
DOI: https://doi.org/10.17576/mjas-2017-2103-10
615
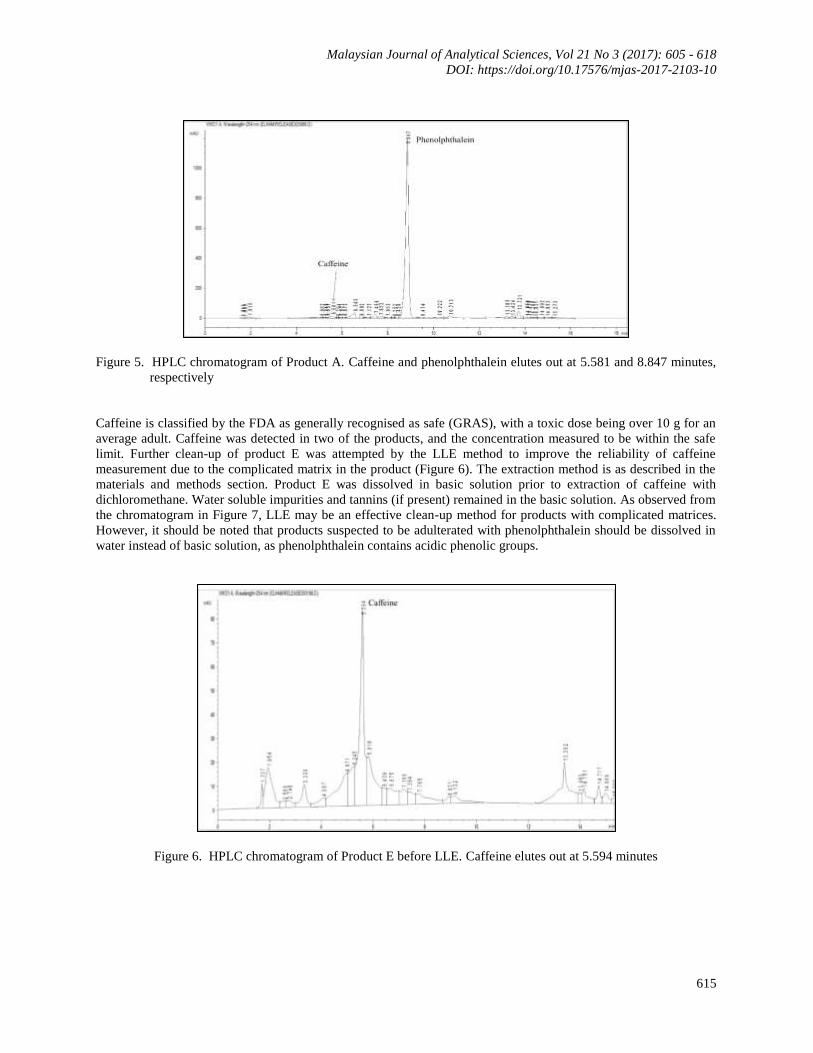
Caffeine and phenolphthalein elutes out at 5.581 and 8.847 minutes, Figure 5. HPLC chromatogram of Product A.
respectively
Caffeine is classified by the FDA as generally recognised as safe (GRAS), with a toxic dose being over 10 g for an
average adult. Caffeine was detected in two of the products, and the concentration measured to be within the safe
limit. Further clean-up of product E was attempted by the LLE method to improve the reliability of caffeine
measurement due to the complicated matrix in the product (Figure 6). The extraction method is as described in the
materials and methods section. Product E was dissolved in basic solution prior to extraction of caffeine with
dichloromethane. Water soluble impurities and tannins (if present) remained in the basic solution. As observed from
the chromatogram in Figure 7, LLE may be an effective clean-up method for products with complicated matrices.
However, it should be noted that products suspected to be adulterated with phenolphthalein should be dissolved in
water instead of basic solution, as phenolphthalein contains acidic phenolic groups.
Caffeine elutes out at 5.594 minutes Figure 6. HPLC chromatogram of Product E before LLE.
Wong & Nasr: DEVELOPMENT AND VALIDATION OF A REVERSE PHASE-HIGH PERFORMANCE
LIQUID CHROMATOGRAPHY-ULTRAVIOLET METHOD FOR SIMULTANEOUS
DETECTION OF CAFFEINE AND PHENOLPHTHALEIN IN WEIGHT REDUCING
SUPPLEMENTS
616
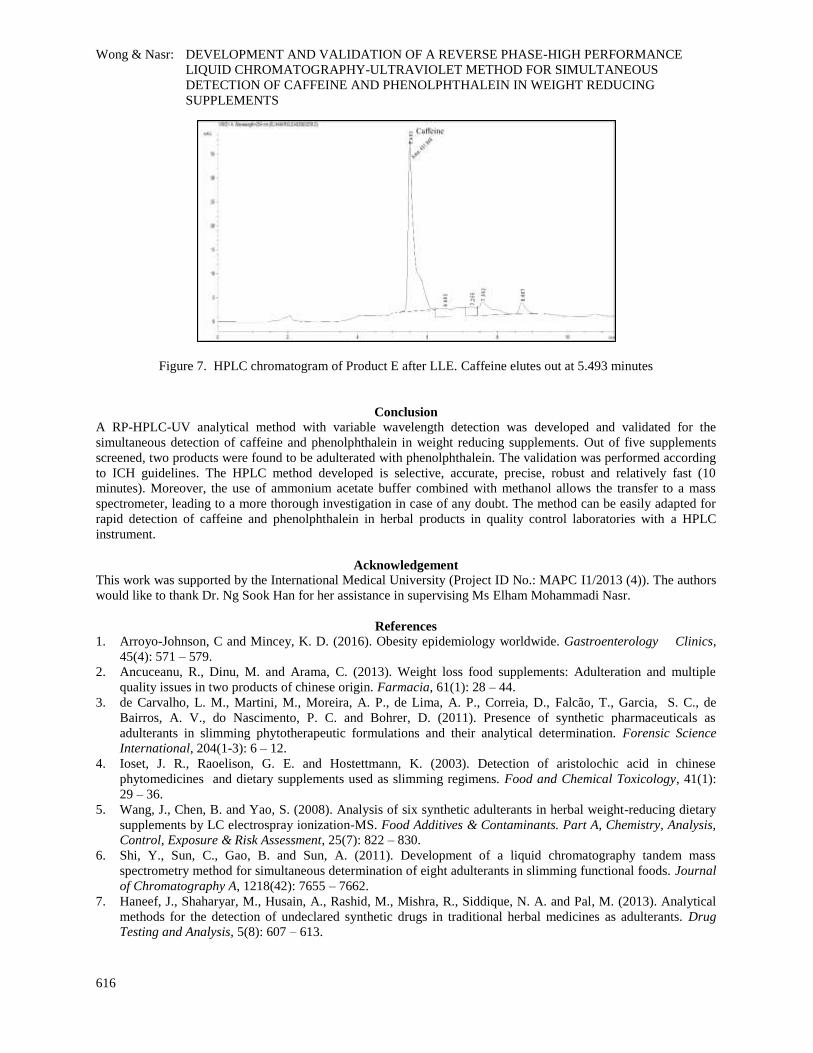
Caffeine elutes out at 5.493 minutes Figure 7. HPLC chromatogram of Product E after LLE.
Conclusion
A RP-HPLC-UV analytical method with variable wavelength detection was developed and validated for the
simultaneous detection of caffeine and phenolphthalein in weight reducing supplements. Out of five supplements
screened, two products were found to be adulterated with phenolphthalein. The validation was performed according
to ICH guidelines. The HPLC method developed is selective, accurate, precise, robust and relatively fast (10
minutes). Moreover, the use of ammonium acetate buffer combined with methanol allows the transfer to a mass
spectrometer, leading to a more thorough investigation in case of any doubt. The method can be easily adapted for
rapid detection of caffeine and phenolphthalein in herbal products in quality control laboratories with a HPLC
instrument.
Acknowledgement
This work was supported by the International Medical University (Project ID No.: MAPC I1/2013 (4)). The authors
would like to thank Dr. Ng Sook Han for her assistance in supervising Ms Elham Mohammadi Nasr.
References
1. Arroyo-Johnson, C and Mincey, K. D. (2016). Obesity epidemiology worldwide. Gastroenterology Clinics,
45(4): 571 – 579.
2. Ancuceanu, R., Dinu, M. and Arama, C. (2013). Weight loss food supplements: Adulteration and multiple
quality issues in two products of chinese origin. Farmacia, 61(1): 28 – 44.
3. de Carvalho, L. M., Martini, M., Moreira, A. P., de Lima, A. P., Correia, D., Falcão, T., Garcia, S. C., de
Bairros, A. V., do Nascimento, P. C. and Bohrer, D. (2011). Presence of synthetic pharmaceuticals as
adulterants in slimming phytotherapeutic formulations and their analytical determination. Forensic Science
International, 204(1-3): 6 – 12.
4. Ioset, J. R., Raoelison, G. E. and Hostettmann, K. (2003). Detection of aristolochic acid in chinese
phytomedicines and dietary supplements used as slimming regimens. Food and Chemical Toxicology, 41(1):
29 – 36.
5. Wang, J., Chen, B. and Yao, S. (2008). Analysis of six synthetic adulterants in herbal weight-reducing dietary
supplements by LC electrospray ionization-MS. Food Additives & Contaminants. Part A, Chemistry, Analysis,
Control, Exposure & Risk Assessment, 25(7): 822 – 830.
6. Shi, Y., Sun, C., Gao, B. and Sun, A. (2011). Development of a liquid chromatography tandem mass
spectrometry method for simultaneous determination of eight adulterants in slimming functional foods. Journal
of Chromatography A, 1218(42): 7655 – 7662.
7. Haneef, J., Shaharyar, M., Husain, A., Rashid, M., Mishra, R., Siddique, N. A. and Pal, M. (2013). Analytical
methods for the detection of undeclared synthetic drugs in traditional herbal medicines as adulterants. Drug
Testing and Analysis, 5(8): 607 – 613.
Malaysian Journal of Analytical Sciences, Vol 21 No 3 (2017): 605 - 618
DOI: https://doi.org/10.17576/mjas-2017-2103-10
617
8. Dunn, J. D., Gryniewicz-Ruzicka, C. M., Mans, D. J., Mecker-Pogue, L. C., Kauffman, J. F., Westenberger, B.
J. and Buhse, L. F. (2012). Qualitative screening for adulterants in weight-loss supplements by ion mobility
spectrometry. Journal of Pharmaceutical and Biomedical Analysis, 71: 18 – 26.
9. Rebiere, H., Guinot, P., Civade, C., Bonnet, P. and Nicolas, A. (2012). Detection of hazardous weight-loss
substances in adulterated slimming formulations using ultra-high-pressure liquid chromatography with diode-
array detection. Food Additives & Contaminants. Part A, Chemistry, Analysis, Control, Exposure & Risk
Assessment, 29(2): 161 – 171.
10. Deconinck, E., Verlinde, K., Courselle, P. and Beer J. O. (2012). A validated ultra high pressure liquid
chromatographic method for the characterisation of confiscated illegal slimming products containing anorexics.
Journal of Pharmaceutical and Biomedical Analysis, 59: 38 – 43.
11. Phattanawasin, P., Sotanaphun, U., Sukwattanasinit, T., Akkarawaranthorn, J. and Kitchaiya, S. (2012).
Quantitative determination of sibutramine in adulterated herbal slimming formulations by TLC-image analysis
method. Forensic Science International, 219: 96 – 100.
12. Food and Drug Administration. Drugs (2009). Available from: http://www.fda.gov/Drugs/ResourcesForYou/
Consumers/QuestionsAnswers/ucm136187.htm. Date acces on 1 April 2017.
13. Dunnick, J. K. and Hailey, J. R. (1996). Phenolphthalein exposure causes multiple carcinogenic effects in
experimental model systems. Cancer Research, 56(21): 4922 – 4926.
14. World Health Organization (1998). World drug information. Essential Medicines and Pharmaceutical Policies,
12(1): 1 – 21.
15. International Agency on Research for Cancer (2000). Some antiviral and antineoplastic drugs, and other
pharmaceutical agents. IARC Monographs on the Evaluation of Carcinogenic Risks to Humans, 76: 387 – 415.
16. Barone, J. J. and Roberts, H. (1984). Human consumption of caffeine. Caffeine, 59 – 73.
17. Diepvens, K., Westerterp, K. R. and Westerterp-Plantenga, M. S. (2007). Obesity and thermogenesis related to
the consumption of caffeine, ephedrine, capsaicin, and green tea. American Journal of Physiology - Regulatory,
Integrative and Comparative Physiology, 292(1): 77 – 85.
18. Snel, J. and Lorist, M. M. (2011). Effects of caffeine on sleep and cognition. Progress in Brain Research, 190:
105 – 117.
19. Cannon, M. E., Cook, C. T. and McCarthy, J. S. (2001). Caffeine-induced cardiac arrhythmia: An unrecognised
danger of healthfood products. Medical Journal of Australia, 174(10): 520 – 521.
20. International Conference on Harmonisation (1996). Guidance for industry Q2B validation of analytical
procedures: Methodology: pp. 1 – 10.
21. Zheng-Fei, P. (2011). Determination of caffeine, phenolphthalein and sibutramine illegally added to weight loss
functional food with UPLC/MS/MS. China Tropical Medicine, 11(9): 1116 – 1117.
22. Hammadi, R. and Almardini, M. A. (2014). A fully validated HPLC-UV method for quantitative and qualitative
determination of six adulterant drugs in natural slimming dietary supplements. International Journal of
Pharmaceutical Sciences Review and Research, 29(1): 171 – 174.
23. National Center for Biotechnology Information (2004). Caffeine. Available from: http://pubchem.ncbi.
nlm.nih.gov/summary/summary.cgi?cid=2519. Acesss online on 1 April 2017.
24. National Center for Biotechnology Information (2005). Phenolphthalein. Available from: http://pubchem.ncbi.
nlm.nih.gov/summary/summary.cgi?cid=4764. Access online on 1 April 2017.
25. Rahim, A. A., Nofrizal, S. and Saad, B. (2014). Rapid tea catechins and caffeine determination by HPLC using
microwave-assisted extraction and silica monolithic column. Food Chemistry, 147: 262 – 288.
26. Shabir, G. (2003). Validation of high-performance liquid chromatography methods for pharmaceutical analysis.
understanding the differences and similarities between validation requirements of the US Food and Drug
Administration, the US Pharmacopeia and the International Conference on Harmonization. Journal of
Chromatography A, 987(1-2): 56 – 66.
27. Center for Drug Evaluation and Research CDER (1994). Reviewer guidance-validation of chromatographic
methods: pp. 1 – 30.
28. U.S. Department of Health and Human Services. (2016). 14th Report on carcinogens (phenolphthalein).
National Toxicology Program.

Wong & Nasr: DEVELOPMENT AND VALIDATION OF A REVERSE PHASE-HIGH PERFORMANCE
LIQUID CHROMATOGRAPHY-ULTRAVIOLET METHOD FOR SIMULTANEOUS
DETECTION OF CAFFEINE AND PHENOLPHTHALEIN IN WEIGHT REDUCING
SUPPLEMENTS
618
29. Khazan, M., Hedayati, M., Kobarfard, F., Askari, S. and Azizi, F. (2014). Identification and determination of
synthetic pharmaceuticals as adulterants in eight common herbal weight loss supplements. Iranian Red
Crescent Medical Journal, 16(3): 15344 - 15350.