development assistance, export promotion, and
TRANSCRIPT
Development Assistance, Export Promotion,and Environmental Technology
August 1993
OTA-BP-ITE-107NTIS order #PB93-218907
GPO stock #052-003-01332-1
Recommended Citation:U.S. Congress, Office of Technology Assessment, Development Assistance,Export Promotion, and Environmental Technology--Background Paper,OTA-BP-ITE-1O7 (Washington, DC: U.S. Government Printing Office,August 1993).
For sale by the U.S. Government Printing OfficeSuperintendent of Documents, Mail Stop: SSOP. Washington. DC 20402-9328
ISBN 0-16 -041852-6
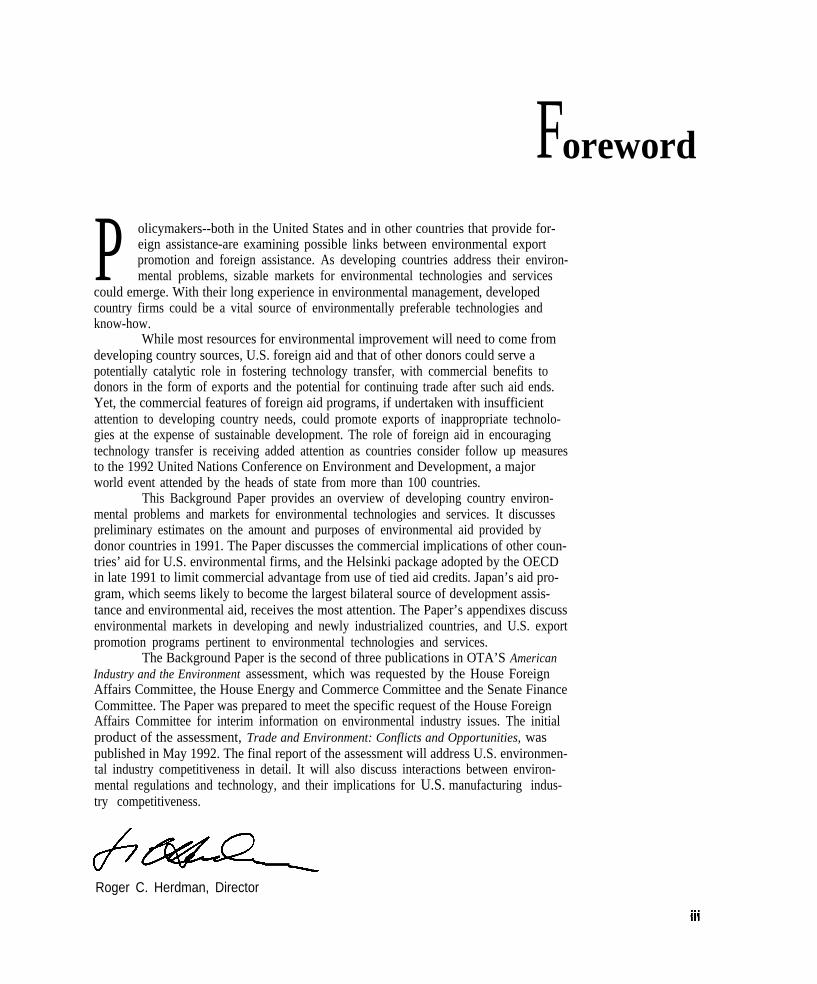
Foreword
P olicymakers--both in the United States and in other countries that provide for-eign assistance-are examining possible links between environmental exportpromotion and foreign assistance. As developing countries address their environ-mental problems, sizable markets for environmental technologies and services
could emerge. With their long experience in environmental management, developedcountry firms could be a vital source of environmentally preferable technologies andknow-how.
While most resources for environmental improvement will need to come fromdeveloping country sources, U.S. foreign aid and that of other donors could serve apotentially catalytic role in fostering technology transfer, with commercial benefits todonors in the form of exports and the potential for continuing trade after such aid ends.Yet, the commercial features of foreign aid programs, if undertaken with insufficientattention to developing country needs, could promote exports of inappropriate technolo-gies at the expense of sustainable development. The role of foreign aid in encouragingtechnology transfer is receiving added attention as countries consider follow up measuresto the 1992 United Nations Conference on Environment and Development, a majorworld event attended by the heads of state from more than 100 countries.
This Background Paper provides an overview of developing country environ-mental problems and markets for environmental technologies and services. It discussespreliminary estimates on the amount and purposes of environmental aid provided bydonor countries in 1991. The Paper discusses the commercial implications of other coun-tries’ aid for U.S. environmental firms, and the Helsinki package adopted by the OECDin late 1991 to limit commercial advantage from use of tied aid credits. Japan’s aid pro-gram, which seems likely to become the largest bilateral source of development assis-tance and environmental aid, receives the most attention. The Paper’s appendixes discussenvironmental markets in developing and newly industrialized countries, and U.S. exportpromotion programs pertinent to environmental technologies and services.
The Background Paper is the second of three publications in OTA’S AmericanIndustry and the Environment assessment, which was requested by the House ForeignAffairs Committee, the House Energy and Commerce Committee and the Senate FinanceCommittee. The Paper was prepared to meet the specific request of the House ForeignAffairs Committee for interim information on environmental industry issues. The initialproduct of the assessment, Trade and Environment: Conflicts and Opportunities, waspublished in May 1992. The final report of the assessment will address U.S. environmen-tal industry competitiveness in detail. It will also discuss interactions between environ-mental regulations and technology, and their implications for U.S. manufacturing indus-try competitiveness.
a’+- -Roger C. Herdman, Director
Advisory Panel
Roland W. Schmitt, Chairman Jeffrey LeonardRensselaer Polytechnic Institute Global Environment Fund
Edgar BerkeyNational Environmental
Technology ApplicationsCorporation
Judith DeanSchool of Advanced International
StudiesJohns Hopkins University
Robert E. DriscollU. S.-ASEAN Council for Business
and Technology, Inc.
Peter EmersonEnvironmental Defense Fund
Harry L. FosterGeneral Motors Co.
Stewart J. HudsonNational Wildlife Federation
David S. MarshMarsh Plating Corporation
Jessica Matthews1
World Resources Institute
Robert S. McNamaraU.S.-Japan Foundation
J.A. MeyerChevron Corporation
T.C. ParsonsCenter for Industrial ServicesUniversity of Tennessee
Martyn RiddleInternational Finance Corporation
Paul RelisCalifornia Integrated Waste
Management Board
Lawrence RossCenter for Waste Reduction
TechnologiesAmerican Institute of Chemical
Engineers
Maxine SavitzGarrett Processing DivisionAllied-Signal Aerospace
Samuel A. SchulhofGeneral Electric Company
James SeloverSelover Associates
Peg SeminarioAFL-CIO
John J. SheehanUnited Steelworkers of America
Sally SheltonGeorgetown University
Mary KellyTexas Center for Policy Studies
NOTE: OTA appreciates and is grateful for the valuable assistance and thoughtful critiques provided by the advisory panelmembers. The panel does not, however, necessarily approve, disapprove, or endorse this report. OTA assumes full responsi-bility for the report and the accuracy of its contents.
iv
Project Staff
Peter D. Blair, Assistant Director, OTAEnergy, Materials, and International Security Division
Audrey B. Buyrn, Program ManagerIndustry, Technology, and Employment Program
Wendell Fletcher, Project Director
Robert Weissler, Senior Analyst
Madeleine Costanza, Consultant Sebastian Remoy
Takashi Mashiko Rodney Sobin
Robert D. Atkinson Susan H. Lusi
ADMINISTRATIVE STAFF
Carol A. Guntow, Office Administrator
Diane D. White, Administrative Secretary
v
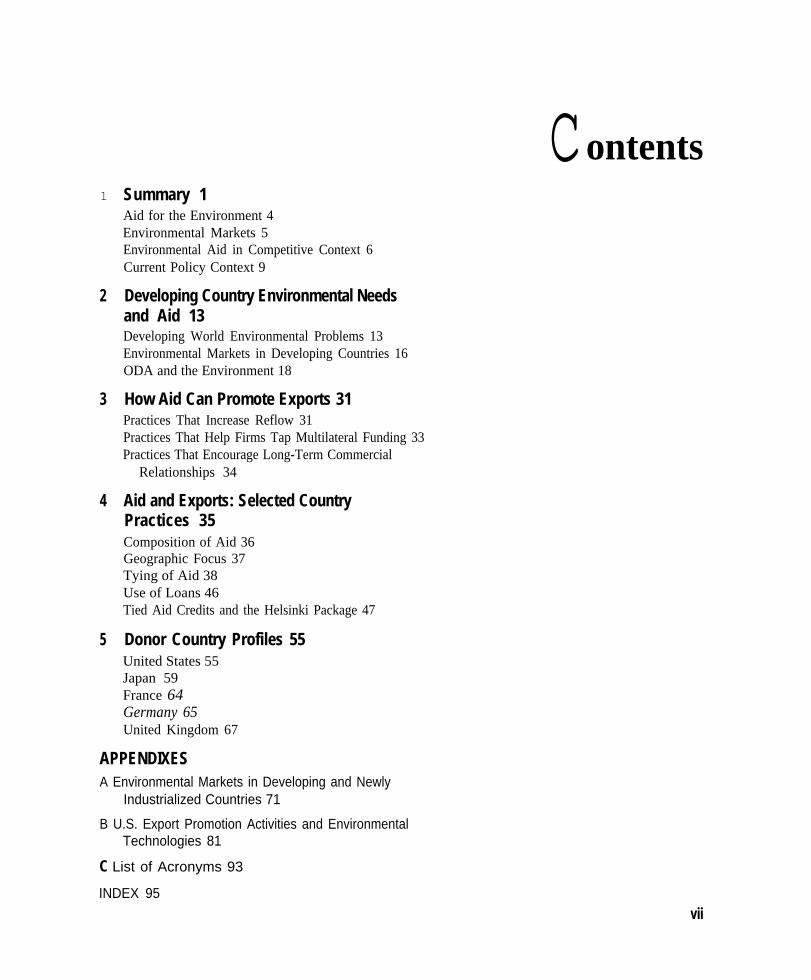
contents1
2
3
4
5
Summary 1Aid for the Environment 4Environmental Markets 5Environmental Aid in Competitive Context 6Current Policy Context 9
Developing Country Environmental Needsand Aid 13Developing World Environmental Problems 13Environmental Markets in Developing Countries 16ODA and the Environment 18
How Aid Can Promote Exports 31Practices That Increase Reflow 31Practices That Help Firms Tap Multilateral Funding 33Practices That Encourage Long-Term Commercial
Relationships 34
Aid and Exports: Selected CountryPractices 35Composition of Aid 36Geographic Focus 37Tying of Aid 38Use of Loans 46Tied Aid Credits and the Helsinki Package 47
Donor Country Profiles 55United States 55Japan 59France 64Germany 65United Kingdom 67
APPENDIXESA Environmental Markets in Developing and Newly
Industrialized Countries 71
B U.S. Export Promotion Activities and EnvironmentalTechnologies 81
C List of Acronyms 93
INDEX 95
vii
Summary 1
A s more countries begin to address environmental prob-lems, new markets for environmental technologies andservices are emerging in the developing world. Develop-ing countries often need technologies and expertise from
developed countries in addressing their many serious environ-mental problems. The potential for exports of U.S. environ-mental technologies and services to developing (and other)countries is attracting increased attention from policymakers.One issue is whether the U.S. government should do more topromote environmental exports. A related issue is whether theFederal government should use foreign assistance to encourageenvironmental exports, either as a specific focus for action, or aspart of a broader strategy to link aid and export policies moreclosely.
Developing countries vary greatly in their ability and/orwillingness to pay for the costs of environmental protection.Most poorer developing countries have not chosen to use theirscarce financial resources to address environmental issueswithout financial assistance from developed countries. The moreprosperous developing countries have more resources; severalfast-growing developing country economies in Southeast Asiaand Latin America plan multi-billion dollar investments inenvironmental infrastructure in the next few years. However,some still receive bilateral aid to address global environmentalproblems that might not otherwise be among their priorities.
Several laws passed in the 102d Congress call for closercoordination of U.S. aid and export promotion efforts, includingenvironmental exports. Additional export promotion measureshave been proposed in the 103d Congress. (See box 1-A fordiscussion of recent laws and Executive Branch initiatives;
1
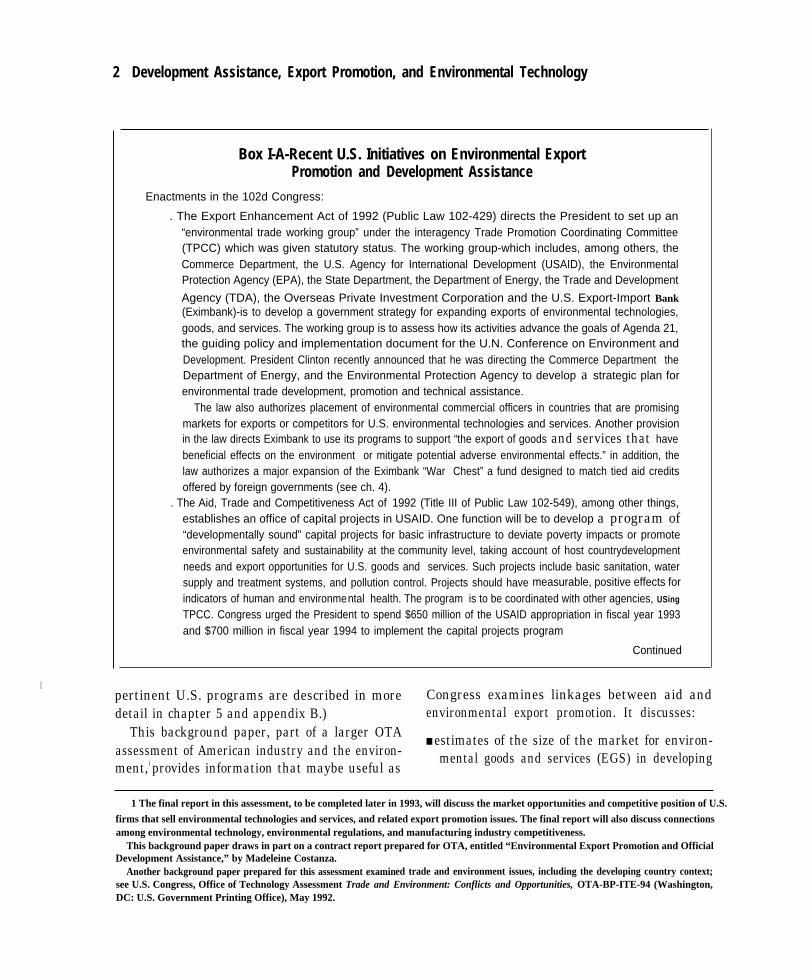
2 Development Assistance, Export Promotion, and Environmental Technology
I
Box I-A-Recent U.S. Initiatives on Environmental ExportPromotion and Development Assistance
Enactments in the 102d Congress:
. The Export Enhancement Act of 1992 (Public Law 102-429) directs the President to set up an“environmental trade working group” under the interagency Trade Promotion Coordinating Committee(TPCC) which was given statutory status. The working group-which includes, among others, theCommerce Department, the U.S. Agency for International Development (USAID), the EnvironmentalProtection Agency (EPA), the State Department, the Department of Energy, the Trade and Development
Agency (TDA), the Overseas Private Investment Corporation and the U.S. Export-Import Bank(Eximbank)-is to develop a government strategy for expanding exports of environmental technologies,goods, and services. The working group is to assess how its activities advance the goals of Agenda 21,the guiding policy and implementation document for the U.N. Conference on Environment andDevelopment. President Clinton recently announced that he was directing the Commerce Department theDepartment of Energy, and the Environmental Protection Agency to develop a strategic plan forenvironmental trade development, promotion and technical assistance.
The law also authorizes placement of environmental commercial officers in countries that are promisingmarkets for exports or competitors for U.S. environmental technologies and services. Another provisionin the law directs Eximbank to use its programs to support “the export of goods and services that havebeneficial effects on the environment or mitigate potential adverse environmental effects.” in addition, thelaw authorizes a major expansion of the Eximbank “War Chest” a fund designed to match tied aid creditsoffered by foreign governments (see ch. 4).
. The Aid, Trade and Competitiveness Act of 1992 (Title III of Public Law 102-549), among other things,establishes an office of capital projects in USAID. One function will be to develop a program of“developmentally sound” capital projects for basic infrastructure to deviate poverty impacts or promoteenvironmental safety and sustainability at the community level, taking account of host countrydevelopmentneeds and export opportunities for U.S. goods and services. Such projects include basic sanitation, watersupply and treatment systems, and pollution control. Projects should have measurable, positive effects forindicators of human and environmental health. The program is to be coordinated with other agencies, USing
TPCC. Congress urged the President to spend $650 million of the USAID appropriation in fiscal year 1993and $700 million in fiscal year 1994 to implement the capital projects program
Continued
pertinent U.S. programs are described in more Congress examines linkages between aid anddetail in chapter 5 and appendix B.) environmental export promotion. It discusses:
This background paper, part of a larger OTA■ estimates of the size of the market for environ-
assessment of American industry and the environ- mental goods and services (EGS) in developingment, l provides information that maybe useful as
1 The final report in this assessment, to be completed later in 1993, will discuss the market opportunities and competitive position of U.S.
firms that sell environmental technologies and services, and related export promotion issues. The final report will also discuss connectionsamong environmental technology, environmental regulations, and manufacturing industry competitiveness.
This background paper draws in part on a contract report prepared for OTA, entitled “Environmental Export Promotion and OfficialDevelopment Assistance,” by Madeleine Costanza.
Another background paper prepared for this assessment examined trade and environment issues, including the developing country context;see U.S. Congress, Office of Technology Assessment Trade and Environment: Conflicts and Opportunities, OTA-BP-ITE-94 (Washington,DC: U.S. Government Printing Office), May 1992.
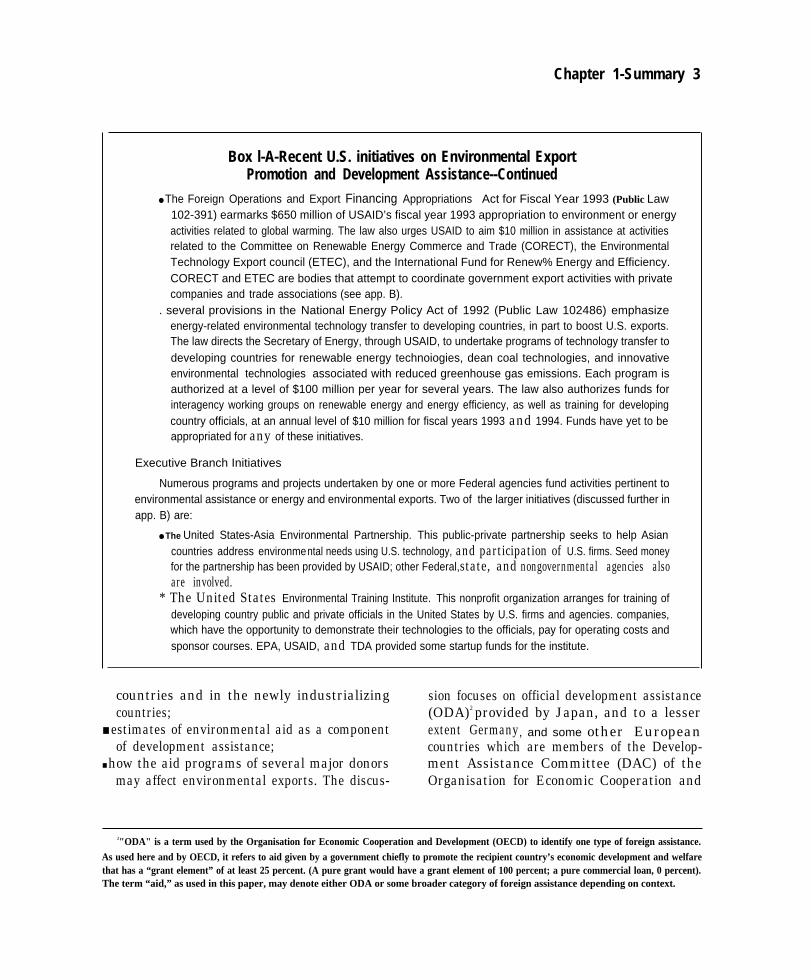
Chapter 1-Summary 3
Box l-A-Recent U.S. initiatives on Environmental ExportPromotion and Development Assistance--Continued
● The Foreign Operations and Export Financing Appropriations Act for Fiscal Year 1993 (Public Law102-391) earmarks $650 million of USAID’s fiscal year 1993 appropriation to environment or energyactivities related to global warming. The law also urges USAID to aim $10 million in assistance at activitiesrelated to the Committee on Renewable Energy Commerce and Trade (CORECT), the EnvironmentalTechnology Export council (ETEC), and the International Fund for Renew% Energy and Efficiency.CORECT and ETEC are bodies that attempt to coordinate government export activities with privatecompanies and trade associations (see app. B).
. several provisions in the National Energy Policy Act of 1992 (Public Law 102486) emphasizeenergy-related environmental technology transfer to developing countries, in part to boost U.S. exports.The law directs the Secretary of Energy, through USAID, to undertake programs of technology transfer todeveloping countries for renewable energy technoiogies, dean coal technologies, and innovativeenvironmental technologies associated with reduced greenhouse gas emissions. Each program isauthorized at a level of $100 million per year for several years. The law also authorizes funds forinteragency working groups on renewable energy and energy efficiency, as well as training for developingcountry officials, at an annual level of $10 million for fiscal years 1993 and 1994. Funds have yet to beappropriated for any of these initiatives.
Executive Branch Initiatives
Numerous programs and projects undertaken by one or more Federal agencies fund activities pertinent toenvironmental assistance or energy and environmental exports. Two of the larger initiatives (discussed further inapp. B) are:
● The United States-Asia Environmental Partnership. This public-private partnership seeks to help Asiancountries address environmental needs using U.S. technology, and participation of U.S. firms. Seed moneyfor the partnership has been provided by USAID; other Federal, state, and nongovernmental agencies alsoare involved.
* The United States Environmental Training Institute. This nonprofit organization arranges for training ofdeveloping country public and private officials in the United States by U.S. firms and agencies. companies,which have the opportunity to demonstrate their technologies to the officials, pay for operating costs andsponsor courses. EPA, USAID, and TDA provided some startup funds for the institute.
countries and in the newly industrializing sion focuses on official development assistancecountries; (ODA)2 provided by Japan, and to a lesser
■ estimates of environmental aid as a component extent Germany, and some other Europeanof development assistance; countries which are members of the Develop-
■ how the aid programs of several major donors ment Assistance Committee (DAC) of themay affect environmental exports. The discus- Organisation for Economic Cooperation and
2"ODA" is a term used by the Organisation for Economic Cooperation and Development (OECD) to identify one type of foreign assistance.
As used here and by OECD, it refers to aid given by a government chiefly to promote the recipient country’s economic development and welfarethat has a “grant element” of at least 25 percent. (A pure grant would have a grant element of 100 percent; a pure commercial loan, 0 percent).The term “aid,” as used in this paper, may denote either ODA or some broader category of foreign assistance depending on context.
4 I Development Assistance, Export Promotion, and Environmental Technology
Development (OECD).3 While there is somediscussion of U.S. aid practices, the discussionis illustrative rather than a comparison.
The background paper is not intended to be acomprehensive analysis of the many ways inwhich a donor’s aid could promote exports, or thedegree to which such export promotion is compat-ible with meeting recipients’ environmental anddevelopment goals.4 The export promoting ef-fects of aid depend on many factors, including(among others) the geographic emphasis; thekinds of projects supported (whether power plantsand sewage treatment plants or technical assist-ance for land management and training); the wayin which projects are planned and approved; andwhether formal policies or informal practicesmake it likely the aid will be spent in the donorcountry.
Whether export promotion is compatible withrecipients’ environmental and development goalsdepends as well on additional considerations.These include, among others, the extent to whicha country’s aid follows environmentally anddevelopmentally sound criteria; whether a recipi-ent country has the technical information andresources needed to make an appropriate choiceamong alternative technologies and approaches;and whether adequate provision is made fortraining, operation and maintenance after equip-ment is installed or projects are completed.
The complex administrative structure of aidand variations in aid missions further complicates
analysis. For example, a single developmentproject may be supported by several bilateral andmultilateral agencies and sources. Japan’s aidsystem involves four major policy-making agen-cies and two implementing agencies. Develop-ment assistance is only one of several missions forU.S. foreign assistance, and many specific objec-tives vie for the limited development assistanceproject budget of the U.S. Agency for Intern-ational Development (USAID), the primary U.S.ODA agency.
Major findings and conclusions from subse-quent chapters are summarized below.
AID FOR THE ENVIRONMENT(SEE CH. 2)
While precise estimates do not exist, develop-ing countries could need to invest amountsexceeding 1 percent of their gross domesticproducts (or over $50 billion annually by the endof this decade at projected growth rates) to factorenvironmental objectives into their developmentrequirements. 5 Most of these investments wouldneed to come from developing country sources, orfrom private investment and trade. But, as wasbrought out at the 1992 United Nations Confer-ence on Environment and Development (UNCED),developed country governments could catalyzedeveloping country environmental efforts byproviding technical assistance and help withproject financing. Additional aid could help
3 OECD members account for about 90 percent of OD& several Arab countries account for most of the rest. The DAC, established in 1961,provides aforumforOECD donors to discuss and coordinate their bilateral aid policies. Unless othemise stated, statistics on ODA in this paperare from the Organisation for Economic Cooperation and Development Development Cooperation 1992 Report (Piuis: OECD, December1992).
4 fro, env~omen~ ~d ~a= Ad ~d exports to ~tern Europe ad the former Soviet union me not adtissti h detail h W p-r.
AnotherOTA assessment on these subjects is in progress; its first report is U.S. Congress, OffIce of lkchnoIogyAssessmenL Energy-E&ciencyTechnoZogiesfor Central and Eastern Europe, OTA-E-562 (WashingtorL DC: U.S. Government Printing OffIce, May 1993). Environmentalexport issues with Mexico associated with the proposed North American Free Trade Agreement also are not addressed. For discussion ofU.S.-Mexican trade issues, see U.S. Congress, Oftlce of ‘lkchnology Assessment, U.S. -MexI”co Trade: Pulling Together or Pulling Apart?,OTA-IT13-545 (Washington, DC: U.S. Government Printing Offke, 1992).
5 Such a level of investment would be roughly comparable as a portion of GDP to investments made by several advanced industrial nationsfor environmental protection during the 1970s.
Chapter l-Summary I 5
developing countries address global issues suchas stratospheric ozone depletion, greenhouse gasemissions, and loss of biodiversity-issues notnecessarily perceived by developing countries asrequiring their independent action.6
Preliminary information suggests that donorsprovided over $2 billion in bilateral aid in 1991for environmental projects or projects with anenvironmental component as defined by thedonor. (Total aid in 1991 was $57 billion.)Environmentally-related aid and loans from multi-lateral sources exceeded $3 billion, so that thetotal in bilateral and multilateral assistance ex-ceeded $5 billion in 1991.
The two largest aid donors—Japan and theUnited States—probably provided over $600million each in bilateral aid for environmentalprojects or for projects with an environmentalcomponent; Germany provided about $500 mil-lion in direct environmental aid.7 Because com-mon definitions and baseline data from otheryears are not available, it is difficult to know howmuch of the donors’ environmental aid relabels orreplaces pre-existing programs or constitutes“new and additional resources. ”
Much of the environmental aid assists indeveloping human resources and institutionalcapacities for addressing environmental con-cerns. Such environmental capacity building in-cludes technical and financial help for countrystudies and strategies; for training, education, andpublic awareness campaigns; for environmentalmonitoring; and for developing ways to deviseand enforce regulations.8
Several donors help developing countries fi-nance infrastructure, including infrastructure thatcan contribute to environmental objectives. Ex-amples are basic infrastructure for public healthand environmental quality (e.g., water supply andwastewater treatment systems, sanitary landfills)and pollution control equipment for factories andpower plants. The United States devotes only asmall share of its bilateral aid to such capitalprojects (whether environmental or otherwise).
To date, donors have focused little aid onhelping developing countries adopt pollutionprevention approaches and cleaner productionprocesses or technologies. Even when they havegreater front-end costs than conventional pollu-tion control technologies, cleaner technologiescan be less costly in the long term because theyuse materials and energy more efficiently andproduce less waste for treatment. Pollution pre-vention has yet to receive much attention fromdevelopment agencies, although some UnitedNations activities are underway and a few bilat-eral technical assistance projects have recentlybeen initiated (including a major new project byUSAID).
ENVIRONMENTAL MARKETS(SEE CH. 2 AND APP. A)
The world market for environmental goods andservices was estimated by OECD to be $200billion in 1990. Developing countries now ac-count for only a small part of this market.However, several fast-growing developing coun-tries in Asia and Latin America may become
G Some multilateral aid for addressing global environmental issues is provided through the Global Environment Facility (GEF),administered by the World B~ the United Nations Environment PrograuL and the United Nations Development Programme. The GEF isnot discussed in detail in this paper.
T The estimates for the United States, Jap~ and Germany are subject to change. As is discussed in chapter 2, these donors were not amongthe nine DAC countries that had reported estimates of environmental aid to OECD by April 1993.
s For a review of DAC member activities up to 1990, see Development Cooperation 1990 Report, op. cit., pp. 71-82.
6 I Development Assistance, Export Promotion, and Environmental Technology
important markets for environmental goods andservices. This has happened in some newlyindustrializing countries which were themselvesconsidered developing countries a few years agog
Partly fueled by aid, environmental businessopportunities in the developing world are grow-ing. The six ASEAN nations currently representan environmental market of about $1.8 billion peryear.
10 The 1992 environmental market in sixLatin American countries is estimated to be $2.4billion. ll Some lower income countries, includ-ing India and China, are increasing their invest-ments in environmental protection and pollutioncontrol. China plans to spend $15 billion onenvironmental protection or projects that includerelated environmental improvements in its cur-rent five-year plan that ends in 1995.
Difficulties in obtaining financing could limitgrowth of developing country environmentalmarkets. In many developing countries, govern-ment funding for environmental protection willlikely remain sparse. Private or mixed public-private funding sources will be key to the growthof environmental markets. Financial packages—drawing on private funds, official assistance, andinnovative approaches for project financing--canbe the determiningg factor in contract awards. Theopening of various developing country econo-mies to greater foreign investment and the loosen-ing of state controls on energy, transport, andmanufacturing industries-including privatiza-tion-provide growing possibilities for environmen-tally favorable investment.
ENVIRONMENTAL AID INCOMPETITIVE CONTEXT(SEE CHS. 3-5)
While a few U.S. environmental firms operateworldwide, most are inexperienced in doingbusiness outside the United States. Many aresmall or medium-size businesses that have fo-cused exclusively on the U.S. market, the largestin the world. Some other aid donors—includingJapan, Germany, and several other Europeancountries-have large environmental industriesthat are actively seeking export opportunities.
Environmental aid, like aid in general, can helpdonor country firms sell goods and servicesabroad, adding to their domestic employment.Aid to help developing countries with environ-mental monitoring, standard setting and enforce-ment, and training can bring commercial benefitsto donor country firms while building developingcountry capabilities. Moreover, such technicalcooperation for projects can develop into lastingbusiness relationships that lead to future sales bydonor country firms after aid ends.
Donor country consultants or citizens oftenconduct project feasibility studies and engineer-ing studies. Industrialized country engineeringand construction firms are often involved inproject design and management, and may usepersonnel and engineering services headquar-tered in donor countries. Some environmentalprojects (such as wastewater treatment facilitiesand stack gas scrubbers) are very expensive tobuild. Although local materials (e.g., concrete,sheetmetal, pipes) and labor comprise a substan-
9 =Ples of me magni~de of tie MC env~~en~ markets ~clude about$11 biwon of environmental projects k ~WaI1’S CUlTt31t
Six-Year Development Plan and over $10 billion in South Korea’s 1991-95 investment plans. See American Institute in ‘IkiwaIL “Listing of~wan’s Six-YearDevelopment Plan Projects (partial List) & Status Report on Selected Major Projects,” August 1991, and Republic of Kor=Ministry of Environment White Paper 1990, 1991, as cited in ‘M Woo Lee, “Perspective of Environmental Industq in Kor+” paperpresented at GLOBE ’92, lhncouver, B.C., Cana@ Mar. 16-20, 1992.
10 Jom~ Menes, ~~g Assistant S-tary for Trade Developmen~ U.S. Department Of Commerce, ~stimonY Before tie ‘oWe
Committee on Merchant Marine and Fisheries, Subcommittee on Environment and Natural Resources, Feb. 25, 1993. ASEAN is theAssociation of South East Asian Nations, consisting of Branei, Indonesi& Malaysia, Philippines, Singapore, and Thailand.
11 uS~,E~vir~~~~t~l~~rket co~itionsa~B~”nessop po~unities in Kq~tinAmtican Countries, Business FOCUS SerieS, OCtObfZ
1992. The six countries are Argentina, Brazil, Chile, Colombia, Mexico, and Venezuela.
Chapter l--Summary I 7
tial portion of the project costs, environmentaland energy infrastructure projects may use im-ported equipment and technology transferredfrom developed countries, with some return ofproject monies to the donor country.
Most donor countries (including the UnitedStates) seek benefits from their aid for theirdomestic economies and firms. Many U.S. con-sultants and contractors benefit from U.S. projectaid, such as grants and technical assistance forinstitution building, education, and training. How-ever, the United States spends a high portion of itsaid on debt relief and “program assistance’ (aidnot linked to particular projects), which as dis-cussed in chapter 4 have limited potential toincrease exports. Moreover, since the 1970s,relatively little U.S. bilateral aid has gone to largecapital projects.12 Large capital projects oftenrequire imports of engineering services, equip-ment and technology, and can be conducive tobuilding long-term business relationships. Muchof the bilateral aid provided by Japan andGermany supports such capital projects.
To varying degrees, donors formally or infor-mally ‘‘tie’ the aid so that funds from the donorare used to purchase its goods and services (boxl-B). Tying of aid tends to increase exports,though it is difficult to say by how much; in somecases, the recipient country would have spent themoney in the donor country anyway.
Tied aid is sometimes offered not as a puregrant but with a loan component; assuming theloan is paid back, such “tied aid credits” enablemore exports for a given amount of net aidexpenditure. While tied aid credits can be apowerful export promotion tool, they can skewaid in ways that promote donor country commerc-
ial interests at the expense of recipient countrydevelopment and environmental interests. TheUnited States, which has used tied aid credits lessthan several other major donors, for many yearsnegotiated for tougher OECD rules to lessencommercial advantage from their use. The latestOECD rules, as amended by the Helsinki Packageadopted in December 1991, show promise inlimiting the commercial effect of tied aid credits;however, even these rules are likely to permitsubstantial use of tied aid credits for commercialadvantage. Some environmental projects may fallin this category (see ch. 4).
Questions are arising about how and whendonors should cooperate on the environment andhow and when they should act to foster businessopportunities for their domestic firms. Theseissues are especially conspicuous in the ongoingdebates about the respective trade, aid, andenvironmental policies of Japan and the UnitedStates—the largest donors of aid in general andenvironmental aid in particular. More cooperationbetween Japan and the United States on environ-mental issues could be a promising area ofcommon interest as the two countries begin toconsider possible new frameworks for restructur-ing their economic relationship.13 The commer-cial ramifications of such cooperation for envi-ronmental firms is not clear.
Environmental aid has emerged as a key focusfor Japan’s aid in the 1990s. Japan has announcedplans for major increases in its environmental aidin the next few years. The major Japanese aidagencies provide support for environmental re-search, training, and technical cooperation withdeveloping countries and financing for environ-mental infrastructure. In addition, Japan’s Minis-
IZ AS is discussed inchapter5, U.S. aid at one time placed major emphasis oncapitalprojects. This changed during the 1970s, inPw ~causeof concern that some large development projects supported by U.S. loans had not made a contribution to development goals (such as alleviationof poverty) commensurate with their size and had potential to contribute to corruption. For discussion of this history, see Curt ‘Ihrnoff and LarryQ. Newels, “Foreign Assistance and Commercial Interests: The Aid for Trade Debate,” CRSReport to Congress, May 24, 1993, p. 17, pp.22-26.
13 Such a possibili~ ~w ~s~ at the Apfl 19$)3 mee~g in w~~gton ~tween president Clinton ~d Japaese prime Minister ~Chi
Miyazawa. See Weekly Compilation Of Presidential Documents, Apr. 16, 1993, p. 598. For discussion of some of the issues, see Pat Murdo,“Cooperatio~ Conflict in U.S.-Japan Environmental Relations,” JEIReport, Japan Economic Institute, Washington DC, May 28, 1993.
8 Development Assistance, Export Promotion, and Environmental Technology
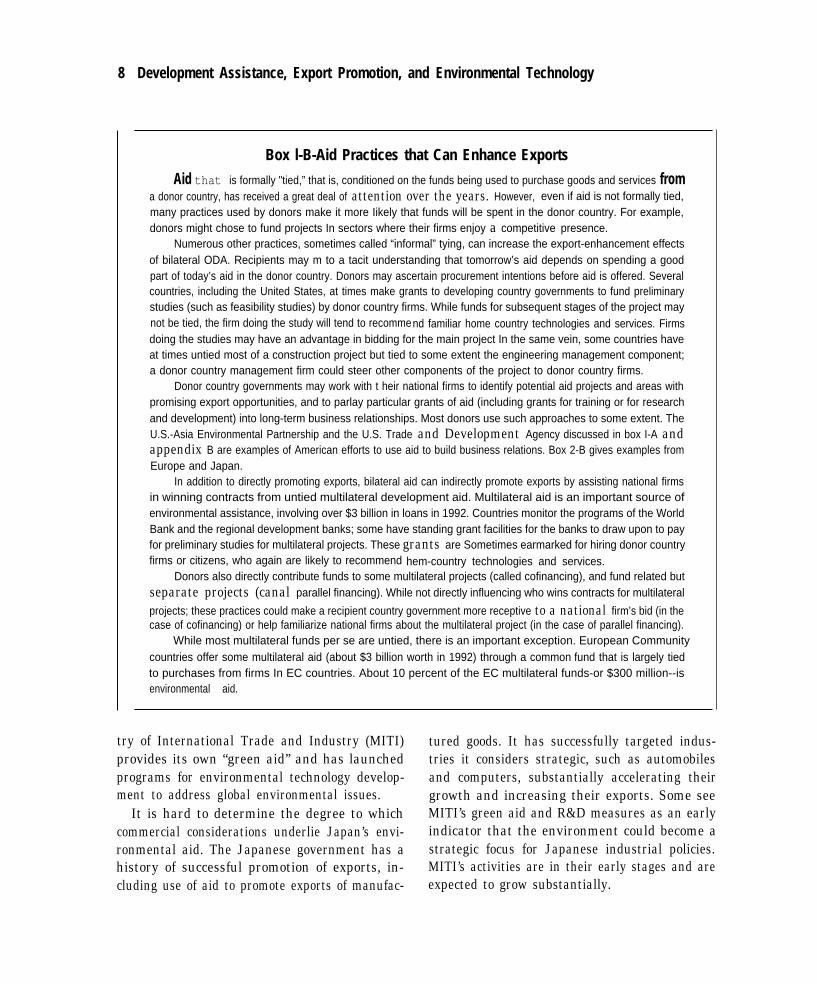
Box l-B-Aid Practices that Can Enhance Exports
Aid that is formally "tied,” that is, conditioned on the funds being used to purchase goods and services froma donor country, has received a great deal of attention over the years. However, even if aid is not formally tied,many practices used by donors make it more Iikely that funds will be spent in the donor country. For example,donors might chose to fund projects In sectors where their firms enjoy a competitive presence.
Numerous other practices, sometimes called “informal” tying, can increase the export-enhancement effectsof bilateral ODA. Recipients may m to a tacit understanding that tomorrow’s aid depends on spending a goodpart of today’s aid in the donor country. Donors may ascertain procurement intentions before aid is offered. Severalcountries, including the United States, at times make grants to developing country governments to fund preliminarystudies (such as feasibility studies) by donor country firms. While funds for subsequent stages of the project maynot be tied, the firm doing the study will tend to recommend familiar home country technologies and services. Firmsdoing the studies may have an advantage in bidding for the main project In the same vein, some countries haveat times untied most of a construction project but tied to some extent the engineering management component;a donor country management firm could steer other components of the project to donor country firms.
Donor country governments may work with t heir national firms to identify potential aid projects and areas withpromising export opportunities, and to parlay particular grants of aid (including grants for training or for researchand development) into long-term business relationships. Most donors use such approaches to some extent. TheU.S.-Asia Environmental Partnership and the U.S. Trade and Development Agency discussed in box I-A andappendix B are examples of American efforts to use aid to build business relations. Box 2-B gives examples fromEurope and Japan.
In addition to directly promoting exports, bilateral aid can indirectly promote exports by assisting national firmsin winning contracts from untied multilateral development aid. Multilateral aid is an important source ofenvironmental assistance, involving over $3 billion in loans in 1992. Countries monitor the programs of the WorldBank and the regional development banks; some have standing grant facilities for the banks to draw upon to payfor preliminary studies for multilateral projects. These grants are Sometimes earmarked for hiring donor countryfirms or citizens, who again are likely to recommend hem-country technologies and services.
Donors also directly contribute funds to some multilateral projects (called cofinancing), and fund related butseparate projects (canal parallel financing). While not directly influencing who wins contracts for multilateral
projects; these practices could make a recipient country government more receptive to a national firm’s bid (in thecase of cofinancing) or help familiarize national firms about the multilateral project (in the case of parallel financing).
While most multilateral funds per se are untied, there is an important exception. European Communitycountries offer some multilateral aid (about $3 billion worth in 1992) through a common fund that is largely tiedto purchases from firms In EC countries. About 10 percent of the EC multilateral funds-or $300 million--isenvironmental aid.
try of International Trade and Industry (MITI) tured goods. It has successfully targeted indus-provides its own “green aid” and has launchedprograms for environmental technology develop-ment to address global environmental issues.
It is hard to determine the degree to whichcommercial considerations underlie Japan’s envi-ronmental aid. The Japanese government has ahistory of successful promotion of exports, in-cluding use of aid to promote exports of manufac-
tries it considers strategic, such as automobilesand computers, substantially accelerating theirgrowth and increasing their exports. Some seeMITI’s green aid and R&D measures as an earlyindicator that the environment could become astrategic focus for Japanese industrial policies.MITI’s activities are in their early stages and areexpected to grow substantially.
Chapter l-Summary I 9
However, Japan’s overall aid program is evolv-ing. Japan has, at least officially, been takingsteps to open up more of its ODA to participationby non-Japanese firms. A recent U.S. ExecutiveBranch report to Congress, coordinated by theState Department, expressed cautious optimismthat U.S. (and other foreign) firms “will be ableto increase their participation in Japan’s ODAcontracts over the next few years. ’14
Whether “cautious optimism” is in order inthe case of environmental aid remains to be seen.Japan appears to be using its environmental aidboth as a showcase and as a testing ground fornew aid approaches. Japan’s stated interest ininternational environmental cooperation may sug-gest receptivity to participation by U.S. firms. Tobenefit from opportunities arising from Japaneseaid, U.S. firms normally would have to establisha sustained presence in Japan and make persistentefforts to understand Japan’s ODA system; fewU.S. firms to date have made such efforts. SomeU.S. environmental firms could be in a position tobenefit by focusing on areas where they providesuperior goods or services pertinent to Japaneseaid objectives.
Even if some U.S. firms might benefit fromJapan’s aid, the greater commercial benefitsflowing to Japanese firms could have long-termramifications for the competitiveness of U.S.environmental firms. Japan’s environmental aid,like its aid overall, is focused on East Asia--aregion with promising potential to emerge as animportant environmental market independent ofaid. Japanese firms are already more establishedin East Asian developing countries than the firmsof any other industrialized country. With its
emphasis on capital projects, Japan’s ODA canhelp build long-term commercial ties and rela-tionships for its firms that may last after aid ends.While some recent U.S. initiatives such as theU.S.-Asia Environmental Partnership (see boxl-A) could help, U.S. firms seeking to compete inthe East Asian market may face an uphill battle.
CURRENT POLICY CONTEXT(SEE CH. 5 AND APP. B)
The appropriate role of U.S. aid in encouragingexports of U.S. goods and services has been asubject of continuing debate.15 Promotion ofexports of U.S. manufactured goods has not beena primary thrust of U.S. development aid. TheU.S. Department of Commerce and several othergovernment agencies administer a number ofprograms to promote and finance U.S. exports;these programs (discussed in appendix B) arelimited in scope, especially for manufacturedgoods. Through enactment of several 1992 laws,such as the Export Enhancement Act, the Na-tional Energy Policy Act, and the Aid, Trade andCompetitiveness Act, Congress authorized Fed-eral agencies to place more emphasis on exportpromotion (including environmental export pro-motion). l6 The degree of emphasis will depend, ofcourse, on funding and commitment to imple-mentation. These and other actions, such as theUnited States-Asia Environmental Partnershiplaunched by the Bush Administration in January1992, are discussed in box l-A.
Some of these measures authorize a greaterUSAID role in fostering U.S. exports, especiallyfor environmental and renewable energy or energy-efficiency technologies. Whether U.S. aid should
14 u-s. D~~ent of Stite ~ ~orfition ~th o~er ~mutive branch agencies and dep~~ts in respom to a request by the hkd
States Semte, “Japan’s Foreign Aid: Program Trends and U.S. Business Opportunities,” Feb. 18, 1993, mirneo., p. 6.15 For a more de~ed discwsion of issues and legislative propos~s, s= cm Tarnoff md Larry Q. Newels, “Foreign AsSiStanM and
Commercial Interests: The Aid for Trade Debate,” CRSReportfor Congress, U.S. Library of Congress Congressional Research Service, May24, 1993.
16 ~ditio~ eXpOII prOmOtiOn m
easures have been introduced in the 103d Congress. Proposala that focus speciilca.lly on environmentalexports include H.R. 1830, the proposed Global Environmental Cleanup Act; H.R. 2112, the proposed National Environmental TradeDevelopment Act, introduced on May 12, 1993; S. 978, the proposed National Environmental ‘lkchnology Act and S. 979, the proposedGreentech Jobs Initiative Act.
10 I Development Assistance, Export Promotion, and Environmental Technology
take on a more commercial orientation continuesto be debated in the development community. Asa practical matter, the efficacy of using aidprojects to promote exports is ultimately limitedby aid budgets. While the United States in someyears may still be the largest overall aid donor, itsODA budget has declined as a portion of GNPover time, and is now well below the DACaverage. Moreover, development assistancethat part of the aid budget most relevant to directpromotion of environmental exports--counts foronly part of the total U.S. foreign assistancebudget.
Some question whether there is any need fordirect government action to promote exportsthrough aid. For example, a 1992 policy reviewby USAID states that since 1985 U.S. exports todeveloping countries have grown faster than thatof major competitors.
17 (Data for particular sectorsmay differ; the USAID policy review did notdiscuss whether environmental exports shared inthis strong growth in exports to developingcountries.) Instead of direct action to promoteexports, the USAID review saw continuing ef-forts to encourage developing countries to openmarkets and make other policy reforms as a betterway to encourage exports, albeit indirectly.
Of course, market-opening approaches wouldnot necessarily promote U.S. exports more thanexports from other industrialized countries. And,despite the recent progress noted by USAID, theUnited States was still behind the EC and farbehind Japan in 1990 merchandise exports todeveloping countries as a percentage of GNP.18
There is also no guarantee that the United Stateswill maintain its current market shares if othercountries pursue aid practices that promote ex-
ports to a greater extent than the United States.While the precise export promotion effect is hardto determine, such practices are widely used byother major donors, many of which also providesubstantial non-aid-related export promotion formanufactured goods.19 In principle, it might bepreferable for all donors to agree to change thesepractices-for example, to forgo tying their aid,letting development priorities and the marketdetermine where aid money is spent. However,such an agreement is not likely to be achieved anytime soon; and for the United States alone to forgouse of such practices could mean U.S. exportswould suffer in time.
Opinions are divided about whether orientingU.S. aid more toward direct promotion of envi-ronmental exports would compromise or furtherenvironmental protection and development goals.There is a similar division of opinion about the aidpractices of other countries.
Supporters of closer links might hold that afocus on exports could further the goals ofeconomic development and environmental pro-tection. Promotion of exports may create astronger constituency for aid in donor countries,making continuation of aid more likely. Linkagesbetween aid and exports also might encouragecontinuing business relationships between donorcountry firms and developing countries—relationships that could be conducive for transferof environmental technology and practices. Also,involvement of donor country firms in aid plan-ning might help screen out some projects that areill-founded from a business sense. The prospect ofexports to developing country markets may en-courage donors to support research and develop-ment to adapt environmental technologies more
17 T’heUSAIDr~~chis discussed in “Aid, Trade and Development: Implications of the Background Papers for the Trade pOficY WorkingGroup,” mimeo., June 1992.
18 The Pmen~ges me: United S@tes, 2.4; EC, 2.8; and Jap~ 3.9. These figures are derived from USAID, “U.S. Trade Trends ~dlssu~,”mimeo., June 1992, p. 11, table 2 (presenting data on 1985 and 1990 merchandise exports to developing countries), and U.S. Department ofCommerce, Statistical Abstract of the United States 1992, p. 830, table 1370 (1990 GNP data).
19 For ~mple, ~ is d~us~ ~ app. B ~d ~1 & ~dressed more fily in ~ f~ report for m msessment, U.S. gov ernment-assistedexport fmcing appears more limited than that in Japan and several European countries; private export financing by U.S. banks is also verylimited.

Chapter 1--Summary I 11
specifically to developing country needs, and tosupport training. It also could encourage moreeffort to evaluate the performance of environ-mental technologies, either by individual coun-tries or possibly through evaluation activitiesundertaken with multilateral support.
Others contend that the use of aid for exportpromotion can compromise both environmentaland developmental goals. They point to increasedcosts for purchases restricted to bidding onlyamong donor country firms. This increases thecosts of capital projects and reduces the amountof real aid.20 A capital projects orientation coulddiminish direct aid for basic human needs, such asfood, medicine, or reducing poverty. At least forsome environmental projects, the division be-tween capital projects and basic human needs isnot clear; for example, capital projects may beneeded to assure safe drinking water and to treatwaste in order to protect against health threats.However, overemphasis on export promotioncould bias projects toward overly expensiveinfrastructure, with more sophisticated technol-ogy than needed to meet basic human needs. Suchtechnology can be inappropriate to a country’slevel of development, draining resources frommore pressing problems, and can create depend-ency on developed countries. Furthermore, ex-pensive capital projects paid by soft loans couldaggravate developing country debt burdens orbalance of payments problems. These financialdifficulties could reduce a country’s capacity tobuy environmental goods and services withoutaid, and could encourage mismanagement of theenvironment. 21
While use of development assistance to pro-mote exports might in some cases hamper envi-ronmental or developmental goals, this result isnot inevitable. It would be possible to pursue
export promotion with safeguards to preventcompromise of environmental or developmentalgoals. Under such an approach, projects, howeverdesirable from an export promotion standpoint,would still need to meet rigorous environmentaland developmental standards. Some export op-portunities might be lost, but it should be possibleto find fully satisfactory projects.
Several steps could be taken to screen projectsfor adverse effects, such as might result from useof inappropriate technology, whether or notexport promotion is the goal. Some of theseprocedures have begun to be used by donors.Among those pertinent to the environment:
1. Environmental studies to identify real needsand priorities: Donors increasingly fund develop-ing country environmental studies, environmentalprofiles, and conservation strategies. DAC hasnoted a need for coordination and use of “goodpractices” in these assessments. USAID’s ap-proach is worthy of note: increasingly, develop-ing country organizations undertake the studies,thus building local capabilities for environmentalanalysis. Additional measures could be taken toassure opportunity for public review and inputfrom nongovernmental organizations in develop-ing and donor countries.
2. Use of guidelines in project reviews: Consci-entious efforts by donors to see that guidelines areapplied could reduce transfers of inappropriatetechnology. Germany, for example, makes spe-cial efforts to assure that developing countrieshave trained personnel available before capitalprojects are funded. Public export financingagencies in the United States and in several otherdonor countries are developing and in some casesimplementing environmental guidelines for deci-sionmakers. So are multilateral lending institu-
ZO One survey of went empirical studies concludes that “an average of 15 to 30 percent’ increased costs is the “best aggregate estimate.”Catrinus J. Jepma, The Z’jing of Aid (Paris: OECD, 1992), p. 58.
21 Developing countries Withheavyburdens on their balance of payments and substantial foreign debt are more likely to overuse (rather thansustainably manage) their natural resource base to gain foreign exchange. Overharvesting of otherwise renewable resources such as timber andfisheries are two examples.
12 I Development Assistance, Export Promotion, and Environmental Technology
tions. Some private lending institutions also aredeveloping environmental criteria.
3. Evaluation of technologies: Better informa-tion about the performance of environmentaltechnologies could help donors assess how proj-ects with export potential would mesh withrecipient countries’ needs. It also could helprecipient countries evaluate alternatives. Someevaluation programs to serve domestic objectivesin donor countries exist, including several smallprograms administered by the U.S. Environ-mental Protection Agency .22 Such evaluationprograms are likely to provide more objectiveinformation than would be available from firmswith an interest in selling their own technology.Technology evaluations might be undertakenmultilaterally, under the auspices of an agencysuch as the United Nations Environment Pro-gramme or the United Nations DevelopmentProgramme.
In many cases, developing countries will findit preferable to use locally available technology,or to adapt developed country technologies tolocal needs. Some donors are working to custom-ize developed country enviromnental technologyto the specific needs of developing countries (seediscussion of Japan’s Green Aid Plan inch. 5).Regional centers in developing countries mightbe tapped to facilitate such adaptations, as well asto address training needs.23
4. Provision for operation and maintenance:Donors might also screen projects with export
I potential to assure that adequate provision isI
made for operation and maintenance of environ-
mental infrastructure once construction is over.Projects often fall into disrepair because ofinadequate budgeting for maintenance or spareparts procurement. Skimping on training fordeveloping country personnel is often a short-coming in development contracts. The morecomplex the technology, the greater the need forhighly trained personnel to operate or maintainthe equipment. Use of aid to support educationand training can serve the environmental anddevelopmental needs of developing countries andexport promotion objectives.
Through such measures, donor countries couldhelp strengthen developing country decisionmak-ing capabilities, while at the same time providingopportunities for their firms to develop commer-cial relationships. With stronger technical capa-bilities and better information, decisionmakers indeveloping countries will be better able to makeinformed choices about available options. Addi-tional steps by donors, such as effective imple-mentation of the environmental guidelines thatare slowly being incorporated into the policies ofnational and multilateral lending institutions, alsocould help provide an appropriate balance be-tween export promotion and environmental ordevelopmental goals. Such efforts may in timeresult in more congruence among aid policies,environmental objectives, and development ob-jectives while contributing to improved economicconditions in developing countries that will beessential for healthy long-term trading relation-ships.
= ~e= ~clude tie Su_d ~ov~ve ~~ology Ev~~tion ~o~ tie WSSte R~uction innovative -Ologies EvaluationII Program and the Muuicipsl Innovative ‘lkchnology Evaluation Rograms. An EPA-sponsored organization the National EUViI’OIMIRJIti
3kchnologies Application CorporatioXL has evaluated bioremed.iation agents related to oil spills.I123 Fordi.s~ssionof ~t~~ role of r@o~Wn~ foremr~-efflci~t whology,s= “fi~vely A&tihdoping COUtryFOCUS
for’lkchnologyCooperationRelated to Global Climate Cbsnge,” Conference Statement, Bell@o, Italy, Oct. 28-Nov. 1,1991 (mimeo., Energyand Climate Program of the World Wildlife Fund, Wasbingtoq DC).
DevelopingCountry
EnvironmentalNeeds and
Aid 2
R ecognition is growing that developing countries may notbe able to achieve their development objectives withoutalso addressing their serious environmental problems.This chapter briefly reviews developing country envi-
ronmental problems and their environmental investment needs(as characterized by the World Bank and the United NationsConference on Environment and Development). It also discussesthe environmental market in developing countries, and reviewsestimates of environmental aid as a component of OfficialDevelopment Assistance (ODA).
DEVELOPING WORLD ENVIRONMENTAL PROBLEMSDeveloping country environmental problems are serious and
wide ranging. Some arise from poverty and the overuse ofresources that can result from poverty. Some result fromdevelopment projects and industrialization undertaken with toolittle concern for the environment. Some result from theenvironmental pressures of urbanization and population growth.Some reflect global concerns about stratospheric ozone deple-tion, greenhouse gas emissions, and biodiversity.
The economic and human costs of inadequate environmentalinfrastructure or environmental management in developingcountries are vast. According to the World Bank, two millionpeople, mostly children, die each year from diarreheal diseasesspread through contaminated water. Between 300,000 and700,000 premature deaths each year could be averted indeveloping countries if concentrations of dust, soot, and othersuspended particulate matter from air pollution could be broughtdown to levels considered safe by the World Health Organiza-tion. Although only recently receiving attention from research-
13
14 I Development Assistance, Export Promotion, and Environmental Technology
ers, exposure to indoor air pollution may poseeven greater health risks. Solid waste collectionand disposal is inadequate in the cities of manydeveloping countries; the common alternative ofdumping refuse in waterways or public spaces canincrease the likelihood of exposure to diseasecarrying organisms. Health risks and environ-mental contamination from hazardous waste canalso be a problem, especially where industrialgrowth is rapid.l
Serious damage from pollution and overuse ofrenewable resources also challenge the develop-ing world’s fisheries, agriculture, and forests,with significant adverse effects for productivityand biological diversity. Studies in several devel-oping countries have found that soil erosionreduced economic output by amounts equal tobetween 0.5 and 1.5 percent of GDP-offsettinga significant amount of annual growth (as meas-ured by conventional means).2 While per capitameasures of resource use and environmentalimpact are low compared with that of developedcountries, the fast climb in developing countrypopulations and the drive to increase incomeshave prompted widespread concern about sus-tainable levels of growth.
Estimates of the investments needed to addressthe environmental needs of developing countriesare imprecise. Often, environmental needs andbasic development requirements overlap. TheWorld Bank estimates that as little as 2 percent ofsewage in Latin America is treated. Worldwide,
I 1.7 billion people lack access to sanitationservices; even in urban areas, the number of
1 people without such services grew by more than
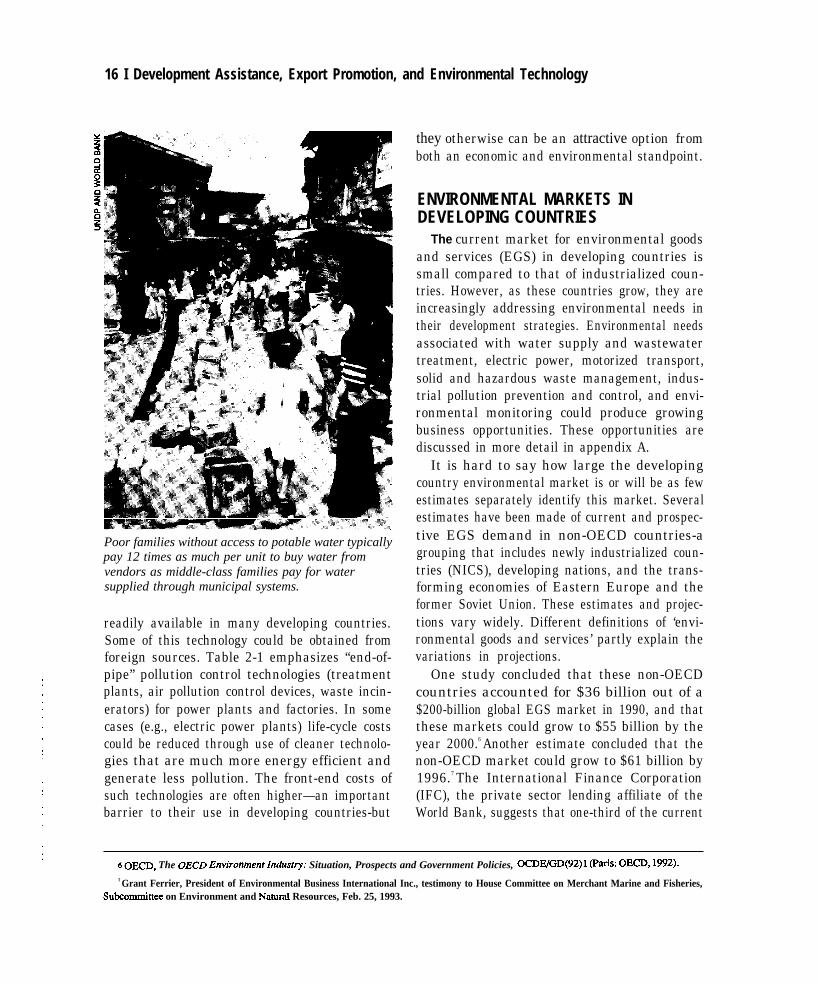
70 million in the 1980s. Roughly 170 millionpeople in urban areas lack nearby access topotable water; in rural areas an estimated 855million people lack safe water.3 These familiesoften must buy water from vendors, paying 4 to100 times more per unit of water (with a medianof 12 times more) than families connected tomunicipal water supplies.4
The World Bank, in an effort to put environ-mental protection costs in context, identified asample of benefits that might arise if $75 billionper year (about 1.4 percent of the projected GDPin developing countries in the year 2000) wereinvested in developing countries for environ-mental improvement.5 As shown in table 2-1,these benefits could be substantial. Among them:reducing child mortality by 3 million per year;reductions in respiratory diseases; and stabilizingworld population at a lower level than wouldotherwise be expected. The costs, according to theBank, might seem large in absolute terms, butwould be small in relation to added incomesproduced from “good economic management.”Moreover, many of the lower cost items (e.g.,family planning and costs associated with in-creasing education for girls) could have a highpay-off. The examples are illustrative; the Bankdid not include programs to, as examples, restoredegraded areas or conduct remedial cleanup ofalready polluted sites.
Some of the environmental programs listed intable 2-1, such as reducing emissions from powerplants and industry, would require more expen-sive or more sophisticated technology than is
1 Examples cited are from the World B* Development andtheEnvironment: WorldDevelopment Report 1992 (Oxford University Press,1992), pp. 44-63.
2 Ibid., p. 56.
s Ibid., p. 47.
4 As cited in Johu Briscoq “when the Cup is Half Full,” Environment, VO1. 35, No. 4, WY 1993, P.1O.
S Such investment levels would be comparable as a portion of GDP to commitments made by several advanced industrial economies dwingthe 1970s, whenenvironmental protection emerged as an important priority in these countries. The $75 billion figure cited above assumes rapideconomic growth rates. If developing world growth occurred at the rate prevailing in the 1980s, and if countries committed only 1 percent ofGDP to the environment $50 billion in additional investments would be requhed.

Chapter 2–Developing Country Environmental Needs and Aid I 15
Table 2-l—Estimated Costs and Long-Term Benefits of Selected Environmental Programsin Developing Countries
Additional investment in year 2000 (in 1990 dollars)
As aBillions As a percentage of
of dollars percentage of GDP growth,Program per year GDP in 2000a 1990-2000a Long-term benefits
Increased investment in water 10.0 0.2 0.5and sanitation.b
Controlling particulate matter 2.0(PM) emissions from coat-firedpower stations.
Reducing acid deposition from 5.0new coal-fired stations.c
Changing to unleaded fuels; con- 10.0trols on the main pollutants fromvehicies. c
Reducing emissions, effluents, 10.0-15.0and wastes from industry.
Soil conservation and afforest- 15.0-20.0ation, including extension andtraining.
Additional resources for agricul-tural and forestry research, inrelation to projected levels, andfor resource surveys.
Family planning (incremental costsof an expanded program to sta-bilize future world population at10 billion rather than 12.5 billion).
Increasing prirnary and secondaryeducation for girls so that asmany girls as boys enroll in pri-mary and secondary educationin low-income countries.
5.0
7.0
2.5
0.04
0.1
0.2
0.1
0.25
0.5
0.2-0.3 0.5-0.7
0.3-0.4
0.1
0.1
0.05
0.7-1.0
0.2
0.3
0.1
Over 2 billion more people provided withservice. Major labor savings and health andproductivity benefits. Child mortality re-duced by more than 3 million per year.
PM emissions virtually eliminated. Largereductions in respiratory illnesses and aciddeposition, and improvements in amenity.
Elimination of pollution from lead; morethan 90 percent reductions in other pollut-ants, with improvements in health andamenity.
Appreciable reductions in levels of ambientpollution, and improvements in health andamenity, despite rapid industrial growth.Low-waste processes often a source ofcost savings for industry.
Improvements in yields and productivity ofagriculture and forests, which increase theeconomic returns to investment. Lowerpressures on natural forests. All areaseventually brought under sustainable formsof cultivation and pasture.
Could contribute to proportionately lessenvironmental damage resulting from natu-ral resource use, consumption, and waste.
The World Bank maintains that improvingeducation for girls should be seen as acritical developing world environmental pri-ority; with the education, women are likelyto have smaller families, and to managenatural resources (a critical role of manywomen in developing countries) more pro-ductively.
a The GDP of developing countries in 1990 was $3.4 trillion, and it is here projected to rise to $5.4 trillion by 2000 (in 1990 prices). The projectedGDP growth rate is 4.7percent a year, significantly higher than historic rates except in Asia. If the GDP growth rate for the 1980s of 3.4 percentcontinued in the 1990s, developing country GDP in 2000 would total $4.7 trillion.
b Current developing world spending on water and sanitation was estimated by the World Bank to be $15-$20 billion per year.C Costs may eventually be lowered by the use of new combustion technologies and other measures discussed in ch. 6.
SOURCE: Taken with some modifications from the World Bank, Development and the Environment: World Development Report 7992 (Oxford:Oxford University Press, May 1992), p. 174, table 9.1.
16 I Development Assistance, Export Promotion, and Environmental Technology
Poor families without access to potable water typicallypay 12 times as much per unit to buy water fromvendors as middle-class families pay for watersupplied through municipal systems.
readily available in many developing countries.Some of this technology could be obtained fromforeign sources. Table 2-1 emphasizes “end-of-pipe” pollution control technologies (treatmentplants, air pollution control devices, waste incin-erators) for power plants and factories. In somecases (e.g., electric power plants) life-cycle costscould be reduced through use of cleaner technolo-gies that are much more energy efficient andgenerate less pollution. The front-end costs ofsuch technologies are often higher—an importantbarrier to their use in developing countries-but
they otherwise can be an attractive option fromboth an economic and environmental standpoint.
ENVIRONMENTAL MARKETS INDEVELOPING COUNTRIES
The current market for environmental goodsand services (EGS) in developing countries issmall compared to that of industrialized coun-tries. However, as these countries grow, they areincreasingly addressing environmental needs intheir development strategies. Environmental needsassociated with water supply and wastewatertreatment, electric power, motorized transport,solid and hazardous waste management, indus-trial pollution prevention and control, and envi-ronmental monitoring could produce growingbusiness opportunities. These opportunities arediscussed in more detail in appendix A.
It is hard to say how large the developingcountry environmental market is or will be as fewestimates separately identify this market. Severalestimates have been made of current and prospec-tive EGS demand in non-OECD countries-agrouping that includes newly industrialized coun-tries (NICS), developing nations, and the trans-forming economies of Eastern Europe and theformer Soviet Union. These estimates and projec-tions vary widely. Different definitions of ‘envi-ronmental goods and services’ partly explain thevariations in projections.
One study concluded that these non-OECDcountries accounted for $36 billion out of a$200-billion global EGS market in 1990, and thatthese markets could grow to $55 billion by theyear 2000.6 Another estimate concluded that thenon-OECD market could grow to $61 billion by1996.7 The International Finance Corporation(IFC), the private sector lending affiliate of theWorld Bank, suggests that one-third of the current
G OECD, The OECD Enviro~entlnd~t~: Situation, Prospects and Government Policies, OCDE/GW92)l &fiS: OE~, 1992).7 Grant Ferrier, President of Environmental Business International Inc., testimony to House Committee on Merchant Marine and Fisheries,
Subeornmittee on Environment and Natuxal Resources, Feb. 25, 1993.
Chapter 2–Developing Country Environmental Needs and Aid I 17
global environmental market is found outside theUnited States, Canada, Europe, and Japan.8 TheIFC believes the world market (which it estimatedto be $300 billion) could grow to $600 billion bythe year 2000.
Environmental business opportunities in somedeveloping countries and regions are alreadyappreciable. Some of these countries could be-come important new markets for environmentaltechnologies and services, as has been the casewith some newly industrialized countries thatwere considered developing countries a few yearsago. Environmental markets are growing in therelatively prosperous, fast-growing countries inEast Asia and Latin America, such as Mexico,Brazil, Chile, Malaysia, and Thailand. One studyestimated the annual environmental market in thesix ASEAN nations to be $1.8 billion.9 Anotherstudy estimated the 1992 environmental marketin six Latin American countries to be $2.4billion. 10 Opportunities are also growing in somelower-income countries, including India and China.China, for example, plans 80 billion yuan ($15billion) for expenditures in environmental proj-ects or projects with an environmental componentin its current five-year plan that ends in 1995.11
Lack of financing constrains growth of somedeveloping country environmental markets, how-ever. Financial packages—private funds, officialassistance and credits, and innovative projectfinancing approaches-can be the determiningfactor in contract awards. The opening of variousdeveloping country economies to greater foreigninvestment and the loosening of state controls on
energy, transport, and manufacturing industries—including privatization--could provide opportu-nities for environmentally favorable investment.
Some innovative approaches for financinginfrastructure projects have potential to easefinancial strains on developing country agencieswhile improving project performance.12 In oneapproach, called build-operate-transfer (BOT), aprivate company builds and operates a project,such as a water treatment facility, power plant, orroad, until it achieves an agreed-upon payback. Atthat time, the facility is turned over to the localauthority. Payments to the private company maycome from revenues generated by the project(such as water fees) or from government pay-ments. Financing is often the responsibility of theprivate developer, who also may assume the risksof construction cost overruns or delays, andinefficient operation. The developer thus hasmore incentive to build and operate the facilityefficiently than would be the case with ‘turnkey’projects transferred upon completion. A trainingcomponent may be included in the project.However, financial risks for developers andinvestors can be substantial and the cost-effectiveness of the approach has been ques-tioned. The BOT approach is new and evolving,with little track record to date.
Firms in the United States, Japan, Germany,the United Kingdom, France, Scandinavia, andother industrialized countries compete for envi-ronmental projects in developing country mar-kets. Some firms have production operations orsubsidiaries in several OECD countries. Environ-
8 International Fiuance Corporation, Znvesting in the Environment: Business Opportunities in Developing Countries (WashingtorL DC: TheWorld Bank and the IFC, 1992), p. iii.
g JorMthan Menes, Acting Assistant Secretary for Trade Developmen~ U.S. Department of Commerce, ttitimony kfore the HouseCommittee on Merchant Marine and Fisheries, Subcommittee on Environment and Natural Resources, Feb. 25, 1993. ASEAN is theAssociation of South East Asian Nations, consisting of Brunei, Indonesi~ Malays@ Philippines, Singapore, and Thailand.
10 US~,EnviromntalMarket Co~itiom ~& BWiness Oppo~um”ties inKey~tinA~~can Coun~ies, Bminess FOCUS Series, &tOber
1992. The six countries are Argentina, Brazil, Chile, Colomb~ Mexico, and Venezuela.
11 AS cited in Foreign Broadcast hformXion Service, “China Battles Hard to Clean Up Environment” Erwironmenta/Zssues, Nov. 12,1992, p. 6.
12 These approaches arediscmsd inIntemtiotiF~ceCorpo~tioq Investing in theEnvironrnent: Bu.n”ness OpportunitiesIn DevelopingCoz4ntrz”es, op. cit., box 1, p. 14.
18 I Development Assistance, Export Promotion,
mental infrastructure projects often involve muchlocally or regionally provided labor and materials(e.g., construction labor, cement or other low-value materials, and local assembly); in suchprojects, prospects for industrial country exportscan be limited to project management and rela-tively sophisticated goods and services.
The NICS and many developing nations are byno means wholly dependent on EGS imports; insome cases local firms produce major portions oftheir EGS market needs. The technical capabili-ties of environmental industries in such countriesas Singapore, South Korea, Taiwan, Mexico,Brazil, India, and China are expanding. In fact,environmental goods are sometimes exported bythese countries--often at lower prices than U.S.,European, or Japanese firms can offer. At thesame time, environmental firms headquartered inOECD countries are finding opportunities forjoint ventures and licensing with local andregional companies.
As their environmental investments grow, de-cisionmakers in developing countries will need tochoose among competing technologies. Somedeveloping nations may be reluctant to useequipment that does not meet stringent U. S., EC,or Japanese environmental standards. Yet, themost advanced technology and equipment fromthe industrialized nations may not be affordable.Even if the price is acceptable, other considerations-such as lack of technically trained personnel,limited resources for maintenance, and inade-quate support infrastructure--may make advancedequipment inappropriate.
Under such circumstances, less expensive butreliable equipment could be a better choice thanstate-of-art facilities. The appropriate mix oftechnologies in a given country will depend on
and Environmental Technology
the types and sources of pollution, physicalfactors such as climate and geology, availabilityof capital, and technical and managerial capabili-ties. In some cases, it makes sense to modifytechnologies to circumstances in developing coun-tries. For instance, Japan is building lower cost(and lower pollution removal efficiency) flue-gasdesulfurization equipment for Asian markets13
and a number of U.S. firms have lower cost, lowerefficiency air pollution control technologies avail-able.
Developing country decisionmakers also maybe able to keep costs below what they otherwisemight be through use of “pollution prevention”and cleaner production processes and technolo-gies to complement end-of-pipe approaches (seebox 2-A.) Pollution prevention cannot eliminatethe need for investments in conventional pollu-tion control and equipment or of treatmentfacilities. But, when practiced effectively, it canlead to savings-in some cases, appreciablesavings-relative to what otherwise would berequired. Thus, it can contribute to sustainabledevelopment objectives and could reduce longerterm costs for environmental protection.
ODA AND THE ENVIRONMENTODA has long been an important source of
funds for developing countries. In 1991, ODAamounted to nearly $57 billion-roughly twice asmuch as foreign direct investment in developingcountries. 14 About $42 billion of the ODA wasbilateral; $14 billion was multilateral.15 ODAserves a variety of purposes, such as meetingbasic human needs, and helping lower incomecountries to build or rebuild economic infrastruc-ture. The United States and Japan are the largestdonors in absolute terms, although other countries
13 Inter~tionalEnw”roment Reporter, “Japanto Work With China In Developing Cheap Desulfurization Units For Plants,’ July 29,1992,p. 497; and Kawasaki Heavy Industries, Ltd. information booklet, 1992.
14 OECD, De@Op~nt Cooperation 1992 Report (Paris: OECD, 1992), P. 78.!
15 M~~at@ aid is provided by a combination of countries aad sources, thnlugh Org@Z8 tions such as the World Bank or U.N. agencies.Bilateral aid flows from ordy one donor country government. Private development assistance, such as from religious or wildlife conservationgroups, is unofficial and generally operates outside the purview of government.
Chapter 2–Developing Country Environmental Needs and Aid 19
Box 2-A-Assistance For Pollution Prevention and Cleaner Production
Pollution prevention-the practice of first considering ways to prevent generation of pollution or waste, thusreducing the need for subsequent treament or disposal--accounts for a small but growing part of efforts to dealwith industrial pollution and waste in industrial ized countries.1 While controlling or treating waste and pollutionthrough remedial measures or end-of-pipe controls is often essential, pollution prevention In many cases is a lessexpensive and environmentally preferable option.
As pollution prevention has become more prominent, a few industrial ized countries have begun to support
pollution prevention and cleaner production activities through their development assistance. A modest level ofsupport for bilateral and multilateral technical assistance for pollution prevention and cleaner production is nowavailable.
Bilateral Programs
Although no survey has been conducted, the Scandinavian countries and The Netherlands have beenleaders in promoting pollution prevention in developing countries and in Eastern Europe. For example, Denmark,Norway, and Sweden have initiated pollution prevention programs as part of their follow up to a decision by theNordic Council of Ministers to assist Eastern European countries in improving their environment In 1991, theDanish Ministry of Environment launched its Eastern Europe pollution prevention assistance program. To date,
$50 million has been spent on a variety of projects. While some support is for environmental infrastructure projects(such as wastewater and sewer systems), a pollution prevention assessment is conducted on all projects; theassessments may identify opportunities to reduce the size and cost of treatment systems. Increased funding forthe program, on the order of $30 million per year, Is under discussion. Norway and Sweden also have begunprograms.
The Netherlands has funded several pollution prevention projects. One is a joint project operated by theUniversity of Amsterdam and a university in Indonesia. The objective is to build capacity In Indonesia for theimplementation of cleaner production strategies.
In 1992, USAID launched its own environmental pollution prevention program (EP3). The program alsoinvolves the U.S. Environmental Protection Agency and cooperative agreements with U.S. environmentalassociations. These arrangements will be used to tap environmental expertise from industry, consulting groups,
1 us, congress, Office of Technology Assessment, Serious Reduction of Hazardous Wastes: For PollutionPrevention and Industrial Efficiency, OTA-ITE-317 (Washington, DC: U.S. Government Printing Office, September 1988).
(Continued on next page
provide a larger percentage of their gross national commodity transfers to countries where the Unitedproducts (see table 2-2).16 States has special security interests, or debt relief
Donor countries vary widely in their aid (see fig. 4-1).17 There is also considerable varia-priorities. For example, only about two-thirds of tion in the geographic distribution of aid (seeU.S. bilateral ODA in 1989 and one-third in 1990 table 2-3). The United States dispersed over 40was project-specific assistance--lower figures percent of its aid in 1991 to Egypt (a low-incomethan other aid donors. The rest involved cash or country) and Israel (a high-income country).
16 Table 2-2 gives figures for “net disbursements,” as defined by the DAC. The DAC defines net disbursements as equal to grossdisbursements, minus repayments of principal on any outstanding aid loans. Interest payments are not subtracted out. Thus, net aid money flowsfrom a donor country will in general be less than the DAC figures by the amount of interest payments received.
17 OECD, Development Cooperation 1991 Report (Paris, OECD, 1991), p. 152. U.S. debt relief in 1990 was extraordinarily high.
20 Development Assistance, Export Promotion, and Environmental Technology
Box 2-A–Assistance For Pollution Prevention and Cleaner Production--Continued
academia, and professional associations. Activities include pollution prevention audits, training, and assistancewith national program development, as well as broader environmental quality assistance. Core funding of $20million for EP3 is expected during the five-year life of the project; other agencies may buy in.
United Nations Activities
United Nations agencies---includingthe United Nations Environment Programme (UNEP), the United NationsIndustrial Development Organisation (UNlDO), and the United Nations Development Programme (UNDP)-- haveseveral pollution prevention and cleaner production activities underway. UNEP’s Industry & EnvironmentProgramme Activity Centre established a Cleaner Production Programme in 1989 to raise awareness indeveloping countries about the benefits of prevention. The Centre collects and disseminates information tofacilitate transfer of know-how and cleaner production techniques and technology to developing countries. Donorcountries provide much of this information and often provide bilateral funding to carry out specific activities. Forexample, Finland’s international development assistance agency supported preparation of 50 case studies oncleaner production In the pulp and paper industry, and the United Kingdom has issued a publication, called“Cleaner Production Worldwide,” in collaboration with UNEP.
UNEP offers training and technical assistance, often in cooperation with other agencies. For example, it isassisting the World Bank and the Chinese National Environmental Protection Agency with a $15 million cleanerproduction project (with half the funds coming from the World Bank). It is anticipated that roughly 100 Chineseexperts will receive training about The Netherland’s systematic pollution prevention process audit procedure(originally developed by the U.S. EPA). There are also plans to install cleaner process equipment in at least 10factories. Recommendations maybe made about changes in government environmental and industrial policiesto overcome end-of-pipe biases and to add incentives for cleaner production. A dissemination phase will aim toprompt more widespread action in China. At certain stages of the project, China will hire foreign consultants asadvisers, and UNEP will convene a special foreign advisory group to assist in the policy review. The project couldencourage the emergence of a market for cleaner process technology in Chinese industry.
Another multilateral activity, a joint UNEP/UNIDO project begun in 1993 to establish National CleanerProduction Centers in 20 developing counties, also could encourage new markets for cleaner processtechnologies. The cost of the centers ($750,000 each, for five years) will be funded by UNEP and UNlDO usingbilateral monies from several European countries (Denmark has pledged $1.6 million). UNIDOand UNEP will trainkey personnel for the centers and assist with industry demonstration projects.
Although Japan is diversifying its aid, over 30 environmental groups and other nongovernmen-percent of its 1991 aid disbursements went to five tal organizations (NGOs) for contributing toAsian countries. serious environmental problems in the develop-
Environmental protection emerged relatively ing world. Often, these problems arose fromrecently as a prominent ODA issue.18 In the 1970s inadequate attention to the environment in largeand 1980s, development aid from DAC members development projects (e.g., dams, power plants,and the World Bank was heavily criticized by and industrial facilities).
I18 Much of the groundwork for including environmental protection as a specific objective in bilateral and multilateral ODA W&3 developed
I by the U.N. World Commission on Environment and Development in its 1987 report, Our Common Future. This document is best known forpresenting a concept of “sustainable development” that stressed the link between economic growth and wise management of natural resources.World Commission on Environment and Development, Our Common Future (New York, NY: Oxford University Press, 1987). Some of thegroundwork was also developed in the 1972 United Nations Conference on the HumanEnvironment and its Stockholm Declaration of “Onlyone Earth.”
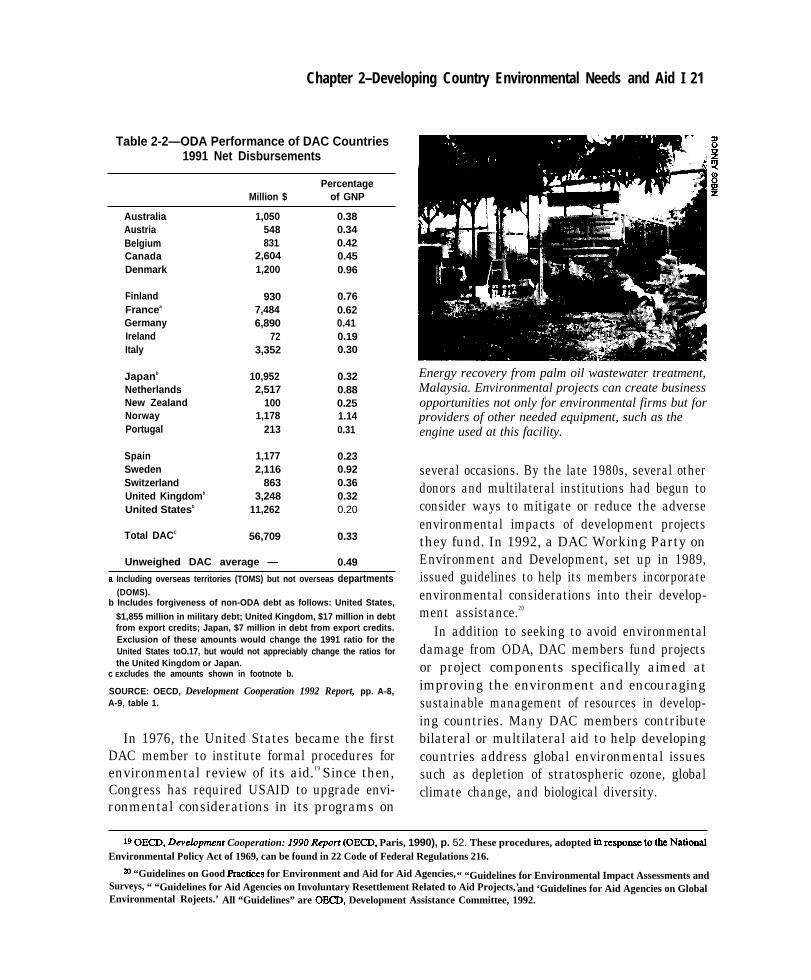
Chapter 2–Developing Country Environmental Needs and Aid I 21
Table 2-2—ODA Performance of DAC Countries1991 Net Disbursements
PercentageMillion $ of GNP
Australia 1,050 0.38Austria 548 0.34Belgium 831 0.42Canada 2,604 0.45Denmark 1,200 0.96
Finland 930 0.76Francea 7,484 0.62Germany 6,890 0.41Ireland 72 0.19Italy 3,352 0.30
Japanb 10,952 0.32Netherlands 2,517 0.88New Zealand 100 0.25Norway 1,178 1.14Portugal 213 0.31
Spain 1,177 0.23Sweden 2,116 0.92Switzerland 863 0.36United Kingdomb 3,248 0.32United Statesb 11,262 0.20
Total DACC 56,709 0.33
Unweighed DAC average — 0.49
a Including overseas territories (TOMS) but not overseas departments(DOMS).
b Includes forgiveness of non-ODA debt as follows: United States,
$1,855 million in military debt; United Kingdom, $17 million in debtfrom export credits; Japan, $7 million in debt from export credits.Exclusion of these amounts would change the 1991 ratio for theUnited States toO.17, but would not appreciably change the ratios forthe United Kingdom or Japan.
c Excludes the amounts shown in footnote b.
SOURCE: OECD, Development Cooperation 1992 Report, pp. A-8,A-9, table 1.
In 1976, the United States became the firstDAC member to institute formal procedures forenvironmental review of its aid.19 Since then,Congress has required USAID to upgrade envi-ronmental considerations in its programs on
Energy recovery from palm oil wastewater treatment,Malaysia. Environmental projects can create businessopportunities not only for environmental firms but forproviders of other needed equipment, such as theengine used at this facility.
several occasions. By the late 1980s, several otherdonors and multilateral institutions had begun toconsider ways to mitigate or reduce the adverseenvironmental impacts of development projectsthey fund. In 1992, a DAC Working Party onEnvironment and Development, set up in 1989,issued guidelines to help its members incorporateenvironmental considerations into their develop-ment assistance.20
In addition to seeking to avoid environmentaldamage from ODA, DAC members fund projectsor project components specifically aimed atimproving the environment and encouragingsustainable management of resources in develop-ing countries. Many DAC members contributebilateral or multilateral aid to help developingcountries address global environmental issuessuch as depletion of stratospheric ozone, globalclimate change, and biological diversity.
1P OECD, Deve/op~nt Cooperation: 1990 Reporz (OECD, Paris, 1990), p. 52. These procedures, adopted in response to tie Natio~Environmental Policy Act of 1969, can be found in 22 Code of Federal Regulations 216.
m “Guidelines on Good Ractices for Environment and Aid for Aid Agencies,“ “Guidelines for Environmental Impact Assessments andSurveys, “ “Guidelines for Aid Agencies on Involuntary Resettlement Related to Aid Projects,’and ‘Guidelines for Aid Agencies on GlobalEnvironmental Rojeets.’ All “Guidelines” are OECD, Development Assistance Committee, 1992.
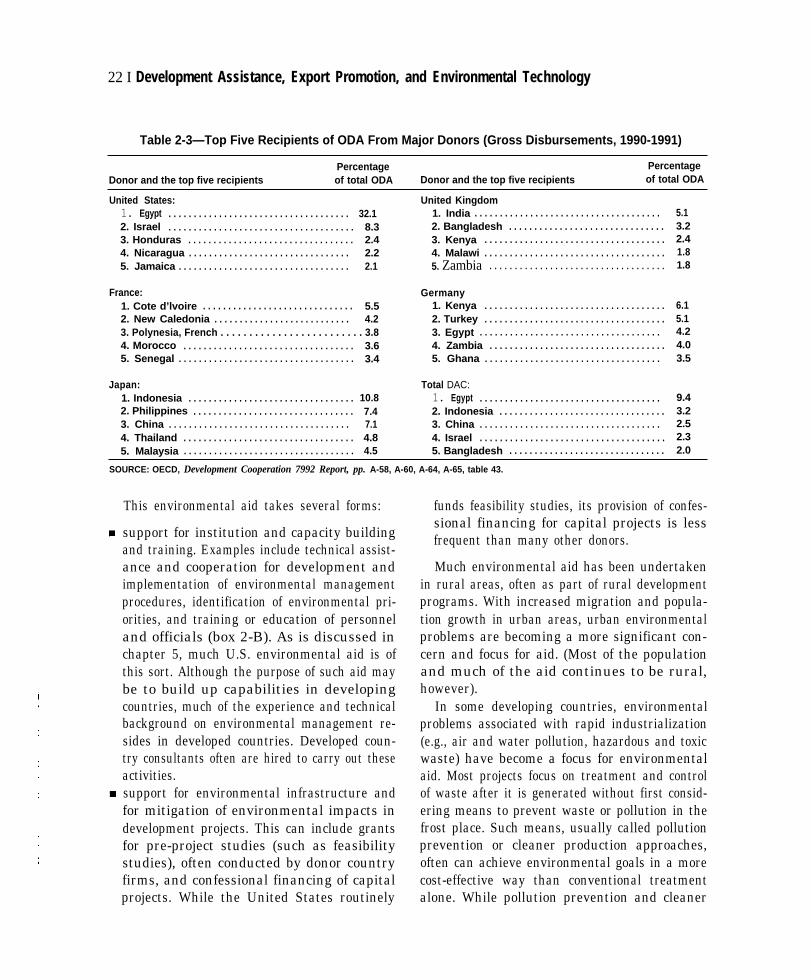
22 I Development Assistance, Export Promotion, and Environmental Technology
Table 2-3—Top Five Recipients of ODA From Major Donors (Gross Disbursements, 1990-1991)
Percentage PercentageDonor and the top five recipients of total ODA Donor and the top five recipients of total ODA
United States:1. Egypt . . . . . . . . . . . . . . . . . . . . . . . . . . . . . . . . . . . . 32.12. Israel . . . . . . . . . . . . . . . . . . . . . . . . . . . . . . . . . . . . . 8.33. Honduras . . . . . . . . . . . . . . . . . . . . . . . . . . . . . . . . . 2.44. Nicaragua . . . . . . . . . . . . . . . . . . . . . . . . . . . . . . . . 2.25. Jamaica . . . . . . . . . . . . . . . . . . . . . . . . . . . . . . . . . . 2.1
France:1. Cote d’lvoire . . . . . . . . . . . . . . . . . . . . . . . . . . . . . . 5.52. New Caledonia . . . . . . . . . . . . . . . . . . . . . . . . . . . 4.23. Polynesia, French . . . . . . . . . . . . . . . . . . . . . . . . . 3.84. Morocco . . . . . . . . . . . . . . . . . . . . . . . . . . . . . . . . . . 3.65. Senegal . . . . . . . . . . . . . . . . . . . . . . . . . . . . . . . . . . . 3.4
Japan:1. Indonesia . . . . . . . . . . . . . . . . . . . . . . . . . . . . . . . . . 10.82. Philippines . . . . . . . . . . . . . . . . . . . . . . . . . . . . . . . . 7.43. China . . . . . . . . . . . . . . . . . . . . . . . . . . . . . . . . . . . . 7.14. Thailand . . . . . . . . . . . . . . . . . . . . . . . . . . . . . . . . . . 4.85. Malaysia . . . . . . . . . . . . . . . . . . . . . . . . . . . . . . . . . . 4.5
United Kingdom1. India . . . . . . . . . . . . . . . . . . . . . . . . . . . . . . . . . . . . .2. Bangladesh . . . . . . . . . . . . . . . . . . . . . . . . . . . . . . .3. Kenya . . . . . . . . . . . . . . . . . . . . . . . . . . . . . . . . . . . .4. Malawi . . . . . . . . . . . . . . . . . . . . . . . . . . . . . . . . . . . .5. Zambia . . . . . . . . . . . . . . . . . . . . . . . . . . . . . . . . . . .
Germany1. Kenya . . . . . . . . . . . . . . . . . . . . . . . . . . . . . . . . . . . .2. Turkey . . . . . . . . . . . . . . . . . . . . . . . . . . . . . . . . . . . .3. Egypt . . . . . . . . . . . . . . . . . . . . . . . . . . . . . . . . . . . .4. Zambia . . . . . . . . . . . . . . . . . . . . . . . . . . . . . . . . . . .5. Ghana . . . . . . . . . . . . . . . . . . . . . . . . . . . . . . . . . . .
Total DAC:1. Egypt . . . . . . . . . . . . . . . . . . . . . . . . . . . . . . . . . . . .2. Indonesia . . . . . . . . . . . . . . . . . . . . . . . . . . . . . . . . .3. China . . . . . . . . . . . . . . . . . . . . . . . . . . . . . . . . . . . .4. Israel . . . . . . . . . . . . . . . . . . . . . . . . . . . . . . . . . . . . .5. Bangladesh . . . . . . . . . . . . . . . . . . . . . . . . . . . . . . .
5.13.22.41.81.8
6.15.14.24.03.5
9.43.22.52.32.0
SOURCE: OECD, Development Cooperation 7992 Report, pp. A-58, A-60, A-64, A-65, table 43.
This environmental aid takes several forms:
support for institution and capacity buildingand training. Examples include technical assist-ance and cooperation for development andimplementation of environmental managementprocedures, identification of environmental pri-orities, and training or education of personneland officials (box 2-B). As is discussed inchapter 5, much U.S. environmental aid is ofthis sort. Although the purpose of such aid maybe to build up capabilities in developingcountries, much of the experience and technicalbackground on environmental management re-sides in developed countries. Developed coun-try consultants often are hired to carry out theseactivities.support for environmental infrastructure andfor mitigation of environmental impacts indevelopment projects. This can include grantsfor pre-project studies (such as feasibilitystudies), often conducted by donor countryfirms, and confessional financing of capitalprojects. While the United States routinely
funds feasibility studies, its provision of confes-sional financing for capital projects is lessfrequent than many other donors.
Much environmental aid has been undertakenin rural areas, often as part of rural developmentprograms. With increased migration and popula-tion growth in urban areas, urban environmentalproblems are becoming a more significant con-cern and focus for aid. (Most of the populationand much of the aid continues to be rural,however).
In some developing countries, environmentalproblems associated with rapid industrialization(e.g., air and water pollution, hazardous and toxicwaste) have become a focus for environmentalaid. Most projects focus on treatment and controlof waste after it is generated without first consid-ering means to prevent waste or pollution in thefrost place. Such means, usually called pollutionprevention or cleaner production approaches,often can achieve environmental goals in a morecost-effective way than conventional treatmentalone. While pollution prevention and cleaner
Chapter 2–Developing Country Environmental Needs and Aid 23
Box 2-B--Technology Cooperation and Technical AssistanceBilateral Activities
Many donor countries help developing countries with training, support collaborative research anddevelopment and assist with developing environmental standards and regulations. While primarily intended tostrengthen developing countrycapacities, such activities may contribute to longer term commercial relationships.Technical training may expose developing country technicians and managers to equipment sold by donor countryfirms. People from donor countries that are engaged in collaborative research and development may gain a betterunderstanding of how to adapt products to developing country needs. Donor country officials or consultants, inadvising on environmental regulations, may be partial to their own national environmental standards andregulations; if their advice is followed, subsequent regulations may, to some degree, favor technologies knownto be able to meet the donor country’s standards.
Many different public and private agencies and institutions from donor countries may engage in such
cooperative activities with their developing country counterparts. {Some activities qualify as “official” developmentassistance; others do not). Examples from the United States, such as the United States Environmental TrainingInstitute and the United States-Ada Environmental Partnership, are discussed in appendix B. A sampling ofactivities from other countries:
Germany: The German government funds the Carl Duisberg Gesellschaft (CDG), a non-governmentalorganization with close ties to German industry, for developing country environmental training. About half thetraining takes place in Germany; the remainder in the developing country. Since 1990, the CDG has been workingwith developing country manufacturing associations and planning or manufacturing ministries on environmentalimprovements in industrial processes. It also undertakes training pertinent to industrial water pollution and wateruse in several Saharan countries, and industrial energy efficiency in members of the Southern AfricanDevelopment Cooperation Countries. (Germany’s environmental aid is discussed further in chapter 5.)
Japan: Several Japanese programs provide environmental training for developing country officials. Japanhas provided funds for environmental management centers in Thailand, China and lndonesia, which, among otherfunctions, undertake and provide training for environmental monitoring. Japan also is cooperating with Indonesiaand China on joint projects to adapt, develop and transfer simplified desulfurization equipment for developingcountry use. (Japan’s environmental ODA, including the “green aid plan” administered by the Ministry ofInternational Trade and Industry, are discussed in chapter 5.)
The Netherlands: A 40-million-guilder fund (known as MILIEV) was set up in 1993 for transferringenvironmental technologies to developing countries. Private sector projects that would contribute to sustainabledevelopment are eligible for government financial support that could cover up to half the costs of the project. The
projects must benefit the environment and in time must be managed by the recipient country.
Continued on next page
production approaches could become an impor- Estimates of Environmental A i dtant part of developing country environmental The 1992 United Nations Conference on Envi-strategies, they have received little attention fromdevelopment assistance agencies until very re-
ronment and Development (UNCED) gave addi-tional prominence to the role of environmental aid
cently. Box 2-A describes recent activities by in development assistance. UNCED’s Secretariatsome donor nations and the United NationsEnvironment Programme,
timated that it could take $125 billion per year which has had a small in aid to catalyze annual investments of $500 toprogram to promote cleaner production since
1990. $625 billion to achieve the conference agenda
24 Development Assistance, Export Promotion, and Environmental Technology
Box 2-B--Technology Cooperation and Technical Assistance-Continued
United Kingdom: A government-sponsored Technology Partnership Initiative, launched in March 1993, aimsto give developing country business representatives better access to United Kingdom technologies andmanagement techniques that would further sustainable development. A guide to United Kingdom environmentaltechnology and services has unprepared. United Kingdom companies also may get help for training developingcountry business personnel. UK and dveloping country firms can gain access to an information network throughBritish Embassy or High Commission commercial sections, or participating trade associations. (see chapter 5 forfurther discussion of the United Kindom's environmental aid.)
Multilateral Activities
Multilateral agencies and funds support training, institutional development, research, and similar activities,The Global Environment Facility (GEF) was setup in 1990 to help countries with per capita incomes of less than$4000 addeess global environmental problems. GEF helps these countries deal with added costs of activitieswithglobal environmental benefits. Grants support investments, technical assistance and research related to climatechange, ozone depletion, pollution in international waters, and biodiversity. Administered by the United NationsDevelopment Programme (UNDP), the United Nations Environment Programme (UNEP)and theWorld Bank, GEFwas funded at a $1.3 billion Ievel during an initial three-year pilot phase; replenishment is now under consideration.
Several multilateral activities have been launched as follow up to the 1992 United Nations Conference onEnvironment and Development. A new Commission on Sustainable Development has been setup under theUnited Nations Economic and Social Council. Among its missions: to monitor progress in transferringenvironmentally sound technology and know-how to developing
Capacity 21, an activity of the United Nation
countries and others.Development Programme(UNDP),was setup in 19$3 to help
developing countries implement local sustainable development programs. The focus will be on institution building,human resource development, public participation, factoring environment into development strategies, andtechnology development, adaptation and applications. UNDP has a target of $100 million for initial funding, with10 developing countries the focal point for the first 18 months of effort.
Another UN agency, the United Nations Environment Programme (UNEP), has provided technical assistanceon the environment for many years. UNEP was recently authorized by its governing council to examine thefeasibility of developing guidelines on information that exporters should provide toimporters on the environmentalimpacts of potentially harmful technologies. (UNEP's pollution prevention work is discussed in box 2-As)
UNEP has setup an international environmental technology center in Japan to promote the transfer ofappropriate environmental management technologies to developing countries. Initially proposed and funded byJapan, the center’s organization, personnel, programs, and international advisory board are supposedtoassureinternational origins for technologies and expertise. It will continue to be under UNEP’s supervision.
I (called Agenda 21) for “accelerated and sustain- $750 million to strengthen the capacity of interna-able development’ in developing countries. Some tional institutions.21
portion of the needed investment would be UNCED provided new focus for an old debateenvironmental, but most would not. The Secretar- about the appropriate level of development assist-iat also estimated an additional $15 billion would ance to developing countries. In 1973, the UNbe needed to help developing countries mitigate General Assembly urged donors to increase theirtheir impacts on the global environment, and ODA to average 0.7 percent of their GNP or more.
21 Report of the Secretary General of the conference, "Financial Resources and Mechanisms “ Preparatory Committee for the UnitedNations Conference on Environment and Development, Fourth Sessions, New York, March’ 2 to April 3, 1992, Plenary Session,AA/Conf.151/PC/101, United Nations General Assembly,
Chapter 2–Developing Country Environmental Needs and AidI 25
However, the DAC has not adopted this goal and,of DAC members, only Norway, The Nether-lands, Sweden, Finland, and Denmark have met itin recent years.
22 Of the six largest DAC donors,only France has approached this level in recentyears. Japan has remained at about 0.3 percent forseveral years despite steady increases in theabsolute amount of aid. The United States, whichnever committed itself to the General Assemblygoal, has seldom exceeded 0.26 percent of itsGNP in aid value since the mid-1970s, and nowspends about 0.20 percent.
All countries at UNCED accepted Agenda 21financing chapter, which reaffirmed commit-ments to the 1973 goal and called for ‘‘new andadditional financial resources” to implementsustainable development.23 As the United Stateshad not affirmed the earlier goal, U.S. officialsheld that its acceptance of the financing chapterwould not be a commitment. However, then-President Bush announced an increase in assist-ance for international forestry and indicated theUnited States would increase its internationalenvironmental assistance by two-thirds over the1990 level. Japan made the largest pledge: itannounced its intention to provide 900 billion to1 trillion yen ($7.1 billion to $7.8 billion at 1992
exchange rates) over 5 years for global environ-mental protection (including bilateral and multi-lateral aid).24
Since UNCED, most donors have continued toacknowledge the need for “new and additional”resources, but have pointed out constraints thathave slowed their response. Expanding ODA hasproven difficult in a period of slow economicgrowth and intensifying global competition. De-veloping countries, meanwhile, have continued topress for “new and additional’ resources, includ-ing environmental aid.25 They are concerned that,without new and additional funding, donors willdivert to the environment other aid now used forsuch purposes as basic health care, generaleducation and small enterprise development.
In followup to UNCED, the DAC is attemptingto track environmental assistance flows to devel-oping countries.26 The initial effort to developstatistics on environmental aid is still in progress.One major obstacle is that donors and multilateralagencies have yet to adopt common definitionsfor estimating their environmental aid. The ab-sence of common definitions is a problem incomparing or assessing what various countriesare doing with their environmental aid. Forexample, Japan includes some aspects of natural
22 ~= non.DAc mem~n, Saudi ~b~ KUVV~~ md the U~tcd Arab Emirates, are dSO impotit providers of ODA. = much of
the last two decades, their ODA routinely exceeded 2 percent of their respective GNPs. This proportion declined in the aftermath of the1990-1991 Gulf war, with Saudi Arabia falling to 1.5 percent and the United Arab Emirates to 1.66 pement of their respective GNPs. The 1991figures for Kuwait were not cited by DAC.
23 me f~cing chapter Stated: “In gen~ financing for the implementation of Agenda 21 will come from a country’s own public andprivate sectors. For developing countries, particulady the least developed countries, ODA is a main source of external funding, and substantialnew and additional funding for sustainable development and implementation of Agenda21 will be required. Developed countries reaillrm theircommitments to reach the accepted United Nations target of 0.7 percent of GNP. . and agree. . .to augment their aid. . .to reach that target assoon as possible and to ensure a prompt and effective implementation of Agen& 21.” United Nations Conference on Environment andDevelopmeq “Financial Resources and Mechanisms,” Agenda 21, Chapter 33, final advance version as adopted by the Plenary in Rio DeJaniero on June 14, 1992, para. 33.15.
24 Jap~e UQ of Foreign A.Hairs, Oflcial Development Asm”stance 1992, VO1. 1 13VWW no Sefi--tSU-Mj0 19921* P“ 217”
25 Jap~’s env~men~ ~d w= r~ort~ to hve increased to about 280 billion yen ($2.4 billion) iI.I fwci~ Y= 1992+ aPP~~t
tripling over the 1991 level. However, the reported informatio~ contained in a June 1993 United Nations publicatio~ provides few specitlcdetails about what is included in this estimate of environmental aid or how it was derived. As cited in Commission on Sustainable DevelopmentReport of the Secretary General, “Addendum: Information provided by Governments on initial f~cial commitments, fmcial flows andqments to give eff~t to the decisions of the United Nations Conference on Environment and Development’ United Nations Economicand Social Council, E/Ch.17/1993/11/Add.1, 8 June 1993, p.15. The Commissio~ setup in follow up to UNCED, has established an ad hocworking group on fuces to assess f~cial needs and monitor resource flows.
26 C)ECD, Development Cooperation 1992 Report, 0p. Cit., pp. 1322.
26 I Development Assistance, Export Promotion, and Environmental Technology
disaster relief in its estimates of environmentalaid,27 while other donors may not.
In 1990, the DAC questioned whether anapparent increase in the number of environmentalprojects cited by donors was real or simply theresult of reclassification.28 In the absence ofcommon definitions, countries are free to “rela-bel,” or reclassify, projects to claim a largervolume of environmental aid. Sometimes thismay be justified: certain longstanding kinds ofdevelopment assistance (such as help for buildingand operating wastewater treatment facilities)could be considered environmental infrastructure.Some other aid projects might fall into theenvironmental category if environmental protec-tion and/or resource conservation and restorationare primary objectives. Generalization is difficult,as is suggested by the case of reforestation, whichcan be undertaken for many different reasons. Aproject to stock a logged area with commerciallydesirable tree species might normally be seen asforestry development. However, if the primeobjectives were watershed management, controlof soil erosion and introduction of good forestmanagement on lands degraded by unsuitablelogging practices, a similar activity might qualifyas environmental.
Another question is how to account for devel-opment projects that have an environmentalcomponent or aspect. For example, water re-source development projects may have mitigationcomponents to reduce environmental impacts(e.g., measures for afforestation and to reduceerosion in reservoir catchment areas). Whatportion of project costs should be environmentalbefore such projects are considered to have anenvironmental component?
Many environmental problems can be avoidedif good design practices are used in planningprojects; by anticipating and addressing likelyenvironmental problems in the planning stage,
project designers can reduce the need to spend asmuch on mitigation components. Hence, environ-mental spending is not always a good indicator ofthe environmental care taken in the project.
Further complications arise in classifying aidfor “cleaner production technology” and “pollu-tion prevention” approaches which are an inte-gral part of production technologies. As has beenmentioned, such techniques reduce the amount ofwaste or pollution that is generated, and thusoffset the need for subsequent treatment ordisposal, or require less inputs of energy and otherresources. A narrow definition of environmentalspending can mask environmentally favorableinvestment in such cleaner production technolo-gies. Indeed, donors attempting to meet theirenvironmental aid commitments using a narrowdefinition could conceivably skew resources fromcleaner production to less effective and morecostly investments in “end-of-pipe” pollutionabatement and waste disposal equipment.
DAC members have begun to introduce “indi-cators’ or markers of environmental aid as part oftheir creditor reports. The guidance for enumera-tors suggests that DAC members identify theenvironmental content of projects using one ofthree codes: those undertaken “specifically forenvironmental purposes,’ those in which thecontent is ‘‘signKlcantly influenced by environ-mental considerations,’ and those in which theenvironmental content is not applicable or known.Some specific kinds of projects are consideredprima facie environmental.
Some donors are using these guidelines toreport their own calculations for specific environ-mental projects, and for projects which include animportant environmental component. The DAChas yet to issue an estimate of environmental aid.Nine of DAC’S 21 countries had reported theirbilateral environmental commitments for 1991,the frost year to be covered, as of May 1993. These
27 @v~-~~~ ~fJ~~~E~vi~om~t ~~D~~~lo~~nt:J~p~n’~ E~efience a~~hieve~nt,Japan’sNatioml Report to UNCED 1992,
December 1991, p. 22.
28 OE~, Develop~nt Cooperation 1990 Report, Op. cit., P 45.
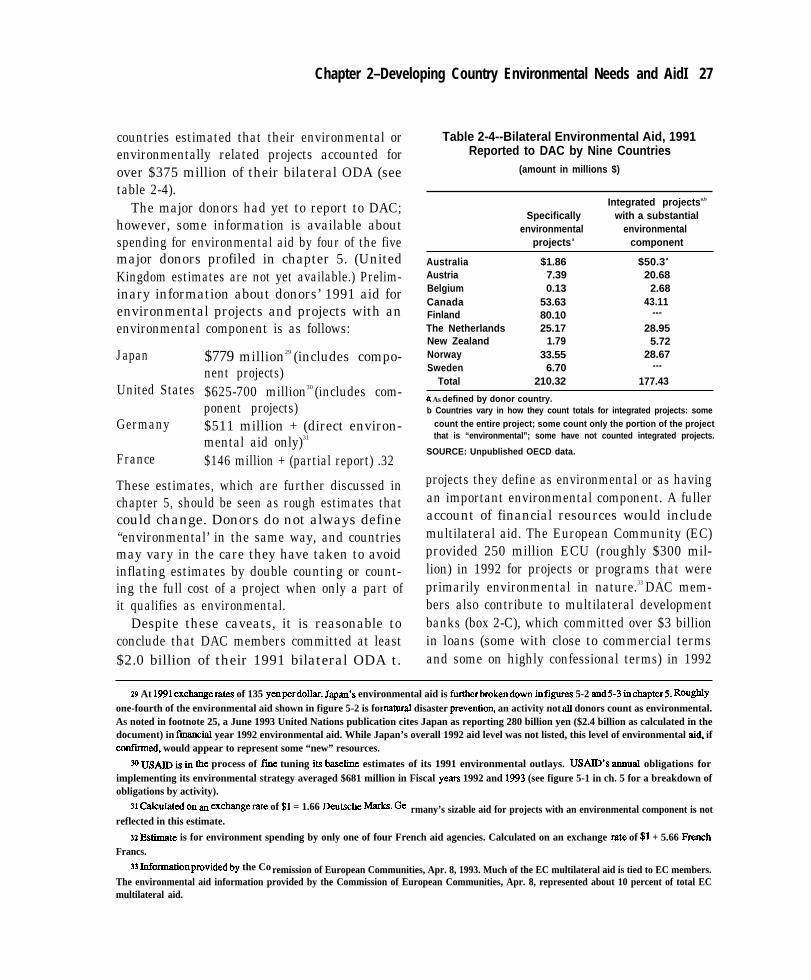
Chapter 2–Developing Country Environmental Needs and AidI 27
countries estimated that their environmental orenvironmentally related projects accounted forover $375 million of their bilateral ODA (seetable 2-4).
The major donors had yet to report to DAC;however, some information is available aboutspending for environmental aid by four of the fivemajor donors profiled in chapter 5. (UnitedKingdom estimates are not yet available.) Prelim-inary information about donors’ 1991 aid forenvironmental projects and projects with anenvironmental component is as follows:
Japan
United States
Germany
France
$779 million29 (includes compo-nent projects)$625-700 million30 (includes com-ponent projects)$511 million + (direct environ-mental aid only)31
$146 million + (partial report) .32
These estimates, which are further discussed inchapter 5, should be seen as rough estimates thatcould change. Donors do not always define“environmental’ in the same way, and countriesmay vary in the care they have taken to avoidinflating estimates by double counting or count-ing the full cost of a project when only a part ofit qualifies as environmental.
Despite these caveats, it is reasonable toconclude that DAC members committed at least$2.0 billion of their 1991 bilateral ODA t.
Table 2-4--Bilateral Environmental Aid, 1991Reported to DAC by Nine Countries
(amount in millions $)
Integrated projectsa,b
Specifically with a substantialenvironmental environmental
projects a component
Australia $1.86 $50.3 a
Austria 7.39 20.68Belgium 0.13 2.68Canada 53.63 43.11Finland 80.10 ---
The Netherlands 25.17 28.95New Zealand 1.79 5.72Norway 33.55 28.67Sweden 6.70 ---
Total 210.32 177.43
a As defined by donor country.b Countries vary in how they count totals for integrated projects: some
count the entire project; some count only the portion of the projectthat is “environmental”; some have not counted integrated projects.
SOURCE: Unpublished OECD data.
projects they define as environmental or as havingan important environmental component. A fulleraccount of financial resources would includemultilateral aid. The European Community (EC)provided 250 million ECU (roughly $300 mil-lion) in 1992 for projects or programs that wereprimarily environmental in nature.33 DAC mem-bers also contribute to multilateral developmentbanks (box 2-C), which committed over $3 billionin loans (some with close to commercial termsand some on highly confessional terms) in 1992
29 At lggI exc~emta of 135 yenperdollar. Japan’s environmental aid is furtherbrokendown infigures 5-2 and5-3 tichSpter5. Rou@Yone-fourth of the environmental aid shown in figure 5-2 is for mtural disaster preventio~ an activity not all donors count as environmental.As noted in footnote 25, a June 1993 United Nations publication cites Japan as reporting 280 billion yen ($2.4 billion as calculated in thedocument) in fucial year 1992 environmental aid. While Japan’s overall 1992 aid level was not listed, this level of environmental ai~ ifconfiied, would appear to represent some “new” resources.
30 us- is in the process of fme tuning its bmehe estimates of its 1991 environmental outlays. USAID’S iuunud obligations forimplementing its environmental strategy averaged $681 million in Fiscal years 1992 and 1993 (see figure 5-1 in ch. 5 for a breakdown ofobligations by activity).
31 ~c~~~ on an exchaugemte of $1 = 1.66 Deutsche IWWkS. Ge rmany’s sizable aid for projects with an environmental component is notreflected in this estimate.
32 Es@te is for environment spending by only one of four French aid agencies. Calculated on an exchange rate of $1 + 5.66 FrenchFrancs.
33 ~omtionpmvid~by the Co remission of European Communities, Apr. 8, 1993. Much of the EC multilateral aid is tied to EC members.The environmental aid information provided by the Commission of European Communities, Apr. 8, represented about 10 percent of total ECmultilateral aid.
28 Development Assistance, Export Promotion, and Environmental Technology
1
Box 2-C-The Multilateral Development BanksThe World Bank and the regional multilateral development banks (MDBs) are major sources of infrastructure
financing In developing countries. Their lending terms vary from close to market (in the better off developingcountries)to highly concessional (in the poorest countries). Like bilateral donors, the multilateral institutions initially
paid Iittle attention to the environmental impacts of the projects they financed. This is changing; most MBDs nowuse environmental guidelines or assessments in project planning or review. MDBs also are working withdeveloping countries as they prepare or revise national development plans to take Into account environmentalneeds. These plans may identify steps to strengthen environmental institutions or Identify environmentalinvestment and lending needs for the coming years.
The multilateral institutions now finance many environmental projects. Like bilateral donors, they have foundit difficult to define environmental aid. However, most banks now "mark” environmental projects and projects witha significant environmental component. As shown in table 2-5, these banks made at least $3 billion in bans forenvironmentally related projects in 1992. (This does not include assistance provided through the GlobalEnvironmental Facility or United Nations agencies discussed in box 2-B.)
While the World Bank, other MDBs and the United Nations conduct procurement under rules that generallyprevent discrimination based on nationality, donor countries often supplement multilateral funding with their ownaid money, through use of consultant trust funds, cofinancing, and parallel financing (described below). Some ofthe consultant funds and parallel financing maybe tied; cofinancing is not tied (except when provided after acontract is awarded). All three practices may have a subtle influence on multilateral procurement (see ch. 3).
Consultant trust funds can be drawn on by MDBs to finance pre-project appraisals. Several consultant trustfunds are available to the World Bank. The largest, a Japanese special fund for policy and human resourcedevelopment, is untied and is administered by the Bank on behalf of Japan. In 1992, the Bank committed over$100 million from the fund for feasibility studies and other project preparation work (including work related to globalenvironmental safeguards). Although Japan signs off on proposed uses for the trust fund, t he Bank’s procurementrules govern subsequent selection of consultants.
Continuedd on next page
for environmental projects or projects with an Not all environmental assistance would beimportant environmental component (table 2-5).(Financing for MDB loans or credits is obtainedfrom various sources, including world capitalmarkets and MDB earnings, as well as contribu-tions from donor countries). Thus, the totalamount committed to bilateral and multilateralenvironmental assistance or assistance with animportant environmental component surpasses $5billion per year, but by how much is not clear.
Given the definitional problems discussedabove, these figures should be treated withcaution. Because DAC reporting on environ-mental ODA leaves the definition up to the donor,comparisons will be difficult. Without bench-marks or common definitions, such estimatesshed little light on how much “new and addi-tional” aid is devoted to the environment.
reported to DAC. For example, Sweden’s exportcredit agency supports a $15 million creditfacility in Malaysia that provides soft loans foracquisition of Swedish environmental protectionand control equipment. While offering below-market rates, this facility does not meet DACcriteria for concessionality, and thus would not becounted in DAC figures. Even counting suchfunds, environmental aid probably meets only asmall part of the overall “catalytic” need identi-fied by the World Bank or by UNCED.
Finally, the quantity of aid reveals little aboutthe quality of environmental aid or whetherdeveloping country needs and priorities are ade-quately addressed.
Chapter 2–Developing Country Environmental Needs and Aid 29
Box 2-C--The Multilateral Development Banks--ContinuedIn some other consultant trust funds, donors maintaln more control over their contributions. The U.S. Trade
and Development Agency administers a trust fund for use by the World Bank for project development andidentification studies. When the Bank identifies a need for such a study, it can apply to TDA for funding. If giventhe go-ahead by TDA, the Bank must commission a U.S. consultant or citizen to perform the study. The aim ofthe fund is to get U.S. consultants involved in World Bank projects at the project planning stage. TDA only fundsstudies where it is dear that U.S. contractors would have a fair chance to compete In the bidding for the proposedproject when undertaken. Initially focused on the environment and also Eastern Europe, the fund now is used forall sectors and regions. TDA has provided about $2.7 million to the fund in the last four years.
Some consultant trust funds are used only for environmental projects. Several countries have togethercontributed more than $15 million to the Technical Assistance Grant Program for the Environment, called theEnvironmental Trust Fund, since late 1990. Each country contribution is separately maintained; tying policies varyby country. Also, the Netherlands, Norway, Belgium, Canada, and Sweden have trust fund for technicalassistance or studies; some of the funds are tied, although the proportion is decreasing. Another specialenvironmental trust fund is being setup by The Netherlands with the inter-American Development Bank.
Cofinancing occurs when additional my is added to multilateral projects, raising the overall budget for
project assistance. Cofinancing can come from another multilateral or a bilateral source. The World Bankincreasingly uses cofinancing; over half of the Bank’s 1992 projects and programs attracted some cofinancing.The financing includes ODA as well as other financing, such as export credits from export-import banks. If theadditional money is given in a separate transaction (not as part of the multilateral project budget), it is called parallelfinancing. An example is a German GTZ (technical assistance agency) grant to China to train maintenance staffin concert with an MDB loan for bus fleet fuel conversion. With several large MDB environmental programsin the works, some countries may seek to promote environmental exports through co-or parallel financing. Thesubtle ways in which co- and parallel financing can help a country’s firms win MDB contracts are discussed inchapter 3.
Table 2-5-1992 Environmental Lending by Selected Multilateral Development Banks
Institution a Environmental and environmentally related lending
World Bank
The Asian Development Bank
The Inter-American Development Bank
Loans for 19 primarily environmental projects amounting to about $1.18 billion wereapproved in 1992. Of these projects, 10 were concerned with better management ofnatural resources, and six with building institutional capacity. The other three focusedon both priorities. in addition, the Bank funded 43 projects with substantial environ-mental components.
1992 lending for environmentally oriented projects amounted to $1.1 billion. Technicalassistance for environmentally oriented projects amounted to about $19 million.
1992 loans for 10 projects “specifically designed to resolve environmental problems”amounted to slightly over $1 billion.
a The European Bank for Reconstruction and Development did not provide information on the extent of its environmental Iending.
SOURCE: Worid Bank, Environment Department, Environmental Assessment Sourcebook, Volume /, Policies, Procedures, and Cross-SectoralIssues, WorldBank Technical Paper, No. 139, and The World Bank and the Environment, Fiscal 1992; Asian Development Bank, Information Office,The Environments Program of the Asian Development Bank, April 1991, and information provided by the Office of the Environment, AsianDevelopment Bank, May 18, 1993; Inter-American Development Bank, Environmental Committee, Annual Report on the Environment and NaturalResources, Washington, DC, 1992, and information provided by the Inter-American Development Bank, Feb. 16, 1992.
HowAid CanPromoteExports 3
A id programs normally promote national exports to someextent. One way is by “reflow,” the spending of aidmoney on goods and services from the donor country. Asecond way is that a country’s own aid programs can
help national firms to tap into aid finding from multilateralorganizations. A third way is that the recipient country’s use ofgoods and services from the donor country can open the door tolong-term commercial relationships. Certain practices tend toincrease aid’s export promotion effect, whether or not they areadopted for that purpose. This chapter describes such practices inthe abstract; their actual use is discussed in chapter 4 (forpractices increasing reflow), box 2-C (for practices that helpfirms tap into multilateral funding), and box 2-B (for practicesincreasing the chance that aid will lead to long-term commercialrelationships).
PRACTICES THAT INCREASE REFLOWSome reflow occurs naturally. The donor country may offer
the best bargains in goods and services. Also, the recipientcountry might prefer to buy from donor country firms because ofa common language, similar culture, or previous commercialrelationships. l The recipient country might also buy from thedonor out of gratitude, or out of a spontaneous belief (notencouraged by the donor) that to do so will increase the prospectsfor future aid from that donor.
Some donor practices can increase reflow, whether or not thatis why the donor adopts the practice. Some of these practices areat times criticized on the ground that they inappropriately
1 Catrinus J. Jep~ The Z’jing ofAid (Paris: OECD Development Centre, 1991), p. 25.
31
32 I Development Assistance, Export Promotion, and Environmental Technology
subordinate development goals to the donor’sown commercial goals. One practice, which is notnormally subject to such criticism, is to focus aidon projects requiring goods and services thatdonor country firms can supply competitively.This practice can substantially boost reflows.
Another practice, which is subject to thecriticism just described, is the ‘tying’ of aid, i.e.,restricting where the aid can be spent. In collect-ing statistics, the DAC distinguishes three catego-ries of aid. First, aid that may freely be spent in allOECD countries and in substantially all develop-ing countries is called “untied.” (Aid earmarkedto finance the recipient’s local costs is alsocounted as “untied.”) Aid that is not “untied”but nevertheless may be spent to procure goodsand services from at least the donor country andsubstantially all developing countries is called‘‘partially untied.” All other aid is called “tied.”Often “tied” aid is restricted so that it can onlybe spent in the donor country; and by “tied aid”people often mean aid so restricted, even thoughthe DAC definition is broader, encompassing anyset of conditions not meeting the definitions ofuntied or partially untied aid.
Tying generally increases reflow, though it isusually hard to tell by how much. In some cases,the recipient country would have spent money inthe donor country even if the aid were untied.
In principle, the tying status of particular aidfunds depends on the actual, practical restrictionson spending rather than on the formally declaredrestrictions. Thus, aid is defined to be tied whenit is “in effect tied to procurement of goods andservices from the donor country.’ This situationis sometimes called ‘‘informal’ tying, as op-posed to the “formal” or openly announcedtying. In practice, however, member countries canreport figures as they wish, and the DAC does not
often revise them; so informal tying might gounreported. Informal tying would occur, forexample, if a donor invited bids in advance offinally deciding to fund projects, and consistentlydecided to fund only those projects for which itsnational firms would win the contract.
Sometimes donors act in ways that do notguarantee that aid will be spent in the donorcountry, but make that outcome more likely. Thistoo is often referred to as “informal tying.” Forexample, a donor might let it be known that if aidfunds are not spent substantially on donor countrygoods and services, future aid will be diminished.Another example is an administrative system thathelps national firms to influence project selection(see ch. 4).
Sometimes formally tying only a small amountof aid can informally tie a much larger amount.One example is tied grants for consultationservices in the pre-project phase. Large social orcapital projects are not normally undertakenwithout some preliminary examination of theproject’s context, scope, planned methods ofimplementation, and likelihood of success. Thispreliminary phase can go by the name of pre-project studies, scoping studies, pre-feasibilityand feasibility studies, and (for capital projects)engineering studies.
The results of these early studies can have aripple effect on the entire project. The firmperforming the study might itself be capable ofdoing or at least managing the construction; itswork in the pre-project stage would often give ita substantial advantage in bidding on the project.3
Even if the firm performing the pre-project studycannot bid on the project, if the project requirestechnology (such as for air pollution controlequipment), that firm is likely to be more familiarwith donor country technologies than with for-
1 z OECD, “DAC Adopts Revised Guiding Principles For Associated Financing and Tied, Partially Tied, and Untied OD~” Press ReleaseA(87)23, Paris, 1987 (emphasis added).
I s The Japanese International Cooperation Agency (JICA), forexarnple, “recommends that the recipient country employ the same consultingfm [to manage a JICA project] that took charge of the Basic Design work [a preliminmy study], “ in order “to secure technical consistencyof the project desi~ etc.” JICA, “Grant Aid and JICA,” undated, p. 12.
Chapter 3-How Aid Can Promote Exports I 33
eign ones and to recommend technical specifica-tions that can be met by donor country vendors.This could steer the main project to national firmseven if the main project is not formally tied.
Similarly, once a construction project goesahead, a donor could tie just the aid for hiring anengineering consulting firm to manage the proj-ect. A national firm in charge of setting specifica-tions, and in a position to advise the recipientgovernment on procurement, would tend to steerbusiness toward other national firms.
Another practice that can increase reflow is togive aid not as a pure grant, but with some loancomponent. Assuming the loan is paid back, if theaid is spent in the donor country, then the amountof reflow will actually exceed the net cost of theaid to the donor. The aid can be given in variousforms. For example, the donor might give thedeveloping country a grant, plus a loan on termssimilar to those for commercial loans.4 Or thedonor might give a “concessiona1 loan,” that is,a loan at terms better than those available in themarkets Other possible forms include giving botha grant and a concession loan, or both a
confessional loan and a loan on close to commer-cial terms. Aid with a loan component is oftenused for major projects (such as wastewatertreatment plants), which are normally too expen-sive to fired by grants alone.
When aid with a loan component is tied it is● called a “tied aid credit. ”6 (The term “tied aid
credit” is commonly used to include both tied andpartially untied aid; it is so used in this back-ground paper.) Assuming the loan is repaid, tiedaid credits can leverage a given net cost to thenational treasury to yield substantially largeramounts of exports. Tied aid credits also have thepotential to skew aid in directions that servedonor country commercial interests over recipient
country development and environmental inter-ests, and their use is limited by international rules(see ch. 4).
PRACTICES THAT HELP FIRMS TAPMULTILATERAL FUNDING
A nation’s own aid programs can help its firmsin two ways to win contracts from multilateral aidsources. First, a nation can provide tied or untiedgrants to perform preliminary studies for projectsbeing considered by a multilateral aid source. If anational firm does the preliminary study (which isassured if the grant for it is tied), it may steer themain project to a national source, as discussedabove in the context of bilateral aid. (However,multilateral sources normally have strict andeffective competitive bidding rules that couldlimit the influence of the firm doing the prelimi-nary study.)
Second, a nation can provide cofinancing orparallel financing for multilateral projects. Cofi-nancing is money contributed directly to themultilateral project. Competitive bidding is rununder the normal rules of the multilateral organi-zation, so in principle the cofinancing gives donorcountry firms no advantage. However, especiallyif the cofinancing represents a large part of thetotal project cost, the recipient country will likelybe especially receptive to bids by firms from thecountry giving the cofinancing. Parallel financingis tied or untied financing for a project separatefrom but closely related to the multilaterallyfunded project; for example, parallel financingcould be for a training program on how to operatea facility whose construction is financed multi-laterally. Parallel financing cannot directly influ-ence the procurement for the multilateral project;however, national firms that bid on the parallel
4 ~vernment gwwmtees of commercial loam are also sometimes used.5 Sucha loan can be thought of conceptually as equivalent to a commercial loan (with a face value equal to the present value of the requhed
repayment stream) combined with a grant and might in fact be built out of those two components by the donor goveamnent.
s me term “aid” signifies there is a grant component, while the term “credit” signifies there is a loan component (Some amOunt mUSt berepaid).

34 I Development Assistance, Export Promotion, and Environmental Technology
financing can thereby learn about the multilateralproject, for which they might then bid as well.
PRACTICES THAT ENCOURAGE LONG-TERM COMMERCIAL RELATIONSHIPS
In the long run, continually giving out aid is anexpensive way to promote exports. A moreprofitable way is to let particular aid effortsmature into long-term, self-sustaining commer-cial relationships. One practice that can encour-age such relationships is to focus aid on countrieswith promising markets.
Another practice that can encourage long-termcommercial relationships is ‘‘technology cooper-at ion. This includes technology demonstra-tions, research and development centers, training
programs, and technical assistance to nascentinstitutions, such as a government environmentagency. Aid for these activities is often tied orpartially untied.8 Technology cooperation mayover time both increase a developing country’sdesire and ability to protect the environment, andincrease its awareness of how the donor country’stechnology can help with that task. Technologycooperation can reach different groups within therecipient country, including government poli-cymakers, universities, industry, and nongovern-mental organizations. While technology coopera-tion can have significant commercial benefits fordonors, it can also be essential to achievingbroader environmental and development goals.
T The term “technology cooperation” as used here is broader than the term “technical cooperation” used by DAC.B ~ the ~tent ~ aid is offm~ ~ ~W& ~d ~mius (e.g., -, quipm~t) rather ~ iII CW& it is by defiit.ion t.kd if tk gOOdS
and services are produced in the donor country.
Aid andExports:SelectedCountry
Practices 4
I t is hard to say how important aid is in promoting exports.One study found that 14.6 percent of OECD exports todeveloping countries during 1987-1990 were aid-financed. l But what does this mean? On the one hand,
some of these exports would have occurred without the aidfinancing. 2 On the other hand, exports directly financed by aidcan lead to other exports not using aid financing, so over time aidcould have a cumulative effect that far exceeds its exportcoverage in a given year.
We can, however, examine countries’ practices that tend toincrease or decrease the exports resulting from foreign aid. Thischapter examines practices of the United States, Japan, France,Germany, and the United Kingdom3 in four areas: the composi-tion of aid (cash transfer, projects in particular sectors, etc.);geographic focus of aid; tying of aid, both formal and informal;and the use of loans (especially tied loans). Much of the data isavailable only for aid as a whole; but, where possible, environment-related aid is discussed. A fifth area of practice, the building oflong-term relationships (such as through technology coopera-tion), was discussed in box 2-B; and a sixth area, use of acountry’s aid that can help national firms to win contracts undermultilateral aid projects, was discussed in box 2-C.
Among the foreign countries examined, Japan’s aid may posethe greatest commercial challenge to the United States, and
1 This figure is derived from a restricted OECD documen~ which gives an analysis byProfessor Catrinus J. Jepma. The OECD plana to publish this analysis in a publiclyavailable form.
z HOW much this happens is explored in Catrinus J. Jepn@ “EC-Wide Un@W,” DEFoundatiorL University of Groninge~ The Netherlands, 1992, p. 10.
3 The largest aid donors are, in order, the United States, Jap~ France, Germany, Italy,and the United Kingdom. Italy is not discussed here.
35
36 I Development Assistance, Export Promotion, and Environmental Technology
receives the most attention below. Japan is, withthe United States, the largest donor of aid andprobably of environmental aid, and it has made acommitment to expand its environmental aidsubstantially. Japanese aid continues to be fo-cused on East Asia, with its potentially largemarket for environmental goods and services(EGS), and where Japan has a strong commercialpresence. Japan also may view the environment asa strategic industry, and has given the environ-ment special attention in its aid programs. Whilethe competitiveness of the U.S. environmentindustry is not discussed in this background paper(it will be discussed in the final report in thisAssessment), it is worth noting that Japan has along history of promoting industries that itconsiders strategic through coordinated use ofR&D, export promotion, import restrictions, taxpolicy, and other policies.4
At the same time, Japan’s ODA could benefitsome U.S. environmental firms. Japan has, atleast officially, been taking steps to open up moreof its ODA to participation by non-Japanesefirms. A recent Executive Branch report toCongress, coordinated by the State Department(referred to below as the “State Department”study), says, “we are cautiously optimistic” thatU.S. and other foreign firms “will be able to
increase their participation in Japan’s ODA con-tracts over the next few years. ”5 It remains to beseen whether this cautious optimism will bejustified. Even if more opportunities exist in aformal sense, U.S. firms seeking to participate inJapanese ODA normally will need to make theeffort to understand Japan’s ODA system, andwill need to be persistent.
COMPOSITION OF AIDFigures 4-1 through 4-3 show patterns in the
composition of aid for 1989 and 1990.6 Comparedwith other major donors, the United States spendsmore on debt relief and program assistance (fig.4-l). Debt relief constitutes forgiveness, resched-uling, and refinancing of debt, including debt onan ODA loan or a non-ODA loan.7 Debt relief isnot normally associated with any particular pur-chases and thus does not directly promote ex-ports. 8 Program assistance is a general categoryfor aid not linked to specific projects. It is oftengiven as a simple cash payment, which again doesnot directly promote exports.9 A small portion ofU.S. program assistance is given as a grant thatcan be spent only to purchase U.S. commodities.However, this restriction does not necessarilyincrease U.S. exports. The recipient country
4 U.S. Conwess, mice of ‘Ikd.nology Assessment, Competing Economies: America, Europe, and the patific Rim, 0~-~98(Washingto~ DC: U.S. Government Printing OtXce, October 1991), ch. 6.
S U.S. Department of State in coordination with other Executive Branch departments and agencies in response to a request by the UnitedStates Senate, “Japan’s Foreign Aid: Program Trends and U.S. Business Opportunities” (Feb. 18, 1993), mimeo., p. 6.
G The Em USCXI in these figures for different types of aid, some of which are explained below, are defti p=kely i.11 OEm,“DevelopmentAssistance Committee Statistical Reporting Directives,” Note by the Secretariat, Dec. No. DAC(88)1O, drafted Feb. 22,1988.This document has unrestricted distribution.
7 Starting with 1991 figures, relief of military debt will not be counted as ODA at al~ and therefore will not show up as debt relief. Thischanged accounting will probably reduce U.S. aid f~es significantly.
s Debt dief could indirectly promote exports in various ways. The recipient country might buy from the donor out of gratitude, or out ofa perception (not necessarily encouraged by the donor) that future aid will depend on current spending patterns. The recipient country wouldhave increased spending ability (although any extra spending that resulted would not necewarily be made in the donor country). The recipientcountry might buy more than it normally could afford from the donor on credit because it anticipates debt relief in the future.
g As with debt relief, exports could be indirectly promoted because of gratitude, increased spending power, or a Pmeption tit W-in the donor country will increase future aid. This third factor may have recently become more important in the case of U.S. aid. Recently,USA.ID has inmanycases set up special accounts to track how aid money is spent. Jn these cases, because it must tell USAID how it is spendingthe money, the recipient may feel pressure to spend it in the United States, even though USAID does not demand this. However, because therecipient csn choose what particular goods and services to spend the money ou spending the special fund on U.S. goods and services wouldnot necessarily increase its total purchases from the United States, as discussed in the text below.
Chapter 4-Aid and Exports: Selected Country Practices I 37
Figure 4-l-Percent of ODA Commitments Devoted to Debt Relief and Program Assistance
1989
70 I I
1990
70 , —
i
D Debt relief
60 _ Program assistance (normally
50A
not project-specific)
~ 40 —c)
230 –
2 0 –
lo–
0 I I I IUs. Japan France Germany U.K.
SOURCE: OECD, Development Cooperation 1991 Report (Paris:OECD, 1991), pp. 202-203, table 30.
normally is permitted a very wide choice of whatcommodities on which to spend the aid. Giventhis flexibility, in many cases a recipient can useup its commodity grants on purchases that itwould on its own have chosen to make from theUnited States.
In 1990 U.S. debt relief aid was abnormallylarge. However, even if debt relief is omittedentirely, the United States spends a higher propor-tion of its aid on program assistance than the otherdonors (fig. 4-2).
The United States spends much less of its aidon large capital projects than several other majordonors. Figure 4-3 compares aid spending inseveral sectors (such as energy and water treat-ment) that could involve environmental equip-ment and services. Figure 4-3 presents percent-ages that are adjusted to omit debt relief, which in1990 was so large for the United States that itskewed all other percentages (such as for capitalprojects) downward; even so, the United Statesfalls clearly at the low end.
;1 I D Debt relief60
_ Program assistance (normallynot project-specific)
; 40—oz 30–
2 0 –
lo–
0 I 1 1 IU.S. ‘ Japan ‘ France Germany U.K.
SOURCE: OECD, Development Cooperation 1992 Report (Pans:OECD, 1992), pp. A-40, A-41, table 30.
U.S. aid (including environmental aid) empha-sizes technical assistance.10 Much of this aid isprovided as grants used to hire U.S. consultantsand service providers. Provision of these servicescould indirectly promote export of capital goods,by familiarizing recipient countries with U.S.products.
GEOGRAPHIC FOCUSAid tends to increase exports to a greater extent
when it is focused on countries with substantialmarkets for the donor’s exports. Japan’s aid,despite geographic broadening in recent years, isstill heavily focused on Asian countries. In 1990,59.3 percent of Japan’s ODA went to Asia,compared with 70.5 percent in 1980.11 SomeAsian developing countries have relatively largeand fast-growing markets for capital goods, andcould become important markets for environ-mental goods and services. Moreover, Japanesefirms already have a strong commercial presencein these countries, which should help them topursue aid-related export opportunities. More
10A few ~ge capi~ proj~ts ~ve &n supported through USAID, including major water and wastewater treatnIent ~d power satorsupport projects in Egypt.
11 Jap~e IW&try of Foreign Affairs, @j5cial Development Assistance 1991, p. 63.
38 I Development Assistance, Export Promotion, and Environmental Technology
30
25
20
E$ 152
10
5
0
Figure 4-2-Percent of Non-Debt Relief ODA Commitments Devoted to Program Assistance
1989
r IUs. Japan France Germany U.K.
SOURCE: OECD, Development Cooperation 1991 Report (Paris:OECD, 1991), pp. 202-203, table 30.
than half of the water purifying and filtering unitsexported from Japan in recent years have gone toSoutheast Asian countries.12
TYING OF AIDHow do the United States, Japan, France,
GermanY, and the United Kingdom compare inthe extent to which they tie their aid? Thisquestion has no easy answer. DAC statistics ontying have shortcomings that make comparisonsdifficult; also, one can look at the available datain different ways. In addition, certain circum-stances can make tying either more or less likelyto promote exports. Some comparisons for 1990and 1989 are presented in figures 4-4 and 4-5,13
but they must be understood in this light:
30-
25-
20-
Ea)p 15-&’
10-
5-
0-
1990
U.S. Japan France “Germany U.K.
SOURCE: OECD, Development Cooperation 1992 Report (Paris:OECD, 1992), pp. A-40, A-41, table 30.
■
■
The statistics are based on aid commitmentsmade-rather than actual funds disbursed—during a given year. Some commitments neverripen into disbursements,14 and the percentagesof each that are tied could differ.Debt relief is counted as untied because it is not
● 15 thus, the abnormallylinked to any purchases,high level of debt relief in the U.S. aid programfor 1990 skews tying statistics downward. Forthis reason, the 1989 figures probably providea more representative comparison; these showthe United States roughly even with Germanyand France (the United States tending to haveslightly less tied aid, but more partially untiedaid), and tying more than Japan but less than theUnited Kingdom. (Japan’s tying statistics arediscussed further below.)
12 As cited in Pat Murdo, “Cooperation Conflict in U.S.-Japan Environmental Relations,” JEI Report, hqmn Economic Institute,Washington DC, my 28, 1993, pp. 10-11.
Is me r~er ~o~d note tit tie ~ing stitics pr~ented ~ f~es 4-4 ~d 4-5 ~ ~erent horn procurement ShdSdCS. (ke~y, b
percentage of aid spent on goods aud serviees fkom the donor emmtry will be greatex than the percentage of tied ai~ beeause some untied aid(in addition to all tied aid) will be spent on goods and scrviees horn the donor country.
14 Fore-le, 1988 co~~en~rm~ut 15 ~rmnt~@er~&s~~men~. ~@UIS Jep~ The~ing ofAid (Pti, FIwNx: OECD,
1991), p. 22.
15 ~ ofi~ lom ~~t ~ve ~n ~~tion~ on pm~s from he donor coun&y, ei~ ~ tied tid or m non-aid export CK@S. ~ the
original loan was ai~ it would have been counted in the DAC statistics for the year it was given.
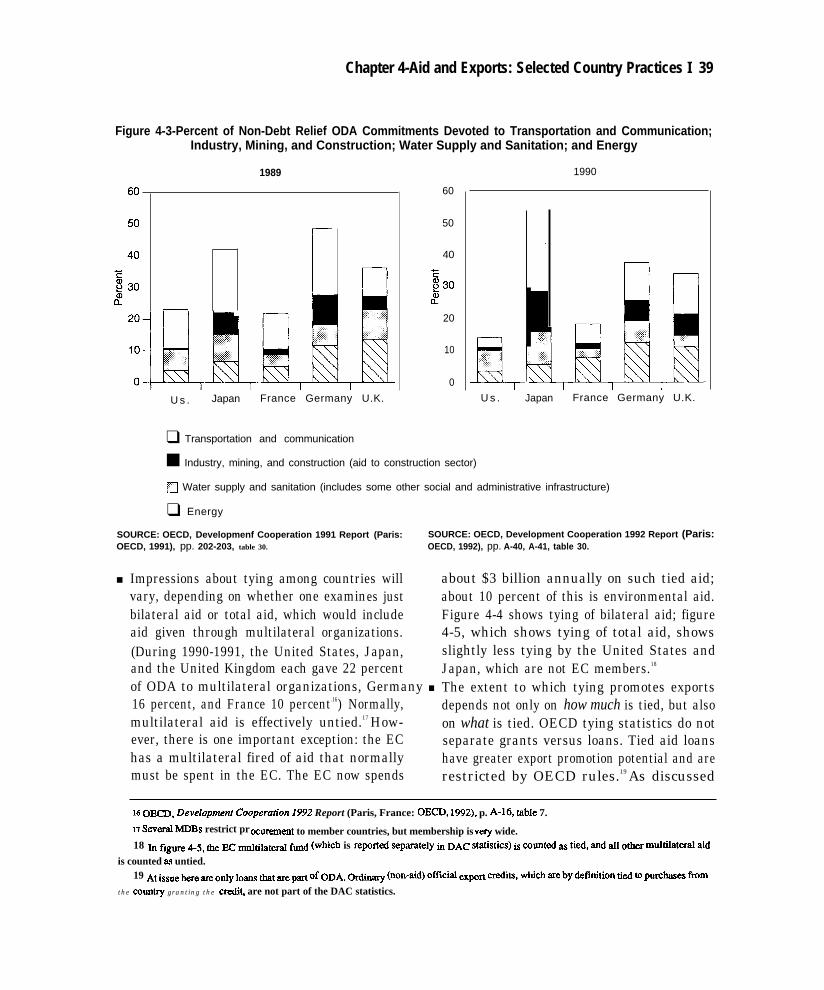
Chapter 4-Aid and Exports: Selected Country Practices I 39
Figure 4-3-Percent of Non-Debt Relief ODA Commitments Devoted to Transportation and Communication;Industry, Mining, and Construction; Water Supply and Sanitation; and Energy
1989
n
U s . Japan France Germany U.K.
❑ Transportation and communication
60
50
40
Eg 30
:
20
10
0
1990
Q
.
m-l
U s . Japan France Germany U.K.
■ Industry, mining, and construction (aid to construction sector)
Q Water supply and sanitation (includes some other social and administrative infrastructure)
❑ Energy
SOURCE: OECD, Developmenf Cooperation 1991 Report (Paris: SOURCE: OECD, Development Cooperation 1992 Report (Paris:OECD, 1991), pp. 202-203, table 30. OECD, 1992), pp. A-40, A-41, table 30.
■
�
Impressions about tying among countries willvary, depending on whether one examines justbilateral aid or total aid, which would includeaid given through multilateral organizations.(During 1990-1991, the United States, Japan,and the United Kingdom each gave 22 percentof ODA to multilateral organizations, Germany ■
16 percent, and France 10 percent.l6) Normally,multilateral aid is effectively untied.17 How-ever, there is one important exception: the EChas a multilateral fired of aid that normallymust be spent in the EC. The EC now spends
about $3 billion annually on such tied aid;about 10 percent of this is environmental aid.Figure 4-4 shows tying of bilateral aid; figure4-5, which shows tying of total aid, showsslightly less tying by the United States andJapan, which are not EC members.18
The extent to which tying promotes exportsdepends not only on how much is tied, but alsoon what is tied. OECD tying statistics do notseparate grants versus loans. Tied aid loanshave greater export promotion potential and arerestricted by OECD rules.19 As discussed
16 OEm, Devezop~nf coopera~o~ J992 Report (Paris, France: OECD, 1992), p. A-16, tibIe 7.
17 Seved MDBs restrict pr ocurernent to member countries, but membership is ve~ wide.18 ~ fiWe 45, the EC multi~ter~ ~d (which is repfi~ sep~ately ~ DA(J s~~tics) is co~t~ ss tied, m(l dl Otha mdtiaterd iiid
is counted as untied.19 Atisme &+re ~ o~y lom tit me pm of ODA. or- (non+id) offlci~ ~prt cr~i& which ~eby definition tied to pUrCb$eS hOII.1
the counhy granting the credit are not part of the DAC statistics.
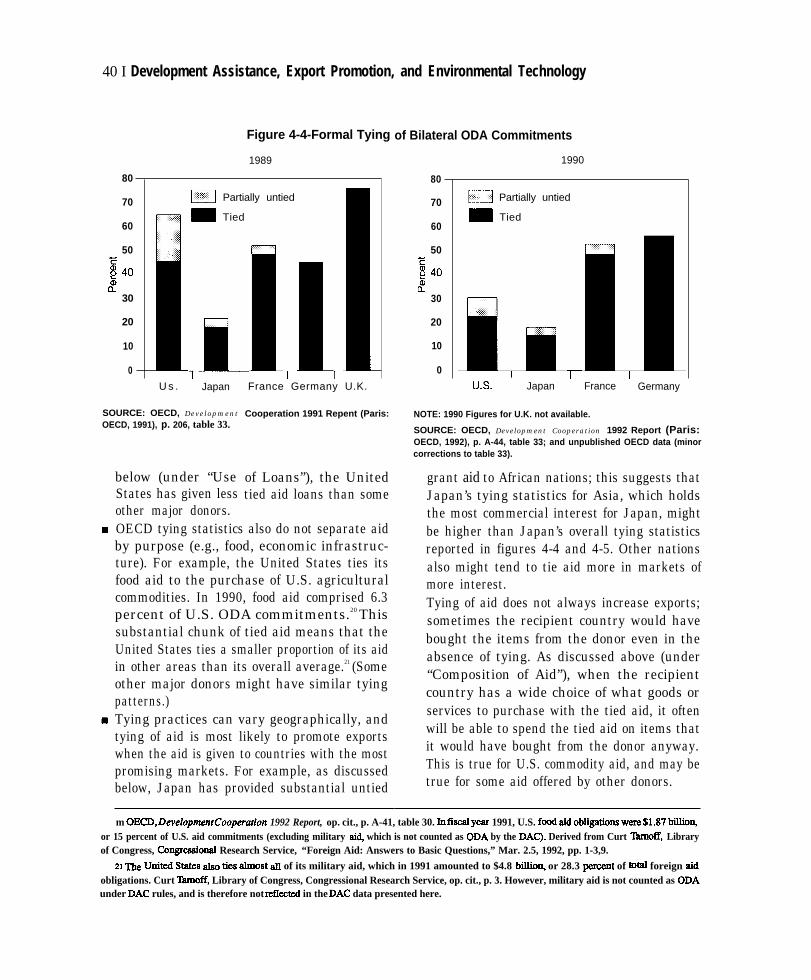
40 I Development Assistance, Export Promotion, and Environmental Technology
80
70
60
50Eg 40
$30
20
10
0
Figure 4-4-Formal Tying
1989
m Partially untied
_ Tied
U s . Japan
SOURCE: OECD, Development
OECD, 1991), p. 206, table 33.
below (under “UseStates has given lessother major donors.
1- 1-France Germany U.K.
Cooperation 1991 Repent (Paris:
of Loans”), the Unitedtied aid loans than some
OECD tying statistics also do not separate aidby purpose (e.g., food, economic infrastruc-ture). For example, the United States ties itsfood aid to the purchase of U.S. agriculturalcommodities. In 1990, food aid comprised 6.3percent of U.S. ODA commitments.20 Thissubstantial chunk of tied aid means that theUnited States ties a smaller proportion of its aidin other areas than its overall average.21 (Someother major donors might have similar tyingpatterns.)Tying practices can vary geographically, andtying of aid is most likely to promote exportswhen the aid is given to countries with the mostpromising markets. For example, as discussedbelow, Japan has provided substantial untied
of Bilateral ODA Commitments
80
70
60
50E; 40
230
20
10
0
1990
n Partially untied
m Tied
1-U.s. Japan France Germany
NOTE: 1990 Figures for U.K. not available.
SOURCE: OECD, Development Cooperation 1992 Report (Paris:OECD, 1992), p. A-44, table 33; and unpublished OECD data (minorcorrections to table 33).
grant aid to African nations; this suggests thatJapan’s tying statistics for Asia, which holdsthe most commercial interest for Japan, mightbe higher than Japan’s overall tying statisticsreported in figures 4-4 and 4-5. Other nationsalso might tend to tie aid more in markets ofmore interest.Tying of aid does not always increase exports;sometimes the recipient country would havebought the items from the donor even in theabsence of tying. As discussed above (under“Composition of Aid”), when the recipientcountry has a wide choice of what goods orservices to purchase with the tied aid, it oftenwill be able to spend the tied aid on items thatit would have bought from the donor anyway.This is true for U.S. commodity aid, and may betrue for some aid offered by other donors.
m OE~,D~eJop~ntcoop~ation 1992 Report, op. cit., p. A-41, table 30. kfkdy- 1991, U.S. fd aid obfigatiom w-$1.87 b~o~or 15 percent of U.S. aid commitments (excluding military ai@ which is not counted as ODA by the DAC). Derived from Curt lhrnoff, Libraryof Congress, Cm.qpessional Research Service, “Foreign Aid: Answers to Basic Questions,” Mar. 2.5, 1992, pp. 1-3,9.
21 n uniti Stites w ties ahnost all of its military aid, which in 1991 amounted to $4.8 billio~ or 28.3 pement of totd foreign aidobligations. Curt Thmoff, Library of Congress, Congressional Research Service, op. cit., p. 3. However, military aid is not counted as ODAunder DAC rules, and is therefore not reilected in the DAC data presented here.
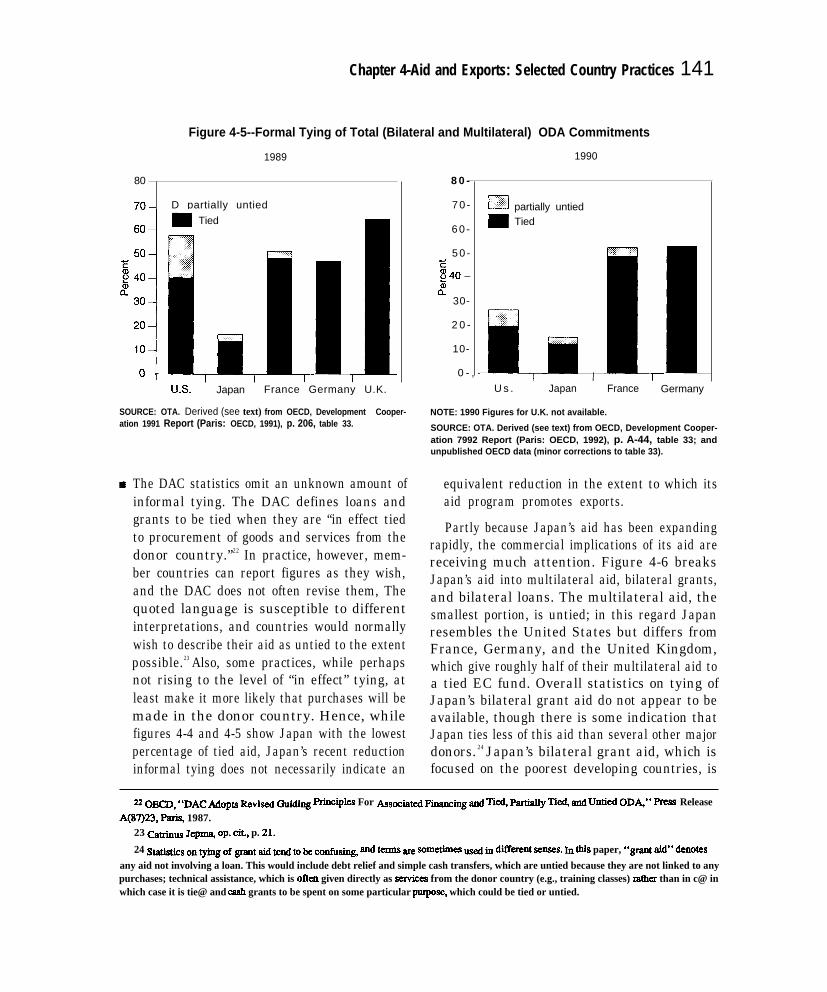
Chapter 4-Aid and Exports: Selected Country Practices 141
Figure 4-5--Formal Tying of Total (Bilateral and Multilateral) ODA Commitments
1989
80
70- D partially untied
Jm Tied60
1-U.s. Japan France Germany U.K.
SOURCE: OTA. Derived (see text) from OECD, Development Cooper-ation 1991 Report (Paris: OECD, 1991), p. 206, table 33.
The DAC statistics omit an unknown amount ofinformal tying. The DAC defines loans andgrants to be tied when they are “in effect tiedto procurement of goods and services from thedonor country.”22 In practice, however, mem-ber countries can report figures as they wish,and the DAC does not often revise them, Thequoted language is susceptible to differentinterpretations, and countries would normallywish to describe their aid as untied to the extentpossible.23 Also, some practices, while perhapsnot rising to the level of “in effect” tying, atleast make it more likely that purchases will bemade in the donor country. Hence, whilefigures 4-4 and 4-5 show Japan with the lowestpercentage of tied aid, Japan’s recent reductioninformal tying does not necessarily indicate an
8 0 -
7 0 -
6 0 -
5 0 -Eg 40 –a)
a 30-
2 0 -
10-
0 - ,
1990
D partially untiedm Tied
I r1 I I
U s . Japan France Germany
NOTE: 1990 Figures for U.K. not available.
SOURCE: OTA. Derived (see text) from OECD, Development Cooper-ation 7992 Report (Paris: OECD, 1992), p. A-44, table 33; andunpublished OECD data (minor corrections to table 33).
equivalent reduction in the extent to which itsaid program promotes exports.
Partly because Japan’s aid has been expandingrapidly, the commercial implications of its aid arereceiving much attention. Figure 4-6 breaksJapan’s aid into multilateral aid, bilateral grants,and bilateral loans. The multilateral aid, thesmallest portion, is untied; in this regard Japanresembles the United States but differs fromFrance, Germany, and the United Kingdom,which give roughly half of their multilateral aid toa tied EC fund. Overall statistics on tying ofJapan’s bilateral grant aid do not appear to beavailable, though there is some indication thatJapan ties less of this aid than several other majordonors. 24 Japan’s bilateral grant aid, which isfocused on the poorest developing countries, is
220-, ~fDAC~opts ~~~ ~d@ ~ciples For ASSOC~~F*~ @ Ti~ p-y Ti@, @ Untied OD~” PrCSS Release
A(87)23, Psris, 1987.23 @~W J~~ op. CiL, p. 21.
24 s~tics on ~ of -t ~d ~~ @ & cofi~g, ~d t- ~ ~metimes ~~ in &erent senses. ~ this paper, “~ tid” dates
any aid not involving a loan. This would include debt relief and simple cash transfers, which are untied because they are not linked to anypurchases; technical assistance, which is often given directly as semices from the donor country (e.g., training classes) rather than in c@ inwhich case it is tie@ and cash grants to be spent on some particular pupae, which could be tied or untied.
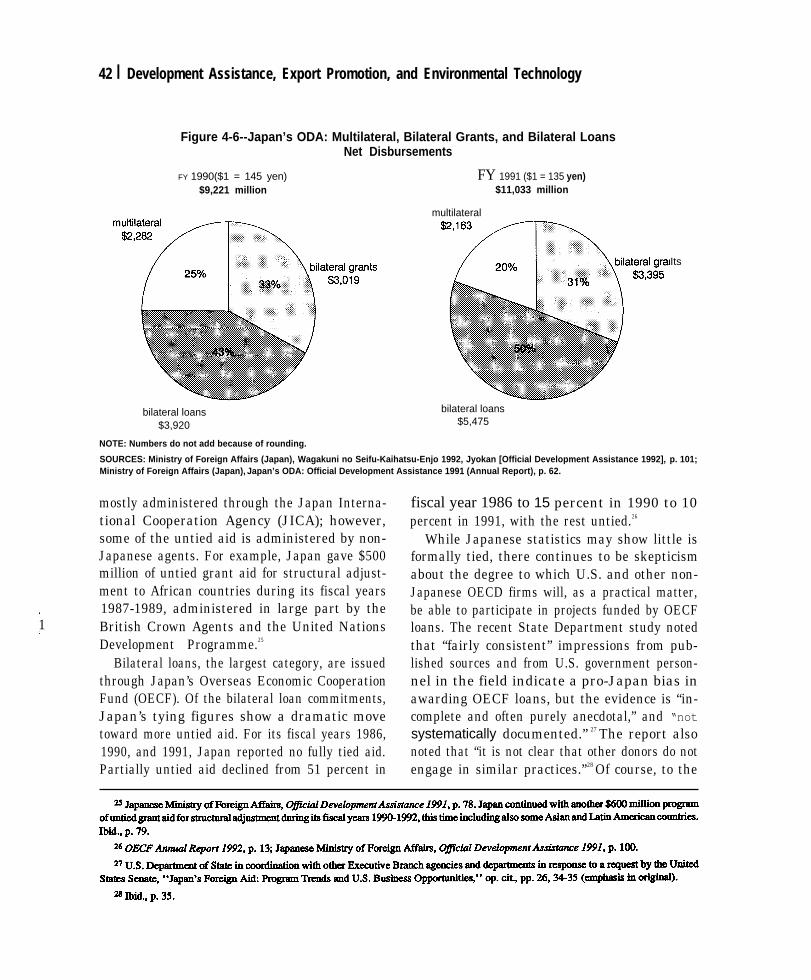
42 I Development Assistance, Export Promotion, and Environmental Technology
Figure 4-6--Japan’s ODA: Multilateral, Bilateral Grants, and Bilateral LoansNet Disbursements
FY 1990($1 = 145 yen) FY 1991 ($1 = 135 yen)$9,221 million $11,033 million
multilateral
Its
bilateral loans bilateral loans
$3,920 $5,475
NOTE: Numbers do not add because of rounding.
SOURCES: Ministry of Foreign Affairs (Japan), Wagakuni no Seifu-Kaihatsu-Enjo 1992, Jyokan [Official Development Assistance 1992], p. 101;Ministry of Foreign Affairs (Japan), Japan’s ODA: Official Development Assistance 1991 (Annual Report), p. 62.
mostly administered through the Japan Interna-tional Cooperation Agency (JICA); however,some of the untied aid is administered by non-Japanese agents. For example, Japan gave $500million of untied grant aid for structural adjust-ment to African countries during its fiscal years
1 1987-1989, administered in large part by the1 British Crown Agents and the United Nations!
Development Programme.25
Bilateral loans, the largest category, are issuedthrough Japan’s Overseas Economic CooperationFund (OECF). Of the bilateral loan commitments,Japan’s tying figures show a dramatic movetoward more untied aid. For its fiscal years 1986,1990, and 1991, Japan reported no fully tied aid.Partially untied aid declined from 51 percent in
fiscal year 1986 to 15 percent in 1990 to 10percent in 1991, with the rest untied.26
While Japanese statistics may show little isformally tied, there continues to be skepticismabout the degree to which U.S. and other non-Japanese OECD firms will, as a practical matter,be able to participate in projects funded by OECFloans. The recent State Department study notedthat “fairly consistent” impressions from pub-lished sources and from U.S. government person-nel in the field indicate a pro-Japan bias inawarding OECF loans, but the evidence is “in-complete and often purely anecdotal,” and “notsystematically documented.” 27 The report alsonoted that “it is not clear that other donors do notengage in similar practices.”28 Of course, to the
Chapter 4-Aid and Exports: Selected Country Practices 143
extent that other non-U.S. donors engage in suchpractices, that too poses a greater commercialchallenge to the United States than the formaltying statistics would suggest.29 To the extent thatthe United States engages in such practices, theUnited States could be reaping commercial ad-vantages beyond what its tying statistics wouldsuggest. However, such practices would probablybe primarily for grant aid (since the United Statesgives very little loan aid), which has less potentialto promote exports for a given amount of net aidexpenditure.
As is evident from the following discussion,some Japanese ODA practices that tend to favorJapanese firms continue to be widely used, whileother practices that onceappear to be changing.
1 Feasibility Studies30
As discussed in chapterparticular country does a
conferred such favor
3, when a firm from afeasibility study, that
tends to make it more likely that a firm from thesame country will win the contract for the mainproject. This is a rationale for the United States’Trade and Development Agency (TDA), whichties grants for feasibility studies to help U.S. firmswin contracts for the subsequent development
projects (see app. B). Japan’s practices encouragethe selection of Japanese firms to do feasibilitystudies for proposed OECF loan projects, all ofwhich require a feasibility study before they cango ahead. Whether intended or not, the use ofJapanese firms to do feasibility studies probablytends to steer the main projects to Japanese firms.
Feasibility studies for OECF projects can bedone by JICA, the recipient country, or interna-tional organizations. JICA studies are paid for byJapan and constitute grant aid. JICA’S annualbudget for these studies is about $200 million—many times larger than TDA’s present budget forfeasibility studies (though increases in TDA’sbudget have been proposed).31 JICA hires con-sultants to do these studies. JICA will hire onlyJapanese fins; some participation by non-Japanese nationals is permitted but rare.32 Forsome studies not done by JICA, the use ofJapanese firms is probably encouraged by subsi-dies given to consulting firms by the Japanesegovernment. For example, in its 1991 fiscal year,MITI provided 420 million yen (roughly $4million) to various associations of consultingfirms, for distribution to their members for use onpre-project studies for possible aid projects.33
29 For e-le, in lg89 the Export-Import Bank of the United StateS report@ “Advance bidding, whereby public *e@ p-es thef~ conclusion of an aid agreemen~ allows the German government to conclude an agmxnent only if the contract is won by a Germsn firm.”Export-Import Bank of the United States, Report to the U.S. Congress on TiedAid CredJ”t Practices, April 1989, p. 63. As well as permittingcancellation (or downsizing) of jobs not won by a German f% this practice could encourage potential aid recipients to seek out and fhvorGerman suppliers.
30 me ~o~tion abut lap-e practices in this section is derived primmily tim OEcFAnnuaZReport J99Z P. 1*, JfC4 “JaPm’SGrantAidBudgetforPY 1992”; JIC& “GeneadInformationfor the Participation OfNon-Japanese Consultants,” undated (given out byJICAin March 1993); U.S. Department of State in coordination with other Executive Branch departments and agencies in response to a request bythe United States Senate, “Japan’s Foreign Aid: Pmgrsm ‘llends and U.S. Business Opportunities,”op. cit,; and other information from JICA.OTA could not obtain information from OECF’S Washington office for this repofi because OECF insisted on preconditions that OTA couldnot accept.
31 ~~~s fi~ ~= 1992 ~dget for ‘~development s~dies” w= $226 million ($66 won of which -e from ~. ~~ “Japan’s
Grant Aid Budget for FY 1992.” This budget includes not only feasibility studies for particular projects, but “master plan” studies to setdevelopment priorities for a country as a whole. The amount spent just on feasibility studies is not given.
TDA’s fiscal year 1993 budget is $40 million, most of which goes to feasibility studies and rela~ prehninary “definitional missions.”
32 m t- _er must be Japtwse; Japanese nationals must constitute at least half the team members and perform at least half theperson-months of effort. JICAmust approve any use of foreign nationals. From June 1988, when use of foreign nationals was first permitithrough August 1992, 132 foreign consultants were used for development studies. JIC~ “General Information for the Participation ofNon-Japanese Consultants,” op. cit. For compariso~ in fiscal year 1988 JICA development study teams used more thim 3,000 people.
33 Ministry of Finance (Japan), Hojokin Soran [Subsia?es Digest] FY 1991, p. 386.
44 I Development Assistance, Export Promotion, and Environmental Technology
I Tying of a Project’s EngineeringManagement
In the last several years, OECF often hasreported projects in several East Asian countriesas untied, except that “consulting services,”which includes project management, are reportedas partially untied, so that only Japanese and LDCfirms are eligible. Since relatively few LDC firmspossess the necessary experience for managementof a sophisticated engineering project, partialuntying can at times be tantamount to full tying.Even if some LDC firms win contracts, the rest goto Japanese firms; U.S. or other OECD countryfirms would not be eligible. The presence of aJapanese firm managing a project could make iteasier for Japanese firms to win other parts of theproject, even if the managing firm did notconsciously try to favor Japanese fins. Someanalysts report that Japanese consulting firmsoften write detailed project specifications thatfavor Japanese firms.34 OECF maintains thatunder its guidelines project specifications “can-not” be drawn to favor particular firms, but hasnot cited specific language in those guidelines.35
Japan is reducing its use of LDC-untied projectmanagement; the practice was relatively rare in its1992 fiscal year except for Indonesia (whichaccounted for 14 percent of loan commitments),for which it was still the norm.36 According to theState Department study, the Indonesian govern-ment has successfully pressed for award of asubstantial portion of engineering service con-tracts to domestic Indonesian firms.
B Request-Driven Aid SystemTraditionally, Japan has made aid decisions
based largely on specific requests from recipientgovernments. In the past, it would evaluate eachproject on its own, without considering how it fitinto the country’s overall development needs.(The United States has traditionally worked withdeveloping countries to prioritize projects withinan overall country plan. USAID has more peoplein the field than JICA and OECF, making thatdialogue more feasible.)
Japan’s aid appears to be changing to give moreattention to a country’s overall priorities. Increas-ingly, Japanese and developing country officialsmeet to discuss the country’s development strat-egy and its relation to Japanese aid. As of March31, 1991, Japan had sent missions to ten develop-ing countries to establish overall developmentpriorities, and had sent missions to nine develop-ing countries to establish environmental priori-ties.37 Also, JICA now sends study teams toevaluate proposed projects in the context of theoverall development plan. Environmental aidmay be serving as a testing ground for Japan’snew approach. MITI has stated that its $2.5 billionGreen Aid Plan (ch. 5) will rely on “policydialogue’ between Japan and the recipient coun-try to prioritize projects, rather than evaluation ofrequested projects in isolation.38
However, Japanese aid is probably still largelyrequest-driven; this may be true even for environ-mental aid. The request-driven approach letsJapanese firms encourage projects of their choos-ing, if they establish close ties with firms in a
~ For e~ple, Fujim~ MU a former employee of the Japan External Trade Association (JETRO), wrote, “IfJapanese ~mmtsare employed for yen-loan projects, they often draw up specifications that only Japanese contractors can meet.” “The Untying of JapaneseAid: New Opportunities for Trade and Investment,”Private Investment and Trade Opportunities (PITO) Economic Brief No. 9 (Honolulu:East-West Center Institute for Economic Development and Policy, May, 1992), p. 22. Mr. Fujimura notex however, that because of “yenappreciation, Japanese consuhancy does not always guarantee procurement from Japam ”
35 U.S. wp~at of Stite in coor~tion with other Executive Branch agencies and departments in response to a request by the UnitedStates Senate, “Japan’s Foreign Aid: Program Trends and U.S. Business Opportunities,” op. cit., p. 35.
36 OECF An~lRepo~ 1992, pp. 87-117.
37 m, Wag&ni no Selfi-Kai~tm-Enjo 1992, Jyokun IO#icial Development Assistance 19921, pp. 6*-69.
38 ~, Ka@o G~utSu Iten ~“ Ka~ru sogote~” Shien (Green Aid Plan) No Suishin ni Tsuite (Promotion Of comprehemive Asm”stame
Concerning Environmental Technology Transjkr “GreenAidPlan”), March 1992.
Chapter 4-Aid and Exports: Selected Country Practices I 45
developing country that can influence that gov-ernment’s requests.39 The State Department hasobserved that “in practice recipient countries arefrequently ill-equipped to set priorities, preparerealistic proposals, and oversee implementation.Japanese trading firms often step into the vacuumto assist in project identification and design.”40
Even under the policy dialogue approach, Japa-nese firms may influence project selection byinfluencing the Japanese government’s posi-tion;41 U.S. firms similarly might be able toinfluence USAID’S project selection process.
S Other FactorsThe State Department study states that “recipi-
ent country governments often believe that whileJapan’s aid is formally untied, they are obliged toselect Japanese suppliers, either as a gesture ofgratitude or as a pragmatic means of ensuring thecontinued flow of Japanese ODA commitments.’ ’42
The same might be said of the United States andother donors’ ODA. Another factor is accessibil-ity of information on upcoming projects: it is hardfor U.S. firms to learn of opportunities without
having a presence in Japan. Again, the effect isnot limited to Japanese ODA; it takes effort fornon-U.S. firms to learn about U.S. ODA.
Despite the difficulties and apparent barriers,some U.S. firms could benefit from JapaneseODA. There have been several recent examples ofsuccessful efforts by U.S. firms to participate inJapanese ODA, and Japanese contract proceduresare becoming more competitive, according to theState Department study.43 The U.S. government,with assistance from the Japanese government, isproviding information to U.S. firms about how tocompete for Japanese ODA.44
Statistics from the Japanese Government seemto suggest that in fact large quantities of Japaneseaid are spent outside of Japan (and thus to suggestthat the concerns raised above regarding opportu-nity for non-Japanese firms are misguided). Forexample, of its 1990 untied bilateral loans, Japanreports that only 20 percent of the procurementwent to Japan, with 55 percent going to develop-ing countries and 25 percent going to other OECD
39 ~ p~iple, ~ from oh countries could similarly develop ties with the developing COUntfy to ~umw its r~ests to JW~
However, in practice Japanese fhms have advantages. Firms from other countries might not understand Japan’s request syst~ and thus notappreciate the need to form such ties to influence requests. Japanese firms might also appear more credible in helping the recipient governmentto frame a request in a way likely to gain approval fkom Tokyo. Also, the system favors incumbent donors, those already with strong ties todeveloping countries; Japan is already the incumbent in several promising East Asian markets.
40 U.S. Dep~mt of Smte ~ cmr~tion ~th o~a ~~tive Br~h agencies ~d dep~ents in response to a quest by the United
States Senate, “Japan’s Foreign Aid: Program Trends and U.S. Business Opportunities,” op. cit., p. 15.
AI ~ Smte Department study sties:~]rivateJapanese firma reportedly “lend” short-term employees to short-staffed JICAandOECF. When secxmdedtoLJXministriesas “technical experts,” these employees often advance proposals in which theirf~ have au interest. For example, in 1991, a JICAofflcialindicated thatprivate employees comprised some 30% of JICAexperts inIndonesia. Meanwhile, an OECDIDAC survey foundthat seconded Japanese experts strongly influenced Indonesia ODA project requests, indeed originated some projects, and an OECFofficial echoed that fact to U.S. government visitors to Tokyo in 1991.
Ibid., pp. 34-35.
42 Ibid., p. 32.43 mid., ~. 1, 6, 54570 ~ Stite Dep~ent repofi iden~led my ~es M over $5 ~c)q ~ost m of those W- fOr kICOmOtiVeS,
locomot.iveparts, orlocomotiverehabilitation by Oeneral Electric and General Motors (sometimes by their foreign subsidiaries). In some cases,General Electric aud General Motors were subcontractors. The report also idmtifkd other types of contracts, including several consultingcontracts.
4 4 @ example is a guide to Japanese ODA for U.S. firms that is part of the State Department stud~ another is the Japan OfficialDevelopment Assistance Conference in Tt@o, Nov. 9-11, 1992, sponsored by the Departtmmt of Commerc e, in which Japanese officials(among others) spoke to 72 U.S. firms about Japanese ODA.
46 I Development Assistance, Export Promotion, and Environmental Technology
countries.45 Of its total fiscal year 1991 loancommitments, Japan reports that only 31 percentwent to Japan, with 48 percent going to develop-ing countries and 21 percent to other OECDcountries. 46
However, the State Department study reportsthat it is impossible to verify such statistics,though this problem is not unique to Japan.47 Someskepticism has been expressed about Japan’sprior statistics on procurement. An Americanresearcher, after extensive efforts to verify statis-tics on procurements from non-Japanese firmsduring 1986-1990, was left with large gapsbetween Japan’s reported statistics and the actualprojects that could be accounted for, and con-cluded that the gaps could not be explained by thefact that certain types of data were Withheld.48
Also, Japan counts as non-Japanese any pur-chases from joint Japanese-LDC joint ventureswith majority LDC ownership, even though muchof the procurement in such cases might ultimatelycome from Japan. OECF’S 1992 annual reportshows many such joint ventures.49
USE OF LOANSAs discussed in chapter 3, for a given amount
of net aid expenditure, giving aid not in pure grantform, but with a loan component, increases the
aid’s potential to promote exports. Loan aid istypically used for large capital projects (such aspower plants and waste water treatment plants),which are most often too expensive to fund bygrants alone. Of the five major donors consideredhere, Japan uses loan aid the most, and the UnitedStates and the United Kingdom the least (fig.4-7).50 While loan aid may tend to increaseexports, export promotion is not necessarily theprime motivation. Japan states that use of loansrather than grants benefits aid recipients bymaking them take more responsibility for theirdevelopment, and that loans for inrastructure arecentral to economic development (based in parton its own rebuilding experience after the SecondWorld War).
Aid loans have the most export potential whenthey are tied, in which case they are called “tiedaid credits.” As used in this background paperand OECD statistics, the term “tied aid credits”includes partially untied as well as tied loans.While OECD collects statistics from most mem-ber countries on tied aid credit offers, thesestatistics are publicly available for recent yearsonly as a total for all countries combined, and noton an individual country basis. For the period1984-1987, the total U.S. notifications of offers($1.1 billion) were far less than for Japan ($8.0
45 ~, Kei~iKyo~o~ no Genjo to Mondiriten, Heisei 4 (“Present Situation and ISSUeS in Economic COOpemtiOX4 1992”), P. 28. ~source does not specify whether these percentages refer to commitments or disbursements.
~ OEC!FAnnual Report 1992, p. 13.
47 Ja~~ ~d ~ ~d r=ipiats ~ reluc~t to rev~ ce~ &~ ~use ~ey wish to protect bus~ess proprietary @ w, reC@klltS do
not always adequately record the data. These problems occurwithmost donors. Also, recipient countries could bereluctauttoreveal informationthat might reflect poorlyon a major aid donor. U.S. Department of State in coordination with other Executive Branch agencies and departmentsin response to a request by the United States Senate,“Japan’s Foreign Aid: Program Trends and U.S. Business Opportunities,” op. cit., pp.1,25.
4S ~gm ~im Doing Good or Doing well: Japan’s Foreign Aid Program (New York NY: Columbti University ~ss) 1992), ch. 3’
.49 OE@’A-/Repo~ ~g$)z, pp. 136.139. OE~ does not fit ~ of its con~tors. However, of 54 p~es lis&tf U (k@ COIIStlUCtiOll
work 6 were such joint ventures (including 4 joint ventures involving f- from Jap~ a developing country, and another OECD country);andof 51 parties listed as doing consulting work 15 were suchjointventures. (For this tally, the same party working on two contracts is countedas two parties.)
some ~utige of ODA ~ven k ~m ~t form is computed by taking the 1991 “S- of tits in to~ OD&” D~ezop~nt
Cooperation 1992 Report, p. A-43, ‘Ihble 32 (the figure for France, missing from that table, was supplied separately by DAC), and subtractingthe portion of that grant share that (based on O’IA’s interpretation of unpublished DAC data) was combined together with other financing (e.g.,a commercial loan) in an “associated financing” package (also called “mixed credits”). Figure 4-7 gives the reverse percentage, i.e., thepercentage of ODA not given in pure grant form.
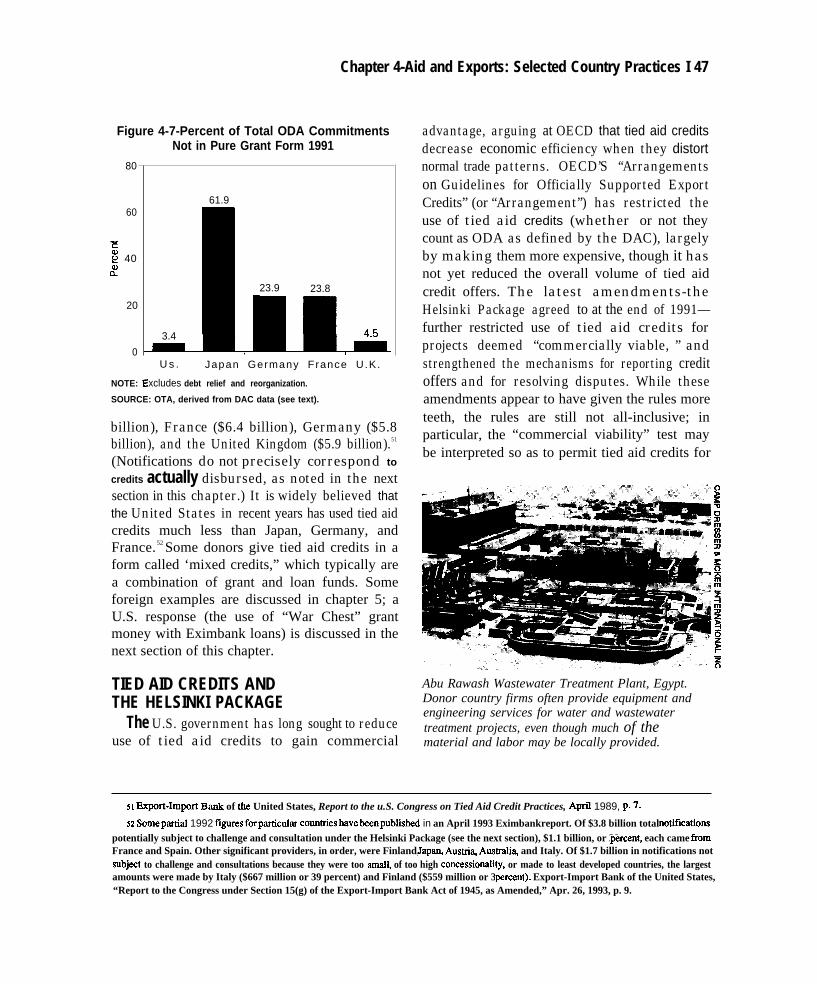
Chapter 4-Aid and Exports: Selected Country Practices I 47
Figure 4-7-Percent of Total ODA CommitmentsNot in Pure Grant Form 1991
80
60
E; 402
20
0
NOTE:
3.4
61.9
23.9 23.8
J_mU s . Japan Germany France U.K.
xcludes debt relief and reorganization.
SOURCE: OTA, derived from DAC data (see text).
billion), France ($6.4 billion), Germany ($5.8billion), and the United Kingdom ($5.9 billion).51
(Notifications do not precisely correspond to
credits actually disbursed, as noted in the nextsection in this chapter.) It is widely believed thatthe United States in recent years has used tied aidcredits much less than Japan, Germany, andFrance.52 Some donors give tied aid credits in aform called ‘mixed credits,” which typically area combination of grant and loan funds. Someforeign examples are discussed in chapter 5; aU.S. response (the use of “War Chest” grantmoney with Eximbank loans) is discussed in thenext section of this chapter.
TIED AID CREDITS ANDTHE HELSINKI PACKAGE
The U.S. government has long sought to reduceuse of tied aid credits to gain commercial
advantage, arguing at OECD that tied aid creditsdecrease economic efficiency when they distortnormal trade patterns. OECD’S ‘‘Arrangementson Guidelines for Officially Supported ExportCredits” (or “Arrangement”) has restricted theuse of tied aid credits (whether or not theycount as ODA as defined by the DAC), largelyby making them more expensive, though it hasnot yet reduced the overall volume of tied aidcredit offers. The latest amendments-theHelsinki Package agreed to at the end of 1991—further restricted use of tied aid credits forprojects deemed “commercially viable, ” andstrengthened the mechanisms for reporting creditoffers and for resolving disputes. While theseamendments appear to have given the rules moreteeth, the rules are still not all-inclusive; inparticular, the “commercial viability” test maybe interpreted so as to permit tied aid credits for
Abu Rawash Wastewater Treatment Plant, Egypt.Donor country firms often provide equipment andengineering services for water and wastewatertreatment projects, even though much of thematerial and labor may be locally provided.
51 EXPrt.~pofi Bank of the United States, Report to the u.S. Congress on Tied Aid Credit Practices, APfl 1989, p. 7.
52 somepfi~ 1992 fiweSforp~c~m coun~es~vebeenpubfish~ in an April 1993 Eximbankreport. Of $3.8 billion total no~cationspotentially subject to challenge and consultation under the Helsinki Package (see the next section), $1.1 billion, or 29 pereent, each came ffomFrance and Spain. Other significant providers, in order, were Finland, Jap~ Austriz Auslrali~ and Italy. Of $1.7 billion in notifications notsubjeet to challenge and consultations because they were too smal~ of too high concessionality, or made to least developed countries, the largestamounts were made by Italy ($667 million or 39 percent) and Finland ($559 million or 32 pereent). Export-Import Bank of the United States,“Report to the Congress under Section 15(g) of the Export-Import Bank Act of 1945, as Amended,” Apr. 26, 1993, p. 9.
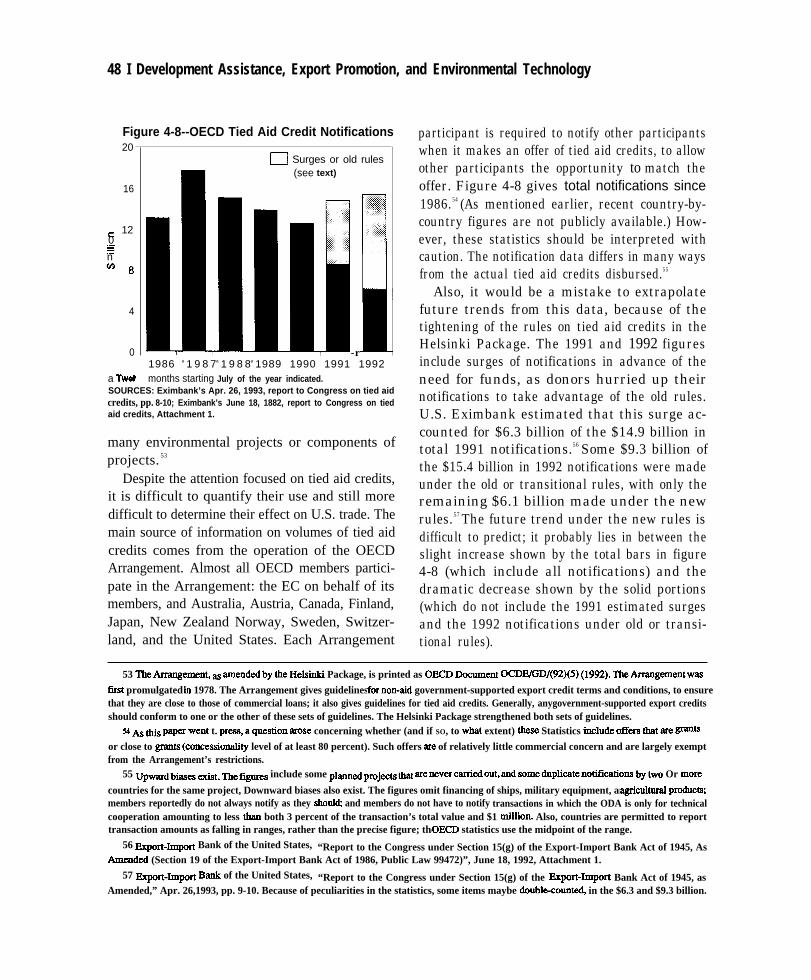
48 I Development Assistance, Export Promotion, and Environmental Technology
Figure 4-8--OECD Tied Aid Credit Notifications20
16
c 120.-=.-n‘8
4
0
a TwelI
D Surges or old rules(see text)
-r1986 a 1 9 8 7a 1 9 8 8a 1989 1990 1991 1992months starting July of the year indicated.
SOURCES: Eximbank’s Apr. 26, 1993, report to Congress on tied aidcredits, pp. 8-10; Eximbank’s June 18, 1882, report to Congress on tiedaid credits, Attachment 1.
many environmental projects or components ofprojects. 53
Despite the attention focused on tied aid credits,it is difficult to quantify their use and still moredifficult to determine their effect on U.S. trade. Themain source of information on volumes of tied aidcredits comes from the operation of the OECDArrangement. Almost all OECD members partici-pate in the Arrangement: the EC on behalf of itsmembers, and Australia, Austria, Canada, Finland,Japan, New Zealand Norway, Sweden, Switzer-land, and the United States. Each Arrangement
participant is required to notify other participantswhen it makes an offer of tied aid credits, to allowother participants the opportunity to match theoffer. Figure 4-8 gives total notifications since1986.54 (As mentioned earlier, recent country-by-country figures are not publicly available.) How-ever, these statistics should be interpreted withcaution. The notification data differs in many waysfrom the actual tied aid credits disbursed.55
Also, it would be a mistake to extrapolatefuture trends from this data, because of thetightening of the rules on tied aid credits in theHelsinki Package. The 1991 and 1992 figuresinclude surges of notifications in advance of theneed for funds, as donors hurried up theirnotifications to take advantage of the old rules.U.S. Eximbank estimated that this surge ac-counted for $6.3 billion of the $14.9 billion intotal 1991 notifications.56 Some $9.3 billion ofthe $15.4 billion in 1992 notifications were madeunder the old or transitional rules, with only theremaining $6.1 billion made under the newrules.57 The future trend under the new rules isdifficult to predict; it probably lies in between theslight increase shown by the total bars in figure4-8 (which include all notifications) and thedramatic decrease shown by the solid portions(which do not include the 1991 estimated surgesand the 1992 notifications under old or transi-tional rules).
53 ~ae=nt, ~ ~~d~by the He~fi Package, is printed as OECD Document OCDE/GD/(92)(5) (1992). ~e~%~entw~
fmt promulgated in 1978. The Arrangement gives guidelines fornon-aid government-supported export credit terms and conditions, to ensurethat they are close to those of commercial loans; it also gives guidelines for tied aid credits. Generally, anygovernment-supported export creditsshould conform to one or the other of these sets of guidelines. The Helsinki Package strengthened both sets of guidelines.
w ~ this pa~ went t. press, a question ~se concerning whether (and if SO, to wht extent) ~= Statistics include offers tit we ~ts
or close to grauta (concessionality level of at least 80 percent). Such offers are of relatively little commercial concern and are largely exemptfrom the Arrangement’s restrictions.
55 upw~bim= ~t. ~efi~s include some p~~pmj~ts ~ ~e~verc~~ out, ~d ~medupli~~no~lcations by fSVO Or IIiOre
countries for the same project, Downward biases also exist. The figures omit financing of ships, military equipment, and agricukuralprod ucts;members reportedly do not always notify as they should and members do not have to notify transactions in which the ODA is only for technicalcooperation amounting to less tban both 3 percent of the transaction’s total value and $1 dlion, Also, countries are permitted to reporttransaction amounts as falling in ranges, rather than the precise figure; the OECD statistics use the midpoint of the range.
56 F@ort.@ofi Bank of the United States, “Report to the Congress under Section 15(g) of the Export-Import Bank Act of 1945, AsArmmded (Section 19 of the Export-Import Bank Act of 1986, Public Law 99472)”, June 18, 1992, Attachment 1.
57 F@ort.~pofi Bank of the United States, “Report to the Congress under Section 15(g) of the ExporMmport Bank Act of 1945, asAmended,” Apr. 26,1993, pp. 9-10. Because of peculiarities in the statistics, some items maybe double-cmm~ in the $6.3 and $9.3 billion.

Chapter 4-Aid and Exports: Selected Country Practices I 49
Tied aid credits on balance probably havelessened U.S. exports, though it is difficult to sayby how much. In the mid- 1980s the United Statesprobably lost billions of dollars in exports be-cause of foreign tied aid credits, though the figureis quite uncertain.58 The losses will likely be lessunder the latest OECD rules: even if the volumeof total tied aid credit offers does not decline, thelatest OECD rules will likely shift tied aid creditsto projects with less overall commercial effect (asdiscussed below).
Since 1983, the Arrangement has imposedcertain minimum “concessionality levels” ontied aid credits.59 The idea was to make thesecredits more expensive for donors, thus decreas-ing their use and limiting their power to leverageaid dollars into exports.60 Also, packages withhigher concessionality levels were thought lesslikely to distort trade.61 The minimum levels havebeen raised three times since (fig. 4-9). However,the tied aid credits notifications stayed in the $10to $15 billion dollar range into the 1990s.
In 1988, the DAC (whose membership does notcorrespond precisely to the participants in theArrangement) adopted Guiding Principles urgingdonors to limit use of tied aid credits to “priorityprojects and programmes which are carefully
Figure 4-9-Minimum Concessionality Levels forTied Aid Credits
Poorest countriesr
// Other countries
2 0 4
0 1 I 1 [ 1 I I I 1
1983 84 85 86 87 88 89 90 91 92 93
Year a
a Minimum levels shown are those in effect as of July of the given year.
SOURCE: OTA, derived from Eximbank reports and information fromthe Treasury Department.
appraised against developmental standards.’ ’62 Inaddition to serving development goals, suchlimits could, if followed, prevent the use oftrade-distorting tied aid credits in cases where theproject did not meet the developmental standards.However, these Guiding Principles were non-binding and had no provision for enforcement,
58A 1989 qofi by the Export-Import Bank of the United States ~) egtimates that U.S. firms lost $400-$800 million in exportsannually during 1985-1988 because of foreign tied aid credits. Bxport-Irnport Bank of the United States, Report to the U.S. Congress on TiedAid Credz”t Pructices, April 1989, p. 142. This estimate considers only sales lost direetly to offess supported by tied aid credits; it does notconsider any losses in follow-on work. Also, one expert argues that the data presented in tbat report instead support a much highes estimateof directly lost sales, $2.4-4.8 billion. Ernest Preeg, The ZI”edAid Cre&”t Issue: U.S. Export Competitiveness in Developing Counm”es (Centerfor Strategic and International Studies: WashingtOrq DC, 1989). Whichever figures sreu~ tbis export loss was much greater than the exportgain fkomU.S. use of tied aideredits, which avemg~ aecordingto the%imbankrepo~ at most $250 million annually during this period ($250million is the average annual value of ull exports made using tied aid credits, whether or not the exports would have btxmmade without them).
59 Conmptiy, the ~mssio~~ level represents the extent to which the aid is a -t M OppOsd to a Iom A Pm -t wo~d tiea coneessionality level of 1(K) percen~ and a loan on terms deemed emnrnercial a concessionslity level of O percent. ‘lbchnieally, theconeessionality level of a soil loan equals the face value of the lotq minus the present value of the future repayment stream (using a referencediscount rate to represent commercial rates), all divided by the face value of the loan.
60 For -le, ~th a ~omssio~~ floor of 25 Wmen~ -h doll~ of ~d ~ ~ l~~g~ at most into 4 do- of CXpOltS; with a
eoneessionality floor of 50 pereen~ each dollar of aid ean be leveraged into at most 2 dollars of exports.61 T&~~ap-e$5 ~~s5io@~ level (ioe., ~ clos~ it is to apme -t), ~ more ~ely it is tit the pw~gewill fund P~-
that othenvise would not have been made, rather than divert purchases from one supplier to snother. John Ray, “Commercial Viability In theHelsinki Pa&age” (mimeo., undated), pp. 4-5.
62 ~~DAC Guidi,ng~iples for~m~~ Financing and Ti~ and Partially Untied Official Development Assistance,” tiOptOd Apr. %1987, attached to press release, “DAC Adopts Revised Guiding Principles for Associated Financing And Tied and Partially Untied CMcialDevelopment Assistance,” PRESS/A(87)23, Apr. 28, 1987.

50 I Development Assistance, Export Promotion, and Environmental Technology
200
180
160
140
120K: 100~
80
60
40
20
0
Figure 4-10--U.S. Eximbank War Chest Grant Funds
_ authorized
150
78.1
D disbursed
150 150 150
7.6 0
n added USAID grants
53.4
30
150 14— 5 150
5.1
1987 1988 1989 1990 1991 1992
SOURCE: Eximbank’s June 18,1992, report to Congress on tied aid credits, Attachment 3; U.S. Congress, GeneralAccounting Office, Export Finance: The Role of the U.S. Export-Import Bank, GGD-93-39 (Washington, DC: U.S.Government Printing office, Dee. 23, 1992), pp. 48-49.
and in fact development priorities have notalways been observed.
To provide leverage for U.S. negotiations torestrict the use of tied aid credits, Congress in1986 established a “War Chest” of grant moneyto be combined with Eximbank loans. The WarChest was intended to let the United Statesrespond in kind to foreign tied aid credits.63
! However, the War Chest’s effectiveness has beenlimited by its size and manner of use. In its initialI1 five years, the War Chest was authorized at only$150 million per year (fig. 4-10), much less than1I the corresponding sums used by several foreign
i countries, so that only a small fraction of foreignoffers could be matched.@ In three of the sixyears, the War Chest was used relatively aggres-sively to gain leverage in negotiations concluded
in 1987 and 1991. In the other years, the WarChest was used sparingly if at all, and then onlywhen a foreign country violated or derogatedfrom the recently concluded agreement. Recentlegislation has increased the War Chest authoriza-tion to $500 million annually for FY 1993-1995,65 though again the amounts authorized willnot necessarily be spent. Eximbank’s statedintention is to use the War Chest “selectively,’with the “focus” on enforcing the new rules.66
Eximbank points out that War Chest use candisproportionately reduce the funds available forordinary export credits. The reason is that thesubsidy component of each Eximbank loan iscounted against Eximbank’s overall appropriations;loans using War Chest funds are subsidized much
6312 U.s+c. Gqsi.’j.
64 ww~st ** ~ not ~qw~ly ~ppmpfi~ w= QSt ~~ ~ ~g~ ~fit mw’s OVerall appro~on levels. In some
years, as shown in figure 4-10, some USAID grant funds were added to the War Chest to support additional tied aid credits.When combined with Eximbank loans, $150 million in War Chest grant funds would typically yield about $430 million in tied aid credits.
This assumes a 35 percent cxmcessionality level.65 ~~ Enbm&ment Act of 1992, Public hW 102429, Sec. 103.66 fiPfl-~Pfl Bti Of he Unitd Swes$ “Report to the Congress under Section 15(g) of the E!xpofi-hnport Bank Act of 1945, as
Amend@” Apr. 26,1993, pp. 13-14.
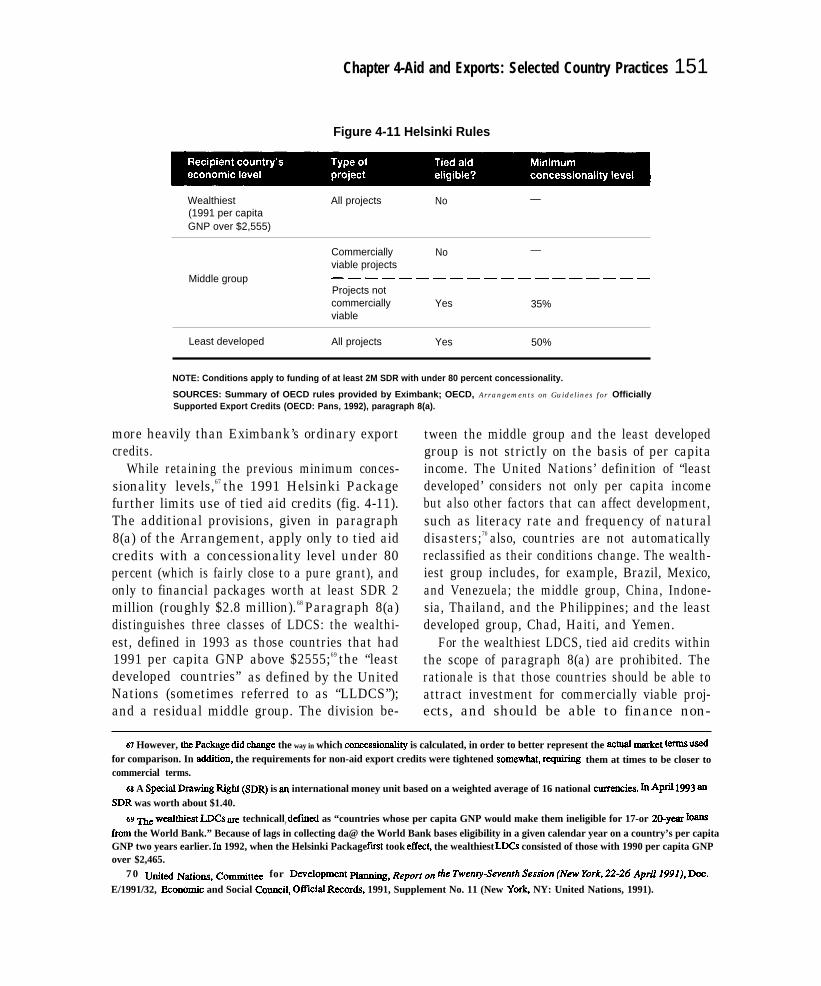
Chapter 4-Aid and Exports: Selected Country Practices 151
Figure 4-11 Helsinki Rules
Wealthiest All projects No —(1991 per capitaGNP over $2,555)
Commercially No —viable projects
Middle group ———————————————————Projects notcommercially Yes 35%viable
Least developed All projects Yes 50%
NOTE: Conditions apply to funding of at least 2M SDR with under 80 percent concessionality.
SOURCES: Summary of OECD rules provided by Eximbank; OECD, Arrangements on Guidelines for OfficiallySupported Export Credits (OECD: Pans, 1992), paragraph 8(a).
more heavily than Eximbank’s ordinary exportcredits.
While retaining the previous minimum conces-sionality levels,67 the 1991 Helsinki Packagefurther limits use of tied aid credits (fig. 4-11).The additional provisions, given in paragraph8(a) of the Arrangement, apply only to tied aidcredits with a concessionality level under 80percent (which is fairly close to a pure grant), andonly to financial packages worth at least SDR 2million (roughly $2.8 million).68 Paragraph 8(a)distinguishes three classes of LDCS: the wealthi-est, defined in 1993 as those countries that had1991 per capita GNP above $2555;69 the “leastdeveloped countries” as defined by the UnitedNations (sometimes referred to as “LLDCS”);and a residual middle group. The division be-
tween the middle group and the least developedgroup is not strictly on the basis of per capitaincome. The United Nations’ definition of “leastdeveloped’ considers not only per capita incomebut also other factors that can affect development,such as literacy rate and frequency of naturaldisasters;70 also, countries are not automaticallyreclassified as their conditions change. The wealth-iest group includes, for example, Brazil, Mexico,and Venezuela; the middle group, China, Indone-sia, Thailand, and the Philippines; and the leastdeveloped group, Chad, Haiti, and Yemen.
For the wealthiest LDCS, tied aid credits withinthe scope of paragraph 8(a) are prohibited. Therationale is that those countries should be able toattract investment for commercially viable proj-ects, and should be able to finance non-
GT However, the p~~ge~d change the way in which concessionality is calculated, in order to better represent the Mtud ~ket ~rmsu~for comparison. In additio~ the requirements for non-aid export credits were tightened somewha~ requhing them at times to be closer tocommercial terms.
Gs A sp~i~ Drawing Right (SDR) is an international money unit based on a weighted average of 16 national eUrreneieS. ~ APfi 1993 ~SDR was worth about $1.40.
@me we~~est LDCS ~ technically defmcd as “countries whose per capita GNP would make them ineligible for 17-or 2@Yw 1o~fkom the World Bank.” Because of lags in collecting da@ the World Bank bases eligibility in a given calendar year on a country’s per capitaGNP two years earlier. In 1992, when the Helsinki Package fmt took effect the wealthiest LDCs consisted of those with 1990 per capita GNPover $2,465.
7 0 Ufitti Nations, co~t~ for D~elopment M-, Rep~~ on t~ ~enq-seventh ses~-on (New Yor&, 22-26 April 1991), k.
E/1991/32, Beonomic and Social Counc~ Oftlcial Reeords, 1991, Supplement No. 11 (New Yor~ NY: United Nations, 1991).
52 I Development Assistance, Export Promotion, and Environmental Technology
commercially viable projects on their own. Forthe least developed group, tied aid credits withinthe scope of paragraph 8(a) are (as before)permitted with a minimum concessionality levelof 50 percent. Thus, tied aid credits would be aparticularly expensive way to promote exports tothese poorest countries; and these countries’poverty limits the opportunity for follow-onbusiness.
The rules are more complex for the middlegroup. For these countries, tied aid credits withinthe scope of paragraph 8(a), when permitted, must(as before) have at least 35 percent concessional-ity. But such tied aid credits are permitted only ifthe project is not “commercially viable.” To becommercially viable, a project must be able to getfinancing from the commercial market, and mustbe able to generate income sufficient to pay backthe loan. The rationale for this restriction is thattied aid for commercially viable projects isunnecessary (since commercially viable projectscould presumably go forward without any aid),and is more likely to distort trade.71 This provi-sion is considered a key feature of the agreement.The middle group of countries to which it appliesincludes some East Asian countries with promis-ing environmental markets, such as Thailand andIndonesia. The effect of this requirement is
, difficult to predict. The precise meaning of,I ‘‘commercially viable’ is only gradually becom-1 ing clear, as countries consult about specific cases
(see below).The strengthened notification and consultation
[f process set up under the Helsinki Package72 is1 also a key feature of the agreement. As before,
countries participating in the Arrangement must
notify other participants about contemplated tiedaid credit offers.73 However, there are some newfeatures. On request of any other participant, thenotification must be supplemented with detailedinformation about the project’s developmentfunction, the project’s technical preparation andappraisal, and the procurement procedures. Also,notifications are now required more often for aidcredits that the donor considers untied. OtherArrangement participants can then request infor-mation to verify the untied status.
The consultation process has also been strength-ened. Consultations among members must al-ways be held for notifications exceeding SDR 50million (about $70 million) with concessionalitylevel less than 80 percent. Consultations are alsorequired if any country objects to an offer on theground that it does not meet the requirements ofparagraph 8(a) concerning commercial viability.The consultations are face to face; and if aparticular proposed aid offer is challenged, thepotential donor must justify its position. In theconsultation, the participants consider “first,whether an aid offer meets the requirement of therules in [paragraph 8(a)],” and “if necessary,whether an aid offer is justified even if therequirements of the rules in [paragraph 8(a)] arenot met.” Unless its position receives “substan-tial support,” the potential donor is advised towithdraw the offer; if it wishes to proceed, it mustsubmit a written justification citing the “overri-ding non-trade-related national interest that forcesthis action.’ ’74
In 1992, there were 824 notifications of tied aidcredit offers, totaling $15.4 billion.75 Of these,137 totaling $3.8 billion were potentially subject
71 Ti~ aid credits might add apmj~t that would not othenvise go forwar~ or might divert a project from One Suppkr to ~oti, ~ IWWdistorts trademore.Forcommerciallyviable projects, which caugo forward ontheirownwithout aid thelatteraltemative seems more probablefor noncommercially viable projects, which cannot go forward without aiL the former alternative seems more probable.
72 -amC pa. 14 and Annex VII.
73 -em~t par. 15.
74 --~~ Pfl. 14.75 ~ information in this paragraph is from Export-Import Bank of the United States, “Report to the Congress under Section 15(g) of the
Export-Import Bank Act of 1945, as Amend~” Apr. 26, 1993, pp. 5-8.
Chapter 4--Aid and Exports: Selected Country Practices I 53
to the consultation process.76 For many of these,additional information was requested by theUnited States or other participants. In four cases,the country in question withdrew its offer ratherthan have to provide the information and face apossible formal challenge. Formal consultationswere requested on 41 offers. The United Statesinitiated or otherwise endorsed all of theseconsultations; even when no U.S. firm wasbidding on the project, these cases were importantto the United States because they would becomeprecedents as to how “commercially viable” isdefined. Of these 41 cases, 36 were completed asof April 1, 1993. In 13 of these cases, the projectswere deemed not commercially viable. An addi-tional seven projects received “substantial sup-port” primarily because they were each part of anongoing project. In the remaining 16 cases, theproject was deemed commercially viable and theoffering country failed to get substantial support.Of these, in seven cases the country went aheadwith the offer, obligating it to explain in writingits “overriding non-trade-related national inter-est” in making the offer. The U.S. Administrationexpected such derogations to be concentrated “inthe early stages of the implementation of the newrules,’ and is not alarmed by the number;nevertheless, it ‘is signaling its intention that thecurrent pace of derogations should not continuebeyond the early implementation phase.” In theonly derogation in which a U.S. firm bid on theproject, Eximbank authorized use of the WarChest to provide matching financing.
Based on the limited sample of completedcases, it seems that projects in the manufacturing,
power, and telecommunications sectors aredeemed commercially viable except in specialcircumstances (such as a local facility serving aremote area, where operating the facility at a lossis cheaper than providing a good or service bylong distance). No completed cases have focusedon environmental projects or components ofprojects, and it is not always clear when suchprojects or components would be deemed com-mercially viable. It is possible that some environ-mental projects will be deemed not commerciallyviable and thus eligible for tied aid credits. Sometypes of projects, such as water and wastewatertreatment facilities serving very poor communit-ies, often might not generate enough revenue topay for themselves. New projects with environ-mental components (such as a factory with a stackgas scrubber) will be judged on the commercialviability of the project as a whole; so the projectcould be deemed commercially viable unless theenvironmental requirements made the wholeproject unprofitable. In the case of a retrofit, suchas a stack gas scrubber put onto an existingfactory, the United States expects that the com-mercial viability standard will be the same (e.g.,whether the factory with the scrubber is commer-cially viable), though there is not yet a precedentaddressing this sort of case; it is possible thatcommercial viability would instead be judged forthe retrofit in isolation, in which case a finding ofnon-commercial viability would be common(scrubbers do not normally bring in revenue).77
If, as the precedents from OECD consultationsevolve, some types of environmental projects orcomponents tend to be regarded as not commer-
76 Everyo~off~w~ exempt for at Ieast Om Of ~= reasom.: it was made before Feb. 15, when the new rules took effecG it was coveredby transitional rules; it was an offer to match a previous offer by another country, and thus not independently subject to consukatioq it wasmade to a least developed country, and thus pczmitted as long as the concessionality level was at least 50 pcmxm~ it had at least 80 percentconcessionali~, it was for under2 million SD~ it was for ships (credits for ships are excluded from coverage under the Arrangement and amcovered by a special agreement).
77 Even in isolatiou such environmental modifications might more often be considered commercially tile if environm- costs ~benefits welt? intelmdized. Thus, a scrubber in isolation could generate revenues if a mechanismexisted such as tradable emissions permits.Similarly, the modifications to make a plant more energy efficient would more often pay for themselves if the cost of the energy reflected theenvironmental costs of its use. Tradable permits, input pricing, and other economic measures to provide incentives to pollute less will bediscussed further in the final report of this Assessment.
54 I Development Assistance, Export Promotion, and Environmental Technology
cially viable, donors could shift aid into those greater role than it does now in internationaltypes of projects, in order to retain the freedom to competition in environmental goods and services.usw tied aid credits. In this case, aid could play a
DonorCountryProfiles 5
B riefly discussed below are the bilateral aid programs offive major donors—the United States, Japan, France,Germany, and the United Kingdom. Emphasis is placedon their bilateral environmental aid. None of these
countries had reported estimates of their environmental ODA toOECD’S development assistance committee as of May, 1993.Hence, all of the cited environmental aid figures should beconsidered preliminary and subject to change.
Although not discussed in detail here, large projects caninclude several bilateral donors and multilateral agencies orlending institutions (see box 2-C). Donors sometimes coordinatebilateral aid with other donors on different components ofspecific projects.1 Donors also may provide cofinancing orparallel financing to complement multilateral environmental aidthrough such mechanisms as the Global Environment Facility orCapacity 21, a recently established facility of the United NationsDevelopment Programme (see box 2-B).
UNITED STATESBilateral development aid is only one of several priorities in
the overall U.S. foreign assistance program. It accounted forabout $4.2 billion (25 percent) of overall U.S. foreign aid
1 For example, the United States and Japan are cooperating in establishing anIndonesian Biodivemity I%otection Center. The possibility of greater United States-Japancooperation on environmental matters in gemral is a subject under consideration forpossible joint discussions between the two countries, as mentioned by President Clintonat his news conference with Japanese Prime Minister Miyazawa on Apr. 16, 1993. Fordiscussion of recent developments, see Pat Murdo, “Cooperation Conflict in U.S.-JapanEnvironmental Relations,” JEIReport Japan Economic Institute, Wasbingto~ DC, May28, 1993.
55
56 I Development Assistance, Export Promotion, and Environmental Technology
obligations in fiscal year 1991. Other budgetpriorities include multilateral aid, food aid, eco-nomic support funds (ESF), and military aid.
The U.S. Agency for International Develop-ment (USAID), established by the Foreign Assist-ance Act of 1961, has the major responsibility foradministering and coordinating U.S. bilateral aid.Some other agencies share aid responsibilities orundertake closely related activities; these includethe State Department (for ESF allocations), theDepartment of Agriculture (for food aid), and theTrade and Development Agency (support fordevelopment project feasibility studies in devel-oping countries).
USAID’s budget and priorities reflect U.S.strategic and political goals. Israel (with a percapita income of over $10,000) and Egypt (witha per capita income of about $600) have headedthe annual list of U.S. aid recipients since 1980,and together have accounted for close to half theentire bilateral foreign aid budget in recent years.2
USAID’s program reflects numerous objectivesadded by Congress over the years.3
U.S. development assistance, as administeredby USAID, has undergone several shifts inemphasis over the last three decades that have abearing on its commercial effects. From 1961until 1973, U.S. development assistance tended toIfinance large capital projects with foreign ex-change components. In 1973, USAID took on anew direction; priority was given to humanI
I development and institution building as precondi-tions for self-sustaining economic growth in thedeveloping world. More emphasis was given toissues of equity, alleviation of poverty, and
meeting basic human needs. USAID’s effortsbecame more rurally oriented, with small-scaleactivities focusing on agriculture, nutrition,health, and education. In 1981, aid policy shiftedagain to place added emphasis on policy dialogue,promotion of the private sector in developingcountries, institution building, and technologytransfer. In recent years, USAID also has placedmuch emphasis on policy reforms in developingcountries.
The portion of USAID’s budget for large-scalecapital projects (projects which often entail majorimports of engineering services and capital goodsfrom developed countries) has declined over theyears. 4 In the early 1960s, 25 percent of USAID’sbudget was devoted to capital projects. That sharehad declined to 6.5 percent in the 1980s.5 Loans,which are primarily used for capital projects, haveaccounted for a decreasing portion of U.S. bilat-eral aid, dropping from almost half in the 1960sto less than 5 percent in 1989. Since 1989 almostall new commitments for bilateral aid have beengrants rather than confessional loans.
Congress has authorized the U.S. Export-Import Bank to combine loan funds with a special“War Chest” of grant money in order to matchconfessional financing by foreign governments.However, the War Chest is not large and has beenused sparingly. (USAID has occasionally contrib-uted grant funds to be combined with Eximbank’sloan funds to the same end.)
While Buy American limitations on procure-ment have been a feature of U.S. foreign assist-ance since its inception, waivers are permitted
z OECD, Development Cooperation 1992 Report, table 43, P. Au.
3 A 1992 ~~iden~ ~~mmission on tie management of USAID programs found 39 “central” objectives affecting USAID’s mission.
4 one f~tor ~ntribu~g to this change was concern that U.S. aid loans sometimes supported large, highlY visible, cosflY fitruc~eprojects that were unsuited to the needs of the developing country. For discussion of this history, see Curt ‘lhrnoff and Larry Q. Nowels,ForeignAssistance and CommercialInterests: TheAidfor Trade Debate, CRS Report for Congress, 93-528-F, U.S. Library of Congress CongressionalResearch Service, May 23, 1993, p. 23.
5 Export-Import Bank of the United States, Repon to the U.S. Congress on Tied Aid Credit Practices April 1989, p. 15, and OECD,Development Cooperation 1992 Report, table 30, p. A-41. While capital projects accounted for just 2.8 percent of USAID’s 1990 budget thisnumber is skewed downward by the abnormally high debt relief in the 1990 figures.
Chapter 5-Donor Country Profiles I 57
under some circumstances.6 Much of USAID’Sgrant assistance is used to hire U.S. firms,nongovernmental organizations or citizens, ordeveloping country participants. According toUSAID, a majority of U.S. aid (62 percent infiscal year 1992) buys goods and services pro-duced in and shipped from the United States.7
However, the portion of aid going to U.S.procurement has apparently declined since theearly 1970s, when it exceeded 90 percent. At thesame time, USAID has encouraged developingcountries to undertake policy reforms that maymake them more open to trade and investment ingeneral. Its 1992 policy office review of thesereforms (discussed in ch. 1) found increases inU.S. exports to developing countries.
Several USAID activities facilitate U.S. busi-ness involvement (see table B-2 in app. B). Thosepertinent to environmental export promotioninclude, among others: the United States-AsiaEnvironmental Partnership (described in app. B);the Project in Development and the Environment(which is focused on the Near East); the Environ-mental Credit Program (which helps financeenvironmentally preferable projects involvingexports of U.S. technology);8 and the Environ-mental Improvement Project, aimed at reducingurban and industrial pollution in the ASEANcountries. The Environmental Enterprises Assist-ance Fund aims to promote dissemination ofenvironmental technologies in developing coun-tries. USAID is also a statutory participant in the
Federal interagency Trade Promotion Coordina-tion Committee and its working group on environ-mental trade (both described in app. B).
Some other U.S. government agencies (alsodiscussed in app. B) support activities that mayencourage exports of U.S. technologies andservices, including environmental exports, todeveloping countries. Trade and DevelopmentAgency grants to developing countries for projectfeasibility studies are used to hire U.S. consult-ants. As they are likely to be more familiar withU.S. technologies and products, the consultantsmay encourage procurement of U.S. goods andservices for subsequent stages of the project. Theagency estimates that each grant dollar returnsover $25 to the U.S. economy in follow onexports. (Some portion of those exports is fi-nanced by other U.S. government agencies.) Theprogram is small but growing: $40 million wasappropriated for TDA in fiscal year 1993; theClinton Administration is seeking $60 million forfiscal year 1994.
Many Federal agencies (as well as state andprivate bodies) participate with USAID in theUnited States-Asia Environmental Partnership,which is designed to involve U.S. firms insolutions to Asian environmental problems. TheDepartment of Commerce, USAID, and severalother agencies are involved in environmental andenergy assistance to Eastern Europe. Partly toboost U.S. exports, in 1992 Congress authorized(but has not yet funded) three new U.S. Depart-
L$ S= ~ ~ffti larry Q. Newels, Foreign Assistance and Co mmercialhterests: The Aidfor Tradk Debate, op. cit., pp. 26-28, fordiscussion of this history. For discussion of the evolution of waivex policies, see U.S. Department of Commerce International TradeAdmit.dstratioq International Financing Programs and U.S. Internm”onal Economic Competitiveness, (U.S. Governmen t Printing office,Waahingt(xq DC, 1990), pp. 2-3.
T U.S. Ag~cy for ~t~tio~ ~velop~~ “Buy American I@@: October 1991 @OU@ Sqti MZ” ~. sls 1~. us-excluded from this calculation $1.56 billion in cash transfers that were used to repay dew of which $1.43 billion was debt owed to the UnitedStates. USAID states tha~ if debt relief were included, the reflow percentage would increase to 70 percent. However, this is so only if reliefof U. S.-held debt is counted as purchases ofU.S. goods and services. But U. S.-helddebt relief would only promote such purchases undercertaincircumstances, such as purchases made with fkecd up funda or in anticipation of future debt relief. If the relief of U.S.-held debt is not countedas purchases of U.S. goods and SCMCCS, then including debt relief in the calculation reduces the 62 pement figure to 45 percen~ as obsavedin Curt Thrnoff and Larry Newels, Congressional Research Sewice, “Foreign Assistance and Comrnercd“ Interests: The Aid for ‘IhdeDebate,” op. cit.
8 U.S. ~~nmental Protection Agency, Global Markets for Environmental Technologies: Dej?ru”ng a More Active Role for EPA Withina Broader U.S. Government Strategy, EPA 16@R-92-001, Washin@oQ DC, EPA December 1992, p. C-8.
58 I Development Assistance, Export Promotion
ment of Energy programs (to be carried outthrough USAID) for transfer of environmentallypreferred energy technologies to developing coun-tries.
Major changes in the scope and nature of U.S.foreign assistance could be in the offing, reflect-ing adjustment to the end of the Cold War,concerns about the Federal budget, and theemergence of new priorities (such as economiccompetitiveness and environmental protection).9
Despite the reflow from grant aid, the U.S.development assistance program still seems lesscommercial in orientation than programs run bymost of the United States’ largest trading partnersand primary competitors. As discussed in chapter4, other leading donors maintain an emphasis oncapital projects, and continue to use soft loans asa substantial part of their ODA. Some of themeasures discussed in box 1-A and appendix Bwould, in theory, give a more commercial cast toU.S. foreign assistance if fully funded and aggres-sively implemented. Given budgetary constraintsand continuing debate about development assist-ance objectives, such an outcome is by no meanscertain.
I U.S. Environmental AidAlthough USAID paid little attention to envi-
ronmental needs in its early years, the UnitedStates was among the first major donors to beginto address the environmental impacts of itsdevelopment assistance. As early as 1976, USAIDhad environmental assessment procedures inplace. For several years it has also supportedand/or carried out environmental or environmen-tally related projects. USAID’s environmentaleffort, like its approach to aid in general, tends tofocus on small-scale projects, often in rural areas.
and Environmental Technology
Recent projects support training of public andprivate decisionmakers; environmental institu-
tion building; and cooperative research on climatechange, biodiversity, and other global environ-mental problems. USAID also supports small-scale technology demonstration projects on alter-native fuels and energy efficiency. It has notusually funded large capital projects for environ-mental infrastructure; exceptions include U.S. aidfor water and wastewater treatment facilities inEgypt.
In the last few years, USAID has retieincreasing efforts to develop an environmentalstrategy. Its most recent environmental strategydocument identifies five priority problem areas:
loss of tropical forests and other habitatscritical for biological diversity;unsustainable agricultural practices;environmentally unsound energy productionand use;urban and industrial pollution; anddegradation and depletion of water and coastalresources. 10
USAID’S bureaus have issued regional envi-ronmental strategies within this overall focus.11
Priorities differ by region. In Africa, for example,most environmental aid is for sustainable agricul-ture, tropical forestry, and biodiversity. Thesepriorities shape much of the environmental aid forLatin America and the Caribbean region, al-though energy and urban and industrial projectshave priority in some areas. Latin America alsohas been a focus for USAID’s activities carriedout under a global climate change initiativemandated by Congress in 1990. In Asia, tropicalforest conservation is a key objective, but energyefficiency, water and coastal resource manage-
9 ~ ~ ~aF Wm ~p~for publication in June 1993, tie Chton ~“ “stration was said to be nearing completion of a report on U.S.foreign assistance reform. See J. Brian Atwood, “Don’t Write Off AID Yet” Washington Post, June 17, 1993, p. A23. Atwood is theAdministrator of USAID.
10 U.S. &enq for ~te~o~ Development Enviro~ent Stiategy Uw Poliq, June 1992, p. 1.
11 MUC. of me &=Wsion ~ this p-ph is ~en from “F-on ~ ~vironmen~” All). Evaluation News: A Newsletter on Recent
Evaluation Findi”ngs andiUethods, 1992, vol. 4, No. 2.
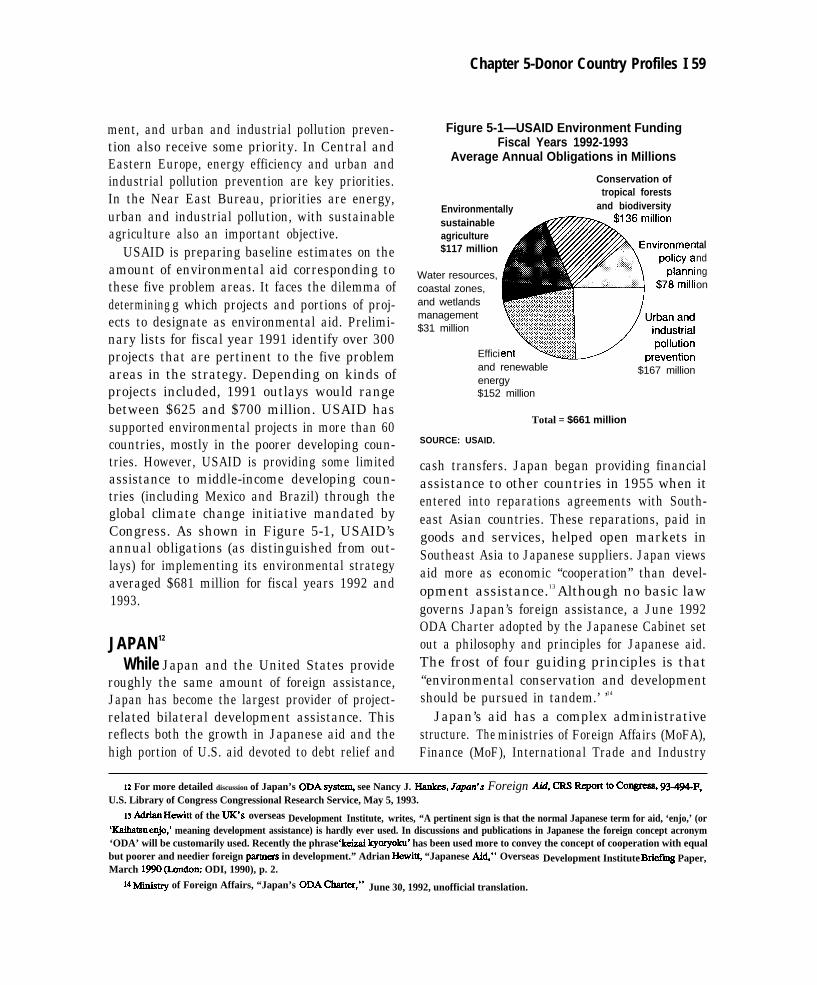
Chapter 5-Donor Country Profiles I 59
ment, and urban and industrial pollution preven-tion also receive some priority. In Central andEastern Europe, energy efficiency and urban andindustrial pollution prevention are key priorities.In the Near East Bureau, priorities are energy,urban and industrial pollution, with sustainableagriculture also an important objective.
USAID is preparing baseline estimates on theamount of environmental aid corresponding tothese five problem areas. It faces the dilemma ofdetermining g which projects and portions of proj-ects to designate as environmental aid. Prelimi-nary lists for fiscal year 1991 identify over 300projects that are pertinent to the five problemareas in the strategy. Depending on kinds ofprojects included, 1991 outlays would rangebetween $625 and $700 million. USAID hassupported environmental projects in more than 60countries, mostly in the poorer developing coun-tries. However, USAID is providing some limitedassistance to middle-income developing coun-tries (including Mexico and Brazil) through theglobal climate change initiative mandated byCongress. As shown in Figure 5-1, USAID’sannual obligations (as distinguished from out-lays) for implementing its environmental strategyaveraged $681 million for fiscal years 1992 and1993.
JAPAN 12
While Japan and the United States provideroughly the same amount of foreign assistance,Japan has become the largest provider of project-related bilateral development assistance. Thisreflects both the growth in Japanese aid and thehigh portion of U.S. aid devoted to debt relief and
Figure 5-1—USAID Environment FundingFiscal Years 1992-1993
Average Annual Obligations in Millions
Conservation oftropical forests
Environmentally and biodiversity
sustainableagriculture$117 million tal
nd
Water resources, ng
coastal zones, on
and wetlandsmanagement$31 million
Efficiand renewable $167 millionenergy$152 million
Total = $661 million
SOURCE: USAID.
cash transfers. Japan began providing financialassistance to other countries in 1955 when itentered into reparations agreements with South-east Asian countries. These reparations, paid ingoods and services, helped open markets inSoutheast Asia to Japanese suppliers. Japan viewsaid more as economic “cooperation” than devel-opment assistance.13 Although no basic lawgoverns Japan’s foreign assistance, a June 1992ODA Charter adopted by the Japanese Cabinet setout a philosophy and principles for Japanese aid.The frost of four guiding principles is that“environmental conservation and developmentshould be pursued in tandem.’ ’14
Japan’s aid has a complex administrativestructure. The ministries of Foreign Affairs (MoFA),Finance (MoF), International Trade and Industry
12 For more detailed discussion of Japan’s ODA sys~ see Nancy J. Hank@, Yapun’s Foreign Aid, ~ WPOrt tO COIWMS, W-494-F,U.S. Library of Congress Congressional Research Service, May 5, 1993.
13 A&ianHewitt of the ~’s overseas Development Institute, writes, “A pertinent sign is that the normal Japanese term for aid, ‘enjo,’ (or‘Kaihatsuenjo,’ meaning development assistance) is hardly ever used. In discussions and publications in Japanese the foreign concept acronym‘ODA’ will be customarily used. Recently the phrase ‘keizai kyoryoku’ has been used more to convey the concept of cooperation with equalbut poorer and needier foreign partnem in development.” Adrian Hewi~ “Japanese A@” Overseas Development Institute Brief@ Paper,March 1990 @ndOIX ODI, 1990), p. 2.
14 -~ of Foreign Affairs, “Japan’s ODA ChWer,” June 30, 1992, unofficial translation.
60 I Development Assistance, Export Promotion, and Environmental Technology
(MITI), and the Economic Planning Agency alloversee development of ODA policy and imple-mentation; several other ministries (e.g., theEnvironment Agency) play smaller roles. Bilat-eral ODA is implemented by two agencies: theOverseas Economic Cooperation (OECF), theconfessional lending arm, and the JapaneseInternational Cooperation Agency (JICA), which
undertakes technical assistance and administersgrant aid (as does the MoFA).
Japan’s bilateral aid has roughly doubled everyfive years since 1961. Although its aid is becom-ing more geographically diverse, Asian countriesreceived nearly 60 percent of its aid in 1990. Themajority of Japanese ODA has still gone tosupport economic infrastructure and developmentof basic industries. Japan devoted 41 percent of its1991 ODA to economic infrastructure activities,and 17 percent for production, including agricul-ture, manufacturing industry, mining, and theconstruction sector.
Japanese ODA tends to finance large projects.It accounted for more than half of DAC aidprojects over $50 million in 1990-1991. Japanoffers confessional loans for the majority of itsODA. Historically, these loans were provided onharder, more commercial terms compared withother donors. Since 1988, Japanese loans havebeen offered with terms closer to those of otherDAC members.
In 1990-1991, grants accounted for only 27percent of its bilateral (and 39 percent of its total)ODA. The Japanese aid system tends to becentralized; about 500 people are stationed infield offices outside of Japan-relatively fewpeople given the size of Japan’s aid program.Lack of field personnel may partly explain someof the difficulties Japan has had in developingcountry-specific programs.
JICA, OECF, and Eximbank of Japan operatefinancing programs that provide loans to Japanesecompanies for investments in developing coun-tries related to their development needs. Exam-ples are public facilities or experimental projectsthat might not otherwise be undertaken withoutinnovation or improvements. The total value ofoutstanding JICA loans is $30 million; OECF andEximbank of Japan operate larger programs.
Like other donors, Japan has faced criticismabout the adverse environmental impacts of itsloans and projects.
15 Since the mid-1980s, it has
taken several administrative steps to incorporateenvironmental considerations into its aid.l6 It hasalso announced several dramatic plans to increasesupport for environmental ODA and to developand transfer environmentally preferable technolo-gies to developing countries. While lower-income developing countries will be the recipientof most of this aid, middle-income developingcountries will receive some environment-relatedODA.17 These are part of a broader, technology-
15 For ~ Ovemiew of tie way in which Japan’s aid system addresses environmental issues, see Richard A. Forrcs4 “JapamseAid ~d theEnvironment” The Ecologist, Vol. 21, No.1, J~-Feb. 1991, pp. 24-32. See also Pete Carey and hwis M. Simons, “Japanb lamed for aidprojects that scar the land: Tokyo’s environmental record rouses objections across A@” San Jose AUercuryNews, Apr. 21, 1992; and Edmund~ “Aid Machine Struggles With Ecology Issues,” Japan EconoITu”c Journal, ‘lMcyo, June 30, 1990, p. 1.
16 JICAestabliahed apanelin 1986 to considexmeasur es to deal with enviromnentalconsiderations inODA. Guidelines ondamconstructionwere issued inearly 1990. JICA has placed environmental oftlcials in each overseas oflice. In August 1989, JICA set up an environment officein its planning department and designated an oflicial in charge of environmental issues in each operational department. In May 1991, JICAmade its environmental ofiice part of the Environment Women in Developmen~ and Global Issues Division. OECF has also taken some stepsto give more prominence to environmental concerns. The Export-Import Bank of Japan has created an environmental post. For an overviewof these steps, see Govermnent of Jap~ Environment and Development: Japan’s Experience and Achievement, Japan’s National Report toUNCED 1992, December 1991, pp. 15-30.
17 _les of Jw~= entionmental aid to middle-income developing countries include: a 69.3 billion yen ($540 million) OECF loanfor a sulfur dioxide emission reduction project in Mexico City an additional 10.4 billion yen ($8.1 million) loan to the Government of Mexicofor afforestatiou and a pledge of 99 billion yen ($77 million) in ODA to Brazil for water quality co nservation. Japan also provides technicalassistance to Eastern Europe for environmental improvement. The Overseas Economic Cooperation Fund, The Overseas Econonu”cCooperation Fund Annual Report 1992 (OECF, Tokyo, October 1992), p. 7.
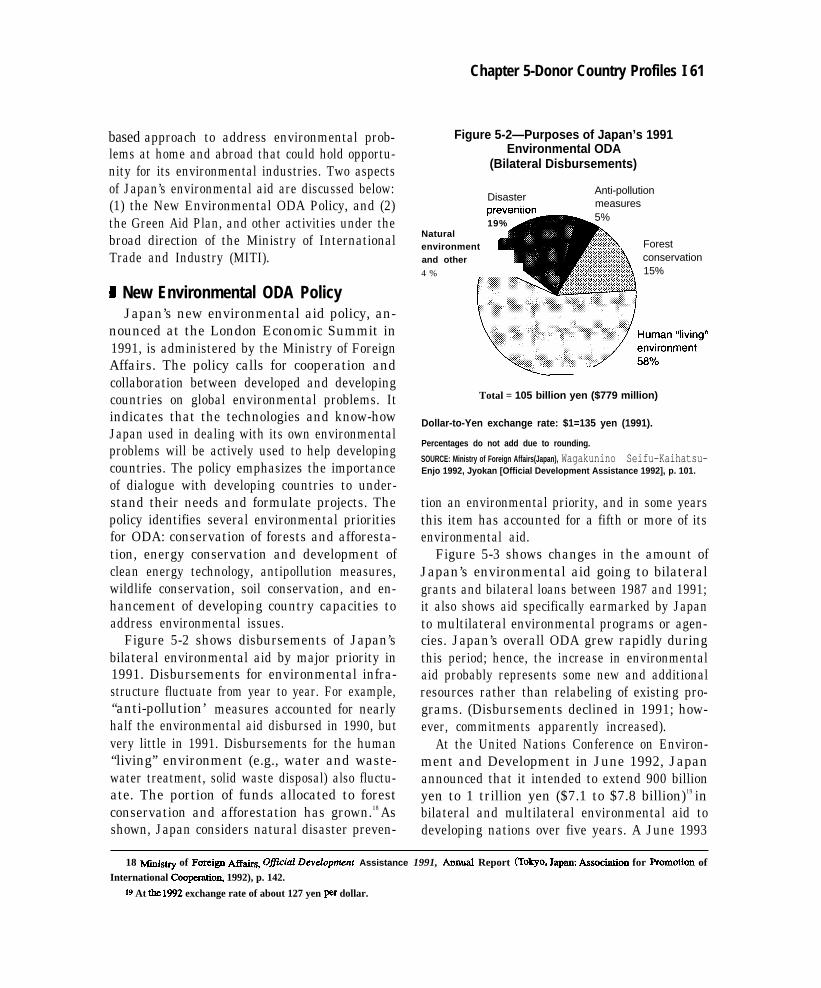
Chapter 5-Donor Country Profiles I 61
based approach to address environmental prob-lems at home and abroad that could hold opportu-nity for its environmental industries. Two aspectsof Japan’s environmental aid are discussed below:(1) the New Environmental ODA Policy, and (2)the Green Aid Plan, and other activities under thebroad direction of the Ministry of InternationalTrade and Industry (MITI).
1 New Environmental ODA PolicyJapan’s new environmental aid policy, an-
nounced at the London Economic Summit in1991, is administered by the Ministry of ForeignAffairs. The policy calls for cooperation andcollaboration between developed and developingcountries on global environmental problems. Itindicates that the technologies and know-howJapan used in dealing with its own environmentalproblems will be actively used to help developingcountries. The policy emphasizes the importanceof dialogue with developing countries to under-stand their needs and formulate projects. Thepolicy identifies several environmental prioritiesfor ODA: conservation of forests and afforesta-tion, energy conservation and development ofclean energy technology, antipollution measures,wildlife conservation, soil conservation, and en-hancement of developing country capacities toaddress environmental issues.
Figure 5-2 shows disbursements of Japan’sbilateral environmental aid by major priority in1991. Disbursements for environmental infra-structure fluctuate from year to year. For example,‘‘anti-pollution’ measures accounted for nearlyhalf the environmental aid disbursed in 1990, butvery little in 1991. Disbursements for the human“living” environment (e.g., water and waste-water treatment, solid waste disposal) also fluctu-ate. The portion of funds allocated to forestconservation and afforestation has grown.18 Asshown, Japan considers natural disaster preven-
Figure 5-2—Purposes of Japan’s 1991Environmental ODA
(Bilateral Disbursements)
19%Naturalenvironmentand other4 %
DisasterAnti-pollution
. . measures5%
\+;:::..:::::::::::::::,..:.:.:.:.:.:.:.:.:.. Forest
conservation15%
Total = 105 billion yen ($779 million)
Dollar-to-Yen exchange rate: $1=135 yen (1991).
Percentages do not add due to rounding.
SOURCE: Ministry of Foreign Affairs(Japan), Wagakunino Seifu-Kaihatsu-Enjo 1992, Jyokan [Official Development Assistance 1992], p. 101.
tion an environmental priority, and in some yearsthis item has accounted for a fifth or more of itsenvironmental aid.
Figure 5-3 shows changes in the amount ofJapan’s environmental aid going to bilateralgrants and bilateral loans between 1987 and 1991;it also shows aid specifically earmarked by Japanto multilateral environmental programs or agen-cies. Japan’s overall ODA grew rapidly duringthis period; hence, the increase in environmentalaid probably represents some new and additionalresources rather than relabeling of existing pro-grams. (Disbursements declined in 1991; how-ever, commitments apparently increased).
At the United Nations Conference on Environ-ment and Development in June 1992, Japanannounced that it intended to extend 900 billionyen to 1 trillion yen ($7.1 to $7.8 billion)19 inbilateral and multilateral environmental aid todeveloping nations over five years. A June 1993
18 -~ of Forei~ MM, Q)$ci~ ~evelop~nt Assistance 1991, hnual Report (To@o, Japan: Assotition for fiomotion ofInternational Cooperatio~ 1992), p. 142.
19 At tie 1992 exchange rate of about 127 yen per dollar.
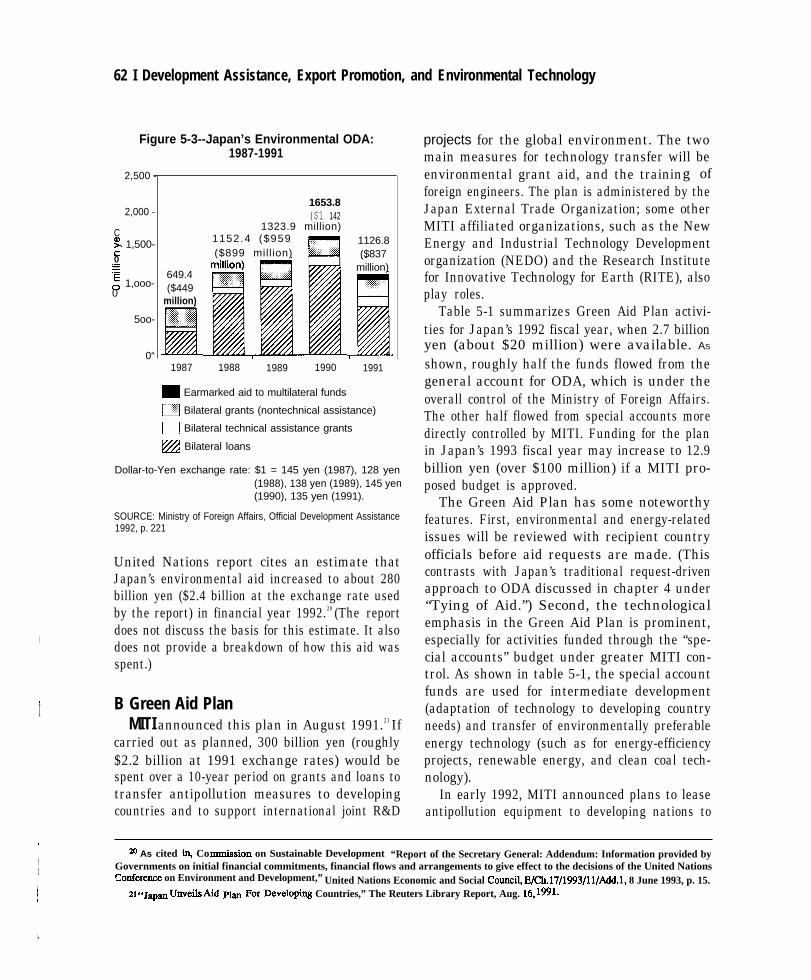
62 I Development Assistance, Export Promotion, and Environmental Technology
Figure 5-3--Japan’s Environmental ODA:1987-1991
2,500 -
2,000 -
C0: 1,500-0.-=.-
: 1,ooo-0
5oo-
0“
649.4($449
million)
1653.8($1 142
1323.9 million)1152.4 ($959
n1126.8
($899 mill ion) ($837.-million)
1987 1988 1989 1990 1991
_ Earmarked aid to multilateral funds
m Bilateral grants (nontechnical assistance)
m Bilateral technical assistance grants
~ Bilateral loans
Dollar-to-Yen exchange rate: $1 = 145 yen (1987), 128 yen(1988), 138 yen (1989), 145 yen(1990), 135 yen (1991).
SOURCE: Ministry of Foreign Affairs, Official Development Assistance1992, p. 221
United Nations report cites an estimate thatJapan’s environmental aid increased to about 280billion yen ($2.4 billion at the exchange rate usedby the report) in financial year 1992.20 (The reportdoes not discuss the basis for this estimate. It also
I does not provide a breakdown of how this aid wasspent.)
, B Green Aid PlanIMITI announced this plan in August 1991.21 If
carried out as planned, 300 billion yen (roughly$2.2 billion at 1991 exchange rates) would bespent over a 10-year period on grants and loans totransfer antipollution measures to developingcountries and to support international joint R&D
projects for the global environment. The twomain measures for technology transfer will beenvironmental grant aid, and the training offoreign engineers. The plan is administered by theJapan External Trade Organization; some otherMITI affiliated organizations, such as the NewEnergy and Industrial Technology Developmentorganization (NEDO) and the Research Institutefor Innovative Technology for Earth (RITE), alsoplay roles.
Table 5-1 summarizes Green Aid Plan activi-ties for Japan’s 1992 fiscal year, when 2.7 billionyen (about $20 million) were available. AS
shown, roughly half the funds flowed from thegeneral account for ODA, which is under theoverall control of the Ministry of Foreign Affairs.The other half flowed from special accounts moredirectly controlled by MITI. Funding for the planin Japan’s 1993 fiscal year may increase to 12.9billion yen (over $100 million) if a MITI pro-posed budget is approved.
The Green Aid Plan has some noteworthyfeatures. First, environmental and energy-relatedissues will be reviewed with recipient countryofficials before aid requests are made. (Thiscontrasts with Japan’s traditional request-drivenapproach to ODA discussed in chapter 4 under“Tying of Aid.”) Second, the technologicalemphasis in the Green Aid Plan is prominent,especially for activities funded through the “spe-cial accounts” budget under greater MITI con-trol. As shown in table 5-1, the special accountfunds are used for intermediate development(adaptation of technology to developing countryneeds) and transfer of environmentally preferableenergy technology (such as for energy-efficiencyprojects, renewable energy, and clean coal tech-nology).
In early 1992, MITI announced plans to leaseantipollution equipment to developing nations to
I
m As cited Q Commiasion on Sustainable Development “Report of the Secretary General: Addendum: Information provided byI Governments on initial financial commitments, financial flows and arrangements to give effect to the decisions of the United NationsI ~o~emnce on Environment and Development,” United Nations Economic and Social Counci4 E/Ch.17/1993/11/Add.1, 8 June 1993, p. 15.
~ 21 4<Jap~ unveils Aid p~ FOr I)eVdOping Countries,” The Reuters Library Report, Aug. 16* 1991.
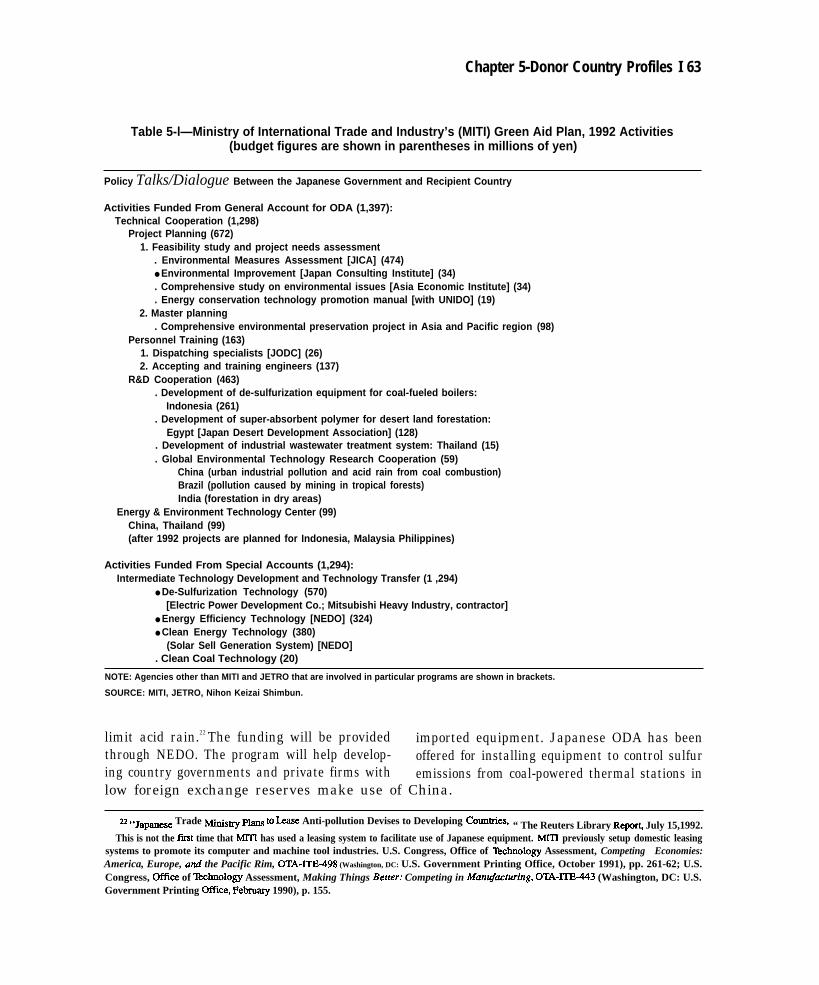
Chapter 5-Donor Country Profiles I 63
Table 5-l—Ministry of International Trade and Industry’s (MITI) Green Aid Plan, 1992 Activities(budget figures are shown in parentheses in millions of yen)
Policy Talks/Dialogue Between the Japanese Government and Recipient Country
Activities Funded From General Account for ODA (1,397):Technical Cooperation (1,298)
Project Planning (672)1. Feasibility study and project needs assessment
. Environmental Measures Assessment [JICA] (474)● Environmental Improvement [Japan Consulting Institute] (34). Comprehensive study on environmental issues [Asia Economic Institute] (34). Energy conservation technology promotion manual [with UNIDO] (19)
2. Master planning. Comprehensive environmental preservation project in Asia and Pacific region (98)
Personnel Training (163)1. Dispatching specialists [JODC] (26)2. Accepting and training engineers (137)
R&D Cooperation (463). Development of de-sulfurization equipment for coal-fueled boilers:
Indonesia (261). Development of super-absorbent polymer for desert land forestation:
Egypt [Japan Desert Development Association] (128). Development of industrial wastewater treatment system: Thailand (15). Global Environmental Technology Research Cooperation (59)
China (urban industrial pollution and acid rain from coal combustion)Brazil (pollution caused by mining in tropical forests)India (forestation in dry areas)
Energy & Environment Technology Center (99)China, Thailand (99)(after 1992 projects are planned for Indonesia, Malaysia Philippines)
Activities Funded From Special Accounts (1,294):Intermediate Technology Development and Technology Transfer (1 ,294)
● De-Sulfurization Technology (570)[Electric Power Development Co.; Mitsubishi Heavy Industry, contractor]
● Energy Efficiency Technology [NEDO] (324)● Clean Energy Technology (380)
(Solar Sell Generation System) [NEDO]. Clean Coal Technology (20)
NOTE: Agencies other than MITI and JETRO that are involved in particular programs are shown in brackets.
SOURCE: MITI, JETRO, Nihon Keizai Shimbun.
limit acid rain.22 The funding will be provided imported equipment. Japanese ODA has beenthrough NEDO. The program will help develop- offered for installing equipment to control sulfuring country governments and private firms with emissions from coal-powered thermal stations inlow foreign exchange reserves make use of China.
22 ttJapae~e Trade ~~~ pl~ to be Anti-pollution Devises to Developing co~triest “ The Reuters Library Repo~ July 15,1992.This is not the fust time that MITI has used a leasing system to facilitate use of Japanese equipment. MITI previously setup domestic leasing
systems to promote its computer and machine tool industries. U.S. Congress, Office of 7kchnology Assessment, Competing Economies:America, Europe, and the Pacific Rim, OTA-ITE498 (Washington, DC: U.S. Government Printing Office, October 1991), pp. 261-62; U.S.Congress, office of ‘lkhnology Assessment, Making Things Berrer: Competing in hfamq$acturing, O12MTE-443 (Washington, DC: U.S.Government Printing OffIce, Februmy 1990), p. 155.
64 I Development Assistance, Export Promotion, and Environmental Technology
In 1990, Japan put forth “New Earth 21,” aproposal to the world community about the needfor a comprehensive and long-range vision toaddress global environmental and energy issues.An associated “action program” proposed avariety of near- and long-term responses to globalenvironmental problems. Many of the long-termresponses would require extensive technologicalbreakthroughs (e.g., nuclear fusion, solar powergeneration from space, reversing desertificationthrough biotechnology). MITI recently issued 14proposals to further “New Earth 21” throughdomestic and international actions to better inte-grate energy, environmental, and economic con-cerns. These include: technological developmentfor protection of the global environment andinternational cooperation in energy and environ-mental fields, including the Green Aid Plan andODA.23
FRANCEThe third largest aid donor is France. Its aid
structure has two main parts: aid to formercolonies and current French Overseas Territories(TOMS), and aid to other low-income countries.The Directorate de RelationsEconomiques Extériu-res (DREE), a division of the Ministry of Finance,develops “protocols”, longer-term (18-month)financing plans with lower-income countries. TheCaisse Culturale de Cooperation Économique(CCCE), the central bank for economic coopera-tion under the Ministry of Cooperation andDevelopment, works with former colonies andTOMS.24
Aid that is oriented toward the poorest coun-tries and TOMS in Sub-Saharan Africa, theCaribbean, and the Indian Ocean, tends to begrant-based and has a human development em-phasis. Assistance for education, health andpopulation, and planning and public administra-
tion together account for 40 percent of totalFrench aid. France’s ODA for education andtraining supports programs in recipient countriesand in universities and technical programs inFrance.
Aid to the better off developing countries tendsto be commercially oriented, focusing on eco-nomic infrastructure development, and often in-volving aggressive use of mixed credits (seediscussion of “Use of Loans” inch. 4). In 1991,France targeted 16.9 percent of its ODA toeconomic infrastructure projects, and 10.1 per-cent to productive industries (as defined byDAC). Roughly 25 percent of French aid is in theforms of loans and mixed credits. The Treasuryand the Ministry of Finance are integrally in-volved in the use of mixed credits.
H French Environmental AidFrance has only recently begun to integrate
environmental considerations (such as environ-mental impact assessment and energy and naturalresource conservation) in its aid program. How-ever, French firms are among the world leaders inwater management technologies, and French aidto the environment is focused on the provision ofpotable water and sanitation.
In January 1993, the Caisse Culturale deDévelopement (which is a technical assistancearm of CCCE) estimated its environmental ODAcommitments to be 825 million French francs($146 million) for 1992.25 Nearly 60 percent ofthis aid was for provision of drinking water. Therest was for sanitation and water purification,public health risks associated with householdwastes, industrial pollution control, public aware-ness and management of natural resources, andagroindustry irrigation. An additional 80.4 mil-lion French francs ($14.2 million) in “environ-mental’ aid went to the TOMS, where 46 percent
~ SPM COnunitttXS on mer~ and EIwironment Fourteen Proposals for a New Earth, Executive s~, rnimeo, Nov. 25, 1992.[ x ~ mm of c-bon ~d Developm~t was the successor to the former wS@Y of Coloties.
I n &ICUIatCKI at $1 = 5.66 Freneh francs.I
iIi
Chapter 5-Donor Country Profiles 165
of the aid went for repairs to sources of potablewater, 22 percent went to sanitation, and 31percent of funding was devoted to restoration ofthe natural environment.26 It is unclear whetherthese figures are indicative of French environ-mental aid, as CCCE’S aid accounts for only arelatively small portion of total French aid.
The Government of France uses a combinationof grants, confessional loans, and mixed credits toprovide its aid. Larger infrastructure programs areusually formed in association with French indus-try and provided for through a basket of mixedcredits. A consequence of this policy was toincrease aid recipients’ foreign debt; however, theFrench government began a series of debt forgive-ness at the Paris Club in 1988, and is continuingthat process currently.
France opposed making OECD’S HelsinkiPackage mandatory. (The Package, discussed inch. 4, tightened restrictions on use of tied aidcredits for commercial advantage). It also hasresisted efforts by the DAC Working Party onEnvironment and Development to impose morestringent environmental requirements among aiddonors and to improve collective environmentalpolicies. However, France was one of the strong-est early supporters for the European Communityprogram for Eastern Europe, called PHARE/EEC,contributing 3 billion French francs ($500 mil-lion) over the first three years. This programprovides some support for environmental man-agement, with priority placed on technical assist-ance and training, particularly for water re-sources, regional water management agencies,institutional planning, legislation, and implemen-
tation of cooperative agreements with industry,local authorities, and environmental groups.27
GERMANYGermany remains the fourth largest aid donor,
and has increased its ODA while undertakingreunification. 28 Since adopting “Basic Guide-lines on Development Policy” in 1986, Germanaid has emphasized sectoral and structural adjust-ment. Germany uses strict development criteria toreview its ODA. For example, countries that donot receive German technical assistance are noteligible for projects involving mixed credits. Thispolicy lessens the chance that large projects willbe funded in countries without the technicalcapabilities to manage them. German aid ismindful of the potential for mutual benefits fromODA for both recipient and donor. These exportintentions are clearly articulated in the introduc-tion to the Basic Guidelines: “In cases where anation’s development program requires it toobtain goods from industrial countries, we try toensure that, if we are the suppliers of assistance,our own economy and workers benefit. ”29
The ministry of economic cooperation (BMZ)oversees development policy for its two imple-menting arms, the German redevelopment bank(KfW) and the technical assistance agency (GTZ).30
The use of two agencies is meant to deliver thewidest possible base for support. According toDAC statistics, Germany spends slightly more onsocial program aid than on economic infrastruc-ture spending, 24.7 percent versus 22.8 percent in1991. However, if water supply projects arecounted as economic infrastructure, those figures
26 Mm Franc&w de D&eloppemen4 “Reparation T’Mmatique des Op&ations: A Haute M&w Ajout& Environementale Engagt%s Parla CFD en 1992 (Hors DOM-TOM et hors adjustment)” Jan. 19, 1993, Paris.
27 Friends of the EII.@I of the u.K., 1991 Enviro Sumnu”t:A Critical View of the Environmental Performance of the G7 Countn”es (bnbuFriends of the ~ U.K. and rIlte17@Ol@ 1991), VO1. 2.
U For an overview Of German development assistance see Burghard Claus and Hans H. Lembke, “The Development Cooperation Policyof the Federal Republic of GermanYs” Gem Development Institute, Berlin, -h l~o
~ Gmmau Federal Ministry of Foreign AiRdrs, as quoted in ibid.
W ~ is the ~~talt fiir wiede~~, and the G’IZ is the Deutsche Gesedlschaft fiir ‘khllkh ZM amrnenarbeit. Both areconsidered agencies under the Ministry of Economic Cooperation.
66 I Development Assistance, Export Promotion, and Environmental Technology
could change to put infrastructure spending in thelead.31
1 German Environmental AidAn early proponent of DAC environmental
guidelines, Germany has pledged to continue tostress the environment in developing countries asit works with neighboring countries in Centraland Eastern Europe where power plants andchemical storage facilities pose an imminentthreat to public health in Germany itself. Ger-many provides a significant amount of aid forenvironmental protection and conservation ofnature. In 1990 and 1991, more than one-fifth ofall German aid was devoted directly to theenvironment.32 Environmental aid is expected toaccount for over 25 percent of its total aid in 1992and 1993. The GTZ estimates disbursements of1,020.7 DM million ($614.9 million) in 1990 and847.8 DM million ($510.7 million) in 1991, andcommitments of 996.0 DM million ($600 mil-lion) for 1992 and 1,001.6 DM million ($603.4million) in 1993.33
To count as environmental aid, projects musthave protection of the human environment and/orthe conservation of nature as primary objectives.This includes support to countries for managingand rationalizing their use of natural resources orprotection of the environment. Examples ofprojects include conservation strategies, institu-tion building, sludge and waste management,environmental impact assessment studies, andsupport for recipient country development ofenvironmental action plans.
Germany’s estimate of its environmental aid,unlike many other donors, excludes projects thatare undertaken for other purposes that have an
environmental component. For example, a live-stock production project with a sub-activity totrain farmers to protect hillsides from erosionwould not count as an “environmental” project.
In general, large inrastructure projects are notconsidered environmental, with the exception ofsludge or waste management projects, and somecases of “necessary“ infrastructure. Dependingupon the level of development in the recipientcountry, such infrastructure projects will besupported through grants in the form of technicalcooperation, confessional loans, and throughmixed credit offerings through the financialcooperation arm, the KfW.
German aid has standing programs for collabo-rative technical R&D and for training. Since theearly 1980s, the technical research has beenconcerned with the development of technologyappropriate for developing countries. Such tech-nologies often happen to be better at protectingthe human environment or reducing destructionof natural resources. One example is a low-smokeor alternative-fuel cookstove, which reduces oreliminates demand for charcoal and thus lessenspressures of deforestation. R&D for this technol-ogy is carried out in developing countries andGermany.
Germany is investing in environmental train-ing and awareness for the staff of its aid programs.It also offers environmental training for develop-ing country personnel in Germany and locally inrecipient countries. It provides financial supportand technical assistance for environmental insti-tution building in developing countries.
Germany recently launched several environ-mental initiatives pertinent to sustainable devel-opment. These include programs on tropical
31 k DAC s~tistics, CCwata WPPIY ~d stitition” me included in social spending under a catego~ called “other.” For W91 Jap~ @Germany had the highest shares in this “other” categoxy among the major donors presented, 9.9 percent of total ODA commitments for Japanand 6.3 percent for Germany. If the whole “other” category in Gtmnany’s case were water and water were counted as economic infrastructure,Germany would have spent 29.1 percent for economic infrastructure.
32 w ~cludes m and GTZ technical and f~cird assistance, but not aid provided by German nongovernmental organizations that isI funded through its aid structure.
33 c~c~at~ on an exchange rate of $l=DM 1.66.
Chapter 5-Donor Country Profiles I 67
forestry, household energy supplies, and institu-tion building for the environment. In cooperationwith Brazil and as a complement to several WorldBank environmental projects, Germany is con-tributing approximately $172 million (DM 285million) to an international pilot program for theconservation of Brazilian tropical rainforests.
UNITED KINGDOMThe United Kingdom aid program is similar in
philosophy and structure to that of the UnitedStates. Administration and policy formulationare, for the most part, under the auspices of oneagency, the Overseas Development Admini stra-tion (UK ODA), whose minister reports to theForeign Secretary .34 British aid makes use of itsown regional missions35 and takes a country-specific approach to aid policy formulation. TheUK places a high premium on promoting sustain-able development and working to help low-income countries.36
The Overseas Development Administrationprovides external assistance under three pro-grams: aid to developing countries, assistance toEastern Europe and the former Soviet Union, and(the smallest by far) “global environmentalassistance. ’37 British aid supports numeroussmall-scale training programs in developing coun-tries. The UK ODA also makes use of a mixedcredit facility, the Aid and Trade Provision(ATP), to aid capital projects in developingcountries. British aid supports water and wastetreatment facilities, power production, and infra-
structure projects through loans and associatedfinancing.
H British Environmental AidBritish aid officials have resisted classifying
their projects and programs as “environmental”and a meaningful estimate of British environ-mental aid is not yet available.38 The label isthought to marginalize concern for the environ-ment, which aid officials see as a cross-cuttingissue which all UK ODA projects must accountfor. The UK ODA’S Manual of EnvironmentalAppraisal, first published in 1989 and revised in1992, is meant to guide officials in addressingenvironmental issues early in the decision cyclefor all projects and programs. The manual pro-vides environmental checklists that could be usedin project conception, formation, planning, im-plementation, and appraisal. “Policy informationmarkers” are being put in place to identify aidprojects and programs that are primarily environ-mental or that have major environmental compo-nents. These markers will adhere to UK ODApolicy and will cover poverty, women in develop-ment, good government, and other issues as wellas the environment. Thus, a clearer enumerationof UK aid for the environment may soon beavailable.39
UK bilateral aid supports a range of programsto promote environmental protection and moreefficient use of resources in developing countries.One focus has been sustainable forestry, with over$200 million in forestry projects underway or in
~ ~ the UK, this agency is generwy refe~ to ss “the ODA.” However, internationally ODArefers tO ~lcid DevelOPm=t AsSis*e.For purposes of clarity, the British agency is referred to here as “UK ODA.”
35 Utie tie expansive coun~mission struc~e of USAID, however, UK ODA has only five regional missions ~d relies on the extensivein-country diplomatic missions, British Council offices, as weU as the CIown Agents for Overseas GOVernn3tXltS and AdmmIs“ “ rlationso
36 British tid, inclu~ hge capi~ projects, goes to countries with very low per capita incomes. clvem Development -s~tiom“British Overseas Aid: 1991 Annual Review,” I_nndoq October 1991.
37 ~ ~emeas Development Arhmms“ “ tratiom “British Aid Statistics 1987/88 - 1991B2,” a publication of the Government StatisticalService, 1992, p. ii.
38‘l’he only clearly iden~l~ component of its environmental aid is for “global environmental XSiSWlct?. ” h.1 1991/92, this ~ounted to
$7.1 million (L4.9million), or O.25% of total UK ODA external assistance programs. This suppcxts the GEFand Montreal Protocol Fund andis completely separate from funding for the environment in its bilateral ODA programs.
39 ~ &~ sho~d ~ av~ble from the ~ ODA in 1993.
68 I Development Assistance, Export Promotion,
preparation in early 1992. The UK ODA’S scien-tific agency, the Natural Resources Institute(NRI), works with developing countries on pesti-cide management and control, and training forusers of pesticides and other potential sources ofhazardous waste. A “Renewable Natural Re-sources Strategy, ’ first published in 1989, coversprograms in agriculture, fisheries, forestry, live-stock, land resources assessment, integrated pestmanagement, and post-harvest technology. Brit-ish aid finds $49 million (34 million poundsSterling) worth of research in the renewableresources sector.40
British aid also funds large capital projects. In1989, it provided $53 million (39 million poundsSterling) for water and sanitation projects, ofwhich $25 million (17.4 million pounds Sterling)was devoted to providing clean drinking water insome 40 developing countries.41 It funds manyhuge infrastructure projects through its mixedcredit facility, the Aid and Trade Provision, orATP. ATP proposals in principle are subject tothe same appraisal criteria and environmentalconsiderations as all other aid.42 However, a studyby the National Audit Office (roughly the UKequivalent of the United States’ General Account-ing Office) found abuse of the ATP facility andsubsequent damage to the environment and publichealth associated with several large water proj-ects.43 These projects were planned and carriedout before UK ODA issued its 1992 Manual ofEnvironmental Appraisal. The manual, as well asother efforts to integrate ATP proposals into thecountry’s priorities system, may help bring ATPprojects in line with environmental standardsapplied to other UK ODA projects.
and Environmental Technology
Through its research programs and via theBritish Council, the UK ODA funds collaborativecleaner technology R&D, and environmentaltraining and institution building. The BritishCouncil manages the UK’s Technical Coopera-tion Trainin amme. In 1990-91, roughlyg Progr485 persons were trained in environmental sub-jects at either the technician or higher degree level(out of a total of 12,600 trainees). The programworks with trainees from developing countrieswho are trained at local institutions in their owncountries. Subjects include environmental aware-ness, impact assessment, environmental law,engineering, management and planning, wildlifemanagement, and pollution control.
The British Council also provides fellowshipsand training in Britain for professionals fromoverseas. A series of high-level internationalseminars for senior officials on a range of issuessuch as environmental policy and managementand environmental law took place in 1992.Programs are also already underway to increaseenvironmental awareness in ODA recipient coun-tries, including environmental protection coun-cils and public awareness campaigns in Ghanaand Guinea Bissau.44
In March 1993, British Prime Minister JohnMajor announced the United Kingdom Technol-ogy Partnership Initiative.45 The Initiative willseek to encourage firms in developing countriesto use British technologies and expertise thatmight contribute to improved performance andreduced environmental impacts. The 3-year pro-gram will foster partnerships between Britishcompanies and private sector firms and associa-tions in developing countries. A network of key
40 UK tim~ Development ~“ “ tratioq “Actionfor the Environment” May 1992 brochure, p. 38.
41 Ibid., pp. 30-31.42 ~cor~g t. ~ OD~ Am ~pplicatiom for -e power.genemtion proj~ts mi@t & “ex~ted” to include ~ environmental hnpwt
assessment or equivalent measure,as Am projects “often involve industrial developments which may require special measures to mitigatepollution problems.” UK Overseas Development Adrmms“ “ tratiom “Manual of Environmental Apprai@” April 1992, p. 15.
43 Natio~ Audit Office, (jversus Aid: Water and the Environment (report by the Comptroller ~d Auditor @ne@ ~SO).44 UK ~~e~ Development ~“ “ tratiou “Action for the Environment” May 1992 brochure, p. 40-41.
45 Whnc)lc)gy Partnership secretaria~ “-nxhnology p~“p: the Initiative,” brochure, n.d., n.p.
Chapter 5-Donor Country Profiles I 69
officials from government and industry will help country business personnel. UK firms also canbusiness personnel in developing countries obtain obtain specific information on the needs ofinformation about, among other matters, the best developing country businesses. British and devel-practices employed by British companies, new oping country firms can access the networktechnologies under demonstration in the UK, and through participating trade associations, Britishsources of financing and other help. Some assist- embassy or High Commission commercial of-ance will be provided to help UK companies fices, or the Partnership’s Secretariat in London.provide hands on training for key developing
Appendix A:Environmental
Markets inDeveloping and Newly
Industrialized Countries1,2
T he largest markets for environmental goodsand services (EGS) lie within the industrial-ized nations that are members of the Organ-isation for Economic Cooperation and Devel-
opment (OECD). These countries will continue toaccount for most EGS expenditures for the next 10 or20 years. However, there is likely to be rapid growthin EGS demand in non-OECD (developing, newlyindustrialized, and Eastern European and formerSoviet) countries. Estimates of the current and pro-spective size of this non-OECD market vary widely.One study concluded that non-OECD countries ac-counted for $36 billion out of an estimated $200 billionglobal EGS market in 1990; by the year 2000, theirEGS markets could grow to $55 billion (with the worldtotal projected to be $300 billion).3 Another sourceconcluded that non-OECD markets amount to $37billion (of a $270 billion world market); in 1996, thenon-OECD market could reach $61 billion (the worldtotal was projected to be $408 billion).4 Yet, anothersource, the International Finance Corporation, sug-gests that one-third of the current global EGS market
of $300 billion, which it projects will reach $600billion in 2000, is found outside the United States,Canada, Europe, and Japan.5
Differences in the estimates reflect in part differentdefinitions of the environmental industry. Some analy-ses include only goods and services for end-of-pipecontrol of air and water pollution and disposal andrecycling of wastes (although some pollution preven-tion consulting may be included). Others includerenewable energy and some energy-efficiency oppor-tunities. Some estimates encompass markets for watersupply, mobile source controls (such as catalyticconverters), noise control, or construction work associ-ated with environmental projects, while others do not.
Perhaps the greatest variable concerns so-called“cleaner technologies, “ including pollution preven-tion and energy-efficient equipment. These technolo-gies are generally integrated into processes-such asindustrial production processes, transportation sys-tems, or heating or cooling systems for buildings. Yetcleaner production and improved energy-efficiencyopportunities are often the most effective and most
1 This appendix draws on preliminary research from the OTA assessment, Amen”can Industry and the Environment: Implicata”onsfor Tradeand Competitiveness. While this appendix focuses on developing and newly industrialized country markets, the final report of the assessmentwill contain more in-depth analyses of global markets and U.S. competitiveness in the environmental goods and services sector.
2 This appendix discusses environmental markets related to the industrial and utility sectors, including water supply, wastewater treatmen~and refuse management. Environmental needs--and market possibilities-associated with land use managemen~ agriculture, foreslry,f~heries, biodiversity conservatio~ and ecotourism development are not addressed here.
3 OECD, The OECD Environment Industry: Situation, Prospects and Government Policies, OECD/GD(92)l (Paris: OECD, 1992).d Grant Ferrier, President of Environmental Business International Inc., testimony to House Committee on Merchant Marine and Fisheries,
Subcommittee on Environment and Natural Resources, Feb. 25, 1993.5 International Finance Comratio% Investing in the Environment: Business Opportunities in Developing Countries (Washington, Dc: ne
World Bank and the IFC, 1992), p. iii.
71
72 I Development Assistance, Export Promotion, and Environmental Technology
cost-effective options for addressing pollution andwaste. While often needed, end-of-pipe and remedialenvironmental controls are, by contrast, almost alwaysa net cost to business and frequently shift pollutionfrom one medium to another. (Per instance, waste-water treatment and some air scrubbing generates solidwastes that require disposal, while incinerators turnsolid wastes into air emissions that require control).
Although now only a modest part of the globalmarket, the environmental business opportunities inspecific developing countries and newly industrializedcountries (NICs) can be quite large. (Environmentaltechnology opportunities in Eastern Europe and theformer Soviet Union are not addressed here. They arethe subject of a separate OTA assessment.)6 Asdeveloping countries begin to address their environ-mental problems, environmental business opportuni-ties could grow quickly. Of particular interest toenvironmental technology vendors are the middle-income and fast-growing countries in East Asia andLatin America such as the four NIC “tigers” (HongKong, South Korea, Singapore, and Taiwan), Mexico,Brazil, Chile, Malaysia, and Thailand. Opportunitiesare also growing in some lower-income countries,including India, Indonesia, and China.
In many developing countries, government fundsfor environmental protection will likely remain sparse.The availability of financing from private or mixedpublic-private sources could be a critical determinantfor growth of environmental markets. The opening ofvarious developing country economies to greaterforeign investment and the loosening of state controlson energy, transport, and manufacturing industries-including privatization-provide growing possibilitiesfor environmentally favorable investment.
Examples of the magnitude of developing countryand NIC environmental markets include about $11
billion of environmental projects in Taiwan’s currentSix-Year Development Plan,7 over $10 billion inSouth Korea’s 1991-95 investment plans,8 an annualenvironmental market of $1.8 billion (1993) in the sixASEAN nations? and a $2.4 billion annual market(1992) in six Latin American countries.10
The NICS and some developing nations producesome of their EGS market needs. The technicalcapabilities of EGS industries in Singapore, SouthKorea, Taiwan, Mexico, Brazil, and some othercountries can be expected to increase. In fact, environ-mental goods are sometimes exported by these coun-tries--often at lower prices than offered by firms in theUnited States, Europe, or Japan. Environmental firmsfrom OECD countries face increased competition fromdeveloping country and NIC companies as well asfrom each other. However, OECD firms also arefinding opportunities for branch operations and jointventures in developing and newly industrialized coun-tries.
SECTOR TRENDSThere are several trends in developing and newly
industrialized countries which present vendors of EGSand cleaner technologies with growing markets:
development of water and wastewater treatmentinfrastructure;electrification;growing transportation needs;development of solid and hazardous waste disposalcapacity;increased industrial production; anddevelopment of environmental monitoring, stand-ard making, and enforcement capability.
6 ne fist rePrt of this other assessment is: U.S. congress, OffIce of lkchnology Assessmen4 Energy-lZJl?ciency TechnOh@fOr cen~aland Eastern Europe, OTA-E-562 (Washingto~ DC: U.S. Government Printing OtXce, May 1993).
7 ~eficm~ti~te ~ Taiw~ ~~Lis@ of ~wa’s S~-y~Development pl~ projects (p- List) & Status Report on !$ekcted MajOr
Projects,” August 1991.s Republic of Kor~Ministry of Environment White Paper 1990,1991, ti M WOO ~, “Perspective of Environmental Industry in Kor~”
paper presented at GLOBE ’92, Wncouwx, BC, CsE@ Mar. 1620, 1S92.9 Jom~ Menes, A- Assis~t Secretary for Trade Development, U.S. Department Of Comm-e, testimonY ~fore tie Home
Committee on Merchant Marine and Fisheries, Subcommittee on Environment and Natural Resources, Feb. 25, 1993. ASEAN is theAssociation of South East Asian Nations consisting of Brunei, Indones@ Malaysb Philippines, Singapore, and Tbailand.
10 US~,EnYiro_ntal~ar~t Co&”tionsandB~iness Oppo~nitiesinKey~tin A~rican Countries, BUSiIKSS FOCUS SerieS, oCtOh
1992 (available through USAID, Arlingtor.L VA). The six countries are Argen@ B- Chile, Colomb~ Mexico, and Venezuela
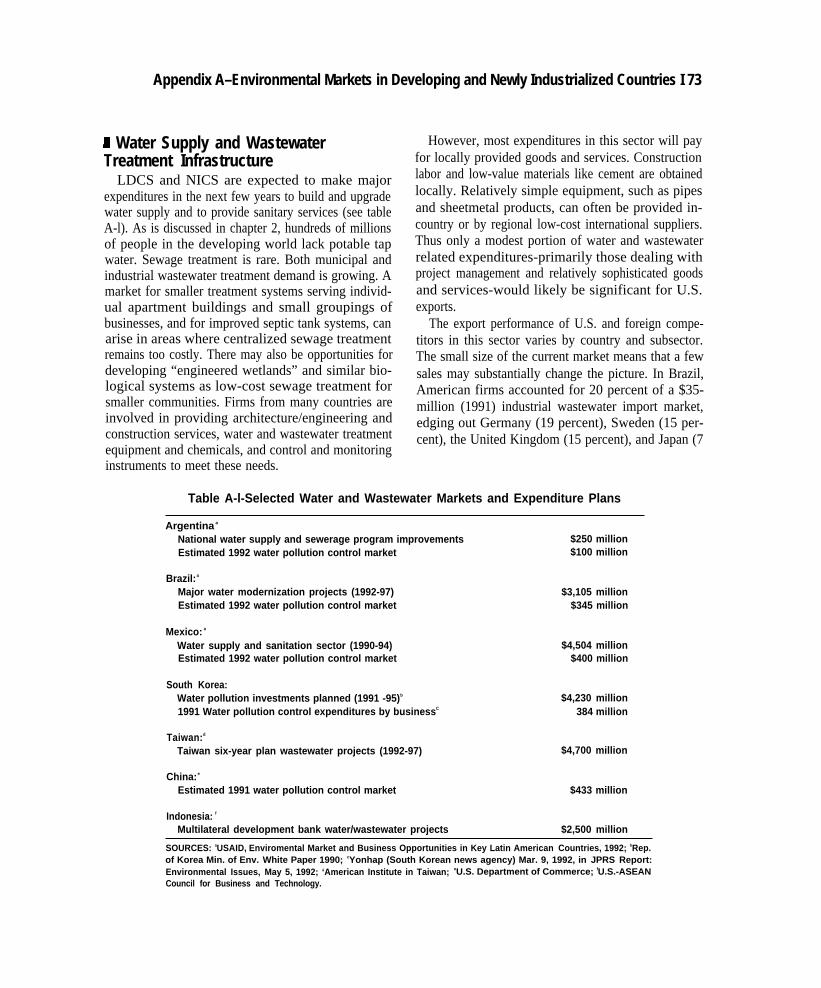
Appendix A–Environmental Markets in Developing and Newly Industrialized Countries I 73
I Water Supply and WastewaterTreatment Infrastructure
LDCS and NICS are expected to make majorexpenditures in the next few years to build and upgradewater supply and to provide sanitary services (see tableA-l). As is discussed in chapter 2, hundreds of millionsof people in the developing world lack potable tapwater. Sewage treatment is rare. Both municipal andindustrial wastewater treatment demand is growing. Amarket for smaller treatment systems serving individ-ual apartment buildings and small groupings ofbusinesses, and for improved septic tank systems, canarise in areas where centralized sewage treatmentremains too costly. There may also be opportunities fordeveloping “engineered wetlands” and similar bio-logical systems as low-cost sewage treatment forsmaller communities. Firms from many countries areinvolved in providing architecture/engineering andconstruction services, water and wastewater treatmentequipment and chemicals, and control and monitoringinstruments to meet these needs.
However, most expenditures in this sector will payfor locally provided goods and services. Constructionlabor and low-value materials like cement are obtainedlocally. Relatively simple equipment, such as pipesand sheetmetal products, can often be provided in-country or by regional low-cost international suppliers.Thus only a modest portion of water and wastewaterrelated expenditures-primarily those dealing withproject management and relatively sophisticated goodsand services-would likely be significant for U.S.exports.
The export performance of U.S. and foreign compe-titors in this sector varies by country and subsector.The small size of the current market means that a fewsales may substantially change the picture. In Brazil,American firms accounted for 20 percent of a $35-million (1991) industrial wastewater import market,edging out Germany (19 percent), Sweden (15 per-cent), the United Kingdom (15 percent), and Japan (7
Table A-l-Selected Water and Wastewater Markets and Expenditure Plans
Argentina a
National water supply and sewerage program improvements $250 millionEstimated 1992 water pollution control market $100 million
Brazil:a
Major water modernization projects (1992-97) $3,105 millionEstimated 1992 water pollution control market $345 million
Mexico: a
Water supply and sanitation sector (1990-94) $4,504 millionEstimated 1992 water pollution control market $400 million
South Korea:Water pollution investments planned (1991 -95)b $4,230 million1991 Water pollution control expenditures by businessC 384 million
Taiwan:d
Taiwan six-year plan wastewater projects (1992-97) $4,700 million
China: e
Estimated 1991 water pollution control market $433 million
Indonesia: f
Multilateral development bank water/wastewater projects $2,500 million
SOURCES: aUSAID, Enviromental Market and Business Opportunities in Key Latin American Countries, 1992; bRep.of Korea Min. of Env. White Paper 1990; cYonhap (South Korean news agency) Mar. 9, 1992, in JPRS Report:Environmental Issues, May 5, 1992; ‘American Institute in Taiwan; eU.S. Department of Commerce; fU.S.-ASEANCouncil for Business and Technology.
74! Development Assistance, Export Promotion, and Environmental Technology
percent).ll In Brazil’s municipal sector, U.S. producersheld 60 percent of a $135-million import market, aheadof Swedish and Japanese competitors. Complicatingmatters are a variety of licensing and joint venturearrangements between Brazilian and American, Brit-ish, Finnish, French, Swedish, and Swiss firms.Mexico’s water pollution control imports seem domi-nated by the U.S. with a 60 percent share (1989) versus14 to 15 percent shares for Japan and Germany.12 Incontrast, Japan is the biggest player in China’s waterpollution control import market of $48.9 million(1991), accounting for 40 to 45 percent, while U.S.sales were 8 percent, behind Austria’s 25 percent.13
Austrian, Danish, and Canadian exports of waterpollution control equipment to China have beensupported by grants and credits from those countries.The U.S. is the largest exporter of water-relatedequipment to Egypt (36 percent in 1991), surpassingJapan (21 percent), Germany (17 percent), and Italy(15 percent) .14 But in Morocco, France dominates with65 percent of the import market, high above U.S. andother European suppliers.15 The point of this snapshotis that it is hard to say who dominates world trade inthe water and wastewater sector except to note that theUnited States, Japan, and several European countriesare the key players.
M Electrification16
The World Bank estimates that electric power sectorcapital investment in developing countries, EasternEurope, and the former Soviet Union during the 1990smay reach $1 trillion.17 An analysis done for the1991/1992 U.S. National Energy Strategy projects thatduring the years 1990 to 2010, electric power invest-ments of over $1 trillion for 624 gigawatts of newcapacity will occur in the developing countries (not
including Eastern Europe or the former Soviet Union).18
Whether or not growth in electricity demand andproduction occurs at this rapid pace, there is increasingrecognition of the need for mitigating or preventingenvironmental impacts. Business opportunities willarise from the need for pollution abatement equipment,more efficient and cleaner power generating technolo-gies, and improved energy end-use efficiency. De-mand for architecture/engineering, construction, andproject management services-areas in which U.S.firms are strong contenders but face growing foreigncompetition-will be increasing.
In the area of air pollution abatement, a relativelyinexpensive initial option is particulate removal byelectrostatic precipitators or fabric filters. U. S., Japa-nese, and European manufacturers are competitive indeveloping country markets and local environmentalindustry capacity is growing. End-of-pipe controls forsulfur dioxide and nitrogen oxides are more sophisti-cated and expensive and perhaps too expensive forsome developing countries. U. S., Japanese, and Ger-man companies appear to be in the lead for thesegas-cleaning technologies, although multinational ar-rangements can make national comparisons difficult.For instance, ASEA Brown Boveri (ABB), considereda Swiss-Swedish conglomerate, owns CombustionEngineering, a U.S.-based maker of air pollutioncontrol equipment, and Flakt, a Swedish provider ofpollution controls. At the same time, ABB and variousU.S. companies license Japanese technology for selec-tive catalytic reduction (SCR) of nitrogen oxides. Avariety of U.S. companies license or have adaptedsulfur and nitrogen oxide control technologies fromJapan and Europe. In fact, some U.S. air pollutioncontrol firms are concerned about the growing strengthof German and Japanese gas-cleaning technology
~~ Ibid., p. 49.
12 Ibid., p. 112.13 U.S. Dep~~t of Commerce National Trade Data B-Id mid.
15 mid.
16 me O’rA ~=~ment Fueling D~elop*nt: Energy TeChnol~gies For D~eloping co~~”es, O’IA-E-516 (w@dIl@O& ~: U.S.
Oovernrnent Printing Office, April 1992) provides an extensive analysis of developing country energy and related envirurunental issues.17 World B* “~piti Expenditures for Electric Power in the Developing counties, ” IEN Energy Series Paper No. 21, February 1990,
in World BaulL “The Bank’s Role in the Eleetric Power Seetor,” draft Industry and Energy Department., box 5, p. 10.
la U.S. Department of En=SY, “National Energy Strategy ‘Ikchnical Amex 5: Analysis of Options to Increase Exports of U.S. Energylkehnology,” 1991/1992, DOE/S-0096P (Springfield, VA: National Tkdmical Information Service).
Appendix A–Environmental Markets in Developing and Newly Industrialized Countries I 75
suppliers. At the same time, some U.S. firms have theirown proprietary technologies.
American firms are major providers of air pollutioncontrol equipment (for power generators and industrialfacilities) in a number of markets. U.S. firms garnereda quarter of Brazil’s 1992 air pollution control imports(Sweden, Germany, and France together accounted forhalf). U.S. firms also accounted for over 25 percent of1989 Mexican air pollution control imports (versus 20percent for Germany, 14 percent for Japan, and 7percent for Switzerland) .19 In Singapore, Americanproducts earned nearly 40 percent of the 1991 importmarket share, with less than 15 percent from Japan andunder 10 percent from Germany .20
Making environmental technologies affordable iscritical to gaining markets in developing countries.Japan has embarked on a program to adapt power plantpollution control equipment to meet less rigorousemission requirements of developing countries at farless cost than would be required in Japan, America, orWestern Europe.21 Japan also plans to lease airpollution abatement equipment in Asian developingcountries.22
Cleaner generation technologies can offer morecost-effective environmental performance than the use’of add-on pollution abatement technologies. A varietyof ‘‘clean coal”23 technologies and combustion tur-bines (gas turbines) can allow developing countries touse their fossil fuel resources more cleanly andefficiently. In the clean coal area, the Department ofEnergy notes that the United States is at the technolog-ical forefront but that U.S. vendors have not been
leaders in marketing abroad. DOE points to German,Japanese, French, Swedish, and Italian suppliers as thestrong competitors.
24Increasing competition to Amer-
ican suppliers is found in the combustion turbinebusiness. General Electric is a major supplier in thissector. GE and its business associates abroad (variousEuropean and Japanese firms) who assemble turbinesusing key GE components supply roughly half theworld’s gas turbine market.25 ABB, Siemens (Ger-many), Westinghouse, Pratt & Whitney, Rolls-Royce(UK), and Mitsubishi (Japan) are among otherscompeting for this market. Licensing and joint ven-tures among competing manufacturers make com-petitiveness assessments difficult.
In the renewable energy sector, U.S. companies alsoface tough Japanese and European competition.26
While the market is now small, it is likely to grow asrenewable energy costs decrease and if increasingconcerns about global climate change force changes inenergy sources. Furthermore, some renewable energytechnologies are well suited to developing countrycircumstances where settlements are far from existingelectricity grids. German, Japanese, and Korean firmsare among America’s competitors in photovoltaic cellproduction. Siemens of Germany, which recentlypurchased ARCO Solar in the United States, isreportedly the world’s largest photovoltaic cell manu-facturer. Siemens exports 75 percent of its U.S.production. 27 Danish, Dutch, Japanese, and Germancompanies are among those who make utility-scalewind turbines. U.S. Windpower has been active inseeking developing country markets.28 Japan is noted
19 us-, Enviro~ntal Market Opportunities. . . . Op Cit., pp. 44, 105.
~ u.S. Dep~~t of Commerce National Trade Data Bank.
21 “Japanto work~~ _ kDevelop&g Cheap Desulfurization UtitS fOrphUMS,” International Environment Reporter, July 29, 1992;Kawasaki Heavy Industries, Ltd., information bookle~ 1992.
n “JapaneseTradeM inistry To Lease Anti-Pollution Devices To Developing Nations, ‘‘ InternationalEnvironmentReporter, July 15,1992,p. 469.
23 Clem COaI t~hologies refer to a variety of technologies including precombustion cl- g of coal to remove polluting components,cleaner combustion technologies, and postcombustion clean-up of stack gases. Stack gas clean-up was referred to in the previous paragraph.
w u.S. Department of Energy, “National Energy Strategy lkchnical Annex 6: Clean Coal Export Programs,” 1991/1992, DOE/S-0095P(Springfield, VA: National lkchnical Information Service), p. 2. DOE’s usage of the term “clean coal” also refers to end-of-pipe controls.
2S Eug~e ZIU Genm~ Electric, personal colnmticatiou Feb. 3, 1993.
26A fo~co~g OTA ~s~sment, Renewable Energy Technology: Research, Deve[op~nt, and commercial prospects, will @yX
technological and commercial aspects of renewable energy.27 ~k Cmtiord, “seven comp~e~ Aw~ded DOE Sok ~ants,” Energy Daily, Apr. 24, 1992, p. 3.
28 J~ Clflke, ‘tu.s. F- Smk to ~ket Whd pow~ fi LDcs,” Energy Daily, NOV. 18, 1992, pp. 1-2.
76 I Development Assistance, Export Promotion, and Environmental Technology
as a leader in the hydroelectric sector.29 Biomass,geothermal, and solar thermal are other renewableenergy options for electricity production.
Improving energy end use efficiency through bettermotors, lights, appliances, controls, heating, coolingand ventilation, and insulation may lead to otherenvironmentally preferable business opportunities.Improving energy efficiency can offer a “least-cost”option for meeting energy service demand by allowingcountries to avoid installation of expensive additionalelectricity generation capacity as well as future fuelcosts. As such, improved energy efficiency can presentlower up-front costs and conserve capital for a countryor utility.30 However, efficiency investments oftenhave a high first cost for consumers which dissuadesinvestment. Innovative financing for improved energyor electricity use efficiency can help overcome theconsumer first cost problems. Pioneered in the UnitedStates by utilities, regulators, “energy service compa-nies,’ and environmental organizations, such ‘demand-side management” approaches are being adopted bydeveloping country utilities (e.g., the Electric Generat-ing Authority of Thailand) .31 The potential for exportsof energy-efficient products to developing and NICmarkets is large-perhaps $4.2 billion annually overthe years 1990-2000 (for both electrical and nonelectri-cal energy conservation) .32 However, U.S. firms maynot now be well positioned to tap this market becauseof tough competition from Japanese and Europeanvendors already positioned in developing countriesand low-cost Korean and Taiwanese competition.33 Infact, the United States is a net importer of someenergy-efficient products such as compact fluorescentbulb ballasts.34 Efforts by American manufacturersand government export promotion officials to target
energy efficiency export opportunities are in their earlystages.
I TransportThe growth of motorized transportation in develop-
ing and newly industrialized countries provides an-other business opportunity for U.S. environmentaltechnology. The United States was the first majornation to institute strong vehicle emissions controls.The removal of lead from gasoline, installation ofcatalytic converters, and desulfurization of fuel wereundertaken in the United States in the 1970s. Japanquickly adapted some of its requirements to U.S.standards, in part to qualify its automotive exports toU.S. markets. Several European countries, Australia,Canada, and South Korea followed in the 1980s.35
However, only in 1993 has the European Community(EC) required the types of vehicle controls the UnitedStates has had for nearly two decades. As the UnitedStates continues to strengthen vehicle emission stand-ards and several industrialized nations research elec-tric, fuel cell, and hydrogen-powered vehicles, severalcountries in the developing world also appear to befollowing the initial U.S. path.
Mexico, Brazil, Taiwan, and South Korea are amongfast-industrializing countries that are requiring cata-lytic converters on new gasoline-powered cars. Argen-tina, Chile, Venezuela, Egypt, Turkey, India, Sin-gapore, and Thailand are expected to follow suit laterin the 1990s. Brazil, South Korea, and Taiwan areprojected to join the U. S., Canada, Japan, and WesternEurope in requiring stricter control-including the useof filters and catalysto--of diesel vehicle emissions.36
These requirements create markets for catalytic com-verters and diesel emissions control devices. The
29 U.S. Dep~ent of fim~, ‘tNati~@ Enerw Swegy ~~c~ hex 5: ~ysis of Optiom to ~r~e Expo* of U.S. ~rgy
‘Rdmology,” 1991/1992, op. cit., p. 47.30 U.S. CoWss, ~ce of ~~olog Asxssment, Fueling D~elop~nt: Energy Tech~logy For Developing Coun~”es, OTA-E-516
(Washington DC: U.S. Government Riming OfIlce, April 1992), p. 7.31 ~bmtio~ ~timte for ~erg CoUmatiom Seizing the Mo~nt: G/o/xz/ Oppo~~”& for the U.S. Energy-E@iency Z-,
December 1992, p. 4.
32 Ibid., p. 69.33 u-s. ~p~mt of FMXD, “Natio@ Ener~ Strat~ lkchnical Annex 6,” oP cit.
~ k~rnatio~ rnstimte for Energy Conservation op cit., p. 64.35 H&w xaent Scimm Co@@@ Inter~tio~IMobiIe Source Emissiom Controls Mar~t S&y: U@te No. 1, ~@fOr dle
Manufacturers of Emission Controls Association August 1990.
~ Ibid.
Appendix A–Environmental Markets in Developing and Newly Industrialized Countries I 77
largest producers of catalysts used in vehicle catalyticconverters are Johnson Matthey (British headquarteredwith extensive U.S. operations) and U.S. companiesAllied-Signal and Engelhardt; Degussa of Germanyand a number of Japanese and Taiwanese firms havesmaller shares of the market.37 Allied-Signal hasrecently expanded operations in France and Mexicoand has a joint venture in Japan. W.R. Grace may enterthe market as it researches electrically heated catalyststo meet future California standards. The substrates onwhich catalysts lie inside catalytic converters are madeby a number of U. S., Japanese, and European firms.Coming is a major manufacturer with manufacturingfacilities in Germany and licenses to Japanese manu-facturers.38 American firms are competitive in themobile source controls market.
Catalytic converters require unleaded gasoline. Thetechnology for producing low-sulfur fuels and un-leaded, reformulated, and oxygenated gasoline canalso be a source of revenue for U.S. firms. For instance,Mexican refineries are being adapted to make less-polluting fuels. The U.S. companies HRI, Texaco, andFoster Wheeler are under contract to provide technolo-gies for three Mexican refineries.39 Refurbishment andreplacement of public transit vehicles—including ve-hicles powered by natural gas-are yet another exportchance created by environmental concerns; and an-other area where U.S. manufacturers face strongforeign competition.
9 Solid and Hazardous WasteManagement
Many developing nations have limited capabilitiesfor safe and efficient waste collection and disposal. Forinstance, there are no sanitary landfills in Pakistan.40
Turkey, an OECD member, has neither sanitarylandfills nor incinerators, and Mexico’s landfill capac-ity is sufficient to meet the needs of only 21 percent ofthe population.41 Modem facilities for the manage-ment of hazardous and specialized (for instance,medical) wastes are often lacking; these wastes fre-quently end up being left at municipal dumps if not inwetlands, quarries, or along roads. Recycling, how-ever, can occur at relatively high rates within theinformal sector of developing country economies aspoor people salvage materials from the discards ofothers. 42
As countries seek to develop waste handling infra-structures, business opportunities arise for architecture/engineering and construction firms to design and buildlandfills and incinerators; for suppliers to sell a rangeof products, from landfill liners and trash handlingequipment to incinerator/waste-to-energy technolo-gies and monitoring instruments; and for servicecompanies to operate disposal sites and recyclingcenters. Among larger national waste managementprograms are Taiwan’s plans to spend $3.5 billion on23 solid waste disposal projects during the currentSix-Year Development Plan and South Korea’s 1991-95 plan to invest $2.6 billion by 1995 on wastemanagement projects, including 55 incinerators.43
South Korea also plans to construct 34 sanitarylandfills over the next 20 years. Energy recovery andpollution abatement for existing refuse incinerators inplaces like China also present market opportunities.
American and European firms are establishinghazardous waste treatment facilities in developingcountries. Waste Management International, subsidi-ary of Waste Management, Inc., operates hazardouswaste facilities in Hong Kong and Singapore and is inthe process of building such a facility in Java,
37 Stephen Lip- “U.S. fiviro~en~ Companies’ Competitive Strategies: Eleven Case Studies,” OTA Contractor Report, Mirch1993.
38 Cwton L. smi@ Cohg bc., presen~tion at “The ClearI Air Marketplace,” ~sons Comer, V’ Apr. 22-23, 199.3 9 Usm, Energy ~~ E~vjro~mnt Market co~itio~~ in ~~-~o, B~iness FocM series, ~ch 1992 (avdable thro@ U S A I D ,
AdillgtO~ VA), p. 27.@ Abm ~ker fi~j~ p~~~s ~pre=n~tive t. the ~t~tio~ Ufion for tie co~ervation Of Nature ~d Natural Resoumes,
Presentation at GLOBE ’92, Mncouver, BC, Cam@ Mar. 16-20, 1992.41 ~temtio~ Finance Corporatio~ Znvesring in the Environment. . . . Op cit., p. 16.42 ~ide
43 ~~m ~ti~te h mwm, Op cit.; Republic of Korea Ministry of fiVkOIMIenG Op Cit.

78 I Development Assistance, Export Promotion, and Environmental Technology
Indonesia.44 The Danish company I. Kruger has wonthe contract to develop in Malaysia an integratedhazardous waste treatment and disposal facility alongwith three regional collection centers; facilities areexpected to be on-line by 1995.45 In Brazil, a$60-million facility featuring a $30-million Finnishincinerator will be built by Ecoclear (Italy) and Gestaode Empreendimentos (Brazil) in Rio de Janeiro.46
American firms account for over 70 percent ofMexican imports of solid and hazardous waste equip-ment (1989).47 U.S. opportunities in waste-to-energyfacilities and hazardous waste incineration are stronglychallenged by German, Japanese, Swiss, and Scan-dinavian firms.
As in the case of water and wastewater treatmentinfrastructure development, most expenditures fornonhazardous and hazardous waste management arelikely to be spent on locally obtained labor andmaterials and on lower-technology components forwhich U.S. firms may not be the low-cost supplier.American companies can be competitive in design,management, and operation of private or govemment-contracted facilities, and in the supply of relativelysophisticated materials handling, treatment, inciner-ation, and monitoring equipment. Incinerators andwaste-to-energy plants present opportunities for sup-ply of air pollution control equipment, while waterpollution treatment technologies may be required forsanitary landfills.
I Industrial ProductionThe success of the NICS, which other developing
nations are trying to replicate, depended on rapidgrowth in manufacturing industries. Industrial growthbrings increased pollution but also can contribute tothe prosperity needed that can be used to battlepollution. Polluting industrial activities found in theNICS and developing countries are too numerous andheterogeneous to discuss succinctly. They range frommyriad small metal shops and tanneries to large
chemical, petroleum refining, and steel complexes.Textiles, primary metals, food products, electronics,automobile assembly, plastic and rubber products,paper and pulp, cement, and manyotherproducts madefor domestic markets and for export generate varyinglevels of pollution when made.
These sectors are increasingly regulated or comingunder other forms of pressure to control wastes andpollution. Thus, opportunities arise for purveyors ofenvironmental goods and services to help retrofit,modernize, and develop newer and cleaner industrialfacilities. For instance, state oil companies plan tomake investments to improve the environmental per-formance of their refineries in Brazil, Mexico, andTaiwan.48 Private and state-owned mining and smelt-ing companies in Chile are making or plan to makeinvestments in scrubbers and new smelting equipmentto lower sulfur dioxide emissions.49 Some U. S.,European, and Japanese multinational corporationsbring home-country or stricter-than-local corporateenvironmental standards to their developing countryoperations. Developing countries share with the U. S.,Europe, and Japan the industrial challenge of phasingout chlorofluorocarbons (CFCS).
In many cases, the environmental equipment andservices required is similar to that described above forwastewater, electric power, and waste handling. Dustand particulate control is often the initial air qualitypriority, as standard sewage treatment is for water.Scrubbing of sulfur and nitrogen oxides, odor andhydrocarbon emissions control, and control of heavymetals and other hazardous substances are otherpriorities. Designing and equipping wastewater andsolid and hazardous waste facilities for industrial parksis a promising area. Such environmental facilitiesserving numerous industrial waste and effluent genera-tors can effect pollution control at lower costs toenterprises than if each one had its own treatmentfacility.
44 PatrickHein.inger, waste Management International, presentation to theu.s. tivironmentd ~tiOIOgySerninar, Jakartq Indonesia, Oct.27, 1992.
45 ~vhomen~ -gement and Re~eW~h ~~ociation of ~aysia @NS~CH) Brief% to U.S. ~viroIIIIlenM ~chIIOIOgy and
Business Mission Participants, Oct. 30, 1992.46 us-, Environmental Market Opportunifl”es. . . . Op. cit., p. 51.
AT ~id., p. Ilg and IJ.S. Department of Commerce National Trade Data Bank.4S ~~w ~ti~te ~ ~wan, “Listing of ‘Ihiwan’s. . .“, op. cit.; and USAID, Environmental Market Conditions. . . . op. cit.@ Usm, ibid.
Appendix A—Environmental Markets in
Despite certain economic advantages in centralizedtreatment and disposal of industrial wastes and efflu-ents, there are also environmental business opportuni-ties at the enterprise level. For instance, metal finishersand electronic plants generate wastewater containingheavy metals. Where effluent standards exist and areenforced facilities typically use chemicals to precipi-tate metals into a sludge which is then removed fordisposal. In developing countries, as in the UnitedStates, Canada, Europe, and Japan, there is thepossibility of removing and recovering metals fromwater by means of ion exchange. American, European,and Japanese firms produce ion exchange resins andapparatus and could be competitive suppliers to theNIC and developing nation markets. The first reportedvendor of an ion exchange effluent control system inMalaysia is RMC Dornier, a subsidiary of DeutscheAerospace (which is owned by Daimler-Benz).50 Ionexchange is just one example of pollution control andprevention equipment applicable to particular indus-tries at the plant level. Solvent and aqueous bathrecovery, volatile organic compound recovery ordestruction, odor control, and particulate control areamong others.
U. S., European, and Japanese firms are also theleading actors in the development of cleaner industrialproduction approaches. Often pollution preventionapproaches can save money and improve quality,whereas end-of-pipe control and disposal is almostalways a cost to business. Opportunities arise forarchitecture/engineering firms to design and for Amer-ican industrial firms to invest directly in cleanerproduction facilities in developing countries.
Finally, past industrial activities have resulted incontaminated sites from which a hazardous substanceremediation market may arise. The United States is aleader in this area because of strict requirements underSuperfund and the Resource Conservation and Recov-ery Act. Underground storage tank requirements andattention to contaminated Defense and Energy Depart-ment sites further propel the U.S. EGS industry.European and Japanese concerns over their con-taminated lands have stimulated remedial activities inthose countries, sometimes using American developedtechnologies but sometimes employing their own
Developing and Newly Industrialized Countries I 79
technologies (e.g., Dutch soil washing technology).However, remediation markets in developing and NICeconomies are likely to remain quite modest for sometime. Developing country environmental prioritiesgenerally lie in limiting additional environmentalinsult through establishment of wastewater treatmentand waste disposal infrastructure, and requiring envi-ronmental controls on new and existing industrialfacilities. Furthermore, many developing countrieshave had a relatively short history of activity in toxicchemical-intensive industries. Although there may beindividual circumstances where contaminated sitespresent an extraordinary hazard or where leakedchemicals and fuels might be recovered for use,generally remediation will be a lower priority.
H Environmental MonitoringAlthough relatively small, the market for environ-
mental monitoring and testing can be the linchpin forthe development of environmental regulations, stand-ards, and enforcement. As such, the use of develop-ment assistance and export promotion programs totarget developing and NIC markets in environmentalmonitoring and testing instruments may yield long-term commercial dividends.
Countries developing an environmental regulatorycapability need to be able to monitor the state of theenvironment, establish quantifiable standards, andmonitor compliance. Pollution-monitoring devices,analytical instruments, fine chemicals and chemicaltest kits, and various laboratory supplies are requiredto perform such functions. Instruments and laboratoryprotocols adopted by a country’s environmental agencymight determine the types of instruments that will beused by state or provincial officials, municipalities,water and sewer authorities, private laboratories, andregulated industries. American instrument manufac-turers compete with Japanese, German, and otherEuropean manufacturers. In southeast Asia, Australianinstruments also compete. Cost as well as precision areimportant, so the best technology may not be the bestseller. American technologies are often perceived astoo expensive and overengineered. An advantage theUnited States does have is the good reputation the U.S.EEA and its standards have abroad, and the widespread
m ~aysia~~entof~e Bnvimnment Brie@ to U.S. Bnvironrnental ‘Rxbology and Business Mission Participants, KtiaLwpur,Oct. 29, 1992; and BnviroPm ’92 Conference and Trade Show display, Kuala Lumpur, Oct. 30, 1992.
80 I Development Assistance, Export Promotion, and Environmental Technology
use of American Water Works Association, WaterEnvironment Federation, and other U.S. industry andprofessional standards internationally. America’s Eu-ropean and Japanese competitors are interested inpromoting the use of their standards in developingcountry markets.
Japan’s funding of environmental managementcenters in several Asian countries has the potential tostrongly influence the choice of instruments andstandards in those countries. For instance, Japan isfinancing and equipping the central reference labora-tory for the Indonesian environment agency BAPEDAL.51
The use of Japanese manufactured equipment forofficial standard-setting and monitoring may influenceprovincial and local authorities and private companiesto purchase like equipment from Japan. The provisionof equipment to standard-setting and enforcementagencies can be a gateway to further sales.
CONCLUSIONThe trends point to increased environmental con-
cerns in developing countries. Improvements in infra-structure, expanding industry, and growing environ-mental administrative capacity point toward an ex-panding market for environmental technologies andservices. While much of the environmental expendi-tures will flow to local and regional providers of labor,materials, and lower-technology products, there willbe important opportunities for American companies toexport their equipment, instruments, and technical andmanagerial expertise. U.S. environmental companiesface considerable competition from foreign firms,chiefly from Europe and Japan but also from develop-ing and newly industrialized country companies withgrowing capabilities.
51 BAPEDAL, Briefimg to u.S. Environmental ‘I&hnology and Business Development Mission Participants, Mart% Indonesi% Oct. 26,1992.
Appendix B:U.S. Export
Promotion Activitiesand Environmental
Technologies
COORDINATION OF FEDERAL ACTIVITIES
F ederal export promotion and financing re-sponsibilities are divided among many agen-cies. The agencies with primary or majormissions to promote U.S. exports and interact
with and provide services to U.S. companies are theDepartment of Commerce, the Export-Import Bank ofthe United States (Eximbank), the Overseas PrivateInvestment Corporation (OPIC), and the Trade Develo-pment Agency (’IDA). The Office of the U.S. TradeRepresentative, the Department of State, and the U.S.Treasury are all important in developing trade policyand conducting the United States’ policy agenda andnegotiations. The Department of Agriculture plays acritical role in promoting U.S. agricultural exports.Other agencies may be active in some trade promotionactivities, but this is not their main mission. Encourag-ing U.S. private sector involvement in developmentassistance is a feature of several U.S. Agency forInternational Development (USAID) programs andactivities. The Department of Energy (DOE) and theSmall Business Administration (EPA) are involved inexport promotion to further specific agency missions.Other agencies, such as the Environmental ProtectionAgency @PA), may become involved because of theirspecial expertise or responsibilities.
With so many programs and agencies, there hasbeen growing recognition that Federal programs are
poorly coordinated, often duplicative, and that anoverall strategy to guide Federal activities has beenlacking. Recent initiatives by Congress and the execu-tive branch aimed at improving program coordinationand developing a more strategic emphasis are dis-cussed below. Some of the initiatives focus onenvironmental goods and services. Table B-1 showsselected Federal programs pertinent to promotion ofenvironmental exports.
I Trade Promotion CoordinatingCommittee
The interagency Trade Promotion CoordinatingCommittee was set up in May 1990 by formerPresident Bush with the aim of consolidating andstreamlining Federal export promotion activities. Con-gress, in the Export Enhancement Act of 1992, gavestatutory status to the TPCC, which is chaired by theSecretary of Commerce. 1 The Export EnhancementAct also gave statutory direction for an EnvironmentalTrade Working Group under the TPCC to develop astrategy to expand U.S. exports of environmentaltechnologies, goods and services, and to address allissues related to export promotion and financing ofenvironmental technologies.2
The Export Enhancement Act identifies 12 perma-nent members of the TPCC (see table B-2). Box B-A
1 Export Enhancement Act of 1992, Public Law 102-429, Sec. 201. TPCC’s predecessor was the Interagency Task Force on Trade. U.S.General Accounting Offkx, Export Promotion: Federal Programs Lack Organization and Funding Cohesiveness, NSA.ID-92-49(Gaithersbuzg, MD: U.S. General Accounting Office, Jan. 10, 1992), p. 7.
z EXpOrt Enhancement Act, 1992, op.cit., SeC. 204(a).
81
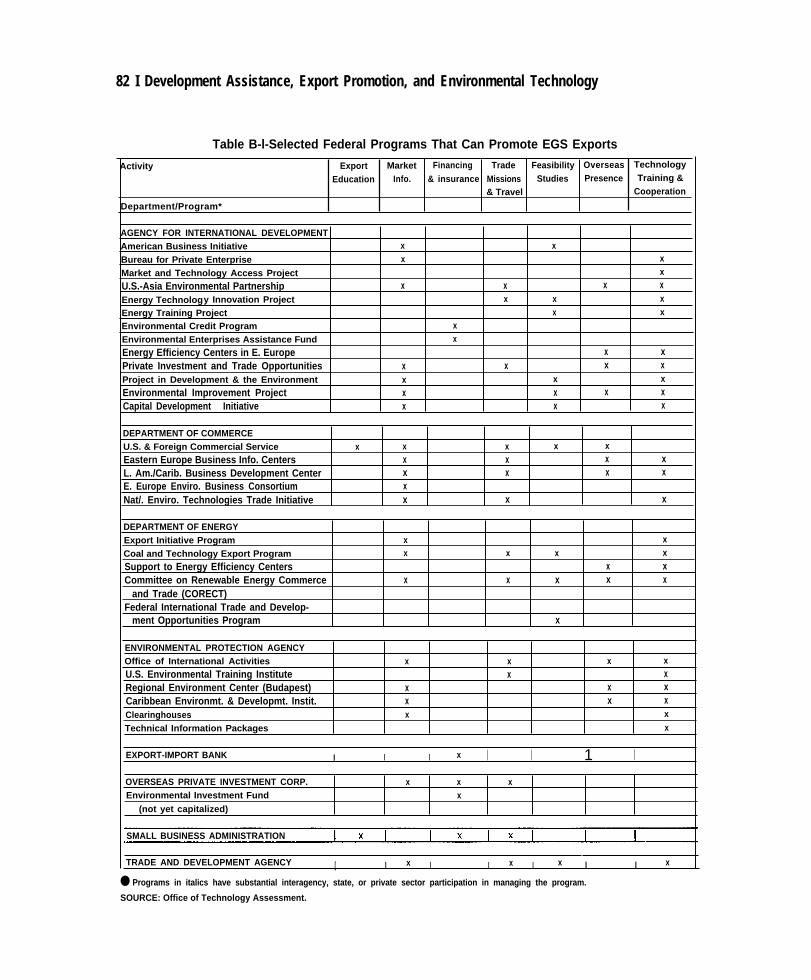
82 I Development Assistance, Export Promotion, and Environmental Technology
Table B-l-Selected Federal Programs That Can Promote EGS Exports
Activity Export Market Financing Trade Feasibility Overseas Technology
Education Info. & insurance Missions Studies Presence Training &
& Travel Cooperation
Department/Program*
AGENCY FOR INTERNATIONAL DEVELOPMENTAmerican Business Initiative x x
Bureau for Private Enterprise x x
Market and Technology Access Project x
U.S.-Asia Environmental Partnership x x x xEnergy Technology Innovation Project x x x
Energy Training Project x x
Environmental Credit Program x
Environmental Enterprises Assistance Fund x
Energy Efficiency Centers in E. Europe x xPrivate Investment and Trade Opportunities x x x xProject in Development & the Environment x x x
Environmental Improvement Project x x x xCapital Development Initiative x x x
DEPARTMENT OF COMMERCEU.S. & Foreign Commercial Service x x x x x
Eastern Europe Business Info. Centers x x x xL. Am./Carib. Business Development Center x x x xE. Europe Enviro. Business Consortium xNat/. Enviro. Technologies Trade Initiative x x x
DEPARTMENT OF ENERGYExport Initiative Program x x
Coal and Technology Export Program x x x x
Support to Energy Efficiency Centers x xCommittee on Renewable Energy Commerce x x x x x
and Trade (CORECT)Federal International Trade and Develop-
ment Opportunities Program x
ENVIRONMENTAL PROTECTION AGENCYOffice of International Activities x x x x
U.S. Environmental Training Institute x xRegional Environment Center (Budapest) x x xCaribbean Environmt. & Developmt. Instit. x x xClearinghouses x x
Technical Information Packages x
EXPORT-IMPORT BANK I I I x I I 1 I
OVERSEAS PRIVATE INVESTMENT CORP. x x xEnvironmental Investment Fund x
(not yet capitalized)
SMALL BUSINESS ADMINISTRATION
TRADE AND DEVELOPMENT AGENCY [ I x I I x I x I I x
● Programs in italics have substantial interagency, state, or private sector participation in managing the program.
SOURCE: Office of Technology Assessment.
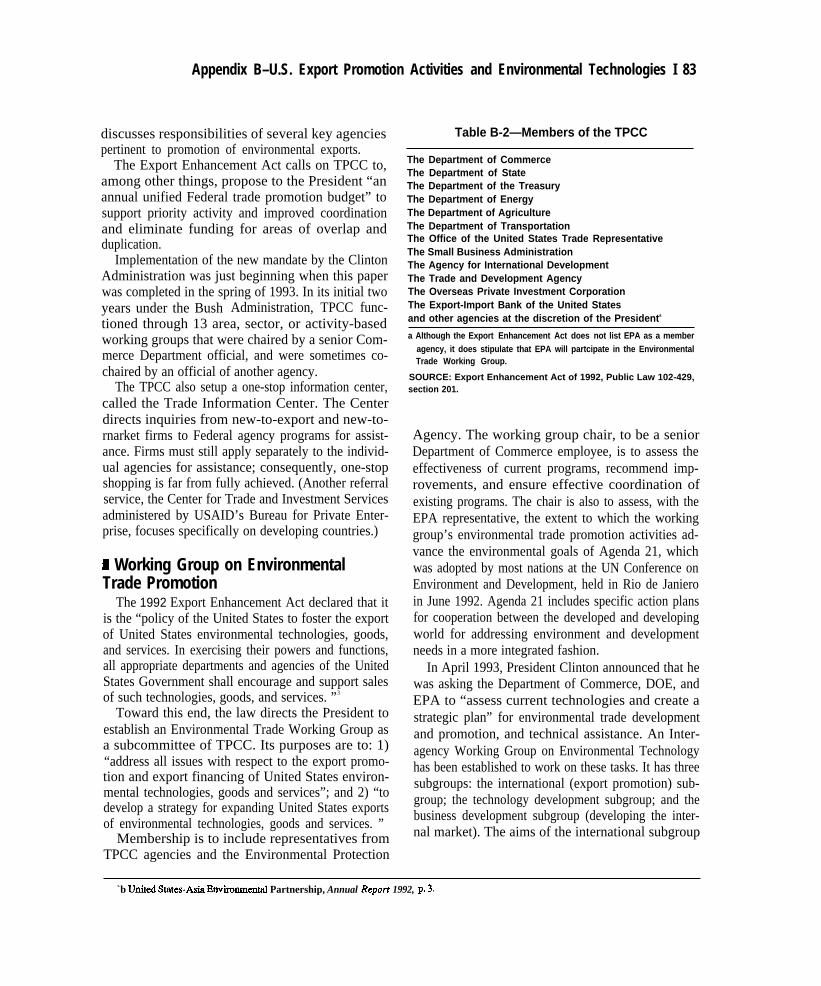
Appendix B–U.S. Export Promotion Activities and Environmental Technologies I 83
discusses responsibilities of several key agenciespertinent to promotion of environmental exports.
The Export Enhancement Act calls on TPCC to,among other things, propose to the President “anannual unified Federal trade promotion budget” tosupport priority activity and improved coordinationand eliminate funding for areas of overlap andduplication.
Implementation of the new mandate by the ClintonAdministration was just beginning when this paperwas completed in the spring of 1993. In its initial twoyears under the Bush Administration, TPCC func-tioned through 13 area, sector, or activity-basedworking groups that were chaired by a senior Com-merce Department official, and were sometimes co-chaired by an official of another agency.
The TPCC also setup a one-stop information center,called the Trade Information Center. The Centerdirects inquiries from new-to-export and new-to-rnarket firms to Federal agency programs for assist-ance. Firms must still apply separately to the individ-ual agencies for assistance; consequently, one-stopshopping is far from fully achieved. (Another referralservice, the Center for Trade and Investment Servicesadministered by USAID’s Bureau for Private Enter-prise, focuses specifically on developing countries.)
1 Working Group on EnvironmentalTrade Promotion
The 1992 Export Enhancement Act declared that itis the “policy of the United States to foster the exportof United States environmental technologies, goods,and services. In exercising their powers and functions,all appropriate departments and agencies of the UnitedStates Government shall encourage and support salesof such technologies, goods, and services. ”3
Toward this end, the law directs the President toestablish an Environmental Trade Working Group asa subcommittee of TPCC. Its purposes are to: 1)“address all issues with respect to the export promo-tion and export financing of United States environ-mental technologies, goods and services”; and 2) “todevelop a strategy for expanding United States exportsof environmental technologies, goods and services. ”
Membership is to include representatives fromTPCC agencies and the Environmental Protection
Table B-2—Members of the TPCC
The Department of CommerceThe Department of StateThe Department of the TreasuryThe Department of EnergyThe Department of AgricultureThe Department of TransportationThe Office of the United States Trade RepresentativeThe Small Business AdministrationThe Agency for International DevelopmentThe Trade and Development AgencyThe Overseas Private Investment CorporationThe Export-Import Bank of the United Statesand other agencies at the discretion of the Presidenta
a Although the Export Enhancement Act does not list EPA as a memberagency, it does stipulate that EPA will partcipate in the EnvironmentalTrade Working Group.
SOURCE: Export Enhancement Act of 1992, Public Law 102-429,section 201.
Agency. The working group chair, to be a seniorDepartment of Commerce employee, is to assess theeffectiveness of current programs, recommend imp-rovements, and ensure effective coordination ofexisting programs. The chair is also to assess, with theEPA representative, the extent to which the workinggroup’s environmental trade promotion activities ad-vance the environmental goals of Agenda 21, whichwas adopted by most nations at the UN Conference onEnvironment and Development, held in Rio de Janieroin June 1992. Agenda 21 includes specific action plansfor cooperation between the developed and developingworld for addressing environment and developmentneeds in a more integrated fashion.
In April 1993, President Clinton announced that hewas asking the Department of Commerce, DOE, andEPA to “assess current technologies and create astrategic plan” for environmental trade developmentand promotion, and technical assistance. An Inter-agency Working Group on Environmental Technologyhas been established to work on these tasks. It has threesubgroups: the international (export promotion) sub-group; the technology development subgroup; and thebusiness development subgroup (developing the inter-nal market). The aims of the international subgroup
`b Utitd states-~~ Environmen@l Partnership, Annual Repo# 1992, p. 3.
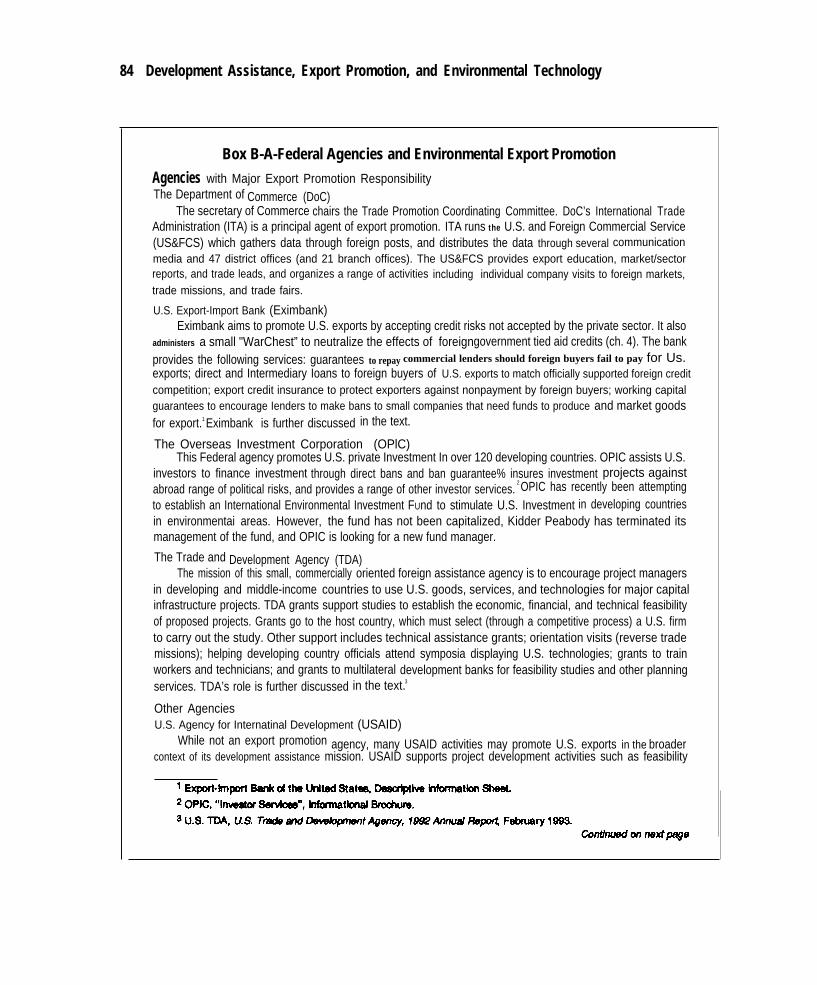
84 Development Assistance, Export Promotion, and Environmental Technology
Box B-A-Federal Agencies and Environmental Export Promotion
Agencies with Major Export Promotion ResponsibilityThe Department of Commerce (DoC)
The secretary of Commerce chairs the Trade Promotion Coordinating Committee. DoC’s International TradeAdministration (ITA) is a principal agent of export promotion. ITA runs the U.S. and Foreign Commercial Service(US&FCS) which gathers data through foreign posts, and distributes the data through several communicationmedia and 47 district offices (and 21 branch offices). The US&FCS provides export education, market/sectorreports, and trade leads, and organizes a range of activities including individual company visits to foreign markets,trade missions, and trade fairs.
U.S. Export-Import Bank (Eximbank)Eximbank aims to promote U.S. exports by accepting credit risks not accepted by the private sector. It also
administers a small "WarChest” to neutralize the effects of foreigngovernment tied aid credits (ch. 4). The bankprovides the following services: guarantees to repay commercial lenders should foreign buyers fail to pay for Us.exports; direct and Intermediary Ioans to foreign buyers of U.S. exports to match officially supported foreign creditcompetition; export credit insurance to protect exporters against nonpayment by foreign buyers; working capitalguarantees to encourage Ienders to make bans to small companies that need funds to produce and market goodsfor export.1 Eximbank is further discussed in the text.
The Overseas Investment Corporation (OPlC)This Federal agency promotes U.S. private Investment In over 120 developing countries. OPIC assists U.S.
investors to finance investment through direct bans and ban guarantee% insures investment projects againstabroad range of political risks, and provides a range of other investor services.
2 OPIC has recently been attemptingto establish an International Environmental Investment FUnd to stimulate U.S. Investment in developing countriesin environmentai areas. However, the fund has not been capitalized, Kidder Peabody has terminated itsmanagement of the fund, and OPIC is looking for a new fund manager.
The Trade and Development Agency (TDA)The mission of this small, commercially oriented foreign assistance agency is to encourage project managers
in developing and middle-income countries to use U.S. goods, services, and technologies for major capitalinfrastructure projects. TDA grants support studies to establish the economic, financial, and technical feasibilityof proposed projects. Grants go to the host country, which must select (through a competitive process) a U.S. firmto carry out the study. Other support includes technical assistance grants; orientation visits (reverse trademissions); helping developing country officials attend symposia displaying U.S. technologies; grants to trainworkers and technicians; and grants to multilateral development banks for feasibility studies and other planningservices. TDA’s role is further discussed in the text.3
Other AgenciesU.S. Agency for Internatinal Development (USAID)
While not an export promotion agency, many USAID activities may promote U.S. exports in the broadercontext of its development assistance mission. USAID supports project development activities such as feasibility
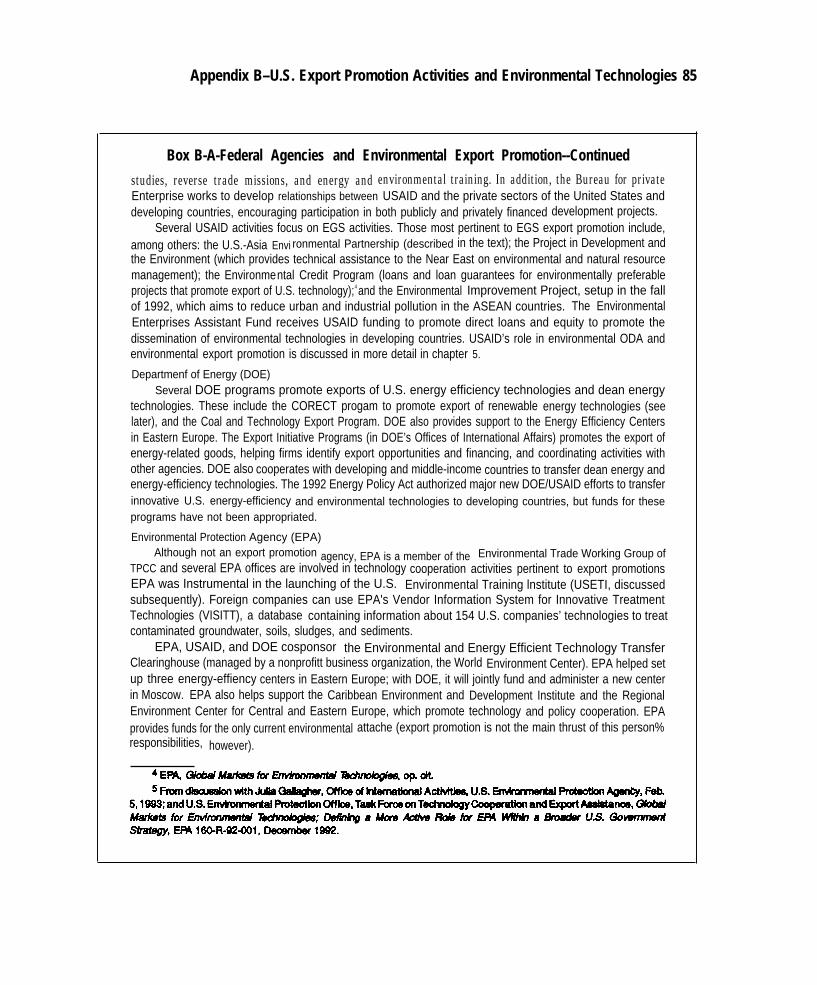
Appendix B–U.S. Export Promotion Activities and Environmental Technologies 85
Box B-A-Federal Agencies and Environmental Export Promotion--Continued
studies, reverse trade missions, and energy and environmental training. In addition, the Bureau for privateEnterprise works to develop relationships between USAID and the private sectors of the United States anddeveloping countries, encouraging participation in both publicly and privately financed development projects.
Several USAID activities focus on EGS activities. Those most pertinent to EGS export promotion include,among others: the U.S.-Asia Envi ronmental Partnership (described in the text); the Project in Development andthe Environment (which provides technical assistance to the Near East on environmental and natural resourcemanagement); the Environmental Credit Program (loans and loan guarantees for environmentally preferableprojects that promote export of U.S. technology);4 and the Environmental Improvement Project, setup in the fallof 1992, which aims to reduce urban and industrial pollution in the ASEAN countries. The EnvironmentalEnterprises Assistant Fund receives USAID funding to promote direct loans and equity to promote thedissemination of environmental technologies in developing countries. USAID’s role in environmental ODA andenvironmental export promotion is discussed in more detail in chapter 5.
Departmenf of Energy (DOE)Several DOE programs promote exports of U.S. energy efficiency technologies and dean energy
technologies. These include the CORECT progam to promote export of renewable energy technologies (seelater), and the Coal and Technology Export Program. DOE also provides support to the Energy Efficiency Centersin Eastern Europe. The Export Initiative Programs (in DOE’s Offices of International Affairs) promotes the export ofenergy-related goods, helping firms identify export opportunities and financing, and coordinating activities withother agencies. DOE also cooperates with developing and middle-income countries to transfer dean energy andenergy-efficiency technologies. The 1992 Energy Policy Act authorized major new DOE/USAID efforts to transferinnovative U.S. energy-efficiency and environmental technologies to developing countries, but funds for theseprograms have not been appropriated.
Environmental Protection Agency (EPA)Although not an export promotion agency, EPA is a member of the Environmental Trade Working Group of
TPCC and several EPA offices are involved in technology cooperation activities pertinent to export promotionsEPA was Instrumental in the launching of the U.S. Environmental Training lnstitute (USETI, discussedsubsequently). Foreign companies can use EPA's Vendor Information System for Innovative TreatmentTechnologies (VISITT), a database containing information about 154 U.S. companies’ technologies to treatcontaminated groundwater, soils, sludges, and sediments.
EPA, USAID, and DOE cosponsor the Environmental and Energy Efficient Technology TransferClearinghouse (managed by a nonprofitt business organization, the World Environment Center). EPA helped setup three energy-effiency centers in Eastern Europe; with DOE, it will jointly fund and administer a new centerin Moscow. EPA also helps support the Caribbean Environment and Development Institute and the RegionalEnvironment Center for Central and Eastern Europe, which promote technology and policy cooperation. EPAprovides funds for the only current environmental attache (export promotion is not the main thrust of this person%responsibilities, however).
86 I Development Assistance, Export Promotion, and Environmental Technology
appear similar to the environmental trade workinggroup called for in the Export Enhancement Act.
8 The United States-Asia EnvironmentalPartnership (USAEP)
USAEP is an export promotion and developmentassistance program aimed at helping countries in theAsia-Pacific region to solve environmental problemsusing U.S. environmental goods and services. It isintended to be a partnership on at least three levels:between different government agencies, between gov-ernment and the private sector, and between Asia andthe United States. It is too early to measure USAEP’Ssuccess.
So far, USAEP is funded primarily by discretionaryfunding from USAID. USAID plans to contribute $100million in core funding over 5 years,4 although thiscommitment can be withdrawn any time. USAEP alsois in the early stages of identifying alternative sourcesof funds and other resources, both public and private.
On the government side, USAEP includes over 20U.S. government agencies. During the Bush Adminis-tration, coordination was facilitated through a specialTPCC working group, co-chaired by USAID and theDepartment of Commerce. USAEP is intended toprovide “one-stop shopping” for all areas of U.S.government assistance, including technology show-casing, training and technology transfer, export financ-ing and risk insurance, and feasibility study funding. Asmall secretariat provides technical assistance andfacilitates public-private interaction.
USAEP activities are intended to encourage tech-nology cooperation between U.S. firms and Asianbusinesses. By promoting sales, licensing, and jointventures, it hopes to help Asian firms meet environ-mental requirements while achieving operating effi-ciencies. It also seeks to transfer U.S. technology andknow-how about environmental and energy-efficientinfrastructure for publicly sponsored infrastructureprojects in Asia. It aims to support training and otherhuman resource development, as well as institutionaldevelopment related to environmental technologytransfer and networking between Asian and American
organizations. USAEP in addition is seeking to sup-port protection of biodiversity.
By late 1992, the Secretariat had 10 projects on-lineand 10 in the planning process.
5 For example, it plansto set up an Infrastructure Advisory Service tocoordinate U.S. government financing, providing one-stop financing to help U.S. companies participate indevelopment infrastructure projects. It is also planninga service to gather, organize, and disseminate informa-tion about Asian environmental trade and investmentopportunities, in conjunction with other businessinformation services.
USAEP is in the process of placing “businessrepresentatives “ in nine Asian countries to identifyopportunities and contacts for U.S. companies. It alsomay support the personnel costs of placing an environ-mental infrastructure specialist in the Asian Develop-ment Bank and perhaps the World Bank to monitorAsian environmental projects.
USAEP also has an arrangement with the NationalAssociation of State Development Agencies (NASDA)called the USAEP/NASDA Technology Fund,launched Oct. 1, 1992. Through NASDA, state agen-cies and local trade organizations may apply to USAEPfor matching funds ($10,000-$30,000) for U.S. busi-nesses to develop trade opportunities in Asia. Propos-als that target specific commercial opportunities in lessdeveloped Asian nations, including participation ofseveral companies, and involving small or medium-size enterprises, will be given greater consideration.Use of the funding is flexible and can include shipmentof demonstration equipment, travel expenses, training,technology adaption, etc. As of March 1,1993, the newenvironmental fund awarded grants totaling $383,000for 18 projects. (See subsequent discussion of Statecoordination.)
I Committee On Renewable EnergyCommerce and Trade (CORECT)
CORECT was setup in 19846 to coordinate Federalpolicy and programs to promote exports in therenewable energy field. Chaired by the Secretary ofEnergy, CORECT includes 14 Federal agencies and
4 United States-Asia Environmental Partnership, Annual RepOn 199z, P. s.5 i cus.~ ~o- Review ad s~~s Report, cable transmitted Nov. 30, 1992, from USD Asia Bureau to ~1 Posts k ‘i&
6 Renewable E~~gy ~d~~ Development At of 1$)83, Pubfic ~w g&s70, ~end~ by tie Renewable Energy Wd EIler~ ~lCieIICy
Technology Competitiveness Act of 1989, Public Law 101-218.
Appendix B–U.S. Export Promotion Activities and Environmental Technologies I 87
industry (often represented through the Export Councilfor Renewable Energy (ECRE)).
CORECT's structure encourages a close relation-ship between Federal agencies and industry. Industryrepresentatives influence the priority setting and pro-gram planning processes of CORECT through fre-quent “Focus Group Meetings” with Federal agencyofficials. Once a task is identified as meriting support,each agency can commit resources depending on itsown mission and expertise. Although Congress hasgiven funds to DOE for administering the process,7
each agency maintains control of its own resources.It is difficult to evaluate the impact of CORECT on
exports of U.S. renewable energy technologies be-cause public trade data is incomplete and the industryreveals little about its trading activities.8 A recent U.S.General Accounting Office report9 notes thatCORECT did not meet a congressional deadline toformulate a plan for increasing renewable energyexports. Still, CORECT has identified barriers toexporting, investigated markets, and sponsored tradepromotion events, which could comprise basic compo-nents of a trade plan. CORECT and ECRE haveestablished a uniform application form to make itsimpler for firms in the renewable energy field to applyfor financing from USAID, Eximbank OPIC, andTDA. GAO also concluded that CORECT had beensuccessful in pulling financial resources from Federalagencies and industry for trade development activities,as well as from multilateral institutions, and has beeninstrumental in developing new financing mecha-nisms. U.S. renewable energy technology firms muststill, however, compete against very competitiveforeign financing and subsidization schemes.
Recently, there has been interest in extendingCORECT’s approach to include energy efficiency, andDOE is planning to establish a parallel committee or asubcommittee of CORECT for this purpose.
TRADE DEVELOPMENT AND TRAININGTrade development programs cultivate the potential
for trade through such activities as trade missions,feasibility studies, reverse trade missions, and training.The Federal government is encouraging U.S. firms toprovide training to developing country officials as away to “promote the transfer of environmentallysound technologies and management principles.”l0
Such training can help establish commercial relationsbetween U.S. firms and developing countries, and mayhelp promote sales of U.S. technologies.
I U.S. Trade and Development Agency11
As discussed in Box B-A, TDA supports feasibilitystudies for development projects. TDA funds must beused to hire U.S. firms to carry out feasibility studiesand other planning services. The host country choosesthe U.S. company, however. Because TDA-fundedfeasibility studies are conducted by U.S. firms, there isabetter possibility that the firms will steer their clientsto U.S. technologies for the subsequent developmentcontract, than if foreign firms conducted the study.
TDA does not fund a study for a project unless U.S.goods, services, and technology in the sector areconsidered internationally competitive. It relies onconsultations with technical advisers, other agenciesand private sector groups to make this judgment.TDA-funded studies focus on infrastructure develop-ment in such sectors as energy, wastewater treatment,transportation, and telecommunications. In fiscal year1992,33 percent of TDA’s funding went to energy andnatural resources projects; 12 percent went to waterand environmental projects.12
TDA’s approach can be advantageous to U.S. firmsin the energy/environmental sector. In 1987, Black andVeatch International of Kansas City won a contract fora study for a power plant in Bang Pakong, Thailand.The Electric Generating Authority of Thailand (EGAT)had received a grant of $350,000 from TDA for thestudy. This led to an additional $30 million revenue for
7 co=~~iod ~pprop~atiom for co~~ ati~ation were $1..4.8 million in 1991,$2 million ~ 1992, ~d $2.5 fion in 1993.8 This section is drawn from U.S. General Amounting Office, Ezport Promotion, Federal Efiorts to Increase Exports ofRenewableEnergy
Technologies, GGD-93-29 (Gaithersburg, MD: U.S. General Aeeounting Of&e, Dee. 1992).g mid.
10 U.S. Environmental Training Institute, “U.S. Environmental Training Institute: Catalogue of Courses, 1992”.11 Formerly the Trade Development PIugr-
IZ U.S. Trade Development Agency, 1992 Annual Report, Washington w, 1993.
88 I Development Assistance, Export Promotion, and
Black and Veatch in further engineering servicescontracts with EGAT, and because of pro-U.S. engi-neering specifications, a $64.6-million contract wasawarded to General Electric for two 300-MW com-bined cycle gas turbine power plants. This further ledto GE winning a similar contract in Rayong, Thailand.Black and Veatch was also selected as project manage-ment consultant for an integrated pulp and paper millproject funded at $200 million.13
The TDA funds reverse trade missions. This gener-mally means paying for foreign procurement officials totravel to the United States and visit U.S. companiesand plants, where they are exposed to U.S. technology.TDA also provides funds for foreign officials to cometo U.S. trade and technology shows, and providesgrants for training. These grants, which amounted to$2.7 milion in fiscal year 1992, can sweeten U.S. bidsfor development projects.
TDA’s fiscal year 1992 appropriation was only $35million, operating with a staff of under 40 people. For1993$40 million was appropriated. Considering itssmall size, the program is judged by many to yield highreturns in terms of exports per tax payer dollar. TDAestimates that for every dollar of TDA programexpenditure, over $25 are returned to the U.S. econ-omy in export income.14 However, some of thoseexports (it is not known what percent) are themselvesfinanced by other U.S. government agencies such asUSAID and Eximbank, so the ratio of outlays receivedto U.S. government program expenditures would belower. The General Accounting Office is currentlyconducting an assessment of the effectiveness ofTDA’s activities.
Environmental Technology
U.S. Environmental Training InstituteThis organization encourages U.S. firms to provide
training courses to qualified public and private sectorofficials from developing countries. Companies areresponsible for funding operating costs and sponsoringcourses. EPA, USAID, and TDA provided somestart-up funds for the Institute, which is a nonprofitorganization. EPA estimates that when in-kind contri-butions are counted, the Federal government supportexceeds $1 million.15
The company that provides the training has anopportunity to showcase its technology and promoteits adoption in developing nations. Companies arechosen on the basis of their technological track recordand training capacity. Their technologies must beproven. EPA and other Federal agencies advise theInstitute. If the course is approved, it is listed in abrochure and circulated through embassies and com-mercial offices. For 1993, 16 training courses areplanned, including such topics as environmental reme-diation of nuclear sites, industrial wastewater treat-ment, clean air technologies, air pollution controltechnologies. l6
EXPORT FINANCING FOR EGS EXPORTSExporting imposes heavy demands on cash flow.
Small and medium-sized EGS firms may not be ableto finance their own exports. Without a strong cashflow and collateral base, private banks will not financeexport transactions. Comparatively few U.S. banks orprivate sector institutions are involved in exportfinancing. The reasons for their lack of interest maybesimilar to those that prevent companies from export-
13 ~fl~~bbA~C~, Dir@~r, Tmde ad Development progr~ testimony ath~gs before tie HOW COllldt@ On Foreign Affairs,
Subcommittee on International Economic Policy and Trade on “Reauthorization of the Trade and Development Program,” Mar. 5, 1991,printed in Foreign Assistance Legislation for Fiscal Years 1992-1993 (Part 6), p. 82.
14 unpub~sh~ ~o-tion pro~id~ by ~~ Feb. 8, 1992, ~d TDA lg~ ~~ Report. The ~~ Report gives the es~te Of OVer
25:1 (p. 2). TDA program expenditures through f~al year 1990 were $160 million (Annual Repor6 p. B1.) T’DA reports $4.6 bfion in ~esby U.S. companies through f~cal year 1992 that were associated with TDA projects (Annual Repofi p. 2); TDA has informed OTA that $4.3billion of those sales were associated with TDA projects funded no later than f~al year 1990. If the sales associated with projects fundedtbrough 1990 ($4.3 billion) are divided by program expenditures through 1990 ($160 million), the ratio is about 27:1. It is likely that asadditional pre-1991 projects mature, additional U.S. sales associated witb such projects will occur, thus increasing the ratio of sales to programexpenditures for expenditures through 1990.
h fucal year 1992, TDA obligated a total of $42.9 rnilliom of which $39.4 rnilliow or 92 percent, was for program activities (inchx@g $8million in funds transferred fkom other agencies), and $3.5 milliou or 8 percent was for operating expenses.
15 U.S. ~v~o~en~ ~otwtion Agency, Glo~l ~ar~ts for Enviro~ntal Technologies: Defining a More Active Roie for EPA Within
a Broader Government Strategy, December 1992, p. D-5.16 photocopy sheet from US-ETI, ‘‘1993 USETI Schedule of Training Courses.”
Appendix B--U.S. Export Promotion Activities and Environmental Technologies I 89
ing: a large domestic market, geographic location, andrisk and complexity of financing foreign transactions.Also, many banks closed their international divisionsin the 1980s in response to the debt crisis in the ThirdWorld.17
While European SMES have considerable access toexport financing, public financing programs in thiscountry are limited.18 Federal export financing iscomparatively small and difficult to access, especiallyfor small companies. Efforts are being made, though,to make federal export financing more available toSMES.
I Export-Import Bank of the United StatesU.S. government assistance for nonagricultural
exports is provided primarily by the Export-ImportBank of the United States (Eximbank). In fiscal year1992 Eximbank assisted $14 billion in exports. l9 Aswill be discussed in more detail in the final report ofthis assessment, U.S. firms get less government helpwith export financing than firms in many majorcompetitor countries.20
Firms have complained that Eximbank is slow inprocessing applications and disbursing approved fi-nancing, that it is difficult to apply for Eximbank loans,and that financing coverage in some cases is inade-quate. 21 Eximbank has been trying to address theseconcerns, especially for small business.22 Eximbank
traditionally relied on commercial banks to reach smallbusiness. However, U.S. banks have been cutting backon international lending, thus lessening access to smallbusiness. In recent years perhaps about 13 percent ofEximbank’s assistance (by volume of exports assisted)has gone directly to small business.23
Eximbank has (among other things) set up ahigh-level administrative unit responsible for smallbusiness, streamlined approval of working capital loanguarantees of less than $2.5 million, and improved
financing coverage in some cases. Under its city/stateprogram, set up in 1987, state and city developmentand finance agencies can help firms to apply forEximbank assistance and can add their own financingto Eximbank’s. Eximbank plans to expand its fiveregional offices (which now handle only export creditinsurance) to full-service offices (which would alsohandle loan guarantees and direct loans).
In the past, Eximbank did not give special attentionto EGS exports. However, the Export EnhancementAct of 1992 specifically requires Eximbank to encour-age “the use of its programs to support the export ofgoods and services that have beneficial effects on theenvironment or mitigate potential adverse environ-mental effects. ” Eximbank is also to report annuallyon this effort.24 Pursuant to the statute, the Bank’sboard has appointed an officer to advise it on ways touse Eximbank programs to support EGS exports.25
17 Martha E. Mangelsdorf, “Unfair Trade, ” ZNC., vol. 13 (April 1991), p. 33.18 wil~ E. Notidurf~ Going Global: HOW Europe Helps Small Firms Export (Washington, DC: Brookings Institution, 1992) PP. 55-57.
19 Eximb@ Annual Report 1992, p. 2.
~ one indicator is difference invohnne of exports supported. One report for 1989 showed U.S. coverage at about 2 p=ent of toti exports,compared with 32 percent for Jap~ 4 pement for Germany, 21 percent for France, and 20 percent for tbe United Kingdom. First WashingtonAssociates, Ltd. (Arlington, VA), “ComprehensiveD irectory of the World’s Export Credit Agencies” (Octobex 1991). Another indicator mightbe numbers of offkes. Eximbank has five regional ofilces in the United States; by contras~ France has 22, and Cauada 8, domestic offices.Eximbank has no overseas ofilces. Japaq in contras~ has 16, including Washington DC, and New York City.
*1 bss to lkimbank pro~ams is also impeded, especially for small business, because, as already discussed, there is no “onestopshopping” for export services; fm must seek assistance individually from Exirnbank and other agencies involved in export promotion.
22 me ~o~on in this and the next paragraph is taken from U.S. Congress, General Accounting Offlce, Export Finance: T~ Role #~heU.S. Export-Import Bank, GOD-93-39 (Gaithersburg, MD: U.S. General Accounting ~lce, Dec. 23, 1992), pp. 22-29; and Export-ImportBank of the United States, Report to the U.S. Congress on Export Credit Competition and the Export-Import Bank of the United States for thePeriodJan. 1,1991 through Dec. 31,1991 (July 1992), pp. 27,32-35.
~ GAO reported figures of 12, 14, and 13 percent respectively, for 1989, 1990, and 1991, with the qua.liflcation tit some Of tie data Wasnot verifkxi. U.S. Congress, General Accounting Office, The U.S. Export-Import Bank: The Bank Provides Direct and Indirect Asm”stance toSmu22Businesses, GGD-92-105 (Gaithersburg, MD: U.S. General Accounting Office, Aug. 21, 1992), pp. 2-5, 10. GAO excluded financingprovided to small business subcontractors working through larger businesses that receive Eximbank financing. Eximbank’s figures, whichinclude indirect financing, are 16, 19, and 18 percent respectively, for the same years.
M The EXpo~ Enhancement Act of 1992, Public hW 102-429, SeC. 106.
~ Eximb@ AnnwlRepo~ 1992, p. 8.
90 I Development Assistance, Export Promotion, and Environmental Technology
PRIVATE SECTOR ATTEMPTS TOCOORDINATE SERVICESI The U.S.-ASEAN Council for Businessand Technology
The U.S.-ASEAN Council for Business and Tech-nology aims to promote trade and investment betweenthe United States and member states of the Associationof Southeast Asian Nations (ASEAN).26 The Council,which is a private nonprofit organization, works withFederal government agencies to help them strengthentheir support to U.S. business, and does receive somefunding from the Federal government to pursue someof its activities. It also provides trade information forand facilitates contacts between U.S. and ASEANfirms. The Council has identified environmental goodsand services as a major opportunity for U.S. businessin the region and as a result has targeted many of itsactivities toward this.
Among other activities, the Council has issued apublication on available export assistance27 and hasconducted environmental business development semin-ars to educate companies about U.S. governmentassistance programs. It has run several EGS trademissions to ASEAN countries, involving the participa-tion of several Federal agencies in the missions andfollow up.
B The Environmental Business CouncilThe Environmental Business Council seeks to
developers trade opportunities for its members. EBCwas started in 1990 as a regional organization, basedin New England where it has sought to expand tradeopportunities by combining the resources of local EGSfirms, academic and technological institutions, andgovernments (especially the State of Massachusetts).28
The Council plans to become a national organization,operating through chapters in regions where environ-mental businesses are clustered. To that end, anEnvironmental Business Council of the United Stateswas formed in February, 1993. In June of 1993,EBC-US hosted a meeting to discuss possible strate-gies and directions for such an organization.
In March of 1992, EBC signed an agreement withthe Confederation of Mexican Industrial Chambers(CONCAMIN), formalizing technology cooperationbetween Mexican industry and EBC. EBC hopes toduplicate this arrangement in other markets, such asEastern Europe. EBC has used the U.S. EnvironmentalTraining Institute (discussed previously) to help or-ganize Environmental Risk Assessment Training forMexican officials and plans to expand its cooperationwith DOC, DOE, EPA, and other agencies.
9 The Environment TechnologyExport Council
ETEC is a nonprofit business association of over 30corporations, six national laboratories, and four tradeassociations. Established in 1992, it aims to help theU.S. pollution prevention industry better exploit globalmarket opportunities. It plans to do this by developinginnovative export financing programs for developingcountry markets; ‘‘synthesizing’ both public andprivate sector market studies to help exporters learnabout business opportunities; partnering with gover-nment agencies to enhance research and travel supportfor U.S. firms; and initiating pilot projects in countriesto obtain and distribute environmental policies andregulations. A primary function of ETEC is to serve asa network for its members. In its nascent form, it is tooearly to assess what sort of impact ETEC will make.
STATE PROGRAMSStates are increasingly helping local businesses gain
access to federal export promotion programs and areproviding their own export promotion services to thesebusinesses. States are assuming greater responsibilityfor helping companies that are new to exporting. Withcooperation from SBA and the US&FCS, state andlocal governments have taken on a larger share ofresponsibility for export awareness and education. Thestates now provide a wide range of export promotionservices to businesses. In 1990, they had over 335
26 As~ ~~ber ~~es ~ B-i D-- ~do~i~ ~ys@ MPpims, Sillgiipore, id ‘fhihld.
27 Enviro_ntMon~: T~Inte~tio~lBu~~ss ~ec~.ve’s G~”& to Govem~ntResoWces. Tids publication provides hlf~.OE on
U.S., foreign and multinational programs of use to exporters.M Diswssion with Donald Comors, ~Board of Directors, Environmental Business Council, Jan. 5, 1993.
Appendix B–U.S. Export Promotion Activities and Environmental Technologies I 91
representatives in overseas offices-an average of 6.5representatives per state.29
A few states have special export promotion effortsfocused on environmental goods or closely relatedsectors. Several states have prepared directories oftheir environmental companies that can be madeavailable to overseas representatives, the US&FCS,and potential customers.30
The Minnesota Trade Office has its own environ-mental trade specialist who organizes trade events, andcounsels local environmental companies on exportmarketing, export opportunities, and export financing.A primary responsibility of this person is to coordinatewith the local US&FCS district office and otherFederal trade promotion programs. The MTO’S envi-ronmental trade specialist has visited most of the 200companies listed in its Environmental Trade Directory,which is targeted at foreign markets. The fact thatstates can have such close relationships with compa-nies, and often get to know their capabilities andinterests, means that they can both help them directlywith their own export promotion programs, andperhaps better connect them to Federal services.31
The State of California has separate programs topromote and finance exports of both energy andenvironmental technologies, as well as an exportfinancing office that is not sector specific. TheCalifornia Energy Technology Export Program, ad-ministered by the State’s Energy Commission, pro-motes exports of energy technologies, including re-newable energy technologies and energy efficiencytechnologies. By focusing on narrowly defined mar-kets, both technologically and geographically, theprogram seeks to help California’s energy firms fillniche demands.32 It conducts detailed studies ofmarkets, 33 organizes trade and reverse trade missionsand other customer-buyer forums, and offers technol-
ogy cooperation to developing middle income coun-tries.
The California Environmental Technology Partner-ship, which is administered by the State’s Environ-mental Protection Agency, was initiated in November1992. The program aims to promote environmentaltechnologies both nationally and internationally. Thepartnership will identify markets and provide exportassistance to environmental firms located in Califor-nia.
In addition to these sector specific programs, theCalifornia Export Finance Office helps companies34
finance exporting; it is not sector specific. The exportfinance office states that it has supported over $500million of trade since 1985 through its export financingoffice.35 It offers loan guarantees and short term loans.
As gateways to Federal export promotion, stateseither make bilateral arrangements with federal agen-cies, or they can access Federal resources through suchorganizations as the National Association of StateDevelopment Agencies. In a 1990 review of stateexport promotion programs, all states reported havinggood relationships with their US&FCS counterparts;over a quarter said they had developed specificFederal/state cooperative plans and memoranda ofunderstanding. 36 States said they were cooperatingwith district offices in the following areas:
■
■
9
■
■
—
recruiting for Federal and state-sponsored events,such as trade fairs and trade missions;cosponsoring trade shows, export seminars, confer-ences and meetings, and cohosting foreign buyermissions, etc.;calling on potential and active exporters;exchanging trade leads, opportunities, and marketinformation;cooperating on newsletters and publications;
~ The Natio@ Assoc~tion of State Development Agencies, Introduction and Analysis; State Export Program Database, 1990, (NASDA:Washington, DC, 1990), pp. 12-13.
30 E.g., Colorado, -~, Massachusetts, Minnesota, Oregon-
31 Discussion with Karin Nelson, Oct. 13, 1992, Minnesota Trade Office.32 perSOMI Communication% Tim C)lseq Program Manager, Energy lkchnology Export I%ogram, September 31, 1992.33 Em either ties a con~actor or send its o- s~ to res~h a ~ket ~d uncover project opportunities, ~d then diSSeIIlhMtes thiS
information to relevant companies.M Not 5pec&My EGS compdeS.35 c~ifofi World Tmde codsiow Newsletter, Winter ‘92-’ 93, p.1.36 Natio~ Association of Stite ~velopment Agencies, Introduction and A~lysi5; State EWOH Program Data&se, ]990 (NASDA:
Washington, DC, 1990), pp. 12-13. NASDA is currently updating this material.
92 I Development Assistance, Export Promotion, and Environmental Technology
developing new programs;legislation and trade policy analysis;collocating trade specialists and sharing mailinglists. 37
States also cooperate with Eximbank to bringFederal export financing to local businesses. In 1987,Eximbank developed the City/State Program, in whichparticipating states assist Eximbank in marketing itsprograms and carry out pre-application processing toexpedite turnaround times.38 As of May 1992, thisprogram had been extended to 22 states.39
1 National Association of StateDevelopment Agencies
States also cooperate with USAID through theNational Association of State Development Agencies.In September 1992, as mentioned previously, NASDAjointly established the Environmental/Energy Tech-nology Fund with US-AEP. As of March 1, 1993, thefund had approved 18 projects. For example:
THE MONTANA MAPPING TECHNOLOGIESPROJECT IN SOUTH AND SOUTHEAST ASIA
The NASDA/US-AEP fund is providing $20,000out of a total cost of $51,200 for three workshops tointroduce integrated digital mapping technologies toAsian countries. Montana company GeoResearch isthe organizer of the workshops and has alreadyconducted two of the workshops in Malaysia and
Nepal, of which the former resulted in the immediatesale of two receivers, software, and other equipment.
STATE OF UTAH/TERRATEK, INC. PROJECT INMALAYSIA AND PHILIPPINES
The fund is providing $20,150 to Utah for twoworkshops in the above countries to promote the saleof Terratek’s test kits for environmental contaminantsin food crops.
Other projects involve grants to promote mid-American waste management and recycling technolo-gies in the Philippines; Alaskan and U.S. energytechnology to Mongolia; and U.S. textile technologiesto Indonesia and Thailand.
In 1988 NASDA also established a Business Devel-opment Seed Fund with USAID ‘‘to encourage statedevelopment agencies. . .to undertake innovative pro-jects that promote business activity with firms indeveloping countries and Eastern Europe.40 The seedfund operates along the same lines as the US-AEPfund, except that cooperation is directly with USAID,and it is neither Asia, nor EGS specific. ThroughNASDA, USAID provides grants of up to $20,000 ona matching basis to state and sub-states for businessdevelopment projects.
NASDA is also currently working with USAID andthe Trade and Development Agency to disseminate toU.S. companies information about procurement opportuni-.
ties through NASDA and the states.
37 p~ap~~fiomthe NAoMI As~iation of State Development Agencies, Zntroducfi”on andAnalysis; State Export Program Database,1990 (NASDA: Washington DC, 1990), pp. 12-13.
38 Ibid., p. 37.
39 lklephone @u@ to Eximbank marketing divisiom Feb. 2, 1993.4 NASD& “NASD~SAID Business Development Seed Fund, ” Information Sheet.

Appendix C:
ASEAN — Association of Southeast AsianNations (members are: Brunei,Indonesia, Malaysia, Philippines,Singapore, and Thailand)
—Aid and Trade Provision (UnitedKingdom)
BMZ — Ministry of Economic Cooperation(Germany)
CCCE — Central Bank for EconomicCooperation (France)
CONCAMIN— Confederation of Mexican Industrial
CORECT
DAC
DoCDoEDREE
DTI
EBCECECRE
EGAT
EGS
Chambers— Committee on Renewable Energy
Commerce and Trade
— Development Assistance Committee(OECD)
— Department of Commerce— Department of Energy— Directorate for External Economic
Relations (France)— Department of Trade and Industry
(United Kingdom)
—Environmental Business Council— European Community—Export Council for Renewable
Energy—Electric Generating Authority of
Thailand— environmental goods and services
EPAESFETEC
Eximbank
GAOGDPGEFGNPGTZ
ICETT
ITA
JETROJICA
LDCSLLDCS
MDB
MoFMoFAMTO
93
List ofAcronyms
— Environmental Protection Agency—Economic Support Fund—Environment Technology Export
council— Export-Import Bank of the United
States
—U.S. General Accounting Office— gross domestic product—Global Environmental Facility— gross national product— Agency for Technical Cooperation
(Germany)
— International Center forEnvironmental Technology Transfer(Japan)
— Intemational Trade Administration ( p a r tof DoC)
— Japan External Trade Organization— Japanese International Cooperation
Agency— German Redevelopment Bank
— less developed countries— least developed countries
— multilateral development bank— Ministry of International Trade and
Industry (Japan)—Ministry of Finance (Japan)—Ministry of Foreign Affairs (Japan)— Minnesota Trade Office
94 I Development Assistance, Export Promotion, and Environmental Technology
NASDA
NEDO
NGOSNOAA
ODAOECD
OECF
OPIC
SBASDR
SMES
TDATPCC
— National Association of StateDevelopment Agencies
— New Energy and IndustrialDevelopment Organization (Japan)
— non-governmental organizations— National Oceanic and Atmospheric
Agency
— Official Development Assistance— Organisation for Economic Co-
operation and Development— Overseas Economic Cooperation Fund
(Japan)— Overseas Private Investment
Corporation
— Research Institute of InnovativeTechnologies for the Earth (Japan)
— Small Business Administration— Special Drawing Right (an
international currency unit used bythe World Bank and the InternationalMonetary Fund)
— small- and medium-sized enterprises
— Trade and Development Agency— Trade Promotion Coordinating
Committee
U.K. ODA
UNCED
UNDP
UNEP
UNDO
USAEP
USAID
US-ETI
US&FCS
USTR
VISITT
— Overseas DevelopmentAdministration, U.K.
— United Nations Conference onEnvironment and Development
— United Nations DevelopmentProgramme
— United Nations EnvironmentProgramme
— United Nations IndustrialDevelopment Organisation
—United States - Asia EnvironmentalPartnership
—U.S. Agency for InternationalDevelopment
— United States EnvironmentalTraining Institute
— U.S. and Foreign Commercial Service(part of ITA)
— United States Trade Representative
— Vendor Information System forInnovative Treatment Technologies(an EPA database)
Index
African Development Bank, 29Agenda 21,2,21,24,25,83Aid, Trade and Competitiveness Act of 1992,2Air pollution, 74-75. See also Pollution preventionAllied-Signal, 77Appropriate technology, 18
evaluation, 11-12Argentina, water supply and wastewater treatment, 73ASEA Brown Boveri, 74,75Asian Development Bank, 29
Black and Veatch International, 87-88Brazil, 72
air pollution control equipment, 75environmental market, 17water supply and wastewater treatment, 73
Build-operate-transfer approach, 17Business involvement in aid, 57Business opportunities, 17
California Energy Technology Export Program, 91California Environmental Partnership, 91California Export Finance Office, 91Capacity 21. See United Nations Development
ProgammeCapacity building, 22Capital projects, 11,37
United Kingdom, 68United States, 56
Caribbean Environment and Development Institute, 85Carl Duisberg Gesellschast, 23Chile, 72
environmental market, 17
China, 72cleaner production project, 20environmental protection investments, 6water supply and wastewater treatment, 73
Classification of environmental assistance programs,26
United Kingdom, 67Commission on Sustainable Development (United
Nations), 24Committee on Renewable Energy Commerce and
Trade, 86-87Competition, 6-9CORECT See Committee on Renewable Energy
Commerce and TradeComing, 77
DAC. See Development Assistance CommitteeDebt relief, 36,37,38Department of Agriculture, 56,81Department of Commerce, 2,57,81,84Department of Energy, 2,58,81,85Department of State, 2,81
executive branch report to Congress, 36,44,4546Department of the Treasury, 81Development Assistance Committee, 25-26
environmental protection issues, 20-23ODA performance of member countries, 21tied aid, 49-50
Distribution of aid, 19,37-38Japan, 60United States, 58-59
95
96 I Development Assistance, Export Promotion, and Environmental Technology
EBC. See Environmental Business CouncilElectrification, 74-76Energy efficiency, 76Engineering management, 44Environment Technology Export Council, 90Environmental aid. See also Multilateral aid; Tied aid
capacity building, 22composition, 36-37distribution, 19,37-38,58-60estimates, 23-29France, 64-65Germany, 66-67Japan, 61-64United Kingdom, 67-69United States, 58-59
Environmental and Energy Efficient TechnologyTransfer Clearinghouse, 85
Environmental Business Council, 90Environmental goals, effect of export promotion, 11Environmental infrastructure, 22Environmental markets, 5-6, 16-18,71-80
trends, 72Environmental monitoring, 79-80Environmental problems, 13-16Environmental programs, 14-16Environmental Protection Agency, 2,81,85Environmental protection costs, 14-16
measurement, 25-26pollution prevention, 14-16
Environmental studies, 11European Community program for Eastern Europe, 65Evaluation
of projects, 11-12of technologies, 12
Eximbank, 2,56,81,84,89tied aid credits, 50
Export Enhancement Act of 1992,2,9,83,86,89Export financing, 88-89Export-Import Bank of the United States. See
EximbankExport promotion
aid practices, 4, 8Japan, 35-36legislation, 1-3reflow, 31-33tied aid 32-33United States, 81-92us policy, 10-11
Feasibility studies, 43,87-88Japan, 43
Financing infrastructure projects, 17-18Foreign Operations and Export Financing Appropria-
tions Act for Fiscal Year 1993,3France, 64-65
environmental aid, 64-65environmental aid spending, 27Helsinki Package, 65
General Accounting Office, 87,88General Electric, 75,88Germany, 65-67
environmental aid, 66-67environmental aid spending, 27sustainable development, 66-67technology cooperation and technical assistance, 23training, 66
Global Environment Facility, 24,55Green Aid Plan, 62-64
Helsinki Package, 47-54France, 65
Hong Kong, 72
India, 6,72Indonesia, 72
water supply and wastewater treatment, 73Industrial waste, 78-79Inter-American Development Bank, 29Interagency Working Group on Environmental
Technology, 83International Finance Corporation, 16
Japan, 7-9,59-61adverse environmental impact of projects, 60current policy, 61-62distribution of aid, 37-38,60environmental aid spending, 27export promotion, 35-36feasibility studies, 43Green Aid Plan, 6244Japan International Cooperation Agency, 42loans, 60Ministry of International Trade and Industry, 7-9,
44,62-64Overseas Economic Cooperation Fund, 42requested aid, 44-45
Index I 97
technology cooperation and technical assistance, 23tied aid, 41-43
Japan International Cooperation Agency. See JapanJICA. See Japan International Cooperation Agency
Laws and regulations, 2-4LDCS. See Least developed countriesLeast developed countries, 51-52Loans, 39-40,41,46-47
Japan, 60Long-term commercial relationships, 34
Malaysia, 72environmental market, 17
Mexico, 72air pollution control equipment, 75cooperation with EBC, 90environmental market, 17water supply and wastewater treatment, 73
Minnesota Trade Office, 91MITI. See Japan, Ministry of International Trade and
IndustryMontana Mapping Technologies, 92Multilateral aid, 33-34,39
multilateral development banks, 28-29for technology, 24
Multilateral development banks, 28-29
National Association of State Development Agencies,86,91,92
National Energy Policy Act of 1992,3,9The Netherlands
pollution prevention, 19technology cooperation and technical assistance,
23-24New Earth 21,64
ODA. See Official Development AssistanceOECD. See Organisation for Economic Cooperation
and DevelopmentOECF. See Overseas Economic Cooperation FundOffice of the U.S. Trade Representative, 81Official Development Assistance, 18-21
bilateral environmental aid, 27DAC country contributions, 21environmental protection issues, 20recipients, 22
Operation and maintenance provisions, 12
Organisation for Economic Cooperation andDevelopment, 71
Helsinki Package, 47-49Overseas Economic Cooperation Fund. See Japan, 42Overseas Private Investment Corporation, 2,81,84
PHARE/EEC, 65Pollution prevention, 18,22-23. See also Air pollution;
Water pollutionsources of assistance, 19-20
Program assistance, 36-37Project review guidelines, 11-12Project screening, 11-12
Regional Environment Center for Central and EasternEurope, 85
Renewable energy, 75-76Requested aid, 44-45Resource Conservation and Recovery Act, 79Reverse trade missions, 88
Sanitation services, 14,77-78Scandinavian countries, pollution prevention, 19Siemens, 75Singapore, 72Small Business Administration, 81Solid waste collection and disposal. See Sanitation
servicesSouth Korea, 72
water supply and wastewater treatment, 73State Department. See Department of StateState of Utah/Terratek Project in Malaysia and
Philippines, 92State programs, 90-92Superfund, 79Sustainable development, 24
Germany, 66-67United Kingdom, 67-68
Taiwan, 72water supply and wastewater treatment, 73
TDA. See Trade and Development AgencyTechnology cooperation, 34
United Kingdom Technology Partnership Initiative,68
Thailand, 72,87-88energy efficiency improvements, 76environmental market, 17
98 I Development Assistance, Export Promotion, and Environmental Technology
Tied aid, 7,8,32-33,38-43engineering management, 44exports promotion, 8grants and bans, 3940,41Japan, 41-43State Department study, 4546
Tied aid credits, 33,46-47Helsinki Package, 47-54
TPCC. See Trade Promotion Coordinating CommitteeTrade and Development Agency, 2,8,43,56,57,81,
84,87-88Trade Information Center, 82Trade Promotion Coordinating Committee, 2,81-83
Environmental Trade Working Group, 83Training, 12
Germany, 66United Kingdom, 68U.S. Environmental Training Institute, 88
Transport, 76-77
UNCED. See United Nations Conference on Envi-ronment and Development
UNDP. See United Nations Development ProgrammeUNEP. See United Nations Environment ProgrammeUnited Kingdom
capital projects, 68environmental aid, 67-69Natural Resources Institute, 68Overseas Development Administration, 6 7 - 6 8sustainable development, 67-68technology cooperation and technical assistance, 24training, 68
United Kingdom Technology Partnership Initiative,68-69
United Nations Conference on Environment andDevelopment, 2,4-5,23-25,61,83
United Nations Development Programme, 20,24United Nations Environment Programme, 20,24United Nations Industrial Development Organisation,
20
United States, 55-59capital projects, 56current policy, 9-12distribution of aid, 58-59environmental aid, 58-59environmental aid spending, 27pollution prevention, 19-20
United States-Asia Environmental Partnership, 3,57-58,86,89
United States Environmental Training Institute, 3,88U.S. Agency for International Development, 2,4, 10,
56-59,81,84-85U. S.-ASEAN Council for Business and Technology,
90USAEP. See United States-Asia Environmental
PartnershipUSAID. See U.S. Agency for International
DevelopmentUtah, 92
War Chest, 50,53,56Waste Management International, 77Water pollution, 13-14. See also Pollution preventionWater supply and wastewater treatment, 73-74World Bank, 13, 14,28,29W.R. Grace, 77