development charges background study update
TRANSCRIPT

General Committee September 18, 2017
DEVELOPMENT CHARGESBACKGROUND STUDY UPDATE

To Update Council on the:• Key issues raised and decisions made as a part of the preparation of the
Development Charges Background Study, Bylaws and Policies• Background information (e.g. Growth Forecast) that will be used to prepare
the Study and have it available to the public by early October in order to obtain Council approval in December 2017
Key Timelines• Finalize Study – By October 6, 2017• Public Meeting – November 14, 2017 • Council Approval – December 12, 2017
Purpose
2

3
1. Stakeholder Consultation2. Updated Growth Forecast3. Proposed Development Charges
a) City Wide Hard DCsb) City Wide Soft DCsc) Combined Ratesd) DCs to Home Prices Comparison
4. Non-Growth Costs5. Area Specific Development Charges6. Debt7. Operating/Lifecycle Impact8. Council-Approved Policies9. New Policy Items10. New Policy Decisions11. Timelines
Agenda

• Stakeholder Group was formed through an invitation extended at the Developers Round Table on March 9th
– Four meetings have been held to-date
– The industry's main concerns to-date have been related to the allocation of costs to
• non-growth shares; and
• post-2031
– No other issues have been raised to-date
1. Stakeholder Consultation
4

2. Updated Growth Forecast
5
• The growth forecast for the period 2017-2031 projects the following:
• Forecast in 2013 DC Study: – 10-year Census Population Growth = 54,204; Population in New Dwelling Units = 67,212. Census population at 2031 = 403,953.– 10-year Employment Growth = 57,283; Building Space = 2,553,322 m2. Employment at 2031 = 240,413.
2017-2026 2017-2031[A]At
2016
[B]Growth
2017-2026
C = [A]+[B]At
2026
[D]Growth
2017-2031
E = [A]+[D]At
2031
Residential
Occupied Dwelling Units 102,680 26,470 129,150 42,170 144,850
Census Population
Population in New Dwellings
328,970 73,160
75,360
402,130 115,630
120,440
444,600
Non-Residential
Employment
Non-Residential Building Space (sq.m)
149,780 41,470
1,997,210
191,250 66,020
3,180,205
215,800

2. Updated Growth Forecast – cont’d
6
• The growth forecast for the period 2017-2031 projects the following:– 3,180,205 m2 (34,231,440 sq. ft.) of non-residential floor space
• Retail 22% (7.6M sq. ft.)• Institutional 23% (7.8M sq. ft.)• Industrial 37% (12.7M sq. ft.)• Office 18% (6.1M sq. ft.)
– 42,170 new residential units• Singles/Semis 33% (14,070)• Multiple Unit 26% (10,920)• Apartments 41% (17,180)
2. Updated Growth Forecast – cont’d
7
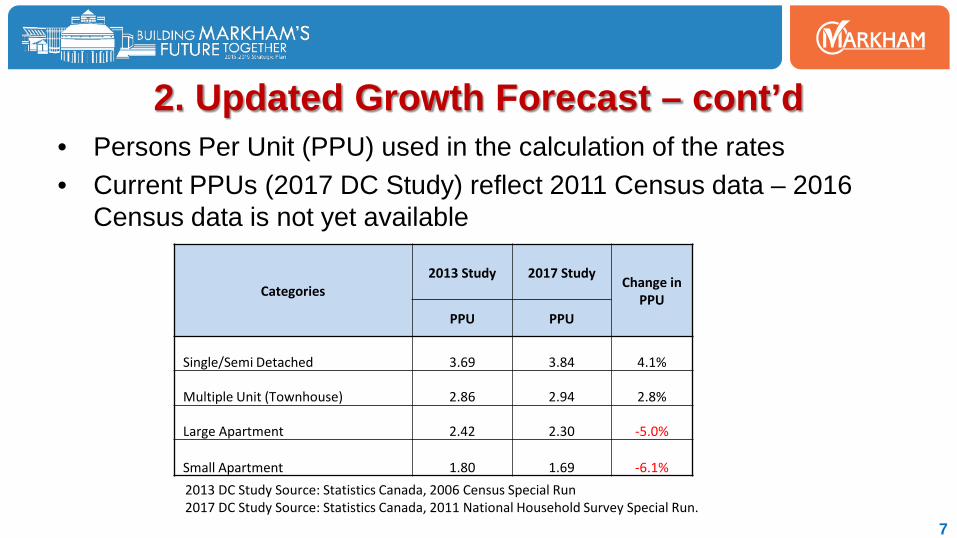
• Persons Per Unit (PPU) used in the calculation of the rates• Current PPUs (2017 DC Study) reflect 2011 Census data – 2016
Census data is not yet available
Categories2013 Study 2017 Study
Change in PPU
PPU PPU
Single/Semi Detached 3.69 3.84 4.1%
Multiple Unit (Townhouse) 2.86 2.94 2.8%
Large Apartment 2.42 2.30 -5.0%
Small Apartment 1.80 1.69 -6.1%2013 DC Study Source: Statistics Canada, 2006 Census Special Run 2017 DC Study Source: Statistics Canada, 2011 National Household Survey Special Run.

3. Proposed Development Charges
8
• Draft development charge rates have been calculated for:– City Wide Hard – CWH (2017-2031)
• Charge per capita – Growth-related Infrastructure Cost/Projected Population and Employment Growth
– City Wide Soft – CWS (2017-2026)• Charge is based on the City’s established 10-year historical
average service level
– Area Specific – ASDC (2017-2031)• Charge per hectare – Growth-related Infrastructure Cost/Net
Developable Hectare

3(a). Proposed Development Charges - CWH [Capital Program]
9
2013 City-Wide
Development Charge
Recoverable
Proposed City-Wide
Development Charge
Recoverable
Difference in RecoverableService
$ (millions) $ (millions) % ChangePROPERTIES ACQUISITION $72 $207 $135 188%ROADS $128 $216 $88 69%STRUCTURES $264 $328 $64 24%WATERMAIN $8 $29 $21 263%INTERSECTION $18 $31 $13 72%SIDEWALKS $18 $29 $11 61%ILLUMINATION $17 $25 $8 47%STORM WATER MANAGEMENT $15 $23 $8 53%STUDIES $10 $11 $1 10%SPECIAL PROJECTS $37 $36 -$1 -3%CREDIT AGREEMENT PROJECTS $6 $4 -$2 -33%TOTAL DCs RECOVERABLE $593 $939 $346 58%
TOTAL GROSS COST $970 $1,403

3(a). Proposed Development Charges – CWH
10
• City Wide Hard Residential Rates
Preliminary City-Wide Hard
Current Residential
Charge
Proposed Residential
Charge
Increase/ (Decrease)
Increase/ (Decrease)
$/Unit $/Unit $ %
Single/Semi Detached $10,981 $18,668 $7,687 70%
Multiple Unit Rate $8,519 $14,276 $5,757 68%
Large Apartment $7,208 $11,180 $3,972 55%
Small Apartment $5,360 $8,219 $2,859 53%
Weighted-Average Rate Increase 63%
3(a). Proposed Development Charges – CWH
11
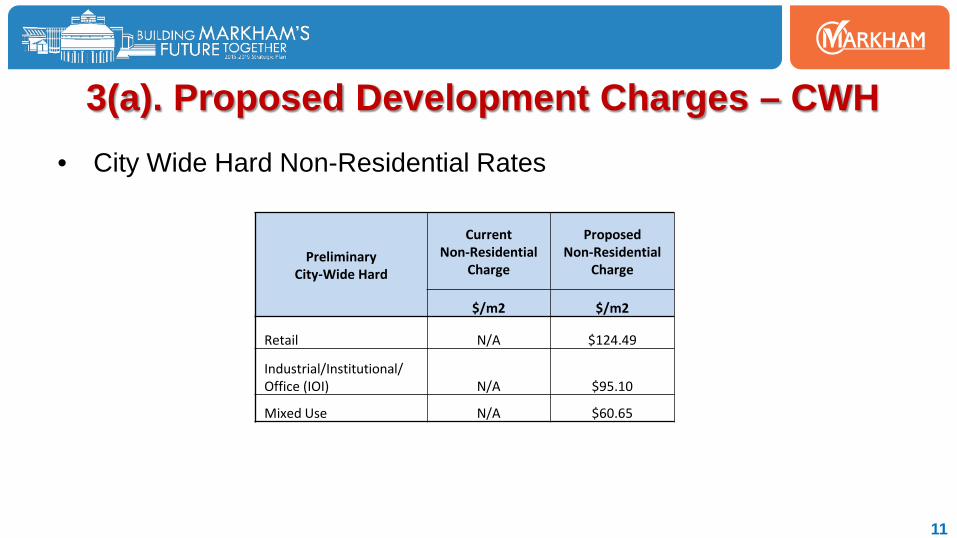
• City Wide Hard Non-Residential Rates
Preliminary City-Wide Hard
Current Non-Residential
Charge
Proposed Non-Residential
Charge
$/m2 $/m2
Retail N/A $124.49
Industrial/Institutional/Office (IOI) N/A $95.10
Mixed Use N/A $60.65

3(b). Proposed Development Charges – CWS
12
Summary of capital programs
Service Total Capital Program
Ineligible Costs (10%,
replacement etc.)
Prior Growth/Available Reserves
DC EligibleCost
(2017-2026)
Subsequent DC Studies
(Post-2026)
General Government $28,455,500 $1,770,100 $0 $17,700,700 $8,984,760
Library $43,910,000 $4,224,200 $8,697,500 $30,718,000 $270,300
Fire Services $28,487,100 $0 $0 $24,383,600 $4,103,500
Indoor Recreation $156,812,300 $8,728,300 $38,802,200 $109,130,200 $151,600
Park Development $149,930,400 $14,993,000 $36,600,500 $97,320,100 $1,016,800
Public Works $40,385,600 $0 $13,948,100 $18,000,100 $8,437,400
Parking $1,348,300 $134,800 $81,000 $1,043,000 $89,400
Waste Management $6,967,100 $696,700 $0 $4,049,500 $2,221,000

3(b). Proposed Development Charges – CWS
13
Components – Rate for a Single Detached Unit (SDU)
Current Proposed
Difference in Charge Service Residential Residential Charge / SDU Charge / SDU
Park Development & Facilities $3,697 $4,948 $1,251 34%Indoor Recreation $5,364 $6,023 $659 12%Library $1,113 $1,594 $481 43%Fire Services $584 $838 $254 43%Waste Management $0 $210 $210 N/AGeneral Government $511 $667 $156 30%Public Works $507 $660 $153 30%Parking $12 $35 $23 192%Total City-Wide Soft $11,789 $14,975 $3,186 27%

3(b). Proposed Development Charges – CWS [Capital Program]
14
Library Service
* Remaining funding as at December 31, 2016
Service Projected Collections 2017-2026 Reserve Balance Available Funds
Library Service $30,717,963 ($1,667,716) $29,050,247
Notable Projects Year DC Eligible Cost
Aaniin Community Centre and Library (20,000 sf) * 2017 $4,566,558
Markham Centre Branch (20,000 sf) 2021 $13,962,160
Future Branch (15,000 sf) 2025 $10,791,874
Total $29,320,592

15
Indoor Recreation
*Remaining funding as at December 31, 2016
Service Projected Collections 2017-2026 Reserve Balance Available Funds
Indoor Recreation $109,130,227 ($69,529,591) $39,600,636
Notable Projects Year DC Eligible Cost
Aaniin Community Centre and Library (101,000 sf) * 2017 $14,587,008
Future Community Centre Expansion (10,000 sf) 2023 $4,705,077
Future FUA Facility (25,000 sf) 2026 $20,460,150
Total $39,752,235
3(b). Proposed Development Charges – CWS [Capital Program]

3(b). Proposed Development Charges – CWS [Capital Program]
16
Fire Service
Service Projected Collections 2017-2026 Reserve Balance Available Funds
Fire Service $24,383,585 ($440,774) $23,942,811
Notable Projects Year DC Eligible Cost
Markham Centre Station (10,000 sf) 2019 $8,328,165
Langstaff Station (10,000 sf) 2021 $8,328,165
FUA Station (10,000 sf) 2023 $8,328,165
Fire Equipment – 2nd Crew Cornell 2017 $136,823
Vehicles 2017-2023 $2,925,000
Total $28,046,318

3(b). Proposed Development Charges – CWS [Capital Program]
17
Public Works
Service Projected Collections 2017-2026
Reserve Balance Available Funds
Public Works $18,000,064 $13,948,097 $31,948,161
Notable Projects Year DC Eligible Cost
Works Yard - Expansion /New 2019 $32,208,277
Yard Expansion 2019 $1,610,000
Yard Expansion 2023 $2,896,800
Fleet 2017-2026 $3,670,500
Total $40,385,577

3(b). Proposed Development Charges – CWS [Capital Program]
18
Park Development & Facilities
Service Projected Collections 2017-2026 Reserve Balance Available Funds
Park Development & Facilities $97,320,079 $36,600,462 $133,920,541
Notable Projects Year DC Eligible Cost
Annual Park Programs 2017-2026 $134,937,343
Total $134,937,343

19
• City Wide Soft Residential Rates
Preliminary City-Wide Soft
Current Residential
Charge
Proposed Residential
Charge
Increase/ (Decrease)
Increase/ (Decrease)
$/Unit $/Unit $ %
Single/Semi Detached $11,789 $14,975 $3,186 27%
Multiple Unit Rate $9,147 $11,453 $2,306 25%
Large Apartment $7,738 $8,969 $1,231 16%
Small Apartment $5,756 $6,594 $838 15%
Weighted-Average Rate Increase 22%
3(b). Proposed Development Charges – CWS

20
• City Wide Soft Non-Residential Rates
Preliminary City-Wide Soft
Current Non-Residential
Charge
Proposed Non-Residential
Charge
Increase/ (Decrease)
Increase/ (Decrease)
$/m2 $/m2 $ %
Retail $10.68 $14.69 $4.01 38%
Industrial/Institutional/Office (IOI) $9.87 $11.20 $1.33 13%
Mixed Use $6.95 $7.16 $0.21 3%
Weighted-Average Rate Increase 18%
3(b). Proposed Development Charges – CWS
21
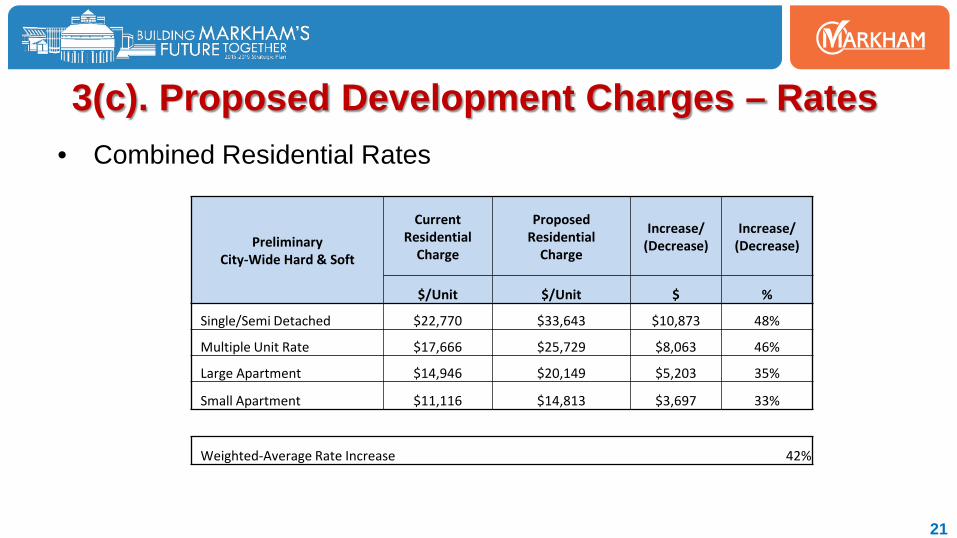
• Combined Residential Rates
Preliminary City-Wide Hard & Soft
Current Residential
Charge
Proposed Residential
Charge
Increase/ (Decrease)
Increase/ (Decrease)
$/Unit $/Unit $ %
Single/Semi Detached $22,770 $33,643 $10,873 48%
Multiple Unit Rate $17,666 $25,729 $8,063 46%
Large Apartment $14,946 $20,149 $5,203 35%
Small Apartment $11,116 $14,813 $3,697 33%
Weighted-Average Rate Increase 42%
3(c). Proposed Development Charges – Rates

3(d). Development Charges to Home Prices Comparison
22
$17,797 $18,119 $20,990 $21,306 $21,690 33,643
7.27% 7.49% 7.29%6.52%
5.27%
6.86%
0.00%
1.00%
2.00%
3.00%
4.00%
5.00%
6.00%
7.00%
8.00%
-
10,000
20,000
30,000
40,000
50,000
60,000
70,000
80,000
90,000
100,000
2012 2013 2014 2015 2016 2017
Deve
lopm
ent C
harg
es ($
per
Uni
t)
Development Charges as a Percentage of Average Single Detached Home Prices
City Region School Boards % of Home Price
2017 Includes:• School Board Increase• Regional Increase• Proposed City Increase
• Utilized average price for 2016
Source: Homes price data from Municipal Property Assessment Corporation (MPAC)
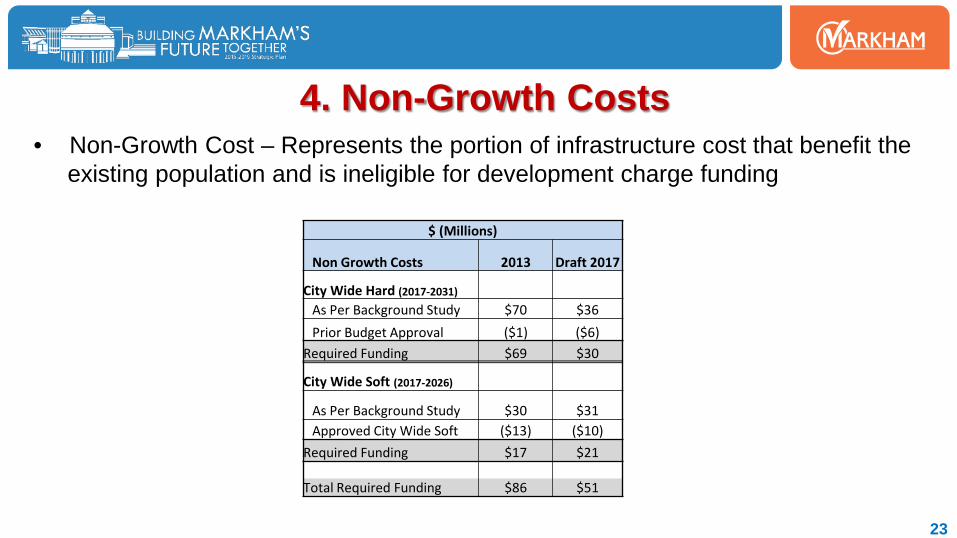
• Non-Growth Cost – Represents the portion of infrastructure cost that benefit the existing population and is ineligible for development charge funding
4. Non-Growth Costs
23
$ (Millions)
Non Growth Costs 2013 Draft 2017
City Wide Hard (2017-2031)
As Per Background Study $70 $36Prior Budget Approval ($1) ($6)
Required Funding $69 $30
City Wide Soft (2017-2026)
As Per Background Study $30 $31Approved City Wide Soft ($13) ($10)
Required Funding $17 $21
Total Required Funding $86 $51

• Total annual non-growth cost to be funded over the next 10 years is $3.9M per annum ($2.1M for soft services and $1.8M for hard services)
• Based on the approved Gas Tax framework, $4M is available annually to fund non-growth costs– This is sufficient to cover the annual non-growth requirements
4. Non-Growth Costs
24

5. Area Specific Development Charges (ASDC)
25
• Staff have met with landowners over the past months to discuss and determine the infrastructure requirements for their specific areas– Infrastructure for most areas have been established, however staff
are reviewing new queries received from developers– ASDCs will be finalized prior to the publication of the Background
Study (released by October 6th)
• The City currently has 20 ASDC bylaws and it is proposed to pass bylaws for 19 in the new background study (a reduction of 1)– The proposal is to close three current ASDCs and open two new
ASDCs for the FUA

5. Area Specific DCs – Proposed Rates
26
Area
Proposed Net Developable
Hectares
Current ASDC Charge per
Hectare
Proposed ASDC Charge per
Hectare Difference in ChargeYonge Steeles Corridor 9.07 $1,231,513 $1,256,227 $24,714 2%Armadale 27.89 $10,723 $11,579 $856 8%Armadale NE 28.45 $12,685 $15,727 $3,042 24%PD 1-7 4.48 $742,898 $1,270,583 $527,685 71%Rodick/Miller Road Planning District 29.28 $239,773 $600,374 $360,601 150%Buttonville Airport 53.00 $654,325 $153,303 ($501,022) -77%Mount Joy 19.42 $51,906 $131,152 $79,246 153%Markham Centre - South Unionville - Helen Ave 2.16 $1,809,555 $162,264 ($1,647,291) -91%Markham Centre 107.61 $7,365 $7,825 $460 6%Markham Centre - Clegg 5.22 $100,952 $162,726 $61,774 61%Markham Centre - Hotel 0.50 $962,844 $889,370 ($73,474) -8%Markham Centre - South Hwy 7 6.20 $1,364,613 $1,289,611 ($75,002) -5%Markham Centre - Sciberras 4.80 $1,545,856 $1,468,636 ($77,220) -5%Markham Centre - East Precinct 11.22 $3,351,013 $2,328,441 ($1,022,572) -31%Cathedral 62.03 $25,869 $10,138 ($15,731) -61%York Downs 17.95 $26,798 $24,348 ($2,450) -9%404 North 58.45 $46,315 $61,987 $15,672 34%Future Urban Area 585.81 $0 $14,029 $14,029 0%Future Urban Area #2 TBD $0 TBD - -
6. Debt
27
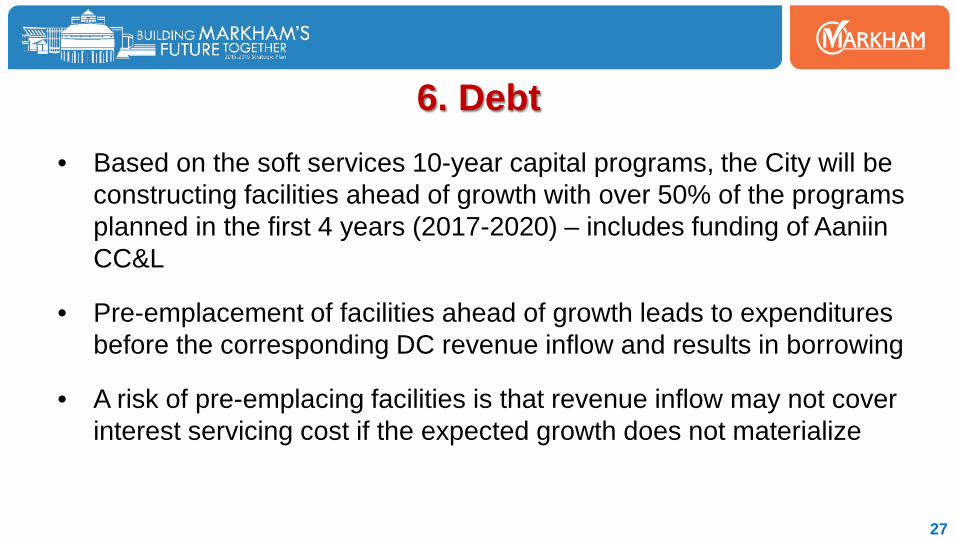
• Based on the soft services 10-year capital programs, the City will be constructing facilities ahead of growth with over 50% of the programs planned in the first 4 years (2017-2020) – includes funding of AaniinCC&L
• Pre-emplacement of facilities ahead of growth leads to expenditures before the corresponding DC revenue inflow and results in borrowing
• A risk of pre-emplacing facilities is that revenue inflow may not cover interest servicing cost if the expected growth does not materialize

6. Debt
28
$-160
$-140
$-120
$-100
$-80
$-60
$-40
$-20
$-
$20
2017 2018 2019 2020 2021 2022 2023 2024 2025 2026 2027 2028 2029 2030 2031
Mill
ions
Development Charge Reserve Balances Hard & Soft Services

6. DebtIssues to Consider
29
• DC Revenues– DC rates are increasing partly due to recovery of interest on the
debt financing
• Housing & Employment Forecast– Not achieving the population and employment forecast will limit the
City’s ability to fund the capital programs through DC’s– However, less growth should result in less infrastructure needs
• Operating Costs– The City will incur operating costs in advance of assessment growth

• Projected new asset value per capita for the period 2016-2031 is less than the existing asset value per capita throughout the City, indicating at a high level, that the City is not adding assets beyond its capability to operate
• The City has a practice of setting aside sufficient funds as a part of its annual budgeting process to offset the operating costs of new facilities (e.g. currently ramping up for Aaniin CC&L)
• The City has a lifecycle reserve study in place to ensure there are sufficient funds in the reserve for the rehabilitation and replacement of infrastructure for the next 25 years, based on known inflows and outflows
7. Operating/Lifecycle Impact
30
8. Council-Approved Policies
31
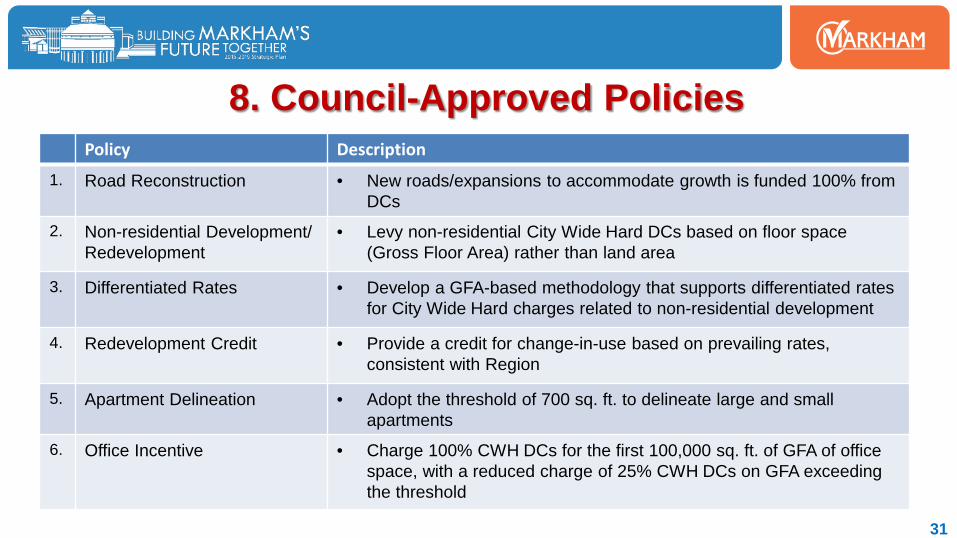
Policy Description
1. Road Reconstruction • New roads/expansions to accommodate growth is funded 100% from DCs
2. Non-residential Development/ Redevelopment
• Levy non-residential City Wide Hard DCs based on floor space (Gross Floor Area) rather than land area
3. Differentiated Rates • Develop a GFA-based methodology that supports differentiated rates for City Wide Hard charges related to non-residential development
4. Redevelopment Credit • Provide a credit for change-in-use based on prevailing rates, consistent with Region
5. Apartment Delineation • Adopt the threshold of 700 sq. ft. to delineate large and small apartments
6. Office Incentive • Charge 100% CWH DCs for the first 100,000 sq. ft. of GFA of office space, with a reduced charge of 25% CWH DCs on GFA exceeding the threshold

1) Office Incentive• The approved policy of a reduced charge for GFA exceeding 100,000 sq. ft.
does not include the City Wide Soft charges – The approval was done in conjunction with the changes in the City Wide Hard
(CWH) methodology [i.e. assessment on GFA vs. land area] and only the CWH reduction was approved
9. New Policy Items
32
• Sub-Committee ResolutionCharge 100% City Wide Soft DCs for the first 100,000 sq. ft. of GFA of office space, with a reduced charge of 25% City Wide Soft DCs on GFA exceeding the threshold

1) Office Incentive
That Council endorse the following policies to be utilized in the preparation of the DC Background Study:
THAT staff be directed to institute a policy for office space as follows:• 100% City Wide Soft DCs to be charged for the first 100,000 sq. ft. of
gross floor area, with a reduced charge of 25% City Wide Soft DCs on gross floor area exceeding the threshold
9. New Policy Items – Decision
33

9. New Policy Items
34
2) Deferral Policy• Current Policy
– Deferral repayment rates are increased to protect the City and ensure collection of an amount that recognizes the time value of money
– Repayment rates are based on the higher of:• The rate in effect at building permit issuance, plus indexing;• The rate in effect at building permit issuance, plus accrued interest; • The rate in effect at building permit issuance, plus the average cost of
borrowing through the Region; or• The rate that is in effect at the time of payment

9. New Policy Items
35
2) Deferral Policy
• City’s intention is to remain in a revenue neutral position • Utilization of the “rate that is in effect at time of payment” has proved difficult
for landowners when rates are adjusted through a background study update• The removal of this provision for CWH and CWS DCs will not negatively
impact the City and will make the program more attractive to the development industry
• Sub-Committee ResolutionRemove “The rate that is in effect at the time of payment” from the policy as arepayment assessment option
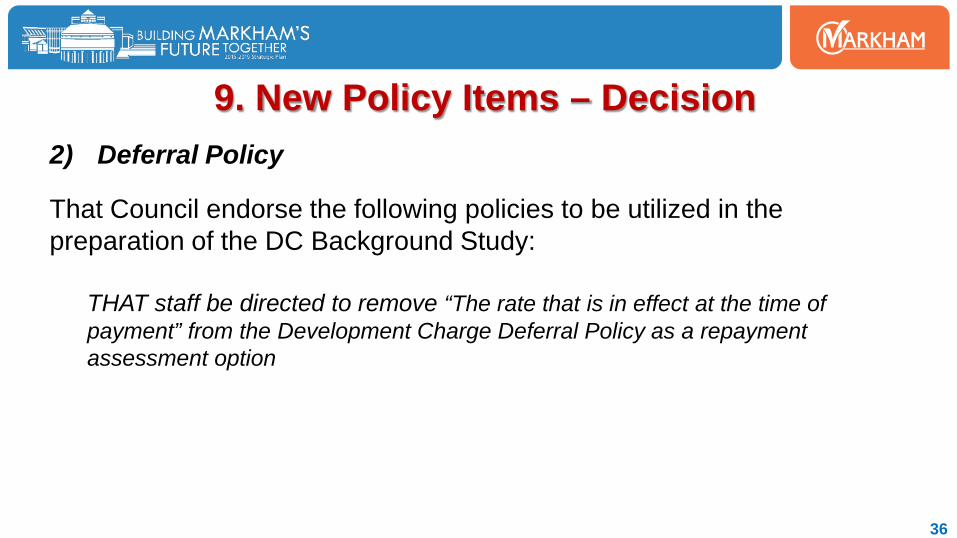
2) Deferral Policy
That Council endorse the following policies to be utilized in the preparation of the DC Background Study:
THAT staff be directed to remove “The rate that is in effect at the time of payment” from the Development Charge Deferral Policy as a repayment assessment option
9. New Policy Items – Decision
36

9. New Policy Items
37
3) Deferral – Purpose-Built (High Density) Rental Buildings
• Issue– Region instituted a deferral for purpose-built rentals which will only be
honoured if local municipalities also defer their charges • Municipal deferral must be similar or better than the Region’s • Development must be a minimum of four (4) stories• Intention is to provide increased rental stock • Not limited to affordable housing
• Offering a deferral for purpose built rentals will incent this form of development and allow the Region to follow suit

9. New Policy Items
38
3) Deferral – Purpose-Built (High Density) Rental Buildings
• The interest and security provision is not aligned with the City’s approach under its current Deferral Policy
*If paid within 15 days of deferral expiration
Key Components of Region’s Policy Recommendation
Duration 36 months
Applicable Rate Calculated at building permit issuance
Interest No Interest*
Security Charge against Land
Title Registration 20-year change of use covenant
9. New Policy Items
39
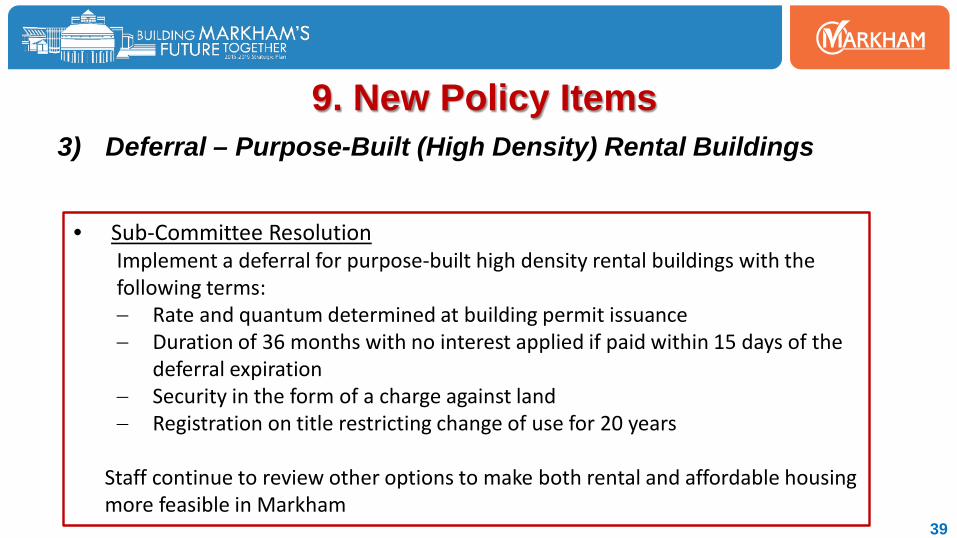
3) Deferral – Purpose-Built (High Density) Rental Buildings
• Sub-Committee ResolutionImplement a deferral for purpose-built high density rental buildings with the following terms:− Rate and quantum determined at building permit issuance − Duration of 36 months with no interest applied if paid within 15 days of the
deferral expiration− Security in the form of a charge against land− Registration on title restricting change of use for 20 years
Staff continue to review other options to make both rental and affordable housing more feasible in Markham
3) Deferral – Purpose-Built (High Density) Rental Buildings
That Council endorse the following policies to be utilized in the preparation of the DC Background Study:a) THAT staff institute a development charge deferral for purpose-built high density rental
buildings with the following terms:• Rate and quantum determined at building permit issuance • Duration of 36 months with no interest applied if paid within 15 days of the deferral
expiration• Security in the form of a charge against land• Registration on title restricting change of use for 20 years
b) Staff continue to review other options to make both rental and affordable housing more feasible in Markham
9. New Policy Items – Decision
40

That Council endorse the following policies to be utilized in the preparation of the DC Background Study:
1. THAT staff be directed to institute a policy for office space as follows:• 100% City Wide Soft DCs to be charged for the first 100,000 sq. ft. of
gross floor area, with a reduced charge of 25% City Wide Soft DCs on gross floor area exceeding the threshold
2. THAT staff be directed to remove “The rate that is in effect at the time of payment” from the Development Charge Deferral Policy as a repayment assessment option
10. Summary – New Policy Decisions
41

3. (a) THAT staff update the DC Deferral Policy to provide a development charge deferral for purpose-built high density rental buildings with the following terms:• Rate and quantum determined at building permit issuance • Duration of 36 months with no interest applied, if paid within 15 days of the
deferral expiration• Security in the form of a charge against land• Registration on title restricting change of use for 20 years
(b) Staff will continue to review other options to make both rental and affordable housing more feasible in Markham
10. Summary – New Policy Decisions
42

11. Timelines• Developer Consultation – Four meetings to-date
– Further meetings if required
• Council Sub-Committee– Further meetings if required
• General Committee – September 18, 2017• Finalize Study – By October 6, 2017• Public Meeting – November 14, 2017 • Council Approval – December 12, 2017 • Effective Date January 2, 2018
43

QUESTIONS
44