development impact fee program (nexus study)files.mtc.ca.gov/pdf/tap/epa_nexus_presentation.pdf ·...
TRANSCRIPT

DEVELOPMENT IMPACT FEE PROGRAM (NEXUS STUDY) City of East Palo Alto
Prepared for: City of East Palo Alto12 December 2013

2East Palo Alto Development Impact Fee Study| Results Presentation
AGENDA
Project Purpose – why the nexus study was
undertaken
Nexus Legalities – requirements the nexus analysis
must satisfy
Impact Fee Schedule – infrastructure categories,
development types, impact fee zones, impact fee
amounts
Nexus Methodology – calculations to determine each
impact fee amount
3East Palo Alto Development Impact Fee Study| Results Presentation
OVERVIEW OF PROJECT
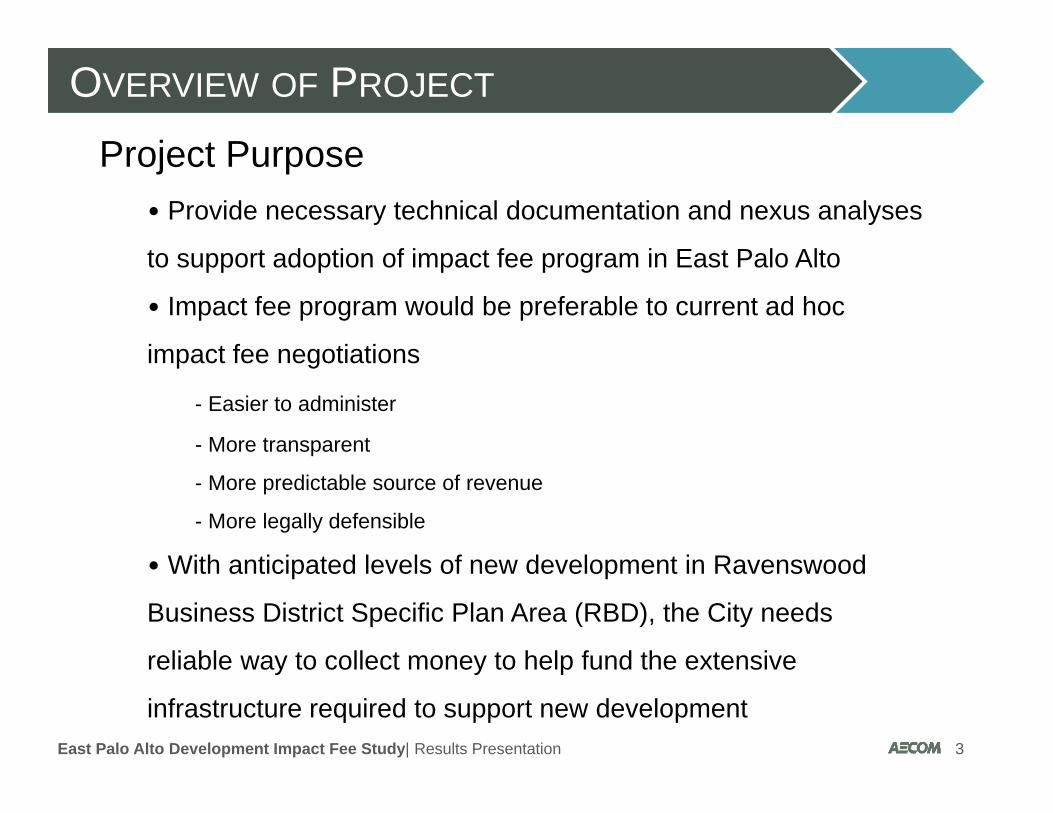
Project Purpose• Provide necessary technical documentation and nexus analyses
to support adoption of impact fee program in East Palo Alto
• Impact fee program would be preferable to current ad hoc
impact fee negotiations
- Easier to administer
- More transparent
- More predictable source of revenue
- More legally defensible
• With anticipated levels of new development in Ravenswood
Business District Specific Plan Area (RBD), the City needs
reliable way to collect money to help fund the extensive
infrastructure required to support new development

4East Palo Alto Development Impact Fee Study| Results Presentation
NEXUS ANALYSES
Mitigation Fee Act (AB 1600)Legal requirements to identify:
Purpose of fees
How fees will be used
Reasonable relationship between fee-funded public infrastructure
and the type of development paying the fee
Proportional relationship between the amount of the fee and the
amount of the impact/demand created by new development
paying the fee
5East Palo Alto Development Impact Fee Study| Results Presentation
IMPACT FEE SCHEDULE
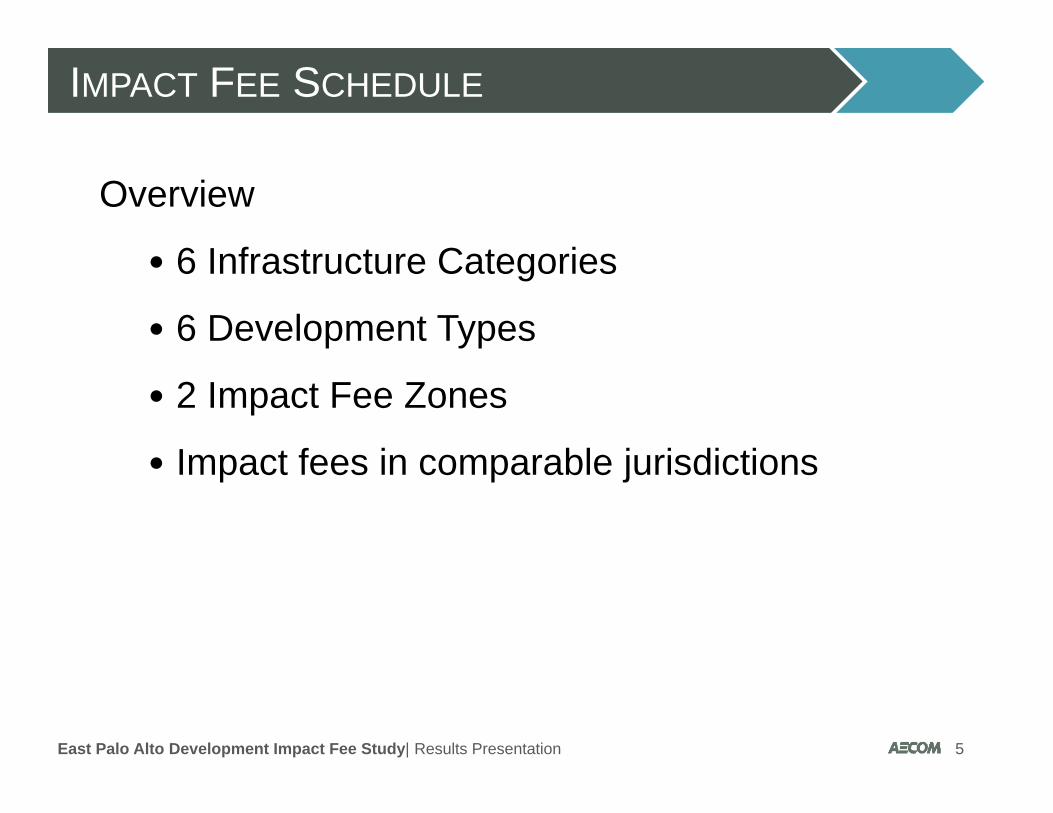
Overview
• 6 Infrastructure Categories
• 6 Development Types
• 2 Impact Fee Zones
• Impact fees in comparable jurisdictions

6East Palo Alto Development Impact Fee Study| Results Presentation
6 INFRASTRUCTURE CATEGORIES
Parks and Trails
Community Facilities
Water Infrastructure
Roadway Infrastructure
Streetscape Infrastructure
1
2
6
3
5
6
Categories chosen because of established correlation between new growth and demand4 Storm Drainage

7East Palo Alto Development Impact Fee Study| Results Presentation
6 DEVELOPMENT TYPES
Town House
Multi-Family
Retail
Office
R&D
Industrial
1
2
6
3
4
5
Non-Residential
Residential
8East Palo Alto Development Impact Fee Study| Results Presentation
2 IMPACT FEE ZONES
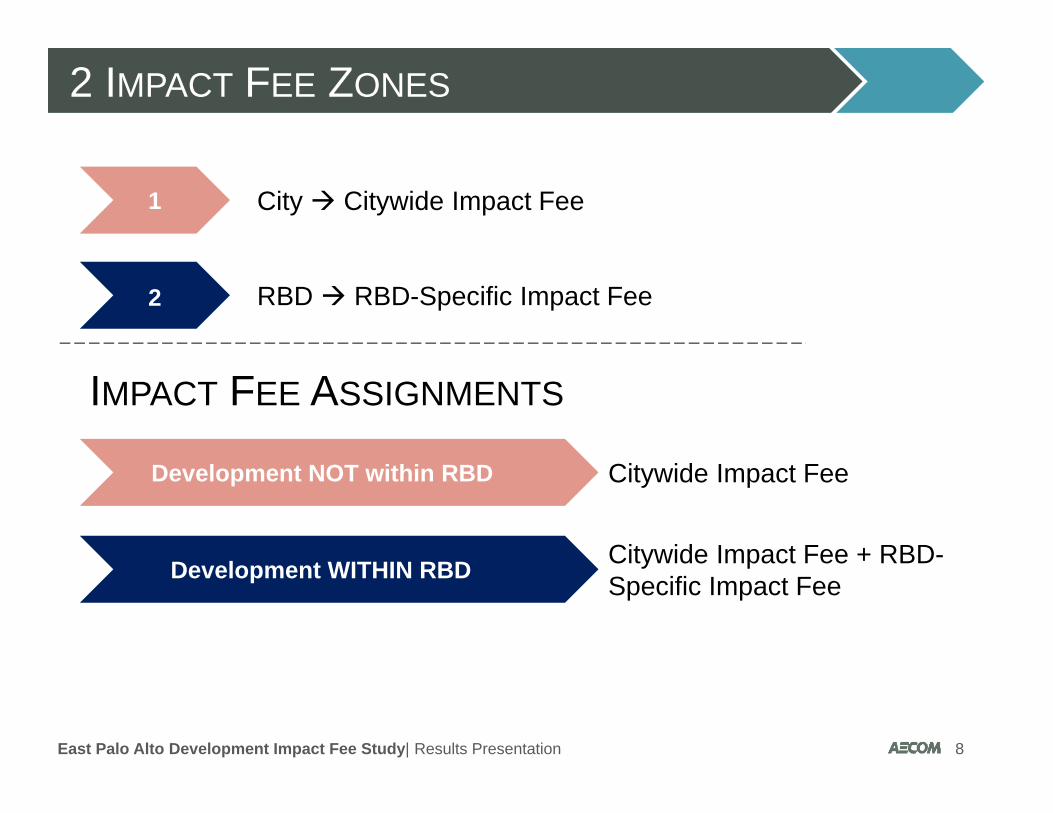
City Citywide Impact Fee
RBD RBD-Specific Impact Fee
Citywide Impact Fee
Citywide Impact Fee + RBD-Specific Impact Fee
1
2
6
Development NOT within RBD
Development WITHIN RBD
IMPACT FEE ASSIGNMENTS
9East Palo Alto Development Impact Fee Study| Results Presentation
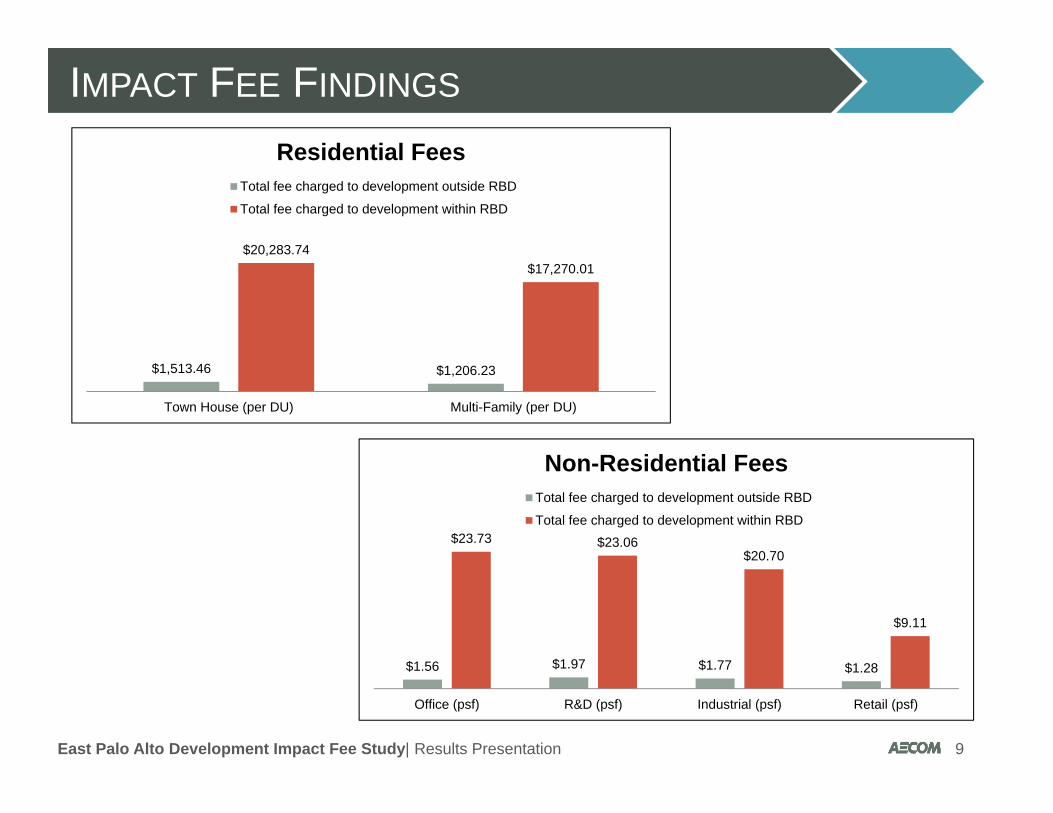
IMPACT FEE FINDINGS
$1,513.46 $1,206.23
$20,283.74$17,270.01
Town House (per DU) Multi-Family (per DU)
Residential FeesTotal fee charged to development outside RBD
Total fee charged to development within RBD
$1.56 $1.97 $1.77 $1.28
$23.73 $23.06$20.70
$9.11
Office (psf) R&D (psf) Industrial (psf) Retail (psf)
Non-Residential FeesTotal fee charged to development outside RBD
Total fee charged to development within RBD

10East Palo Alto Development Impact Fee Study| Results Presentation
IMPACT FEE FINDINGS
$1,003.00
$784.00
$510.46
$422.23
Town House (per DU) Multi-Family (per DU)
Residential Fees Outside RBD
Water Infrastructure Community Facilities
$0.44
$1.49 $1.45
$0.62
$0.87
$0.37$0.25
$0.51
$0.25
$0.11
$0.07
$0.15
Office (psf) R&D (psf) Industrial (psf) Retail (psf)
Non-Residential Fees Outside RBD
Water Infrastructure Parks & Trails Community Facilities

11East Palo Alto Development Impact Fee Study| Results Presentation
IMPACT FEE FINDINGS
$18.91
$13.93$11.97
$1.61
$4.78
$4.74
$1.51$3.67
$3.56
$0.74 $0.32
$0.21
$0.25 $0.11
$0.07
Office (psf) R&D (psf) Industrial (psf)
Non-Residential Fees Within RBD
Roadway Infrastructure Water Infrastructure
Storm Drainage Streetscape
Community Facilities
$9,981.00$11,424.00
$4,053.17$2,479.77
$4,317.06$1,793.96
$1,504.69
$1,244.61
$510.46
$422.23
Town House (per DU) Multi-Family (per DU)
Residential Fees Within RBDRoadway Infrastructure Water Infrastructure
Storm Drainage Streetscape
Community Facilities
Note: No stand-alone retail projected for RBD
12East Palo Alto Development Impact Fee Study| Results Presentation
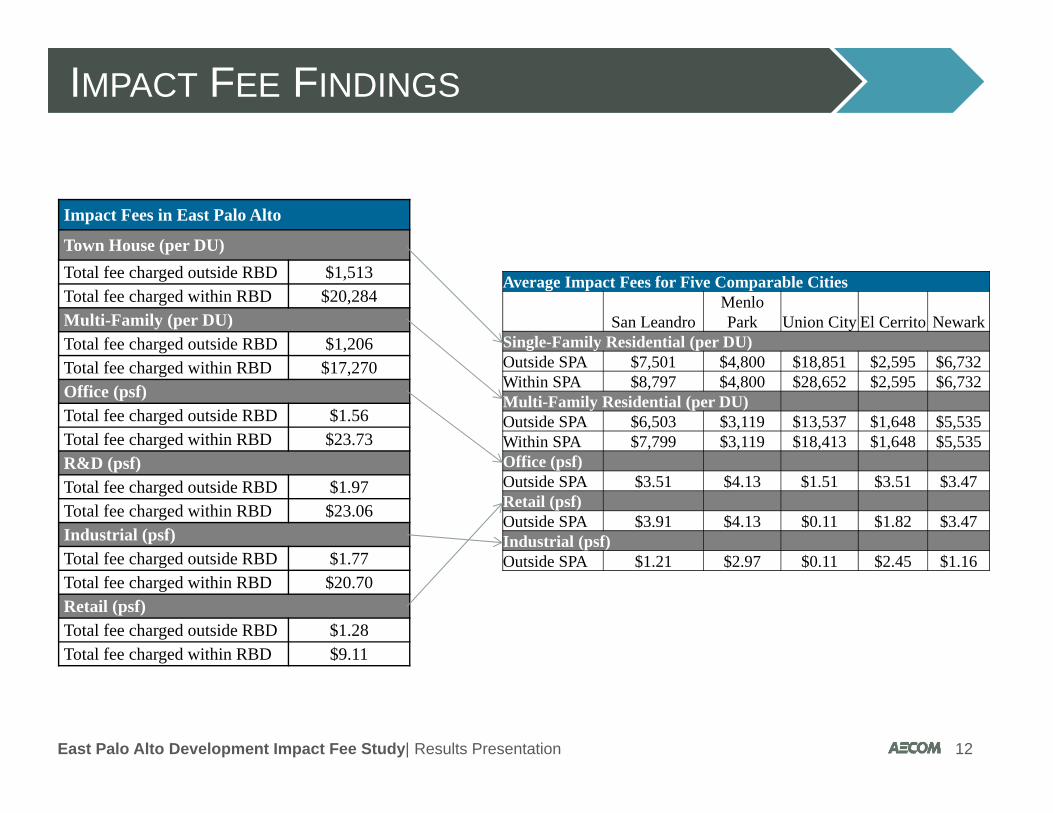
IMPACT FEE FINDINGS
Impact Fees in East Palo Alto
Town House (per DU)Total fee charged outside RBD $1,513 Total fee charged within RBD $20,284 Multi-Family (per DU)Total fee charged outside RBD $1,206 Total fee charged within RBD $17,270 Office (psf)Total fee charged outside RBD $1.56Total fee charged within RBD $23.73 R&D (psf)Total fee charged outside RBD $1.97 Total fee charged within RBD $23.06Industrial (psf)Total fee charged outside RBD $1.77Total fee charged within RBD $20.70Retail (psf)Total fee charged outside RBD $1.28 Total fee charged within RBD $9.11
Average Impact Fees for Five Comparable Cities
San LeandroMenlo Park Union City El Cerrito Newark
Single-Family Residential (per DU)Outside SPA $7,501 $4,800 $18,851 $2,595 $6,732Within SPA $8,797 $4,800 $28,652 $2,595 $6,732Multi-Family Residential (per DU)Outside SPA $6,503 $3,119 $13,537 $1,648 $5,535Within SPA $7,799 $3,119 $18,413 $1,648 $5,535Office (psf)Outside SPA $3.51 $4.13 $1.51 $3.51 $3.47Retail (psf)Outside SPA $3.91 $4.13 $0.11 $1.82 $3.47Industrial (psf)Outside SPA $1.21 $2.97 $0.11 $2.45 $1.16

13East Palo Alto Development Impact Fee Study| Results Presentation
COMPARISON HIGHLIGHTS
Residential Fees Comparison
Citywide: on the lower end
RBD: on the higher end
Non‐Residential Fee Comparison
Citywide: on the lower end
RBD: high
14East Palo Alto Development Impact Fee Study| Results Presentation
NEXUS METHODOLOGY
Overview
• Growth and development projections
• General assumptions
• Detailed calculations to determine fees for each infrastructure category,
per development type,
in each impact fee zone.
15East Palo Alto Development Impact Fee Study| Results Presentation
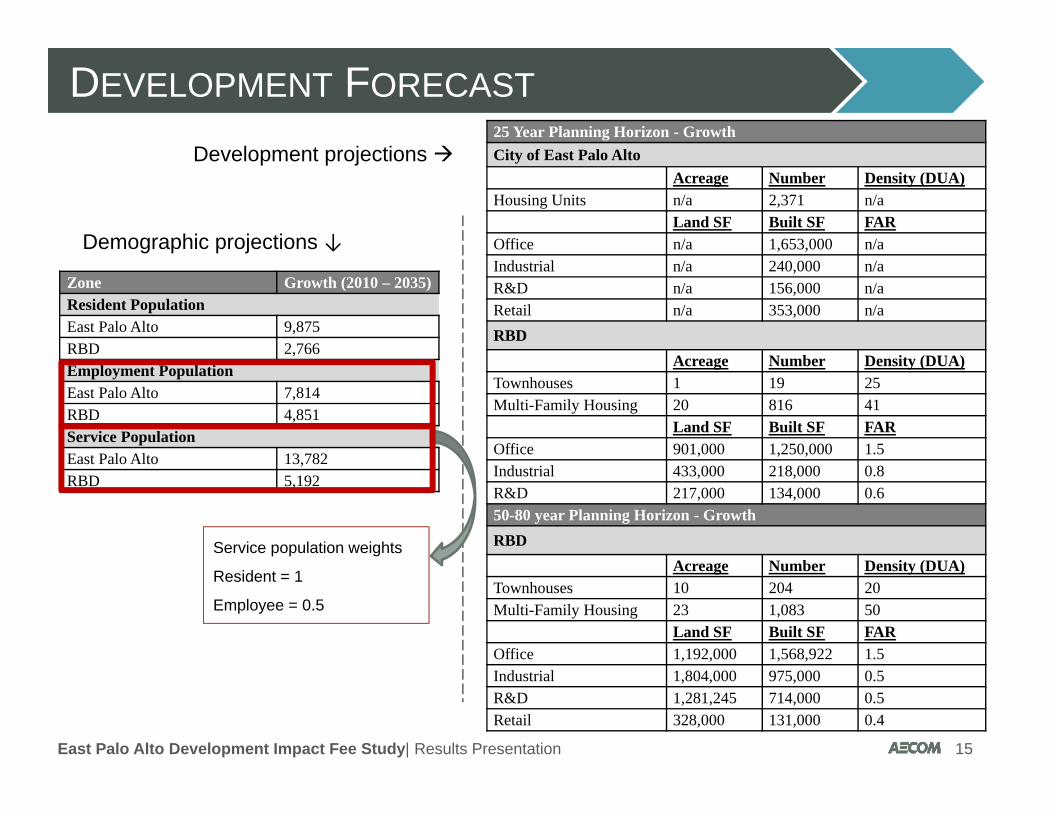
DEVELOPMENT FORECAST
Demographic projections ↓
Zone Growth (2010 – 2035)Resident Population East Palo Alto 9,875RBD 2,766Employment Population East Palo Alto 7,814RBD 4,851Service Population East Palo Alto 13,782RBD 5,192
Development projections 25 Year Planning Horizon - GrowthCity of East Palo Alto
Acreage Number Density (DUA)Housing Units n/a 2,371 n/a
Land SF Built SF FAROffice n/a 1,653,000 n/a Industrial n/a 240,000 n/aR&D n/a 156,000 n/aRetail n/a 353,000 n/aRBD
Acreage Number Density (DUA)Townhouses 1 19 25Multi-Family Housing 20 816 41
Land SF Built SF FAROffice 901,000 1,250,000 1.5Industrial 433,000 218,000 0.8R&D 217,000 134,000 0.650-80 year Planning Horizon - GrowthRBD
Acreage Number Density (DUA)Townhouses 10 204 20Multi-Family Housing 23 1,083 50
Land SF Built SF FAROffice 1,192,000 1,568,922 1.5Industrial 1,804,000 975,000 0.5R&D 1,281,245 714,000 0.5Retail 328,000 131,000 0.4
Service population weights
Resident = 1
Employee = 0.5

16East Palo Alto Development Impact Fee Study| Results Presentation
GENERAL ASSUMPTIONS
Town House (persons / DU) 3.9Multi-Family (persons / DU) 3.2SF / employee (Office) 260SF / employee (R&D) 610SF / employee (Indistrial) 910SF / employee (Retail) 440
General land use assumptions ↓
Infrastructure requirements Adopted ten-year CIP
RSP
DEPLAN
17East Palo Alto Development Impact Fee Study| Results Presentation
PARKS AND TRAILS
Commitment to providing recreation and open
space amenities (Conservation and Open Space
Element within General Plan)
New development attracts new residents and
employees who require new (or expanded and
improved) open space
29 parks and trails projects in CIP/RSP ($53M)
Cost will be borne citywide (new parks and trails will
benefit entire city, not just new development)
New development will pay its fair share
18East Palo Alto Development Impact Fee Study| Results Presentation
PARKS AND TRAILS
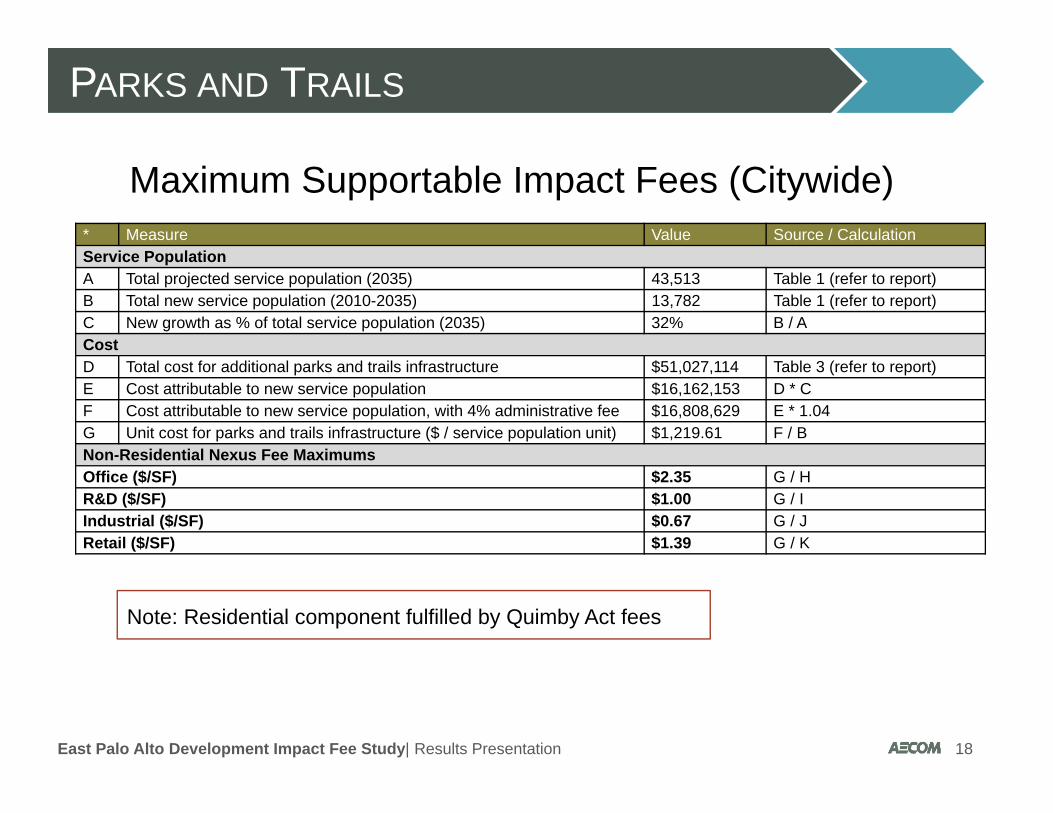
* Measure Value Source / CalculationService PopulationA Total projected service population (2035) 43,513 Table 1 (refer to report)B Total new service population (2010-2035) 13,782 Table 1 (refer to report)C New growth as % of total service population (2035) 32% B / ACostD Total cost for additional parks and trails infrastructure $51,027,114 Table 3 (refer to report)E Cost attributable to new service population $16,162,153 D * CF Cost attributable to new service population, with 4% administrative fee $16,808,629 E * 1.04G Unit cost for parks and trails infrastructure ($ / service population unit) $1,219.61 F / BNon-Residential Nexus Fee MaximumsOffice ($/SF) $2.35 G / HR&D ($/SF) $1.00 G / IIndustrial ($/SF) $0.67 G / JRetail ($/SF) $1.39 G / K
Maximum Supportable Impact Fees (Citywide)
Note: Residential component fulfilled by Quimby Act fees
19East Palo Alto Development Impact Fee Study| Results Presentation
PARKS AND TRAILS
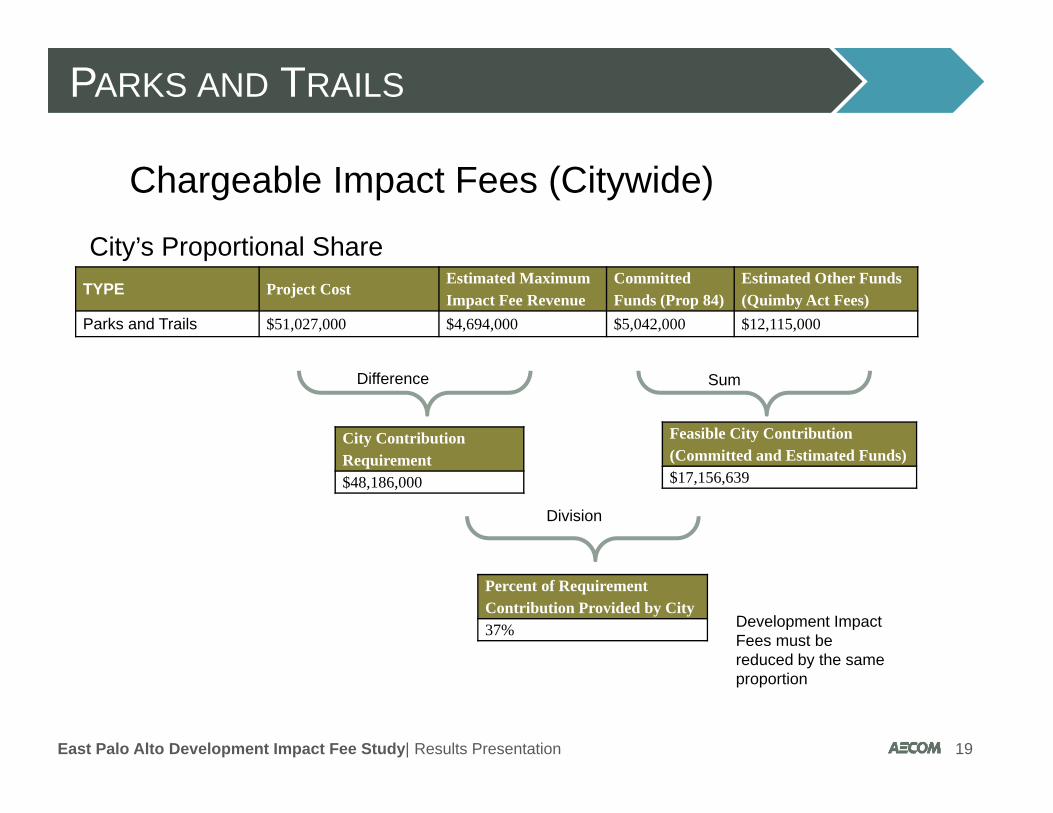
Chargeable Impact Fees (Citywide)
City’s Proportional ShareTYPE Project Cost
Estimated Maximum Impact Fee Revenue
Committed Funds (Prop 84)
Estimated Other Funds (Quimby Act Fees)
Parks and Trails $51,027,000 $4,694,000 $5,042,000 $12,115,000
Percent of Requirement Contribution Provided by City37%
City Contribution Requirement$48,186,000
Difference Sum
Feasible City Contribution (Committed and Estimated Funds)$17,156,639
Division
Development Impact Fees must be reduced by the same proportion
20East Palo Alto Development Impact Fee Study| Results Presentation
PARKS AND TRAILS
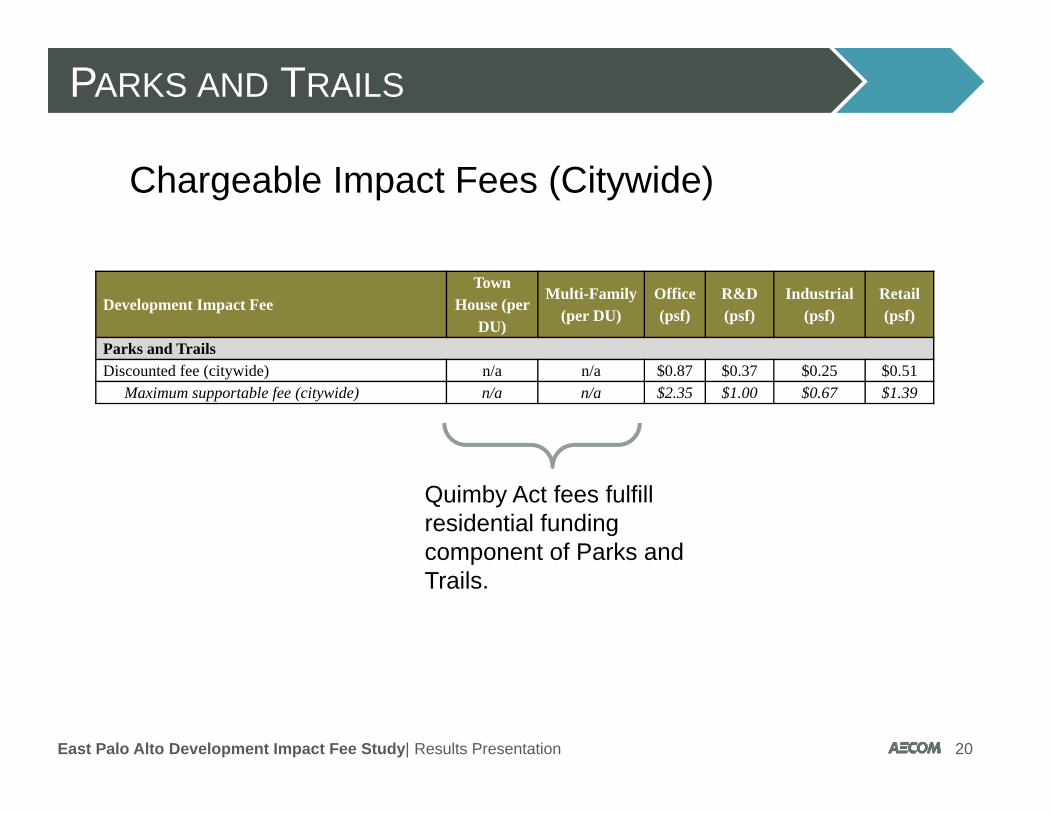
Chargeable Impact Fees (Citywide)
Development Impact FeeTown
House (per DU)
Multi-Family (per DU)
Office (psf)
R&D (psf)
Industrial (psf)
Retail (psf)
Parks and TrailsDiscounted fee (citywide) n/a n/a $0.87 $0.37 $0.25 $0.51
Maximum supportable fee (citywide) n/a n/a $2.35 $1.00 $0.67 $1.39
Quimby Act fees fulfill residential funding component of Parks and Trails.

21East Palo Alto Development Impact Fee Study| Results Presentation
COMMUNITY FACILITIES
Commitment to providing community facilities (Land
Use Element within General Plan)
New development attracts new residents and
employees who require new (or expanded and
improved) community facilities
11 community facility projects in CIP/RSP ($42M)
Cost will be borne citywide (new parks and trails will
benefit entire city, not just new development)
New development will pay its fair share

22East Palo Alto Development Impact Fee Study| Results Presentation
COMMUNITY FACILITIES
Maximum Supportable Impact Fees (Citywide)* Measure Value Source / CalculationService PopulationA Total projected service population (2035) 43,513 Table 1 (refer to report)B Total new service population (2010-2035) 13,782 Table 1 (refer to report)C New growth as % of total service population (2035) 32% B / ACostD Total cost for additional community facilities $41,815,000 Table 3 (refer to report)E Cost attributable to new service population $13,244,340 D * CF Cost attributable to new service population, with 4% administrative fee $13,774,113 E * 1.04G Unit cost for community facilities ($ / service population) $999 F / BResidential Nexus Fee MaximumsTownhouse ($ / DU) $3,895 G * HMulti-Family ($ / DU) $3,222 G * INon-Residential Nexus Fee MaximumsOffice ($/SF) $1.92 G / JR&D ($/SF) $0.82 G / KIndustrial ($/SF) $0.55 G / LRetail ($/SF) $1.14 G / M

23East Palo Alto Development Impact Fee Study| Results Presentation
COMMUNITY FACILITIES
Chargeable Impact Fees (Citywide)
City’s Proportional ShareTYPE Project Cost
Estimated Maximum Impact Fee Revenue
Committed Funds (Prop 84)
Estimated Other Funds
Community Facilities $41,815,000 $9,919,000 $0 $4,247,000
Percent of Requirement Contribution Provided by City13%
City Contribution Requirement$33,172,000
Difference Sum
Identified City Contribution (Committed and Estimated Funds)$4,247,000
Division
Development Impact Fees must be reduced by the same proportion

24East Palo Alto Development Impact Fee Study| Results Presentation
COMMUNITY FACILITIES
Chargeable Impact Fees (Citywide)
Development Impact FeeTown
House (per DU)
Multi-Family (per DU)
Office (psf)
R&D (psf)
Industrial (psf)
Retail (psf)
Community FacilitiesDiscounted fee (citywide) $510 $422 $0.25 $0.11 $0.07 $0.15
Maximum supportable fee (citywide) $4,386 $3,628 $2.16 $0.92 $0.62 $1.28

25East Palo Alto Development Impact Fee Study| Results Presentation
WATER INFRASTRUCTURE
Commitment to providing adequate water infrastructure
(Land Use Element within General Plan; Goal UTIL-3 of
Ravenswood Specific Plan)
New development attracts new residents and employees
who require new (expanded/improved) water infrastructure
Water storage, supply, and distribution projects in CIP/RSP
($15.2M)
Water supply costs will be borne citywide (benefit the
whole City)
Storage and distribution projects are engineered
specifically to support new development in RBD; costs will
be borne fully by new development

26East Palo Alto Development Impact Fee Study| Results Presentation
WATER INFRASTRUCTURE - SUPPLY
Maximum Supportable Impact Fees (Citywide)* Measure Value Source / CalculationCapacity / DemandA Capacity of new water supply infrastructure (gpd) 1,455,357 See Note 1B % of demand on new water supply infrastructure by new development (citywide) 100% See Note 1CostC Total cost for water supply infrastructure $5,400,000 Table 3D Cost attributable to new service population, with 4% administrative fee $5,616,000 D * B * 1.04E Unit cost for water supply infrastructure ($ / gpd) $3.86 D / AResidential Nexus Fee MaximumsTownhouse ($ / DU) $1,003 E * FMulti-Family ($ / DU) $784 E * GNon-Residential Nexus Fee MaximumsOffice ($/SF) $0.44 E * HR&D ($/SF) $1.49 E * IIndustrial ($/SF) $1.45 E * JRetail ($/SF) $0.62 E * K

27East Palo Alto Development Impact Fee Study| Results Presentation
WATER INFRASTRUCTURE - DISTRIBUTION
Maximum Supportable Impact Fees (RBD-Specific)* Measure Value Source / CalculationCapacity / DemandA Demand for water distribution infrastructure (gpd) in RBD from new development 1,116,968 Table 24CostB Total cost for water distribution infrastructure $4,838,327 Table 3C Unit cost for water distribution infrastructure, with 4% administrative fee ($ / gpd) $4.50 B / A * 1.04Residential Nexus Fee MaximumsTownhouse ($ / DU) $1,171 C * DMulti-Family ($ / DU) $915 C * ENon-Residential Nexus Fee MaximumsOffice ($/SF) $0.51 C * FR&D ($/SF) $1.74 C * GIndustrial ($/SF) $1.69 C * HRetail ($/SF) $0.72 C * I

28East Palo Alto Development Impact Fee Study| Results Presentation
WATER INFRASTRUCTURE – STORAGE
Maximum Supportable Impact Fees (RBD-Specific)* Measure Value Source / Calculation
Capacity / DemandA Water storage tank capacity required for new development in SPA (MG) 2 East Palo Alto Water System Master PlanB Total projected acreage of new development (50-80 yr. planning horizon) 138 Table 2
CostC Total cost for water storage tank $5,000,000 Table 3D Per-acre cost for water storage tank (with 4% administrative fee) $37,578 C * 1.04 / B
Residential Nexus Fee MaximumsTownhouse ($ / DU) $1,879 D * E / FMulti-Family ($ / DU) $781 D * G / HNon-Residential Nexus Fee MaximumsOffice ($/SF) $0.66 D * I / 43,560 / JR&D ($/SF) $1.55 D * K / 43,560 / LIndustrial ($/SF) $1.60 D * M / 43,560 / NRetail ($/SF) $2.16 D * O / 43,560 / P

29East Palo Alto Development Impact Fee Study| Results Presentation
WATER INFRASTRUCTURE
Chargeable Impact Fees
Development Impact FeeTown
House (per DU)
Multi-Family (per
DU)Office (psf) R&D (psf)
Industrial (psf)
Retail (psf)
Water InfrastructureCitywide fee $1,003 $784 $0.44 $1.49 $1.45 $0.62 RBD-specific fee $3,050 $1,696 $1.17 $3.29 $3.29 $2.88
Fee charged to development outside RBD $1,003 $784 $0.44 $1.49 $1.45 $0.62 Fee charged to development within RBD $4,053 $2,480 $1.61 $4.78 $4.74 $3.50

30East Palo Alto Development Impact Fee Study| Results Presentation
STORM DRAINAGE
Commitment to providing adequate storm drainage (Goal
UTIL-3 in Ravenswood Specific Plan)
New development attracts new residents and employees
who require new (or expanded and improved) storm
drainage
Drainage projects in CIP/RSP ($15.4M)
Storm Drainage projects are engineered specifically to
support new development in RBD; costs will be borne
fully by new development

31East Palo Alto Development Impact Fee Study| Results Presentation
STORM DRAINAGE
Maximum Supportable Impact Fees (RBD-Specific)* Measure Value Source / CalculationService Population
AImpervious acres (correlated to demand for storm drain infrastructure) in RBD from new development
125 Table 24
CostB Total cost for storm drain infrastructure in RBD $15,413,372 Table 3C Unit Cost for storm drain infrastructure, with 4% administrative fee ($ / impervious acre) $128,710.85 B / A * 1.04Residential Nexus Fee MaximumsTownhouse ($ / DU) $5,792 C * DMulti-Family ($ / DU) $2,407 C * ENon-Residential Nexus Fee MaximumsOffice ($/SF) $2.02 C / FR&D ($/SF) $4.92 C / GIndustrial ($/SF) $4.77 C / HRetail ($/SF) $6.65 C / I

32East Palo Alto Development Impact Fee Study| Results Presentation
STORM DRAINAGE
Chargeable Impact FeesCity’s Proportional Share
Infrastructure Item Project CostEstimated Maximum Impact Fee Revenue
Required City Contribution
Committed Funds
Water Infrastructure $15,413,000 $16,030,000 $0 $3,925,000
Committed funds exist in excess of required City contribution (particularly for Storm
Drainage)
City can use ‘excess’ fund monies to remit a portion of development’s burden
Development Impact FeeTown House
(per DU)Multi-Family
(per DU)Office (psf)
R&D (psf)
Industrial (psf)
Retail (psf)
Storm DrainageDiscounted RBD-specific fee $4,317 $1,794 $1.51 $3.67 $3.56 $4.96
Maximum supportable RBD-specific fee $5,792 $2,407 $2.02 $4.92 $4.77 $6.65
Discounted fees calculated by subtracting ‘excess’ monies from cost total
33East Palo Alto Development Impact Fee Study| Results Presentation
ROADWAY INFRASTRUCTURE
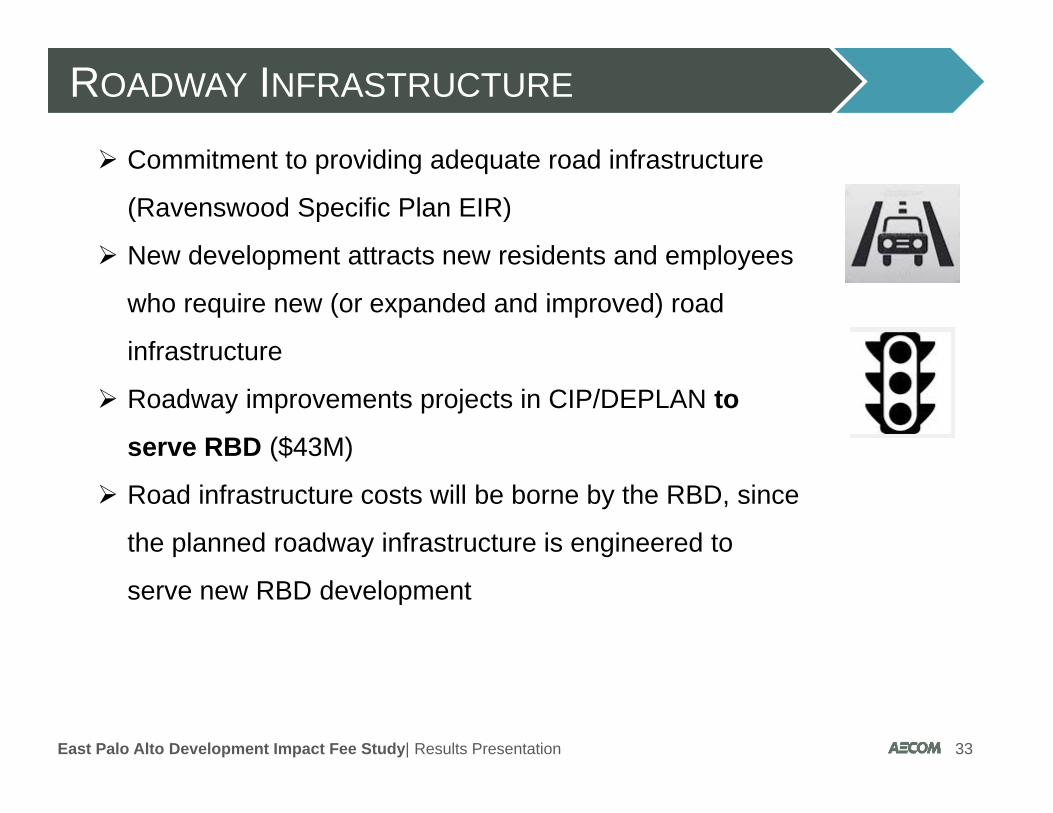
Commitment to providing adequate road infrastructure
(Ravenswood Specific Plan EIR)
New development attracts new residents and employees
who require new (or expanded and improved) road
infrastructure
Roadway improvements projects in CIP/DEPLAN to
serve RBD ($43M)
Road infrastructure costs will be borne by the RBD, since
the planned roadway infrastructure is engineered to
serve new RBD development

34East Palo Alto Development Impact Fee Study| Results Presentation
ROADWAY INFRASTRUCTURE
Maximum Supportable Impact Fees (RBD-Specific)* Measure Value Source / CalculationCapacity / DemandA Gross number of trips in RBD 21,902 Table 25CostB Total cost for roadway improvements / street structure in RBD $43,378,927 Table 3C Unit cost for roadway improvements, with 4% administrative fee ($ / trip) $2,059.81 B / A * 1.04Residential Unit ConversionsE Townhouse (trips / DU) 5.81 Table 25F Multi-Family (trips / DU) 6.65 Table 25Commercial Unit ConversionsG Office (trips / Ksf)1 11.01 Table 25H R&D (trips / Ksf) 1 6.97 Table 25I Industrial (trips / Ksf) 1 8.11 Table 25Residential Nexus Fee MaximumsTownhouse ($ / DU) $11,967 C * EMulti-Family ($ / DU) $13,698 C * FNon-Residential Nexus Fee MaximumsOffice ($/SF) $22.68 C * G / 1000R&D ($/SF) $14.36 C* H / 1000Industrial ($/SF) $16.71 C * I / 1000

35East Palo Alto Development Impact Fee Study| Results Presentation
ROADWAY INFRASTRUCTURE
Chargeable Impact Fees (RBD-Specific)City’s Proportional Share
Infrastructure ItemProject Cost (incl. 4% administrative fee)
Estimated Maximum Impact Fee Revenue
Required City Contribution
Committed Funds
Road Infrastructure $45,114,000 $45,114,000 $0 $7,500,000
Committed funds exist in excess of required City contribution
City can use ‘excess’ fund monies to remit a portion of development’s burden
Development Impact FeeTown House
(per DU)Multi-Family
(per DU)Office (psf)
R&D (psf)
Industrial (psf)
Roadway InfrastructureDiscounted RBD-specific fee $9,898 $11,329 $18.76 $13.82 $11.87
Maximum supportable RBD-specific fee $11,967 $13,698 $22.68 $14.36 $16.71
Discounted fees calculated by subtracting ‘excess’ monies from cost total

36East Palo Alto Development Impact Fee Study| Results Presentation
ROADWAY INFRASTRUCTURE
Chargeable Impact Fees (RBD-Specific)
Development Impact FeeTown House
(per DU)Multi-Family
(per DU)Office (psf) R&D (psf)
Industrial (psf)
Roadway InfrastructureCitywide fee n/a n/a n/a n/a n/aRBD-specific fee $9,898 $11,329 $18.76 $13.82 $11.87
Fee charged to development outside RBD $0.00 $0.00 $0.00 $0.00 $0.00 Fee charged to development within RBD $9,981 $11,424 $18.91 $13.93 $11.97

37East Palo Alto Development Impact Fee Study| Results Presentation
STREETSCAPE INFRASTRUCTURE
Commitment to providing streetscape (Land Use Element
within General Plan)
New development attracts new residents and employees
who require new (or expanded and improved)
streetscape infrastructure
Streetscape projects in DEPLAN to serve RBD ($4.6M)
Streetscape infrastructure costs will be borne by the
RBD, since the planned RBD streetscape infrastructure is
a local amenity that serves new RBD development
38East Palo Alto Development Impact Fee Study| Results Presentation
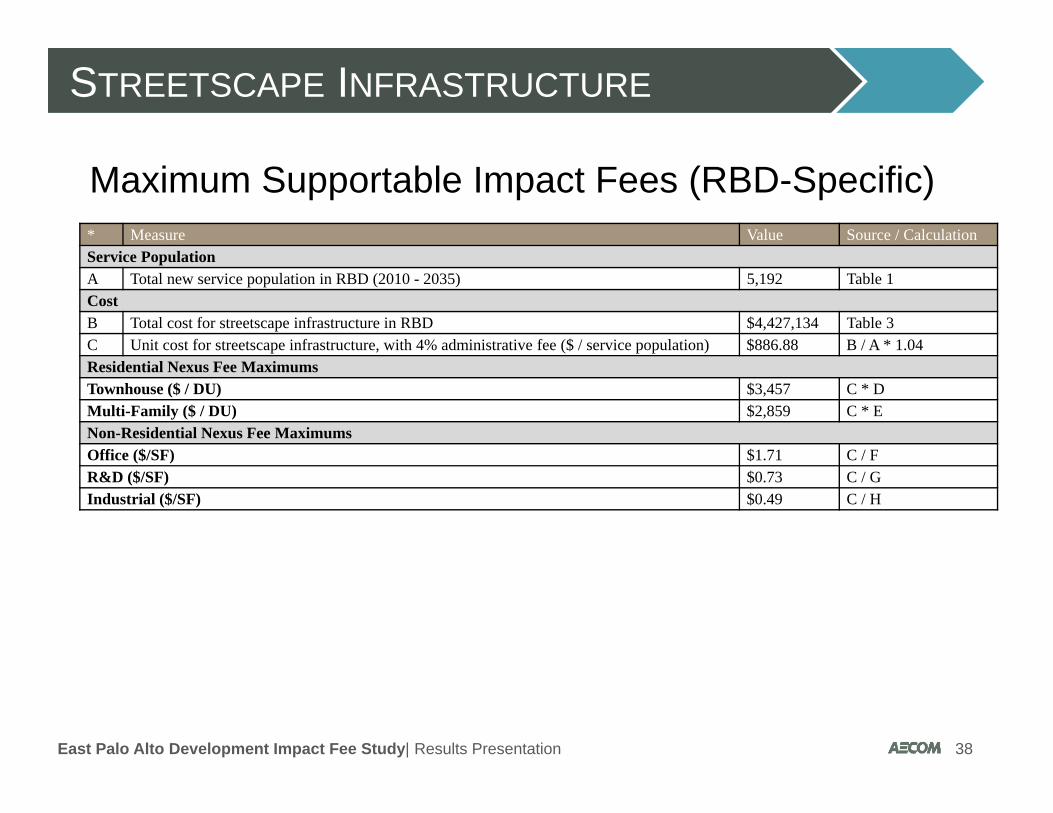
STREETSCAPE INFRASTRUCTURE
Maximum Supportable Impact Fees (RBD-Specific)* Measure Value Source / CalculationService PopulationA Total new service population in RBD (2010 - 2035) 5,192 Table 1CostB Total cost for streetscape infrastructure in RBD $4,427,134 Table 3C Unit cost for streetscape infrastructure, with 4% administrative fee ($ / service population) $886.88 B / A * 1.04Residential Nexus Fee MaximumsTownhouse ($ / DU) $3,457 C * DMulti-Family ($ / DU) $2,859 C * ENon-Residential Nexus Fee MaximumsOffice ($/SF) $1.71 C / FR&D ($/SF) $0.73 C / GIndustrial ($/SF) $0.49 C / H

39East Palo Alto Development Impact Fee Study| Results Presentation
STREETSCAPE INFRASTRUCTURE
Chargeable Impact Fees (RBD-Specific)City’s Proportional Share
Infrastructure ItemProject Cost (incl. 4% administrative fee)
Estimated Maximum Impact Fee Revenue
Required City Contribution
Committed Funds
Streetscape $4,604,000 $4,733,000 $0 $2,500,000
Committed funds exist in excess of required City contribution
City can use ‘excess’ fund monies to remit a portion of development’s burden
Development Impact FeeTown House
(per DU)Multi-Family
(per DU)Office (psf)
R&D (psf)
Industrial (psf)
StreetscapeDiscounted RBD-specific fee $1,505 $1,245 $0.74 $0.32 $0.21
Maximum supportable RBD-specific fee $3,457 $2,859 $1.71 $0.73 $0.49
Discounted fees calculated by subtracting ‘excess’ monies from cost total

40East Palo Alto Development Impact Fee Study| Results Presentation
STREETSCAPE INFRASTRUCTURE
Chargeable Impact Fees (RBD-Specific)
Development Impact FeeTown House
(per DU)Multi-Family
(per DU)Office (psf) R&D (psf)
Industrial (psf)
StreetscapeCitywide fee n/a n/a n/a n/a n/aRBD-specific fee $1,505 $1,245 $0.74 $0.32 $0.21
Fee charged to development outside RBD $0 $0 $0 $0 $0 Fee charged to development within RBD $1,583 $1,309 $0.78 $0.33 $0.22
41East Palo Alto Development Impact Fee Study| Results Presentation
CITY COMMENTS & QUESTIONS