development of a body image assessment procedure for
TRANSCRIPT

Louisiana State UniversityLSU Digital Commons
LSU Historical Dissertations and Theses Graduate School
1994
Development of a Body Image AssessmentProcedure for Children and Pre-Adolescents.Staci Veron GuidryLouisiana State University and Agricultural & Mechanical College
Follow this and additional works at: https://digitalcommons.lsu.edu/gradschool_disstheses
This Dissertation is brought to you for free and open access by the Graduate School at LSU Digital Commons. It has been accepted for inclusion inLSU Historical Dissertations and Theses by an authorized administrator of LSU Digital Commons. For more information, please [email protected].
Recommended CitationGuidry, Staci Veron, "Development of a Body Image Assessment Procedure for Children and Pre-Adolescents." (1994). LSU HistoricalDissertations and Theses. 5799.https://digitalcommons.lsu.edu/gradschool_disstheses/5799
INFORMATION TO USERS
This manuscript has been reproduced from the microfilm master. UMI films the text directly from the original or copy submitted. Thus, some thesis and dissertation copies are in typewriter face, while others may be from any type of computer printer.
The quality of this reproduction is dependent upon the quality of the copy submitted. Broken or indistinct print, colored or poor quality illustrations and photographs, print bleedthrough, substandard margins, and improper alignment can adversely affect reproduction.
In the unlikely event that the author did not send UMI a complete manuscript and there are missing pages, these will be noted. Also, if unauthorized copyright material had to be removed, a note will indicate the deletion.
Oversize materials (e.g., maps, drawings, charts) are reproduced by sectioning the original, beginning at the upper left-hand comer and continuing from left to right in equal sections with small overlaps. Each original is also photographed in one exposure and is included in reduced form at the back of the book.
Photographs included in the original manuscript have been reproduced xerographically in this copy. Higher quality 6" x 9" black and white photographic prints are available for any photographs or illustrations appearing in this copy for an additional charge. Contact UMI directly to order.
University Microfilms International A Bell & Howell Information C om pany
300 North Z e e b Road. Ann Arbor. Ml 48106-1346 USA 313/761-4700 800/521-0600

Order Number 9508572
D evelopm ent o f a b od y im age assessm ent procedure for children and pre-adolescents
Guidry, Staci Veron, Ph.D.
The Louisiana State University and Agricultural and Mechanical Col., 1994
Copyright © 1994 by Guidry, Staci Veron. All rights reserved.
300 N. ZeebRd.Ann Arbor, Ml 48106

DEVELOPMENT OF A BODY IMAGE ASSESSMENT PROCEDURE FOR CHILDREN AND PRE-ADOLESCENTS
A DissertationSubmitted to the Graduate Faculty of the
Louisiana State University and Agricultural and Mechanical College
in partial fulfillment of the requirements for the degree of
Doctor of Philosophyin
The Department of Psychology
byStaci Veron Guidry
B.S., University of Southwestern Louisiana, 1988 M.A., Louisiana State University, 1992
August 1994

Copyright 1994 Staci Veron Guidry All rights reserved

ACKNOWLEGMENTSI would like to express my sincere thanks to my
dissertation committee chairman, Donald A. Williamson, for his guidance, encouragement, and support throughout graduate school, and especially during the completion of this project. I would also like to thank my dissertation committee members: Phillip Brantley, Katie Cherry, Mary Lou Kelly, and Rick
Netemeyer, with very special thanks to Dr. Netemeyer for his patience and assistance with the statistical analyses. I
would also like to express sincere thanks to my husband, Chris Guidry, for his help with the compilation of this manuscript, but more importantly for his patience, love, and understanding of all the sacrifices made to complete this project. Finally, special thanks are extended to my parents,
Lynn and Faith Veron, who always taught me that I could achieve anything, and without whom this would not be
possible.
iii

TABLE OF CONTENTSAcknowlegments ......................................... iiiList of T a b l e s ............................................ vList of Figures.......................................... viiA b s t r a c t ................................................viiiIntroduction ............................................. 1M e t h o d .................................................... 44Results.................................................... 53
D i s c u s s i o n ................................................89R e f e r e n c e s .............................................. 100Appendix A: Children's Eating Attitudes Test ........ 108Appendix B: Children's Depression Inventory .......... 113Appendix C: Sociocultural Influence on
Thinness Questionnaire ................. 115Appendix D: Piers-Harris Children's Self-concept
Questionnaire .............................. 117Appendix E: Consent F o r m ............................... 118Appendix F: Summary Sheet ............................. 119V i t a ..................................................... 120
iv
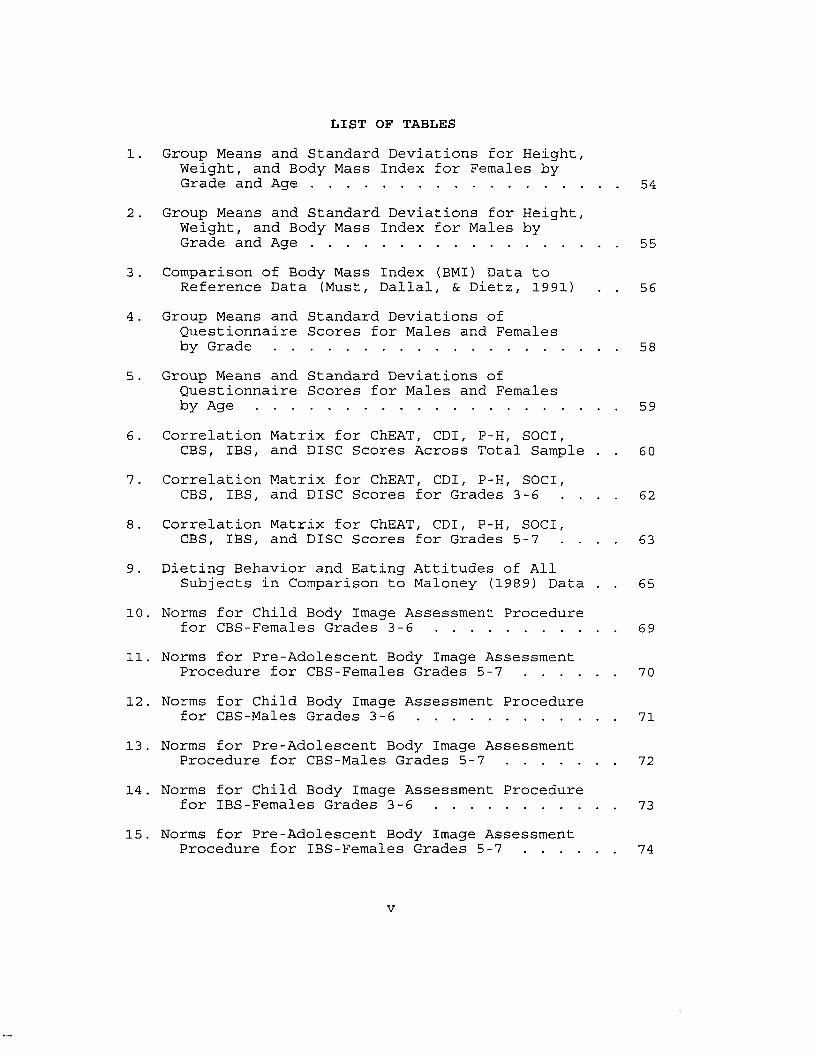
LIST OF TABLES1. Group Means and Standard Deviations for Height,
Weight, and Body Mass Index for Females byGrade and A g e ....................................... 54
2. Group Means and Standard Deviations for Height,Weight, and Body Mass Index for Males byGrade and A g e ....................................... 55
3. Comparison of Body Mass Index (BMI) Data toReference Data (Must, Dallal, & Dietz, 1991) . . 56
4. Group Means and Standard Deviations ofQuestionnaire Scores for Males and Femalesby G r a d e ........................................... 58
5. Group Means and Standard Deviations ofQuestionnaire Scores for Males and Femalesby A g e ...........................................5 9
6. Correlation Matrix for ChEAT, CDI, P-H, SOCI,CBS, IBS, and DISC Scores Across Total Sample . . 60
7. Correlation Matrix for ChEAT, CDI, P-H, SOCI,CBS, IBS, and DISC Scores for Grades 3-6 . . . . 62
8. Correlation Matrix for ChEAT, CDI, P-H, SOCI,CBS, IBS, and DISC Scores for Grades 5-7 . . . . 63
9. Dieting Behavior and Eating Attitudes of AllSubjects in Comparison to Maloney (1989) Data . . 65
10. Norms for Child Body Image Assessment Procedurefor CBS-Females Grades 3 - 6 ........................69
11. Norms for Pre-Adolescent Body Image AssessmentProcedure for CBS-Females Grades 5-7.... ........ 70
12. Norms for Child Body Image Assessment Procedurefor CBS-Males Grades 3 - 6 .......................... 71
13. Norms for Pre-Adolescent Body Image AssessmentProcedure for CBS-Males Grades 5-7 72
14. Norms for Child Body Image Assessment Procedurefor IBS-Females Grades 3 - 6 ........................73
15. Norms for Pre-Adolescent Body Image AssessmentProcedure for IBS-Females Grades 5-7 ........ 74
v
16. Norms for Child Body Image Assessment Procedurefor IBS-Males Grades 3 - 6 .......................... 75
17. Norms for Pre-Adolescent Body Image AssessmentProcedure for IBS-Males Grades 5-7 76
18. Comparison of Group Means and Standard Deviationsfor Females Who Had and Had Not BegunMenstruating .................................... 79
19. Goodness-of-fit Indices for Structural Models . . . 83
20. Path Estimates for Structural M o d e l s ...............84
21. Correlation Matrix for LISREL VariablesControlling for Body Mass I n d e x ................... 86
vi

LIST OF FIGURES1. Conceptual Model for Anorexia Nervosa ............... 5
2. Conceptual Model for Bulimia Nervosa ............... 83. Model of Body Image Disturbances.................... 134. Relationship Between Body Image Disturbance
and Fear of Fatness................................ 155. Body Image Assessment Silhouettes
Adult F e m a l e ....................................... 22
6. Causal Model of the Development of Body ImageDisturbances and Eating Disorders inC h i l d r e n ........................................... 37
7. Body Image Assessment SilhouettesFemale Child .................................... 47
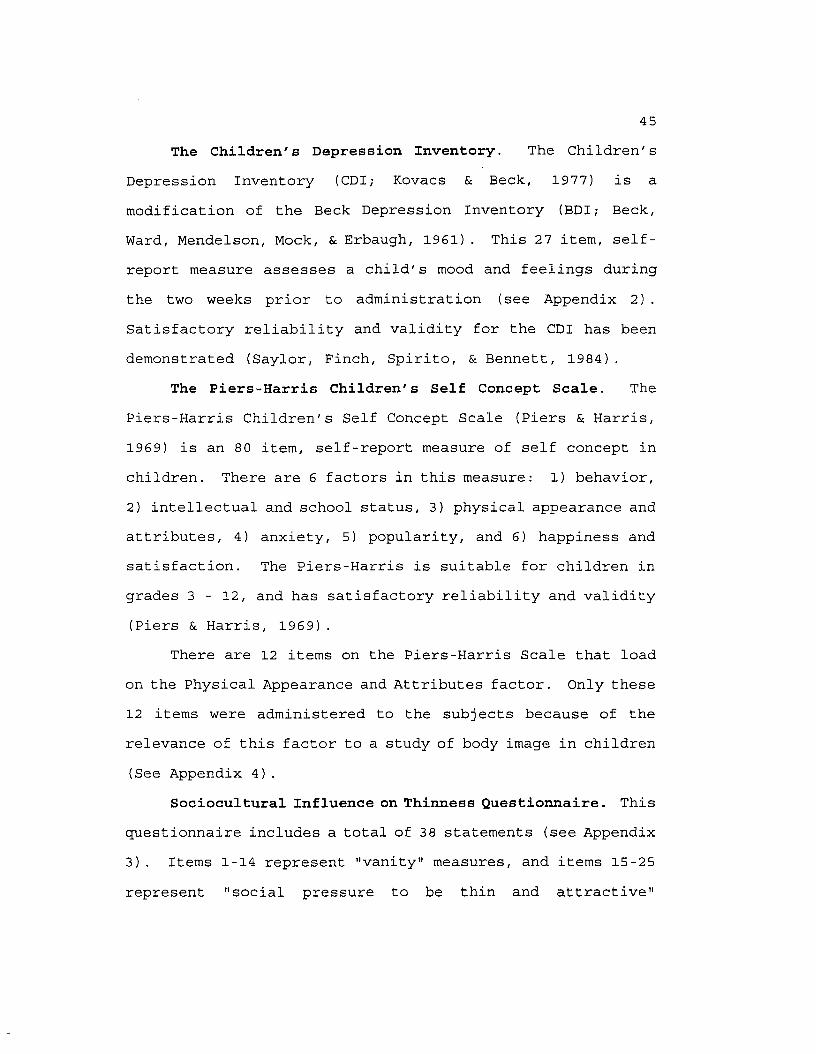
8. Body Image Assessment SilhouettesFemale Pre-Adolescent ............................ 48
9. Body Image Assessment SilhouettesMale C h i l d ......................................... 49
10. Body Image Assessment SilhouettesMale Pre-Adolescent................................ 50
11. Original Structural Model with StandardizedLISREL Estimates ................................ 81
12. Alternative Structural Model withStandardized LISREL Estimates ................... 82
vii
ABSTRACTEating disorders have been researched extensively among
adult, and, more recently, among adolescent populations. Body image disturbance is included as a diagnostic criterion for anorexia nervosa and bulimia nervosa, and has been
postulated as a central characteristic of the eating disorders. Researchers have identified eating disorders among prepubertal children; therefore, there is a need for the development of reliable and valid measures of eating disorders and body image in children. In this investigation,
a total of 257 children in grades 3 through 7 completed the Children's Eating Attitudes Test, Children's Depression Inventory, Piers-Harris Children's Self Concept Scale physical appearance and attributes items, and the
Sociocultural Influence on Thinness questionnaire. The Body Image Assessment (BIA) procedure for children and preadolescents was also administered. Results showed that 40.5% of this sample wanted to be thinner, 13.5% admitted to
caloric restriction, and 1.3% wanted to vomit after eating. Males and females had significantly different scores on the questionnaires administered, but there was not a significant effect for age, indicating that the scores of the younger subjects were not significantly different from the scores of the older subjects. The study found that separate norms were needed for the male and female child and pre-adolescent BIA procedures. Satisfactory reliability coefficients were found

for the BIA procedure. The LISREL VII program was used to test a structural model of the development of eating disorder symptoms in 3 - 7 graders. Support for the causal model that
was tested indicates that body dysphoria may be an important mediating factor between social pressure for thinness, negative affect, and negative evaluation of self in the development of eating disorder symptoms in young females. Subjects in this study were of higher socioeconomic status, and future research is needed with more representative
samples of children.
ix

INTRODUCTIONEating disorders have been researched extensively among
adult and, more recently, among adolescent populations. Few
studies have investigated the development, prevalence, and progression of eating problems and eating disorders from
middle childhood to adolescence. Until very recently, eating
disorders were thought to be rare among prepubertal children, and assessment measures were not available for this population. Recently, more attention has been focused on children who may be at risk for developing an eating
disorder.Body image disturbances are included as diagnostic
criteria for anorexia nervosa and bulimia nervosa, and have been proposed as a central characteristic of the eating disorders. Researchers have identified the presence of eating disorders among prepubertal children, as well as a preference for thinness and body dissatisfaction among children as young as 6 years old. Therefore, the earliest stages of the development of eating disorders may begin before puberty, and reliable and valid measures for the assessment of eating disorders and body image among children are needed.
The following sections summarize the literature pertaining to eating disorders and body image, and the existing literature related to children, which leads to a discussion
of the purpose of this investigation. There are several

other important factors related to the eating disorders, including physiological factors, but a review of these is
beyond the scope of this paper.Eating Disorders
Anorexia nervosa is an eating disorder characterized by extreme weight reduction methods due to a strong drive for thinness and morbid fear of fatness (Williamson, Cubic, & Fuller, 1993) . Four diagnostic criteria for anorexia nervosa are specified by the American Psychiatric Association (1994):
1) Refusal to maintain body weight at or above
a minimally normal weight for age and height (e.g., weight loss leading to maintenance of body weight less than 85% of that expected;or failure to make expected v/eight gain during period of growth, leading to body weight less than 85% of that expected).
2) Intense fear of gaining weight or becoming fat, even though underweight.
3) Disturbance in the way in which one's body weight or shape is experienced; undue influence of body weight or shape on self-evaluation, or denial of the seriousness of the current low body weight.
4) In post-menarcheal females, amenorrhea, i.e., the
absence of at least three consecutive menstrual
cycles.
3Specify type:
Restricting type: During the episode of Anorexia Nervosa, the person does not regularly engage in binge eating or purging behavior
Binge Eating/Purging type: During the episode of Anorexia Nervosa, the person regularly engages in binge eating or purging behavior.
Several theories of anorexia nervosa have been developed. Most behavioral theories have proposed that the
primary factor that causes the characteristic starvation, excessive exercise, and purgative methods of anorexia nervosa is fear of weight gain. Thus, behaviors that avoid fatness are negatively reinforced because the fear of weight gain and
associated anxiety are reduced by the occurrence of the behaviors.
An approach-avoidance conflict with food has been suggested by Holmgren, Humble et al. (1983) , in that the fearof weight gain causes an anorexic to use dietary restraint and/or purgative methods that are in conflict with food
preoccupation. Binge eating results when the approach to food is dominant, and subsequent avoidance behaviors (i.e., starvation, purging, excessive exercise) are used to reduce the fear of weight gain following binging.
Schlundt and Johnson (1990) proposed a three dimensional model of the eating disorders, with body weight, behavioral control, and body weight preoccupation representing the three

dimensions. Body weight is a continuum from extreme
emaciation to morbid obesity. Behavioral control represents
the approach-avoidance conflict, with starvation at one end and binging at the other. Body weight preoccupation includes the anxiety caused by the fear of weight gain, which motivates the individual to control eating behaviors. Therefore, in this model, anorexia nervosa is characterized by very low body weight, excessive control over eating, and
intense preoccupation with weight gain.Williamson, Davis, Duchmann, McKenzie, and Watkins
(1990) proposed that anorexia nervosa is a weight phobia, in
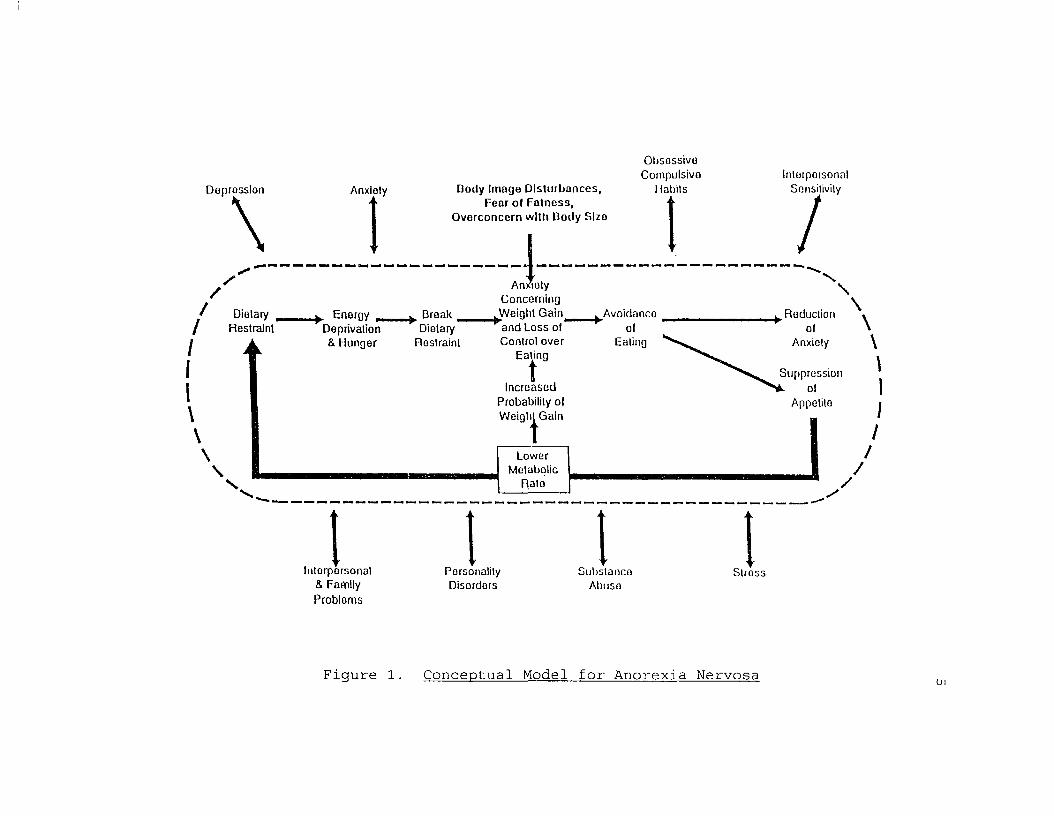
that the central characteristics of this disorder are a fear of fatness, preoccupation with body size, and body image disturbance. This model for restricting anorexics, which is illustrated in Figure 1, proposed that fear of weight gain and body image disturbances cause, an individual to use starvation, exercise, and/or purgative methods to lose
weight. Dietary restraint results in energy deprivation, hunger, and food cravings. If the individual breaks dietary restraint, overeating and binging may occur, causing anxiety about weight gain. This anxiety is reduced by subsequent dietary restraint. After a period of starvation, appetite will be suppressed, which allows the anorexic to demonstrate
greater control over eating. These restrictive eating
patterns result in a lower basal metabolic rate, which causes the anorexic to gain weight more easily, thereby reinforcing
Doprosslon\ Anxiety Body Im age D is tu rb a n c e s , F ea r o l F a tn e s s ,
O v orc o n ce rn with Dody Slzo
ObsossivoCompulsivo
Habits
// )•nxio
IIntorpoisonal
Sensitivity
/Dietary t
Restraint+ Energy _
Deprivation & Hunger
^ Break _ Dietary
Restraint
Anxioty Concerning
AA/eighl Gain^ and Loss o l ” Control over
Eating
\Avoidanco
olEaling
Reduction \\
TIncreased
Probability ol Weight Gain
Suppressionol
Appetite
t\\
V
LowerMetabolic
Rato //
IIntorporsonal
& Family Probloms
IPersonalityDisordors
Ijubs lanco
Abuso
IStross
Figure 1. Conceptual Model for Anorexia Nervosa
the fear of weight gain. In summary, the primary psychopathology of anorexia nervosa involves starvation which reduces anxiety regarding weight gain. Bi-directional arrows to variables outside the ellipse indicate the reciprocal relationship between anorexia nervosa and secondary
psychopathology. Secondary problems include depression, personality disorders, and family conflict.
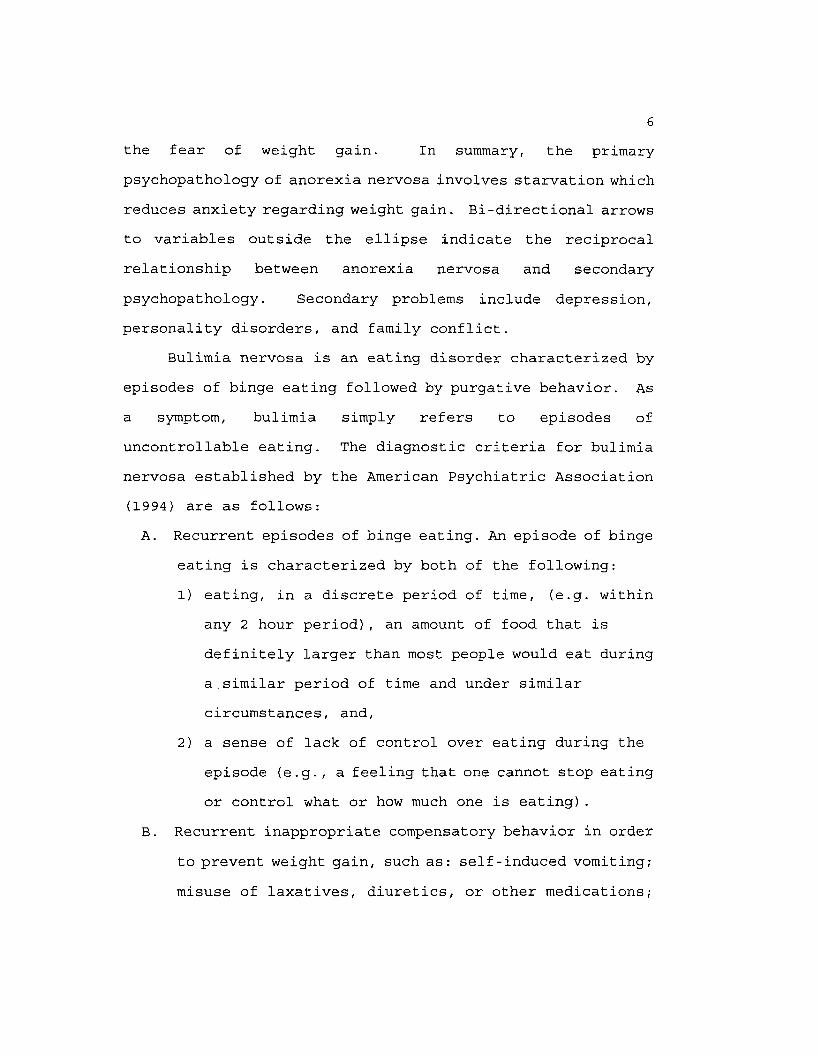
Bulimia nervosa is an eating disorder characterized by episodes of binge eating followed by purgative behavior. As a symptom, bulimia simply refers to episodes of uncontrollable eating. The diagnostic criteria for bulimia nervosa established by the American Psychiatric Association (1994) are as follows:
A. Recurrent episodes of binge eating. An episode of binge eating is characterized by both of the following:
1) eating, in a discrete period of time, (e.g. within any 2 hour period), an amount of food that is definitely larger than most people would eat during a.similar period of time and under similar circumstances, and,
2) a sense of lack of control over eating during the episode (e.g., a feeling that one cannot stop eating or control what or how much one is eating).
B. Recurrent inappropriate compensatory behavior in order
to prevent weight gain, such as: self-induced vomiting;
misuse of laxatives, diuretics, or other medications;
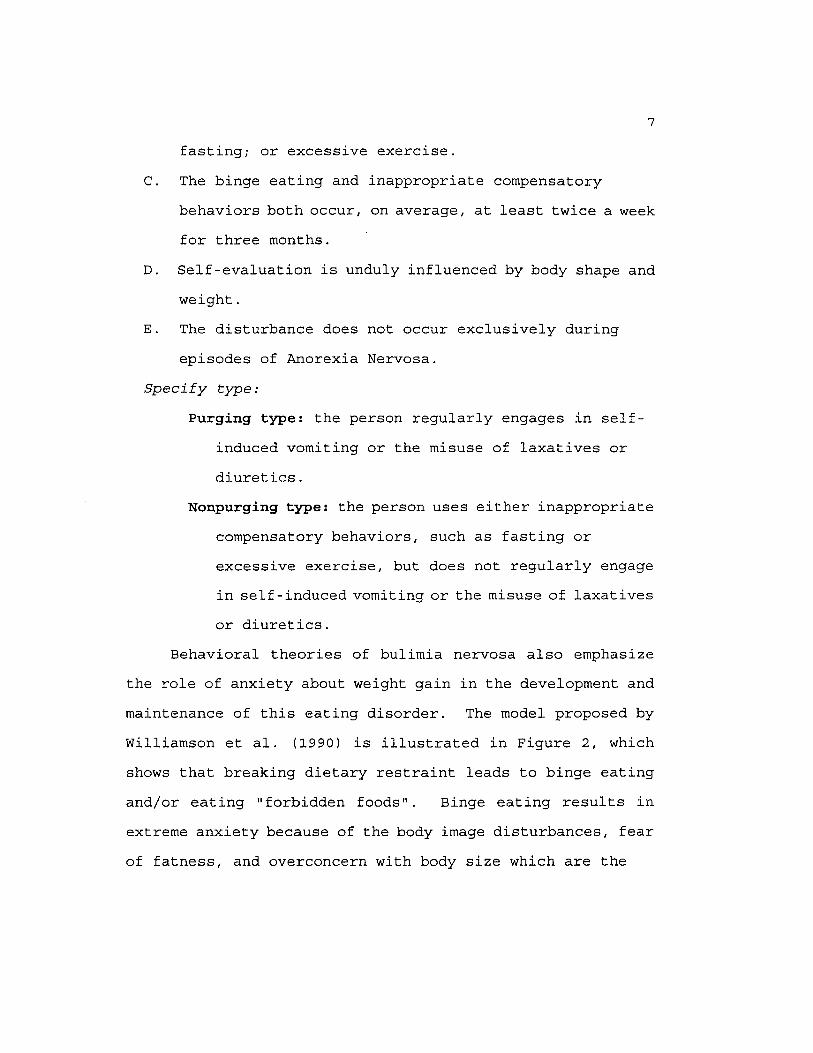
fasting; or excessive exercise.
C. The binge eating and inappropriate compensatory behaviors both occur, on average, at least twice a week for three months.
D. Self-evaluation is unduly influenced by body shape and weight.
E. The disturbance does not occur exclusively during episodes of Anorexia Nervosa.
Specify type:
Purging type: the person regularly engages in self- induced vomiting or the misuse of laxatives or
diuretics.Nonpurging type: the person uses either inappropriate
compensatory behaviors, such as fasting or excessive exercise, but does not regularly engage in self-induced vomiting or the misuse of laxatives or diuretics.
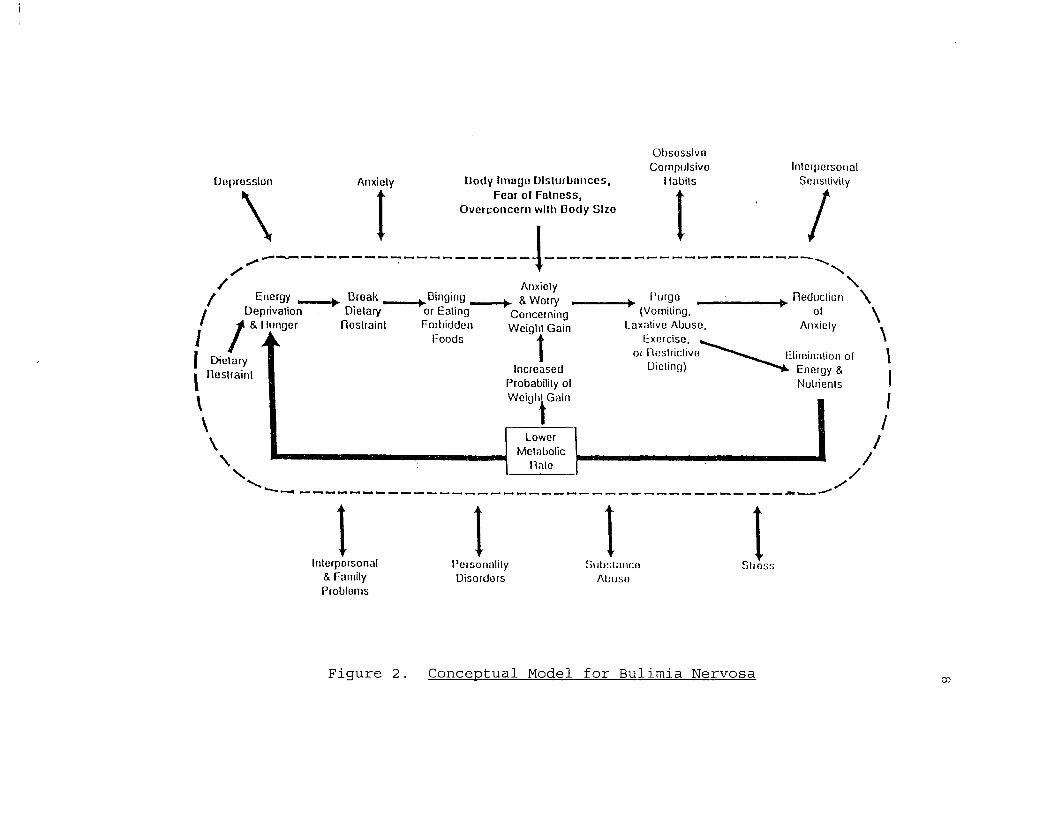
Behavioral theories of bulimia nervosa also emphasize the role of anxiety about weight gain in the development and maintenance of this eating disorder. The model proposed by Williamson et al. (1990) is illustrated in Figure 2, whichshows that breaking dietary restraint leads to binge eating and/or eating "forbidden foods". Binge eating results in extreme anxiety because of the body image disturbances, fear of fatness, and overconcern with body size which are the
Depression\ Anxicly B ody Im ago D is tu rb an ces , F ea r ol F a ln e s s ,
O v e rc o n c e rn with Dody Slzo
Obsosslvo Coinpnlsivo
I labils
//
/ Energy
I- I
/ /| Dietary
Restraint
Break _ Deprivation Dietary& Hunger Rostraint
I\
\\
^B inging or Eating Forbidden
Foods
Anxiety & Worry .
Concerning Weight Gaint
Increased Probability ol Weigli^Gain
N
LowerMetabolic
Inlerporsonal & Family Probloms
i
Purge(Vomiting,
Laxative Abuse, Exercise,
or Restrictive Dieting)
I
InterpersonalSensitivity
/X \
^ Reduction \ ol
A n x ie ty
Elimination ol Energy & Nutrients
\
//
PersonalityDisordors
S u b s t a n c e
A b u s e
ISlross
Figure 2. Conceptual Model for Bulimia Nervosa

central characteristics of the disorder. Purging via self
induced vomiting, laxative or diuretic use, fasting, and/or
excessive exercise serves to reduce this anxiety by "undoing" the effects of binge eating. Purging is, therefore,
negatively reinforced, but also causes the elimination of energy and nutrients. Thus, the bulimic is more likely to
binge again. Metabolic rate may be lowered as a result of
purging, resulting in an increased vulnerability for weight gain. The cycle of binge eating and purging becomes habitual, and is reciprocally influenced by secondary
problems such as depression, personality disorders, and interpersonal difficulties.
There is considerable empirical support for the anxiety model of bulimia nervosa. Leitenberg, Gross, Peterson, and Rosen (1984) found that bulimic subjects reported increased
anxiety after eating a large test meal without being allowed to purge. Williamson, Goreczny, Davis, Ruggiero, and McKenzie (1988) reported that heart rate and forearm electromyogram (EMG) were both elevated for bulimics after eating a test meal. Bennett, Williamson, and Powers (1989) found a negative correlation between purging frequency and
metabolic rate, making weight gain from binging more likely.
Regarding secondary psychopathology, Williamson, Kelley, Davis, Ruggiero, and Blouin (1985) found that bulimics were more neurotic, depressed, impulsive, and manipulative
compared to normal controls.
10Body Image
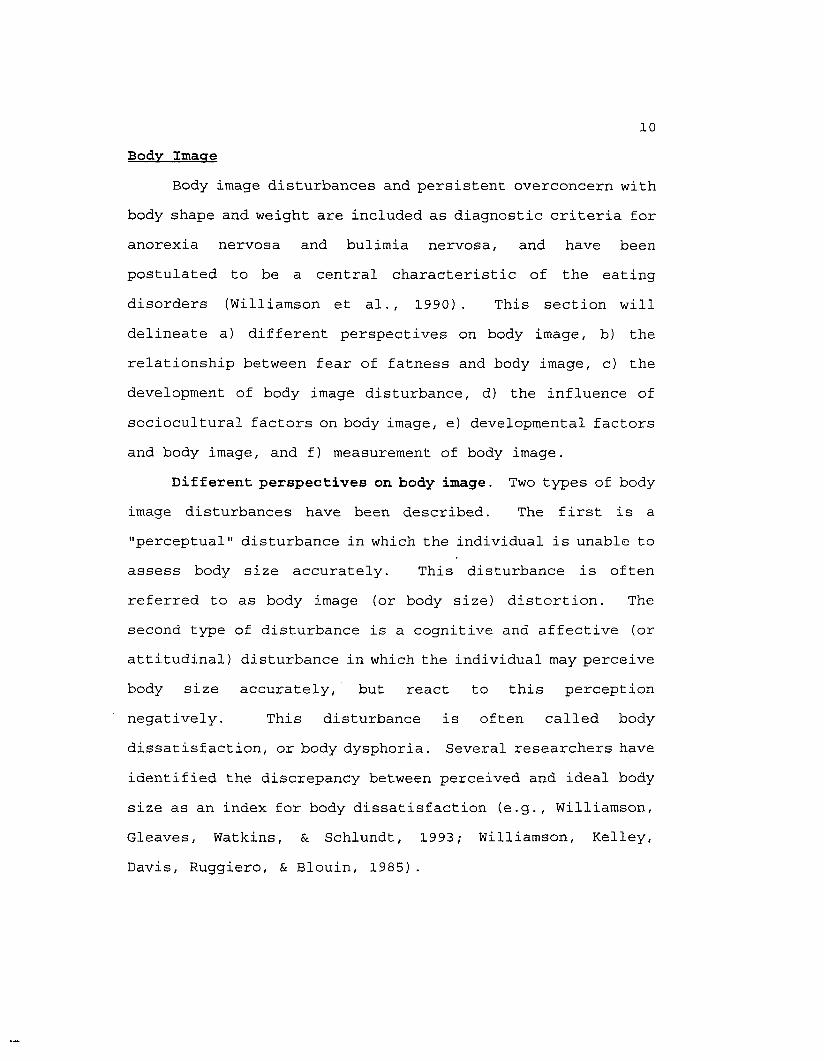
Body image disturbances and persistent overconcern with body shape and weight are included as diagnostic criteria for anorexia nervosa and bulimia nervosa, and have been postulated to be a central characteristic of the eating disorders (Williamson et al., 1990). This section willdelineate a) different perspectives on body image, b) the relationship between fear of fatness and body image, c) the
development of body image disturbance, d) the influence of sociocultural factors on body image, e) developmental factors and body image, and f) measurement of body image.
Different perspectives on body image. Two types of body image disturbances have been described. The first is a "perceptual" disturbance in which the individual is unable to assess body size accurately. This disturbance is often
referred to as body image (or body size) distortion. The second type of disturbance is a cognitive and affective (or attitudinal) disturbance in which the individual may perceive body size accurately, but react to this perception negatively. This disturbance is often called body dissatisfaction, or body dysphoria. Several researchers have
identified the discrepancy between perceived and ideal body size as an index for body dissatisfaction (e.g., Williamson, Gleaves, Watkins, & Schlundt, 1993; Williamson, Kelley,
Davis, Ruggiero, & Blouin, 1985).
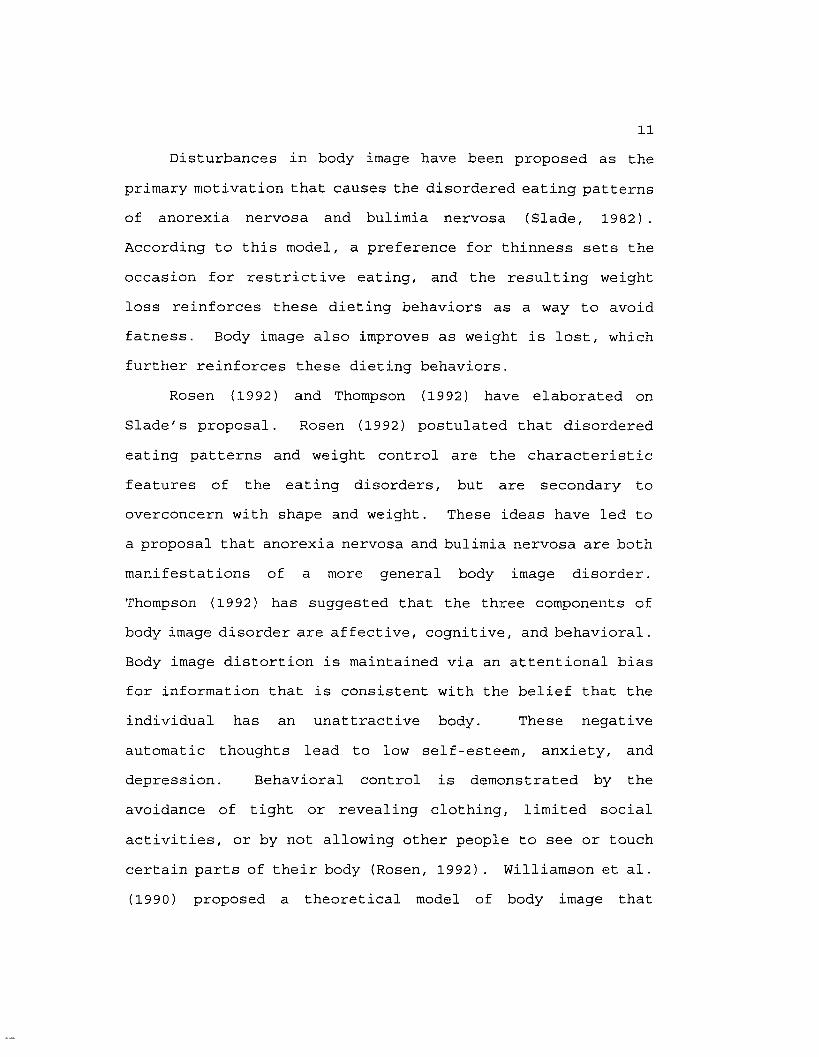
11Disturbances in body image have been proposed as the
primary motivation that causes the disordered eating patterns of anorexia nervosa and bulimia nervosa (Slade, 1982). According to this model, a preference for thinness sets the occasion for restrictive eating, and the resulting weight
loss reinforces these dieting behaviors as a way to avoid fatness. Body image also improves as weight is lost, which further reinforces these dieting behaviors.
Rosen (1992) and Thompson (1992) have elaborated on Slade's proposal. Rosen (1992) postulated that disordered eating patterns and weight control are the characteristic
features of the eating disorders, but are secondary to overconcern with shape and weight. These ideas have led to a proposal that anorexia nervosa and bulimia nervosa are both manifestations of a more general body image disorder. Thompson (1992) has suggested that the three components of
body image disorder are affective, cognitive, and behavioral. Body image distortion is maintained via an attentional bias for information that is consistent with the belief that the individual has an unattractive body. These negative
automatic thoughts lead to low self-esteem, anxiety, and depression. Behavioral control is demonstrated by the
avoidance of tight or revealing clothing, limited social
activities, or by not allowing other people to see or touch certain parts of their body (Rosen, 1992) . Williamson et al. (1990) proposed a theoretical model of body image that

12includes three components: body size distortion (perception of actual body size), preference for thinness (ideal body
size) , and body size dissatisfaction, whereby body size dissatisfaction is a function of the discrepancy between body size distortion and preference for thinness.
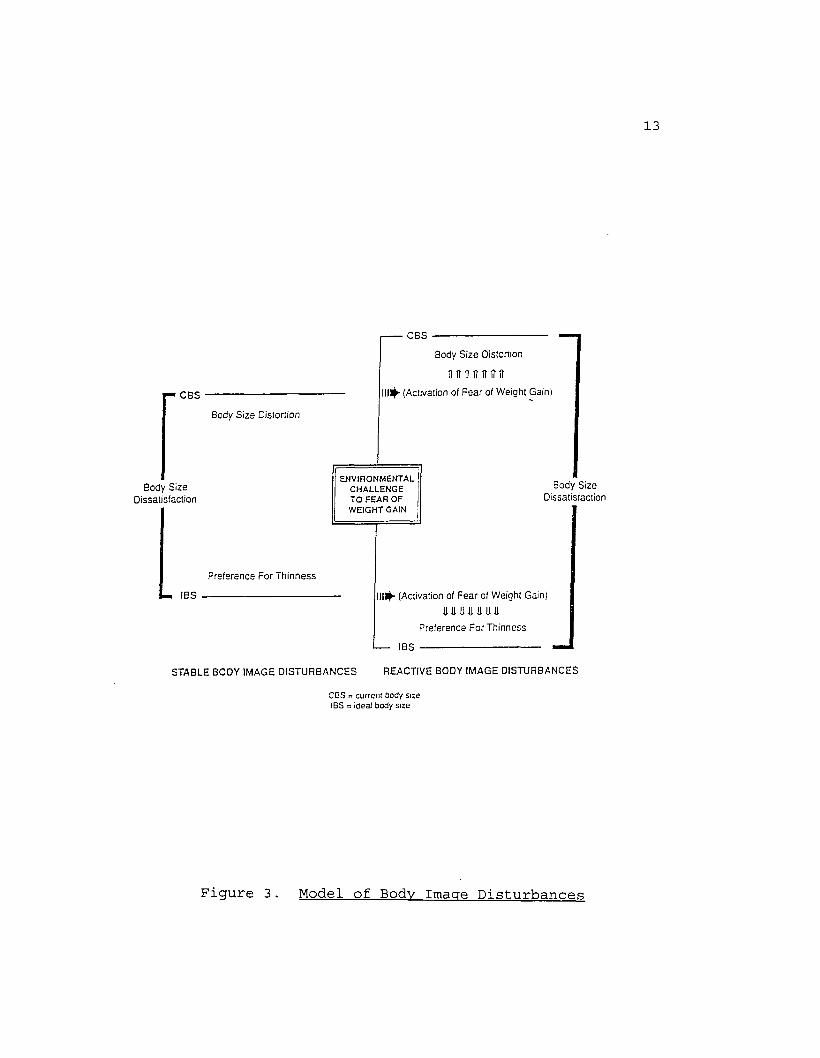
The theoretical model of body image disturbance developed by Williamson, Davis et al. (1990) is illustratedin Figure 3. This model demonstrates how body image distortion, preference for thinness, and body size
dissatisfaction interact with fear of fatness and result in body image disturbances. Body size distortion refers to the degree of perceptual accuracy of current body size (CBS), and eating disordered subjects have been found to overestimate their actual body size. Ideal body size (IBS) represents a standard that an individual chooses to compare herself to.As CBS (body size distortion) increases and IBS (idealstandard) decreases, body size dissatisfaction increases.
Within this theoretical model, body sizedissatisfaction is considered to be a dynamic variable, in that it may be influenced by environmental events that magnify an individual's fear of weight gain. Examples of such environmental events are eating, weighing, or wearing
tight clothes. This magnification of the fear of weight gain can worsen body size distortion, preference for thinness, orboth. The result is an increase in body size
dissatisfaction.
13
C B S
B ody S iz e D is io rtio n
B ody S iz e D is sa tis fa c tio n
C B S --------------------------------------------
B ody S iz e D isto rtion
i i t t i n n n r i ?11^- (A ctivation of F e a r of W eig h t G ain )
EN VIRONM ENTAL C H A L L E N G E T O FE A R O F W EIG H T GAIN
B ody S iz e D issa tis fa c tio n
P re f e r e n c e F o r T h in n e s s
IBS 1 ^ - (A ctivation of F e a r of W e ig h t G ain )
P re fe re n c e F o r T h in n e s s
IB S
ST A B L E B O D Y IM A G E D IS T U R B A N C E S R E A C T IV E BO D Y IM A G E D IS T U R B A N C E S
C B S = c u rre n t Body s ize IBS = id ea l body s ize
Figure 3. Model of Body Image Disturbances

14Evidence for the stability of IBS was found in a study
by McKenzie, Williamson, and Cubic (1993). This study also found that at pre-test, bulimics overestimated actual body size and underestimated ideal body size relative to controls matched for height and weight. Following consumption of a
test meal, the bulimics' overestimation of actual body size was enhanced, but ideal body size estimates remained stable across pre- and post-testing for both groups.
Relationship between fear of fatness and body image.A theoretical model that illustrates how a fear of
fatness results in body size distortion and a strong preference for thinness is presented in Figure 4 . This model
postulates that body image disturbances are an indirect result of a fear of fatness. Research has shown that individuals become worried and/or overconcerned about situations associated with a feared stimulus (e.g., Rescorla, 1988) and certain situations are viewed as safe or unsafe. Researchers have shown that anxious subjects have an attentional bias for threatening stimuli (e.g., Mathews & MacLeod, 1985). Similarly, an attentional bias for food words in anorexia nervosa (Channon, Hemsley, & de Silva,
1988) , and for fatness and body size stimuli in bulimia
nervosa (Ben-Tovim, Walker, Fok, & Yap, 1989; Schotte,
McNally, & Turner, 1990) has been demonstrated.
This attentional bias causes the salience of certain stimuli to be enhanced. These cues are attended to more

15
F e a r o f "F a tn e s s "
O vcrconccrn/W orry about Body Size
A tten tio n a l Bias for
’Fatness" Stimuli
TEnhancedSalience
o f’Fatness" Scimuli
Body Size
A ttentional Bias for
"Thinness" Stim uli
i fEnhancedSalience
of"Thinness" Scimuli
Strong Preference for Thinness
IncreasedDissatisfaction
w ith Body Size
Figure 4. Relationship Between Body Image Disturbance andFear of Fatness

16frequently or intensely, which causes a distortion in the
perception of these cues. Therefore, body size distortion and a strong preference for thinness result from this attentional bias for "fatness" and "thinness" stimuli, which causes increased body size dissatisfaction.
Development of body image disturbance. Thompson (1990)
has proposed a self-ideal discrepancy hypothesis which emphasizes an individual's tendency to compare his/her
appearance with an ideal. The result of this comparison is a discrepancy between the real self and ideal self, with a larger discrepancy leading to greater body dissatisfaction. Research has supported this relationship between the self- ideal discrepancy and higher levels of eating disturbance and
psychological distress (Thompson & Altabe, 1991; Thompson & Psaltis, 1988) .
Williamson, Gleaves, Watkins, and Schlundt (1993) evaluated the validity of the conceptualization of body dissatisfaction as the discrepancy between self and ideal body size estimates. Measures of self-ideal body size discrepancy were found to correlate more highly with measures of body dissatisfaction than were measures of current body size, ideal body size, body size estimation accuracy, or
indices based on actual body size. These results illustrate
how normal weight individuals may have a substantial self-
ideal discrepancy because of a biased estimate of self or
ideal.

Negative affect has also been implicated in the
development and maintenance of body image disturbance. Research has shown that non-eating disordered depressed subjects are less satisfied with their bodies and see themselves as less physically attractive than nondepressed subjects (Noles, Cash, & Winstead, 1985). An association
between depressed mood and body size overestimation has been reported in anorexic subjects (e.g., Bruch, 1962), as well as
subjects with no history of an eating disorder (e.g., Taylor & Cooper, 1986). Attie and Brooks-Gunn (1989) also reported that eating behaviors were related more to depressive
symptomatology rather than delinquency or aggression in an adolescent sample.
Influence of sociocultural factors on body image. Ntst
researchers agree that sociocultural factors play a significant role in the development of body image in western societies (Rosen, 1992; Thompson, 1990) . Recent research has documented the movement from a more curvaceous ideal to one
that is thinner and less curvaceous (e.g., Morris, Cooper, & Cooper, 1989) . Nassar (1988) found that non-Western
cultures, where thinness is not necessarily valued, have lower rates of eating disorders. The trend toward a thinness ideal in our society is alarming given the fact that women have historically altered their bodies to fit the prevailing
conception of attractiveness (Ehrenreich & English, 1978), and to increase societal acceptability (Fallon, 1990).

18Moreover, individuals are limited in the extent to which they can alter their bodies to fit a societal ideal, which places "culture in conflict with physiology" (Brownell, 1991, pg.
1) •
Developmental factors and body image. Developmental factors have been identified as possible causal factors in the development of body image disturbances. Specifically,
the time of onset of menarche (menarcheal timing) has been found to play an important role in levels of body
dissatisfaction later in life. Several researchers have found that girls who begin menstruating later in adolescence (after age 14) are less likely to evidence a body image disturbance than girls who begin menstruating before age 14. For example, Brooks-Gunn and Warren (1985) found that late
maturers had less body dissatisfaction, fewer eating disturbances, less body fat, and lower body weight than girls
who began menstruating between the ages of 11.5 and 14. Duncan, Ritter, Dornbusch, Gross, and Carlsmith (1985) found that 27% of subjects with late onset of menarche, 53% of subjects with normal onset of menarche, and 69% of subjects
with early onset of menarche wanted to be thinner. Such findings have led some researchers to conclude that girls who
begin menstruating earlier than their peers may be at risk for developing bulimia (Striegel-Moore, Silberstein, & Rodin,
1986).

19Thus far, the concept of body image and the development
of body image disturbances has been addressed. As mentioned previously, sociocultural factors have been found to play a significant role in body dissatisfaction and body image disturbance. However, virtually all young women are exposed
to the same sociocultural factors, so why isn't there an even
greater epidemic of eating disorders than has been reported?Similarly, Polivy and Herman (1985) have suggested that
dietary restraint causes binging. Why then are some
individuals successful dieters who do not binge nor develop an eating disorder? The onset of menarche has been
implicated in the development of body image disturbances, in that early maturers have higher rates of body image disturbances and disordered eating patterns than late maturers. So then, what factors differentiate early maturers
who develop body image disturbances from those who do not? Research to date has identified several factors that are related to the development of body image disturbances and eating disorders, including social pressure for thinness and menarcheal timing, but future research must begin to identify the casual factors that lead to these disturbances. Current research has suggested that the time period just before and after the beginning of puberty may be crucial for understanding the etiology of body image and eating
disturbances.
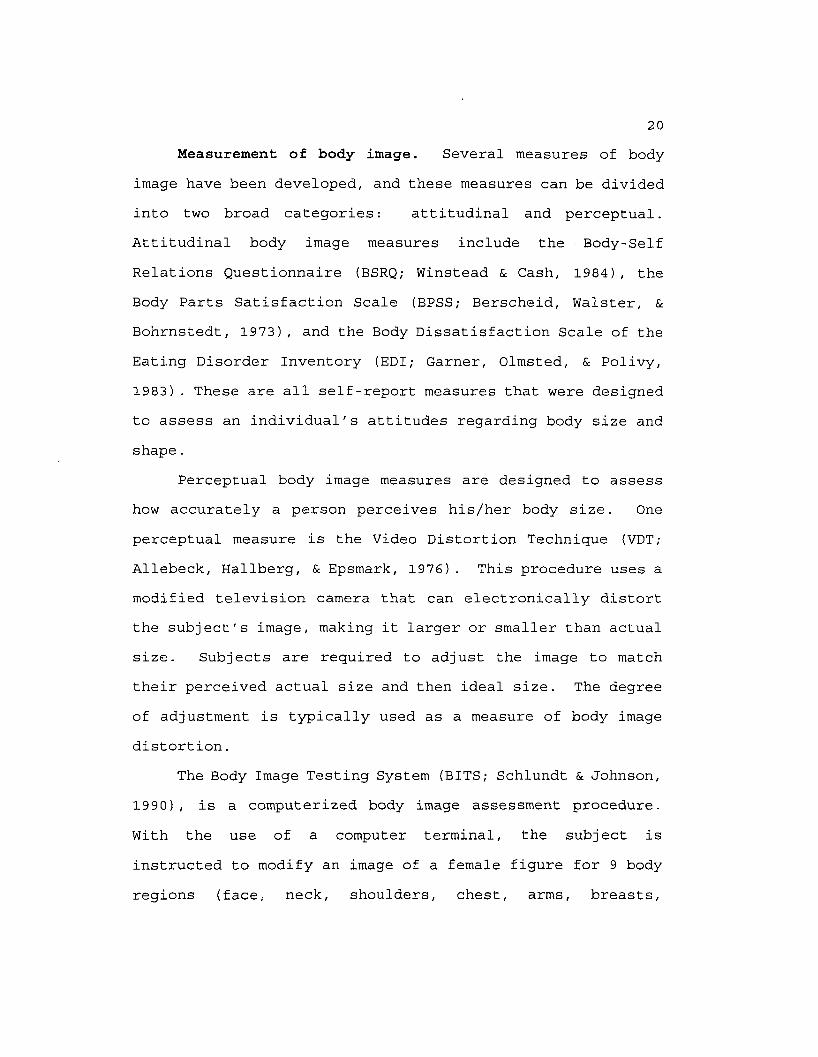
20Measurement of body image. Several measures of body
image have been developed, and these measures can be divided into two broad categories: attitudinal and perceptual.Attitudinal body image measures include the Body-Self Relations Questionnaire (BSRQ; Winstead & Cash, 1984), the Body Parts Satisfaction Scale (BPSS; Berscheid, Walster, & Bohrnstedt, 1973), and the Body Dissatisfaction Scale of the Eating Disorder Inventory (EDI; Garner, Olmsted, & Polivy, 1983). These are all self-report measures that were designed
to assess an individual's attitudes regarding body size and shape.
Perceptual body image measures are designed to assess how accurately a person perceives his/her body size. One perceptual measure is the Video Distortion Technique (VDT; Allebeck, Hallberg, & Epsmark, 1976). This procedure uses a modified television camera that can electronically distort the subject's image, making it larger or smaller than actual size. Subjects are required to adjust the image to match their perceived actual size and then ideal size. The degree of adjustment is typically used as a measure of body image
distortion.The Body Image Testing System (BITS; Schlundt & Johnson,
1990), is a computerized body image assessment procedure.
With the use of a computer terminal, the subject is
instructed to modify an image of a female figure for 9 body
regions (face, neck, shoulders, chest, arms, breasts,
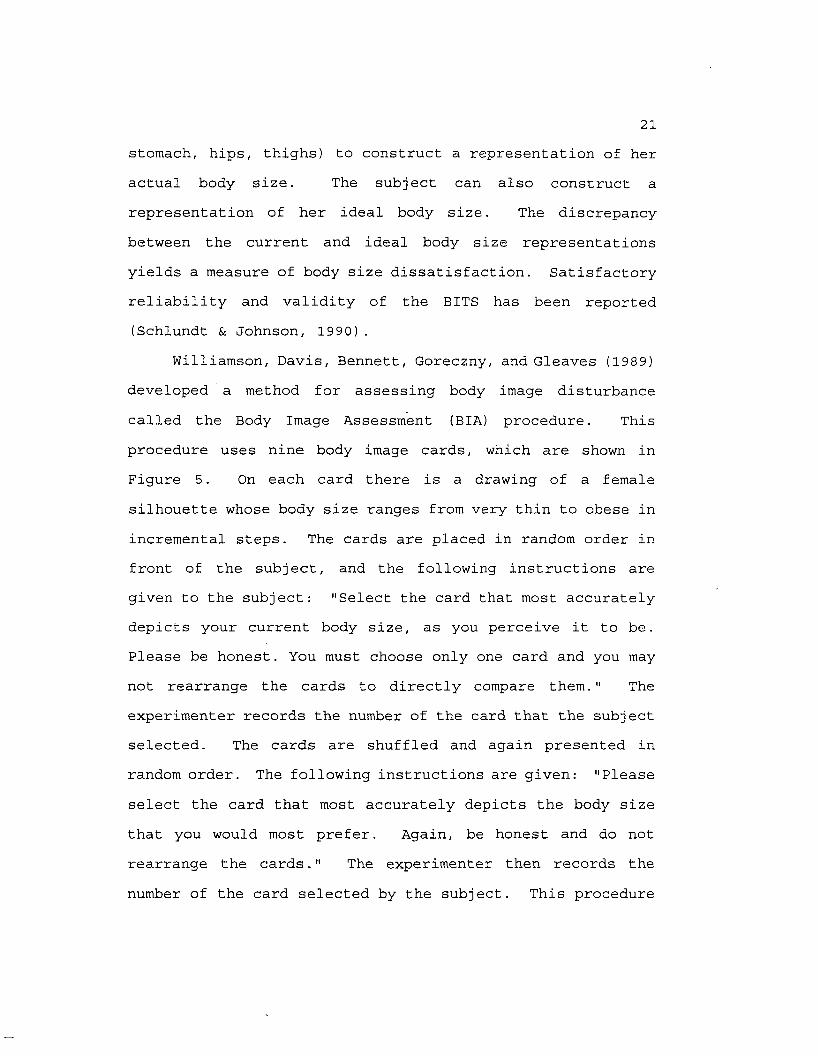
21stomach, hips, thighs) to construct a representation of her actual body size. The subject can also construct a representation of her ideal body size. The discrepancy between the current and ideal body size representations yields a measure of body size dissatisfaction. Satisfactory reliability and validity of the BITS has been reported (Schlundt & Johnson, 1990).
Williamson, Davis, Bennett, Goreczny, and Gleaves (1989) developed a method for assessing body image disturbance called the Body Image Assessment (BIA) procedure. This
procedure uses nine body image cards, which are shown in Figure 5. On each card there is a drawing of a female
silhouette whose body size ranges from very thin to obese in
incremental steps. The cards are placed in random order in front of the subject, and the following instructions are given to the subject: "Select the card that most accuratelydepicts your current body size, as you perceive it to be. Please be honest. You must choose only one card and you may not rearrange the cards to directly compare them." The experimenter records the number of the card that the subject selected. The cards are shuffled and again presented in random order. The following instructions are given: "Please
select the card that most accurately depicts the body size that you would most prefer. Again, be honest and do not rearrange the cards." The experimenter then records the number of the card selected by the subject. This procedure
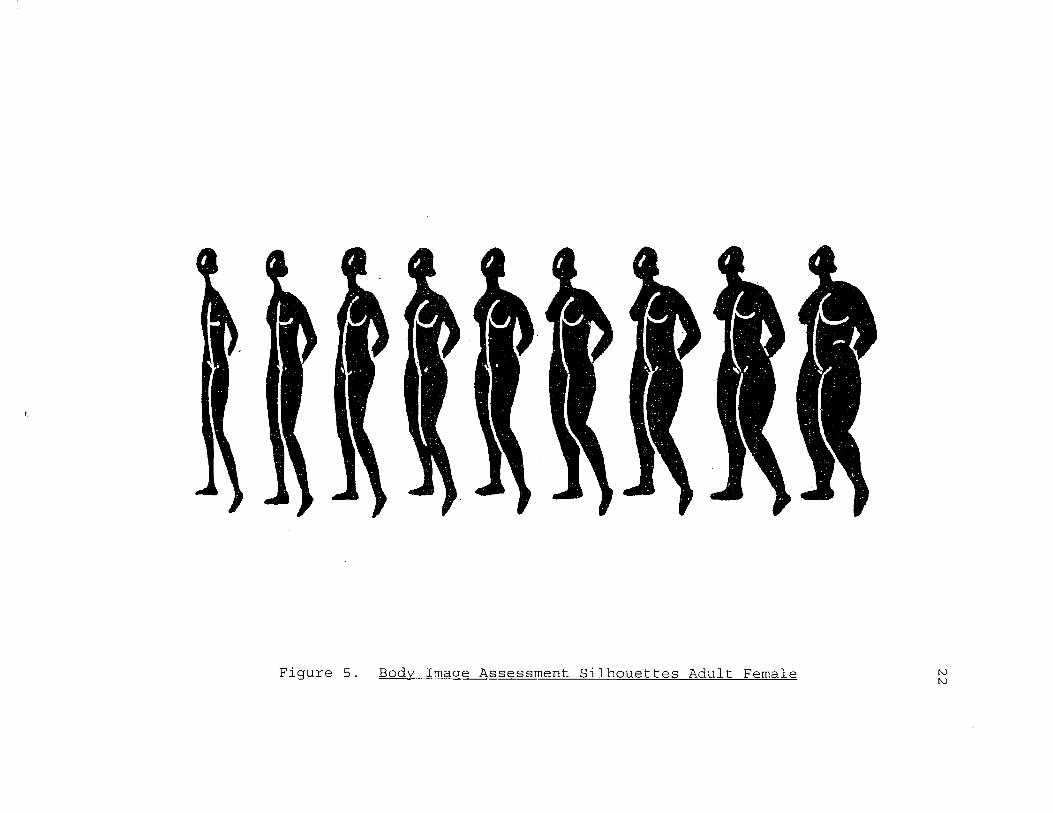
Figure 5. Body Image Assessment Silhouettes Adult Female t oto

23generally takes less than one minute, and from these data the experimenter can derive scores for current body size (CBS)
and ideal body size (IBS). The difference between CBS and IBS yields a body dissatisfaction score. Williamson, Gleaves, Watkins, and Schlundt (1993) have validated the CBS - IBS discrepancy as a measure of body size dissatisfaction.
Keeton, Cash, and Brown (1990) examined the reliability and validity of several body image assessment techniques that are frequently used in research. The authors evaluated the
Body-Self Relations Questionnaire (BSRQ), the Body Parts Satisfaction Scale (BPSS), the Mirror Focus Procedure, the Body Image Detection Device (BIDD) , and the Body Image
Assessment procedure (BIA).Results confirmed that body image is not a
unidimensional construct, and that there is an important distinction between attitudinal and perceptual assessments of body image. Specifically, the BIA Procedure was as reliable as the more elaborate BIDD caliper method. The perceptual self-estimates of the BIA procedure were also more reality based and more appropriately distinct from ideal estimates. Results showed that estimates based on the body as a whole (silhouette) may be more valid than estimates derived from
procedures such as the BIDD. The authors concluded that "this silhouette procedure is relatively simple, economical,
and is more reality based and less susceptible to the general
overestimation phenomenon so apparent with BIDD."
The results of body image assessment procedures can be
viewed within an information processing perspective
(Vitsousek & Hollon, 1990). This approach assumes that an eating disordered individual's memory store , i.e., self-schema, is highly associated with beliefs about weight. The BIA procedure provides ambiguous stimuli for the estimation of CBS, and cognitive psychologists have shown that nonclinical subjects routinely make judgment and decisionmaking errors when there is ambiguity in the experimental situation. This has been referred to as "judgment under uncertainty" (Arkes, 1991). Thus, the instructions of the
BIA would be predicted to activate body-related schema and many associations related to fatness, etc. in eating disordered subjects. Arkes (1991) refers to these
"association-based judgment errors" which in the context of BIA could yield errors such as overest.imation of CBS and underestimation of IBS. A judgment bias related to weight-
preoccupied subjects' fear of fatness has been identified in a recent study (Jackman & Williamson, 1993), providing empirical evidence for this hypothesis. Specifically, the high weight-preoccupied group was more likely to exhibit a
judgment error in response to ambiguous weight related sentences than a low weight-preoccupied group.
The previous sections have summarized the literature
regarding eating disorders and body image in adult and clinical populations. The next two sections will summarize

25the literature regarding eating patterns and body image in children and adolescents.Eating Patterns and Body Image in Adolescents
There have been several investigations regarding eating
behaviors and attitudes among adolescents. Greenfield, Quinlan, Harding, Glass, and Bliss (1987) administered an
anonymous questionnaire to 424 males and 337 females ages 13 to 19 years to assess their eating behaviors and attitudes. Results showed that preoccupation with weight, body image, diet, and eating behavior were common among this sample,
especially among the females. Specifically, they found that 44.6% of the females reported serious binge eating, 11.6% engaged in self-induced vomiting, and 39.7% fasted. An important finding of this study was that weight concerns and disordered eating habits in adolescents were more highly correlated with attitudes toward weight and appearance than with actual height/weight ratios.
A longitudinal study was conducted by Attie and Brooks- Gunn (1989) to investigate the development of eating problems
among adolescent girls. These authors measured body image, psychopathology, and eating patterns in 193 white females grades 7 through 10. Two years later, these subjects were contacted to complete the same measures.
The findings from this prospective study suggested that eating problems may develop in response to the physical changes that occur during puberty. The presence of eating

26problems was positively correlated with body fat, which typically increases significantly in females during puberty. Girls who expressed the greatest dislike for their bodies had higher scores on the Eating Attitudes Test-26, which assesses anorexic attitudes toward eating. At the 2 year follow-up, body image continued to predict eating problems, though psychopathology accounted for the greatest amount of variance in EAT-2 6 scores. The authors also found that eating behaviors were related more to depressive symptomatology rather than delinquency and aggression.
The purpose of this investigation was the prediction of change in eating behaviors among female adolescents. The
most significant finding was that body image was the only predictor of long-term change, in that the girls with the
most negative body image were more likely to develop eating problems. The results of this study also showed that having a mother who is preoccupied with thinness and who restricts her eating places a normal high school adolescent at greater
risk for restrained eating.Attie and Brooks-Gunn (1992) identified binge eaters and
dieters in a normal sample of adolescent females. Binge
eaters scored above the 65th percentile on the EAT-26 Bulimia Scale, and dieters scored above the 65th percentile on the EAT-26 Diet Scale, but did not have high Bulimia scores.
Four variables were selected for study: body image,
depressive symptoms, dating, and impulse control. Results
27showed that the variable that discriminated binge eaters from dieters was low dating frequency, followed by body image and depression, with the binge eaters more dysfunctional on all
measures. The authors did not report whether these results
were mediated by obesity.Brown, Cash, and Lewis (1989) conducted a national
survey on body image and compared female adolescent bulimics
to matched controls. In this study, bulimics differed from weight-matched controls on their dissatisfaction with current
weight, fear of weight gain, and increased sensitivity to small changes in weight. Regardless of weight, bulimics perceived their body size as heavier than did the controls, were much more anxious and preoccupied about their weight and weight gain, and reported higher dietary restraint to lose weight. Bulimics evaluated not only their physical appearance more negatively, but also their fitness level and health as well.
Taken together, this research suggests that eating problems are prevalent among adolescents, particularly females, and that the concepts of body preference and body image are significant factors in the' development of eating problems in this population. The next section will summarize the existing, but limited, research literature regarding body preference and body image in children.
28Body Preference and Body Image in Children
Early studies of body preference in children found that
children have definite ideas about physical attractiveness. Research has shown that body type and physical attractiveness are associated at least as early as age 6 (Cavior & Lombardi,
1973) . Kindergarten subjects (ages 5 - 6) can not only
distinguish chubby peers from others, but also show an aversion to looking fat (Lerner & Gellert, 1969), and demonstrate a preference for average body builds (Lerner &
Schroeder, 1971).Recent research has demonstrated that expectations
regarding thinness among females may be evident as early as
6 and 7 years of age. It has been suggested that children acquire the sociocultural values of beauty before adolescence
(Feldman, Feldman, & Goodman, 1988), and that girls learn long before puberty that beauty is a basic dimension of the feminine gender role (Freedman, 1984).
In a study of normal weight and obese girls in grades 4
through 12, Mellin (1988) found that restrained eating, fear of fatness, body image distortion, binge eating, and purging affected approximately one-third of 9 year-old girls. Wardle and Beales (1986) also found evidence that body image disturbance and body size dissatisfaction is the norm for girls ages 12 - 18, and is increasing among younger age
groups.

Using the Children's Eating Attitudes Test, Maloney,
McGuire, Daniels, and Specker (1989) found that 45% of the children surveyed in grades 3 through 6 wanted to be thinner,
whereas 37% had already tried to lose weight and 6.9% scored in the anorexia nervosa range. In a cross-sectional survey of 1118 preadolescent children (average age 7.97 years), females selected ideal-self figures that were significantly thinner than current-self. The selection of thinner figures as ideal-self occurred across all levels of weight, age, race, and school/community setting among females (Collins,
1991). Specifically, 42% of the black and white 1st, 2nd, and 3rd grade girls in this study preferred thinner body figures.
If children at such young ages clearly have preferences for a thin body size and aversion for fat body size, what is the impact on overweight youngsters? Mendelson and White (1985) examined the development of self-body-esteem, which is the physical counterpart to self-esteem, in children and adolescents. Subjects were divided into three age groups: 8.5 - 11.4 years, 11.5 - 14.4 years, and 14.5 - 17.4 years. Results showed that overweight and normal weight children had similar self-esteem at the youngest age. Self-esteem was adversely affected in overweight boys only at the middle age, and conversely, self-esteem was adversely affected in overweight girls only at the oldest age. These results suggest that not all overweight children have low self

30esteem. The authors concluded that overweight boys in the middle age may be rejected by their peers if they cannot participate in sports/activities, while older males who are viewed as strong or husky are more desirable. Conversely, while middle age overweight girls may still be able to
participate in same-sex peer activities, older overweight girls are viewed as incongruent with the slender ideal stereotype of womanhood.
Body image disturbances are related to self-esteem and eating disturbances in young females (Grant & Fodor, 1986). Research has shown that 3 - 5 year olds already have a
clearly defined body self-concept, and that at these young ages males have a more positive self-concept than females
(Story, 1979) . Fabian and Thompson (1989) reportedcorrelations between depression, self-esteem, body esteem,
eating disturbance, and teasing at very young ages (10 - 15) in a study of female adolescents. Similarly, among eating disordered subjects, bulimics and repeat dieters have lower self-esteem than non-dieters (e.g., Dykens & Gerrard,
1986) .Taken together, this research points to the differences
in weight, body size, and self-esteem across male and female
children and adolescents. Female children as young as 6 years old acquire the sociocultural influences toward thinness and have a lower body self-concept than males. This research highlights the increased vulnerability for some

31young children, especially females, to develop eating
disorders.Eating Disorders Among Children
As discussed previously, there have been several studies investigating eating problems and body image among adolescents, particularly females, and it has been suggested that the onset of puberty and the related physical changes that occur at puberty play an important role in body image
and eating disorders (e.g., Tobin-Richards, Boxer, & Peterson, 1983). However, disturbed eating patterns and body image disturbances may develop during childhood and place a child at risk for developing an eating disorder (Attie &
Brooks-Gunn, 198 9) .It is important to note that the validity of the
diagnosis of anorexia nervosa in children has been questioned because of the lower percentage of body fat in prepubertal children as well as the absence of the menstrual cycle in female prepubescents (e.g., Irwin, 1981). In addition, other disorders may be incorrectly diagnosed as anorexia nervosa in children. Jaffe and Singer (1989) identified atypical eating
disorders in 8 prepubertal children ages 5 - 11. All of these children displayed several eating disordered behaviors, including refusal to eat normal amounts or types of foods; ritualistic, obsessive behavior while eating; very slow eating, with up to 3 or 4 hours required for one meal; hiding
food; and one episode of self-induced vomiting. However,
32none of these children evidenced body image distortion or fear of fatness, and diagnoses of anorexia nervosa or bulimia
nervosa were not warranted in any of these cases.Anorexia nervosa. Blitzer, Rollins, and Blackwell
(1961) identified 15 subjects with anorexia nervosa, 9 of whom reported a prepubertal onset. Warren (1968) also identified 20 girls with a diagnosis of anorexia nervosa with
the age of onset between 10 and 16 years. Eight of these subjects were prepubertal, and 4 evidenced early pubertal development but had not begun menstruating. Fosson, Knibbs,
Bryant-Waugh, and Lask (1987) identified 48 children who were diagnosed with anorexia nervosa between the ages of 7 and 14 . Twenty-three of these subjects were prepubertal, 2 0 were
pubescent, and 5 were postpubertal.In an investigation of the development of anorexia
nervosa in younger subjects, Hawley (1985) followed 21 children who were age 13 or younger (range = 7.2 - 13.5years) at the onset of anorexia nervosa. Seven of these subjects were prepubertal, 7 evidenced secondary sexual characteristics but had not begun menstruating, and 4 were
postpubertal at onset. Individual psychotherapy was conducted with each subject. There were no deaths in this
sample, and the nutritional outcome and menstrual outcome were both good. The results of this study did not support
the view that the age of onset of anorexia nervosa has
prognostic significance.

33Among cases of anorexia nervosa in children, several key
clinical characteristics of eating disorders have been
identified. In the Blitzer et al. (1961) study, body image
distortion was reported in anorexic subjects with a prepubertal onset, while in the Fosson et al. (1987) study, half of the anorexic sample had distorted body image
regardless of pubertal status. In addition, a fear of fatness was documented in both the Fosson et al. (1987) and
Warren (1968) studies. Blitzer et al. (1961) also identified preoccupation with food and food-related behaviors as well as premorbid feeding difficulties in this sample of anorexic children.
Another issue related to the diagnosis of anorexia nervosa in prepubertal children is the prevalence rate for boys. For example, Fosson et al. (1987) identified 7prepubertal and 6 pubescent boys but no postpubescent boys who were diagnosed with anorexia nervosa. Similarly, Hawley (1985) identified 4 prepubertal male anorexics, which was 19%
of the total sample. Jacobs and Isaacs (1986) designed a study to directly compare prepubertal and postpubertal children diagnosed with anorexia nervosa, and found only 1 postpubertal anorexic boy compared to 6 prepubertal anorexic boys.
In summary, the literature on anorexia nervosa in
children demonstrates that there are both atypical as well as typical cases of anorexia nervosa in young children, and that

34body image distortion and a fear of fatness have been identified in these anorexic children. Additionally, the
prevalence rates for anorexic prepubertal boys are quite surprising in light of the prevalence rates for anorexic adolescent and adult males. Further research is needed regarding children diagnosed with anorexia nervosa, as well as factors associated with the discrepant prevalence rates for males.
Bulimia nervosa. The diagnosis of bulimia nervosa in children has received very little attention in the eating disorder literature; therefore, very little is known about the incidence of bulimia nervosa in this population. Problems regarding the diagnosis of bulimia nervosa in children include the validity and accuracy of self report regarding binging and purging behaviors, as well as the ability of a child to manifest such a secretive disorder. Currently, it is unclear whether bulimia nervosa is a rare occurrence in preadolescent populations, or if it has just gone undetected thus far.
Though it is unclear whether the syndrome of bulimia
nervosa actually occurs among children, bulimic behaviors have been reported in the literature. For example, Fosson
et al. (1987) reported that 40% of their anorexic sampleengaged in self-induced vomiting, 33% exercised excessively,
13% demonstrated a binge eating pattern, and 8% abused laxatives.
35Purpose of the Present Investigation
The purpose of the present investigation was to: 1)develop norms for the Body Image Assessment procedure for
children and pre-adolescents, 2) evaluate the reliability and
validity of this new body image assessment procedure, 3) examine the prevalence of eating disorder pathology in this sample, 4) test a causal model of the development of body image disturbances and disordered eating in preadolescent children.
The term LISREL stands for linear structural relations. LISREL is a specific program for structural equation modeling developed by Joreskog and Sorbom (1989). The technique is also referred to as causal modeling, or as analysis of
covariance structures. Structural equation modeling can be viewed as the merging of two statistical approaches, confirmatory factor analysis and path analysis (Shatford & Evans, 1986) . This approach has an advantage over path analysis because it allows for errors in the measurement of variables, without assuming that any one variable is perfect (Shatford & Evans, 1986) .
The purpose of structural modeling is to provide a means of estimating the relationships among the underlying constructs of a hypothetical model. Maximum likelihood estimations are used to estimate the parameters of the model in an attempt to establish the validity of the hypothesis of
no differences between the data and the model. Specifically,
36comparisons are made between the observed data covariance matrix with the matrix implied by the model to determine if
the two are significantly different.
Within structural modeling, the various measures (indicator variables) are hypothesized to assess different
constructs (latent variables). The structural model is the hypothesized causal pattern of the latent variables. There are two kinds of latent variables in a structural equation
model: exogenous, which represent independent variables, andendogenous, which represent dependent variables.
After LISREL computes the maximum likelihood estimates of the model parameters, several indices are produced to
determine the fit of the model. The adequacy of the measurement model can be determined by examining squared
multiple correlations for each variable and the coefficient of determination for all of the observed variables jointly. The LISREL program also provides several indices of how well the data fit the model. Both the overall fit of the model
and the fit of the individual components of the model are examined in LISREL. It is generally accepted that several
indices should be examined to determine the overall fit of a model (Hayduk, 1989) .
The causal model that was tested in this investigation had six variables: social pressure for thinness, negative
affect, evaluation of self, puberty, body dysphoria, and
eating disorder symptoms (see Figure 6).

37
8oola l P raaau ra (or
Th lnneaa
Evaluation
of Sa if
BodyDysphoria
Eating Disorder
Symptoms
Nagatlva Aitaat
Figure 6. Causal Model of the Development of Body Image Disturbances and Eating Disorders in Children
38Social pressure for thinness was included because
sociocultural factors have been found to play a significant role in the development of body image (e.g., Rosen, 1992).
However, virtually all young women are exposed to the same
sociocultural factors, but not all women develop an eating disorder. Social pressure for thinness was represented by
scores on the Sociocultural Influences on Thinness questionnaire (see Appendix 3) .
Negative affect is often associated with the eating
disorders (e.g. Altshuler & Weiner, 1985), and research has shown that non-eating disordered depressed subjects are less satisfied with their bodies and see themselves as less physically attractive than nondepressed subjects (Noles,
Cash, & Winstead, 1985) . The relationship between negative affect, body image, and eating patterns was examined, as well
as the role that negative affect plays in the development of body image disturbances and eating disorders. Negative affect was represented by scores on the Children's Depression Inventory (see Appendix 2).
Body image is closely related to self-esteem and eating disturbance in young females (Grant & Fodor, 1986); therefore, a measure of self-esteem regarding physical
appearance was included as a variable in this model. This variable was represented by scores on the Physical Appearance
and Attributes factor of the Piers-Harris Children's Self-
Concept Scale (see Appendix 4) .

The onset of puberty in females has been identified as a predisposing factor for the development of eating disorder symptoms (Attie & Brooks-Gunn, 1989) . Although all females
enter puberty, not all females develop eating problems in response to the physical changes that occur during puberty. We were interested in identifying any differences in body
image and eating patterns that occur between females who have and have not begun menstruating, as well as the causal impact
that the onset of menarche has on the development of body image and eating disorders. Female subjects were asked if, and when, they had begun menstruating. Therefore, the presence or absence of menstruation defined the puberty variable.
A casual model of the aforementioned variables was tested as a determinant of body dysphoria. Body dysphoria was defined as the discrepancy between Current Body Size (CBS) and Ideal Body Size (IBS) obtained from the Body Image Assessment procedure.
Finally, the association of body dysphoria and eating disorder symptoms was tested to examine whether body dysphoria was a mediating variable between social pressure for thinness, negative affect, negative evaluation of self,
and puberty on the development of eating disorders. Eating disorder symptoms were represented by scores on the Children's Eating Attitudes Test (see Appendix 1).
40Studies investigating eating problems and eating
disorders in younger populations have demonstrated that anorexia nervosa does occur in prepubertal children (Blitzer
et al., 1961; Hawley, 1985). However, there are fewassessment measures available for use with children, and
research in this area must expand if effective interventions for children with eating disorders are to be developed.
The primary purpose of this investigation was to develop
a Body Image Assessment (BIA) procedure for children and preadolescents based on the Williamson et al. (1989) BIA
procedure for adults. Four sets of silhouette cards were generated for use with prepubertal children and pubescent children, one set each for males and females. Attie and Brooks-Gunn (1989) reported that body image was the only significant predictor of change in eating behaviors among adolescents, in that girls with the most negative body image were more likely to develop eating problems. In this study,
the BIA procedure was administered to all subjects to obtain a measureof body size dissatisfaction and body image distortion.
Studies have shown that children as young as age 6 have
definite ideas about physical attractiveness (Cavior & Lombardi, 1973), and also show an aversion to looking fat (Lerner & Gellert, 1969) . In addition, a fear of fatness has been documented in studies of anorexic children (Fosson et al., 1987; Warren, 1968), as well as preoccupation with food

41and food-related behaviors (Blitzer et al., 1961). In order to assess eating attitudes, dieting behaviors, and food
preoccupation, the Children's Eating Attitudes Test (ChEAT;
Maloney et al. , 1989) was administered to all subjects inthis study (see Appendix 1).
Depression is often associated with the eating disorders (e.g., Altshuler & Weiner, 1985), and research has shown that
non-eating disordered depressed subjects are less satisfied with their bodies and see themselves as less physically attractive than nondepressed subjects (Noles, Cash, & Winstead, 1985) . An association between depressed mood and body size overestimation has been reported in anorexic subjects (e.g., Bruch, 1962), as well as subjects with no history of an eating disorder (e.g. Taylor & Cooper, 1986). Attie and Brooks-Gunn (1989) also reported that eating behaviors were related more to depressive symptomatology rather than delinquency or aggression in an adolescent sample. In this study, the Children's Depression Inventory (CDI; Kovacs & Beck, 1977) was used to obtain a measure of depression (see Appendix 2).
Sociocultural factors have been found to play a significant role in the development of body image (Rosen,
1992; Thompson, 1990). Research has shown that the ideals presented in our society by the media have become progressively thinner (e.g., Morris, Cooper, & Cooper, 1989), and that females alter their bodies to fit the prevailing
42concept of attractiveness (Ehrenreich & English, 1978). In order to assess social pressure to be thin, the Sociocultural Influences on Thinness questionnaire was administered to female subjects (see Appendix 3).
Body image disturbance is closely related to self-esteem and eating disturbance in young females (Grant & Fodor,
1986) . Research has shown that 3 - 5 year olds have a clearly defined body self-concept, and that at these young
ages males have a more positive self-concept that females (Story, 1979). Fabian and Thompson (1989) reported
correlations between depression, self-esteem, body esteem, eating disturbance, and teasing at very young ages (10 - 15) in a study of female adolescents. Similarly, among eating disordered subjects, bulimics and repeat dieters have lower self-esteem than non-dieters (e.g., Dykens & Gerrard, 1986) .
In this study, the Physical Appearance and Attributes factor items of the Piers-Harris Children's Self-Concept Scale (Piers & Harris, 1969) were administered to all subjects to obtain a measure of self-esteem.
One limitation of this study was the somewhat nonrepresentative sample of subjects studied. The subjects
attended either the University Laboratory School or Christian Life Academy in Baton Rouge, and both are private elementary
schools. These students are not a representative sample of 3rd through 7th graders. However, anorexia nervosa and bulimia nervosa have been found to have similar clinical
characteristics independent of racial origin, and it appears
that higher socioeconomic status (SES) is an important factor that results in an increased vulnerability for the development of an eating disorder (Anderson & Hay, 1985).
Therefore, if children who are at risk for developing an
eating disorder were to be identified, we were more likely to find them in samples of higher SES children. The results of
this study generalize only to higher SES 3rd through 7th graders, and future research will be needed with more representative samples of children.
METHODSubjects
A total of 257 subjects participated in this study. Subjects were both male and female students in grades 3
through 7 at the University Laboratory School and Christian Life Academy in Baton Rouge, Louisiana. Consent forms explaining the purpose and procedure of this study were received from each child's parent/guardian prior to data collection (see Appendix 5) . Descriptive data for this sample are presented in the Results section.Clinical Instruments
The Children's Eating Attitudes Test. The Children's Eating Attitudes Test (ChEAT; Maloney, McGuire, Daniels, & Specker, 1989) is a 26 item, six-point, self-report measure
that assesses eating attitudes, dieting behaviors, and food preoccupation in young children (see Appendix 1). The ChEAT
is a modification of the Eating Attitudes Test (EAT; Garner Sc Garfinkel, 1979), which has been used to assess anorexic attitudes toward eating in adolescent and adult populations. Maloney et al. (1989) used simpler synonyms to replace wordson the EAT that were deemed too difficult for third and fourth grade children. A score of 20 or above is indicative of anorexic attitudes toward eating. Satisfactory
reliability for the ChEAT has been reported (Maloney, McGuire, & Daniels, 1988).
44
45The Children's Depression Inventory. The Children's
Depression Inventory (CDI; Kovacs & Beck, 1977) is a modification of the Beck Depression Inventory (BDI; Beck, Ward, Mendelson, Mock, & Erbaugh, 1961) . This 27 item, self-
report measure assesses a child's mood and feelings during the two weeks prior to administration (see Appendix 2) .
Satisfactory reliability and validity for the CDI has been
demonstrated (Saylor, Finch, Spirito, & Bennett, 1984).The Piers-Harris Children's Self Concept Scale. The
Piers-Harris Children's Self Concept Scale (Piers & Harris, 1969) is an 80 item, self-report measure of self concept in children. There are 6 factors in this measure: 1) behavior,
2) intellectual and school status, 3) physical appearance and attributes, 4) anxiety, 5) popularity, and 6) happiness and satisfaction. The Piers-Harris is suitable for children in
grades 3 - 1 2 , and has satisfactory reliability and validity (Piers & Harris, 1969) .
There are 12 items on the Piers-Harris Scale that load on the Physical Appearance and Attributes factor. Only these 12 items were administered to the subjects because of the
relevance of this factor to a study of body image in children (See Appendix 4).
Sociocultural Influence on Thinness Questionnaire. This questionnaire includes a total of 3 8 statements (see Appendix3). Items 1-14 represent "vanity" measures, and items 15-25
represent "social pressure to be thin and attractive"

46(Netemeyer, Burton, & Lichtenstein, 1993). Items 26-30 are
a measure of "social comparison" adapted from Richins (1991),
and items 31-36 are a measure of "reference/peer group influence" adapted from Beaden, Netemeyer, and Teel (1989) .
The items on this questionnaire have been validated with adult populations (Richins, 1991; Netemeyer, Burton, & Lichtenstein, 1993), and were adjusted for a third grade reading level.
The Body Image Assessment (BIA) Procedure for Children. The BIA procedure for children is a modification of the Body Image Assessment (BIA) procedure developed by Williamson et al. (1989) .This procedure involves four sets of body image cards that correspond to male and female children and pre-adolescents
(see Figures 7 - 10) . Each set includes nine body image cards, 6 inches X 9 inches, and on each card there is a
silhouette of a figure whose body size ranges from very thin to obese.
The Adobe Illustrator graphics software package was used to generate the BIA silhouettes. The number 1 and number 9
cards for each of the four sets were hand drawn and entered into the computer with the same number of control points. The computer blended between the two figures in 7 incremental
steps to yield the 9 body image cards.The BIA procedure for children involves the placement of
the nine body image cards in random order on a table or desk

Figure 7. Body Image Assessment Silhouettes Female Child
Figure 8. Body Image Assessment Silhouettes Female Pre-Adolescent-

Figure 9. Body Image Assessment Silhouettes Male Child

in front of the subject. The subject is given the following instructions: "I want you to look at all of these cards andpoint to the one that most looks like you do right now. You
can only pick one card." After the subject chooses a card, the card number, which is written on the back of the card, is recorded. The cards are then shuffled and again placed in
front of the subject in random order. The subject is then given the following instructions: "I want you to look at allof these cards and point to the one that you would most want to look like if you could look like any of these. You can only pick one card." After a card is selected, the card
number is recorded. The entire procedure should generally take about one minute. These data yield scores for current body size (CBS) and ideal body size (IBS) for each subject. A body size dissatisfaction score is derived from the difference between CBS and IBS.Procedure
A master list of all students in participating classes was obtained from the teacher, and consent forms were sent
home to parents/guardians to be returned prior to data collection (see Appendix 5). Only 15 (5.4%) of the 273
students who were eligible to participate were not given permission by parents/guardians. Of the 258 students who received permission, only 1 student refused to participate in this study. The 257 subjects who participated in this study were given the ChEAT, CDI, and Piers-Harris Physical
Appearance and Attributes items to complete during class. The Sociocultural Influence on Thinness questionnaire was
also administered to females only. The directions for all questionnaires were read to the class, and the first author remained in the classroom while subjects completed the questionnaires confidentially. During this time, the BIA
procedure was conducted with each child. The BIA cards for children were administered to the children in grades 3-6, and
the BIA cards for pre-adolescents were administered to the children in grades 5-7. Therefore, both BIA procedures were used with subjects in grades 5 and 6 to examine the
correspondence of the measures. A one-week test-retest reliability check was obtained by re-administering the BIA to 20 children in each grade. The height and weight of each subject was obtained by one experimenter, and the scale was calibrated regularly. Subjects were not allowed to remove any clothing or shoes when being weighed. Girls were asked if, and when, they had begun menstruating. A summary sheet was completed for each subject (see Appendix 6).

RESULTSDemographic Data
A total of 257 students participated in this study,
which was approved by an Internal Review Board (IRB)
committee at LSU, including 109 males and 148 females.
Subjects were students in grades 3 through 7 at the
University Laboratory School (n = 156) and Christian Life
Academy (n = 101) in Baton Rouge, Louisiana. The total
number of students participating in each grade were as
follows: Grade 3 (n = 38) , Grade 4 (n = 42) , Grade 5 (n =
79) , Grade 6 (n = 45) , and Grade 7 (n = 53) . Racial
composition of this sample included Caucasians (n = 235) ,
African Americans (n = 21) , and Hispanics (n = 1) . Of the
148 females, 39 had begun menstruating and 109 had not begun
menstruating. The means and standard deviations for height
(inches), weight (pounds), and Body Mass Index (BMI) by sex
are presented in Tables 1 and 2.
Body Mass Index (BMI) is a commonly used measure of
adiposity, or fatness, in clinical studies. Must, Dallal,
and Dietz (1991) presented reference data for sex-, age-, and
race-specific criteria for BMI. These data were based on a
large, nationally representative sample for people ages 6 -
74 years. A comparison of the BMI values from this sample
and the BMI data presented by Must et al. (1991) are shown in
Table 3. The data from this study were very similar to that
53

Table 1. Group means and standard deviations for height,weight. and Body Mass Index for females by grade and age.
Grade n Mean Height (inches)
Mean Weight (pounds)
BMI
3 19 53 .47 68.42 16.64(2.72) (14.38) (2.38)
4 23 55 .48 78 . 73 17 . 53(4.19) (19.70) (3.12)
5 49 57.73 84 . 56 18.77(2.43) (17.73) (1 .12)
6 24 61.47 104.33 19 . 15(2.78) (22.60) (3.63)
7 32 61.40 116.53 21.12(3.96) (29.39) (4.35)
Age n Mean Height Mean Weight BMI(inches) (pounds)
8-9 26 53 . 03 68 . 04 16 . 60(3.12) (14.04) (2.30)
10-11 69 57 .64 85 .10 85 . 66(2.64) (18.35) (6.78)
12-13 53 61.65 112.44 20.31(3.46) (27.43) (4.14)
Note: Standard deviations are in parentheses; BMI = Body-Mass Index.
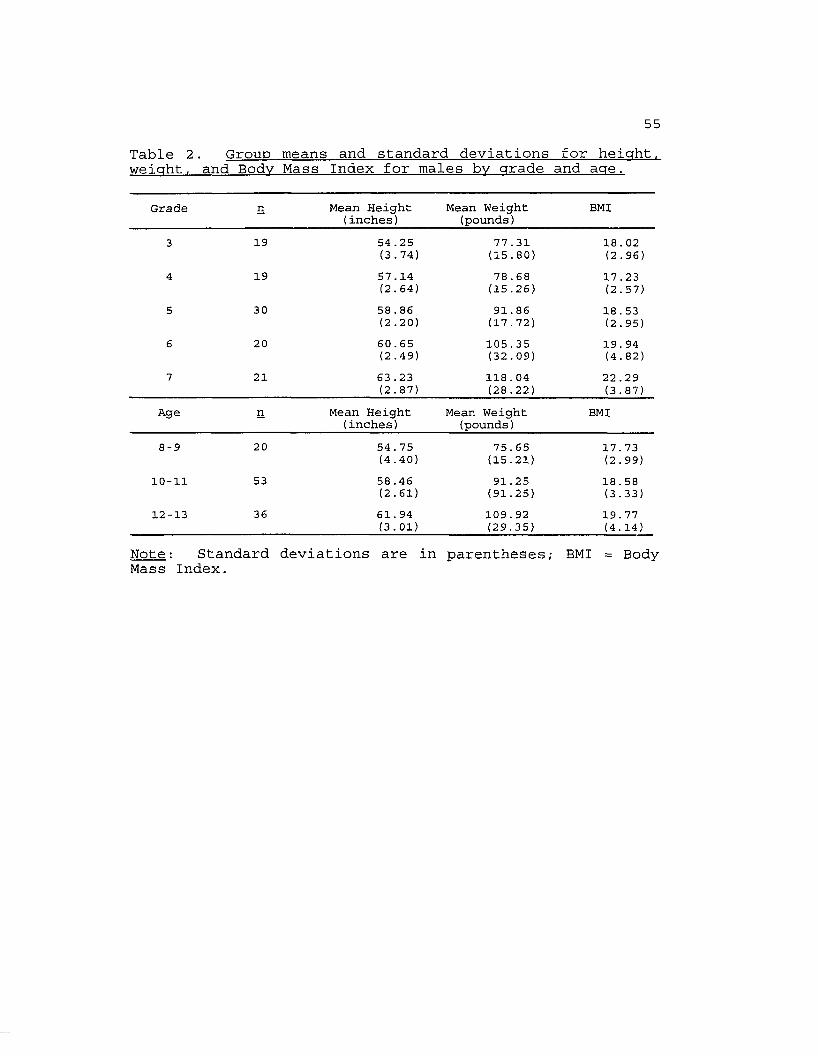
Table 2. Group means and standard deviations for height,weight, and Body Mass Index for males by grade and age.
Grade n Mean Height (inches)
Mean Weight (pounds)
BMI
3 19 54 .25 77 .31 18.02(3.74) (15.80) (2.96)
4 19 57.14 78.68 17.23(2.64) (15.26) (2.57)
5 30 58 . 86 91.86 18.53(2.20) (17.72) (2.95)
6 20 60.65 105.35 19 . 94(2.49) (32.09) (4.82)
7 21 63 .23 118.04 22 .29(2.87) (28.22) (3.87)
Age n Mean Height Mean Weight BMI(inches) (pounds)
8-9 20 54 . 75 75.65 17. 73(4.40) (15.21) (2.99)
10-11 53 58 .46 91.25 18.58(2.61) (91.25) (3.33)
12-13 36 61. 94 109.92 19 . 77(3.01) (29.35) (4.14)
Note: Standard deviations are in parentheses; BMI = BodyMass Index.

56Table 3 . Comparison of Body Mass Index (BMI) data to reference data (Must, Dallal. & Dietz. 1991).
Age (years) n Subjects' BMI Reference DataMales
8 4 16 .45 15 . 629 16 17 . 01 16 .1710 23 17.46 16 . 7211 30 18.28 17.2812 20 18 .18 17 .8713 14 19 . 22 18 . 53
Females8 7 15 . 75 15 . 669 19 16 .27 16 . 3310 38 17 . 22 17 . 0011 31 17.58 17 . 6712 32 18 . 86 18 .3513 17 20 . 96 18 . 95
Note: Median data presented for subjects' BMI in comparisonto 50th percentile reference data.

57of Must et al. (1991), though the subjects in this sample
were slightly heavier.
Questionnaire DataAll subjects completed the Children's Eating Attitudes
Test (ChEAT), Children's Depression Inventory (CDI), and Piers-Harris Physical Appearance and Attributes items.
Additionally, allfemales completed the Sociocultural Influence on Thinness (SOCI) questionnaire. The means and standard deviations for
these scores are presented in Tables 4 and 5. Across all grades, males scored higher than females on the Piers-Harris
measure of self-esteem. Females in the 6th grade had the highest ChEAT scores, and females in the 7th grade had the highest CDI scores.
Pearson product-moment correlations for the ChEAT, CDI, Piers-Harris, and SOCI questionnaires and Body Image Assessment Current Body Size (CBS) , Ideal Body Size (IBS) , and Discrepancy (DISC) scores (CBS - IBS) are presented in Table 6. Across the entire sample, scores on the ChEAT were significantly correlated with scores on the CDI, SOCI, IBS, and DISC. CDI scores were significantly correlated with
scores on the Piers-Harris, and SOCI, and Piers-Harris scores were significantly correlated with SOCI. SOCI scores were significantly correlated with IBS scores, indicating that as perceived social pressure for thinness increases, one's ideal body size becomes thinner.
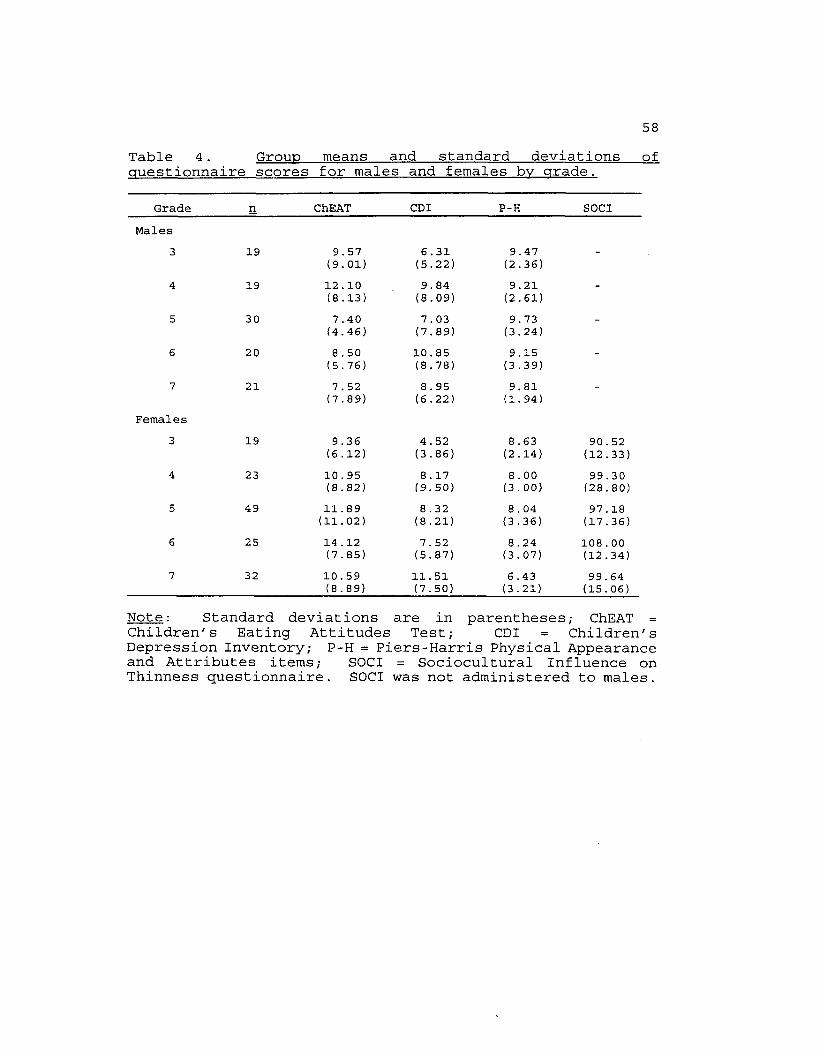
58Table 4. Group means and standard deviations ofquestionnaire scores for males and females by grade.
Grade n ChEAT CDI P-H SOCIMales
3 19 9.57(9.01)
6 .31 (5.22)
9.47(2.36)
-
4 19 12.10(8.13)
9.84(8.09)
9.21(2.61)
-
5 30 7.40(4.46)
7 . 03 (7.89)
9 . 73 (3.24)
-
6 20 8 . 50 (5.76)
10.85(8.78)
9 .15 (3.39)
-
7 21 7 . 52 (7.89)
8 . 95 (6.22)
9.81(1.94)
-
Females3 19 9.36
(6.12)4.52(3.86)
8 .63 (2.14)
90 . 52 (12.33)
4 23 10 . 95 (8.82)
8 .17 (9.50)
8 . 00 (3.00)
99.30(28.80)
5 49 11. 89 (11.02)
8 .32 (8.21)
8 . 04 (3.36)
97 .18 (17.36)
6 25 14 . 12 (7.85)
7 . 52 (5.87)
8.24(3.07)
108.00 (12.34)
7 32 10 . 59 (8.89)
11. 51 (7.50)
6 .43 (3.21)
99.64 (15.06)
Note: Standard deviations are in parentheses; ChEAT =Children's Eating Attitudes Test; CDI = Children's Depression Inventory; P-H = Piers-Harris Physical Appearance and Attributes items; SOCI = Sociocultural Influence on Thinness questionnaire. SOCI was not administered to males.

59Table 5. Group means and standard deviations ofquestionnaire scores for males and females by age.
Age n ChEAT CDI P-H SOCIMales
8-9 20 9 . 95 7 .10 9.30 -
(8.76) (6.37) (2.32)10-11 53 9 .13 8.26 9.32 -
(6.32) (7.66) (3.25)12-13 36 7 . 75 9.89 9.53 _
(7.21) (2.21) (7.79)Females
8-9 26 10.81 5.27 8.42 91.50(8.85) (6.04) (2.42) (14.06)
10-11 69 11.59 8.28 8 . 08 98.90(9.85) (8.37) (3.25) (21.54)
12-13 53 11.77 9. 98 7.11 102.92(8.64) (7.10) (3.23) (14.50)
Note: Standard deviations are in parentheses; ChEAT =Children's Eating Attitudes Test; CDI = Children's Depression Inventory; P-H = Piers-Harris Physical Appearance and Attributes items; SOCI = Sociocultural Influence on Thinness questionnaire.SOCI was not administered to males.
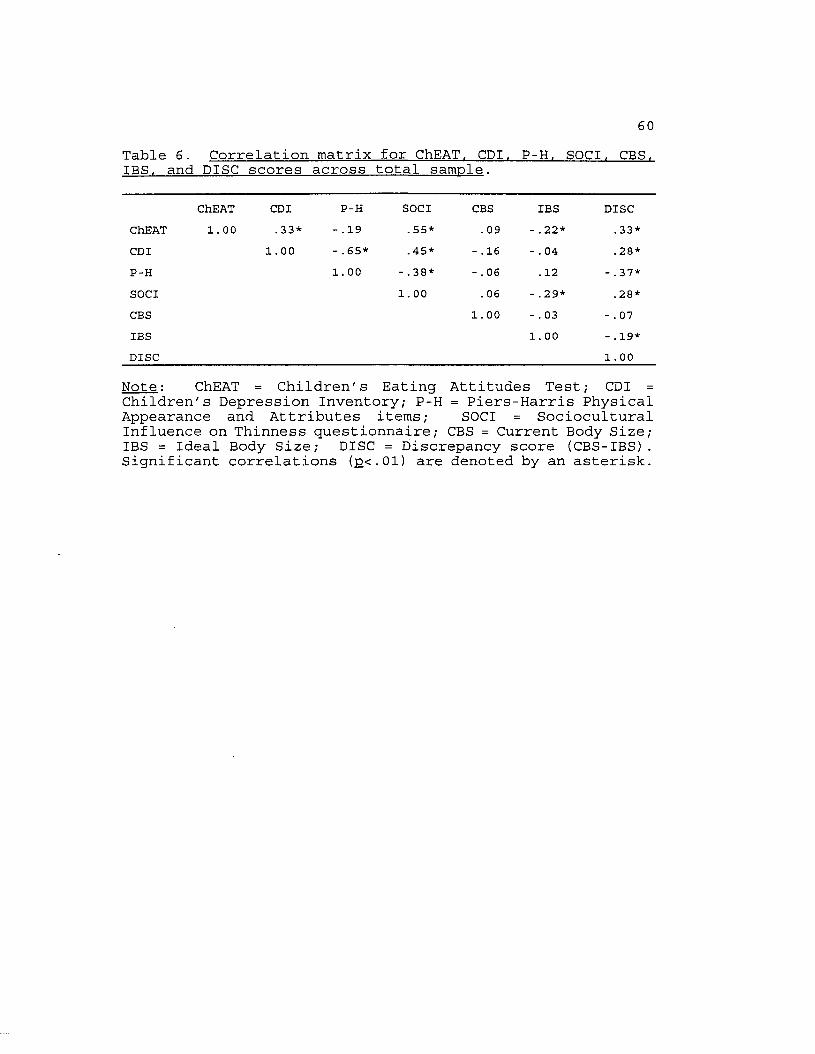
60Table 6. Correlation matrix for ChEAT. CDI. P-H. SOCI. CBS.IBS, and DISC scores across total sample.
ChEAT CDI P-H SOCI CBS IBS DISCChEAT 1. 00 .33* -.19 . 55* .09 - .22* . 33*CDI 1.00 -.65* .45* - .16 - . 04 .28*P-H 1. 00 - .38* - . 06 .12 - .37*SOCI 1.00 . 06 - .29* .28*CBS 1. 00 - . 03 - . 07IBS 1. 00 - .19*DISC 1. 00
Note : ChEAT = Children's Eating Attitudes Test ; CDI =Children 's Depression Inventory; P-H = Piers -Harris PhysicalAppearance and Attributes items; SOCI = Sociocultural Influence on Thinness questionnaire; CBS = Current Body Size; IBS = Ideal Body Size; DISC = Discrepancy score (CBS-IBS). Significant correlations (p<.01) are denoted by an asterisk.

61The child BIA cards were administered to subjects in
grades 3 - 6, and the pre-adolescent BIA cards wereadministered to subjects in grades 5 - 7 . Therefore, Pearson
product-moment correlations for the ChEAT, CDI, Piers-Harris,
and SOCI questionnaires and BIA Current Body Size (CBS) , Ideal Body Size (IBS) and Discrepancy (DISC) scores were calculated for these grades. These data are presented in Tables 7 and 8.Children's Eating Attitudes Test
The mean total score for the Children's Eating Attitudes Test (ChEAT) across the entire sample was 10.37 (S.D. = 8.46,
range = 0 - 60). Of the 257 subjects, 31 (12.1%) had scores of 20 or above. Maloney, McGuire, Daniels, and Specker
(1989) reported that 6.9% of their sample of 318 subjects in grades 3 - 6 had scores of 20 or above on the ChEAT. However, subjects in the Maloney, et al. (1989) study werestudents in public elementary schools while the subjects in this study were students in private elementary schools. Research has shown that eating concerns and dieting occur more frequently in middle and upper socioeconomic status populations. The means and standard deviations for ChEAT scores by grade and age are presented in Tables 4 and 5. Female 6th graders had the highest scores on the ChEAT, while male 5th graders had the lowest ChEAT scores. A summary of dieting behaviors and attitudes of this sample in comparison

62Table 7. Correlation matrix for ChEAT. CDI. P-H. SOCI. CBS.IBS, and DISC for grades 3 - 6 .
ChEAT CDI P-H SOCI CBS IBS DISCChEAT 1.00 .34* - . 15 . 56* .08 - . 24* .26*CDI 1. 00 - . 64* .42* - .19 - . 01 .30*P-H 1. 00 - .26* - .04 .10 - .35*SOCI 1. 00 . 05 - . 29* .23CBS 1.00 - .04 - .13IBS 1.00 - . 24*DISC 1. 00
Note : ChEAT = Children's Eating Attitudes Test ; CDIChildren's Depression Inventory; P-H = Piers-Harris Physical Appearance and Attributes items; SOCI = Sociocultural Influence on Thinness questionnaire; CBS = Current Body Size; IBS = Ideal Body Size; DISC = Discrepancy score (CBS-IBS). Significant correlations (pc.Ol) are denoted by an asterisk.

Table 8. Correlation matrix for ChEAT. CPI. P-H. SOCI. CBS.IBS, and DISC for grades 5 - 7 .
ChEAT CD I P-H SOCI CBS IBS DISCChEAT 1. 00 .25* - . 14 . 55* . n -.19 . 34*CD I 1.00 - .65* .40* - .18 -. 03 . 36*P-H 1.00 - .42* - . 07 .18 - .44*SOCI 1.00 . 08 -.31* .31*CBS 1. 00 -. 07 - . 10IBS l.00 - .11DISC 1.00
Note : ChEAT = Children's Eating Attitudes Test ; CD I =Children's Depression Inventory; P-H = Piers-Harris Physical Appearance and Attributes items; SOCI = Sociocultural Influence on Thinness questionnaire; CBS = Current Body Size; IBS = Ideal Body Size; DISC = Discrepancy score (CBS-IBS). Significant correlations (pc.Ol) are denoted by an asterisk.

64to the Maloney et al. (1989) sample is presented in Table 9.Of the 257 subjects in this sample, 40.5% wanted to be thinner, 13.5% admitted to caloric restriction, and 1.3% wanted to vomit after eating.
Multivariate Analysis of Variance (MANOVA)An age X gender MANOVA was used to compare scores on the
ChEAT, CD I, and Piers-Harris questionnaires. The
Sociocultural Influence on Thinness questionnaire was not included in these analyses because it was administered to females only. Results showed that the interaction between age and gender was not significant, (Wilk's Lambda = .976, F
(6, 496) = 1.03; p >.05) . There was a significant difference for gender, (Wilk's Lambda = .882, F (3, 248) = 11.03; p <
.01), with female subjects scoring higher on the ChEAT and lower on the Piers-Harris. There was no significant difference between males and females for CDI scores. There was not a significant effect for age, (Wilk's Lambda = .963, F (6, 496) = 1.55; p > .05), indicating that the scores ofyounger subjects were not significantly different from the scores of older subjects.Body Image Assessment (BIA) Procedure
In order to assess the reliability of administering a
BIA procedure to children as young as 8 years old, the BIA procedure was administered twice during the initial assessment to 58 subjects. In this procedure, the subject selected CBS (CBS1), the cards were shuffled, then the
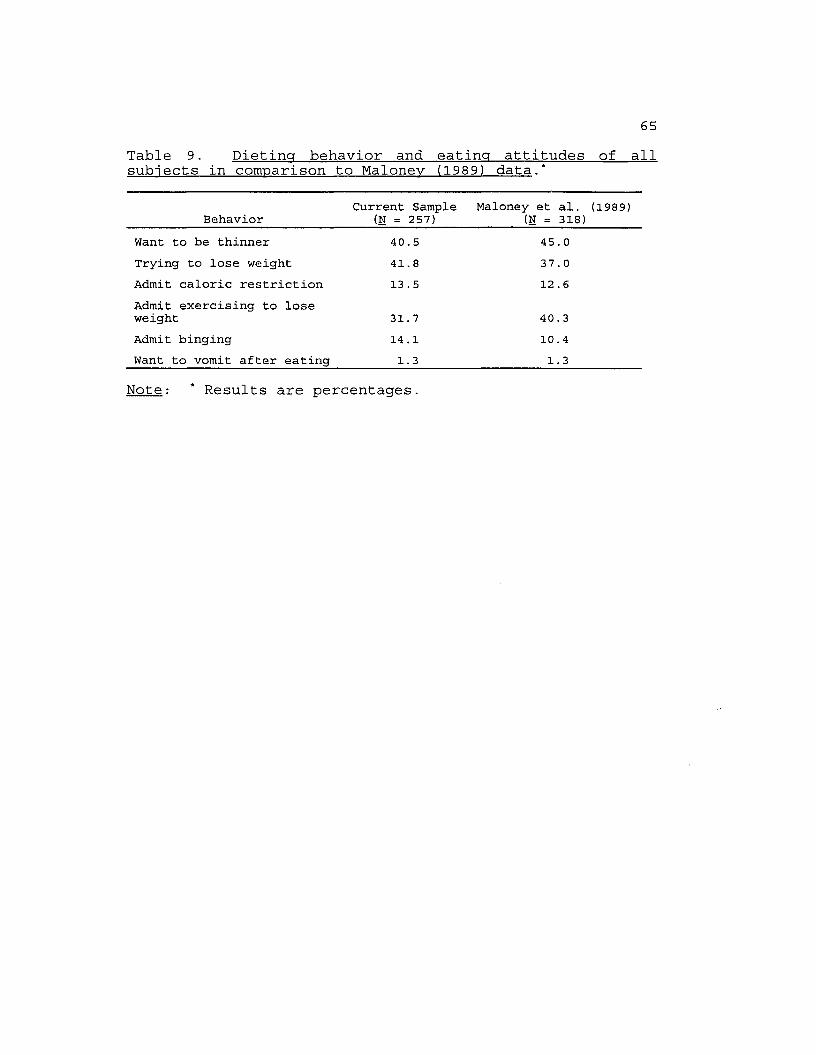
65Table 9. Dieting behavior and eating attitudes of all subjects in comparison to Maloney (1989) data.*
BehaviorCurrent Sample
(N = 257)Maloney et a l . (1989)
(N = 318)Want to be thinner 40.5 45 . 0Trying to lose weight 41.8 37.0Admit caloric restriction 13 . 5 12 . 6Admit exercising to lose weight 31.7 40 . 3Admit binging 14 .1 10.4Want to vomit after eating 1.3 1.3
Note: * Results are percentages.

66subject was again asked to select CBS (CBS2) . The same
procedure was conducted for the selection of IBS, yielding
IBS1 and IBS2. For subjects in the 5th and 6th grades (n = 17), CBS and IBS cards were selected twice from the child BIA cards (CBS1, CBS2, IBS1, IBS2), then CBS and IBS cards were
selected twice from the pre-adolescent cards (CBS3, CBS4, IBS3, IBS4).
Pearson product-moment correlations were calculated to assess the reliability of these initial BIA administrations.
Across all subjects, the correlation of CBS1 and CBS2 was .89 (p < .01) , and the correlation of IBS1 and IBS2 was .88 (p <
.01) . For the 5th and 6th graders who selected cards from both the child and pre-adolescent BIA procedure, the
correlation for the second BIA administration of CBS3 and
CBS4 was .84 (p < .01), and the correlation for IBS3 and IBS4
was .78 (p < .01) .' Examination of the correlations within each grade shows
that the younger subjects were as reliable as the older subjects. Correlations for CBS and IBS respectively for each grade are as follows: Grade 3 (1.00, 1.00); Grade 4 (.88,
.85); Grade 5 (.93, .82); Grade 6 (.77, .71); and Grade 7 (.88, .87). Taken together, these data show that subjects across all grades reliably selected CBS and IBS.
A series of t-tests were calculated to evaluate the
correspondence of the child and pre-adolescent BIA procedures. Both sets of cards were administered to 5th and
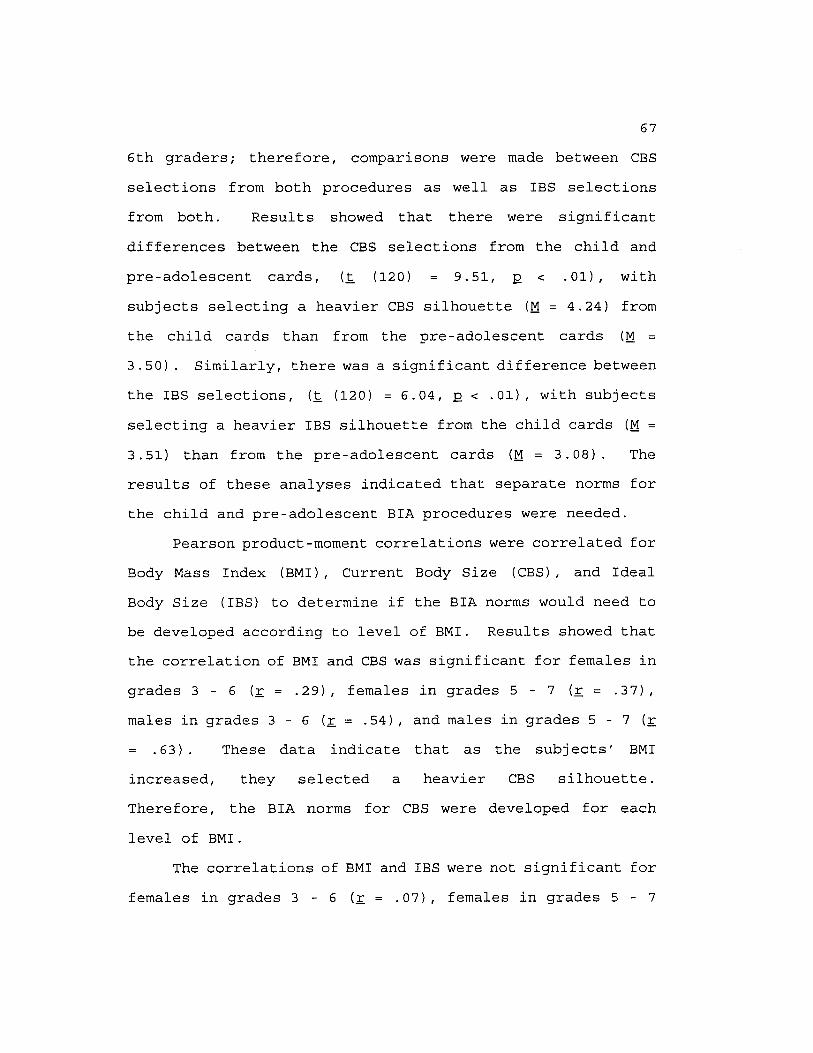
6th graders; therefore, comparisons were made between CBS selections from both procedures as well as IBS selections from both. Results showed that there were significant
differences between the CBS selections from the child and
pre-adolescent cards, (t (120) = 9.51, p < .01), with subjects selecting a heavier CBS silhouette (M = 4.24) from the child cards than from the pre-adolescent cards (M =3.50) . Similarly, there was a significant difference between the IBS selections, (t (120) = 6.04, p < .01), with subjects
selecting a heavier IBS silhouette from the child cards (M =3.51) than from the pre-adolescent cards (M = 3.08) . The results of these analyses indicated that separate norms for the child and pre-adolescent BIA procedures were needed.
Pearson product-moment correlations were correlated for Body Mass Index (BMI) , Current Body Size (CBS) , and Ideal Body Size (IBS) to determine if the BIA norms would need to be developed according to level of BMI. Results showed that the correlation of BMI and CBS was significant for females in grades 3 - 6 (r = .29) , females in grades 5 - 7 (r = .37) ,
males in grades 3 - 6 (r = .54), and males in grades 5 - 7 (r = .63) . These data indicate that as the subjects' BMI
increased, they selected a heavier CBS silhouette. Therefore, the BIA norms for CBS were developed for each
level of BMI.The correlations of BMI and IBS were not significant for
females in grades 3 - 6 (r = .07), females in grades 5 - 7

68(r = .13), males in grades 3 - 6 (r = .03), and males grades 5 - 7 (r = .07). These results indicate that the subjects' selection of an IBS silhouette did not vary as a function of BMI. Therefore, the BIA norms for IBS were generated without
taking level of BMI into account.
Norms: Norms for the BIA were calculated using T-scores, which are linearly derived scores having a distribution with a mean of 50 and a standard deviation of
10. Nine of the female subjects and 13 of the male subjects
were omitted from these analyses because there was only one subject at higher levels of BMI and a standard deviation
could not be calculated at these levels. As noted above, norms for CBS selections were generated according to BMI. The ranges of BMI for each group were: female 3 - 6 graders
(BMI = 13 - 25), female 5 - 7 graders (BMI = 14 - 23), male 3 - 6 graders (BMI = 14 - 23), and male 5 - 7 graders (BMI = 17 - 20). Norms for BIA selections of CBS are presented in
Tables 10 - 13.Norms for IBS selections for each of the four groups
were generated independent of BMI, and these data are
presented in Tables 14 - 17.Norms for the BIA procedure allow comparisons of a
subject's selection of CBS and IBS to the selections of
children of the same sex, grade, and BMI. For example, if a
female in the 4th grade with a BMI of 18 selected a CBS of 3,
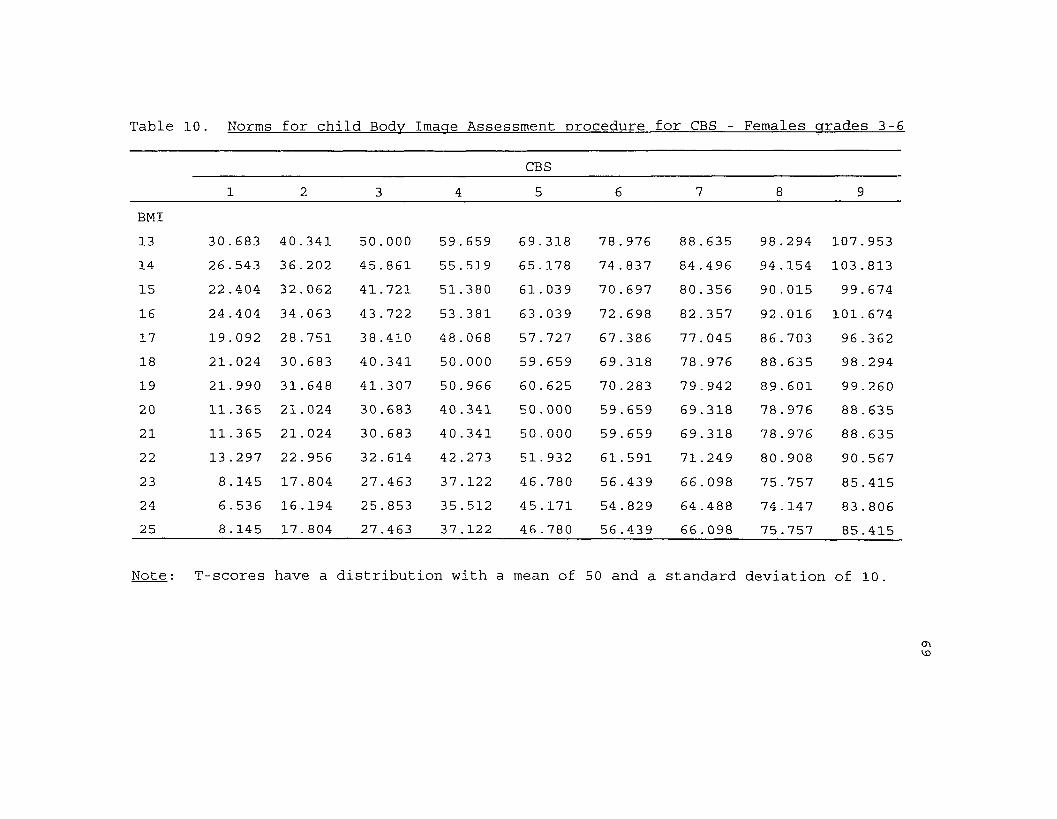
Table 10. Norms for child Body Image Assessment procedure for CBS - Females grades 3-6
CBS1 2 3 4 5 6 7 8 9
BMI13 30.683 40.341 50.000 59 . 659 69 .318 78.976 88 . 635 98.294 107.95314 26 .543 36.202 45.861 55.519 65.178 74 . 837 84.496 94.154 103.81315 22.404 32.062 41.721 51.380 61. 039 70 . 697 80.356 90.015 99.67416 24.404 34 . 063 43.722 53.381 63.039 72.698 82 .357 92.016 101. 67417 19.092 28.751 38 .410 48.068 57.727 67.386 77.045 86.703 96.36218 21.024 30 . 683 40 .341 50.000 59.659 69.318 78.976 88 . 635 98.29419 21.990 31. 648 41.307 50.966 60.625 70.283 79 . 942 89.601 99.26020 11.365 21.024 30 .683 40.341 50.000 59.659 69.318 78.976 88 .63521 11.365 21. 024 30 . 683 40.341 50 . 000 59 . 659 69.318 78.976 88 . 63522 13.297 22.956 32.614 42.273 51.932 61 . 591 71.249 80 . 908 90 . 56723 8.145 17.804 27.463 37.122 46 . 780 56.439 66.098 75 . 757 85.41524 6 . 536 16.194 25 . 853 35.512 45 . 171 54 . 829 64.488 74 .147 83 .80625 8 .145 17.804 27.463 37.122 46 . 780 56 .439 66 . 098 75.757 85 .415
Note : T-scores have a distribution with a mean of 5 0 and a standard deviation of 10 .
<J\KD
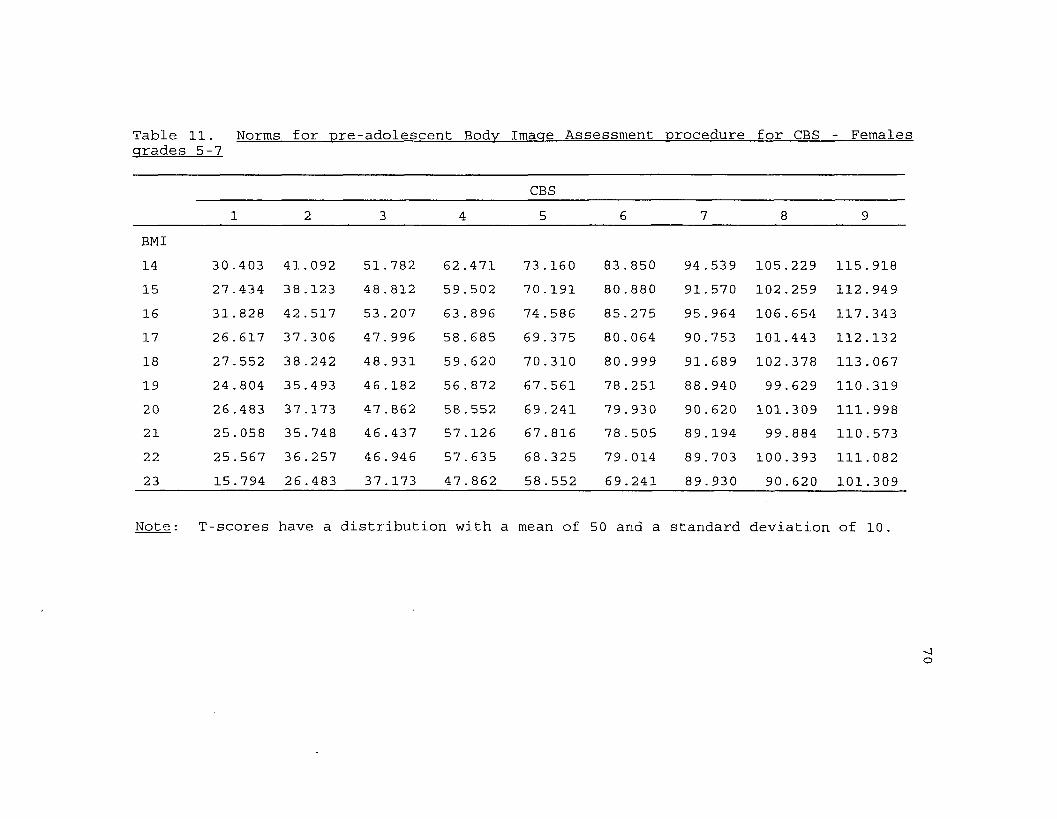
Table 11 Norms for ore -adolescent Bodv Imacre Assessment procedure for CBS - Femalesarades 5--7
CBS1 2 3 4 5 6 7 8 9
BMI14 30 .403 41.092 51.782 62.471 73.160 83 . 850 94 . 539 105.229 115.91815 27.434 38 .123 48.812 59 . 502 70.191 80 . 880 91.570 102 .259 112.94916 31.828 42 . 517 53.207 63 .896 74 .586 85.275 95.964 106.654 117.34317 26.617 37.306 47.996 58 . 685 69.375 80.064 90.753 101.443 112.13218 27.552 38 .242 48.931 59 . 620 70.310 80.999 91.689 102.378 113.06719 24.804 35 .493 46.182 56.872 67.561 78.251 88 . 940 99.629 110.31920 26 .483 37 .173 47 . 862 58.552 69.241 79 . 930 90 . 620 101.309 111.99821 25.058 35 . 748 46.437 57.126 67.816 78.505 89.194 99.884 110.57322 25 .567 36.257 46.946 57 . 635 68.325 79.014 89.703 100.393 111.08223 15.794 26.483 37.173 47.862 58.552 69.241 89.930 90.620 101.309
Note: T-scores have a distribution with a mean of 50 and a standard deviation Of 10 .
-*4O

BMI14151617181920212223
12. Norms for child Body Image Assessment procedure for CBS - Males grades 3-6
__________________________________ CBS_____________________________________1 2 3 4 5 6 7 8 9
24.945 34 .340 43 . 73619.725 29.121 38 . 51623 .521 32.917 42.31321.291 30.387 40 . 08221.813 31.209 40.60423.826 33 .222 42 . 61824.019 29 . 793 35 . 56612.417 21.813 31.20912.417 21.813 31.20915.549 24 . 945 34 . 340
53.132 62.528 71.92447.912 57.308 66.70451.708 61.104 70.50049 . 478 58.874 68 . 27050.000 59.396 68.79252.013 61.409 70 .80541. 340 47.113 52.88740 . 604 50 . 000 59 .39640 .604 50.000 59.39643.736 53.132 62.528
81.319 90.715 100.Ill76.099 85.495 94.89179.896 89.291 98.68777 . 665 87.061 96 .45778.187 87.583 96.97980 .201 89.597 98.99258 . 660 64.434 70.20768 .792 78.187 87.58368 . 792 78.187 87.58371.924 81.319 90.715
T-scores have a distribution with a mean of 50 and a standard deviation of 10.
Table 13 . Norms for ore -adolescent Bodv Imaae Assessment procedure for CBS - Malesarades 5-7
CBS1 2 3 4 5 6 7 8 9
BMI17 19 . 539 32.082 44 . 625 57.167 69 . 710 82 .252 94.795 107.338 119.88018 19 .214 31.756 44.299 56 . 841 69 .384 81. 927 94 . 469 107.012 119.55519 17 . 748 30.290 42 . 833 55.375 67.918 80.461 93.003 105 . 546 118.08920 21 . 779 34.322 46.864 59.407 71. 950 84 . 492 97.035 109.577 122.120
Note: T-scores have a distribution with a mean of 50 and a standard deviation of 10.

73Table 14 . Norms for child Body Image Assessment procedure forIBS - Females grades 3-6
IBS T-score1 25.8762 36 . 0523 46 .2284 56 .4045 66.5806 76.7557 86 . 9318 97.1079 107.283
Note: T-scores have a distribution with a mean of 50 and astandard deviation of 10.

74Table 15. Norms for pre-adolescent Body Image Assessmentprocedure for IBS -Females grades 5-7
IBS T-score1 27.9122 39.8583 51.8034 63.7485 75.6946 87 . 6397 99.5858 111. 5309 123.475
Note: T-scores have a distribution with a mean of 50 and astandard deviation of 10.

75Table 16. Norms for child Body Image Assessment procedure forIBS - Males grades 3-6
IBS T-score1 26 .. 6152 34 .. 9803 43 ..3464 51.. 7115 60 .. 0776 68 ..4427 76 ..8088 85 .. 1739 93 .. 539
Note: T-scores have a distribution with a mean of 50 and astandard deviation of 10.
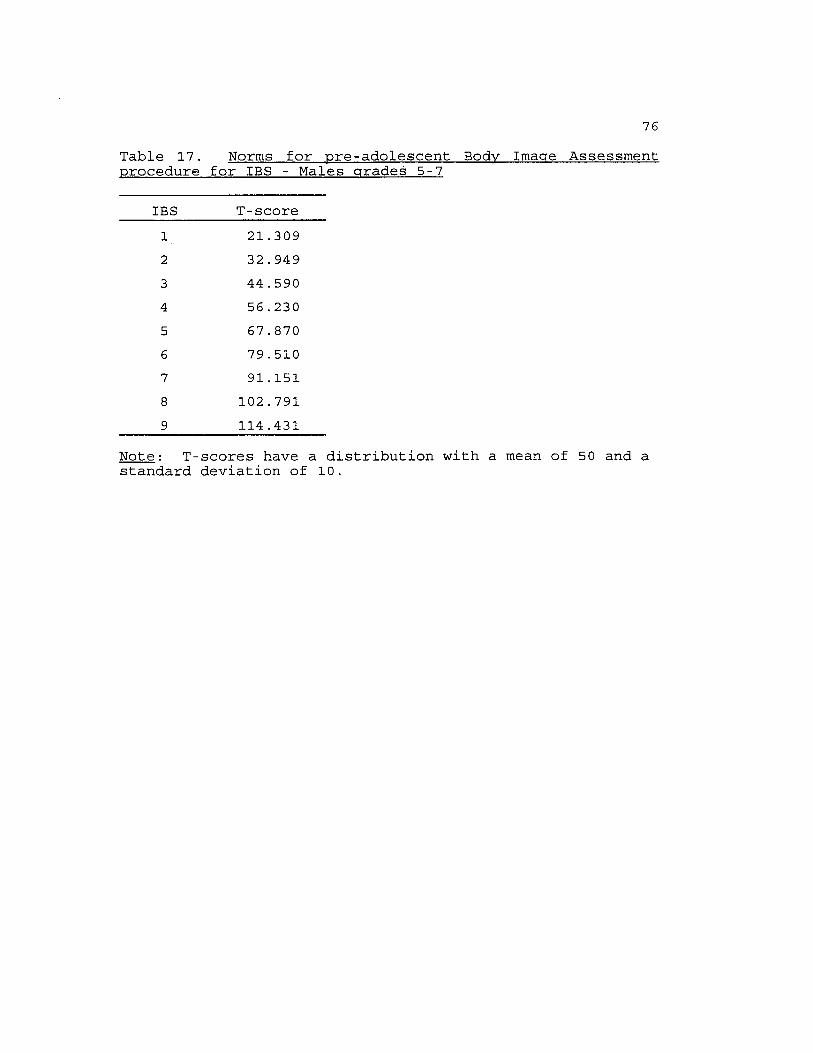
76Table 17. Norms for pre-adolescent Body Image Assessmentprocedure for IBS - Males grades 5-7
IBS T-score1 21.3092 32 . 9493 44.5904 56 .2305 67.8706 79.5107 91.1518 102.7919 114.431
Note: T-scores have a distribution with a mean of 50 and astandard deviation of 10.
77she is one standard deviation below the mean (see Table 10).Similarly, if the same subject selected an IBS of 2, she is 1.5 standard deviations below the mean (see Table 14)
compared to other females in the 4th grade.Test-retest reliability data: A one-week reliability
check was obtained by re-administering the BIA procedure to 20
subjects in each grade. Pearson product-moment correlations were calculated to obtain test-retest reliability coefficients
for CBS and IBS selections. One- week test-retest reliability coefficients for CBS selections were r = .79 (p < .01), and
for IBS selections were r = .67 (p < .01) .Satisfactory reliability coefficients were also found for
5th and 6th graders, with whom both the child and preadolescent cards were administered. For these subjects, one- week test-retest reliability coefficients for the second BIA administration were CBS r = .78 (p < .01) and IBS r = .64 (p
< . 01 ) .
Menstruation DataFemale subjects were asked if, and when, they had begun
menstruating. Of the 148 females, 39 had begun menstruating
and 10 9 had not begun menstruating. For these 3 9 subjects, the age of onset of menstruation was calculated (in months)
using the subjects' date of birth and self-reported age of
onset. Subjects' age of onset of menstruation was compared to the 1993 average age of onset (12.8 years; Rees, 1993) . This
78comparison yielded a discrepancy score for each of the 3 9 subjects.
Among this sample, 36 of the 39 subjects reported age of onset which was earlier than the national average, one subject reported menstruation onset equal to the national average, and only two subjects began menstruating later than the national average. These data are not equally distributed around the
mean; however, this is a very small sample, and these data are based on subjects' self-report.
A series of t-tests were calculated to compare BIA and
questionnaire scores for females who had begun menstruating with those who had not. Results showed that females who had
begun menstruating did not differ from those who had not on
ChEAT scores, nor did those who had begun menstruating differ from those who had not on body dysphoria (CBS - IBS). These scores are presented in Table 18.
Conversely, females who had begun menstruating had significantly lower scores than non-menstruating females on the Piers-Harris self-esteem measure, had higher scores on the Children's Depression Inventory, and had higher scores on the Sociocultural Influence on Thinness questionnaire (see Table 18) .
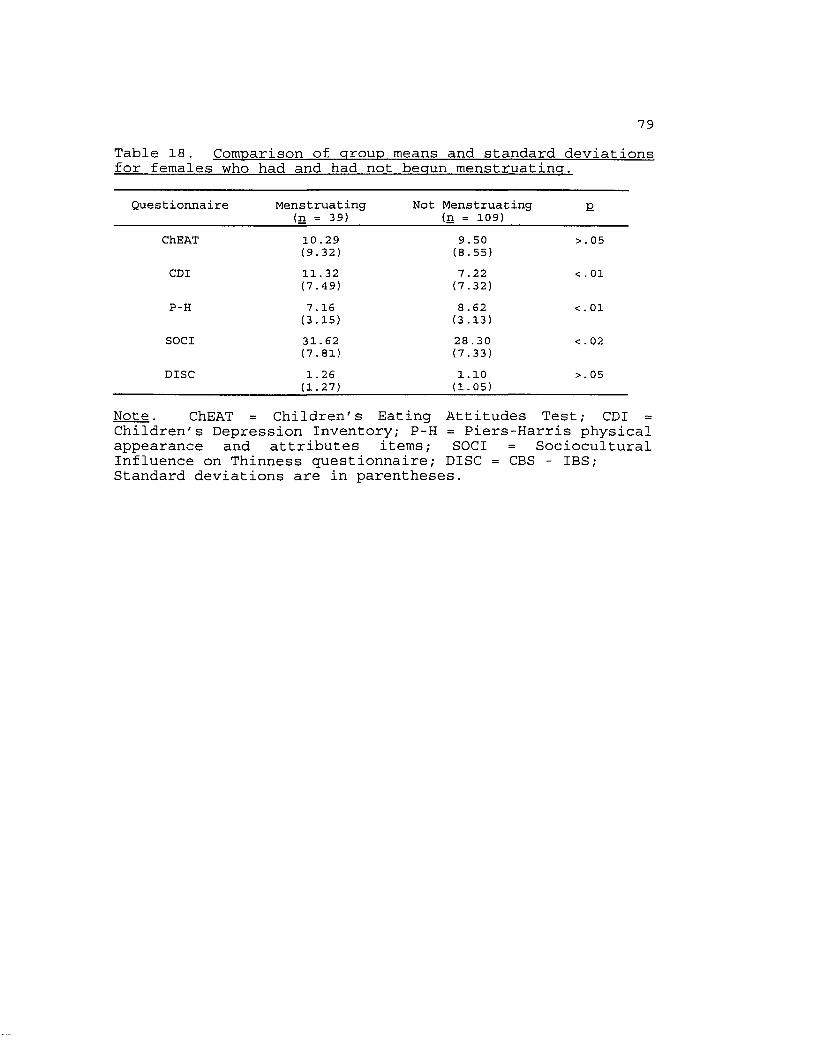
79Table 18. Comparison of group means and standard deviationsfor females who had and had not begun menstruating.
Questionnaire Menstruating (n = 39)
Not Menstruating (n = 109) E
ChEAT 10.29 9.50 >.05(9.32) (8.55)
CDI 11.32 7 .22 < . 01(7.49) (7.32)
P-H 7.16 8 .62 <.01(3.15) (3.13)
SOCI 31.62 28 .30 < . 02(7.81) (7.33)
DISC 1.26 1.10 >.05(1.27) (1.05)
Note. ChEAT = Children's Eating Attitudes Test; CDI = Children's Depression Inventory; P-H = Piers-Harris physical appearance and attributes items; SOCI = Sociocultural Influence on Thinness questionnaire; DISC = CBS - IBS; Standard deviations are in parentheses.
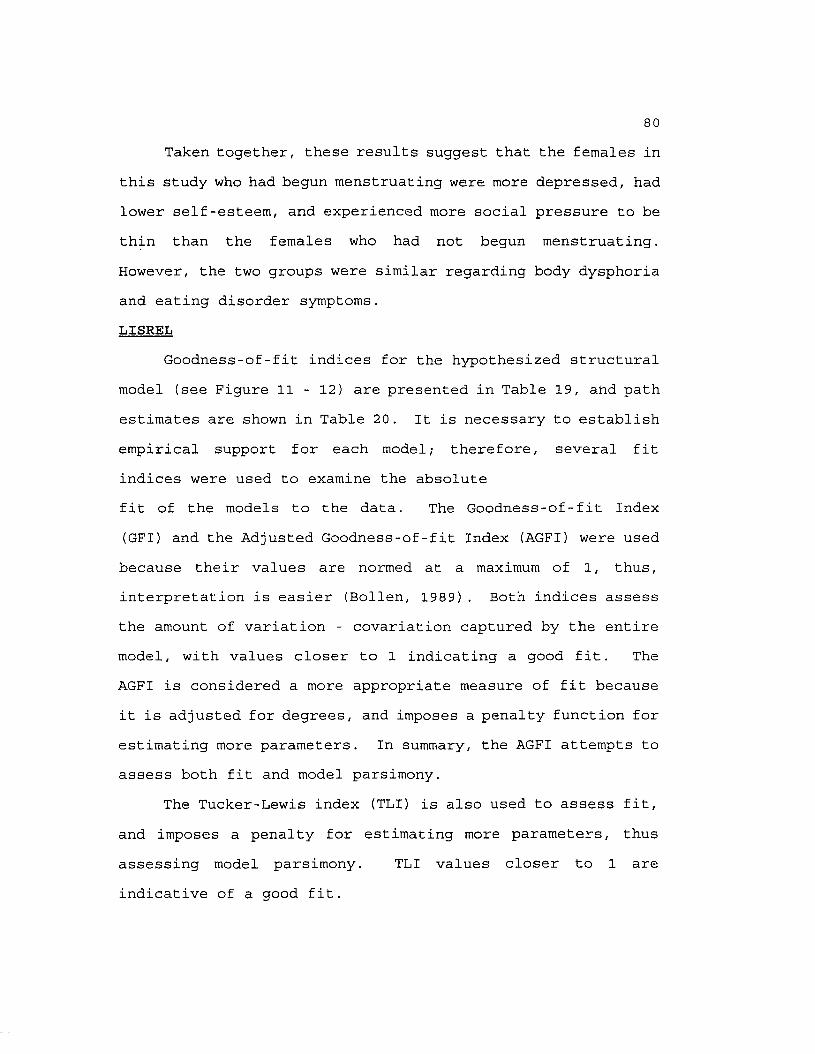
80Taken together, these results suggest that the females in
this study who had begun menstruating were more depressed, had lower self-esteem, and experienced more social pressure to be thin than the females who had not begun menstruating.
However, the two groups were similar regarding body dysphoria and eating disorder symptoms.LISREL
Goodness-of-fit indices for the hypothesized structural
model (see Figure 11 - 12) are presented in Table 19, and path estimates are shown in Table 20. It is necessary to establish
empirical support for each model; therefore, several fit indices were used to examine the absolutefit of the models to the data. The Goodness-of-fit Index
(GFI) and the Adjusted Goodness-of-fit Index (AGFI) were used because their values are normed at a maximum of 1, thus, interpretation is easier (Bollen, 1989) . Both indices assess the amount of variation - covariation captured by the entire model, with values closer to 1 indicating a good fit. The AGFI is considered a more appropriate measure of fit because it is adjusted for degrees, and imposes a penalty function for
estimating more parameters. In summary, the AGFI attempts to assess both fit and model parsimony.
The Tucker-Lewis index (TLI) is also used to assess fit,
and imposes a penalty for estimating more parameters, thus assessing model parsimony. TLI values closer to 1 are
indicative of a good fit.
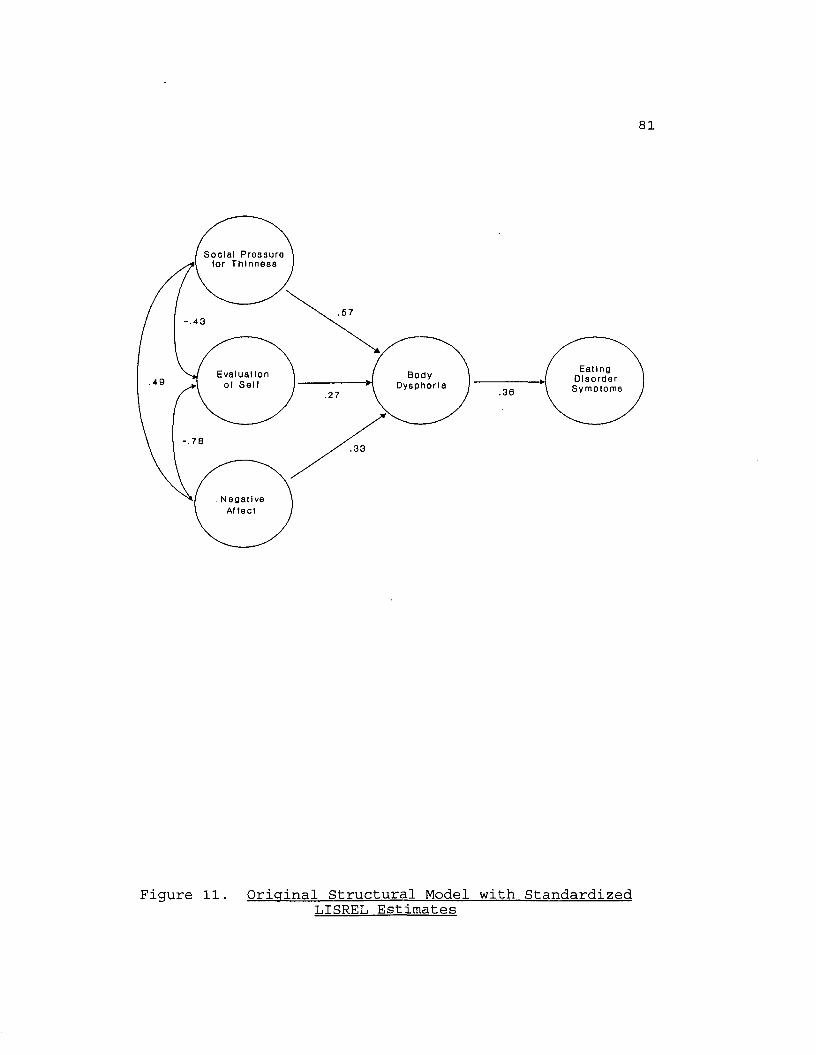
81
S o c i a l P r e s s u r e l o r T h i n n e s s
-.43
E a t i n gD i s o r d e r
S y m p t o m s
E v a l u a t i o n B o d yD y s p h o r i a.49
.30
.33
N e g a t i v e Af t e c t
Figure 11. Original Structural Model with Standardized T j T S R E L Estimates

82
S o c i a l P r e s s u r e ( o r T h i n n e s s
■ 16ns.57
E a t i n gD i s o r d e r
S y m p t o m s
E v a l u a t i o n B o d yD y s p h o r i a .20
.33
N e g a t i v eA t l e c t
Figure 12 . Alternative Structural Model with Standardized LISREL Estimates
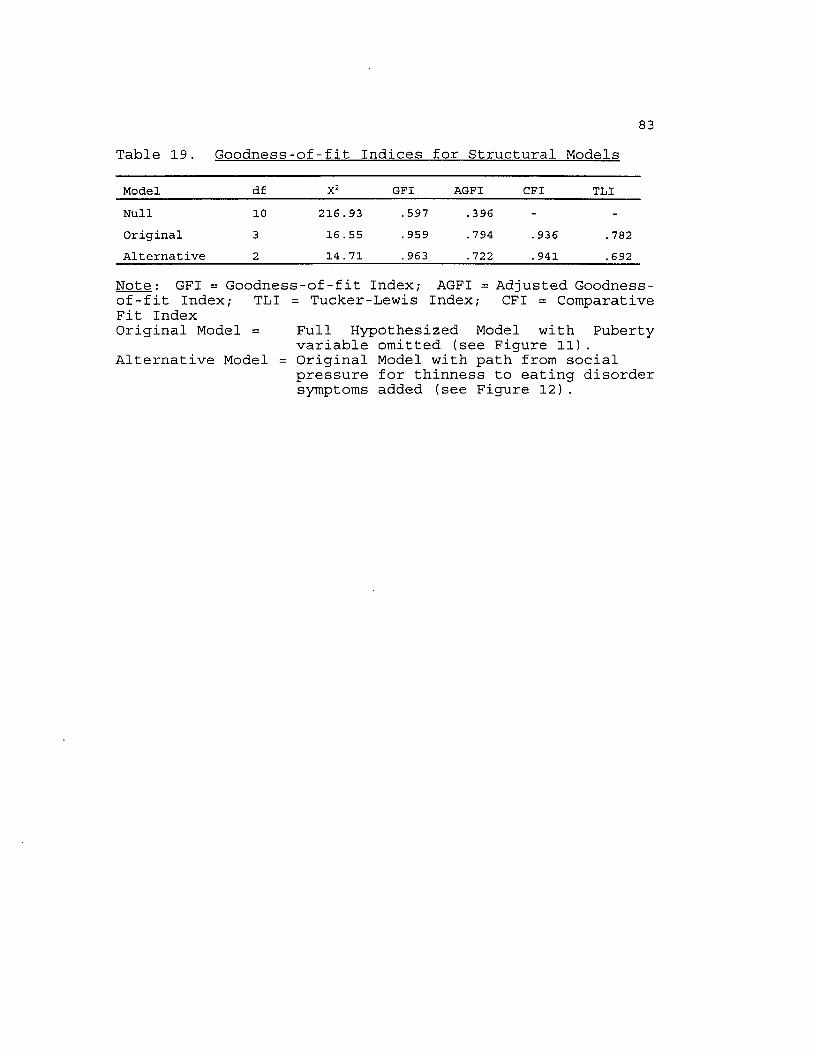
83Table 19. Goodness-of-fit Indices for Structural Models
Model df X2 GFI AGFI CFI TLINull 10 216.93 . 597 .396 - -Original 3 16 .55 . 959 .794 . 936 .782Alternative 2 14 . 71 . 963 .722 . 941 . 692
Note: GFI = Goodness-of-fit Index; AGFI = Adjusted Goodness-of -fit Index; TLI = Tucker-Lewis Index; CFI = Comparative Fit IndexOriginal Model = Full Hypothesized Model with Puberty
variable omitted (see Figure 11) . Alternative Model = Original Model with path from social
pressure for thinness to eating disorder symptoms added (see Figure 12).

Table 20. Path Estimates for Structural Models84
PathOriginal Model Alternative Model
SOC PRESSURE -> BODY DYS rn . 57 .57EVAL SELF -» BODY DYS ri2 .27 .27NEG AFFECT -» BODY DYS ri3 .33 .33BODY DYS -» E.D. B21 .36 .26SOC PRESSURE -> EVAL SELF 012 - .43 - .43SOC PRESSURE -> NEG AFFECT 013 .49 .49EVAL SELF -» NEG AFFECT 023 - . 78 - . 78SOC PRESSURE -» E.D. r21 - . 15nsR2 BODY DYSPHORIA .42 .42R2 EATING DISORDER SYMPTOMS . 15 . 15
Note: SOC PRESSURE = Social pressure for thinness; BODY DYS= body dysphoria (CBS - IBS); EVAL SELF = evaluation of self (Piers-Harris scores); E.D. = eating disorder symptoms (ChEAT scores); NEG AFFECT = negative affect (CDI scores).

85Path significance is a second criteria for evaluating
causal models since it is possible to obtain acceptable levels
of fit for a model which has nonsignificant coefficients. Therefore, researchers have proposed examining causal parameter estimates among latent variables in conjunction with model fit statistics (e.g., Anderson & Gerbing, 1988).
The LISREL model was computed controlling for Body Mass Index (BMI). The purpose of this statistical control was to measure Current Body Size (CBS) as a perceptual difference while taking subjects' actual body size into account, e.g., an overweight subject's selection of an 8 for CBS is different from a thin subject's selection of an 8 for CBS. Therefore, the final LISREL model presented is controlled for BMI, and the correlation matrix for the LISREL variables is presented
in Table 21.The causal model that was tested in this investigation
included six variables: social pressure for thinness,negative affect, evaluation of self, puberty, body dysphoria, and eating disorder symptoms (See Figure 6). The models in this investigation were tested with data from females subjects for two reasons: 1) the Sociocultural Influence on Thinnessquestionnaire was constructed only for females and therefore
was not administered to males, and 2) the overwhelming majority of individuals with eating disorders are females. A minimum of 3 0 subjects per predictor is recommended for these
analyses, which would require a minimum of 12 0 subjects for
86Table 21. Correlation matrix for LISREL variables controllingfor Body Mass Index (BMI).
ChEAT DISC P-H CDI SOCIChEAT 1.00 .30 - .17 .37 .56DISC 1.00 - .35 .32 .25P-H 1. 00 - .67 - . 35CDI 1. 00 .42SOCI 1. 00
Note: ChEAT = Children's Eating Attitudes Test; DISC =Discrepancy score (CBS - IBS) ; P-H = Piers-Harris Physical Appearance and Attributes items; CDI = Children's Depression Inventory; SOCI = Sociocultural Influence on Thinness Questionnaire.

87this investigation, and a total of 148 females participated in this study.
The sociocultural pressure for thinness variable was
represented by items from the Sociocultural Influence on Thinness questionnaire, which has been validated by Richins (1991) with adult populations. Negative affect was
represented by total scores on the Children's Depression Inventory (CDI). Evaluation of self was represented by scores on the Piers-Harris Physical Appearance and Attributes items. Puberty was represented by the presence or absence of menstruation. Body dysphoria was represented by subtracting
BIA Current Body Size scores from Ideal Body Size scores (CBS - IBS), yielding absolute values. The conceptualization of
body dysphoria as the discrepancy between self (CBS) and ideal (IBS) body estimates has been validated in previous research
(Williamson, Barker, Bertman, & Gleaves, in press; Williamson, Gleaves, Watkins, & Schlundt, 1993). Eating disorder symptoms were represented by total scores on the Children's Eating Attitudes Test (ChEAT).
Analyses of the proposed model showed that the puberty variable was not highly correlated with sociocultural pressure for thinness (r = -.12; p > .05), evaluation of self (r = .16;
P < .05), negative affect (r = -.20; p< .05), body dysphoria (r = -.06; p > .05), or eating disorder symptoms (r = -.02; p>
.05). Therefore, the puberty variable was omitted from the
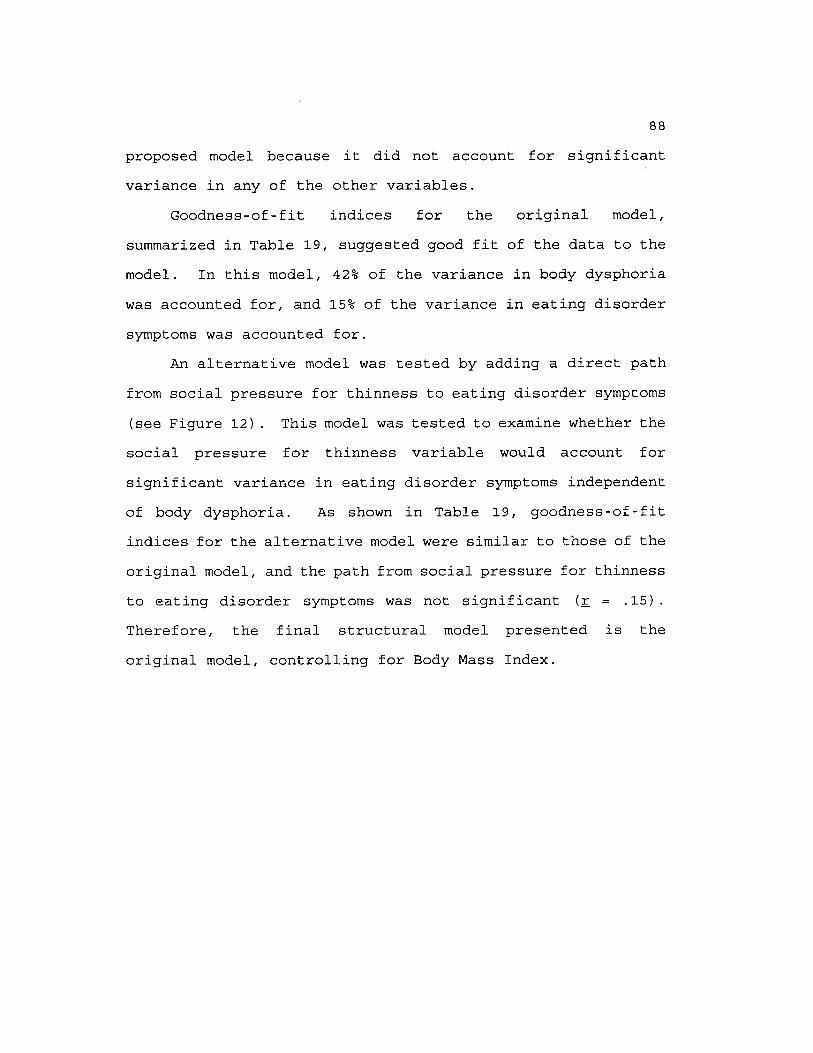
88proposed model because it did not account for significant variance in any of the other variables.
Goodness-of-fit indices for the original model,
summarized in Table 19, suggested good fit of the data to the model. In this model, 42% of the variance in body dysphoria
was accounted for, and 15% of the variance in eating disorder
symptoms was accounted for.An alternative model was tested by adding a direct path
from social pressure for thinness to eating disorder symptoms
(see Figure 12) . This model was tested to examine whether the social pressure for thinness variable would account for
significant variance in eating disorder symptoms independent of body dysphoria. As shown in Table 19, goodness-of-fit indices for the alternative model were similar to those of the
original model, and the path from social pressure for thinness to eating disorder symptoms was not significant (r = .15) .Therefore, the final structural model presented is the original model, controlling for Body Mass Index.
DISCUSSIONOne of the purposes of this investigation was to examine
the prevalence of eating disorder pathology in a sample of 3 -
7 graders. Until very recently, eating disorders were thought to be rare among prepubertal children, and assessment
measures were not available for this population. However,
researchers have identified the presence of eating disorders among prepubertal children (e.g., Fosson et al. , 1987; Hawley, 1985), as well as a preference for thinness and body
dissatisfaction among children as young as 6 years old (Collins, 1991). Given these recent findings, within the eating disorder literature more attention is being focused on children and the need to identify children who are at risk for developing an eating disorder so that effective interventions can be developed.
In this study, the presence of eating disorder symptoms was examined using the Children's Eating Attitudes Test (ChEAT; Maloney et al., 1989), which was developed to assess eating attitudes, dieting behaviors, and food preoccupation in children as young as 8 years old. A cutoff score of 20 or above is indicative of anorexic attitudes toward eating.
In this Sample of 257 subjects, 31 (12.1%) had scores of 20 or above on the ChEAT in comparison to 6.9% reported by
Maloney et al., (1989) . The higher incidence of eating disorder symptoms in our sample is not surprising given the research that shows a higher incidence of eating concerns and
89
90dieting among individuals of middle and upper socioeconomic status (Anderson & Hay, 1985). Given the range of scores on
the ChEAT (0 - 60), it is likely that several of the subjects
would meet criteria for an eating disorder diagnosis. However, clinical interviews were not conducted, and definitive statements regarding diagnoses among these subjects are not possible.
Researchers have proposed that females who begin
menstruating earlier than their peers may be at risk for developing an eating disorder (Striegel-Moore, Silberstein, & Rodin, 1986), This hypothesis is based upon the notion that body dysphoria and preference for thinness may increase as
girls approach puberty. However, in this study, no
significant differences were found between subjects for ChEAT and BIA scores, indicating that scores of the youngest
subjects (8 years old) did not differ from scores of the oldest subjects (13 years old) , many of whom had begun menstruating.
Additionally, many of the 3 9 females who had begun menstruating had a very recent onset of menses. Future research may focus on the duration of time menstruating,
because the length of time menstruating, rather than menarcheal timing, may be an important variable regarding the development of body dysphoria and eating disturbances in young
females.

91Examination of dieting behaviors and eating attitudes of
subjects in this study highlight the fact that children at
very young ages have acquired clear preferences for a thin body size. Among these subjects, 40.5% wanted to be thinner, 41.8% reported that they are trying to lose weight, 13.5% admitted to caloric restriction, 31.7% exercised in order to
lose weight, 14.1% reported binge eating, and 1.3% wanted to vomit after eating. These results are alarming given that the majority of these subjects were either normal weight or
underweight.The primary purpose of this investigation was the
development of a Body Image Assessment (BIA) procedure for children and pre-adolescents. This BIA procedure is a modification of the Body Image Assessment procedure for adults developed by Williamson et al. (1989) . Body imagedisturbances are included as diagnostic criteria for anorexia
nervosa and bulimia nervosa, and have been proposed as a central characteristic of the eating disorders (Williamson et al, 1990) . Therefore, if the earliest stages of the development of eating disorders begin before puberty, reliable and valid body image assessment measures for use with children and pre-adolescents are needed.
An initial concern in the development of this BIA procedure was the reliability of silhouette selections by children as young as 8 years old. Correlations of .89 for
Current Body Size (CBS) and .88 for Ideal Body Size (IBS)

92showed that subjects across all grades reliably selected CBS and IBS silhouettes.
In order to evaluate the correspondence of the child and pre-adolescent BIA procedures, both were administered tosubjects in grades 5 and 6. There were significant differences between the data derived from child and pre
adolescent procedures for both CBS and IBS selections,indicating that separate norms for the two BIA procedures were needed. Additionally, Body Mass Index (BMI) was found to be
significantly correlated with CBS but not with IBS.Therefore, norms for CBS selections were calculated for each level of BMI, whereas norms for IBS selections were generated independent of BMI. It should be noted that only four levels
of BMI were available for males in grades 5 - 7 .Concurrent validity of the BIA procedure for children and
pre-adolescents is demonstrated by the significant relationships between BIA discrepancy scores (CBS - IBS) and other measures of eating disorder symptoms, social pressure for thinness, negative affect, and negative evaluation of self. The use of self - ideal discrepancy scores to represent body dysphoria has been validated, and in this investigation
the body dysphoria variable was significantly correlated
(pc.Ol) with all other measures.A final purpose of this investigation was to test a
causal model of the development of body image disturbances and disordered eating in children. The model that was tested and

93supported is shown in Figure 6. This structural modeling
analysis can be construed as another test of construct validity for the BIA discrepancy score. A structural model of four risk factors, social pressure for thinness, negative affect, negative evaluation of self, and puberty, was
evaluated. These risk factors were hypothesized to be related to eating disorder symptoms with body dysphoria as a mediating variable.
Among this sample of female subjects, the onset of menstruation did not have a significant impact on body dysphoria; therefore, the puberty variable was omitted from the model. The onset of puberty in females has been
identified as a predisposing factor for the development of eating disorder symptoms (Attie & Brooks-Gunn, 1989) . Several researchers have found that girls who begin menstruating later in adolescence (after age 14) are less likely to evidence a body image disturbance than girls who begin menstruating before age 14 (Duncan, et al. , 1985; Brooks-Gunn & Warren,
1985).Only 3 9 of the 14 8 females in this study had begun
menstruating; however, 36 of the 39 subjects reported an age of onset that was earlier than the national average of 12.8
years. Therefore, according to previous research, these
subjects were more likely to evidence body image disturbances and eating problems, but within this sample there was not a significant relationship between these variables. However,

94females who had begun menstruating had significantly higher scores on the Children's Depression Inventory and Sociocultural Influence on Thinness questionnaires, and lower
scores on the Piers-Harris self-esteem questionnaire than
females who had not begun menstruating.Social pressure for thinness was found to be
significantly associated with body dysphoria, which supports
previous research showing that weight concerns and disordered eating habits in adolescents were more highly correlated with attitudes toward weight and appearance than with actual body size (Glass & Bliss, 1987) .
Negative affect was also found to be significantly
associated with body dysphoria. These results are consistent with research showing that negative affect is often associated with the eating disorders (e.g., Altshuler & Weiner, 1985), and that non-eating disordered depressed subjects are less
satisfied with their bodies and see themselves as less physically attractive than nondepressed subjects (Noles, Cash, & Winstead, 1985) . Negative affect was also significantly correlated with social pressure for thinness and negative evaluation of self, indicating that as negative affect
increased, sociocultural pressure for thinness increased and self-esteem decreased.
Negative evaluation of self was a significant predictor of body dysphoria, as subjects with lower self-esteem
evidenced greater body dysphoria. Body image disturbances

95have been found to be related to self-esteem and eating disturbances in young females (Grant & Fodor, 1986) . Research
has shown that females as young as 5 years old have a clearly defined self-concept, and that at very young ages males have a more positive self-concept than females (Story, 1979).
These findings are also supported by results of this study because across all grades, females had lower scores on the self-esteem measure than the males.
The relationship between body dysphoria and eating disorder symptoms was significant, indicating that as body
dissatisfaction increased, eating disorder symptoms increased. In the original structural model, 42% of the variance in body dysphoria was accounted for, and 15% of the variance in eating disorder symptoms was accounted for by the other variables.
These results highlight the impact that societal preference for thinness, negative affect, and negative selfesteem have on young females in relation to body satisfaction and disordered eating patterns. In this model, body dysphoria was found to mediate the association of social pressure for thinness, negative affect, and negative evaluation of self with eating disorder symptoms. This finding explains why all young females who are exposed to social pressure for thinness, are depressed, or who have low-self-esteem do not necessarily
develop an eating disorder. The crucial variable for developing eating disorder symptoms may be the presence of body dysphoria.

96These results support previous models of the development
of body image disturbances and disordered eating patterns. Slade (1982) proposed that body image disturbances are the
primary motivation that causes the disordered eating patterns of anorexia nervosa and bulimia nervosa. Rosen (1992) elaborated on Slade's (1982) proposal and postulated that disordered eating and weight control are the characteristic features of the eating disorders, but are secondary to
overconcern with body shape and weight. These ideas have led to a proposal that anorexia nervosa and bulimia nervosa are both manifestations of a more general body image disorder.
In a recent study, Williamson, Netemeyer, et al. (1994)investigated risk factors for the development of disordered eating patterns in female college athletes using structural equation modeling. Results of this study indicated that eating disorder symptoms were significantly influenced by the interaction of social pressure for thinness, athletic
performance anxiety, and negative self-appraisal of athletic achievement, and that these risk factors and eating disorder
symptoms were mediated by overconcern with body size and shape. Similarly, the results of the current investigation support the prediction that body dysphoria mediates the association of social pressure for thinness, negative affect,
and negative evaluation of self with eating disorder symptoms
in young females.

97These data have implications for the assessment and
treatment of body image and eating disturbances in young
females. All of these variables should be assessed using appropriate assessment measures. These results also point to the need for reliable and valid body image assessment measures
that can be used with children. Rosen (1992) has proposed
that it is not adequate to use crude measures of body dissatisfaction; therefore, the Body Image Assessment procedure for children and pre-adolescents has been developed as a reliable and valid measure of body image.
Results of this study also point to several factors that
may be a focus of intervention in order to prevent the development of eating disorders in young females. Specifically, if social pressures for thinness, negative affect, and/or negative evaluation of self can be modified, then the likelihood that a young girl will evidence body dysphoria and subsequently develop eating disorder symptoms
may be reduced.Rosen (1992) has summarized the research regarding the
cognitive-behavioral treatment of body image disturbances in
adult and adolescent subjects, and these approaches may also be efficacious with younger subjects. Cognitive-behavioral treatment of body image disturbances includes cognitive restructuring of irrational thoughts about body size and the perceived importance of physical appearance for self-worth, as
well as exposure to situations that the individual avoids due
98to a fear that attention will be called to their shape or
weight. Additionally, a parental component of treatment should be added to maximize the benefits of these interventions with children.
Two limitations of this study need to be addressed. One
limitation is the sample of subjects who were studied. These students are not a representative sample of 3rd through 7th graders. Low socioeconomic status (SES) subjects were rare, and this sample was primarily Caucasian. However, anorexia nervosa and bulimia nervosa have been found to have similar
clinical characteristics independent of racial origin, and it appears that higher SES is an important factor that results in
an increased vulnerability for the development of an eating disorder (Anderson & Hay, 1985). Therefore, if children who are at risk for developing an eating disorder were to be identified, we were more likely to find them in a sample of higher SES children. Given this limitation, the results of this study should be generalized only to middle and higher SES children in grades 3 - 7 , and future research will be needed with more representative samples of children.
Another limitation involves the hypothesized causal
relationships between the variables in structural modeling methodology. A causal relationship can be supported by the data, though it is impossible to prove causality in a
structural modeling analysis. In the case of a model having

99good fit with the data, there is always the possibility that another model may fit the data equally well.
In conclusion, this study found the presence of body
dysphoria and disordered eating patterns in a significant number of young children. Preliminary data supporting the
reliability and validity of the Body Image Assessment procedure for children and pre-adolescents were presented. Future research is needed with more representative samples of children. There is a need for continued research regarding the development and progression of eating disorders in children, and this study illustrates the utility of structural equation modeling methodology for such research.

REFERENCESAllebeck, P., Hallberg, D., & Epsmark, S. (1976). Body image:
An apparatus for measuring disturbances in estimation of size and shape. Journal of Psychosomatic Research, 20. 583-589.
Altshuler, K. Z., & Weiner, M. F. (1985) . Anorexia nervosa and depression: A dissenting view. American Journal ofPsychiatry. 142. 328-332.
American Psychiatric Association (1994) . Diagnostic and statistical manual of mental disorders (4th ed.). Washington: Author.
Anderson, J. C., & Gerbing, D. W. (1988) . Structural equation modeling in practice: A review and recommended two-step approach. Psychological Bulletin. 103, 411-423.
Anderson, A. E., & Hay, A. (1985) . Racial andsocioeconomic influences in anorexia nervosa and bulimia. International Journal of Eating Disorders.4, 479-487.
Arkes, H. R. (1991). Costs and benefits of judgment errors: Implications for debiasing. Psychological Bulletin. 110. 486-498.
Attie, I., & Brooks-Gunn, J. (1989). Development of eatingproblems in adolescent girls: A longitudinal study.Developmental Psychology. 25. 70-79.
Attie, I., Sc Brooks-Gunn, J. (1992). Developmental issues inthe study of eating problems and disorders. In J. H.Crowther, D. L. Tennenbaum, S. E. Hobfoll, & M. A. P. Stephens (Eds.), The etiology of bulimia nervosa: Theindividual and familial context, (pp. 35-58). Washington, DC: Hemisphere Publishers.
Beaden, W. 0., Netemeyer, R. G. , & Teel, J. E. (1989).Consumer susceptibility to interpersonal influence. Journal of Consumer Research. 15.(March). 473-481.
Beck, A., Ward, C., Mendelson, M., Mock, J., & Erbaugh,J. (1961). An inventory for measuring depression. Archives of General Psychiatry, 4. 561-571.
Ben-Tovim, D. I., Walker, M. K. , Fok, D., & Yap, E. (1989). An adaptation of the stroop test for measuring shape and food concerns in eating disorders: A quantitative measure of psychopathology? International Journal of Eating Disorders. 8 . 681-687.
100
101Bennett, S. M. , Williamson, D. A., & Powers, S. K. (1989).
Bulimia nervosa and resting metabolic rate. International Journal of Eating Disorders. 8 . 417-424.
Berscheid, E., Walster, E., & Bohrnstedt, G. (1973, November). The happy American body: A survey report. PsychologyToday, pp. 119-131.
Blitzer, J. R. , Rollins, N., & Blackwell, A. (1961). Childrenwho starve themselves: Anorexia nervosa. PsychosomaticMedicine. 23. 369-383.
Bollen, D. A. (1989). Structural equations with latentvariables. New York: John Wiley.
Brooks-Gunn, J., & Warren, M. P. (1985). Effects of delayed menarche in different contexts: Dance and nondancestudents. Journal of Youth and Adolescence, 14. 285-300.
Brown, T. A., Cash, T. F., & Lewis, R. J. (1989). Body-image disturbances in adolescent female binge-purgers: A brief report of the results of a national survey in the U.S.A. Journal of Child Psychology and Psychiatry, 30. 605-613.
Brownell, K. D. (1991). Dieting and the search for the perfect body: Where physiology and culture collide. BehaviorTherapy. 22. 1-12.
Bruch, H. (1962). Perceptual and conceptual disturbances in anorexia nervosa. Psychosomatic Medicine. 24. 187-194.
Cavior, N. , & Lombardi, D. A. (1973) . Developmental aspects of judgment of physical attractiveness in children. Developmental Psychology. 8. 67-71.
Channon, S., Hemsley, D., & de Silva, P. (1988). Selectiveprocessing of food words in anorexia nervosa. British Journal of Clinical Psychology, 27. 259-260.
Collins, M. E. (1991). Body figure perceptions and preferences among preadolescent children. International Journal of Eating Disorders. 10. 199-208.
Duncan, P. D., Ritter, P. L., Dornbusch, S. M., Gross, R. T., & Carlsmith, J. M. (1985). The effects of pubertal timing on body image, school behavior, and deviance. Journal of Youth and Adolescence. 14. 227-235.
Dykens, E. M., & Gerrard, M. (1986) . Psychological profiles of purging bulimics, repeat dieters, and controls. Journal of Consulting and Clinical Psychology. 54. 283-288.
102Ehrenreich, B., & English, D. (1978) . For her own good: 15 0
years of the experts' advice to women. New York: Anchor Press/Doubleday.
Fabian, L. J., & Thompson, J. K. (1989) . Body image and eating disturbance in young females. International Journal of Eating Disorders. 8. 63-74.
Fallon, A. (1990). Culture in the mirror: Socioculturaldeterminants of body image. In T. F. Cash and T. Pruzinsky (Eds.), Body images: Development. deviance. and change (pp. 80-109). New York: Guilford.
Feldman, W., Feldman, E., & Goodman, J. T. (1988) . Cultureversus biology: Children's attitudes toward thinness and fatness. Pediatrics. 81. 190-194.
Fosson, A., Knibbs, J. M., Bryant-Waugh, R., & Lask, B.(1987) . Early onset anorexia nervosa. Archives of Disease in Childhood. 62. 114-118.
Freedman, R. J. (1984) . Reflections on beauty as it relates to health in adolescent females. Women and Health. . .The Journal of Women's Health Care. 9, 2 9-45.
Garner, D. M., & Garfinkel, P.E. (1979). The eating attitudes test: An index of the symptoms of anorexia nervosa.Psychological Medicine. 9. 273-279.
Garner, D. M., Olmsted, M. P., & Polivy, J. (1983).Development and validation of a multidimensional inventory for anorexia and bulimia. International Journal of Eating Disorders. 2 . 15-34.
Grant, C. L., & Fodor, I. G. (1986). Adolescent attitudestoward body image and anorexic behavior. Adolescence. 21. 269-281.
Greenfield, D., Quinlan, D. M. , Harding, P., Glass, E., &Bliss, A. (1987). Eating behavior in an adolescent population. International Journal of Eating Disorders. 6. 99-111.
Hawley, R. M. (1985) . The outcome of anorexia nervosa in younger subjects. British Journal of Psychiatry. 146. 657-660 .
Hayduk, L. A. (1987) . Structural eguation modeling with LISREL: Essentials and advances. Baltimore: The JohnsHopkins University Press.

103Holmgren, S., Humble, K., Norring, C., Roos, B.,
Rosmark, B., & Sohlberg, S. (1983). The anorecticbulimic conflict: An alternative diagnosticapproach to anorexia nervosa and bulimia. International Journal of Eating Disorders. 2 . 3-15.
Irwin, M. (1981). Diagnosis of anorexia nervosa in childrenand the validity of DSM-III. American Journal ofPsychiatry. 138, 1382-1383.
Jackman, L. P., & Williamson, D. A. (1993) . Judgment errors in response to ambiguous stimuli related to body size and shape. Unpublished master's thesis, Louisiana State University, Baton Rouge.
Jacobs, B. W., Sc Isaacs, S. (1986). Pre-pubertal anorexianervosa: A retrospective controlled study. Journal of Child Psychology and Psychiatry. 27, 237-250.
Jaffe, A. C., & Singer, L. T. (1989) . Atypical eatingdisorders in young children. International Journal of Eating Disorders. 8. 575-582.
Joreskog, K. G., Sc Sorbom, D. (1989) . LISREL VII: A guide to the program and applications. Chicago, IL: SPSS Inc.
Keeton, W. P., Cash, T. F., Sc Brown, T. A. (1990) . Body image or body images? Comparative, multidimensional assessment among college students. Journal of Personality Assessment. 54. 213-230.
Kovacs, M. Sc Beck, A. (1977) . An empirical-clinical approach toward a definition of childhood depression. In J. Schulterbrandt Sc A. Raskin (Eds.), Depression in childhood: Diagnosis, treatment, and conceptual models. New York: Raven Press.
Leitenberg, H. , Gross, H., Peterson, H., & Rosen, J. C.(1984). Analysis of an anxiety model in the process of change during exposure plus response prevention treatment of bulimia nervosa. Behavior Therapy. 15. 3-20.
Lerner, R. M., & Gellert, E. (1969) . Body buildidentification, preference, and aversion in children. Developmental Psychology. 1 . 456-462.
Lerner, R. M. , Sc Schroeder, C. (1971) . Physique identification, preference, and aversion in Kindergarten children. Developmental Psychology. 5 . 538.
Maloney, M. J. , McGuire, J. B., & Daniels, S. R. (1988).Reliability testing of a children's version of the Eating

104Attitudes Test. Journal of the American Academy of Child and Adolescent Psychiatry, 27. 541-543.
Maloney, M. J. , McGuire, J., Daniels, S. R. , & Specker, B. (1989). Dieting behavior and eating attitudes in children. Pediatrics. 84. 482-487.
Mathews, A. , & MacLeod, C. (1985) . Selective processing ofcues in anxiety states. Behavior Research and Therapy. 23, 563-569.
McKenzie, S. J., Williamson, D. A., & Cubic, B. A. (1993).Stable and reactive body image disturbances in bulimia nervosa. Behavior Therapy. 24. 195-207.
Mellin, L. M. (1988). Responding to disordered eating in children and adolescents. Nutrition News. 51. 5-7.
Mendelson, B. K., & White, D. R. (1985) . Development of self- body-esteem in overweight youngsters. Developmental Psychology. 21. 90-96.
Morris, A., Cooper, T., & Cooper, P. J. (1989). The changing shape of female fashion models. International Journal of Eating Disorders. 8. 593-596.
Must, A., Dallal, G. E., & Dietz, W. H. (1991). Reference data for obesity: 85th and 95th percentiles of body mass index (wt/ht2) and triceps skinfold thickness. American Journal of Clinical Nutrition. 53. 839-846.
Nassar, M. (1988) . Culture and weight consciousness. Journal of Psychosomatic Research. 32. 573-577.
Netemeyer, R. G. , Burton, S., & Lichtenstein, D. R. (1993). Trait aspects of vanity: Measurement and relevance toconsumer behavior. Work in progress, Louisiana State University.
Noles, S. W. , Cash, T. F., & Winstead, B. A. (1985). Bodyimage, physical attractiveness, and depression. Journal of Consulting and Clinical Psychology. 53. 88-94.
Piers, E. V. , & Harris, D. B. (1969). The Piers-HarrisChildren's Self Concept Scale. Los Angeles: WesternPsychological Services.
Polivy, J., & Herman, C. P. (1985). Dieting and bingeing: A causal analysis. American Psychologist. 40, 193-201.
Rees, M. (1993) . Menarche when and why? Lancet. 342. 1375-1376 .
105Rescorla, R. A. (1988) . Pavlovian conditioning: It's not what
you think it is. American Psychologist. 43. 151-160.
Richins, M. L. (1991). Social comparison and the idealized images of advertising. Journal of Consumer Research. 18. (June). 71-83.
Rosen, J. C. (1992). Body image disorder: Definition,development, and contribution to eating disorders. In J. H. Crowther, S. E. Hobfoll, M. A. P. Stephens, & D. L. Tennebaum (Eds.), The etiology of bulimia: The individual and family context. (pp. 157-178). Washington, DC: Hemisphere Publishers.
Saylor, C. F., Finch, A. J., Spirito, A., & Bennett B. (1984). The Children's Depression Inventory: A systematicevaluation of psychometric properties. Journal of Consulting and Clinical Psychology. 52, 955-967.
Schlundt, D. G., & Johnson, W. G. (19 90). Eating disorders:Assessment and treatment. Needham Heights, MA: Allyn &
Bacon.Schotte, D. E., McNally, R. J., & Turner, M. L. (1990). A
dichotic listening analysis of body weight concerns in bulimia nervosa. International Journal of Eating Disorders. 9, 109-113.
Shatford, L. A., & Evans, D. R. (1986). Bulimia as amanifestation of the stress process: A LISREL causalmodeling analysis. International Journal of Eating Disorders. 5. 451-473.
Slade, P. (1982). Toward a functional analysis of anorexia nervosa. British Journal of Clinical Psychology, 21. 167-179.
Story, M. D. (1979) . Factors associated with more positive body self-concepts in preschool children. The Journal of Social Psychology. 108. 49-56.
Striegel-Moore, R. H., Silberstein, L. R., & Rodin, J. (1986) . Toward an understanding of risk factors for bulimia. American Psychologist. 41. 246-258.
Taylor, M. J., & Cooper, P. J. (1986) . Body sizeoverestimation and depressed mood. British Journal of Clinical Psychology. 25. 153-154.
Thompson, J. K. (1990) . Body image disturbance: Assessment and treatment. Elmsford, NJ: Pergamon Press.
106Thompson, J. K. (1992). Body image: Extent of disturbance,
associated features, theoretical models, assessment methodologies, intervention strategies, and a proposal of a new DSM IV diagnostic category-body image disorder. In M. Hersen, R. M. Eisler, & P. M. Miller (Eds.), Progress in behavior modification. Sycamore, IL: SycamorePublishing, Inc.
Thompson, J. K., & Altabe, M. N. (1991) . Psychometricqualities of the Figure Rating Scale. International Journal of Eating Disorders. 10. 615-619.
Thompson, J. K. , & Psaltis, K. (1988). Multiple aspects and correlates of body figure ratings: A replication andextension of Fallon and Rozin (1985). InternationalJournal of Eating Disorders, 7, 813-818.
Tobin-Richards, M. H., Boxer, A. M. , & Peterson, A. C. (1983). The psychological significance of pubertal change: Sex differences in perceptions of self during earlyadolescence. In J. Brooks-Gunn & A. C. Peterson (Eds.), Girls at puberty: Biological, social, and psychological perspectives (pp. 127-154). New York: Plenum Press.
Vitsousek, K. B., & Hollon, S. D. (1990) . The investigation of schematic content and processing in eatingdisorders.Cognitive Therapy and Research. 14. 191-214.
Wardle, J., & Beales, S. (1986). Restraint, body image, and food attitudes in children from 12 to 18 years. Appetite. 7, 209-217.
Warren, M. (1968). A study of anorexia nervosa in young girls. Journal of Child Psychology and Psychiatry, 9, 27-40.
Williamson, D. A., Barker, S. E., Bertman, L. J., & Gleaves, D. H. (in press) . Body image, body dysphoria, and dietary restraint: Factor structure in nonclinical subjects.Behaviour Research and Therapy.
Williamson, D. A., Cubic, B. A., & Fuller, R. D. (1993).Eating disorders. In S. M. Turner, K. S. Calhoun, & H. E. Adams (Eds.), Handbook of clinical behavior therapy. (2nd ed.) . New York: John Wiley & Sons, Inc.
Williamson, D. A., Davis, C. J., Bennett, S. M., Goreczny, A. J. , & Gleaves, D. H. (1989). Development of a simpleprocedure for body image assessment. Behavioral Assessment. 11. 433-446.
Williamson, D. A., Davis, C. J., Duchmann, E. G., McKenzie, S. J. , Sc Watkins, P. C. (1990) . Assessment of eating

107disorders: Obesity, anorexia, and bulimia nervosa. New York: Pergamon Press.
Williamson, D. A., Gleaves, D. H., Watkins, P. C. , & Schlundt, D. G. (1993) . Validation of self - ideal body size discrepancy as a measure of body dissatisfaction. Journal of Psychopathology and Behavioral Assessment.15. 57-68.
Williamson, D. A., Goreczny, A. J., Davis, C. J. , Ruggiero, L., & McKenzie, S. J. (1988). Psychophysiologicalanalysis of the anxiety model of bulimia nervosa. Behavior Therapy. 19. 1-9.
Williamson, D. A., Kelley, M. L., Davis, C. J., Ruggiero, L., & Blouin, D. C. (1985) . Psychopathology of eating disorders: A controlled comparison of bulimic, obese, and normal subjects. Journal of Consulting and Clinical Psychology, 53, 161-166.
Williamson, D. A., Netemeyer, R. G. , Jackman, L. P., Anderson, D. A., Funsch, C. L., & Rabalais, J. Y. (1994).Structural equation modeling of risk factors for the development of eating disorder symptoms in female athletes. Manuscript submitted for publication.
Winstead, B. A., & Cash, T. F. (1984, March). Reliability and validity of the Body-Self Relations Questionnaire: A new measure of body image. Paper presented at the meeting of the Southeastern Psychological Association, New Orleans, LA.

APPENDIX A: CHILDREN'S EATING ATTITUDES TEST
Adapted Eating Attitudes Test - 26
N a m e____________________Directions: Read each sentence. Circle the word that
best tells what you think. The pictures of pies may help you remember the words.
1. I am very scared of being fat.
a l w a y s usua l l y of ten s o m e t i m e s rarely n ev e r
€ > €2. I try not to eat when I am hungry.
a l w a y s u sua l l y of ten s o m e t i m e s rarely n eve r€ €3. I th ink about food a lot of the time.
a l w a y s usua l l y of ten s o m e t i m e s r a r e l y neve r
© €Sometimes I eat a lot and feel like I cannot stop.
a l w a y s u sua l l y of ten s o m e t i m e s rarely never€5. I cut my food into small pieces.
a l w a y s usual l y of len s o m e t i m e s rarely neve r

6. I know how many calories are in the'foods I eat.
a lw a y s u s u a l l y o f t e n s o m e l m e s rarely
/. I try not to eat foods like bread and potatoes.
a lw ays u sua l l y of ten s o m e t i m e s rarely
I. I th ink other people want me to eat more.
a l w a ys usua l l y of ten s o m e t i m e s rarely€ 0
9. I throw-up after I eat.
a lw a ys u sua l l y often s o m e t i m e s€0. I feel very guilty after I eat.
rarely
0
a l w a ys usua l ly offen s o m e t i m e s rarely
11. I think about being thinner a lot.
a lw ays usual ly often s o m e t i m e s rarely
n eve r
neve ron eve ro
nev e ronev e r

110
12. I think about burning up calories when I exercise
a lways usual ly of ten s om e t im es rarely
@ © 0 0 013. Other people think that I am too thin.
a lways usua l ly of t en s o m e t im es rarely
14, I often think about having fat on my body.
a lw a ys usual ly of ten so m e t i m e s rare ly
• © O € 0
15. I take longer than others to eat my meals.
a lw ays usual ly of ten s o m e t i m e s rarely€16. I try not to eat foods with sugar in them.
a lw ay s u s u a l l y of ten s o m e t i m e s rarely
17. I eat diet foods.
a l ways usual ly of ten s o m e t i m e s rarelyO 0
neveroneve ro
neve roneve ro
neve ronev e r
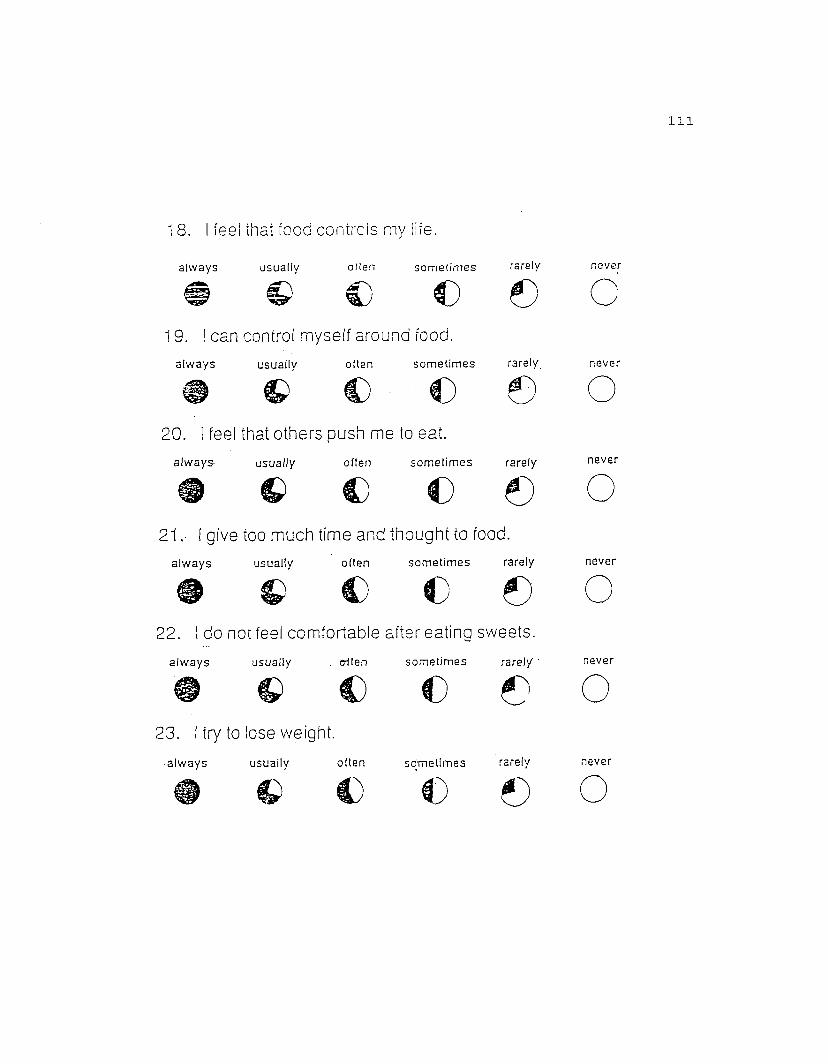
Ill
1 8. I feel that food controls mv lire.
neve ra lw a ys usuaffv often s o m e t i m e s rarely# © c € e19. I can control myself around food.
a l w a y s usua l l y of ten s o m e t i m e s rarely. neve r
20. I feel that others push me to eat.
always- u s u a l l y of ten s o m e t i m e s rarely neve ro21.- I give too much time and thought to food.
a l w a y s usual ly of t en s o m e t i m e s rarely neve r# © C C 0 O22. I do not feel comfortable after eating sweets.
a l w a y s usual ly . e-llen s o m e t i m e s rarely ' n eve r• €> € € 0 O23. I try to lose weight.
a l w a y s usual ly of ten s o m e t i m e s rarely never€ 0 O
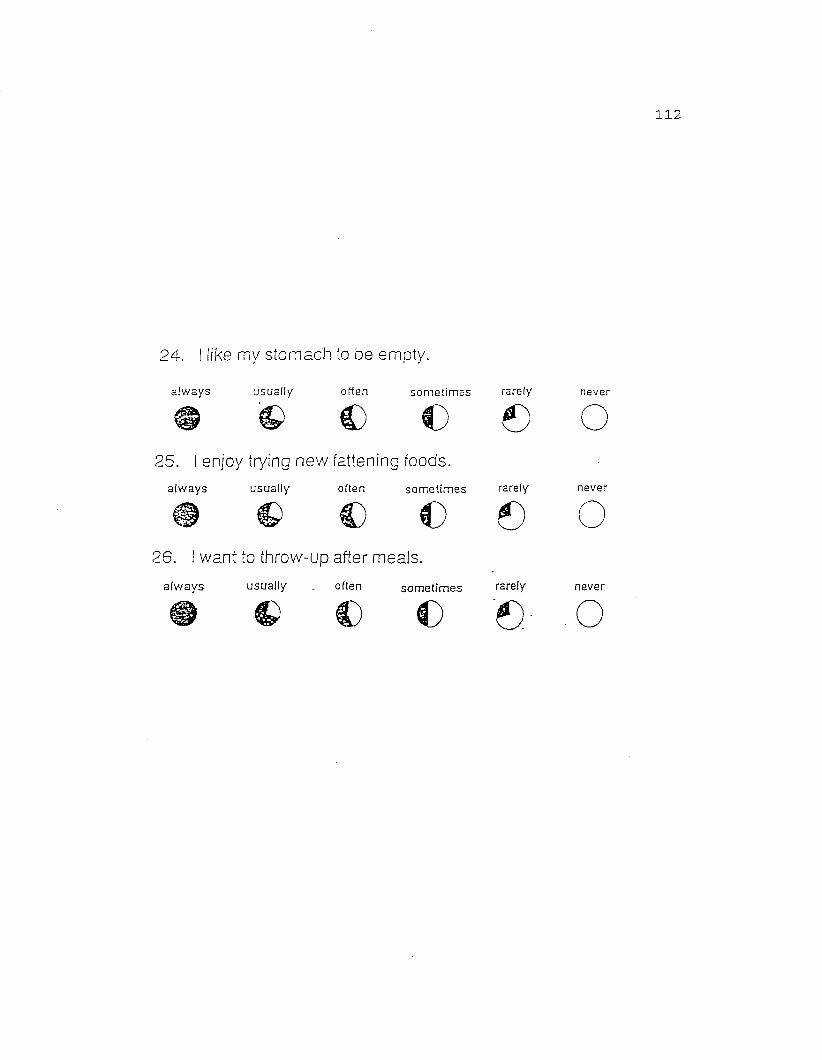
112
24. I like my stomach to be empty.
a lw a y s usual l v of ten s o m e t i m e s rarely never© '€>€)€€> O25. I enjoy trying new fattening foods.
a l w a y s u sua l l y often s o m e t i m e s rarely never
9 C € € 6) O26. I want to throw-up after meals.
a l w a y s u sua l l y . often s o m e t i m e s rarely neve r'£)• O
PLEASE NOTE
Copyrighted materials in this document have not been filmed at the request of the author They are available for consultation, however
in the author’s university library.
APPENDIX B Pages 113-114
University Microfilms International
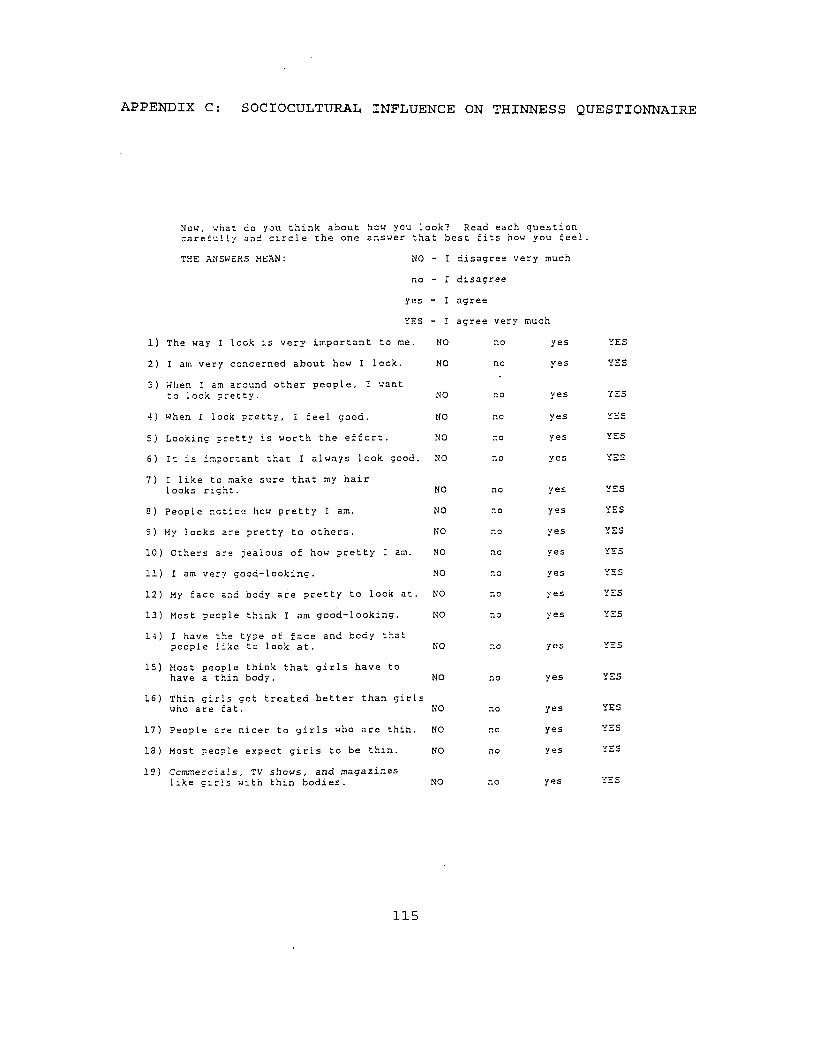
APPENDIX C: SOCIOCULTURAL INFLUENCE ON THINNESS QUESTIONNAIRE
Now, what co you think about hew you look? Read each carefully and circle the one answer that best fits how
question 1 you feel.
THE ANSWERS MEAN: NO - I disagree ve ry much
no - I disagree
yes - I agree
YES - I agree very much
1) The way' I look is very important to me. NO no yes YES
2) I am very concerned about how I lock. NO no yes YES
3) When I am around other people, I want to 1ook pretty. NO no yes YES
4) When I look pretty, I feel good. NO no yes YES
5) Looking pretty is worth the effort. NO no yes YES
6) It is important that I always look good. NO no yes V7C
7) I like to make sure that my hair looks right. NO no yes YES
a) People notice how pretty I am. NO no yes YES
9) My looks are pretty to others. NO no yes YES
10) Others are jealous of how pretty I am. NO nc yes YES
11) I am very good-looking. NO no yes vrc
12) My face and body are pretty to look at. NO no yes YES
13) Most people think I am good-looking. NO no yes YES
14) I have the type of face and body that people like to look at. NO no yes YES
15) Most people think that girls have to have a thin body. NO no yes YES
16) Thin girls get treated better than girls who are fat. NO no yes YES
17) People are nicer to girls who are thin. NO no yes YES
IS) Most people expect girls to be thin. NO no yes YES
19) Commercials, TV shows, and magazines like girls with thin bodies. NO no yes YES
115
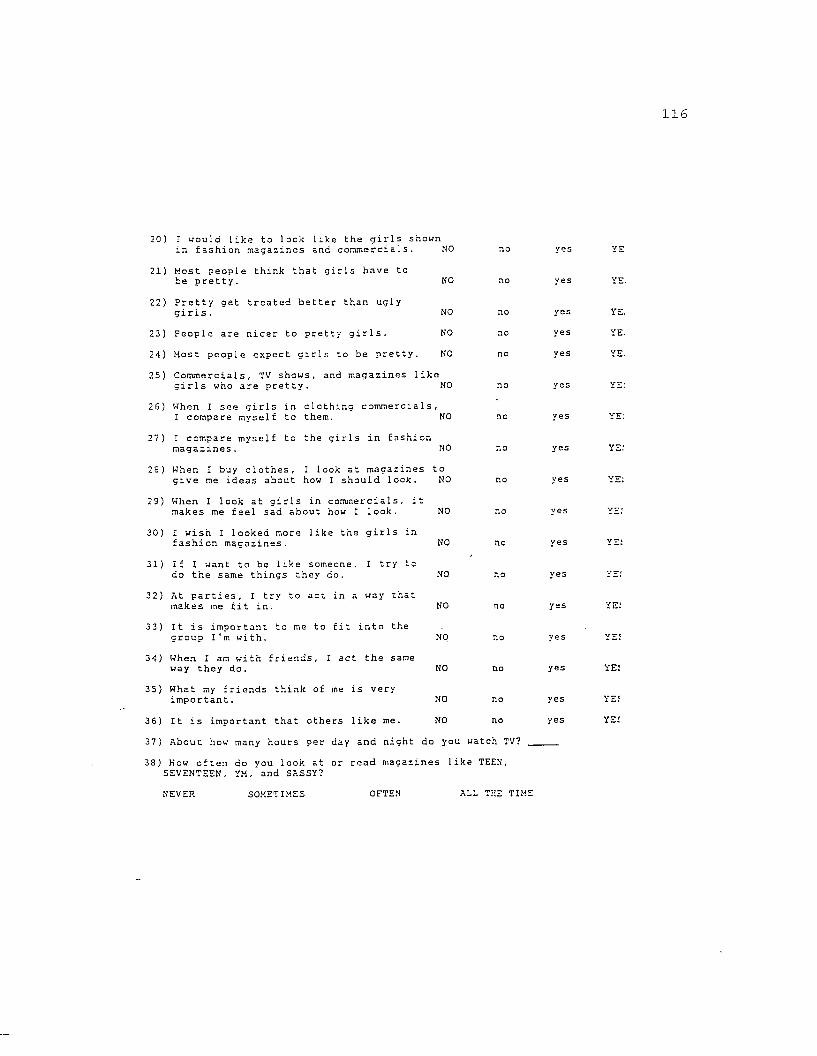
116
20) I would like to look like the girls shown in fashion magazines and commercials. NO
21) Most people think that girls have tohe pretty. NO
22) Pretty get treated better than ugly girls. NO
23) People are nicer to pretty girls. NO
24) Most people expect girls to be pretty. NO
25) Commercials, TV shows, and magazines like girls who are pretty. NO
26) When I see girls in clothing commercials,I compare myself to them. NO
27) I compare myself to the girls in fashionmagazines. NO
no
no
yes
yes
yes
yes
YE.
YE:
YE.
YE:
28) When I buy clothes, I look at magazines togive me ideas about how I should look.
29) When I look at girls in commercials, i makes me feel sad about how I look.
30) I wish I looked more like the girls in fashion magazines.
31) If I want to be like someone, I try to do the same things they do.
32) At parties, I try to act in a way that makes me fit in.
33) It is important to me to fit into the group I'm with.
34) When I am with friends, I act the same way they do.
35) What my friends think of me is very important.
36) It is important that others like me.
NO
NO
NO
NO
NO
NO
NO
NO
NO
no
no
yes
yes
yes
yes
yes
YE!
YE 5
YE!
37) About how many hours per day and night do you watch TV?
38) Kow often do you look at or read magazines like TEEN, SEVENTEEN, YM, and SASSY?
NEVER SOMETIMES O F T E N ALL THE TIME
PLEASE NOTE
Copyrighted materials in this document have not been filmed at the request of the author They are available for consultation, however
in the author’s university library.
APPENDIX D Page 117
University Microfilms International

APPENDIX E: CONSENT FORM
The Department of Psychology at Louisiana State University is conducting a research project investigating eating patterns and body image in children. Principle investigators for the study will be Dr. Donald Williamson, a clinical psychologist and professor at LSU, and Staci Guidry, a doctoral student in clinical psychology at LSU.
As a subject, your child's height and weight will be obtained, and he/she will complete 3 questionnaires. The Children's Eating Attitudes Test measures attitudes toward eating and food. The Children's Depression Inventory measures mood in the past 2 weeks. The Piers-Harris measures self-esteem and attitudes toward one's appearance. Females will also complete a fourth questionnaire regarding social pressure to be thin.
Your child's body image will be assessed individually using the Body Image Assessment (BIA) procedure for children. Nine body image cards are used, and on each card there is a drawing of a femalE or male silhouette whose body size ranges from verY thin to obese. The cards will be placed randomly on your child's desk, and your child will be asked to pick the card which most looks like him/her. The cards are then shuffled and again presented in random order, and the child is asked to pick the card that he/she would most want to look like. The entire procedure generally takes one minute.
All information obtained for this study will be kept confidential, and no one participating will be identified by name if the information appears publicly. As a subject, your child has the right to ask any questions and have them answered to his/her satisfaction. Your child is free to refuse to participate or withdraw from the study at any time. By marking the appropriate statement below and signing this form, you are agreeing to allow your child to participate in this study.Please check the appropriate statement.________ YES, my child does have my permission to participate.________ NO, my child does not have my permission to participate.________ I would like more information before making a decision,
and will contact Staci Guidry at 291-5618 or 765-2672.
Parent/Guardian Signature Date
Parent/Guardian Name (print) Phone Number
Child's Name/Date of Birth (Print) School/Grade
118

APPENDIX F: SUMMARY SHEET
Date______ID Number_ SchoolTeacherGrade___Age_____SexRaceHeight_WeightHas subject begun menstruating? yes no If yes, when did she have her first period?_ChEAT_1
2___3
CD I__________Piers-Harris
Sociocultural Pressure QuestionnaireBIA Cards Used: Child Pre-AdolescentInitial BIA Administration
Both
BIA cards (First set) CBS IBSBIA cards (Second set if used): CBS______ IBS
Discrepancy_
Discrepancy_One-week reliability check:BIA cards (First set) :CBS IBSBIA cards (Second set is used): CBS______ IBS_________Comments
Discrepancy_
Discrepancy_
119
VITAStaci Veron Guidry was born February 28, 1967 in
Franklin, Louisiana. She attended the University of
Southwestern Louisiana, where she graduated Magna Cum Laude in 1988 with a Bachelor of Science degree in psychology. Staci
earned her Master of Arts degree in psychology from Louisiana State University in 1992. She is currently a candidate for the Doctor of Philosophy degree in clinical psychology at
Louisiana State University, and anticipates graduating in August 1994.
120
DOCTORAL EXAMINATION AND DISSERTATION REPORT
Candidate: Staci Veron Guidry
Major Field: Psychology
Title of Dissertation: Development of a Body Image Assessment Procedurefor Children and Pre-Adolescents
Approved:
/ / . i AAA//mA —iW LMajor Professor and Chairman
EXAMINING COMMITTEE;
P/ruiC&s i/t'-u
Date of Examination:
May 10, 1994