development of a cardiovascular disease risk prediction
TRANSCRIPT
1160
J Atheroscler Thromb, 2020; 27: 1160-1175. http://doi.org/10.5551/jat.48843
The official journal of the Japan Atherosclerosis Society and the Asian Pacific Society of Atherosclerosis and Vascular Diseases
Original Article
Aim: To construct a risk prediction model for cardiovascular disease (CVD) based on the Suita study, an urban Japanese cohort study, and compare its accuracy against the Framingham CVD risk score (FRS) model.
Methods: After excluding participants with missing data or those who lost to follow-up, this study consisted of 3,080 men and 3,470 women participants aged 30–79 years without CVD at baseline in 1989–1999. The main outcome of this study was incidence of CVD, defined as the incidence of stroke or coronary heart disease. Multi-variable Cox proportional hazards models with stepwise selection were used to develop the prediction model. To assess model performance, concordance statistics (C-statistics) and their 95% confidence intervals (CIs) were cal-culated using a bootstrap procedure. A calibration test was also conducted.
Results: During a median follow-up period of 16.9 years, 351 men and 241 women developed CVD. We for-mulated risk models with and without electrocardiogram (ECG) data that included age, sex, systolic blood pres-sure, diastolic blood pressure, high-density lipoprotein cholesterol, non-high-density lipoprotein cholesterol, low-density lipoprotein cholesterol, diabetes mellitus, smoking, and urinary protein as risk factors. The C-statistics of the Suita CVD risk models with ECG data (0.782; 95% CI, 0.766–0.799) and without ECG data (0.781; 95% CI, 0.765–0.797) were significantly higher than that of the FRS model (0.768; 95% CI, 0.750–0.785).
Conclusions: The Suita CVD risk model is feasible to use and improves predictability of the incidence of CVD relative to the FRS model in Japan.
(FRS) model3) and the Suita score model for coronary heart diseases (CHDs)4). However, it is usually not convenient for physicians to calculate risks separately by component and integrate them.
Recently, several risk prediction tools for multi-ple CVDs (CHDs and strokes) that are simple to use have been developed. However, such risk prediction tools for multiple CVDs depend on the proportion of CVD components. In other words, most of these risk prediction tools are based mainly on data from West-
Introduction
Cardiovascular diseases (CVDs) continue to be the leading causes of mortality worldwide1, 2). CVD prevention is one of the most urgent concerns to be addressed. One aspect of CVD prevention is to iden-tify individuals with higher risk for CVDs and man-age their risk factors appropriately. Accordingly, many risk prediction tools for CVD components have been developed, such as the Framingham CVD risk score
Copyright©2020 Japan Atherosclerosis SocietyThis article is distributed under the terms of the latest version of CC BY-NC-SA defined by the Creative Commons Attribution License.
Address for correspondence: Michikazu Nakai, Center for Cerebral and Cardiovascular Disease Information, National Cerebral and Cardiovascular Center, 6-1 shinmachi kishibe, Suita-city, Osaka, JAPAN 564-8565 E-mail: [email protected]
Received: January 23, 2019 Accepted for publication: December 19, 2019
Key words: Cohort studies, Risk score model, Stroke, Coronary heart disease
Development of a Cardiovascular Disease Risk Prediction Model Using the Suita Study, a Population-Based Prospective Cohort Study in Japan
Michikazu Nakai1, Makoto Watanabe2, Yoshihiro Kokubo2, Kunihiro Nishimura3, Aya Higashiyama2, 3, Misa Takegami3, Yoko M Nakao2, 3, Tomonori Okamura4 and Yoshihiro Miyamoto1, 2
1Center for Cerebral and Cardiovascular Disease Information, National Cerebral and Cardiovascular Center, Suita, Japan2Department of Preventive Cardiology, National Cerebral and Cardiovascular Center, Suita, Japan3Department of Preventive Medicine and Epidemiologic Informatics, National Cerebral and Cardiovascular Center, Suita, Japan4Department of Preventive Medicine and Public Health, Keio University School of Medicine, Tokyo, Japan

Suita CVD Risk Score
1161
cohort) at the National Cardiovascular Center (NCVC). They have returned every two years for fol-low-up examinations. Informed consent was given by all participants.
We excluded 1,258 participants because they had a previous history of CVD (n=355), were lost to fol-low-up (n=276), had moved to other cities before the baseline examination (n=21), were younger than 30 or older than 79 years at baseline (n=23), had missing data about risk factors (n=172), or did not fast for ≥ 10 hours before blood test (n=411). The remaining 6,550 participants (3,080 men and 3,470 women) were included in the analysis (Fig.1). This cohort study was approved by the NCVC institutional review board in Suita, Japan (M17-001).
Baseline ExaminationsBlood samples were centrifuged immediately
after collection. Routine blood examinations were per-formed, including measurement of total cholesterol (TC), high-density lipoprotein cholesterol (HDL-C), and triglycerides (TG). Well-trained physicians mea-sured blood pressure three times after 5 minutes of rest using a standard mercury sphygmomanometer. The average of the second and third measurements was used for the analysis. Public health nurses obtained information on cigarette smoking status, alcohol drinking habits, and medical history. The cat-egorization of HDL-C in this study was based on cri-teria in the Japan Atherosclerosis Society (JAS) guide-lines25).
In addition to classifying blood pressure accord-ing to the Japanese Society of Hypertension classifica-tion system26), we verified whether medication was
ern countries3, 5-9), where CHDs develop more fre-quently than strokes. In Asians, strokes develop more commonly than CHDs10). In particular, Japan is a country with a remarkably lower incidence of CHDs11). Japanese cohort studies show that strokes develop two times more frequently than CHDs. Stroke prevention remains an essential concern in Japan10, 11).
In the past, two risk prediction tools for multiple CVDs have been developed in Japan, one is based on the Hisayama study12, 13) of CVD incidence in rural southwestern Japan and the other is on the NIPPON-DATA80 study14) of CVD mortality in a representa-tive Japanese population. However, the Hisayama risk prediction tool with a baseline survey from 1988 may not be applicable to the current Japanese population, as most are living in urban areas and rapidly acquiring westernized lifestyles12, 13, 15, 16). Similarly, it would be difficult to use the NIPPONDATA80 risk prediction tool nowadays. Its baseline survey occurred in 1980, and its risk model adopted CVD mortality as the out-come. Age-adjusted CVD mortality has declined con-siderably in the past several decades11, 17). In addition, disease mortality is influenced by advances in thera-peutic technologies and agents as well as disease inci-dence. For greater applicability to more populations, it would be important to make a risk prediction tool with disease incidence reflective of the current urban Japanese population.
Consequently, we have developed a 10-year risk prediction model for multiple CVDs in the Suita study, a recent urban Japanese cohort study. We have compared its accuracy against the FRS model3). More-over, we compared risk models with and without data from electrocardiograms (ECGs), which are often included in health checkups by law in Japan. ECGs can provide useful information for early detection of CVD risk factors such as atrial fibrillation (AF)18).
Methods
PopulationsThe Suita study is a cohort study about CVD
among urban residents in Suita, Japan, that began in 1989. The details of this study have been described elsewhere19-24). Briefly, 12,200 and 3,000 participants aged 30 to 79 years were randomly selected in 1989 and 1996, respectively, from the municipality popula-tion registry of Suita City. Participants were stratified by sex and 10-year age categories. There were 7,808 participants (original cohort: 6,480; secondary cohort: 1,328) who received baseline regular health checkups between September 1989 and March 1996 (original cohort) or April 1996 and March 1999 (secondary
Randomly sampled Suita-city residents at baseline (Total Sample=7,808)
N=355, CVD history N=276, Lost to follow up N=21, moving to other cities N=23, less than 30 or greater than 79 years
Analysis cohort (Total Sample=7,133)
N=172, Missing data of risk factors N=411, Fasting less than 10 hours
Participants (N=6,550 Men:3,080, Women:3,470) Outcome (N=592 Men:351, Women:241)
Fig.1. Flow-chart of study participants

Nakai et al.
1162
Revision (ICD-10) codes: I200–I259) and fatal stroke (ICD-10 code: I60–I699) on the basis of the underly-ing cause of death on death certificates provided by the Ministry of Health, Welfare, and Labour (MHWL). In Japan, the MHWL accumulates death certificates by law and codes them on the basis of ICD codes to compile national vital statistics. The criteria for myocardial infarction (MI) were based on the World Health Organization Monitoring of Trends and Determinants in Cardiovascular Disease project (MONICA)28). CHD consisted of coronary angio-plasty, coronary artery bypass grafting, and sudden cardiac death within 24 hours. Stroke was defined according to criteria from the U.S. National Survey of Stroke29), which was based on computed tomography findings. Strokes were classified on the basis of com-puted tomography, magnetic resonance imaging, and autopsy findings.
Statistical AnalysisAnalysis of variance and χ2 tests were used to
compare means and frequencies. Age-adjusted multi-variable Cox proportional hazards modeling was per-formed. Stepwise selection was used to develop the best risk prediction model. We constructed two mod-els, one with ECG data and another without ECG data. Risk factors included sex, age, SBP, DBP, HDL-C, non-HDL-C, LDL-C, smoking status, DM, and urinary protein. When each value of blood pressures (SBP and DBP) or lipid profiles (LDL-C and non-HDL-C) belonged to different categories, we adopted the higher category to estimate hazard ratios, regres-sion coefficients, or scores. To derive the risk score for each variable, coefficients were multiplied by a factor of 10 to allow for integer scores. The total score was calculated as the sum of the individual weighted scores. Total FRS was calculated according to CVD points for both men and women, as previously described30). The CVD risk prediction models were translated into a risk score sheet using methods devel-oped in the Framingham Heart Study30). In order to estimate the 10-year risk probability for a CVD inci-dent, the equation 1-S0(t)exp(xib) is used, where S0(t) is the baseline survival function at the follow-up time (t=10 years) and xib is a linear predictor of the total score for each participant from the fitted model. Then, the estimated cardiovascular risk score at 10 years for each category was calculated as the average 10-year risk for CVD events in the corresponding category.
Furthermore, we evaluated the discriminatory ability of the risk models using concordance statistics (C-statistics)31-33) and 95% confidence intervals (CIs) with 200 iterations of a bootstrap method. Parameters were defined on the basis of the assumption that a
significantly effective. In Supplemental Table 1, we compared the following groups: (i) participants who took anti-hypertensive drugs and had decreased blood pressure, considered normal (systolic blood pressure (SBP) <140 mmHg and diastolic blood pressure (DBP) <90 mmHg), and (ii) participants who took anti-hypertensive drugs with no change in blood pres-sure, considered to have high blood pressure (SBP ≥ 140 mmHg or DBP ≥ 90 mmHg). There were no sig-nificant differences in both univariable (P=0.554) and multivariable (P=0.712 with ECG; P=0.669 without ECG) models. In addition, we compared (i) partici-pants who took anti-hypertensive drugs and had decreased blood pressure, considered normal, and (iii) patients with Stage II hypertension (SBP ≥ 160 mmHg or DBP ≥ 90 mmHg). There were no statisti-cal differences in univariable (P=0.477) and multi-variable (P=0.552 with ECG; P=0.551 without ECG) models. Therefore, we have combined these groups into the same category if SBP ≥ 160 mmHg or DBP ≥ 100 mmHg or if they were taking medication.
Since CVD risk increases with age, categories for age were based on 10-year intervals up to age 60 years and 5-year intervals thereafter. Diabetes mellitus (DM) is defined as having a fasting blood glucose level of ≥ 126 mg/dL, currently using anti-diabetic medication, or both. Cigarette smoking was dichotomized as cur-rent versus other. Low-density lipoprotein cholesterol (LDL-C) was calculated using the Friedewald equa-tion27). Non-HDL-C was calculated by subtracting HDL-C from TG. If the TG level was greater than 400 mg/dL, we set the value as missing (n=96).
A standard 12-lead ECG was obtained from all participants. Each ECG was coded independently using the Minnesota Code by two well-trained physi-cians. On the basis of the Minnesota Code classifica-tion system, AF was defined as 8-3-1, and left ventric-ular hypertrophy (LVH) was defined as both 3-1 and ST-T change (4-1-1, 4-1-2, 4-2, 4-3, 5-1, 5-2, or 5-3).
Definition of CVDsThe end of the follow-up period was on (1) the
date of the first CHD or stroke event, (2) the date of death, (3) the date of leaving Suita City, or (4) December 31, 2013 (censored), whichever came first.
Follow-Up SurveyThe health status of each participant was checked
during clinical visits every 2 years and through a yearly questionnaire by mail or telephone. Medical records of participants with suspected CHD or stroke were reviewed by registered hospital physicians who were blinded to the baseline information. We defined fatal CHD (International Classification of Diseases 10th

Suita CVD Risk Score
1163
ware program, version 9.4 (SAS Institute, Cary, NC, USA), and the STATA software program, version 14.2 (StataCorp LP, College Station, TX, USA).
Results
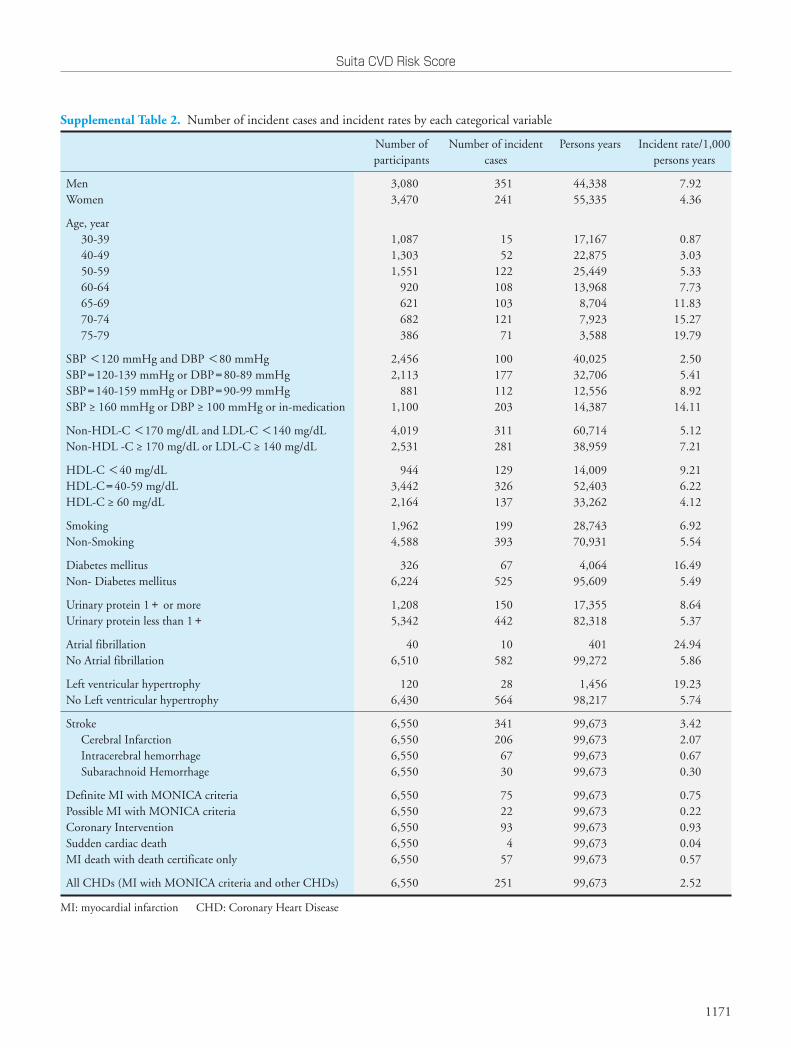
During the median follow-up period of 16.9 years with 99,673 person-years (original cohort: median, 18.8 years with 84,870 person-years; second-ary cohort: median, 16.1 years with 14,803 person-years), 351 men developed CVDs, consisting of 164 CHDs and 187 strokes. In addition, 241 women developed CVDs, consisting of 87 CHDs and 154 strokes. CHDs included 75 definite MIs, 22 possible MIs, 93 coronary interventions, 4 sudden cardiac deaths, and 57 fatal MIs on the basis of death certifi-cate data only. Strokes consisted of 206 cerebral infarc-tions, 67 intracerebral hemorrhages, 30 subarachnoid hemorrhages, and 38 strokes of unknown type. Among strokes, 59 were detected on the basis of only death certificate data.
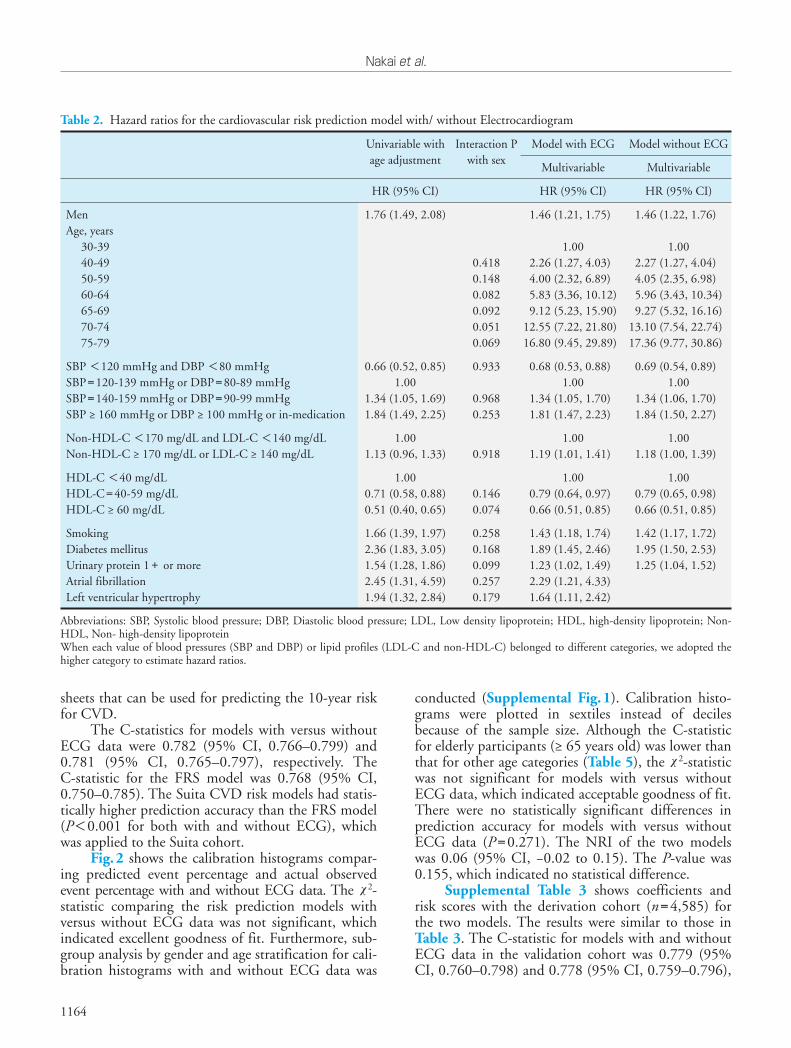
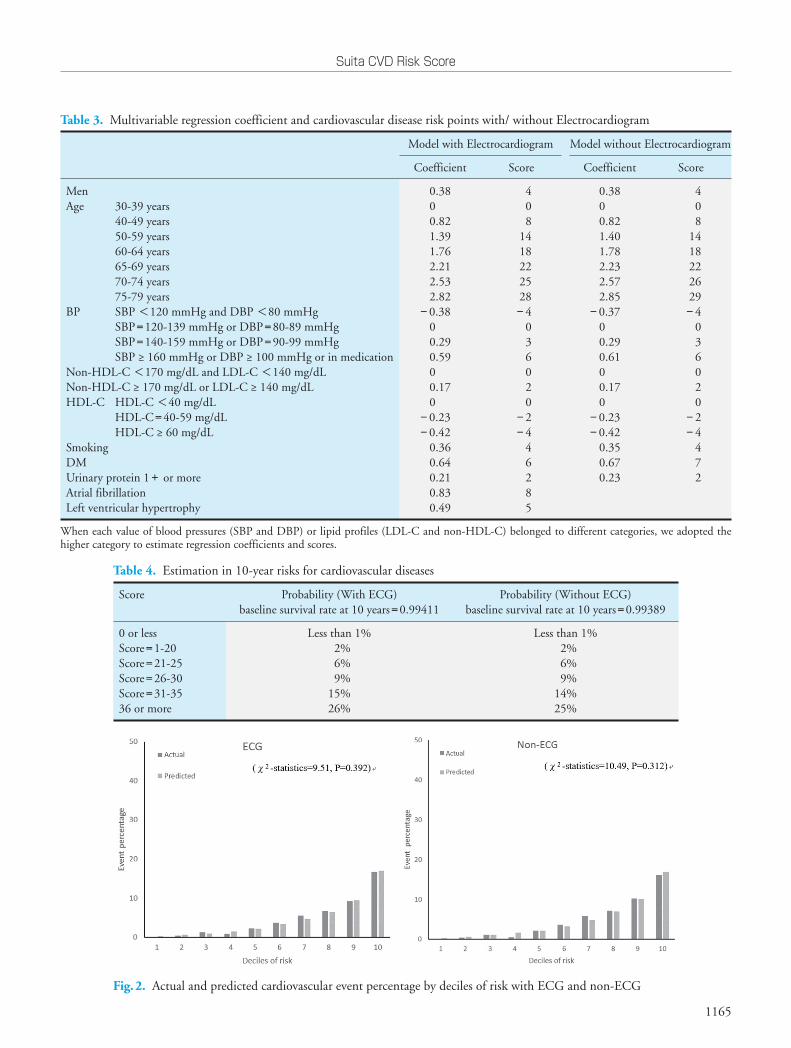
Table 1 shows risk factors by sex. All factors are significantly different between males and females except for anti-hypertensive medication and LVH. Age-adjusted multivariable hazard ratios from the risk prediction models are shown in Table 2. Incidence rates for each categorical variable are shown in Sup-plemental Table 2. Tables 3 and 4 provide risk score
population of bivariate data pairs of the form (Xi, Yi) exists. On the basis of a scheme for sampling pairs of pairs [(Xi, Yi), (Xj, Yj)] from that population, a pair of pairs was considered concordant if the larger X value was paired with the smaller Y value. The C-statistic represents the conditional probability of concordance plus half of the conditional probability that the data pairs are neither concordant nor discordant, assuming that the two Y-values can be ordered33). STATA com-mands somersd and lincom were used to calculate C-statistics and confidence limits and to compare the accuracy of our models and that of the FRS model on the basis of P values. To assess the calibration of our risk prediction models, we used the modified Hos-mer–Lemeshow test (also called the Gronnesby and Borgan test) to evaluate predicted event percentage and actual observed event percentage within 10 years by deciles or sextiles of risk scores as a sub-analysis.
To explore the consistency of the risk score devel-oped, 70% of the study participants (n=4,585) were randomly assigned to the risk prediction model as a derivation cohort, and the remaining 30% (n=1,965) were reserved to validate the risk score assigned by the derivation cohort. Finally, we evaluated a category-free version of net reclassification improvement (NRI (>0)) proposed by Pencina et al.34, 35) We followed the procedures as outlined by Goldman et al.36).
All analyses were performed using the SAS soft-
Table 1. Baseline characteristics and incident cardiovascular disease during the follow-up by sex
Men (n =3,080) Women (n =3,470) P-value
Age, yearsBody mass index kg/m2
Systolic blood pressure, mmHgDiastolic blood pressure, mmHgLow density lipoprotein cholesterol, mg/dLHigh density lipoprotein cholesterol, mg/dLNon- high-density lipoprotein cholesterol, mg/dLCreatinine, mg/dLestimated glomerular filtration rate, mL/min/1.73 m2
Cigarette smoking, %Count of cigarettes per day
Alcohol drinking, %Antihypertensive drug, %Diabetes mellitus, %Urinary protein 1+ or more, %Atrial Fibrillation, %Left Ventricular Hypertrophy, %
56±1322.8±2.9128±21
80±12123±33
50±14151±350.90±0.2889.0±32.1
50.3%24±1275.2%11.4%
6.6%20.6%
1.0%1.9%
54±1322.2±3.3125±22
76±12133±35
58±14154±390.68±0.2192.9±28.6
11.9%15±932.4%10.7%
3.6%16.6%
0.3%1.8%
<0.001<0.001<0.001<0.001<0.001<0.001<0.001<0.001
0.0061<0.001<0.001<0.001
0.34<0.001<0.001<0.001
0.77
Cumulative incidence of cardiovascular disease, %Cumulative incidence of Stroke, %Cumulative incidence of coronary heart disease, %
11.4%6.4%5.6%
6.9%4.5%2.6%
<0.0010.001
<0.001
Means with standard deviations were shown
Nakai et al.
1164
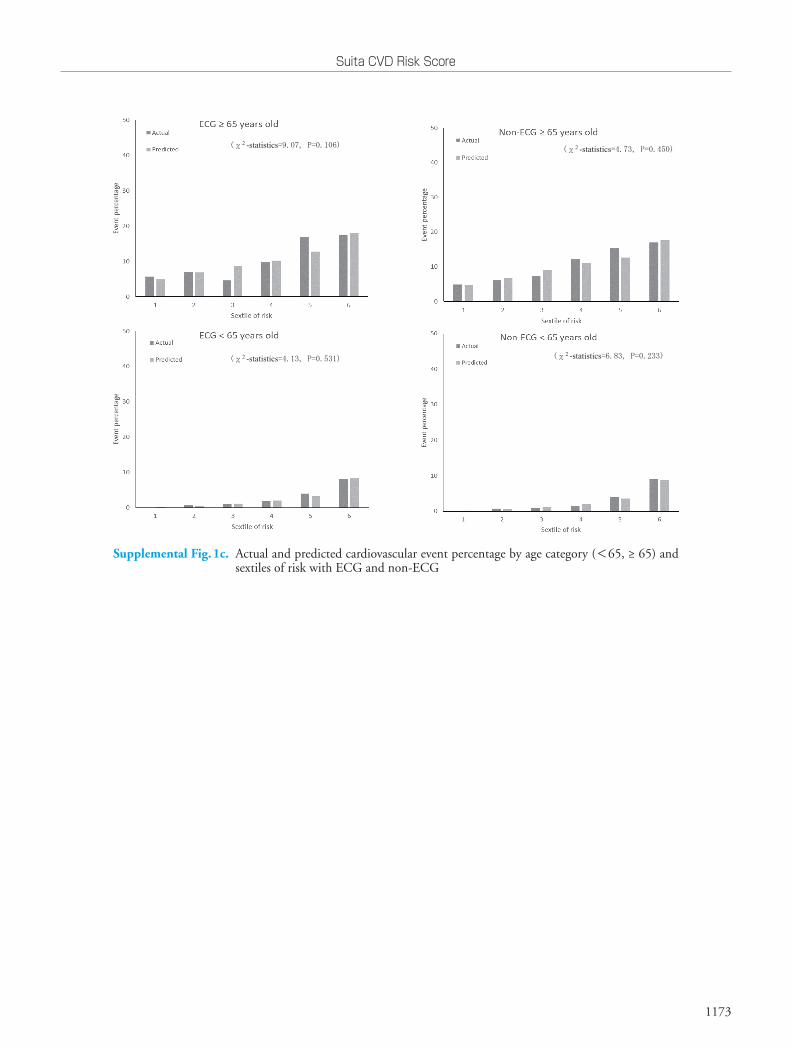
conducted (Supplemental Fig.1). Calibration histo-grams were plotted in sextiles instead of deciles because of the sample size. Although the C-statistic for elderly participants (≥ 65 years old) was lower than that for other age categories (Table 5), the χ2-statistic was not significant for models with versus without ECG data, which indicated acceptable goodness of fit. There were no statistically significant differences in prediction accuracy for models with versus without ECG data (P=0.271). The NRI of the two models was 0.06 (95% CI, −0.02 to 0.15). The P-value was 0.155, which indicated no statistical difference.
Supplemental Table 3 shows coefficients and risk scores with the derivation cohort (n=4,585) for the two models. The results were similar to those in Table 3. The C-statistic for models with and without ECG data in the validation cohort was 0.779 (95% CI, 0.760–0.798) and 0.778 (95% CI, 0.759–0.796),
sheets that can be used for predicting the 10-year risk for CVD.
The C-statistics for models with versus without ECG data were 0.782 (95% CI, 0.766–0.799) and 0.781 (95% CI, 0.765–0.797), respectively. The C-statistic for the FRS model was 0.768 (95% CI, 0.750–0.785). The Suita CVD risk models had statis-tically higher prediction accuracy than the FRS model (P<0.001 for both with and without ECG), which was applied to the Suita cohort.
Fig.2 shows the calibration histograms compar-ing predicted event percentage and actual observed event percentage with and without ECG data. The χ2- statistic comparing the risk prediction models with versus without ECG data was not significant, which indicated excellent goodness of fit. Furthermore, sub-group analysis by gender and age stratification for cali-bration histograms with and without ECG data was
Table 2. Hazard ratios for the cardiovascular risk prediction model with/ without Electrocardiogram
Univariable with age adjustment
Interaction P with sex
Model with ECG Model without ECG
Multivariable Multivariable
HR (95% CI) HR (95% CI) HR (95% CI)
MenAge, years
30-3940-4950-5960-6465-6970-7475-79
1.76 (1.49, 2.08)
0.4180.1480.0820.0920.0510.069
1.46 (1.21, 1.75)
1.002.26 (1.27, 4.03)4.00 (2.32, 6.89)5.83 (3.36, 10.12)9.12 (5.23, 15.90)
12.55 (7.22, 21.80)16.80 (9.45, 29.89)
1.46 (1.22, 1.76)
1.002.27 (1.27, 4.04)4.05 (2.35, 6.98)5.96 (3.43, 10.34)9.27 (5.32, 16.16)
13.10 (7.54, 22.74)17.36 (9.77, 30.86)
SBP <120 mmHg and DBP <80 mmHgSBP=120-139 mmHg or DBP=80-89 mmHgSBP=140-159 mmHg or DBP=90-99 mmHgSBP ≥ 160 mmHg or DBP ≥ 100 mmHg or in-medication
0.66 (0.52, 0.85)1.00
1.34 (1.05, 1.69)1.84 (1.49, 2.25)
0.933
0.9680.253
0.68 (0.53, 0.88)1.00
1.34 (1.05, 1.70)1.81 (1.47, 2.23)
0.69 (0.54, 0.89)1.00
1.34 (1.06, 1.70)1.84 (1.50, 2.27)
Non-HDL-C <170 mg/dL and LDL-C <140 mg/dLNon-HDL-C ≥ 170 mg/dL or LDL-C ≥ 140 mg/dL
1.00 1.13 (0.96, 1.33)
0.918
1.00 1.19 (1.01, 1.41)
1.00 1.18 (1.00, 1.39)
HDL-C <40 mg/dLHDL-C=40-59 mg/dLHDL-C ≥ 60 mg/dL
1.000.71 (0.58, 0.88)0.51 (0.40, 0.65)
0.1460.074
1.000.79 (0.64, 0.97)0.66 (0.51, 0.85)
1.000.79 (0.65, 0.98)0.66 (0.51, 0.85)
SmokingDiabetes mellitus Urinary protein 1+ or moreAtrial fibrillationLeft ventricular hypertrophy
1.66 (1.39, 1.97)2.36 (1.83, 3.05)1.54 (1.28, 1.86)2.45 (1.31, 4.59)1.94 (1.32, 2.84)
0.2580.1680.0990.2570.179
1.43 (1.18, 1.74)1.89 (1.45, 2.46)1.23 (1.02, 1.49)2.29 (1.21, 4.33)1.64 (1.11, 2.42)
1.42 (1.17, 1.72)1.95 (1.50, 2.53)1.25 (1.04, 1.52)
Abbreviations: SBP, Systolic blood pressure; DBP, Diastolic blood pressure; LDL, Low density lipoprotein; HDL, high-density lipoprotein; Non-HDL, Non- high-density lipoproteinWhen each value of blood pressures (SBP and DBP) or lipid profiles (LDL-C and non-HDL-C) belonged to different categories, we adopted the higher category to estimate hazard ratios.
Suita CVD Risk Score
1165
Fig.2. Actual and predicted cardiovascular event percentage by deciles of risk with ECG and non-ECG
Table 3. Multivariable regression coefficient and cardiovascular disease risk points with/ without Electrocardiogram
Model with Electrocardiogram Model without Electrocardiogram
Coefficient Score Coefficient Score
MenAge 30-39 years 40-49 years 50-59 years 60-64 years 65-69 years 70-74 years 75-79 yearsBP SBP <120 mmHg and DBP <80 mmHg SBP=120-139 mmHg or DBP=80-89 mmHg SBP=140-159 mmHg or DBP=90-99 mmHg SBP ≥ 160 mmHg or DBP ≥ 100 mmHg or in medicationNon-HDL-C <170 mg/dL and LDL-C <140 mg/dLNon-HDL-C ≥ 170 mg/dL or LDL-C ≥ 140 mg/dLHDL-C HDL-C <40 mg/dL HDL-C=40-59 mg/dL HDL-C ≥ 60 mg/dL SmokingDMUrinary protein 1+ or moreAtrial fibrillationLeft ventricular hypertrophy
0.3800.821.391.762.212.532.82
-0.3800.290.5900.17 0
-0.23-0.42
0.360.640.210.830.49
408
1418222528-4
036020
-2-4
46285
0.3800.821.401.782.232.572.85
-0.3700.290.6100.170
-0.23-0.42
0.350.670.23
408
1418222629-4
036020
-2-4
472
When each value of blood pressures (SBP and DBP) or lipid profiles (LDL-C and non-HDL-C) belonged to different categories, we adopted the higher category to estimate regression coefficients and scores.
Table 4. Estimation in 10-year risks for cardiovascular diseases
Score Probability (With ECG)baseline survival rate at 10 years=0.99411
Probability (Without ECG)baseline survival rate at 10 years=0.99389
0 or lessScore=1-20Score=21-25Score=26-30Score=31-3536 or more
Less than 1%2%6%9%
15%26%
Less than 1%2%6%9%
14%25%

Nakai et al.
1166
significant differences between the two models. ECG is often examined as part of health checkups in Japan. The FRS model also includes AF and LVH as impor-tant indexes38). Thus, it is important to determine if ECG should be included in the Japanese CVD risk model; this was the first attempt to use a Japanese cohort study. The results showed that the model with-out ECG data performed as accurately as the model with ECG in a Japanese CVD risk model. Applying the model with or without ECG data could depend on user preference.
The Suita CVD risk model was more applicable to Japanese individuals than the FRS model. Needless to say, this would be because of clinical differences between different populations, such as cholesterol lev-els or disease composition (stroke or CHD). The Hisayama study, a cohort study in rural Japan that began in the 1990s, presented a new CVD risk model with stroke and CHD39). The Suita CVD risk model included similar variables and had results similar to those of the Hisayama study. However, we are not able to directly compare these two models using statistical methods. Another report based on the Hisayama study40) showed that the recent ratio of stroke to CHD incidence is decreasing (men 1.3, women 2.5), which was close to that in the Suita study (men 1.1, women 1.8). This indicates that differences in disease composition between rural and urban areas in Japan are getting smaller because lifestyles throughout Japan are becoming more westernized and homogenized.
Several limitations of this study should be dis-cussed. First, this Suita CVD risk model was formu-lated on the basis of limited samples from a limited area. External validation with other cohort studies was not conducted. However, we did evaluate internal val-idation by generating histograms between predicted event percentage and actual observed event percentage and analyzed C-statistics using a bootstrap method. Second, the C-statistic in elderly participants was lower because of the small sample size. The proportion of elderly participants in this population was only 25.8% (n=1,689), which may have decreased power in the analysis. The goodness of fit test indicated a
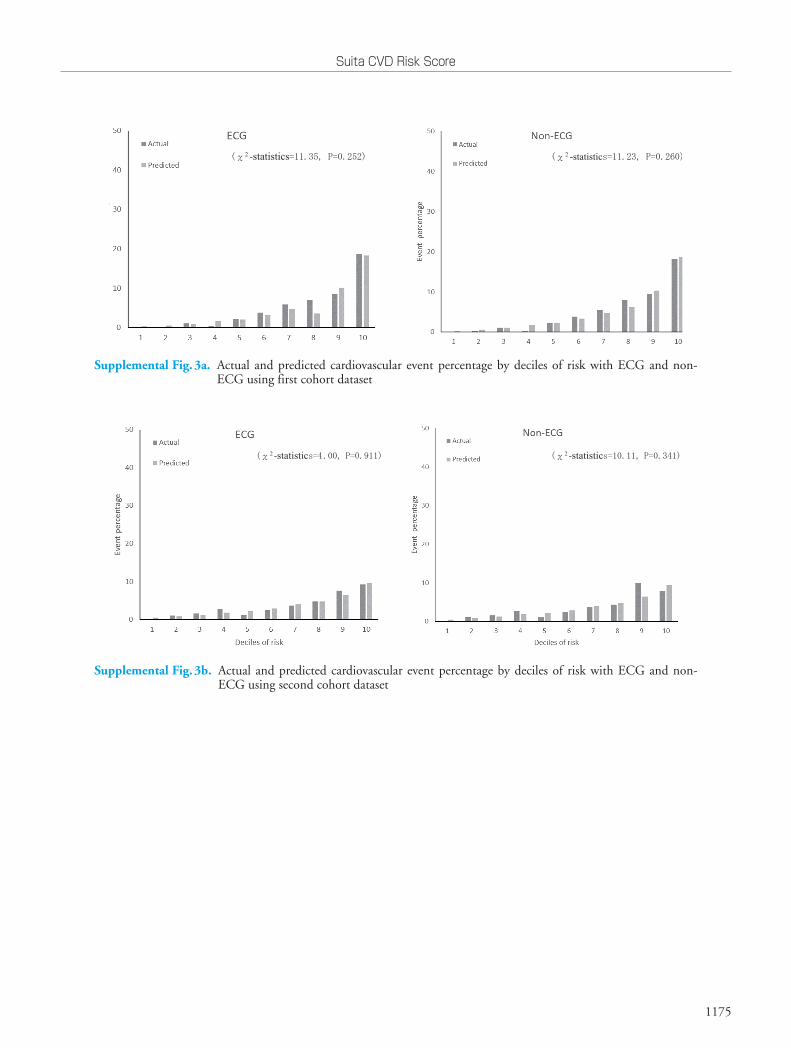
respectively. Since the C-statistic of the FRS model that was applied to the Suita cohort was 0.765 (95% CI, 0.746–0.784), our models had higher accuracy (P =0.005 with ECG; P=0.012 without ECG). The cal-ibration histograms comparing predicted event per-centage and actual observed event percentage with versus without ECG data in the validation cohort were not significantly different (Supplemental Fig.2). The models with versus without ECG data had simi-lar prediction accuracy (P=0.436). The χ2 test showed no significant differences between the model with ECG data and the model without ECG data (Supple-mental Fig.3).
Discussion
In this study, we developed a new 10-year Suita CVD risk model and demonstrated it had higher accuracy than the FRS model among urban Japanese individuals, who have a relatively high incidence of CHD but still lower than those in the United States. Since most of the Japanese population currently lives in urban areas16), the Suita CVD risk model could be applicable to considerably more Japanese individuals, making it a useful tool for the prevention of CVDs.
According to the 2017 JAS guidelines, LDL-C and HDL-C levels should be tested during the initial screening in clinical settings. If the LDL-C value is above 120 mg/dL, non-HDL-C is carefully tested. Several papers in Japan also reported the relationship between the non-HDL-C value and incident CHDs20, 21, 37). Instead of using only the TC value, this Suita CVD risk model can select either non-HDL-C or LDL-C as factors. Therefore, the Suita CVD risk model would be very convenient because two risk fac-tors for dyslipidemia can be applied simultaneously. Furthermore, this model is the first reported risk pre-diction tool with non-HDL-C in Japan, which could lead to increased use of non-HDL-C in primary care settings.
In addition, we constructed two risk models, a model with ECG data and a model without ECG data. According to C-statistics and NRI, there were no
Table 5. C-statistics by sex and age categories (<65, ≥ 65) in the Suita CVD risk model with and without Electrocardiogram
C-statistic (95% Confidence Interval)
Model with ECG Model without ECG
MenWomenAge ≥ 65 years oldAge <65 years old
0.754 (0.732, 0.775)0.794 (0.771, 0.818)0.645 (0.613, 0.678)0.764 (0.737, 0.790)
0.752 (0.731, 0.774)0.794 (0.770, 0.817)0.643 (0.610, 0.675)0.763 (0.737, 0.789)
Suita CVD Risk Score
1167
nal validation of this model.
Conflict of Interest
Kunihiro Nishimura received research findings from Philips Japan, Ltd.; Tokyo Electric Power Com-pany; Terumo Company; and Miraka Holdings. The other authors declare no conflicts of interest.
Acknowledgments
We sincerely appreciate the members of the Suita Medical Foundation and the Suita City Health Cen-ter. We thank all researchers and medical staff in the Department of Preventive Cardiology, National Cere-bral and Cardiovascular Center, for their excellent medical examinations and follow-up surveys. We also thank Satsuki-Junyukai, the society members of the Suita study. We appreciate the comments and sugges-tions from four anonymous reviewers that improved this manuscript significantly.
This study was supported by Health and Labour Sciences Research Grants (H27-Junkankitou-Ippan-009, H29-Junkankitou-Ippan-003, H30-Junk-ankitou-Ippan-005), the Intramural Research Fund of the National Cerebral and Cardiovascular Center (27-4-3), and a Grant-in-Aid for Scientific Research B (No. 16H05252).
References1) World Health Organization. The atlas of heart disease and
stroke. World Health Organization, Geneva, 20042) Vital Statistics of Japan, 2010, Tokyo. Health and Welfare
Statistical Association 20103) D’Agostino RB Sr, Vasan RS, Pencina MJ, Wolf PA,
Cobain M, Massaro JM, Kannel WB. General cardiovas-cular risk profile for use in primary care: the Framingham Heart Study. Circulation, 2008; 117: 743-753
4) Nishimura K, Okamura T, Watanabe M, Nakai M, Take-gami M, Higashiyama A, Kokubo Y, Okayama A, Miya-moto Y. Predicting Coronary Heart Disease Using Risk Factor Categories for a Japanese Urban Population, and Comparison with the Framingham Risk Score: The Suita Study. J Atheroscler Thromb, 2014; 21: 784-798
5) Hippisley-Cox J, Coupland C, Vinogradova Y, Robson J, Minhas R, Sheikh A, Brindle P. Predicting cardiovascular risk in England and Wales: prospective derivation and val-idation of QRISK2. BMJ, 2008; 336: 1475-1482
6) Conroy RM, Pyörälä K, Fitzgerald AP, Sans S, Menotti A, De Backer G, De Bacquer D, Ducimetière P, Jousilahti P, Keil U, Njølstad I, Oganov RG, Thomsen T, Tunstall-Pedoe H, Tverdal A, Wedel H, Whincup P, Wilhelmsen L, Graham IM. SCORE project group. Estimation of ten-year risk of fatal cardiovascular disease in Europe: the SCORE project. Eur Heart J, 2003; 24: 987-1003
7) Woodward M, Brindle P, Tunstall-Pedoe H. SIGN group
good fit among elderly participants. Furthermore, Vliegenthart et al. have shown that coronary calcifica-tion improves CVD prediction among elderly individ-uals, but our cohort study did not collect data about coronary calcification41). Third, the generalizability of this risk score is limited. We cannot conclude that this risk model is applicable to all urban Japanese residents because the cohort study was based in a single city. However, as stated above, there is a possibility that the risk model in this study may be partly applicable to residents in rural areas since most of Japan has been westernizing rapidly in the past 30 years. Fourth, there were 3,271 participants who were censored for deaths from other causes (n=181), left Suita City (n=762), and withdrew from the study and with other reasons (n=2,328). Among participants who died, we might have missed CVD events before death if the partici-pant did not answer yearly questionnaires or attended clinical visits for CVD follow-up. We might not have been able to detect CVD events after participants left Suita City or withdrew from the study. Consequently, such a large number of censored participants might have led to a decrease in the absolute risk for CVDs, thus unexpectedly biasing the results. Fifth, approxi-mately 20% of CVD events were detected on the basis of the data on the underlying causes of death found only in death certificates. This might bias the results because of relatively low accuracy of diagnosis on death certificates. Additionally, the methods to fill in death certificates substantially changed in 1995, but the proportions of CVD events detected with death certificates only were similar before and after 1995. We think such major changes did not systematically impact the analysis results. Finally, the Suita CVD risk model did not include chronic kidney disease, which was included in a previous Suita CHD risk model4). In this study, since the baseline period was extended to 1999, there were two methods used to measure serum creatinine. It is possible to calculate estimated glomerular filtration rate with each method using dif-ferent equations, but the creatinine measurement methods were not compatible and results could not be standardized.
Conclusion
We developed a 10-year Suita CVD risk model for an urban Japanese population. Compared with a previous model, ours has better predictability and fea-sibility. This new risk score model could be widely applicable to urbanized Japanese individuals. It is fea-sible enough to be used during health checkups or in primary care settings in Japan. Further studies with relatively large samples should be conducted for exter-

Nakai et al.
1168
protein cholesterol and non-high-density lipoprotein cho-lesterol and the incidence of cardiovascular disease in an urban Japanese cohort study: The Suita study. Atheroscle-rosis, 2009; 203: 587-592
21) Okamura T, Kokubo Y, Watanabe M, Higashiyama A, Ono Y, Miyamoto Y, Yoshimasa Y, Okayama A. Triglycer-ides and non-high-density lipoprotein cholesterol and the incidence of cardiovascular disease in an urban Japanese cohort: the Suita study. Atherosclerosis, 2010; 209: 290-294
22) Kokubo Y, Nakamura S, Okamura T, Yoshimasa Y, Makino H, Watanabe M, Higashiyama A, Kamide K, Kawanishi K, Okayama A, Kawano Y. Relationship between blood pressure category and incidence of stroke and myocardial infarction in an urban Japanese popula-tion with and without chronic kidney disease: the Suita Study. Stroke, 2009; 40: 2674-2679
23) Higashiyama A, Okamura T, Ono Y, Watanabe M, Kokubo Y, Okayama A. Risk of smoking and metabolic syndrome for incidence of cardiovascular disease--com-parison of relative contribution in urban Japanese popula-tion: the Suita study. Circ J, 2009; 73: 2258-2263
24) Watanabe M, Kokubo Y, Higashiyama A, Ono Y, Okayama A, Okamura T. New diagnosis criteria for dia-betes with hemoglobin A1c and risks of macro-vascular complications in an urban Japanese cohort: the Suita study. Diabetes Res Clin Pract, 2010; 88: e20-3
25) Kinoshita M, Yokote K, Arai H, Iida M, Ishigaki Y, Ishi-bashi S, Umemoto S, Egusa G, Ohmura H, Okamura T, Kihara S, Koba S, Saito I, Shoji T, Daida H, Tsukamoto K, Deguchi J, Dohi S, Dobashi K, Hamaguchi H, Hara M, Hiro T, Biro S, Fujioka Y, Maruyama C, Miyamoto Y, Murakami Y, Yokode M, Yoshida H, Rakugi H, Wakat-suki A, Yamashita S; Committee for Epidemiology and Clinical Management of Atherosclerosis. Japan Athero-sclerosis Society (JAS) Guidelines for Prevention of Ath-erosclerotic Cardiovascular Diseases 2017. J Atheroscler Thromb, 2018; 25: 846-984
26) Shimamoto K, Ando K, Fujita T, Hasebe N, Higaki J, Horiuchi M, Imai Y, Imaizumi T, Ishimitsu T, Ito M, Ito S, Itoh H, Iwao H, Kai H, Kario K, Kashihara N, Kawano Y, Kim-Mitsuyama S, Kimura G, Kohara K, Komuro I, Kumagai H, Matsuura H, Miura K, Morishita R, Naruse M, Node K, Ohya Y, Rakugi H, Saito I, Saitoh S, Shimada K, Shimosawa T, Suzuki H, Tamura K, Tana-hashi N, Tsuchihashi T, Uchiyama M, Ueda S, Umemura S; Japanese Society of Hypertension Committee for Guidelines for the Management of Hypertension. The Japanese Society of Hypertension Guidelines for the Man-agement of Hypertension (JSH 2014). Hypertens Res, 2014; 37: 253-390
27) Friedewald WT, Levy RI, Fredrickson DS. Estimation of the concentration of low-density lipoprotein cholesterol in plasma, without use of the preparative ultracentrifuge. Clin Chem, 1972; 18: 499-502
28) The World Health Organization MONICA Project (monitoring trends and determinants in cardiovascular disease): a major international collaboration. WHO MONICA Project Principal Investigators. J Clin Epide-miol, 1988; 41: 105-114
29) Walker AE, Robins M, Weinfeld FD. The national survey
on risk estimation. Adding social deprivation and family history to cardiovascular risk assessment: the ASSIGN score from the Scottish Heart Health Extended Cohort (SHHEC). Heart, 2007; 93: 172-176
8) Siontis GC, Tzoulaki I, Siontis KC, Ioannidis JP. Com-parisons of established risk prediction models for cardio-vascular disease: systematic review. BMJ, 2012; 24: 344
9) Stout KK, Daniels CJ, Aboulhosn JA, Bozkurt B, Broberg CS, Colman JM, Crumb SR, Dearani JA, Fuller S, Gur-vitz M, Khairy P, Landzberg MJ, Saidi A, Valente AM, Van Hare GF. 2018 AHA/ACC Guideline for the Man-agement of Adults With Congenital Heart Disease: Exec-utive Summary: A Report of the American College of Cardiology/American Heart Association Task Force on Clinical Practice Guidelines. J Am Coll Cardiol, 2018; pii: S0735-1097:36845-1
10) Ueshima H, Sekikawa A, Miura K, Turin TC, Takashima N, Kita Y, Watanabe M, Kadota A, Okuda N, Kadowaki T, Nakamura Y, Okamura T. Cardiovascular disease and risk factors in Asia: a selected review. Circulation, 2008; 118: 2702-2709
11) Ueshima H. Explanation for the Japanese Pradox: Preven-tion of increase in coronary heart disease and reduction in stroke. J Atheroscler Thromb, 2007; 14: 278-286
12) Arima H, Yonemoto K, Doi Y, Ninomiya T, Hata J, Tani-zaki Y, Fukuhara M, Matsumura K, Iida M, Kiyohara Y. Development and validation of a cardiovascular risk pre-diction model for Japanese: the Hisayama study. Hyper-tens Res, 2009; 32: 1119-1122
13) Honda T, Yoshida D, Hata J, Hirakawa Y, Ishida Y, Shi-bata M, Sakata S, Kitazono T, Ninomiya T. Development and validation of modified risk prediction models for car-diovascular disease and its subtypes: The Hisayama Study. Atherosclerosis, 2018; 279: 38-44
14) NIPPON DATA80 Research Group. Risk assessment chart for death from cardiovascular disease based on a 19-year follow-up study of a Japanese representative pop-ulation. Circ J, 2006; 70: 1249-1255
15) Shiba N, Nochioka K, Miura M, Kohno H, Shimokawa H. CHART-2 Investigators. Trend of westernization of etiology and clinical characteristics of heart failure patients in Japan--first report from the CHART-2 study. Circ J, 2011; 75: 823-833
16) Ministry of Internal Affairs and Communications, Statis-tics Bureau, Available at:https://www.stat.go.jp/data/kokusei/2010/final/pdf/01-02.pdf (Access Nov 6,2019)
17) Journal of Health and Welfare Statistics (In Japanese), Health, Labour and Welfare Statistics Association, 2013/2014,60,101
18) McClure LA, Kleindorfer DO, Kissela BM, Cushman M, Soliman EZ, Howard G. Assessing the performance of the Framingham Stroke Risk Score in the reasons for geo-graphic and racial differences in stroke cohort. Stroke, 2014; 45: 1716-1720
19) Kokubo Y, Kamide K, Okamura T, Watanabe M, Higashi-yama A, Kawanishi K, Okayama A, Kawano Y. Impact of high-normal blood pressure on the risk of cardiovascular disease in a Japanese urban cohort: the Suita study. Hypertension, 2008; 52: 652-659
20) Okamura T, Kokubo Y, Watanabe M, Higashiyama A, Miyamoto Y, Yoshimasa Y, Okayama A. Low-density lipo-

Suita CVD Risk Score
1169
Cohort Study. PLoS One, 2016; 1137) Saito I, Yamagishi K, Kokubo Y, Yatsuya H, Iso H,
Sawada N, Inoue M, Tsugane S. Non-High-Density Lipo-protein Cholesterol and Risk of Stroke Subtypes and Cor-onary Heart Disease: The Japan Public Health Center-Based Prospective (JPHC) Study. J Atheroscler Thromb, 2020; 27: 363-374
38) Wolf PA, Abbott RD, Kannel WB. Atrial fibrillation as an independent risk factor for stroke: the Framingham Study. Stroke, 1991; 22: 983-988
39) Honda T, Yoshida D, Hata J, Hirakawa Y, Ishida Y, Shi-bata M, Sakata S, Kitazono T, Ninomiya T. Development and validation of modified risk prediction models for car-diovascular disease and its subtypes: The Hisayama Study. Atherosclerosis, 2018; 279: 38-44
40) Hata J, Ninomiya T, Hirakawa Y, Nagata M, Mukai N, Gotoh S, Fukuhara M, Ikeda F, Shikata K, Yoshida D, Yonemoto K, Kamouchi M, Kitazono T, Kiyohara Y. Sec-ular trends in cardiovascular disease and its risk factors in Japanese: half-century data from the Hisayama Study (1961-2009). Circulation, 2013; 128: 1198-1205
41) Vliegenthart R, Oudkerk M, Hofman A, Oei HH, van Dijck W, van Rooij FJ, Witteman JC. Coronary calcifica-tion improves cardiovascular risk prediction in the elderly. Circulation, 2005; 112: 572-577
of stroke. Clinical findings. Stroke, 1981; 12: I13-14430) D’Agostino RB Sr, Vasan RS, Pencina MJ, Wolf PA,
Cobain M, Massaro JM, Kannel WB. General cardiovas-cular risk profile for use in primary care: the Framingham Heart Study. Circulation, 2008; 117: 743-753
31) Harrell FE Jr, Lee KL, Mark DB. Multivariable prognos-tic models: issues in developing models, evaluating assumptions and adequacy, and measuring and reducing errors. Stat Med, 1996; 15: 361-387
32) Pencina MJ, D’Agostino RB. Overall C as a measure of discrimination in survival analysis: model specific popula-tion value and confidence interval estimation. Stat Med, 2004; 23: 2109-2123
33) Newson R. Comparing the predictive powers of survival models using Harrell’s C or Somers’ D. Stata Journal, 2010; 10: 339-358
34) Pencina MJ, D’Agostino RB Sr, D’Agostino RB Jr. Vasan RS. Evaluating the added predictive ability of a new marker: from area under the ROC curve to reclassification and beyond. Stat Med, 2008; 27: 157-172
35) Pencina MJ, D’Agostino RBS, Steyerberg EW. Extensions of net reclassification improvement calculations to mea-sure usefulness of new biomarkers. StatMed, 2011; 30: 11-21
36) Goldman N, Glei DA, Weinstein M. What Matters Most for Predicting Survival? A Multinational Population-Based

Nakai et al.
1170
Supplemental Table 1. Univariable and multivariable hazard ratios among blood pressure categories by models
Univariable adjusted for age
HR (95%CI) P-value
SBP <120 mmHg and DBP <80 mmHgSBP=120-139 mmHg or DBP=80-89 mmHgSBP=140-159 mmHg or DBP=90-99 mmHgSBP 160 mmHg or DBP 90 mmHg(SBP<140 or DBP <90) and in medication(SBP ≥ 140 or DBP ≥ 190) and in medication
0.407 (0.268, 0.617)0.611 (0.414, 0.902)0.816 (0.545, 1.222)1.169 (0.760, 1.799)
1.001.130 (0.754, 1.695)
<0.0010.0130.3240.477
0.554
Multivariable with Electrocardiogram Multivariable without Electrocardiogram
HR (95%CI) P-value HR (95%CI) P-value
SBP <120 mmHg and DBP <80 mmHgSBP=120-139 mmHg or DBP=80-89 mmHgSBP=140-159 mmHg or DBP=90-99 mmHgSBP 160 mmHg or DBP 90 mmHg(SBP <140 or DBP <90) and in medication(SBP ≥ 140 or DBP ≥ 190) and in medication
0.412 (0.271, 0.626)0.601 (0.406, 0.890)0.803 (0.534, 1.208)1.141 (0.740, 1.759)
1.001.080 (0.718, 1.624)
<0.0010.0110.2930.552
0.712
0.412 (0.271, 0.626)0.593 (0.401, 0.878)0.796 (0.530, 1.196)1.141 (0.740, 1.760)
1.001.093 (0.727, 1.623)
<0.0010.0090.2720.551
0.669
Multivariable model was adjusted for age, systolic blood pressure/diastolic blood pressure, Low density lipoprotein/ Non- high-density lipoprotein, high-density lipoprotein, smoking, diabetes mellitus and urinary protein. When each value of blood pressures (SBP and DBP) or lipid profiles (LDL-C and non-HDL-C) belonged to different categories, we adopted the higher category to estimate hazard ratios.
Suita CVD Risk Score
1171
Supplemental Table 2. Number of incident cases and incident rates by each categorical variable
Number of participants
Number of incident cases
Persons years Incident rate/1,000 persons years
MenWomen
3,0803,470
351241
44,33855,335
7.924.36
Age, year30-3940-4950-5960-6465-6970-7475-79
1,0871,3031,551
920621682386
1552
122108103121
71
17,16722,87525,44913,968
8,7047,9233,588
0.873.035.337.73
11.8315.2719.79
SBP <120 mmHg and DBP <80 mmHgSBP=120-139 mmHg or DBP=80-89 mmHgSBP=140-159 mmHg or DBP=90-99 mmHgSBP ≥ 160 mmHg or DBP ≥ 100 mmHg or in-medication
2,4562,113
8811,100
100177112203
40,02532,70612,55614,387
2.505.418.92
14.11
Non-HDL-C <170 mg/dL and LDL-C <140 mg/dLNon-HDL -C ≥ 170 mg/dL or LDL-C ≥ 140 mg/dL
4,0192,531
311281
60,71438,959
5.127.21
HDL-C <40 mg/dLHDL-C=40-59 mg/dLHDL-C ≥ 60 mg/dL
9443,4422,164
129326137
14,00952,40333,262
9.216.224.12
SmokingNon-Smoking
1,9624,588
199393
28,74370,931
6.925.54
Diabetes mellitus Non- Diabetes mellitus
3266,224
67525
4,06495,609
16.495.49
Urinary protein 1+ or moreUrinary protein less than 1+
1,2085,342
150442
17,35582,318
8.645.37
Atrial fibrillationNo Atrial fibrillation
406,510
10582
40199,272
24.945.86
Left ventricular hypertrophy No Left ventricular hypertrophy
1206,430
28564
1,45698,217
19.235.74
StrokeCerebral InfarctionIntracerebral hemorrhageSubarachnoid Hemorrhage
6,5506,5506,5506,550
341206
6730
99,67399,67399,67399,673
3.422.070.670.30
Definite MI with MONICA criteriaPossible MI with MONICA criteriaCoronary InterventionSudden cardiac deathMI death with death certificate only
6,5506,5506,5506,5506,550
752293
457
99,67399,67399,67399,67399,673
0.750.220.930.040.57
All CHDs (MI with MONICA criteria and other CHDs) 6,550 251 99,673 2.52
MI: myocardial infarction CHD: Coronary Heart Disease

Nakai et al.
1172
2 -statistics 2 -statistics
Supplemental Fig.1a. Actual and predicted cardiovascular event percentage by sex and sextiles of risk with ECG
2 -statistics 2 -statistics
Supplemental Fig.1b. Actual and predicted cardiovascular event percentage by sex and sextiles of risk with non-ECG
Suita CVD Risk Score
1173
2 -statistics 2 -statistics
2 -statistics2 -statistics
Supplemental Fig.1c. Actual and predicted cardiovascular event percentage by age category (<65, ≥ 65) and sextiles of risk with ECG and non-ECG

Nakai et al.
1174
Supplement Table 3. Cardiovascular disease risk points and regression coefficient with/ without Electrocardiogram using deriva-tion dataset
Model with Electrocardiogram Model without Electrocardiogram
Coefficient Score Coefficient Score
Sex (Men)Age 30-39 years 40-49 years 50-59 years 60-64 years 65-69 years 70-74 years 75-79 yearsBP SBP <120 mmHg and DBP <80 mmHg SBP=120-139 mmHg or DBP=80-89 mmHg SBP=140-159 mmHg or DBP=90-99 mmHg SBP ≥ 160 mmHg or DBP ≥ 100 mmHg or in medicationNon-HDL-C <170 mg/dL and LDL-C <140 mg/dLNon-HDL-C ≥ 170 mg/dL or LDL-C ≥ 140 mg/dLHDL-C HDL-C <40 mg/dL HDL-C=40-59 mg/dL HDL-C ≥ 60 mg/dL SmokingDMUrinary protein 1+ or moreAtrial fibrillationLeft ventricular hypertrophy
0.2600.811.361.712.172.502.66
-0.5100.240.5700.18 0
-0.30-0.47
0.380.620.241.120.54
308
1417222527-5
026020
-3-5
462
115
0.2600.821.381.742.202.542.71
-0.4800.240.5800.170
-0.30-0.46
0.360.640.26
308
1418222527-5
026020
-3-5
463
When each value of blood pressures (SBP and DBP) or lipid profiles (LDL-C and non-HDL-C) belonged to different categories, we adopted the higher category to estimate regression coefficients and scores.
2 -statistics 2 -statistics
Supplemental Fig.2. Actual and predicted cardiovascular event percentage by deciles of risk with ECG and non-ECG using validation dataset
Suita CVD Risk Score
1175
2 -statistics 2 -statistic
Supplemental Fig.3a. Actual and predicted cardiovascular event percentage by deciles of risk with ECG and non-ECG using first cohort dataset
2 -statistic2 -statistic
Supplemental Fig.3b. Actual and predicted cardiovascular event percentage by deciles of risk with ECG and non-ECG using second cohort dataset