development of a citsci and artificial intelligence
TRANSCRIPT
DEVELOPMENT OF A CITSCI AND ARTIFICIAL INTELLIGENCE SUPPORTED GIS
PLATFORM FOR LANDSLIDE DATA COLLECTION
Recep Can 1, Sultan Kocaman 1,*, Candan Gokceoglu 2
1 Hacettepe University, Dept. of Geomatics Engineering, 06800 Beytepe Ankara, Turkey - (recepcan,
sultankocaman)@hacettepe.edu.tr 2 Hacettepe University, Dept. of Geological Engineering, 06800 Beytepe Ankara, Turkey - [email protected]
Commission V, WG V/3
KEY WORDS: WebGIS, Citizen Science, Deep Learning, Landslide, Data Quality, CNN
ABSTRACT:
Geospatial data are fundamental to understand the relationship between the geographical events and the Earth dynamics. Although
the geospatial technologies aid geodata collection, the increasing possibilities yield new application areas and cause even a greater
demand. Considering the increment in data quantity and diversity, to be able to work with the data, they must be collected, stored,
analysed and presented with the help of specifically designed platforms. Geographical Information Systems (GIS) with mobile and
web support are the most suitable platforms for these purposes. On the other hand, the location-enabled mobile, web and
geospatial technologies empowered the rise of the citizen science (CitSci) projects. With the CitSci, mobile GIS platforms enable
the data to be collected from almost any location. As the size of the collected data increases, considering automatic control of the
data quality has become a necessity. Integrating artificial intelligence (AI) with the CitSci based GIS designs allows automatic
quality control of the data and helps eliminating data validation problem in CitSci. For this reason, the purpose of the present study
is to develop a CitSci and AI supported GIS platform for landslide data collection because landslide hazard mitigation efforts
require landslide susceptibility, hazard and risk assessments. Especially, landslide hazard assessments are necessary the time of
occurrence of a landslide. Although this information is crucial, it is almost impossible to collect time of occurrence in regional
hazard assessment efforts. Consequently, use of CitSci for this purpose may provide valuable information for landslide hazard
assessments.
* Corresponding author
1. INTRODUCTION
Natural hazards are observed throughout the world. As stated
by Cutter et al. (2015), the yearly economic losses from
geophysical, hydro-meteorological and climatological events
could exceed US$300 billion by 2030 worldwide; and more
lives and assets can be under risk due to climate change,
globalization, technological change, urbanization and political
and economic instability. In order to fight the problems of
today, new approaches need to be developed and put into
practice.
To understand the Earth dynamics and related spatial events,
geospatial data has crucial importance. Geospatial data enable
collaborations between different scientific disciplines and
contribute to them by adding new horizons. In order to
facilitate interdisciplinary work, geospatial data must be
obtained first; and stored, analysed and presented on a suitable
platform. Geographical Information Systems (GIS), which can
be defined as “Organized activity by which people measure
and represent geographic phenomena then transform these
representations into other forms while interacting with social
structures” (Chrisman, 1999), are the most appropriate
platforms for this purpose. A GIS design must cover the proper
data collection approaches, spatial analysis methods for
conversions and interpretation, and also the most suitable
presentation approaches for sound and vibrant interaction with
the social structures.
The geodata can be collected by using sensors solely (i.e. IoT)
or by people possibly with the help of sensors and online
platforms. When the data are collected by people, some sort of
interpretation can also be included at the beginning of the
process via selective sampling. As volunteer-based or
crowdsourcing-based approaches, Volunteered Geographical
Information (VGI) and Citizen Science (CitSci) can also be
used for the collection and interpretation of geodata at different
contribution levels. CitSci refers to the participation of
volunteers in scientific processes regardless their scientific,
technical or research background. Oxford English Dictionary
defines CitSci as: “Scientific work undertaken by members of
the general public, often in collaboration with or under the
direction of professional scientists and scientific institutions.”
(CSA, 2020). For different definitions and further discussion
on participatory science, please see Brovelli et al. (2020).
Owing to the developments in Information and Communication
Technologies (ICT), nearly every location is reachable
nowadays, and online CitSci repositories, where geospatial
data are collected, analysed and reported, are good options to
benefit the CitSci potential.
The International Archives of the Photogrammetry, Remote Sensing and Spatial Information Sciences, Volume XLIII-B5-2020, 2020 XXIV ISPRS Congress (2020 edition)
This contribution has been peer-reviewed. https://doi.org/10.5194/isprs-archives-XLIII-B5-2020-43-2020 | © Authors 2020. CC BY 4.0 License.
43

CitSci has also critical importance for geoscience researches
since it allows the collection of massive amounts of timely
geospatial data. GeoCitSci.com, a CitSci platform for
geoscience researches, has been initiated at Hacettepe
University as a collaboration between the Departments of
Geomatics Engineering and Geological Engineering. A CitSci
and artificial intelligence (AI) supported WebGIS platform was
designed and implemented in this study to contribute to
landslide researchers. The platform consists of a WebGIS
application for data collection and presentation, a mobile app
(LaMA) for data provision, and both have AI system to control
processes for ensuring data quality.
The platform aims to collect volunteers’ observations about
landslides together with images, location and time of
occurrence information. To collect the observations efficiently,
the system was designed as simple as possible so that any
volunteer can use it without the need of knowledge or
experience related to the topic. In addition to its simple design,
the system was developed to be able to work on multiple
devices for receiving data from any platform. Data quality
control is also very important for the system design for
effective utilization of resources and increasing the quality of
the results to be obtained from the collected data.
The platform is basically composed of three layers, which are
presentation, application and data layer. The presentation layer
is responsible for retrieving location and the volunteer
observation on the landslide with images, and for showing the
image on the map after the data are controlled and classified
automatically by a deep learning model. The application layer
includes the deep learning model, which is specifically
designed and implemented for classifying images with
landslides. The application layer controls form data, processes
and classifies images, and send them to the data layer in order
to upload to the database management system. The data layer
is responsible for storing and managing the data.
A CitSci project has several challenges, such as engaging
people to contribute to the project through a website. Several
parameters should be taken into account when designing a
CitSci project. The user interface design is extremely
important so that all participants can use the system easily
without the need of any prior knowledge or experience.
Platform independency and compatibility with multiple devices
are also important aspects. Reaching out to more volunteers
means collecting more information about the problem. Quality
control of the collected data is another aspect to consider while
designing a CitSci project. The developed web application and
the technologies used in this study addresses all these
questions. The detailed system design is described in following
sections.
2. BACKGROUND
2.1 CitSci Platforms Apps for Natural Hazards
CitSci based apps enable the data to be collected where the
natural hazard occurred. Many studies have been carried out
with the aim of using CitSci platforms in natural hazards.
Kocaman et al. (2018) reviewed the CitSci approaches for
disaster management efforts.
For example; De Longueville et al. (2010) developed a
workflow with the aim of validation VGI data in natural
hazards with an example from U.K floods. Schade et al. (2013)
explains how VGI sensing techniques help crisis information
system and describe a workflow related integration of VGI
with the spatial data infrastructures. Nolasco-Javier et al.
(2018) have used newspapers, agency reports, interviews and
field observations to collect landslide occurrence data in order
to derive the rainfall threshold in Philippines. Holderness et al.
(2017) have reviewed the Peta Jakarta project, which was a
collaboration of university, local government and social
networking sites (SNS) for flood mitigation. The purpose of the
project was supporting decision makers with the real-time
flood situations obtained from the social media.
Liang et al. (2017) have developed CitSci based platform to
obtain ground observations during earthquake and integrate
available real-time earthquake information with the geospatial
data to contribute earthquake science. Cochran et al. (2009)
have presented Quake-Catcher Network (QCN) project which
aims to increase the number of seismic stations by using
volunteers’ computing resource as a seismic station to obtain
information about large earthquakes through faster and
accurate way.
Kocaman and Gokceoglu (2019a) developed the LaMA app for
landslide data collection which work on both iOS and Android
platforms. Yalcin et al. (2020a) developed an Android app for
collecting earthquake intensity data and they produced iso-
intensity map for Istanbul earthquake and also investigated
after Elazig earthquake occurred on Jan 24, 2020 in Turkey
(Yalcin et al., 2020b). An extensive review on the potential of
CitSci for landslide research is given by Kocaman and
Gokceoglu (2019b). The Landslide Reporter project of NASA
is also an important CitSci initiative that aims to collect
landslide related information all over the world (Juang et al.,
2019; NASA, 2020).
2.2 Convolutional Neural Networks in Data Quality
Assessment
The data quality is the major problem for CitSci studies. Crall
et al. (2010) studied on improving and integrating data on
invasive species collected by citizen scientists and they said
that only 39% of the citizen science programs have any data
quality checks in place. In addition, several authors (i.e.
Kocaman et al., 2018; Kocaman and Gokceoglu, 2019a, 2019b;
Can et al., 2019; Yalcin et al., 2020) mentioned the importance
of the quality of data collected by volunteers since it has a
direct effect on the accuracy of results. Considering this
problem, Yalcin et al. (2020) used the data provided by the
trained volunteers. However, it may be difficult or even
impossible to train the volunteers if data is collected from all
over the world. In this case, various automatic data control
systems are needed. Can et al. (2019) developed a
Convolutional Neural Network (CNN) based data quality
control algorithm proposed to check the landslide photographs
provided by the volunteers.
The International Archives of the Photogrammetry, Remote Sensing and Spatial Information Sciences, Volume XLIII-B5-2020, 2020 XXIV ISPRS Congress (2020 edition)
This contribution has been peer-reviewed. https://doi.org/10.5194/isprs-archives-XLIII-B5-2020-43-2020 | © Authors 2020. CC BY 4.0 License.
44
3. SYSTEM DESIGN
The goal of the CitSci supported GIS platforms is collecting
geospatial data with the help of volunteers. To collect the data
efficiently, the system must be designed as simple as possible
so that any volunteers can use it without the need of any
knowledge related to topic and experience. In addition to
simple design, the system must be developed to be able to
work on multiple platforms for receiving data from any device.
Data quality assessment is also very important for the system
design for effective usage of resources and the quality of the
work.
Considering all these requirements, the LaMA app was
developed by Kocaman and Gokceoglu (2019a). The app runs
across multiple device platforms such as Android, iOS and
web. In addition, a web-based data entry possibility was
developed in this study for the users who prefer to provide data
over a web-browser. Since the technical characteristics of the
LaMA app are already provided by Kocaman and Gokceoglu
(2019a), only the specifications of the web interface is
provided in this paper.
In this section, the system architecture is explained in detail.
The overall system design elements are shown in Figure 1. The
system is composed of three main layers, which are
presentation, application and the data. The presentation layer
involves the user interfaces, forms and visualization
functionality. The application layer consists of the data
processing elements, which are mainly responsible for data and
error handling procedures and the quality control system. The
data layer is responsible for storing and managing the data, and
involves a database management system and file management
system. The details on the layers are provided in the following
sub-headings.
Figure 1. Main components of the developed WebGIS platform
(except the mobile app LaMA, which was already presented by
Kocaman and Gokceoglu, 2019a).
3.1 Presentation Layer
The presentation layer depicted in Figure 1 is responsible for
user interactions with the application, so it is the most
important part of the application for obtaining the volunteer
provided data. This part of the system need to be simple, user-
friendly, and compatible with multiple operating systems. The
web-based presentation layer is composed of three modules,
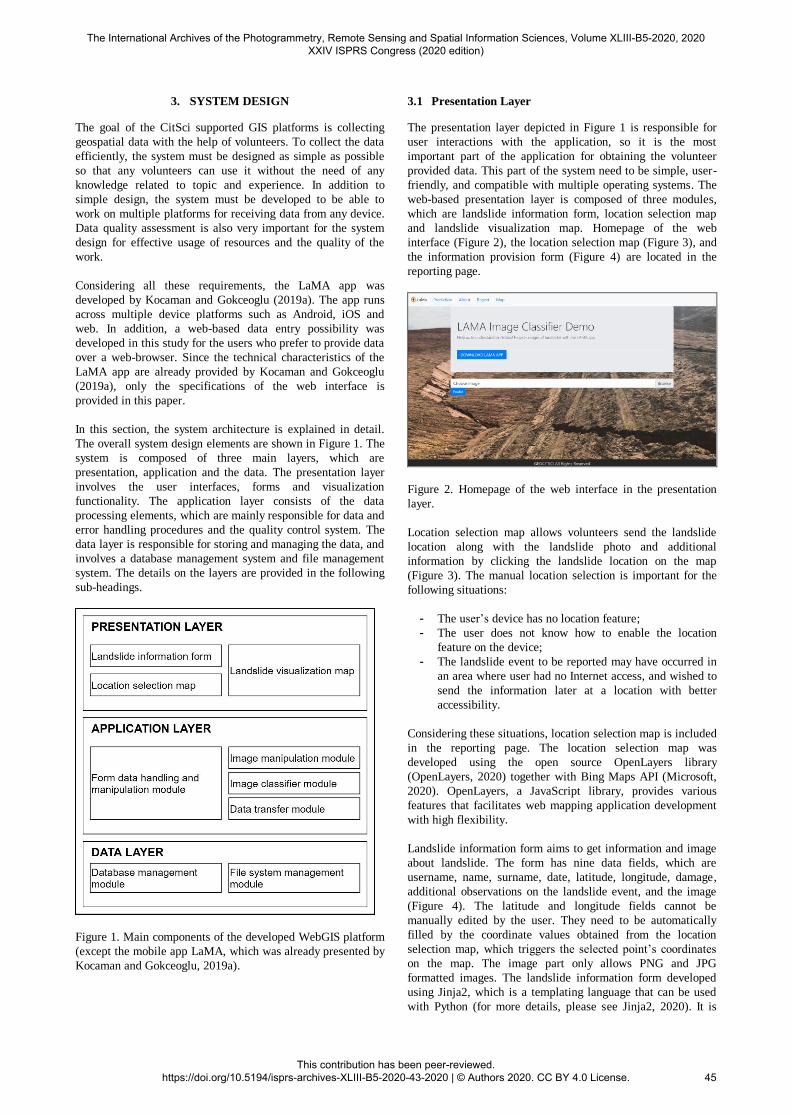
which are landslide information form, location selection map
and landslide visualization map. Homepage of the web
interface (Figure 2), the location selection map (Figure 3), and
the information provision form (Figure 4) are located in the
reporting page.
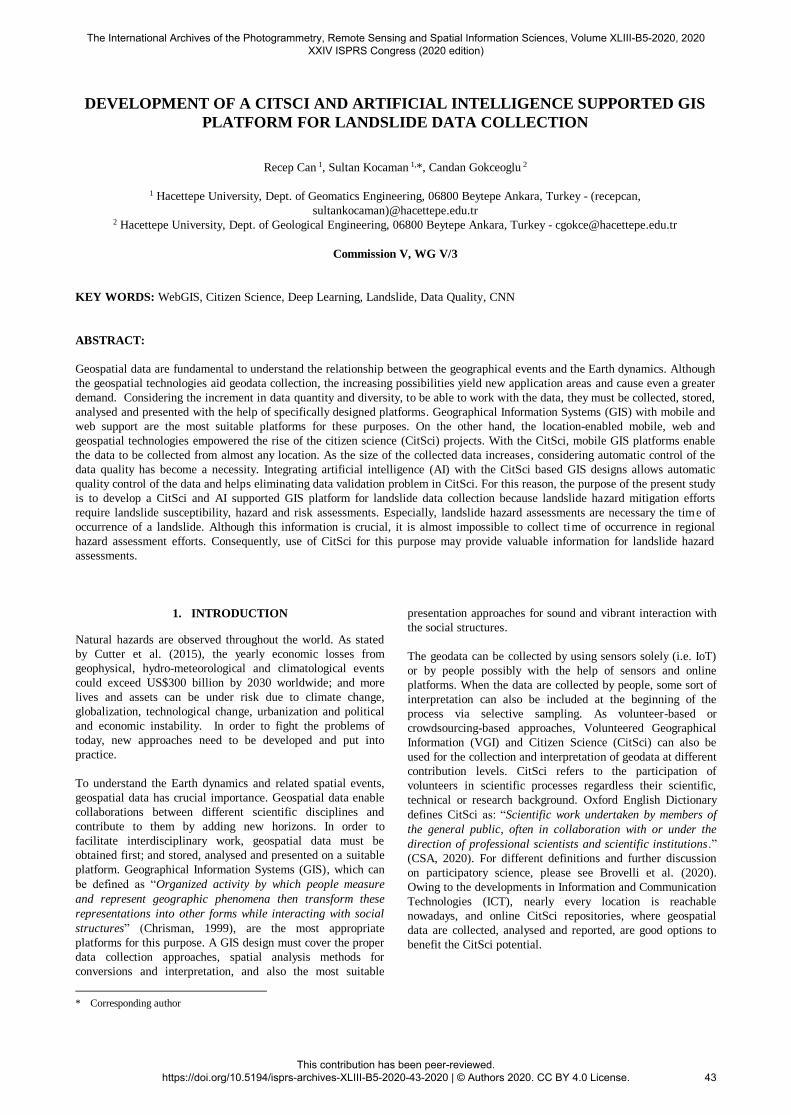
Figure 2. Homepage of the web interface in the presentation
layer.
Location selection map allows volunteers send the landslide
location along with the landslide photo and additional
information by clicking the landslide location on the map
(Figure 3). The manual location selection is important for the
following situations:
- The user’s device has no location feature;
- The user does not know how to enable the location
feature on the device;
- The landslide event to be reported may have occurred in
an area where user had no Internet access, and wished to
send the information later at a location with better
accessibility.
Considering these situations, location selection map is included
in the reporting page. The location selection map was
developed using the open source OpenLayers library
(OpenLayers, 2020) together with Bing Maps API (Microsoft,
2020). OpenLayers, a JavaScript library, provides various
features that facilitates web mapping application development
with high flexibility.
Landslide information form aims to get information and image
about landslide. The form has nine data fields, which are
username, name, surname, date, latitude, longitude, damage,
additional observations on the landslide event, and the image
(Figure 4). The latitude and longitude fields cannot be
manually edited by the user. They need to be automatically
filled by the coordinate values obtained from the location
selection map, which triggers the selected point’s coordinates
on the map. The image part only allows PNG and JPG
formatted images. The landslide information form developed
using Jinja2, which is a templating language that can be used
with Python (for more details, please see Jinja2, 2020). It is
The International Archives of the Photogrammetry, Remote Sensing and Spatial Information Sciences, Volume XLIII-B5-2020, 2020 XXIV ISPRS Congress (2020 edition)
This contribution has been peer-reviewed. https://doi.org/10.5194/isprs-archives-XLIII-B5-2020-43-2020 | © Authors 2020. CC BY 4.0 License.
45
preferred in this application because it has automatic HTML
escaping, which helps preventing XSS attacks; and supports
template inheritance. The reporting page is responsive meaning
that the application is suitable to work on every device without
considering how large or small screen size, mobile or desktop
device. The reporting page’s interface was developed using
Bootstrap 4, which is a front-end component library to be used
building responsive web pages (Bootstrap, 2020). Bootstrap
makes development faster with its prebuilt components. It is
also easily integrated with Openlayers, Jinja2 and Flask.
Figure 3. Location selection map on the landslide reporting
page.
Figure 4. Landslide information form on the landslide
reporting page.
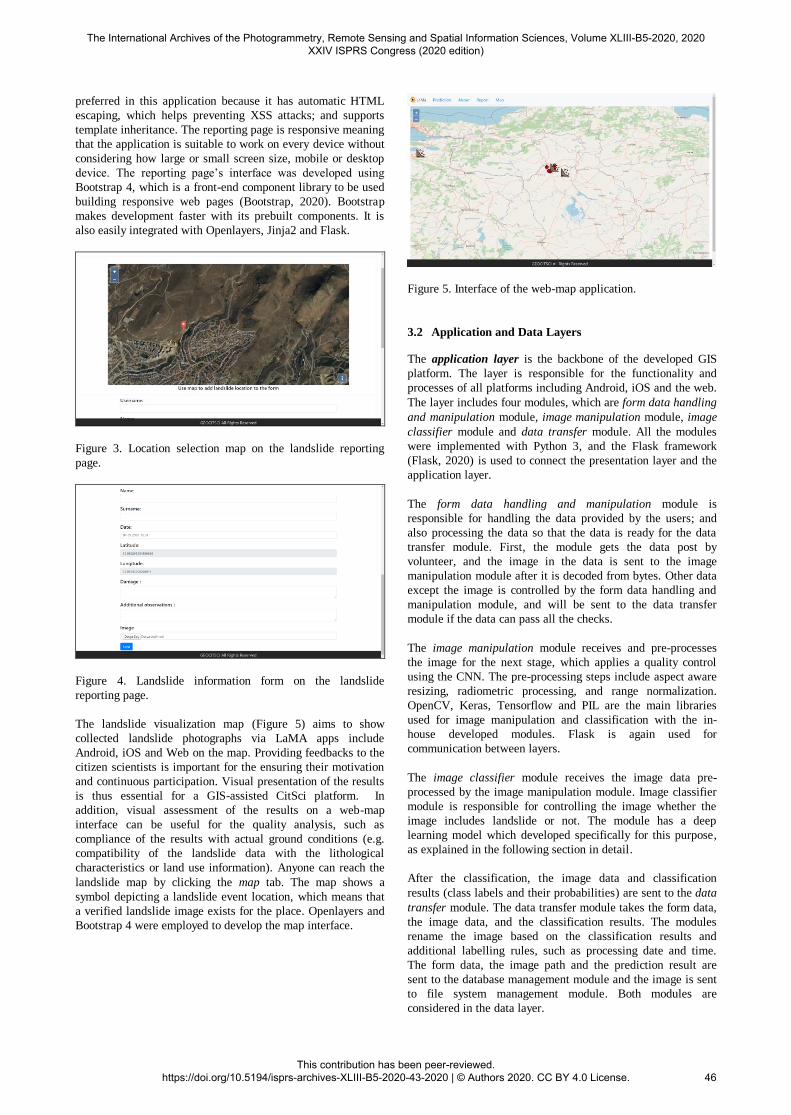
The landslide visualization map (Figure 5) aims to show
collected landslide photographs via LaMA apps include
Android, iOS and Web on the map. Providing feedbacks to the
citizen scientists is important for the ensuring their motivation
and continuous participation. Visual presentation of the results
is thus essential for a GIS-assisted CitSci platform. In
addition, visual assessment of the results on a web-map
interface can be useful for the quality analysis, such as
compliance of the results with actual ground conditions (e.g.
compatibility of the landslide data with the lithological
characteristics or land use information). Anyone can reach the
landslide map by clicking the map tab. The map shows a
symbol depicting a landslide event location, which means that
a verified landslide image exists for the place. Openlayers and
Bootstrap 4 were employed to develop the map interface.
Figure 5. Interface of the web-map application.
3.2 Application and Data Layers
The application layer is the backbone of the developed GIS
platform. The layer is responsible for the functionality and
processes of all platforms including Android, iOS and the web.
The layer includes four modules, which are form data handling
and manipulation module, image manipulation module, image
classifier module and data transfer module. All the modules
were implemented with Python 3, and the Flask framework
(Flask, 2020) is used to connect the presentation layer and the
application layer.
The form data handling and manipulation module is
responsible for handling the data provided by the users; and
also processing the data so that the data is ready for the data
transfer module. First, the module gets the data post by
volunteer, and the image in the data is sent to the image
manipulation module after it is decoded from bytes. Other data
except the image is controlled by the form data handling and
manipulation module, and will be sent to the data transfer
module if the data can pass all the checks.
The image manipulation module receives and pre-processes
the image for the next stage, which applies a quality control
using the CNN. The pre-processing steps include aspect aware
resizing, radiometric processing, and range normalization.
OpenCV, Keras, Tensorflow and PIL are the main libraries
used for image manipulation and classification with the in-
house developed modules. Flask is again used for
communication between layers.
The image classifier module receives the image data pre-
processed by the image manipulation module. Image classifier
module is responsible for controlling the image whether the
image includes landslide or not. The module has a deep
learning model which developed specifically for this purpose,
as explained in the following section in detail.
After the classification, the image data and classification
results (class labels and their probabilities) are sent to the data
transfer module. The data transfer module takes the form data,
the image data, and the classification results. The modules
rename the image based on the classification results and
additional labelling rules, such as processing date and time.
The form data, the image path and the prediction result are
sent to the database management module and the image is sent
to file system management module. Both modules are
considered in the data layer.
The International Archives of the Photogrammetry, Remote Sensing and Spatial Information Sciences, Volume XLIII-B5-2020, 2020 XXIV ISPRS Congress (2020 edition)
This contribution has been peer-reviewed. https://doi.org/10.5194/isprs-archives-XLIII-B5-2020-43-2020 | © Authors 2020. CC BY 4.0 License.
46
The data layer is responsible for storing, writing, reading and
querying data. The layer includes two modules, which are the
database management module and file system management
module. The database management module is responsible for
database related works such as database connection, querying,
writing etc. The file system management module is responsible
for storing the image data.
3.3 Data Quality Assessment Approach
The image classifier module has a pre-trained CNN-based
deep learning algorithm developed by Can et al. (2019). The
module basically evaluates the image posted by the user and
classifies the image as irrelevant or landslide. Although four
other classes can also be determined with the developed
architecture, the developed CitSci platform is only interested in
the existence of a landslide event in the photo. Therefore, the
other classes are merged with the irrelevant class based on the
sum of their probabilities except the landslide class in the
image classifier module. If an image includes landslide, the
image is stored with corresponding classification result. If not,
the image and the information posted with the image are
deleted from the memory. This automation reduces storage
costs and ensures the efficient use of the storage. Thanks to the
deep learning model, manual checks are not required on the
obtained data to find out if they are landslide relevant or not. In
this way, the cost of the human labour is also eliminated.
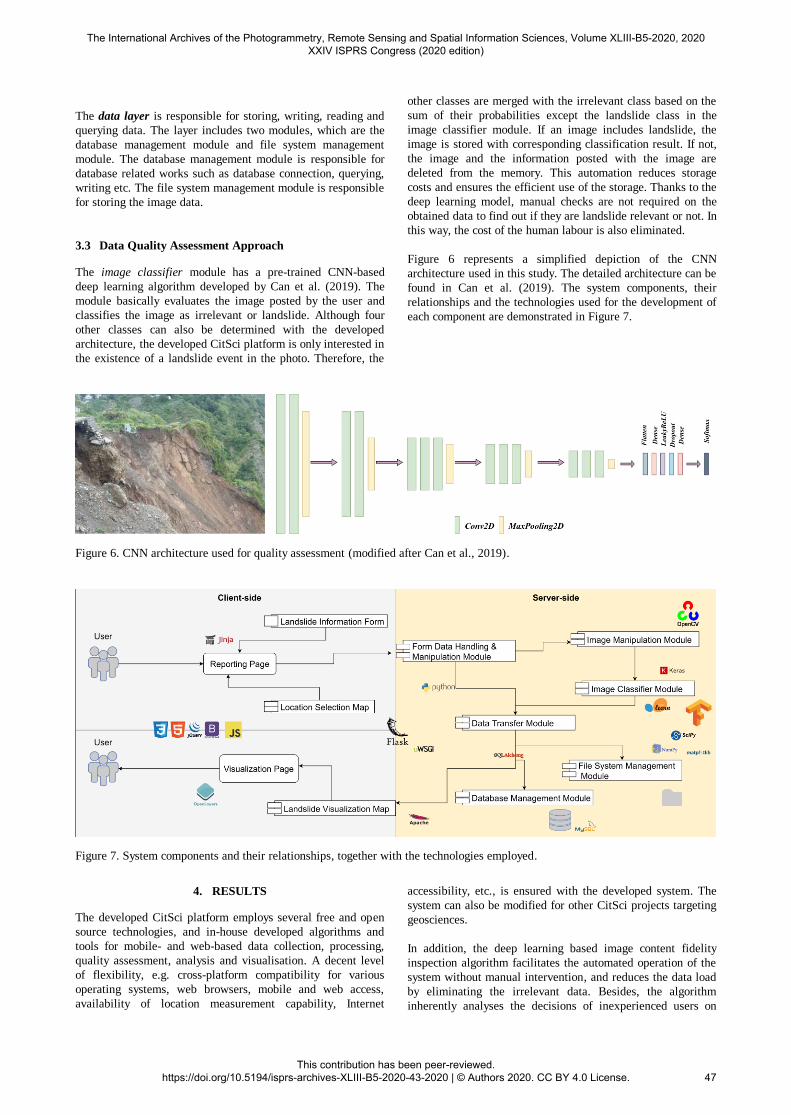
Figure 6 represents a simplified depiction of the CNN
architecture used in this study. The detailed architecture can be
found in Can et al. (2019). The system components, their
relationships and the technologies used for the development of
each component are demonstrated in Figure 7.
Figure 6. CNN architecture used for quality assessment (modified after Can et al., 2019).
Figure 7. System components and their relationships, together with the technologies employed.
4. RESULTS
The developed CitSci platform employs several free and open
source technologies, and in-house developed algorithms and
tools for mobile- and web-based data collection, processing,
quality assessment, analysis and visualisation. A decent level
of flexibility, e.g. cross-platform compatibility for various
operating systems, web browsers, mobile and web access,
availability of location measurement capability, Internet
accessibility, etc., is ensured with the developed system. The
system can also be modified for other CitSci projects targeting
geosciences.
In addition, the deep learning based image content fidelity
inspection algorithm facilitates the automated operation of the
system without manual intervention, and reduces the data load
by eliminating the irrelevant data. Besides, the algorithm
inherently analyses the decisions of inexperienced users on
The International Archives of the Photogrammetry, Remote Sensing and Spatial Information Sciences, Volume XLIII-B5-2020, 2020 XXIV ISPRS Congress (2020 edition)
This contribution has been peer-reviewed. https://doi.org/10.5194/isprs-archives-XLIII-B5-2020-43-2020 | © Authors 2020. CC BY 4.0 License.
47
landslides and corrects (removes) if the decision was false
(irrelevant).
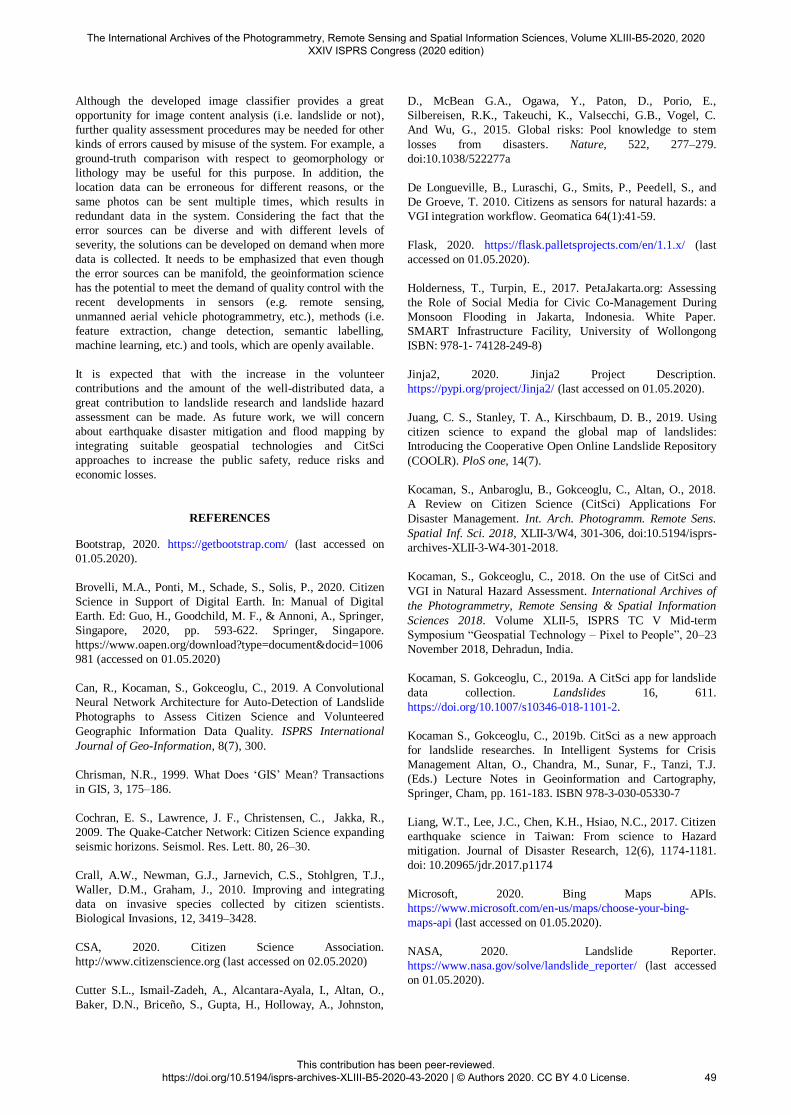
Figures 8 and 9 were obtained from the demo application of
the project page. Since the purpose of the demo page is
ensuring the model’s data quality assessment performance, all
the posted data were stored and displayed on the map. Two
different symbols are used on the web-map. If the posted image
was classified as landslide, the map page represents the image
with landslide symbol and locates the symbol to the provided
location. If the image is classified as irrelevant, the image is
represented with the red circle (Figure 8). By clicking on the
symbol, the image can be shown in its original size. Figures 9
and 10 show examples from true and false landslide
photographs provided by the users, which were classified
correctly.
Figure 8. The symbols used on the demo application for
landslide and non-landslide (red circles) data.
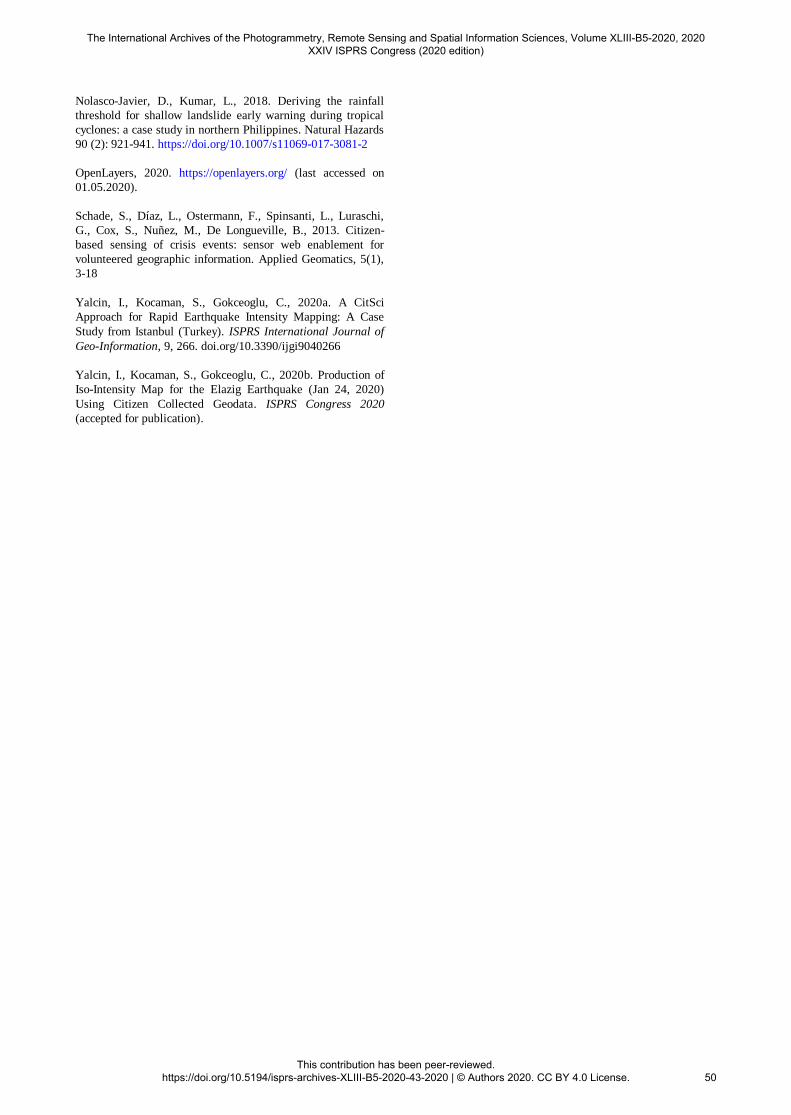
Figure 9. An example to the user-provided landslide
photograph (below) together with its location (above). The
photo was also classified as landslide in the image classifier.
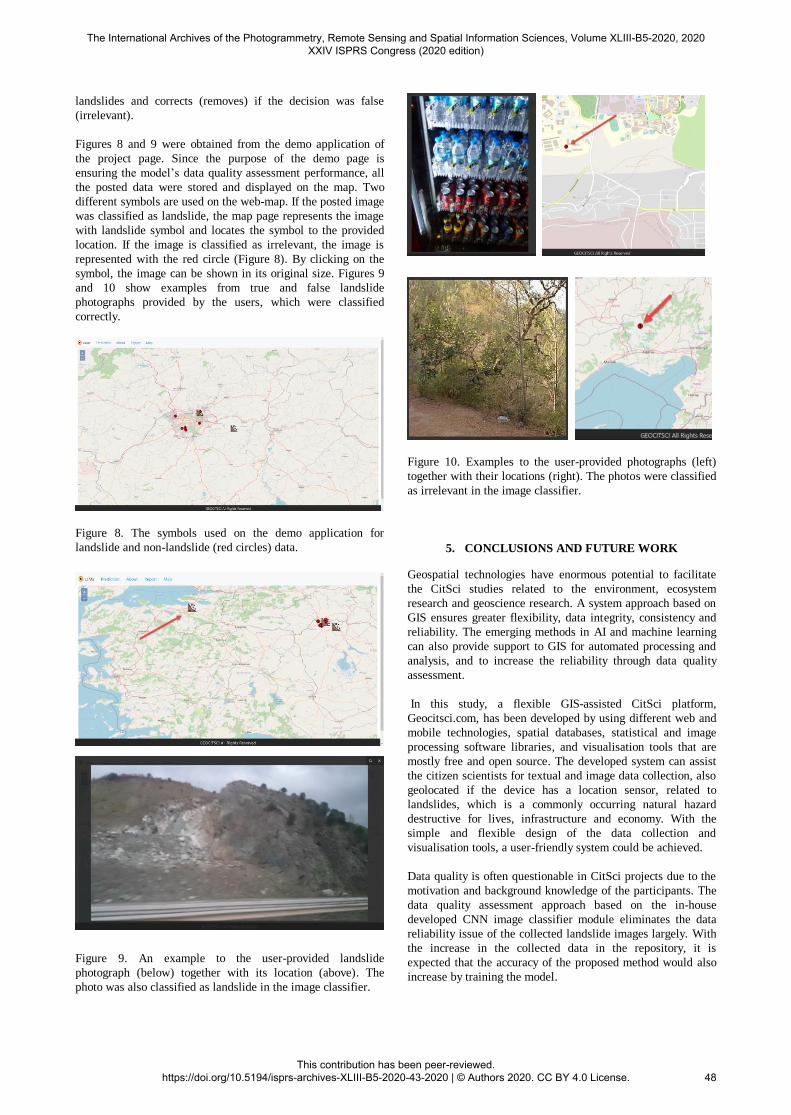
Figure 10. Examples to the user-provided photographs (left)
together with their locations (right). The photos were classified
as irrelevant in the image classifier.
5. CONCLUSIONS AND FUTURE WORK
Geospatial technologies have enormous potential to facilitate
the CitSci studies related to the environment, ecosystem
research and geoscience research. A system approach based on
GIS ensures greater flexibility, data integrity, consistency and
reliability. The emerging methods in AI and machine learning
can also provide support to GIS for automated processing and
analysis, and to increase the reliability through data quality
assessment.
In this study, a flexible GIS-assisted CitSci platform,
Geocitsci.com, has been developed by using different web and
mobile technologies, spatial databases, statistical and image
processing software libraries, and visualisation tools that are
mostly free and open source. The developed system can assist
the citizen scientists for textual and image data collection, also
geolocated if the device has a location sensor, related to
landslides, which is a commonly occurring natural hazard
destructive for lives, infrastructure and economy. With the
simple and flexible design of the data collection and
visualisation tools, a user-friendly system could be achieved.
Data quality is often questionable in CitSci projects due to the
motivation and background knowledge of the participants. The
data quality assessment approach based on the in-house
developed CNN image classifier module eliminates the data
reliability issue of the collected landslide images largely. With
the increase in the collected data in the repository, it is
expected that the accuracy of the proposed method would also
increase by training the model.
The International Archives of the Photogrammetry, Remote Sensing and Spatial Information Sciences, Volume XLIII-B5-2020, 2020 XXIV ISPRS Congress (2020 edition)
This contribution has been peer-reviewed. https://doi.org/10.5194/isprs-archives-XLIII-B5-2020-43-2020 | © Authors 2020. CC BY 4.0 License.
48
Although the developed image classifier provides a great
opportunity for image content analysis (i.e. landslide or not),
further quality assessment procedures may be needed for other
kinds of errors caused by misuse of the system. For example, a
ground-truth comparison with respect to geomorphology or
lithology may be useful for this purpose. In addition, the
location data can be erroneous for different reasons, or the
same photos can be sent multiple times, which results in
redundant data in the system. Considering the fact that the
error sources can be diverse and with different levels of
severity, the solutions can be developed on demand when more
data is collected. It needs to be emphasized that even though
the error sources can be manifold, the geoinformation science
has the potential to meet the demand of quality control with the
recent developments in sensors (e.g. remote sensing,
unmanned aerial vehicle photogrammetry, etc.), methods (i.e.
feature extraction, change detection, semantic labelling,
machine learning, etc.) and tools, which are openly available.
It is expected that with the increase in the volunteer
contributions and the amount of the well-distributed data, a
great contribution to landslide research and landslide hazard
assessment can be made. As future work, we will concern
about earthquake disaster mitigation and flood mapping by
integrating suitable geospatial technologies and CitSci
approaches to increase the public safety, reduce risks and
economic losses.
REFERENCES
Bootstrap, 2020. https://getbootstrap.com/ (last accessed on
01.05.2020).
Brovelli, M.A., Ponti, M., Schade, S., Solis, P., 2020. Citizen
Science in Support of Digital Earth. In: Manual of Digital
Earth. Ed: Guo, H., Goodchild, M. F., & Annoni, A., Springer,
Singapore, 2020, pp. 593-622. Springer, Singapore.
https://www.oapen.org/download?type=document&docid=1006
981 (accessed on 01.05.2020)
Can, R., Kocaman, S., Gokceoglu, C., 2019. A Convolutional
Neural Network Architecture for Auto-Detection of Landslide
Photographs to Assess Citizen Science and Volunteered
Geographic Information Data Quality. ISPRS International
Journal of Geo-Information, 8(7), 300.
Chrisman, N.R., 1999. What Does ‘GIS’ Mean? Transactions
in GIS, 3, 175–186.
Cochran, E. S., Lawrence, J. F., Christensen, C., Jakka, R.,
2009. The Quake-Catcher Network: Citizen Science expanding
seismic horizons. Seismol. Res. Lett. 80, 26–30.
Crall, A.W., Newman, G.J., Jarnevich, C.S., Stohlgren, T.J.,
Waller, D.M., Graham, J., 2010. Improving and integrating
data on invasive species collected by citizen scientists.
Biological Invasions, 12, 3419–3428.
CSA, 2020. Citizen Science Association.
http://www.citizenscience.org (last accessed on 02.05.2020)
Cutter S.L., Ismail-Zadeh, A., Alcantara-Ayala, I., Altan, O.,
Baker, D.N., Briceño, S., Gupta, H., Holloway, A., Johnston,
D., McBean G.A., Ogawa, Y., Paton, D., Porio, E.,
Silbereisen, R.K., Takeuchi, K., Valsecchi, G.B., Vogel, C.
And Wu, G., 2015. Global risks: Pool knowledge to stem
losses from disasters. Nature, 522, 277–279.
doi:10.1038/522277a
De Longueville, B., Luraschi, G., Smits, P., Peedell, S., and
De Groeve, T. 2010. Citizens as sensors for natural hazards: a
VGI integration workflow. Geomatica 64(1):41-59.
Flask, 2020. https://flask.palletsprojects.com/en/1.1.x/ (last
accessed on 01.05.2020).
Holderness, T., Turpin, E., 2017. PetaJakarta.org: Assessing
the Role of Social Media for Civic Co-Management During
Monsoon Flooding in Jakarta, Indonesia. White Paper.
SMART Infrastructure Facility, University of Wollongong
ISBN: 978-1- 74128-249-8)
Jinja2, 2020. Jinja2 Project Description.
https://pypi.org/project/Jinja2/ (last accessed on 01.05.2020).
Juang, C. S., Stanley, T. A., Kirschbaum, D. B., 2019. Using
citizen science to expand the global map of landslides:
Introducing the Cooperative Open Online Landslide Repository
(COOLR). PloS one, 14(7).
Kocaman, S., Anbaroglu, B., Gokceoglu, C., Altan, O., 2018.
A Review on Citizen Science (CitSci) Applications For
Disaster Management. Int. Arch. Photogramm. Remote Sens.
Spatial Inf. Sci. 2018, XLII-3/W4, 301-306, doi:10.5194/isprs-
archives-XLII-3-W4-301-2018.
Kocaman, S., Gokceoglu, C., 2018. On the use of CitSci and
VGI in Natural Hazard Assessment. International Archives of
the Photogrammetry, Remote Sensing & Spatial Information
Sciences 2018. Volume XLII-5, ISPRS TC V Mid-term
Symposium “Geospatial Technology – Pixel to People”, 20–23
November 2018, Dehradun, India.
Kocaman, S. Gokceoglu, C., 2019a. A CitSci app for landslide
data collection. Landslides 16, 611.
https://doi.org/10.1007/s10346-018-1101-2.
Kocaman S., Gokceoglu, C., 2019b. CitSci as a new approach
for landslide researches. In Intelligent Systems for Crisis
Management Altan, O., Chandra, M., Sunar, F., Tanzi, T.J.
(Eds.) Lecture Notes in Geoinformation and Cartography,
Springer, Cham, pp. 161-183. ISBN 978-3-030-05330-7
Liang, W.T., Lee, J.C., Chen, K.H., Hsiao, N.C., 2017. Citizen
earthquake science in Taiwan: From science to Hazard
mitigation. Journal of Disaster Research, 12(6), 1174-1181.
doi: 10.20965/jdr.2017.p1174
Microsoft, 2020. Bing Maps APIs.
https://www.microsoft.com/en-us/maps/choose-your-bing-
maps-api (last accessed on 01.05.2020).
NASA, 2020. Landslide Reporter.
https://www.nasa.gov/solve/landslide_reporter/ (last accessed
on 01.05.2020).
The International Archives of the Photogrammetry, Remote Sensing and Spatial Information Sciences, Volume XLIII-B5-2020, 2020 XXIV ISPRS Congress (2020 edition)
This contribution has been peer-reviewed. https://doi.org/10.5194/isprs-archives-XLIII-B5-2020-43-2020 | © Authors 2020. CC BY 4.0 License.
49
Nolasco-Javier, D., Kumar, L., 2018. Deriving the rainfall
threshold for shallow landslide early warning during tropical
cyclones: a case study in northern Philippines. Natural Hazards
90 (2): 921-941. https://doi.org/10.1007/s11069-017-3081-2
OpenLayers, 2020. https://openlayers.org/ (last accessed on
01.05.2020).
Schade, S., Díaz, L., Ostermann, F., Spinsanti, L., Luraschi,
G., Cox, S., Nuñez, M., De Longueville, B., 2013. Citizen-
based sensing of crisis events: sensor web enablement for
volunteered geographic information. Applied Geomatics, 5(1),
3-18
Yalcin, I., Kocaman, S., Gokceoglu, C., 2020a. A CitSci
Approach for Rapid Earthquake Intensity Mapping: A Case
Study from Istanbul (Turkey). ISPRS International Journal of
Geo-Information, 9, 266. doi.org/10.3390/ijgi9040266
Yalcin, I., Kocaman, S., Gokceoglu, C., 2020b. Production of
Iso-Intensity Map for the Elazig Earthquake (Jan 24, 2020)
Using Citizen Collected Geodata. ISPRS Congress 2020
(accepted for publication).
The International Archives of the Photogrammetry, Remote Sensing and Spatial Information Sciences, Volume XLIII-B5-2020, 2020 XXIV ISPRS Congress (2020 edition)
This contribution has been peer-reviewed. https://doi.org/10.5194/isprs-archives-XLIII-B5-2020-43-2020 | © Authors 2020. CC BY 4.0 License.
50