development of a decision support tool
TRANSCRIPT

Development of a Decision Support Tool
for On-site Wastewater Treatment Systems
in Jamaican Communities
By
Andrew M. Snauffer
A REPORT
Submitted in partial fulfillment of the requirements for the degree of
MASTER OF SCIENCE IN ENVIRONMENTAL ENGINEERING
MICHIGAN TECHNOLOGICAL UNIVERSITY
2007
Copyright © Andrew M. Snauffer 2007

This report �“Development of a Decision Support Tool for On-site Wastewater Treatment
Systems in Jamaican Communities�” is hereby approved in partial fulfillment of the requirements
for the degree of MASTER OF SCIENCE IN ENVIRONMENTAL ENGINEERING.
Civil and Environmental Engineering
Master�’s International Program
Signatures:
Report Advisor _____________________________
James R. Mihelcic
Department Chair ___________________________
Neil J. Hutzler
Date ____________________________
ii

Preface
The following report details the development of a tool for supporting on-site wastewater
treatment decisions in Jamaican communities. The tool was developed in the course of my
experience as a US Peace Corps Volunteer in 2005-2007. During this time, I served as a water
sanitation engineer for the Western Regional Health Authority in Montego Bay, St. James. I
worked with health departments in the parishes of St. James, Trelawny, Hanover, and
Westmoreland to understand and document their processes for approving building applications
and certifying on-site wastewater treatment systems. The Ministry of Health�’s Developer’s
Manual for On-site Wastewater Treatment and Excreta Disposal Management and the Water
Resources Authority�’s Guidelines for Assessing the Vulnerability of Groundwater to Pollution
supplied many of technical parameters and guidelines. Professors and resources from Michigan
Technological University provided the theoretical framework and global context for this work.
This report is submitted to fulfill the requirements for the degree of Master of Science in
Environmental Engineering from the Master�’s International Program in Civil and Environmental
Engineering at Michigan Technological University. It is intended to document the use of
decision support techniques to wastewater treatment evaluations, suggest a means for carrying
out the implementation and further development of this tool, and address the broader
applicability of this work in the developing world.
iii

Table of Contents Preface............................................................................................................................................ iii Table of Contents........................................................................................................................... iv List of Figures ................................................................................................................................. v List of Tables .................................................................................................................................. v List of Acronyms ........................................................................................................................... vi Acknowledgements....................................................................................................................... vii Abstract .......................................................................................................................................... ix Chapter 1 Introduction and Objectives ........................................................................................... 1
1.1. Sanitation in the Developing World ............................................................................... 1 1.1.1. Agenda 21 ................................................................................................................. 3 1.1.2. Sanitation in Jamaica ................................................................................................ 4
1.2. Objectives ....................................................................................................................... 5 1.3. Rationale ......................................................................................................................... 6
Chapter 2 Background .................................................................................................................... 7 2.1. Health and Environmental Risk ...................................................................................... 7 2.2. Decision Support........................................................................................................... 10
2.2.1. Decision Support the Developing and Developed World....................................... 10 2.2.2. Decision Support Tools........................................................................................... 12
2.3. Groundwater Vulnerability Assessments...................................................................... 13 2.4. DRASTIC Groundwater Pollution Potential Factors.................................................... 14
Chapter 3 Methodology ................................................................................................................ 18 3.1. Development of an On-site Wastewater Decision Support Tool for Jamaica .............. 21 3.2. Sanitation Implementation Assessment Tool Usage..................................................... 22
3.2.1. Groundwater Pollution Potential (DRASTIC) Parameters ..................................... 24 3.2.2. Local Feature Parameters........................................................................................ 26 3.2.3. Sustainability Index ................................................................................................ 28
Chapter 4 Results and Discussion................................................................................................. 31 4.1. Hypothetical Case Study - Spot Valley Estate.............................................................. 31 4.2. Discussion of Uncertainties .......................................................................................... 24
4.2.1. Weights ................................................................................................................... 24 4.2.2. Ranges..................................................................................................................... 25 4.2.3. Ratings .................................................................................................................... 26
4.3. Discussion of Subjectiveness........................................................................................ 27 Chapter 5 Conclusions and Recommendations for Future Work ................................................. 28
5.1. Conclusions................................................................................................................... 28 5.2. Broader Applicability.................................................................................................... 29 5.3. Recommendations for Future Work.............................................................................. 30
References..................................................................................................................................... 32 Appendix A Sanitation Implementation Assessment Tool........................................................... 39 Appendix B Sanitation Implementation Assessment Tool Rules Table....................................... 40 Appendix C Hydrostratigraphic Map of Jamaica by Dwight Smikle ........................................... 44 Appendix D WRA Guidelines for Assessing the Vulnerability of Groundwater in a Given Area to Pollution.................................................................................................................................... 62 Appendix E Sustainability Factor Checklists ............................................................................... 67
iv

List of Figures
Figure 1: Estimated mortality and disease burden for selected environmental risk factors .......... 9 Figure 2: Map of Jamaica Showing the Area of Basement Aquiclude........................................ 19 Figure 3: Process Flow Diagram for Sanitation Implementation Assessment Tool .................... 23 Figure 4: Completed Sanitation Implementation Assessment Tool Worksheet for Spot Valley
Estate..................................................................................................................................... 24 Figure 5: Completed Sustainability Assessment Worksheet for Spot Valley Estate................... 25
List of Tables
Table 1: Water supply and sanitation technologies considered improved and not improved ....... 2 Table 2: Comparison of water supply and sanitation coverage in Jamaica, Latin America & the
Caribbean, and the world for 2000 ............................................................................................. 4 Box 1: Common definitions used to describe public health .......................................................... 8 Table 3: Ten leading risk factors contributing to burden of disease in 2000............................... 10 Table 4: Descriptions of Decision Support Tools and Concepts ................................................. 13 Table 5: Definitions of DRASTIC parameters ............................................................................. 16 Table 6: Assigned Weights for DRASTIC Parameters................................................................ 17 Table 7: Typical Onsite Treatment Systems per Treatment Requirement................................... 21 Table 8: Description of Sanitation Implementation Assessment Tool Fields.............................. 23 Table 9: Jamaican Hydrogeologic Settings and Key Descriptors................................................ 25 Table 10: Ratings and descriptions used in sanitation implementation assessment tool ............. 28
v

List of Acronyms
AHP Analytic Hierarchy Process AIDS Acquired Immune Deficiency Syndrome AMR-B WHO Subregion Americas B (low-mortality developing countries in the
Americas) DALY Disability Adjusted Life Years DEA Data Envelopment Analysis DI DRASTIC Index DRASTIC Depth to water, net Recharge, Aquifer media, Soil media, Topography, Impact of
the vadose zone, hydraulic Conductivity EHU Environmental Health Unit ER Evidential Reasoning GIS Geographic Information Systems GPA Global Programme of Action (for the Protection of the Marine Environment from
Land-Based Activities, UNEP) HIV Human Immunodeficiency Virus LVI Local Vulnerability Index MAGIQ Multi-Attribute Global Inference of Quality MAUT Multi-Attribute Utility Theory MCDA Multi-Criteria Decision Analysis MCDM Multi-Criteria Decision-Making MOH Ministry of Health NDI Normalized DRASTIC Index NLVI Normalized Local Vulnerability Index NRC National Research Council NSI Normalized Sustainability Index PAI Project Appropriateness Index SMART Simple Multi-Attribute Rating Technique UN United Nations UNDESA United Nations Department of Economic and Social Affairs UNEP United Nations Environmental Programme UNICEF United Nations International Children�’s Emergency Fund WHO World Health Organization WRA Water Resources Authority WSH Water, Sanitation, and Hygiene
vi

Acknowledgements
Thank you to the US Peace Corps and the government of Jamaica for allowing me to fulfill my
dream of volunteering abroad. Thanks to the staff of Peace Corps Jamaica for supporting me in
my efforts. Many thanks to Jamaica�’s Ministry of Health and the Western Regional Health
Authority for making a likkle space for me. Special thanks to my supervisor and Regional
Environmental Officer Basel McFarlane, Regional Technical Director Dr. Alexander
Konstantinov, and GIS Master Orett Clarke. Thanks also to the public health inspectors of the
western parishes, especially Hubert Cooke, Steve Morris, Basil Dunn, Marsha Ann Palmer,
Andrew Hall, Kareen Miller, and Mr. Malcolm. Thanks to the professionals and staff at the
Water Resources Authority, Michelle Watts, and especially Andreas Haiduk for his valuable
time, technical expertise, and inspiration for this project.
I would also like to give thanks to the community members of Flankers, St. James who
welcomed me into their lives and became my family in Jamaica. Thanks to Mrs. Nash, Parry,
Charm, Rose, Gene, Sandy, Auntie Viviene, Sasha Lee, Alicia, Nikisha, and the rest of the staff
and students of the Flankers Peace and Justice Centre. Friends, be brave and keep up the good
work.
Thanks to Michigan Technological University and the various groups and organizations at MTU
that supported and enriched me. Thanks to the GUIDE program for helping to financially
support my graduate education. Many thanks to the Sustainable Futures Institute for the
opportunity to begin learning about the balance of economy, society, and environment by
earning the Graduate Certificate in Sustainability. Thanks to the D80 Center and Engineers
Without Borders as well as mentors Dr. Kurt Patterson and Dr. John Gierke for allowing me to
present my Peace Corps experience to a diverse audience and for guiding me.
I would like to give a special note of thanks to my graduate committee. Dr. Blair Orr, thank you
for your �“beyond engineering�” perspective and for preparing me to be realistic in my
expectations of my service. Dr. David Watkins, thanks for your technical expertise on so many
aspects of this project. You were more than just a part of my committee; you took the time to
vii

travel to Jamaica to be a part of my Peace Corps experience, and for that I am grateful. I would
like to say a very special thank you to my advisor, Dr. James Mihelcic, for his tireless patience
and constant support during my two years in the Peace Corps. His persistent urging to take a
larger perspective of my work kept me from giving up on this effort more times than I can count.
Jim, you are not only a great cheerleader, you are a mentor and a role model of the type of person
I want to be.
Finally, I would like to give a big �“RESPECT�” to all those who have served and are serving in
the cause of peace. Keep your torches burning brightly so that others may see the way forward.
viii

Abstract
Proposals for new on-site wastewater treatment systems in Jamaica are approved by responsible
authorities based largely on expert judgment. This study has analyzed the technical inputs in on-
site sanitation decision making and the processes followed in Jamaica at the national and parish
levels. A standardized methodology for groundwater vulnerability assessments (DRASTIC) and
an assessment tool for project managers in sustainable development work have also been
reviewed. These materials have been brought together and adapted to create a decision support
tool for on-site wastewater systems in Jamaica. This decision support tool evaluates technical
site data using DRASTIC and project sustainability using checklists adapted from the reviewed
assessment tool. In addition to environmental data and economic viability, the support tool
evaluates socio-cultural respect, community participation, and political cohesion as components
of social sustainability. As a result, the score represents a triple bottom line (environmental,
economic, and social) evaluation of the proposed project. Parameters from each of these
methodologies are evaluated and weighted to generate a project appropriateness index. This
score represents the project�’s suitability in terms of relative risk of environmental contamination
and social and economic feasibility. It is hoped that adoption and use of this tool by health
authorities will result in better on-site sanitation decisions and help ensure the safety of drinking
water for the future.
ix

Chapter 1 Introduction and Objectives
1.1. Sanitation in the Developing World
Clean water and sanitation are critical needs throughout the world. Nearly 1.1 billion people still
remain without access to improved sources of water, and about 2.4 billion have no access to any
form of improved sanitation (WHO/UNICEF, 2000). The term sanitation refers to a process
whereby people demand, effect, and sustain a hygienic and healthy environment for themselves
by erecting barriers to prevent the transmission of disease agents (UNICEF, 1997). UNEP
(2004) further defines sanitation as:
Control of physical factors in the human environment that could harm development,
health, or survival.
The study and use of practical measures for the preservation of public health.
The Global Water Supply and Sanitation Assessment 2000 by the World Health Organization
(WHO) and United Nations International Children�’s Emergency Fund (UNICEF) further goes on
to say that certain types of water supply and sanitation technologies are safer or more adequate
than others and that some of them could not be considered as �“coverage.�” Terms such as �“safe�”
and �“adequate�” should therefore be replaced with �“improved�” (WHO/UNICEF, 2000). Types of
facilities that are considered as �“improved�” water sources and �“improved�” sanitation facilities are
provided in Table 1.
1

Table 1: Water supply and sanitation technologies considered improved and not improved The following technologies are considered to be �“improved�”: Water supply Household connection Public standpipe Borehole Protected dug well Protected spring Rainwater collection
Sanitation Connection to a public sewer Connection to septic system Pour-flush latrine Simple pit latrine Ventilated improved pit latrine
The following technologies are considered to be �“not improved�”: Water supply Unprotected well Unprotected spring Vendor-provided water Bottled water* Tanker truck provision of water
Sanitation Service or bucket latrines (where excreta are manually removed) Public latrines Open latrine
*Not considered �“improved�’ because of limitations concerning the potential quantity of supplied water, not the quality.
(WHO/UNICEF, 2000)
As many as 5.2 million people, including 4 million children under five years of age, die each
year from waste-related diseases (UNDESA, 2004). Many of these deaths can be prevented by
increased coverage of improved sanitation technologies. While improvements in sanitation
coverage are under way, a large amount of work remains to be done, particularly in the
developing world. The following sanitation statistics, taken from the Global Water Supply and
Sanitation Assessment 2000, provide a good summary:
The proportion of people with access to excreta disposal facilities increased from 55% in
1990 to 60% in 2000. Between those years, approximately 747 million people gained
access to sanitation facilities. At the same time the number of people who lack access to
sanitation services remained roughly the same.
At the beginning of 2000, two-fifths of the world�’s population (2.4 billion people) lacked
access to improved sanitation facilities.
Sanitation coverage in rural areas is less than half of that in urban locations. The result is
that 80% of those lacking adequate sanitation (2 billion people) live in rural areas.
In Africa, Asia, Latin America and the Caribbean, nearly 2 billion people in rural areas
have no access to improved sanitation facilities.
2

To achieve WHO/UNICEF 2015 sanitation targets in Africa, Asia, Latin America and the
Caribbean, an additional 2.2 billion people will have to be provided with sanitation
facilities.
Polluted water is estimated to affect the health of more than 1.2 billion people, and to
contribute to the death of an average 15 million children every year.
(WHO/UNICEF, 2000)
1.1.1. Agenda 21
Drafted in 1992, the United Nations Department of Economic and Social Affairs�’ Agenda 21, the
Rio Declaration on Environment and Development, sets out a vision for global partnership for
sustainable development. Sustainable development as defined by the Brundtland Commission
(UN, 1987) is �“development that meets the needs of the present without compromising the
ability of future generations to meet their own needs.�” Chapter 21 of Agenda 21 addresses
environmentally sound management of solid wastes and sewage-related issues. Agenda 21 lays
out a foundation of specific objectives and essential actions to stop and ultimately reverse
environmental degradation caused by unsustainable waste and sewage disposal. The four key
waste-related program areas are:
1. Minimizing wastes,
2. Maximizing environmentally sound waste reuse and recycling,
3. Promoting environmentally sound waste disposal and treatment, and
4. Extending waste service coverage.
Of these program areas, the last two deal particularly with sanitation. Promoting
environmentally sound waste disposal and treatment is of extreme importance for health. In the
developing world less than 10% of urban sewage is treated at all, and only a small portion of that
which is treated meets international standards (UNDESA, 2004). The program requires
governments to establish treatment and disposal quality criteria, monitor pollution levels, and
finally dispose of all waste in accordance with national and international environmental quality
guidelines. Extending waste service coverage is also key to ensuring the health of people and the
environment. This program compels governments to first mobilize necessary technical, financial
and human resource capacity and eventually provide adequate waste collection services in all
urban areas and sanitation coverage in all urban and rural areas.
3

1.1.2. Sanitation in Jamaica
Like many developing countries, Jamaica is under pressure to provide adequate water and
sanitation services to an ever-growing population. Table 2 summarizes the coverage of water
supply and sanitation in Jamaica in comparison to that of the region (Latin America and the
Caribbean) and the world. While a few of the larger cities like Kingston, Montego Bay, Ocho
Rios, and Negril have centralized sewage collection and treatment systems, such facilities are
just now on the drawing board for most other cities. Sewerage is not generally provided in rural
areas, except in small housing developments. The most common form of rural sanitation is the
pit latrine, used by 68% of rural households. Septic tanks, pit latrines and other types of on-site
sanitation can be effective and safe. However, if not constructed, used and maintained properly,
they can pose a threat to health and the quality of aquifers and surface water (Jamaica Water
Sector Policy Paper, 1999).
Table 2: Comparison of water supply and sanitation coverage in Jamaica, Latin America & the Caribbean, and the world for 2000
% Water Supply Coverage % Sanitation Coverage Urban Rural Total Urban Rural Total Jamaica 81 59 71 98 66 84 Latin America & the Caribbean 93 62 85 87 49 78 World 94 71 82 86 38 60
(WHO/UNICEF, 2000)
In places in which centralized treatment is available, developers are generally required to connect
to these systems. Outside of these locations, wastewater must be hauled away or treated on-site.
The latter of these options is generally preferable. The procedure to apply for on-site wastewater
disposal and treatment systems is detailed in the Developer�’s Manual for On-site Wastewater
Treatment and Excreta Disposal Management (MOH, May 2004). A detailed engineer�’s report
is not required if the developer proposes a traditional on-site wastewater treatment system for
single unit dwellings. However, applications for properties with more than nine lots require a
building application form, engineer�’s report, site survey plan, detailed plan drawings, and
specifications. These documents must be submitted to the responsible parish council. The parish
council in turn submits the information to the National Environmental Planning Agency (NEPA),
4

which forwards the application to relevant government agencies. NEPA chairs a meeting of the
Technical Review Committee comprised of the following organizations:
National Environmental Planning Agency
Water Resources Authority
National Irrigation Committee
National Works Agency
Office of Disaster Preparedness and Emergency Management
Mines and Geology Division
Jamaica Bauxite Institute
Ministry of Health / Environmental Health Unit
Surveyor�’s Association
The Water Resource Authority (WRA) is the agency charged with establishing which sites are
suitable for soil absorptive methods and the level of treatment required. This evaluation takes
into consideration many parameters including soil type, underlying hydrostratigraphy, depth to
groundwater, population density, and proximities to wells, springs, fault lines, and surface water.
Though the data used is quantitative in nature, the decision-making process is not formalized.
WRA professionals have access to the most current hydrogeological data, but little technical
support in making final decisions. Hence they must rely largely on professional judgment.
Similar limitations exist at the parish level. Public health inspectors can use available resources
such as groundwater maps to characterize site-specific data such as groundwater depths and flow
directions, but modern decision support methods and tools are not available.
1.2. Objectives
Sanitation decisions need to be based on available technical data and supported by tools that can
be used by those in positions of responsibility. Accordingly, the objectives of this work are to:
1. Assess current methods and tools used in the on-site wastewater system approval process;
2. Identify available decision support tools and ensure they are made available to persons
responsible for sanitation decisions;
3. Identify gaps in methods and tools used by responsible authorities; and
4. Develop support tools to fill gaps and build capacity in sanitation decision-making.
5

1.3. Rationale
Current on-site system certifications are made primarily based on the professional judgment of
persons in positions of responsibility for public and environmental health. While there is no
completely automated substitute for this acquired skill, a support tool can improve the efficiency
and accuracy of the decision-making process by emphasizing important criteria and steps to be
followed. Responsible persons must analyze the full complement of possible groundwater
contamination routes. They must further study proximity and flow paths of surface runoff to
determine risk to surface water bodies. The implications of contamination of ground water and
nearby surface water bodes must be evaluated, and ultimately the professional must judge what
level of treatment is needed for the site. The proposed system is then evaluated against this
judgment, with full consideration of special circumstances, and the application is either approved
or denied. Similar decision processes occur for both larger and smaller developments and single-
building applications at the parish, city, and community levels.
A decision support tool will aid responsible persons in determining level of treatment required by
systematizing the decision-making process. Besides allowing comparisons of different treatment
levels, such a tool will track key inputs, point out situations in which rules and guidelines (e.g.
minimum distances) have been violated, and provide guidance in local to regional contexts. In
addition, a standardized tool will help promote consistency in on-site treatment decisions
throughout Jamaica.
6

Chapter 2 Background
2.1. Health and Environmental Risk
In the evaluation of groundwater and surface water contamination routes, public health
professionals must carefully consider the risk posed by improperly treated discharges from
sanitation systems. Risk is defined as the possibility of suffering harm or loss; danger or a
factor, thing, element, or course involving uncertain danger; a hazard (American Heritage
Dictionary, 2004). The World Health Report 2002 (WHO, 2002) further illustrates using the
following definitions:
Risk can mean a probability, for example, the answer to the question: �“What is the risk
of getting HIV/AIDS from an infected needle?�”
Risk can mean a factor that raises the probability of an adverse outcome. For example,
major risks to child health include malnutrition, unsafe water and indoor air pollution.
Risk can mean a consequence. For example, what is the risk from driving while drunk?
(Answer: Being in a car crash).
Risk can mean a potential adversity or threat. For example, is there risk in riding a
motorcycle?
Other terms useful for describing risk in public health decisions are listed in Box 1 (Fry, 2008).
7

Box 1: Common definitions used to describe public health
Morbidity
Incidence of illness
Mortality �“Mortality�” and �“death�” are used interchangeably
Relative Risk A ratio of the risk of morbidity or mortality for a population receiving an intervention to the risk for a population not receiving the intervention
Population Attributable Risk or Fraction The fraction of occurrence of a disease or death that is attributable to a particular risk factor in a population
Disability Adjusted Life Years (DALYs) A measure of burden of disease. One DALY is equal to the loss of one healthy life year due to death or the inability to work because of illness. In 2001, there were nearly 1.5 billion DALYs, or roughly 0.24 DALY per person globallya.
Attributable Burden of Disease The fraction of a disease or injury burden that results from past exposure to a riska
Avoidable Burden of Disease The proportion of future disease or injury burden that is avoidable if exposure levels are reduced to an alternative distribution a
a WHO 2002
Risk factors are critical in the evaluation of disease burden that a society must bear. The World
Health Organization has conducted extensive reviews of studies showing risk factor and disease
burden correlations. Figure 1 shows the five types of environmental risk that lead to the greatest
disease burden both worldwide and in low-mortality developing countries in the Americas
(WHO Subregion AMR-B), which includes Jamaica.
8

Figure 1: Estimated mortality and disease burden for selected environmental risk factors
%DALYs of total environment-related DALYs (figure adapted from Ezzati et al., 2004)
Worldwide unsafe water, sanitation, and hygiene (WSH) account for almost half of the disease
burden attributable to environmental risks. In developing countries in the Americas, this risk
factor comprises over one-third of the environmental disease burden, second only to lead
exposure. Environmental factors likewise represent an estimated 94% of the diarrhoeal burden
of disease in the world, with associated the risk factors unsafe drinking-water and poor sanitation
and hygiene as paramount (Prüss-Üstün and Corvalán, 2006). Diarrhea is in turn responsible for
4.3% of the global burden of disease (WHO 2004). The bottom line is that unsafe WSH as a
single risk factor contributes heavily to the worldwide burden of disease. Table 3 shows the
distribution of burden of disease according to risk factor.
9

Table 3: Ten leading risk factors contributing to burden of disease in 2000 (Source: WHO, 2002).
10 leading selected risk factors in high mortality developing countries in 2000
10 leading selected risk factors in developed countries in 2000
Risk Factor % DALYs Risk Factor % DALYsUnderweight 14.9 Tobacco 9.4 Unsafe sex 10.2 Blood pressure 7.2 Unsafe water, sanitation, and hygiene 5.5 Alcohol 6 Indoor smoke from solid fuels 3.7 Cholesterol 3.5 Zinc deficiency 3.2 Overweight 3 Iron deficiency 3.1 Low fruit and vegetable intake 2.8 Vitamin A deficiency 3 Physical inactivity 2.6 Blood pressure 2.5 Illicit drugs 2.5 Tobacco 2 Unsafe sex 2.5 Cholesterol 1.9 Iron deficiency 2.4
The importance of understanding how diseases are transmitted through water-related routes is
clear, considering that the risk factor �“water, sanitation, and hygiene�” is responsible for 5.5% of
all DALYs in low- and middle-income countries (WHO, 2002). It is obvious that diarrhea,
environmental causes, and ultimately unsafe WSH are all risk factors that build on and feed into
each other. But what are the risk factors that lead to unclean water, inadequate sanitation, and
poor hygiene? This study will identify some of the key parameters and factors that can lead to
elevated risk of groundwater and surface water contamination. In their assessments of risk to
groundwater and surface water, health professionals must examine these factors to determine the
overall risk of a sanitation technology selection and siting decision.
2.2. Decision Support
2.2.1. Decision Support the Developing and Developed World
In 2000-2001 the UNEP/GPA Coordination Office was directed to implement the GPA Strategic
Action Plan on Municipal Wastewater. This Strategic Action Plan is an effort to help nations
deal with public health problems and coastal environmental degradation caused by discharge of
municipal wastewater with insufficient or no treatment. A guide called Recommendations for
Decision-Making, coupled with a Knowledge Base, was created (UNEP, 2001). These materials
inform decision makers and professionals on environmentally sound wastewater management
10

and treatment systems. Practices and procedures recommended in the guide include the
following:
Technology, developing the relevant sections of the GPA and addressing, amongst others,
infrastructure, cleaner production and best practices;
Management, including regulations and legislation; operation and maintenance;
appropriate charges and their collection; establishment of emission limits and
surveillance, and economic and financial instruments;
Institutional arrangements, including the structure of the administrative system, capacity
building, public participation and information needs;
Sustainability, addressing the long term requirements of wastewater management
systems;
Domestic resource mobilization, detailing the possibilities to mobilize within the
municipality or nation the required financial resources; and
International resource mobilization to supplement the domestic resources.
Similarly, �“Intersectoral decision-making skills in support of health impact assessment of
development projects final report�” by the World Health Organization (2006) lists a number of
participatory techniques involving decision-makers but does not include information on decision
support for process or technical experts. UNICEF has similar references but again does not
delve into the realm of decision support techniques.
On the other hand, sanitation decisions in the developed world are mostly based on technical
evaluations and funded via a tax base built on a predominately gainfully employed populace. As
examples of research applications, Queensland University of Technology researchers have used
multicriteria decision-making to technically evaluate site suitability for sewage effluent
renovation based on physico-chemical characteristics of the soil; and Khalil et al. (2004 & 2005)
used multi-criteria decision-making (MCDM) methods, PROMETHEE and GAIA, in the
analysis of soil samples. While a systematic technical evaluation was carried out in these
studies, the decision-making technique was focused on data processing of one set of parameters,
soil characteristics, rather than a full range of technical (environmental) and socio-economic
factors. Quite simply, the question addressed was, �“How can we make this treatment design
11

perform optimally?�” rather than, �“Can we afford or not afford to use this design in the first
place?�”
2.2.2. Decision Support Tools
In the 1980s Stuart Pugh developed the decision matrix at the University of Strathclyde in
Glasgow, Scotland. Used to describe a Multi-Criteria Decision Analysis (MCDA) problem, the
decision matrix involves creating a grid of decision alternatives and evaluation criteria or
metrics. Decision alternatives are listed on one axis and evaluation criteria on the other. Each
decision alternative is evaluated against each criterion and assigned a score. The score may be
subjective or objective but should be relevant to the decision at hand. If any of the metrics are
subjective in nature, an interval scale may be utilized. If so desired, subjective weights may be
placed on each metric to establish a relative importance (Mavris and Kirby, 1999). Once all
decision alternatives have been scored against all criteria, the results are tabulated and the
decision alternatives can be evaluated as a whole.
The decision matrix technique is effective for making decisions in which several alternatives
must be judged against one another using a number of criteria. As such it is useful in evaluating
complex systems and decision-making processes. Its inherent limitations lie in the subjectivity
of its scoring system. Even where hard numbers are used, their relevance to the decision being
made can be subjective. Further, not all criteria are generally equal in such decisions, so that
their weighting, while necessary to the process, is also subjective. These weights can be fine-
tuned based on working models, experience, and desired outcomes, but in the end, there is really
no way to remove subjectivity from them altogether. Finally, it is likely the case that some
criteria are related (i.e., not independent), and so the additive scoring system may give undue
weight to particular features of the decision that are better represented in the defined criteria than
others. Yet the technique remains a valuable asset to complex decision-making and will likely
be used for such for many years to come.
Decision support tools and concepts discussed in the literature are listed in Table 4.
12

Table 4: Descriptions of Decision Support Tools and Concepts Simple Multi-Attribute Rating Technique (SMART), also known as the decision matrix
Capable of handling both tangible and intangible attributes, SMART evaluates questions on an explicit 0 to 100 point scale. This attribute allows for ease of comparison among all choices. SMART requires no judgments of preference or indifference among hypothetical entities. (Yap, 1992)
Analytic Hierarchy Process (AHP) AHP involves the use of a hierarchical structure to represent the decision problem. It requires pairwise comparisons (as contrasted with simultaneous comparisons) of the project alternatives as well as pairwise comparisons of the multiple criteria. (Yap, 1992)
Preference Ranking Organization Method for Enrichment Evaluations (PROMETHEE)
PROMETHEE is a non-parametric method, which ranks a number of objects on the basis of a range of variables or criteria and suitable preference functions. PROMETHEE establishes preference flows ( ) for each variable and respective criteria and ranks are based on the established preference flows. (Khalil, 2005)
Graphical Analysis for Interactive Assistance (GAIA)
GAIA is a visualization method, which complements the PROMETHEE ranking providing guidance regarding the principal criteria, which contribute to the rank order of the objects. Also, GAIA is crucial for experimenting with different criteria weightings. (Khalil, 2005)
Fuzzy Logic First introduced in 1965, fuzzy logic and fuzzy set theory have been extensively used in ambiguity and uncertainty modeling in decision making. The basic concept is that statements are not only �“true�” or �“false.�” Partial belonging to a set, called a fuzzy set, is also possible. Fuzzy sets are characterized by membership functions. (Afshar, 2007)
2.3. Groundwater Vulnerability Assessments
Like many places in the world, Jamaica relies on groundwater as the source of most of its potable
water. Protection of this resource is needed to ensure that future generations will have the water
they need for economic and social prosperity. In order to protect groundwater, assessments of its
vulnerability must be made when considering proposed on-site wastewater systems in new
building developments. Several definitions of vulnerability are offered in the literature:
13

Sotornikova and Vrba (1987) define vulnerability as: �“The ability of the system to cope
with external impacts, both natural and anthropogenic, which affect its state and character
in time and space.�”
The U.S. National Research Council (NRC 1993) defines vulnerability as: �“The tendency
or likelihood for contaminants to reach a specified position in the groundwater system
after introduction to some location above the most upper aquifer.�”
Villumsen et al. (1982) provide a risk-based definition: �“The risk of chemical substances
used or disposed on or near the ground surface to influence groundwater quality.�”
Assessments of groundwater vulnerability may be of an intrinsic and/or specific nature. Intrinsic
vulnerability refers to the groundwater contamination probability of an area based solely on its
geological and hydrological characteristics. These characteristics can include aquifer properties,
water recharge rates, and soil composition. Specific vulnerability is a measure of the pollution
potential for particular contaminant and is based on its physical and chemical properties. Full
assessment of groundwater vulnerability requires concern for both intrinsic and specific
vulnerabilities. However, as this study focuses on sanitation, only intrinsic vulnerability will be
considered.
2.4. DRASTIC Groundwater Pollution Potential Factors
Determining the vulnerability of groundwater to contamination on an aquifer or regional scale is
an immense undertaking. Direct sampling and monitoring is an expensive and tedious method
even in the developed world. Developing an understanding of the underlying geology and
hydrology of an area allows one to apply subjective modeling, making analyses of large regions
far more feasible. There are three general approaches to assessing groundwater vulnerability:
statistical methods, overlay (index) methods, and process-based contaminant transport models.
Even though a combination of the three strategies will provide better insight into the
complexities for regional groundwater vulnerability, the overlay and index methods provide
relatively rapid assessments where preliminary measures of intrinsic and specific vulnerability
are available (Afshar et al. 2007). The index approach utilizes a weighted combination of the
14

state variables rated on the basis of previous contaminant transport research. Any number of
variables may be used. Aller et al. (1987) introduced an index method which has become a
standard in groundwater vulnerability assessments. The method is known as DRASTIC, an
acronym for its seven key parameters:
D = Depth to water
R = (Net) Recharge
A = Aquifer media
S = Soil media
T = Topography (slope)
I = Impact of the vadose zone
C = (Hydraulic) Conductivity of the aquifer
The two key components of the DRASTIC method are the identification of mappable areas
called hydrogeologic settings and the specification of the numerical system and relative ratings
used to generate the index.
In DRASTIC a hydrogeologic setting is a composite description of all the major geologic and
hydrologic factors which affect and control groundwater movement into, through, and out of an
area. It is defined as a mappable unit with common hydrogeologic characteristics, and as a
consequence, common vulnerability to contamination by introduced pollutants (Aller et al.
1987). A large number of factors were considered in the development of the method, including
aquifer chemistry, temperature, transmissivity, tortuosity, gaseous phase transport. Also
considered was which information could be readily ascertained, as use of indeterminable data
would have rendered the method useless. In the end the seven key parameters that make up the
name of the method were selected. Definitions of these parameters are shown in Table 5.
15

Table 5: Definitions of DRASTIC parameters extracted from Aller et al. (1987)
Depth to water (D) Depth to water refers either to the depth to the water surface in an unconfined aquifer or to the top of the aquifer where the aquifer is confined.
Net Recharge (R) Net Recharge indicates the amount of water per unit area of land which penetrates the ground surface and reaches the water table.
Aquifer Media (A) Aquifer media refers to the consolidated or unconsolidated medium which serves as an aquifer. The aquifer medium exerts the major control over the route and path length which a contaminant must follow. The path length is an important control (along with hydraulic conductivity and gradient) in determining the time available for attenuation processes such as sorption, reactivity, and dispersion and also the amount of effective surface area of materials contacted in the aquifer.
Soil Media (S) Soil media refers to that uppermost portion of the vadose zone characterized by significant biological activity. For purposes of this document, soil is commonly considered the upper weathered zone of the earth which averages three feet or less.
Topography or slope (T) Topography refers to the slope and slope variability of the land surface. Basically, topography helps control the likelihood that a pollutant will run off or remain on the surface in one area long enough to infiltrate.
Impact of the Vadose Zone (I)
The vadose zone is defined as that zone above the water table which is unsaturated. The type of vadose zone media determines the attenuation characteristics of the material below the typical soil horizon and above the water table. The media also control the path length and routing, thus affecting the time available for attenuation and the quantity of material encountered. The routing is strongly influenced by any fracturing present.
Hydraulic Conductivity (C)
Hydraulic conductivity refers to the ability of the aquifer materials to transmit water, which in turn, controls the rate at which ground water will flow under a given hydraulic gradient.
The numerical ranking system of DRASTIC is a classic index and overlay method for assessing
groundwater vulnerability. To generate the index, the method requires three significant sets of
constants: weights, ranges, and ratings.
(1) Weights - The relative importance of each DRASTIC factor in determining contamination
potential was evaluated with respect to the others. The technical advisory committee charged
with developing DRASTIC used a Delphi (consensus) approach to determine weight values.
Each DRASTIC factor has been designated a relative weight ranging from 1 to 5. The factors
16

most significant to groundwater vulnerability have weights of 5; the least significant a weight of
1. The weight for each of the DRASTIC factors is shown in Table 6
Table 6: Assigned Weights for DRASTIC Parameters
Parameter Weight
Depth to Water Table 5
Net Recharge 4
Aquifer Media 3
Soil Media 2
Topography 1
Impact of the Vadose Zone 5
Hydraulic Conductivity of the Aquifer 3
Another set of weights known as Agricultural DRASTIC was developed by Aller et al. (1987) to
reflect the pollution potential of herbicides and pesticides in agricultural settings. This weight
set is outside the scope of this study and will not be considered.
(2) Ranges - Each DRASTIC factor specified by a numerical value has been divided into ranges.
Material factors (A, S, and I) are designated by significant media types. For the numerical
values of these ranges, see Aller et al. (1987).
(3) Ratings - Each range has been compared with the others to determine its contribution to
groundwater vulnerability. The DRASTIC ratings range from 1 to 10. For the numerical values
of these ratings, see Aller et al. (1987).
The value of the DRASTIC index is determined by summing the contributions (weighted ratings)
of all seven parameters. The equation for calculating the DRASTIC Pollution Potential Index is:
DrDw + RrRw + ArAw + SrSw + TrTw + IrIw + CrCw = Pollution Potential Equation 2-1
where D, R, A, S, T, I, and C correspond to the parameters listed in Tables 5 and 6, and the
subscripts r and w denote rating and weight, respectively.
17

Chapter 3 Methodology
Many agencies in Jamaica are involved in protecting public health and therefore protecting the
environment. The organization responsible for approval of proposed water harnessing and on-
site sewage systems is the Water Resources Authority (WRA). Technical comments are often
sought from the Water Resources Authority by the Town Planning Department, the Natural
Resources Conservation Authority, and developers who represent land owners. Comments are
generally sought on the suitability of proposed sewage treatment / disposal methods at various
locations in the island on the basis of the potential for groundwater contamination (WRA
Guidelines, 1999). WRA professionals review a host of information about each site and
proposed development. Of particular concern is the issue of groundwater contamination. A
number of wells and springs in Jamaica have been condemned as a result of unacceptably high
levels of contamination. A chief culprit of these contaminations has been the overuse of pit
latrines and soak-away pits. Once a source is contaminated, it will remain so for many years
because pits continue to seep sewage into the groundwater even after their use is discontinued.
A decision is made on the potential for groundwater pollution at or near the site, based on the
subsurface geology (e.g., aquiclude or aquifer, based on the hydraulic conductivity), the
existence of faults, the depth of the water table and the direction of groundwater flow, the type
and depth of soil cover, and the history of groundwater pollution in the area (WRA Guidelines,
1999). WRA professionals use hydrostratigraphic maps to study a site�’s underlying geology.
A hydrostratigraphic unit is a group of rocks that exhibits similar hydrologic properties and is
contemporaneous (of similar geological period) within the stratigraphic sequence. The
formations are mapped on the basis of their water bearing properties, either as aquifers or
aquicludes. Aquifer refers to a rock or group of rocks that allow for the movement and/or
storage of groundwater. In the Jamaican context an aquiclude is any rock or group of rocks that
does not allow for the movement or storage of groundwater resources (Smikle, 2000). Faults,
high water table, thin or porous soil covering, and other factors contribute to increasing the
vulnerability of groundwater to contamination. The area covered by the Basement Aquiclude, a
18

hydrostratigraphic unit of very low permeability, is shown as an example in Figure 2. The six
most important hydrostratigraphic units present in Jamaica are described in Appendix C.
Figure 2: Map of Jamaica Showing the Area of Basement Aquiclude
In areas in which there is a low vulnerability to contamination (such as the Basement Aquiclude
shown in Figure 2) a primary treatment system such as a pit latrine is usually adequate for
sewage disposal. In places of higher vulnerability, secondary or even tertiary sewage treatment
may be necessary. An important distinction must be made between treatment stages typically
used in sanitation literature and these treatment quality levels or categories which are unique to
Jamaica. As a review of the treatment stages, UNEP (2004) offers the following definitions:
The first stage of contaminant removal in a wastewater treatment plant through screening
and settling processes, which can remove 40-50% of contaminants.
Second stage of wastewater treatment to reduce suspended solids through biological
cleansing, to remove between 85-95% of contaminants.
Third stage of wastewater treatment including filtration and disinfection, which
effectively removes up to 99.999% of pathogens and suspended solids.
The Developer�’s Manual - On-site Wastewater Treatment and Excreta Disposal Management
(MOH/EHU, 2004) provides these definitions:
Primary treatment is defined as simply physical treatment prior to final disposal.
Secondary treatment requires physical treatment and biological treatment prior to final
disposal. This treatment level corresponds to most soil absorption systems.
19

Tertiary treatment is usually required when proposed developments are located within an
environmentally sensitive area or area of public health concern. This treatment level
requires physical and advanced biological treatment. Sometimes chemical treatment may
be used in combination to obtain effluent requirements. Tertiary treatment systems are
typically evaporation-transpiration systems or systems with liquid discharge.
For purposes of this study, primary, secondary, and tertiary treatment will refer to Jamaica�’s
quality levels or categories. Table 7 outlines the Jamaican categories or quality levels along with
typical treatment systems for which the Jamaican Ministry of Health grants approval.
Table 7: Typical Onsite Treatment Systems per Treatment Requirement
Category Treatment Requirements
Typical Treatment Systems
Dry Excreta Management
Not applicable Ventilated Improved Double Pit Latrine Biolatrine (composting)
Primary Treatment
Settle solids Septic tank + Absorption Pit
Secondary Treatment
Settle solids and
Biological treatment
Septic Tank + Tile Field Septic Tank + Intermittent Sand Filter Septic Tank + Mounded Tile Field Septic Tank + Tiled Chamber System
Tertiary Treatment
Physical treatment and
Biological treatment or
Chemical treatment
Biodigester Septic Tank + Subsurface Wetland
Septic Tank + Evapotranspiration Bed Septic Tank + Recirculating Sand Filter Septic Tank + Intermittent Sand Filter +
Tile Field Septic Tank + Intermittent Sand Filter +
Reed Bed (subsurface wetland)
(MOH/EHU, 2004)
20

The following documents are submitted to WRA in the course of a development application:
A site location map
A layout plan
Present and proposed use of land
Type of sewage disposal method proposed
Soil report
(WRA Guidelines, 1999)
In addition to the information contained in these documents, WRA professionals must rely on
their stratigraphic maps, well databases, GIS map layers, population and survey data, and other
data sources. They must analyze all possible groundwater contamination routes to access
vulnerability and evaluate the proposed treatment method. In the end professional judgment
dictates whether applications should be approved. No automated program can replace this
professional judgment, but decision support tools and techniques can aid in the presentation and
assessment of relevant data to help professionals to make quicker, more informed, and more
consistent decisions.
3.1. Development of an On-site Wastewater Decision Support Tool for Jamaica
As a result of this effort, a sanitation implementation assessment tool for Jamaica has been
developed. This tool was constructed to allow a user to input key parameters and see the relative
risk of contamination associated with primary, secondary, and tertiary levels of on-site
wastewater treatment.
It is important that this tool be in a simple format so that it is readily usable by health and water
professionals with a wide variety of computer backgrounds and expertise. Three sets of
parameters are used to determine the relative groundwater vulnerability, the importance of local
features, and project sustainability. Spreadsheet constants for calculation of relative risks are
presented in a rules table. This rules table contains a description of each rule, reference, a first
test value (or lower bound), a second test value (or upper bound), and a relative risk (or rating)
value. The relative risk is a value from 1 to 10 assessed based on the apparent risk suggested by
21

22
the description and reference. These values are multiplied by their respective parameter weights
and summed to produce a relative risk for each level of treatment.
3.2. Sanitation Implementation Assessment Tool Usage
The sanitation implementation assessment tool created as a result of this effort is a simple
spreadsheet. This spreadsheet combines three distinct assessment methods relevant to on-site
wastewater treatment systems in Jamaica. These methods evaluate a sanitation project�’s
suitability according to factors used today in the on-site certification process, the vulnerability of
groundwater under the proposed site, and its sustainability. The column headings and
descriptions of their contents follow in Table 8.
Table 8: Description of Sanitation Implementation Assessment Tool Fields
Column Heading Description A Parameter A listing of the factors to be assessed in each methods B Input Values Assessed values for each parameter, entered by user C-E Unweighted
Rating The rating or score for the entered input values. For local feature parameters, this value corresponds to the unweighted score for each of the three sanitation level alternatives. In DRASTIC, this value is the unweighted rating. In the sustainability assessment this value represents the composite score for each sustainability factor.
F Weight The weight to be applied to each parameter�’s rating, used to indicate parameter importance and for normalization purposes.
G-I Weighted Rating
The product of the Unweighted Rating and Weight, which shows each parameter�’s relative contribution to the assessed risk of the proposed system.
Parameters given in column A are grouped according to the method that employs them. Figure 3
shows the process flow for calculations. As a user enters input values, the spreadsheet
continuously assigns ratings based on the ranges in which those values fall. Indices for each of
the three methods are built as values are entered. Once the input values have been entered, the
spreadsheet will display a final Project Appropriateness Index as an output.

Figure 3: Process Flow Diagram for Sanitation Implementation Assessment Tool
23

3.2.1. Groundwater Pollution Potential (DRASTIC) Parameters
In the assessment of groundwater pollution risk, the possibility of regional, aquifer-wide
contamination due to poor sanitation must be considered. The pollution potential index of the
DRASTIC method serves this purpose. Because DRASTIC is used to determine intrinsic
groundwater vulnerability as a function of hydrogeological factors, it differs from the preceding
section in that it is not dependent on the proposed treatment quality level. Hence it produces one
risk assessment value, the DRASTIC pollution potential index, rather than a relative risk across
multiple decision alternatives. For purposes of this assessment, the DRASTIC index is
calculated on the same spreadsheet using the prescribed ranges, ratings and weights, as is done
for the local feature parameters.
As previously discussed, the hydrostratigraphic units are groups of rocks that exhibit similar
hydrologic properties and are of similar geological period. Thus they give key information about
hydrogeologic setting in the Jamaican context. These hydrostratigraphic units were described
and mapped by Smikle (2000). Figure 2 shows an example of the maps provided. The
hydrogeologic settings along with key descriptors as summarized from Smikle (2000) are shown
in Table 9.
24

Table 9: Jamaican Hydrogeologic Settings and Key Descriptors (summarized from Smikle, 2000)
Hydrogeologic Setting
Geology Water Resources Waste Disposal Drainage Characteristics
Basement Aquiclude volcanics and volcani-clastics, including the Yellow Limestone Group
very low permeability (ability of rock to transport water), no wells tap this unit.
little to no groundwater under threat from pollution
surface drainage and rivers prone to riverine flooding
Limestone Aquifer all members of the White Limestone Group (except the Montpelier Formation); the major aquifer across the island
high degree of secondary permeability often associated with karstification and/or faulting
not suited for the development of pit latrines or absorption pits
channels supported by groundwater flow with frequent sinks and rises, where flooding is common
Limestone Aquiclude
the Montpelier Formation, a member of the White Limestone group but karstification has not been significant
very low primary permeability, but faulting has generated zones of increased permeability
absorption pits may be appropriate in sections that are sufficiently distanced from water sources, but faulted areas are particularly prone to pollution
surface runoff generally characteristic, but flooding not very common as the channels tend to be steep-sided
Coastal Aquiclude the Coastal Group of limestones
permeability very low and does not support the development of springs and wells
generally suitable for the establishment of absorption pits
drainage channels may be associated with discharge from nearby aquifers, and ponding in many areas may lead to flooding
Coastal Aquiclude. Falmouth Formation
the Coastal Group of limestones
significant permeability and the presence of groundwater
pits and other unlined systems are unsuitable means of waste disposal
very little surface water development
Alluvium Aquifer Sediments derived mainly from rocks of the basement complex and deposited by the major rivers over time
sediments are non-homogenous creating a system where the highest permeabilities are found in areas with coarse sand and gravel; clay rich areas act more as aquicludes
sewage disposal by absorption pits has contaminated a large part of the Kingston basin; heterogeneity of sediments determines disposal system suitability
drainage reflective of the lithology, in sandy areas a sparse drainage network, in clay areas increased drainage density; flooding common in both, where rainfall events produce flows that overtop channels
Alluvium Aquiclude Sediments derived from the breakdown of limestones
sediments formed are clay sized and hence of very low permeability
low permeability of the sediments allows for the establishment of pits; in wetland areas, the water logged nature of the soils render such systems ineffective
drainage not well developed on these sediments; flooding mostly associated with the expansion of wetland areas in response to rainfall
25

The user needs to input the DRASTIC parameters with appropriate site values. Once the values
are entered, the spreadsheet sums the weighted ratings and calculates the DRASTIC index (DI).
To be able to compare the DI with indices from the other incorporated methods, the DI is
normalized according to the formula:
min
max
(DI DINDIDI
) Equation 3-1
where NDI = normalized DRASTIC index
DImin = minimum DRASTIC index
DImax = maximum DRASTIC index
Since maximum and minimum values of the DRASTIC index are 23 and 203, respectively, the
normalized DRASTIC index is computed according to the equation (Afshar et al, 2007):
( 2203
DINDI 3) Equation 3-2
The computed normalized DRASTIC index is displayed at the bottom of the spreadsheet.
3.2.2. Local Feature Parameters
Local feature parameters are those parameters used today in the assessment of proposed on-site
systems. The following nine parameters are employed:
Distance to nearest well or potential well (m)
Is site upgradient of wells or potential wells nearby (within 2 km)?
Distance to nearest well or potential well along groundwater flow direction (m)
Distance to nearest spring (m)
Distance to nearest fault line (m)
Distance to surface water (m)
Population density (persons/acre)
Aquifer utilization (GPD)
Distance to nearest landmark(s) of importance (tourist attractions, fish hatcheries, etc)(m)
26

The contamination risk posed by the local feature parameters is dependent on the treatment level
proposed. For instance, latrines and absorption pits should be sited at least two kilometers from
a well or potential well site (WRA Guidelines, 1999). Hence the risk of siting a primary
treatment system within two kilometers of a well is relatively higher than siting a secondary or
tertiary system in this area. For this reason a decision matrix is employed with decision
alternatives on one axis (primary, secondary, and tertiary treatment) and evaluation criteria (the
parameters) on the other.
Values used in the tool are frequently based on �‘high�’ and �‘low�’ risk levels described in the
literature. Table 10 presents ratings values and their corresponding descriptions as applied in
this study.
Table 10: Ratings and descriptions used in sanitation implementation assessment tool (adapted from Afshar et al., 2007)
Rating Value Description
1 Very, very low / Negligible
2 Very low
3 Low
4 Somewhat low
5 Low to medium
6 Medium to high
7 Somewhat high
8 High
9 Very high
10 Very, very high / Critical
The user needs to input the local feature parameter values with the appropriate local values.
Once the values are all entered, the tool sums the weighted ratings and calculates the local
vulnerability index (LVI). To be able to compare the LVI with indices from the other
incorporated methods, the LVI is normalized according to the equation:
27
min
max
(LVI LVINLVILVI
) Equation 3-3
where NLVI = normalized local vulnerability index
LVImin = minimum local vulnerability index
LVImax = maximum local vulnerability index
The nine local feature parameters have minimum and maximum ratings of 1 and 10, respectively.
Hence the minimum and maximum values of the local vulnerability index are 9 and 90,
respectively, and the normalized local vulnerability index is computed according to the equation:
(90
LVINLVI 9) Equation 3-4
The computed normalized local vulnerability index is displayed at the bottom of the section in
the spreadsheet.
3.2.3. Sustainability Index
Having evaluated the technical environmental aspects of a proposed project, the user must now
estimate its sustainability by gauging relevant socioeconomic parameters. The method for
conducting this assessment is adapted from McConville (2006). Using the concepts of
sustainability and life cycle analysis, an inclusive framework was created to assess the
effectiveness and viability of international water and sanitation projects. This framework was
presented as the Sustainability Assessment Matrix. Included in this matrix are the following four
sustainability factors:
Socio-cultural Respect
Community Participation
Political Cohesion
Economic Sustainability
A fifth sustainability factor, environmental sustainability, is not included in this assessment since
an environmental evaluation has already been conducted. These factors are evaluated over the
following three life cycle stages:
28
Needs Assessment
Conceptual Designs / Feasibility
Design / Action Planning
The implementation and operations / maintenance life cycle stages are not included because this
assessment is carried out prior to the beginning of construction of the proposed system. See
Appendix E for further explanation of these adaptations.
A value is determined for each of the sustainability factors via a checklist of rhetorical questions
and explanatory statements. To determine the score, a user completes a checklist of
sustainability recommendations for each matrix element and level of treatment. Matrix elements
are then summed for each sustainability factor and level of treatment. If none of the
recommendations are met, the matrix element is 0 (poor evaluation). If all of the
recommendations are met, the matrix element is 4 (excellent evaluation). Weights are used to
normalize the scores. Since the maximum score for the adapted sustainability assessment matrix
is 48, the weight used for normalization is 1/48 = 0.0208. The normalized sustainability index
(NSI) is generated at the bottom of the section.
Once all sections of the spreadsheet are complete, three weighted project appropriateness indices
are generated for primary, secondary, and tertiary systems, respectively. Higher normalized
local vulnerability and DRASTIC indices signify higher risks associated with the proposed
project and therefore a lower degree of project appropriateness. However, a higher normalized
sustainability index points to a higher degree of project appropriateness. Hence, the normalized
local vulnerability and DRASTIC indices are subtracted from the normalized sustainability
index. Since each index can have values from 0 to 1, the range of values of this function is -2 to
1. This function can be used to determine a project appropriateness index with values ranging
from 0 to 1 as presented in Equation 3-5.
PAI = (NSI - NLVI - NDI + 2) 3 Equation 3-5
where PAI = project appropriateness index
29

These indices show the relative risk of systems of the various treatment quality levels (primary,
secondary, tertiary), as well as an overall assessment of the appropriateness of the proposed
project. Based on these numbers, a user may approve the project or request changes (in
sanitation technology, siting, etc.).
30
Chapter 4 Results and Discussion
Due to the conclusion of the author�’s Peace Corps service, case studies with the sanitation
implementation assessment tool were not completed in Jamaican communities. For the purposes
of this report, a hypothetical case study will illustrate the use of the tool and serve as a basis for
discussion.
4.1. Hypothetical Case Study - Spot Valley Estate
On December 21, 2004, a contract between the Minister of Water and Housing and the West
Indies Home Contractors Limited was signed for the construction of a new development in
eastern St. James. 493 housing units were to be built in the community of Spot Valley, St James
and marketed to employees in the tourism sector. Water will be sourced from the existing
Martha Brae water supply system, and an on-site treatment system will need to be built
(Jamaican Observer, 2004). The developer proposes an oxidation ditch design to treat the
wastewater to a tertiary level.
Spot Valley is south of Barrett Town about 1.5 miles from Rose Hall and 12 miles from Montego
Bay. The town is located at latitude 18.5 degrees north, longitude 77.8 degrees west, and at an
elevation of 241 meters (Falling Rain Genomics, 2007). The proposed site of the treatment
facility is adjacent to and slightly upgrade of a small stream, into which the effluent will be
discharged. This stream passes through a series of small wetlands before cascading over a falls
about 30 meters from the proposed site. This falls is a scenic attraction, and the pool that collects
below it is a swimming hole for local children. From the hydrostratigraphic maps of Jamaica,
this location overlies the limestone aquiclude hydrostratigraphic unit. This unit is primarily
composed of white limestone but karstification, or dissolution of the limestone bedrock, has not
been significant. The rock therefore has a low primary permeability, but faults in the unit have
created areas of increased permeability. These faulted areas are especially susceptible to
groundwater pollution, and therefore the use of pits or unlined systems is not recommended.
Surface runoff is typical in aquicludes, but variability in the formation distribution on the north
coast limits the size of the drainage areas and networks. Instead drainage develops as smaller
31

channels and streams that flow towards the coast. The stream flowing through the proposed site
is of this type. Flooding is generally not a problem except along populated gully courses.
The evaluation using the sanitation implementation assessment tool is conducted as follows. A
user researches and establishes DRASTIC and local vulnerability parameters for this site. He or
she conducts the sustainability assessment and enters all data into the tool. Interpretations of the
results of this study are then presented.
DRASTIC index is determined by selection of the correct range for each parameter. Depth to
groundwater is readily determined by well logs or hydrogeologic reports. Since the site is
adjacent to a small stream and wetland on a very slight slope ground, the depth to groundwater
will be less than 5 feet. The 30 year mean rainfall for St. James is 1791mm per year
(Metrological Service of Jamaica, 2002), so the net recharge due to rainfall at the site is
approximately 7 to 10 inches. The Montpelier Formation is mostly comprised of white
limestone about 1000 meters thick, indicating the aquifer media and vadose zone are massive
limestone and limestone respectively. Soils are thin or absent. The site is on a very gentle hill
with a topography value of 2% to 6%. Transmissivity values for this unit are given as 8 to
11,181 m2/day. Hydraulic conductivity can be determined by the relation:
T = K × b Equation 4-1
where T = transmissivity of the aquifer
K = hydraulic conductivity
b = aquifer thickness
Using this relation, it is found that hydraulic conductivity varies from 0.19 to 268 gallons per
day-ft2. As the higher values occur mainly along fault zones of increased permeability, the range
of 1-100 gallons per day-ft2 is used. Selecting these values in the sanitation implementation
assessment tool produces a normalized DRASTIC index of 0.68.
In the order to complete the local feature evaluation, the user must enter actual values for the
parameters listed. Wells, springs, faults, and surface water bodies are tracked and mapped for all
32

of Jamaica by the Water Resources Authority. Wells, springs, and faults are visible on the
WRA�’s groundwater maps produced for each parish, and rivers and lakes are available via GIS
maplayers. Local knowledge can also be used to identify smaller features that might not be
visible on large-scale media. The nearest well is next to the small tributary 500 meters upstream
from the site. There are no wells downgradient of the site all the way to the ocean, so the nearest
well along the groundwater flow direction can be entered as any very large number (10,000
meters is adequate). The nearest spring is five kilometers upgradient of the site, and the nearest
fault line is situated at the site of the falls 30 meters downstream. The nearest surface water
body is the adjacent stream into which the effluent will run, hence zero meters away. There are
approximately 25,200 people within a seven kilometer radius (Falling Rain Genomics, 2007), so
the population density is:
25,200 persons (7 km)2 × 0.00405 km2
acre = 0.66 persons acre
The aquiclude presents few opportunities for groundwater development, so the aquifer utilization
is expected to be less than 500 gallons per day. The nearest landmark of importance is the falls,
which attracts locals and tourists alike, 30 meters downstream. Entering these values in the
sanitation implementation assessment tool yields normalized local vulnerability indices of 0.41,
0.22, and 0.03 for primary, secondary, and tertiary systems.
The sustainability evaluation looks at the proposed project appropriateness in terms of socio-
cultural respect, community participation, political cohesion, and economic sustainability. It
requires the user to visit the proposed site and get to know the community and its members. In
the course of this evaluation, the user will not only complete the sustainability factor checklists,
he or she will begin to understand the community�’s values and beliefs, ways of working and
interacting, and socioeconomic situation. A completed sustainability checklist for Spot Valley
Estate is presented in Figure 5. Based on this checklist, the sanitation implementation
assessment tool scores the four sustainability factors for primary, secondary, and tertiary
systems. Some of the matrix element sustainability recommendations score the same for all
systems. Differences do occur however. For instance, the willingness and capacity of the
community to perform operation, maintenance, and disposal requirements can be assessed for
primary and secondary systems, but the community lacks the knowledge and skill to deal with
this type of tertiary system. Also, the community is currently bearing the cost for their existing
33

34
primary systems, but whether they will be willing to pay to tie into this tertiary system is
unknown as no surveys were conducted by the developer. Completing the sustainability
evaluation yields normalized sustainability indices of 0.35, 0.35, and 0.31 for primary,
secondary, and tertiary systems.
The completed sanitation implementation assessment tool worksheets are presented in Figures 4
and 5. Based on the data entered, the tool finds project appropriateness indices of 0.42, 0.71, and
0.76 for primary, secondary, and tertiary systems. This result indicates that a tertiary system is
the most appropriate choice for the proposed project. As this level of treatment is proposed in
the submitted design, the user can approve the project.
Several notes can be made on these results. Generally speaking, tertiary treatment is favored
because it presents the lowest risk to groundwater on a local and regional basis, particularly for
large developments such as Spot Valley Estate. For smaller community-run systems in areas of
low groundwater vulnerability, primary or secondary treatment may be found to be most
appropriate. In such cases, normalized local vulnerability indices will be closer in value, while
socioeconomic factors such as construction costs and maintenance requirements will raise the
normalized sustainability indices for primary and secondary systems. Additionally, the
importance of nearby landmarks is specifically highlighted in this case study. The design called
for discharging system effluent directly into a small stream that feeds the nearby waterfall and
swimming hole. Since these features are used for recreational purposes by locals and tourists, it
is essential to consider them in the evaluation of project appropriateness. In fact the developer�’s
exclusion of these features in design considerations and the lack of communication with local
community members prompted a review by the Water Resources Authority, Ministry of Health,
Western Regional Health Authority, and St. James Health Department. Despite meeting water
treatment requirements with a state-of-the-art tertiary treatment system, this review resulted in an
eleventh hour design change at the developer�’s cost. This measure was undertaken in order to
allay community members�’ concerns about potential damage to what they regard as a significant
community environmental and cultural asset.

Figure 4: Completed Sanitation Implementation Assessment Tool Worksheet for Spot Valley Estate
24

Figure 5: Completed Sustainability Assessment Worksheet for Spot Valley Estate
25

4.2. Discussion of Uncertainties
In spite of the intended benefits, the design of the sanitation implementation assessment tool
involves a level of uncertainty. The tool should be used only after an understanding of these
uncertainties has been gained. The tool has been constructed following extensive research into
appropriate sanitation project siting and technology. Standardized groundwater vulnerability
evaluation and sustainability assessment methods have been reviewed. Jamaica�’s procedures for
on-site sanitation system certification have been documented through interviews and literature
reviews. Where possible, constants for local feature parameters are based on literature values.
Where values are not given, they are inferred from statements in the literature and personal
references. See Table 10 for the ratings and description scheme used in this study. For a
description of a process to further calibrate spreadsheet constants, see Section 5.3
Recommendations for Future Work.
The mechanics of the spreadsheet operate similarly to those of DRASTIC. The tool is based on a
numerical ranking system containing three components, namely weights, ranges, and ratings.
Consideration of the uncertainties in each of these components will lead to a better understanding
of the uncertainty in the results.
4.2.1. Weights
Weights determine the relative importance of each parameter in the tool. The weights in the
DRASTIC method vary from 1 for a least important factor to 5 for a most important factor. To
develop these values, a technical advisory committee used a Delphi (consensus) approach.
According to this system, these weights are constant and may not be changed. Local feature
parameter weights are set based on the immediacy of their threat and on discussions and
guidance from Jamaican health professionals and U.S. university professors. The Sustainability
Assessment Matrix method is designed to award a sustainability score out of 100 possible points.
Since the method is adapted (notably stripped of the environmental sustainability metrics to
avoid double counting environmental risks), the weights are used to scale the point totals.
While the weights for the DRASTIC and Sustainability Assessment Matrix methods are set by
the rule system and adaptation process, respectively, considerable uncertainty is involved in the
24

setting of the local feature parameter weights. Being sited close to an operational well carries a
greater risk than being sited in an area with a population density slightly higher than 35 people /
acre, but the magnitudes of those risks relative to one another is as yet unknown. Initial values
have been set according to the literature references and reasoning in Appendix B. These weights
are expected to be fine tuned as more case studies are conducted, but there will always be some
level of uncertainty in these values. The relative importance of each of the methods with respect
to the others is also uncertain. Using a subjective 100 point scoring system, the Sustainability
Assessment Matrix method, alongside technically evaluated data and indices, is especially
problematic. While it is clear that socioeconomic factors are relevant in consideration of
proposed on-site wastewater systems, the numerical system for rating their importance relative to
the technical metrics of DRASTIC and the local features warrants further consideration. The
weights can be used to prioritize the systems with respect to one another, but case study data is
needed to calibrate this weighting.
4.2.2. Ranges
Ranges set the conditions by which parameters are evaluated. Ranges or significant media types
are presented for each DRASTIC factor. A value entered for a factor will be matched up to its
corresponding range within the factor and scored accordingly. Where possible, the ranges given
for local feature parameters are based on literature values. For example, WRA Guidelines for
Assessing the Vulnerability of Groundwater (1999) state that �“in areas where the use of latrines
or absorption pits cannot be avoided, measures should be taken to ensure that the facility be
sited:
at least 2 km from a well or potential well site
in areas down gradient of a well or potential well site
in an aquiclude�”
This guideline sets the minimum safe well proximity for primary treatment at 2 kilometers in the
Jamaican context. The Sustainability Assessment Matrix method carries sustainability
recommendations, but it does not determine evaluation metrics, and ranges are not specified.
Some uncertainty in the DRASTIC method is present due to the coarseness of the ranges set. For
instance, a system located on a 6.1% grade receives a rating of 5 for topography, but being
25

located on a 5.9% grade earns such a system a rating of 9. This limitation holds true for the local
feature parameters, many of which are set based on step functions even coarser than those of
DRASTIC.
4.2.3. Ratings
Ratings determine the relative contribution of each range to project appropriateness. The ratings
in the DRASTIC method vary from 1 for a range of lowest pollution potential to 10 for a range
of highest pollution potential. Factors D, R, S, T, and C have one rating per range. Factors A
and I have a �“typical�” rating and a variable rating, allowing the user to adjust the rating if more
specific information on the factor is available. For purposes of this study, the typical ratings are
used where given. Like weights and ranges, DRASTIC ratings should not be modified. The
ratings given for local feature parameters are based on the literature, though most of these do not
give a rating value. Values are assigned according to ratings and descriptions given in Table 10.
For example, secondary treatment should be used where the population density is more than 35
persons / acre (WRA Guidelines, 1999), suggesting a �‘high�’ risk (8) of using a primary treatment
system and a �‘low�’ (3) to �‘very low�’ (2) risk for secondary and tertiary. In the Sustainability
Assessment Matrix method ratings are basically the sums of the number of sustainability
recommendations (check boxes) that are completed for each factor. However, the examples and
questions given are neither comprehensive nor entirely appropriate in for every project. Hence
these ratings are adjustable if the user determines that other conditions indicate that the general
essence of the guideline has been met.
From a numerical standpoint, ratings for most DRASTIC factors are set by the method. Ratings
for factors A (Aquifer media) and I (Impact of vadose zone) are specified as �“variable.�”
Variable ratings mean that the user can select a typical value or adjust it based on knowledge of
specific conditions. The ratings can vary by between 1 rating point (10% on a 10 point scale)
and 8 rating points (80%). For instance, basalt aquifer and vadose zone media have typical
ratings of 9 but can be set anywhere in the range of 2 to 10 given data on the number of
interconnected openings in the lava flow materials. Beyond the numerical uncertainties, much of
the hydrogeological data available in the developed world are still in short supply in Jamaica,
resulting in uncertainties in many of the DRASTIC parameters. Uncertainties in ratings in the
26

other methods used are less easy to quantify. Local feature parameters carry considerable
uncertainties. Values are based on references to �‘high�’ and �‘low�’ risk reported in the literature
rather than quantifiable resources. See Table 10 for ratings values and descriptions as applied in
the tool. Ratings in the Sustainability Assessment Matrix method are based on the number of
sustainability recommendations met. However, this is ultimately a subjective evaluation. Not
only might two users have different opinions as to weather a recommendation is met, but the
method also permits users to consider other conditions that show that a guideline has been met.
In the end the user sets the rating.
4.3. Discussion of Subjectiveness
In addition to uncertainties, judgments of appropriate treatment levels and technologies have an
inherent level of subjectiveness. The sources of subjectiveness include differences in user
experience, backgrounds, values, and identification with the local community and culture. These
subjective elements will find their ways into decision support tools and ultimately the final
judgments themselves.
Subjectiveness in the sanitation implementation assessment tool therefore must be considered
and evaluated. Unlike uncertainties, subjectiveness is limited by the fact that most inputs are
tangible numbers. All DRASTIC and local feature parameters require inputs of specific values
or value ranges. Some subjectiveness exists in the evaluation of sustainability. However, it is
unlikely that two separate users will have vastly different results from the same site evaluation.
Many questions in the assessment are of a binary (yes/no) nature. For instance, in the socio-
cultural respect needs assessment, the determination of health education level calls for users to
find out if community members connect water and sanitation issues with disease and wash their
hands with soap. Other sections of the sustainability assessment require completion of certain
activities. For instance, community members / stakeholders must review an itemized budget in
order to verify the costs and availability of resources during economic sustainability design and
action planning. The checklists for these and other questions and activities should not have
different results if a thorough assessment is carried out. Hence the tool, though carrying a level
of uncertainty, requires users to enter definitive inputs and is not bound by a large degree of
subjectiveness.
27
Chapter 5 Conclusions and Recommendations for Future Work
5.1. Conclusions
Preservation of clean and safe drinking water supplies is of paramount importance. This is
especially true in the developing world, where unsafe water, sanitation, and hygiene account for
almost half of the disease burden attributable to environmental risks. Informed decision-making
on the siting and employed technology of on-site wastewater treatment systems is critical to the
preservation of groundwater purity. It is vital that decision makers have access to all relevant
information to ensure the best possible decision-making.
Decision support techniques can improve the speed, accuracy, and consistency of the decision-
making process. In Jamaica treatment systems are categorized into three treatment quality
levels: primary (physical treatment, e.g. septic tank + absorption pit), secondary (physical and
biological treatment, e.g. septic tank + tile field or intermittent sand filter), and tertiary (physical
and advanced biological or chemical treatment, e.g. biodigester + reed bed or septic tank +
evapotranspiration bed). In order to evaluate the relative risk of choosing a particular
technology, a decision matrix has been developed. This tool allows a user to evaluate each
treatment level against the key criteria by creating a composite score. This score represents the
relative risk of choosing a treatment technology of a given quality level.
This study has reviewed three methods for evaluating the appropriateness of proposed on-site
wastewater treatment systems in Jamaican communities. The first of these methods considers
the local feature parameters reviewed by professionals in Jamaica�’s Water Resources Authority
and in regional and parish health departments. The second method of evaluation uses
DRASTIC, a standardized system for evaluating groundwater pollution potential using
hydrogeologic settings. Finally, a method employing a sustainability assessment matrix was
analyzed and adapted for determining the expected sustainability of a sanitation project using
socioeconomic factors. Use of this method in particular recognizes that sanitation siting and
technology selection are indeed a challenge in sustainable development, requiring a triple bottom
line approach of environmental, economic, and social analyses.
28

5.2. Broader Applicability
The sanitation implementation assessment tool was developed for use in evaluating on-site
wastewater treatment systems in Jamaican communities and for this reason is tailored
specifically to Jamaica. While much of the methodology and utility is Jamaica-specific, the tool
can be adapted for a variety of locations and contexts. Possible adaptations include redefinition
of decision alternatives, modification of evaluation criteria, and calibration of weights, ranges,
and weights.
The sanitation implementation assessment tool uses a decision matrix approach to calculate
weighted project appropriateness indices for three given treatment levels in the Jamaican context:
primary (simple physical treatment), secondary (physical and biological treatment), and tertiary
(physical and advanced biological or chemical treatment). These levels may not be appropriate
in all settings, but they can be redefined or broken out as is instructive. The decision alternatives
could be further decomposed into technology groups or even specific technology options. For
instance, a modified sanitation implementation assessment tool might have decision alternatives
such as tile field, biodigester, subsurface wetland, and evapotranspiration bed shown in the
evaluation matrix. Furthermore, the assigned ratings, weights, and ranges may vary in different
situations. These values may need to be adjusted depending on technology limitations, water
quality standards, or other considerations. For instance, if biodigesters are known to be less
efficient at pathogen removal because of chronic installation issues, the required minimum
distance to nearest the well may need to be increased.
The evaluation criteria may also be modified as appropriate to the circumstances in which they
are employed. In the sanitation implementation assessment tool the evaluation criteria are the
DRASTIC and local feature parameters and the sustainability factors. As the DRASTIC method
is a standardized system, these parameters and their weights, ranges, and ratings should not be
changed. However, the local feature parameters and sustainability factors have been developed
and adapted for use in Jamaica. Hence these lists may need to be trimmed, expanded or
enhanced. Factors affecting evaluation criteria might include lack of faulting, very low
population density, and susceptibility to climate change impacts.
29

If modifications are made to the sanitation implementation assessment tool, the tool should be
recalibrated for those changes. These calibrations can take the form of case studies, expert
consultations, or simple reconfirmations of existing weights, ratings, and ranges. Tool
calibration is discussed further in the final section.
5.3. Recommendations for Future Work
Due to the conclusion of the author�’s Peace Corps service, case studies with the sanitation
implementation assessment tool were not completed in Jamaican communities. Case studies are
needed to calibrate the sanitation implementation assessment tool to become a useful tool for
health professionals. The initial round of case studies should be conducted on existing on-site
primary, secondary, and tertiary wastewater treatment systems. An independent means of
evaluating actual system appropriateness should be developed. The means of evaluation should
be results-based and at a minimum include effluent quality, local groundwater sampling, and a
survey of attitudes within the local community. The case studies should be scored using the
sanitation implementation assessment tool without prior knowledge of the system
appropriateness or performance. The scores of the case studies should then be compared to
actual system appropriateness as gauged by independent evaluation (using effluent quality, local
groundwater sampling, community survey, etc.). The case study scores and actual
appropriateness evaluations should at least rank the systems in a similar order, and they should
fall into the same relative ranges (very good, very bad, etc.). Discrepancies in ranking order
should be analyzed to identify the underlying reasons. As discrepancies are identified, the
responsible spreadsheet constants (weights, ratings, and ranges) should be calibrated to bring the
case study scores in alignment with actual system appropriateness.
Alternate scoring schemes should also be investigated and if warranted developed. The
sanitation implementation assessment tool assumes an additive and equal relationship between
the three incorporated methodologies to generate a project appropriateness index. An alternate
weighting scheme could be employed to give greater importance to one or two of these
methodologies. This weighting could be user-driven or responsive to extremely high or low
values. For instance, a high local vulnerability index driven by very close proximity to wells or
other features could trigger an increase in its own weighting. The result would be a lower
30

appropriateness index even if DRASTIC and sustainability indices suggested the proposed
project was appropriate. Another alternate scoring scheme might be suggested by a definition
utilized by the UN (2006):
Hazard = Risk ×Vulnerability Equation 5-1
Following this definition, an alternate way to express the hazard posed by a given treatment
system is to multiply the risk posed by local features such as adjacent wells by the DRASTIC
groundwater vulnerability index. Alternate scoring methods such as these may yield better
adherence to actual system appropriateness as indicated by case studies.
Once spreadsheet constants have been calibrated using actual project data, the sanitation
implementation assessment tool should be distributed within Jamaica�’s Water Resources
Authority and Ministry of Health. Additional comments and inputs should be requested and
used to make necessary refinements. Finally the tool should be delivered to health authorities
and departments, beginning with the Western Regional Health Authority and health departments
in St. James, Trelawny, Hanover, and Westmoreland. These organizations have participated in
much of the information gathering that took place for this study, so they are likely to benefit the
most from the initial delivery. A training course should be developed for completing on-site
wastewater system certifications. This training should include process and legal education,
presentation of available resources such as groundwater maps and this tool, and opportunities for
discussion and feedback. Once these tools are in use, metrics on availability of information,
completion times, and comparisons with actual plant performances should be kept. Follow-up
training sessions should address additional tool parameter tuning and needs where necessary.
Today�’s demanding professions require skilled workers who receive regular training to stay
abreast of the latest developments. Jamaica�’s health professionals are in urgent need of training
and resources with which to perform their jobs. Only by cooperation among the various
responsible agencies will this need be met. It is hoped that the further refining and
implementation of the sanitation implementation assessment tool and other relevant tools will
help improve sanitation and safeguard groundwater quality for future generations.
31

References Afshar, A., M. A. Mariño, M. Ebtehaj, and J. Moosavi, �“Rule-Based Fuzzy System for Assessing
Groundwater Vulnerability�”, Journal of Environmental Engineering, 133:5(532), May 2007.
Ezzati, M., A. Rodgers, A.D. Lopez et al. �“Mortality and Burden of Disease Attributable to
Individual Risk Factors,�” In Ezzati, M., A.D. Lopez et al. (Eds). Comparative Quantification of Health Risks: Global and Regional Burden of Disease Attributable to Selected Major Risk Factors, Volume 2. Geneva, World Health Organization, 2004, last accessed from http://www.who.int/publications/cra/en/, October 26, 2007.
Falling Rain Genomics, Inc., Maps, Weather, and Airports for Spot Valley, Jamaica, last
accessed from http://www.fallingrain.com/world/JM/12/Spot_Valley.html on December 6, 2007.
Fry, L.M. �“Chapter 2 Project Motivation: Public health and the role of environmental engineers�”
In Water Supply, Sanitation Systems, and Indoor Air Quality: Field Guide in Engineering for Development Workers (Eds: Mihelcic, J.R., E.A. Myre, L.M. Fry, B.D. Barkdoll), ASCE Press, Reston, VA, to be published 2008.
Jamaica Observer, �“493 houses for Spot Valley�”, published December 23, 2004, last accessed
from http://www.jamaicaobserver.com/news/html/20041222T220000-0500_71936_OBS_____HOUSES_FOR_SPOT_VALLEY.asp on December 6, 2007.
Khalil, W., A. Goonetilleke, S. Carroll, and L. Dawes, �“Logan City Council Land Capability
Assessment for On-site Sewage Treatment Systems�”, Centre for Built Environment and Engineering Research, Faculty of Built Environment and Engineering, Queensland University of Technology, October 2005.
Khalil, W., A. Goonetilleke, S. Kokot, and S. Carroll, �“Use of chemometrics methods and
multicriteria decision-making for site selection for sustainable on-site sewage effluent disposal�”, Analytica Chimica Acta 506 (1): pp. 41�–56, 2004.
Kim, Youn Jong, and Se-Yeong Hamm, �“Assessment of the potential for groundwater
contamination using the DRASTIC/EGIS technique, Cheongju area, South Korea�”, Hydrogeology Journal (1999) 7:227�–235.
Kirby, M.R., and D.N. Mavris, �“Forecasting Technology Uncertainty in Preliminary Aircraft
Design�”, AIAA 99-5631, for presentation at the World Aviation Conference, San Francisco, CA, October 19-21, 1999.
Mavris, D.N., and M.R. Kirby, �“Technology Identification, Evaluation, and Selection for
Commercial Transport Aircraft�”, SAWE Paper No. 2456, for presentation at the 58th Annual Conference Of Society of Allied Weight Engineers, Inc., San Jose, CA, May 24-26, 1999.
32

Meteorological Service of Jamaica, �“30 Year Mean Rainfall,�” 2002, last accessed from
http://www.metservice.gov.jm/documents/30%20yr%20Mean%20Rainfall.htm on December 7, 2007.
McConville, J.R., �“Applying Life Cycle Thinking to International Water and Sanitation
Development Projects: An assessment tool for project managers in sustainable development work,�” MS Environmental Engineering Report, Michigan Technological University, 2006, last accessed from http://www.cee.mtu.edu/sustainable_engineering/resources/reports/McConville_Final_Report.pdf on October 26, 2007.
McConville, J.R., and J.R. Mihelcic, �“Adapting Life Cycle Thinking Tools to Evaluate Project
Sustainability in International Water and Sanitation Development Work,�” Environmental Engineering Science, 24(7): 937-948, 2007.
Ministry of Health / Environmental Health Unit (MOH/EHU) of Jamaica, Developer’s Manual -
On-site Wastewater Treatment and Excreta Disposal Management, May 2004. Ministry of Water, Jamaica Water Sector Policy Paper, 28 January 1999, last accessed from the
Water Resources Authority website http://www.wra.gov.jm/dynaweb.dti?dynasection=history&dynapage=water_policy on October 26, 2006.
Murray CJL, Lopez AD, eds. (1996) �“The global burden of disease: a comprehensive assessment
of mortality and disability from diseases, injuries and risk factors in 1990 and projected to 2020.�” Global Burden of Disease and Injury, Vol 1. Harvard School of Public Health on behalf of WHO, Cambridge, MA.
National Environment and Planning Agency, Frequently Asked Questions (FAQ�’s), last accessed
from http://www.nepa.gov.jm/faq/faq.asp on February 14, 2007. National Research Council (NRC). (1993). Groundwater assessment; contamination potential
under conditions of uncertainty, National Research Council, National Academy Press, Washington, D.C.
Neap, Halil Shevket, and Tahir Celik, �“Value of a Product: A Definition,�” International Journal
of Value-Based Management, vol 12: 181-191, 1999. Paredes, Ricardo D., �“Privatization and Regulation Challenges in Jamaica�”, Inter-American
Development Bank, Ref # RE3-03-004, July 2003. Prüss-Üstün, A. and C. Corvalán. 2006. Preventing Disease Through Healthy Environments:
Towards an estimate of the environmental burden of disease. Geneva: WHO Press. Annex 1. Last accessed from
33

http://www.who.int/quantifying_ehimpacts/publications/preventingdisease.pdf on October 26, 2007.
risk. Dictionary.com. The American Heritage® Dictionary of the English Language, Fourth
Edition. Houghton Mifflin Company, 2004. Last accessed from http://dictionary.reference.com/browse/risk on October 17, 2007.
Smikle, Dwight, Hydrostratigraphic Map of Jamaica, Annex 1, Explanatory Notes, Water
Resources Authority, May 2000. Sotornikova, R., and Vrba, J. �“Some remarks on the concept of vulnerability maps, in
vulnerability of soil and ground water to pollution.�” Proc., Int. Conf. on the Vulnerability of Soil and Groundwater to Pollutants, The Hague, The Netherlands, 471�–476.
United Nations. �“Report of the World Commission on Environment and Development.�” General
Assembly Resolution 42/187, 11 December 1987. Last accessed from http://www.un.org/documents/ga/res/42/ares42-187.htm on October 26, 2007.
United Nations. The 2nd United Nations World Water Development Report: �“Water, a shared
responsibility.�” 4th World Water Forum in Mexico City, Mexico, 22 March 2006, last accessed from http://www.unesco.org/water/wwap/wwdr2/ on December 6, 2007.
United Nations Children�’s Fund (UNICEF) and United States Agency for International
Development (USAID), �“Towards Better programming: A Sanitation Handbook.�” May 1997, New York: UNICEF Programme Division Water, Environment and Sanitation, last accessed from http://www.unicef.org/wes/files/San_e.pdf on May 1, 2007.
United Nations Department of Economic and Social Affairs, Division for Sustainable
Development, Agenda 21: Chapter 21, Environmentally Sound Management of Solid Wastes and Sewage-related Issues, December 15 2004, last cited from http://www.un.org/esa/sustdev/documents/agenda21/english/agenda21toc.htm on January 23, 2007.
United Nations Environmental Programme, �“Strategic Action Plan to Address Municipal
Wastewater,�” November 2000, cited from the website http://dinrac.nowpap.org/documents/GPA_Strategic_Action_Plan_to_Address_Municipal_Wastewater.pdf on October 3, 2006.
UNEP/WHO/HABITAT/WSSCC: Guidelines on Municipal Wastewater Management.
UNEP/GPA Coordination Office, The Hague, The Netherlands, February 2004, last accessed from http://www.training.gpa.unep.org/documents/guidelines_on_municipal_wastewater_english.pdf on October 26, 2007.
34

35
Villumsen, A., Jacobsen, O. S., and Sonderskov, C. �“Mapping the vulnerability of groundwater reservoirs with regard to surface pollution.�” Yearbook 1982, Geological Survey of Denmark, Copenhagen, Denmark, 17�–38.
Water Resources Authority Guidelines for Assessing the Vulnerability of Groundwater in a
Given Area to Pollution, Ref # DR 8-26, April 15, 1999. World Health Organization. 2002. World Health Report 2002: Reducing Risks, Promoting
Healthy Life. Geneva: WHO Press. Last accessed from http://www.who.int/whr/2002/en/ on October 26, 2007.
World Health Organization, �“Intersectoral decision-making skills in support of health impact
assessment of development projects final report�”, 2000. Last accessed from http://www.who.int/water_sanitation_health/resources/hiadevprojects/en/ on October 3, 2006.
World Health Organization (WHO) and United Nations International Children�’s Emergency
Fund (UNICEF), Global Water Supply and Sanitation Assessment 2000 Report, last accessed from http://www.who.int/entity/water_sanitation_health/monitoring/jmp2000.pdf on April 30, 2007.
Yap, C.S., K.S. Raman and C.M. Leong, �“Methods for Information System Project Selection; An
Experimental Study of AHP and SMART�”, Department of Information Systems and Computer Science, National University of Singapore, 1992.

Appendix A Sanitation Implementation Assessment Tool and Sustainability Assessment Worksheet The following is the sanitation implementation assessment tool:
DRASTIC Parameters Input Values Weight
Depth to groundwater (ft) 5
Recharge, net (in) 4
Aquifer media 3
Soil media 2
Topography (% slope) 1
Impact of vadose zone media 5
Conductivity, hydraulic (GPD/ft^2) 3
Pollution Potential (DRASTIC Index) 23
Normalized DRASTIC Index
Primary Secondary Tertiary Primary Secondary Tertiary
Distance to nearest well or potential well (m) 4Is site upgradient of wells or potential wells nearby (within 2 km)? 5
Distance to nearest well or potential well along groundwater flow direction (m) 5
Distance to nearest spring (m) 4
Distance to nearest fault line (m) 4
Distance to surface water (m) 5
Population density (persons/acre) 3
Aquifer utilization (GPD) 1Distance to nearest landmark(s) of importance (tourist attractions, fish hatcheries, etc.) (m) 2
Local Vulnerability Index 0 0 0 33 0 0 0
Normalized Local Vulnerability Index input values input values input values
Primary Secondary Tertiary Primary Secondary Tertiary
Sociocultural respect 0 0 0 0.02083 0.00 0.00 0.00
Community participation 0 0 0 0.02083 0.00 0.00 0.00
Political cohesion 0 0 0 0.02083 0.00 0.00 0.00
Economic sustainability 0 0 0 0.02083 0.00 0.00 0.00Normalized Sustainability Index 0.00 0.00 0.00Project Appropriateness Index input values input values input values
Complete Sustainability Assessment
worksheet
Local Feature Parameters
Sustainability Factors Input Values
Unweighted Rating
Weighted RatingWeight
Unweighted Rating Weighted Rating
Input Values
input values
WeightWeighted Rating
0 0
Unweighted Rating
39

The following is the sustainability assessment worksheet:
Socio-cultural Respect
Prim
ary
Sec
onda
ry
Terti
ary
Community Participation
Prim
ary
Sec
onda
ry
Terti
ary
Political Cohesion
Prim
ary
Sec
onda
ry
Terti
ary
Economic Sustainability
Prim
ary
Sec
onda
ry
Terti
ary
Needs Assessment Generate a yearly calendar of work and social
life in the community. Conduct a participatory needs assessment at
the local level to determine local development priorities.
Conduct a situational analysis of regional and national issues, such as political structure and stability, government policies, and foreign aid.
Understand the local and national economic situation (poverty level, employment, cost of living, flow of resources).
Identify social preferences and traditional beliefs associated with water supply and sanitation practices.
Identify stakeholders and community leaders. Ensure that proposed project is consistent with regionally identified development priorities and plans.
Understand how the community economic situation is affected by water and sanitation issues.
Determine the level of health education in the community.
Determine the type of political organization and cohesion at the community level.
Research the history of NGO and government projects in the area.
Identify sources of monetary and non-monetary resources (materials, labor, and tools) within the community.
Recognize differences in gender roles in water and sanitation.
Reach a consensus with community members that project intervention is appropriate.
Establish communication lines with existing NGO and/or government institutions in the area.
Assess the community willingness-to-pay in both monetary and non-monetary terms for current water and sanitation services.
Conceptual Designs/Feasibility Assess how the proposed interventions will
affect daily activities and socio-cultural roles within the community.
The project goals are clearly defined and understood by the community and development workers.
Develop a working relationship with partner organization(s), including at least one that is based in the host country.
Estimate the implementation costs of each conceptual design.
Evaluate the willingness and capacity of the community to perform operation, maintenance, and disposal requirements for each design.
Identify a representative committee that can act as the community liaison throughout the project.
Consult the plans and designs of other organizations on similar projects.
Estimate operation, maintenance, and disposal costs for each conceptual design.
Design recognizes and respects traditional gender roles.
Present several technically feasible alternatives for community evaluation and feedback.
Explore options to integrate existing technologies or programs into conceptual designs.
Assess the community willingness-to-pay in both monetary and non-monetary terms for each improved system.
Recognize why biases exist towards certain technologies by donors and/or locals.
Community members formally select a design based on an understanding of the constraints involved in the selection process.
Contact potential partner institutions for project financing.
Conduct an economic feasibility assessment to evaluate long-term project viability based on cost estimates, projected operation and maintenance costs, community willingness to pay, the need for outside resources, and the availability of outside funding.
Design/Action Planning Understand the traditional structure of
community projects. Community input is solicited in refining the
selected technical design. The roles and responsibilities of partner
institutions are defined in a detailed action plan. Verify the costs and availability of resources.
Consider the seasonality of labor in setting the timeline.
Final technical design is approved through a process of community consensus.
Agree on financial commitments. Confirm the community contribution for money, materials, equipment, tools, and labor.
Explore options for increasing gender equity in project roles and capacity building.
Community members are involved in identifying and sequencing tasks that will be incorporated into an action plan.
A timeline is drafted that meets the requirements of all institutions involved.
Finalize budget based on local costs, available resources, and community contribution.
Confirm that labor and resource contributions are equitably divided.
The community members and development workers approve of the timeline and responsibilities laid out in the action plan.
Final project design and action plan are presented to partner institutions and local, regional, and/or national level authorities.
Develop an action plan for resource procurement.
Sustainability Indices 0 0 0 0 0 0 0 0 0 0 0 0
40

Appendix B Sanitation Implementation Assessment Tool Rules Table Following is the Rules Table for the sanitation implementation assessment tool:
40

41

42

43

Appendix C Hydrostratigraphic Map of Jamaica by Dwight Smikle
This appendix contains the Hydrostratigraphic Map of Jamaica by Dwight Smikle (2000), which
is not readily available through public resources.
44

HYDROSTRATIGRAPHIC MAP
OF
JAMAICA
ANNEX 1
EXPLANATORY NOTES
Prepared by
Dwight Smikle
Senior Hydrogeologist
Water Resources Authority
Hope Gardens, P.O. Box 91
Kingston 7
Jamaica
Telephone: (876) 927-0077
Fax: (876) 977-0179
E-Mail [email protected]
May 2000
45
TABLE OF CONTENTS
Page
INTRODUCTION ................................................ 45 1.0 Basement Aquiclude ................................... 46
1.1 Geology ................................................... 46 1.2 Water Resources ...................................... 46 1.3 Waste Disposal ........................................ 47 1.4 Drainage Characteristics.......................... 47
2.0 Limestone Aquifer ...................................... 48 2.1 Geology ................................................... 48 2.2 Water Resources ...................................... 48 2.3 Waste Disposal ........................................ 49 2.4 Drainage Characteristics.......................... 50
3.0 Limestone Aquiclude .................................. 51 3.1 Geology ................................................... 51 3.2 Water Resources ...................................... 51 3.3 Waste Disposal ........................................ 53 3.4 Drainage Characteristics.......................... 53
4.0 Coastal Aquiclude....................................... 54 4.1 Geology ................................................... 54 4.2 Water Resources ...................................... 54 4.3 Waste Disposal ........................................ 56 4.4 Drainage Characteristics.......................... 56
5.0 Alluvium Aquifer........................................ 57 5.1 Geology ................................................... 57 5.2 Water Resources ...................................... 57 5.3 Waste Disposal ........................................ 57 5.4 Drainage Characteristics.......................... 59
6.0 Alluvium Aquiclude.................................... 60 6.1 Geology ................................................... 60 6.2 Water Resources ...................................... 60 6.3 Waste Disposal ........................................ 60 6.4 Drainage Characteristics.......................... 60
46
INTRODUCTION
The hydrostratigraphic units have been derived based on the 1:250,000 Geological Map of
Jamaica (1977), prepared by the Mines and Geology Division. A hydrostratigraphic unit is a
group of rocks that exhibits similar hydrologic properties and are contemporaneous (of similar
geological period) within the stratigraphic sequence. The Hydrostratigraphic units represent
formations found at the surface at the mapped location. In areas where the surface geology is
expected to be superficial, the underlying geology has been mapped.
The formations (group of rocks with similar geologic properties) are mapped on the basis of their
water bearing properties, either as aquifers or aquicludes. Aquifer refers to a rock or group of
rocks, that allow for the movement and/or storage of groundwater. It is expected that these
rocks will sustain a reliable yield to a well or spring.
In the Jamaican context an aquiclude is any rock or group of rocks that does not allow for the
movement or storage of groundwater resources. Such rocks do not sustain a reliable yield to
wells and springs.
Based on these hydrologic properties, the rocks of Jamaica may be divided into the following
hydrostratigraphic units;
1. Basement Aquiclude 2. Limestone Aquifer 3. Limestone Aquiclude 4. Coastal Aquiclude 5. Alluvium Aquifer 6. Alluvium Aquiclude
This booklet sets out to define the geology that is associated with each unit. It then describes the
water resources associated with the unit as well as the drainage characteristics. The booklet also
recommends relevant disposal methods that are suited for each unit. A glossary of terms is
included to attempt to explain the uase of terms that may be unfamiliar to the non-geologist.
Any further clarifications may be sought from the Water Resources Authority.
45

1.0 Basement Aquiclude
1.1 Geology
This unit consists of the Volcanics and Volcani-clastics that comprise the basement complex, as
well as the Yellow Limestone Group. These rocks are mainly confined to the Cretaceous inliers
of the island, and cover a total of 15% of the land surface.
1.2 Water Resources
As a result of the very low permeability (ability of rock to transport water), no wells tap this unit.
Springs may occur in areas where geologic processes have created a weathered and fractured
permeable layer/zone. These springs are generally low yielding and often seasonal.
The main resource type in these areas is surface water. This surface water originates from the
generation of overland flow associated with rainfall events. The existence of springs in the
weathered/fractured sections of these rocks allow for the development of larger sustained yields
in the rivers that drain these areas.
46

Figure 1 Area of Basement Aquiclude.
1.3 Waste Disposal
The best suited sewage disposal method for these rocks is determined by the local lithology (rock
type). In general there is no groundwater under threat from pollution and all methods are
suitable. Pit latrines are suitable for these areas but the WRA recommends the establishment of
composting pits. In the areas where springs have developed, there may exist significant
permeability in the overlying sediments. These areas will be unsuited for the development of
absorption pits due to the threat to these springs.
1.4 Drainage Characteristics
The dominance of surface drainage and rivers on these rocks has an impact on the flooding
potential of these areas. They are generally more prone to riverine flooding due to the presence
of a larger number of rivers and their rapid response to rainfall events. Activities in upper
watershed areas have reduced the holding capacity and water is released much faster to the lower
reaches of the river, increasing riverine flooding.
47

2.0 Limestone Aquifer
2.1 Geology
This unit consists of all members of the White Limestone Group, with the exception of the
Montpelier Formation. This group unconformably overlies the Basement Aquiclude and is the
major aquifer across the island.
2.2 Water Resources
This unit is characterized by a high degree of secondary permeability (this is permeability
generated by geologic processes acting on the rock after it has been created). This permeability
is often associated with karstification and/or faulting and hence is highly variable. In terrains
where the limestone aquifer occurs there is a general absence of surface drainage. This is due to
the rapid rate of percolation (movement of water into the sub surface) that occurs. Significant
storage occurs where water is ponded in the aquifer by subsurface barriers. The thickness of this
unit is in excess of 1,500 metres.
Groundwater is the major resource type of this unit, as rainfall quickly percolates to the
groundwater table. The most extensive areas of the limestone aquifer occur in the Rio Cobre,
Rio Minho, Black River, Martha Brae and Dry Harbour Mountain hydrological basins. The
Cabarita River, and Great River basins have less extensive areas of the limestone aquifer. The
resources of this aquifer have been extensively exploited in the Rio Cobre, Rio Minho and Black
River basins; to a lesser extent in the Dry Harbour Mountain and Martha Brae basins and are
sparsely exploited in the Cabarita River and Great River basins. The extensive exploitation of
groundwater in Rio Cobre and Rio Minho Basins has left very little resource for additional
development within this aquifer.
For the remainder of the island significant resources still remain untapped in the Black River,
Dry Harbour Mountain and Martha Brae basins. In some areas of the island such as the
Manchester Highlands, sections of the Dry Harbour Mountains and the Cockpit Country,
resources may be abundant, but depth to water and other hydrogeologic characteristics may make
the water inaccessible.
48

Wells and springs abound in this unit, and yields are dependent on hydrogeological setting. The
transmissivity values (flow rate per unit of aquifer) measured within this unit range from 14.9
m2/day to 14,908 m2/day.
2.3 Waste Disposal
Due to the high permeability and abundant nature of their groundwater resources these rocks are
not suited for the development of pit latrines or absorption pits for waste disposal. In areas of
high water table, pits pose a direct threat to groundwater. The occurrence of sinkholes indicate
direct surface connections with the groundwater table and tend to enhance contamination.
The WRA recommends the establishment of composting pits or the use of central treatment
facilities to reduce the threat to the resource. Significant clay layers above the main aquifer,
forming a protective barrier, occur in specific areas. It may be possible to develop alternate
treatment/ disposal; methods such as stabilizing ponds, on this clay.
49

Figure 2 Area of Limestone Aquifer.
2.4 Drainage Characteristics
The high rates of percolation do not allow for the generation of significant overland flows. This
lack of overland flow is evident in the sparsity of surface drainage that occurs on this group.
Drainage where developed is in the form of channels that are supported by groundwater flow.
Frequent occurrences of sinks and rises are also characteristic of these channels. Flooding in
association with these river sinks is common. In most cases human activity has served to reduce
the intake of the sinks which then results in backwater and flooding.
50

3.0 Limestone Aquiclude
3.1 Geology
This unit is comprised by the Montpelier Formation. This rock is a member of the White
Limestone group but karstification has not been significant.
3.2 Water Resources
In its intrinsic properties this rock has a very low primary permeability, however faulting has
served to generate zones of increased permeability. This formation may yield water to wells and
springs, but generally in association with these zones of increased permeability.
The transmissivity within those zones is also highly variable and is known to range from 8 m 2/day to 11,181 m 2/day. The thickness of the Montpelier is approximately 1,000 metres.
Occurring mainly along the coast of the island; this formation often acts as a subsurface barrier,
serving to pond groundwater in juxtaposed limestone aquifers. Within this formation there
occurs both surface and ground water resources. The surface water resources have their source
as springs which rise at the contact of the aquiclude with the aquifer, and flow across the
aquiclude to the sea. The north coast springs in the Dry Harbour Mountain Basin are of this
type. In other cases faults and zones of increased permeability in the aquiclude serve to channel
ground water directly out of a juxtaposed aquifer. Along the north coast this aquiclude prevents
the occurrence of seawater intrusion into the limestone aquifer. There are limited opportunities
for ground water development in this unit.
51

Figure 3 Area of Limestone Acquiclude.
52

3.3 Waste Disposal
This unit, being characterized by generally low permeability has a lower risk of groundwater
contamination. Absorption pits may be appropriate in sections that are sufficiently distanced
from water sources. Ground water occur in areas of increased permeability such as faults. These
faulted areas are particularly prone to pollution and hence are unsuited for pits or unlined
systems. The WRA recommends vaulted composting pits as the minimum requirements for
sewage disposal in such areas. Surface water is particularly abundant where this aquiclude is
juxtaposed to an aquifer. Pollution of these channels by runoff from facilities located in close
proximity is possible.
3.4 Drainage Characteristics
Surface runoff is generally characteristic of aquiclude rocks in Jamaica. Being patchily
distributed mainly along the north coast restricts the size of the drainage areas underlain by these
rocks. As such there is no real sustained flow in channels associated with surface runoff. The
perennial channels on this unit are associated with groundwater discharged as springs from
juxtaposed aquifers. Variations in flow are smaller than on a similar sized drainage area of the
basement aquiclude. Numerous dry channels and gullies occur where the groundwater
contribution to streamflow is minimal. There are generally no well-established drainage
networks. Instead drainage develops as a series of adjacent and feeder channels that drain
towards the coast. Most of the north coast springs / rivers are of this type and they represent an
invaluable resource both for recreation as well as industrial and domestic purposes.
Flooding as a result of over topping of banks is not very common as the channels tend to be steep
sided. However some riverine flooding occurs along gully courses that have become inhabited.
53

4.0 Coastal Aquiclude
4.1 Geology
Comprised by the Coastal Group of limestones, this unit is patchily distributed, mainly along the
north and east coasts.
4.2 Water Resources
The permeability is very low and does not support the development of springs and wells. Where
it outcrops in association with a Limestone Aquifer it serves as a subsurface barrier to flow from
the aquifer. In this manner this unit behaves similar to the Limestone aquiclude and prevents the
occurrence of seawater intrusion into the aquifer. There is generally very little groundwater
associated with this unit. The main resource type is surface water, which is generated by springs
flowing across the unit or by surface runoff from its outcrop surface. This unit is generally less
than 300 metres thick.
The Falmouth Formation is the exception in this group, being characterized by significant
permeability and the presence of groundwater. However, high salinity limits the usefulness of
water from this formation. The Falmouth Formation is less than 50 metres thick.
54

Figure 4 Area of Coastal Aquiclude.
55
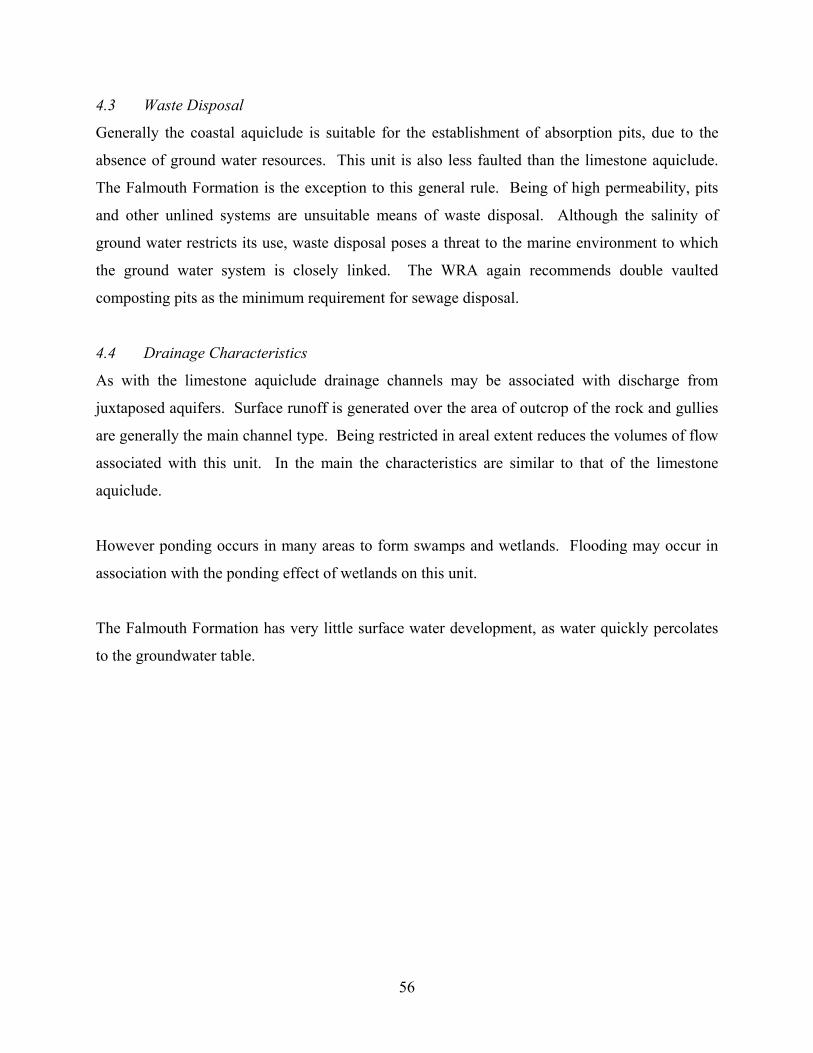
4.3 Waste Disposal
Generally the coastal aquiclude is suitable for the establishment of absorption pits, due to the
absence of ground water resources. This unit is also less faulted than the limestone aquiclude.
The Falmouth Formation is the exception to this general rule. Being of high permeability, pits
and other unlined systems are unsuitable means of waste disposal. Although the salinity of
ground water restricts its use, waste disposal poses a threat to the marine environment to which
the ground water system is closely linked. The WRA again recommends double vaulted
composting pits as the minimum requirement for sewage disposal.
4.4 Drainage Characteristics
As with the limestone aquiclude drainage channels may be associated with discharge from
juxtaposed aquifers. Surface runoff is generated over the area of outcrop of the rock and gullies
are generally the main channel type. Being restricted in areal extent reduces the volumes of flow
associated with this unit. In the main the characteristics are similar to that of the limestone
aquiclude.
However ponding occurs in many areas to form swamps and wetlands. Flooding may occur in
association with the ponding effect of wetlands on this unit.
The Falmouth Formation has very little surface water development, as water quickly percolates
to the groundwater table.
56

5.0 Alluvium Aquifer
5.1 Geology
This unit is comprised of sediments derived mainly from rocks of the basement complex and
deposited by the major rivers over time. These sediments are deposited across the coastal plains
of Kingston, Rio Cobre and Rio Minho basins; as well as within the drainage channels and flood
plains of rivers within the Blue Mountain North and South basins.
5.2 Water Resources
The sediments are non-homogenous, with diverse lithologies ranging from clay to boulders.
This in turn creates a system where the highest permeabilities are found in areas with coarse sand
and gravel content. Clay rich areas act more as aquicludes and confining layers, with the entire
continuum existing between.
Transmissivity within the sediments range from 135 m 2/day to 6,800 m 2 /day.
The sediments are most extensive in the Rio Cobre, Rio Minho and Kingston basin coastal
plains. Contamination of the alluvium aquifer in the Kingston Basin as a result of the improper
disposal of sewage has curtailed the uses of this water. Within the Rio Cobre and Rio Minho
basins there is little scope for additional development of ground water as the greater portion of
the resource has already been allocated. Poor irrigation efficiencies in some areas and the lack
of control prior to 1961 have allowed for the over development of sections of this aquifer. The
sediments range in thickness from 30 to 300 metres on the major south coastal plains.
Ground and surface water occur within the sediments. There is generally some interconnection
between both resources. Where deposits are in close proximity to rivers, there is generally a
hydraulic connection between the river and the sediments. In these areas wells have been drilled
to tap subsurface flow.
5.3 Waste Disposal
57

The heterogeneity of these sediments determines its suitability for the type waste disposal system
that can be installed. Groundwater is often found at shallow depths within these sediments
which make it prone to pollution. In areas where significant clay deposits occur, they may act as
a protective layer for the underlying groundwater.
Figure 5 Area of Allivium Aquifer.
58

Sewage disposal by absorption pits has led to the contamination of a large part of the water
resources of the Kingston basin. This has proven the unsuitability of soakaway pits as a disposal
method on these sediments. As the plains tend to be well populated, central sewage systems can
be regarded as the most suitable. Landfill sites may be developed in areas where a clay layer
forms an effective barrier to water movement into the ground water body or an artificial liner
will have to be installed to prevent contamination of water resources by leachate.
5.4 Drainage Characteristics
Drainage on these sediments is reflective of the lithology. In the sandy areas, there is a general
sparse drainage network. In most cases, drainage is dominated by one large channel with several
tributaries. Rivers are for the most part perennial, but show large seasonal variations in flow,
unless supported by ground water discharge. In areas where clays dominate the lithology, there
is a marked increase in drainage density. Main channels are joined more frequently by
tributaries. In the most part drainage channels are in the form of gullies, that carry water with
rainfall during events, sustained flows are rare. Riverine flooding is common in both areas,
where rainfall events produce flows that overtop the channel. Swampy areas also develop on
clay rich sediments in low-lying areas.
59
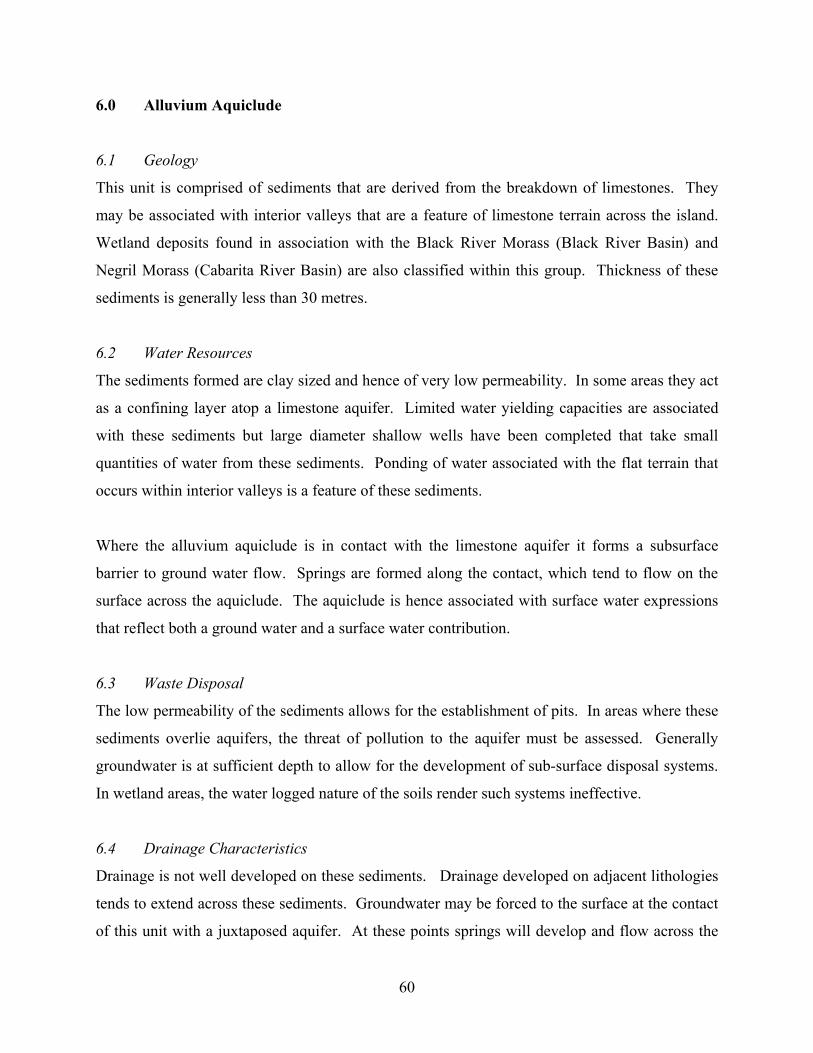
6.0 Alluvium Aquiclude
6.1 Geology
This unit is comprised of sediments that are derived from the breakdown of limestones. They
may be associated with interior valleys that are a feature of limestone terrain across the island.
Wetland deposits found in association with the Black River Morass (Black River Basin) and
Negril Morass (Cabarita River Basin) are also classified within this group. Thickness of these
sediments is generally less than 30 metres.
6.2 Water Resources
The sediments formed are clay sized and hence of very low permeability. In some areas they act
as a confining layer atop a limestone aquifer. Limited water yielding capacities are associated
with these sediments but large diameter shallow wells have been completed that take small
quantities of water from these sediments. Ponding of water associated with the flat terrain that
occurs within interior valleys is a feature of these sediments.
Where the alluvium aquiclude is in contact with the limestone aquifer it forms a subsurface
barrier to ground water flow. Springs are formed along the contact, which tend to flow on the
surface across the aquiclude. The aquiclude is hence associated with surface water expressions
that reflect both a ground water and a surface water contribution.
6.3 Waste Disposal
The low permeability of the sediments allows for the establishment of pits. In areas where these
sediments overlie aquifers, the threat of pollution to the aquifer must be assessed. Generally
groundwater is at sufficient depth to allow for the development of sub-surface disposal systems.
In wetland areas, the water logged nature of the soils render such systems ineffective.
6.4 Drainage Characteristics
Drainage is not well developed on these sediments. Drainage developed on adjacent lithologies
tends to extend across these sediments. Groundwater may be forced to the surface at the contact
of this unit with a juxtaposed aquifer. At these points springs will develop and flow across the
60

sediments. Where springs emerge without the development of drainage channels there is the
tendency for the formation of wetlands. Flooding is mostly associated with the expansion of
wetland areas in response to rainfall.
Figure 6 Area of Alluvium Aquiclude.
61

Appendix D WRA Guidelines for Assessing the Vulnerability of Groundwater
in a Given Area to Pollution
This appendix contains the WRA Guidelines for Assessing the Vulnerability of Groundwater in a
Given Area to Pollution, Ref # DR 8-26, which is not readily available through public resources.
62

63

64

65

66

Appendix E Sustainability Factor Checklists
This appendix contains sustainability factor checklists for the sustainability matrix method,
extracted and adapted from Applying Life Cycle Thinking to International Water and Sanitation
Development Projects: An assessment tool for project managers in sustainable development
work (McConville, 2006). Because DRASTIC and local feature parameters are evaluated in the
sanitation implementation assessment tool, environmental sustainability has been considered.
Thus it has been removed from the sustainability evaluation in order to avoid a double counting.
Since the sanitation implementation assessment tool is intended to be used in the planning and
approval process, the first life stages are included in its evaluations. Table 10 shows the original
Sustainability Assessment Matrix as developed by McConville (2006). The parameters utilized
by the sanitation implementation assessment tool are highlighted. The new possible totals from
these parameters are calibrated using the weights within the sanitation implementation
assessment tool.
Table 10: Sustainability Assessment Matrix
Following are the relevant sustainability factor checklists as presented by McConville (2006).
67

Element: 1,1 (Needs Assessment, Socio-cultural Respect) A needs assessment is essentially information gathering, in an attempt to comprehend the cultural fabric of society. It is especially important for foreign aid workers to look objectively at differences in cultural perceptions of social roles, hygiene, and proper water usage. Information can be gathered from a variety of sources, including literature, site visits, and community surveys. General information on socio-cultural issues (unemployment, payment of taxes, illiteracy, and health care) can be gathered from publications such as the Human Development Reports (e.g. UNDP, 2005). More specific information is best gathered on-site. A yearly calendar of work and social life can provide a good cultural introduction. It can also be used to infer the seasonal changes in labor supply and water use. Water and sanitation practices are often closely intertwined with religious, traditional or superstitious beliefs. It is important to understand the local beliefs and taboos centered on water and waste. The needs assessment will evaluate the level of health education and understanding of the role of water and sanitation in disease transmission. Gender roles and preferences can be particularly distinct on water and sanitation issues and are important to recognize in project planning and implementation. The following specific tasks are recommended to satisfy this element: Generate a yearly calendar of work and social life in the community.
�• How is a year defined? �• How are the seasons identified? �• What are the characteristics of each season? �• What is the primary employment in the area?
- For men? - For women? - For children?
�• Is this work constant throughout the year or seasonal? �• What time of year is the busiest? Are other seasons very slow? �• Are there patterns of seasonal migration?
�• What is the primary religion in the area? �• When are the major holidays? �• When do weddings, baptisms, and other social ceremonies take place?
Identify social preferences and traditional beliefs associated with sanitation practices.
�• What is the preferred sanitation method in the community?
68

�• What are preferred methods of anal cleansing? �• How do people feel about handling excreta (even when decomposed)?
- Will people transport it? - Will they reuse it? - How will this affect maintenance issues?
�• Are the religious constraints to be considered?
- A traditional rule is that Muslims should not defecate facing or with their backs towards Mecca.
�• Do people believe that excreta are harmful?
- Many people believe that children�’s excreta are less harmful than that of adults. - Others believe that disease is �“an act of God�”, therefore sanitation and hygiene practices
are irrelevant.
�• Are people afraid to use latrines? Why?
- Snakes, insects, and other animals - Black magic - Smells - Collection of excreta in a single place is �“unsanitary�” - Belief that women using a pit latrine will become infertile
�• Are there taboos associated with washing hands with soap?
Determine the level of health education in the community.
�• Have community members been involved in answering questions on community health? In formal and informal settings?
�• What is their education background? �• What health education issues are covered in schools? �• Who receives education? Men or women? (Note: that there may be discrepancies between who
receives education and who performs water/sanitation related tasks)
69

�• How often do people get sick in the community? �• Why do people get sick? (According to them) �• Do people connect water and sanitation issues with disease? �• What is the community motivation for improved water and sanitation services? �• Are there health care facilities available? �• How is the quality of the water? How is quality perceived in the community? �• How do you perceive the cleanliness of the community? How do community members perceive
it? �• Do they wash their hands with soap? �• Do they have a latrine? �• Do they use a latrine? Do the children?
Recognize differences in gender roles in water and sanitation.
�• How do men use water? How much?
�• How do women use water? How much? �• Who provides water for the household? Agriculture? Business? �• Do men and women follow separate sanitation practices? �• Are there separate latrines for men and women? �• Who is in charge of the children�’s hygiene?
70

Element: 1,2 (Needs Assessment, Community Participation) Community ownership is achieved by involving the community in every stage of the project. This can be initiated through a participatory needs assessment (see Appendix A). Participatory assessments are important methods for obtaining locally specific and community gathered data. This assessment clarifies the priorities of both the community and the development workers. The accuracy of the needs assessment can be improved by identifying and including a variety of stakeholders in the discussions (men, women, youth, elders, specific ethnic groups, community leaders, and water organizations). Another essential step is to determine the political and organizational capacity of the community. Subsequent community participation steps will depend on the ability and willingness of the community and development workers to work together. By recognizing the type of political organization in the community (egalitarian, hierarchist, individualist, fatalist), project planners can adapt the management model to the existing structure (Biggs and Smith, 2003). Addressing issues of community priorities, demographics, leadership and consensus provides development workers with critical background information, and helps the community better understand its own capacities. The outcome of this stage is the conceptualization of priorities and constraints on a participatory project approach. The following specific tasks are recommended to satisfy this element: Conduct a participatory needs assessment at the local level to determine local development
priorities.
�• Did you use a participatory approach to needs assessment? There are a range of methodologies based on a participatory approach to evaluate development needs, for example: Rapid Rural Appraisal (RRA), Participatory Rural Appraisal (PRA), and Participatory Analysis for Community Action (PACA). In general, they all aim to identify community problems and to plan solutions with the active participation of the community members (Selener et al., 1999). Each method uses a set of �“tools�” to assist the locals in analyzing the characteristics of their community (community map, social calendars), identifying problems (problem lists, priority analysis), and developing possible solutions (solution brainstorming, feasibility matrix). Participatory tools are most useful when a representative group of community members are involved (men, women, youth, elders, ethnic groups, community leaders and organizations). The participatory needs assessment must take place in the community itself. In depth literature can be found on all of these methods. It is not necessary that all techniques be used during the needs assessment. In fact, development workers should select the tools that are the most applicable to the community. Whatever tools are used the result should still be the identification of the top community needs.
�• Is the group involved in the needs assessment representative? Are they influenced by local power groups?
�• Can the following types of questions be answered by community members?
- What are the general characteristics of this community? (employment, services available, ethnic groups, community history)
- What are the strengths of the community? - What are the problems in the community?
71

- What is the present level of satisfaction with the existing sanitation system? - What are the causes and effects of these problems? - Which problems have priority for the community? - What can be done to address the problems? - Does the community have knowledge of options for improved sanitation systems? - What are the preferred options? - What technical, financial, and capacity building assistance does the community need to
reach these solutions? Identify stakeholders and community leaders.
�• Who will be directly affected by project intervention? �• Who will be indirectly affected? �• Who will pay? �• Are both genders considered? �• Are all age groups considered? �• Are there ethnic groups with varying needs? Can they be equally or proportional represented in
the project process? �• Who are the community leaders? �• Who are the local influential people (LIPs)? �• Are there people with veto power? (mayor, village chef) �• Are there influential people without official titles who will affect how others accept the project?
(leading scorer on the soccer team, favorite old man, people of wealth or connections) �• Are all these people behind the project? What will make them agree? �• Are there any existing sanitation committees?
Determine the type of political organization and cohesion at the community level.
�• How is the community governed? �• Who are the decision makers in the community? Official? Unofficially?
72

�• How representative is the community government? �• What is the level of participation in community decision making? �• Who implements the decisions? �• What are the rules and procedures governing community action? �• What is the level of participation in community activities?
Reach a consensus with community members that project intervention is appropriate.
�• Is there a perceived need for sanitation intervention within the community? �• Do community members understand the project possibilities?
�• Is the community aware of the capabilities/limitations of the development workers? �• Are community priorities in line with development workers�’ area of expertise? �• Is there agreement within the community to participate in project intervention?
73

Element: 1,3 (Needs Assessment, Political Cohesion) In the modern world, communities are no longer isolated entities that ignore the world beyond their backyard. Project planners need to coordinate their work with national, regional and local development schemes. The needs assessment will collect information on the local political situation, national policies and existing institutions (government, non-government, private enterprises) in the field. The first step is to situate the project in the national or global context, by acknowledging widespread political issues and problems. Project managers need to consider how their project can be integrated into nationally identified development plans and policies, such as National Poverty Reduction Strategy Papers (PSRPs), National Strategic Plans, Sector-Wide Approaches (SWaps), and local development schedules. It is beneficial to examine the history of development institutions in the area. Perhaps certain projects have been tried before or certain groups have expertise that could be useful in project planning and implementation. Information gathering is facilitated by making contacts and communicating with the agents directly. The following specific tasks are recommended to satisfy this element: Conduct a situational analysis of regional and national issues such as political structure and
stability, government policies, and foreign aid.
�• Are there any overwhelming local/regional issues that may affect the project?
- War - Drought - Disease (AIDS and other epidemics)
�• How stable is the national government? �• What is the financial situation of the country?
- Debt levels - Inflation rates
�• What is the structure of the national government? �• What do community members think about the government?
�• How active are government officials in the community? �• Does the government address sanitation issues? �• Are there government programs/initiatives in sanitation? �• How transparent are government finances and policies? �• How prominent are foreign aid projects?
74

�• Are there NGO programs/initiatives in sanitation in the area? �• Have you looked at potential information sources such as: UNDP Human Development Report,
local interviews, government and NGO reports?
Ensure that proposed project is consistent with regionally identified development priorities and plans.
�• What are the priorities outlined in the National Poverty Reduction Strategy Papers (PSRPs),
National Strategic Plans, and/or Sector-Wide Approaches (SWaps)? These are national initiatives that outline the development priorities for the country. There will be more government funding and institutional support for projects that address these priorities.
�• Are there local development schedules within the community or region? (check with mayor,
village counsel, community leaders) �• What is the availability of grants or aid money for sanitation intervention?
Research the history of NGO and government projects in the area.
�• What NGOs have worked in the community before? �• What type of project were they involved in? �• Were they successful? �• What work has the government done in the area? �• How was the community involved in the project implementation? �• Are past project reports available? �• Are the projects on-going?
Establish communication lines with existing NGO and/or government institutions in the area.
�• Have government officials in the area been contacted? �• Have NGOs with a history in the area been contacted? �• Are they familiar with your organization? �• What initiatives/projects are they currently working on in the area? �• What advice do they have for working in the area?
75

Element: 1,4 (Needs Assessment, Economic Sustainability) The objective of this element is to understand the economic situation of the community, its resource base, and willingness-to-pay for project improvements. Some information is available in published literature from organizations such as the United Nations, the World Bank, or international aid organizations (e.g. UNDP Human Development Reports and USAID country reports). Supplement literature reviews with information gained during a site visit. It is important to gain a basic understanding of how money and resources flow within the community, in particular, how water and sanitation costs fit into local spending and budgets. Identifying the local resource base is best done during a site visit and with community input. Working with the community to identify resources gives a clearer picture of resource availability and increases the community�’s appreciation of their own assets. It is important to separate monetary and non-monetary resources since these are generally valued very differently by both communities and donors. Finally, assessing the community willingness-to-pay for various projects will help in determining project feasibility and the potential for community contributions. The following specific tasks are recommended to satisfy this element: Understand the local and national economic situation (poverty level, employment, cost of living,
flow of resources).
�• What is the primary source of employment?
- National? - Locally?
�• How stable is the employment level? �• What is the average income? �• How is wealth distributed? (ratios of high/low income, inequality in wealth) �• What is the average cost of living in the community? �• What do people spend money on? When? �• Do people rent or own their property?
�• What are indicators of wealth? (livestock, vehicle, improved home, multiple wives)
Understand how the community economic situation is affected by sanitation issues.
�• Is income lost due to disease? �• How do people compensate for the loss of children? �• How much time is spent gathering water or dealing with sanitation? �• What percentage of income is spent on water and/or sanitation services?
76

�• Do community members understand the economic consequences of water and sanitation systems?
�• Would improved services provide economic gains?
Identify sources of monetary and non-monetary resources (materials, labor, and tools) within the
community.
�• How do people make money?
- Paid salary - Agriculture - Trade - Small enterprises (hand crafts, food sales at market, odd jobs)
�• How constant is the income?
- Does it vary by season? - Can people save money?
�• Does this vary by gender? �• Are there construction tools (wheelbarrows, shovels, picks, masonry tools) available? �• Is aggregate (sand, gravel, or rock) or lumber available? �• Can a community labor force be organized? �• Does the community have the means to transport supplies?
Assess the community willingness-to-pay in both monetary and non-monetary terms for current
sanitation services.
�• What do people pay for sanitation services?
- In cash - In organized community labor - In materials
�• If there are fees (monetary or otherwise) for current services do community members pay them? �• Are current services considered adequate?
77

�• Would people be willing to pay for an improved sanitation services? �• Do people rent or own their property?
- It can affect how much they are willing to pay for improvements to the property - Will landlords charge higher rent if sanitation services are improved? - Are tenants willing to pay higher rent for improved services?
78

Element: 2,1 (Conceptual Designs/Feasibility, Socio-cultural Respect) This project element is about assessing the cultural feasibility and appropriateness of the project design. An assessment of each design should be performed that considers the socio-cultural constraints identified in the needs assessment (seasonality of labor, ethnic divisions, gender roles, and traditional perceptions on water, sanitation, and health). The designs will build on existing technical systems and cultural values. It is helpful to estimate how a new system will affect the roles and responsibilities of individuals within the society, by considering the level of behavior change that the improved system will demand. The willingness and capacity of the community to operate, maintain, or dispose of the proposed systems needs to be evaluated. For example, certain sanitation technologies require handling of feces which may be unacceptable in some cultures. Other systems may require technical expertise that is currently beyond the learning capacity of the community. Care should be taken that a new system will not undermine or interfere with traditional gender roles, so that it will be acceptable to both men and women. It is also important to recognize that bias towards certain technologies may exist on behalf of donors and local residents. Understanding the reasoning behind these biases (desire for prestige, system familiarity, cultural preferences in quality, or political pressure) can have important ramifications for design selection and user support. The following specific tasks are recommended to satisfy this element: Assess how the proposed interventions will affect daily activities and socio-cultural roles within
the community.
�• Can you brainstorm potential social advantages and disadvantages of potential systems? �• Will the new system elevate or lower the social status of any group or individual? (By giving
them new responsibilities or eliminating their roles?) �• Does the new system have the potential to shift social values? Is this positive or negative? �• How can designs address these concerns so that the system will be culturally acceptable?
�• Will the system result in increased or decreased free time? For whom?
- Improved sanitation systems may be more convenient, but will they require increase time for cleaning and structure maintenance.
�• How will these changes in free time affect the lives of community members?
- Will increased free time allow for gainful economic employment? - Will it affect social time? (Women often socialize together at the water source) - Will it affect how children are employed in household chores? (If children no longer fetch
water, what will they do? Is it reasonable to expect that they will be able to go to school?)
�• Will the new system affect political or power roles in the community?
Evaluate the willingness and capacity of the community to perform operation, maintenance, and disposal requirements for each design.
79

�• How much technical knowledge is required to operate the system?
- Does this knowledge exist within the community? - Can people be trained to operate this system? - Do people want to be trained? - Will trained people remain in the community? (Labor forces can be migratory. Educated
people tend to be drawn to urban centers where there are better job opportunities.)
�• Are cultural and traditional preferences and taboos considered and respected?
- Consider how favorite aspects of the current system can be incorporated into the design (location, ease of operation, privacy). People are most willing to accept something with which they are familiar.
- Refer to information gathered during needs assessment
- Ex: Certain sanitation systems may require handling of excreta that may be unacceptable
in some cultures.
�• When will the system require maintenance? (Daily, monthly, seasonally)
- Will people have the time to perform maintenance? - Will this vary depending on the season? (seasonality of labor) - Ex: During the harvest people are very busy and will be unwilling to take on any
additional tasks. - Can maintenance schedules be timed to coordinate with labor availability?
Design recognizes and respects traditional gender roles.
�• Women are often in charge of household water supply, while men are involved in construction
and technology. Will a new system interfere with the traditional gender power balance? �• What will be the role of men and women in the new system? �• How can the project encourage ownership by both gender groups? �• Are separate facilities provided for men and women if necessary?
Recognize why biases exist towards certain technologies by donors and/or locals.
�• Are certain improved systems associated with prestige and wealth?
80

�• Are there political pressures/incentives to adopt certain technologies? �• Are some systems more acceptable because of their familiarity to either residents or donor
agencies? �• What significance is placed on system convenience, privacy, comfort, or aesthetics? �• Are there differences in cultural standards of quality or cleanliness that need to be reconciled? �• Remember that not all biases are negative. Some may be helpful in promoting the use and
general acceptance of the system.
81

Element: 2,2 (Conceptual Designs/Feasibility, Community Participation) The community needs to be involved in the development of conceptual designs and feasibility studies. This requires strong communication skills on behalf of both the community and the development workers. It helps to designate a clear community liaison to facilitate communication exchanges. At the start of the preliminary design process the scope is defined through mutually agreement on project objectives and expected outcomes. In most water and sanitation projects the technical designs are developed by outside consultants. However, feasibility studies require feedback and evaluation from community members. Community input can be solicited on conceptual designs through a local user�’s committee or representative community organization. The feedback sessions will be most beneficial when community members are given time to reflect on design proposals and allowed to express their concerns and opinions. Their suggestions and concerns can then be incorporated into the feasibility analysis, design revisions, and the selection of an appropriate design. The following specific tasks are recommended to satisfy this element: The project goals are clearly defined and understood by the community and development workers.
�• What need had the highest priority? �• How do community members visualize the expected benefits? How do the development
workers?
- Increased health? - Increased incomes? - Reduction in seasonal migrations? - Time and labor savings?
�• Who will benefit from the project?
- Will all members benefit equally? - Are all the beneficiaries represented in community discussions?
�• Are community members and development workers in agreement? Identify a representative committee that can act as the community liaison throughout the project.
�• Can this committee present the community opinions and views to the project planners? �• Will they be responsible for reporting project plans back to the community, including
explanations of alternatives? �• Is the committee capable of performing (or assigning the responsibility for) the following roles?
- Assisting in feasibility studies
82

- Gathering of field data - Organizing community education - Generating support for the project.
�• Can an existing committee fill this role? �• Is it necessary to create a new committee? (Note: there is a danger of too many committees
within a community. It can lead to a confusion of roles.) �• Does this group represent all beneficiaries? (men, women, ethnic diversity) �• Are members of this committee respected within the community? �• Does this committee operate according to local customs?
Present several technically feasible alternatives for community evaluation and feedback.
�• Does the presentation of each design include a technical description, estimated costs, installation time, and operation and maintenance needs?
�• Is the potential for long-term management of each system emphasized? �• Are presentations of alternatives done in a fair and balanced way? �• Does the community understand the proposed technology? �• Are advantages and disadvantages of each design understood and discussed? �• Does the community think that they can manage and maintain the system on their own? �• What education, training or support services would be necessary for the proposed designs?
�• Are there any community concerns not addressed in the conceptual designs? �• Are there legal issues surrounding use of the water source or necessary land? �• Is there sufficient knowledge within the community to manage the systems being considered?
Community members formally select a design based on an understanding of the constraints
involved in the selection process.
�• Are community members allowed to judge the advantages and disadvantages of differing systems?
�• Are decision-makers given time to reflect before selecting a design?
83

�• How is the decision reached? Democratic process? Leader decides? �• Is this process consistent with traditional methods of community decision making? �• Is the decision influenced by outside forces? �• Is it possible to judge if the design was chosen on technical merit or political motivation? �• Do community members seem happy with the selected design?
84

Element: 2,3 (Conceptual Designs/ Feasibility, Political Cohesion) It is important to foster good relationships within the development community early in the planning process. Opening communication lines gives organizations access to a broader array of information for decision making. Partner institutions can be government agencies, non-governmental organizations (NGOs), or private enterprises. It is preferable that at least one partner organization is based in the host country. Working with partner organizations during the planning process ensures that the efforts of all organizations are complementary, not redundant or conflicting. It is possible that similar projects have been attempted or implemented in the local area. The conceptual design process can be improved by consulting the work of other projects and institutions. Promotional efforts for the new project can be improved by collaborating with existing technology or programs in the area. For example, if the design needs a pump, investigate the possibility of using local pumps, or those being promoted by local NGOs. Health initiatives may also offer educational services and trainings that complement the project. This is also the stage to begin contacting potential partners and exploring the availability of funding for the project. The following specific tasks are recommended to satisfy this element: Develop a working relationship with partner organization(s), including at least one that is based in
the host country.
�• Have local government officials, NGOs, or private enterprises been contacted? �• Do partner organizations have compatible programs and agendas? �• What is the expected level of support and interaction from all parties? �• Do partners have suggestions or feedback on the designs? �• Are government officials kept informed? �• Can the basic goals of the working relationship be written in a Memorandum of Understanding
(MOU)? (EWB, 2005) Consult the plans and designs of other organizations on similar projects.
�• Have similar projects been implemented in the area? �• Will the project be redundant or in conflict with another project? �• What technical designs are working in nearby communities? �• What constraints did they use? �• Were there problems? How were they resolved? �• How long did the projects take?
Explore options to integrate existing technologies or programs into conceptual designs.
85

�• What water supply and sanitation technologies are being promoted by government or NGO programs in the area?
�• What is the potential to use these technologies in the design? �• Could other programs offer education or training support? �• Are there institutions pushing health initiatives that could provide educational services and
support?
Contact potential partner institutions for project financing.
�• Are there grants or low-interest loans available?
- For agencies? - For individuals?
�• What are the conditions for receiving funding? �• Are funds available for operation and maintenance? �• Are programs and funding available for supportive health/sanitation education?
86

Element: 2,4 (Conceptual Designs/Feasibility, Economic Sustainability) The economic feasibility of each conceptual design is based on a series of cost estimates and willingness to pay studies. The cost estimates for implementing each alternative should be comprehensive and include labor, materials, equipment, transportation, political fees, and training. It is helpful to have the community involved in pricing and cost calculations as they know the prices and availability of local resources. Cost reduction and long-term sustainability of the project can be achieved by minimizing outside resources, especially if they will have to be replaced. It is equally important to consider the projected operation and maintenance costs for potential designs. The end-of-life costs for disposal, recycling, and reuse also factor into feasibility studies. Feasibility compares costs of the conceptual designs against the willingness of the community to contribute to construction, operation, and maintenance. Many designs are based on the theory of local ownership through control of operation and maintenance. The community should understand this commitment and be willing to pay it. In determining willingness to pay, it may help to explain labor and materials contributions in equivalent monetary terms. Finally, the economic feasibility of the alternative designs can be assessed by examining the gap between estimated costs and the willingness to pay for them during construction, operation, and maintenance (refer to Appendix A for more details). The following specific tasks are recommended to satisfy this element: Estimate the implementation costs of each conceptual design.
�• Are training costs included? �• How much will materials and equipment cost? �• What local materials can be used? What will it cost? �• How can non-local materials be obtained? �• What will transportation of materials, equipment, and laborers cost? �• What will labor cost? Skilled and unskilled? �• Will food be provided for labor crews? What will it cost? �• Can community members provide local cost information?
�• Will there be political fees that should be included in the budget? �• How should development workers�’ time be included? �• What about costs for promoting use of the system or health education?
Estimate operation, maintenance, and disposal costs for each conceptual design.
�• Include costs for materials, replacement parts, and skilled laborers. �• Can these parts and materials be found locally?
87

- If not, include cost estimates for transportation of supplies or displacement of people to get supplies
�• How often will materials and parts need replacement? �• What are the minimum costs to keep the system running?
- Daily - Weekly - Monthly - Annually
�• How will recurrent costs be recovered?
- Fees - Outside aid
Assess the community willingness-to-pay in both monetary and non-monetary terms for each improved system.
There are a number of methods in use for determining willingness-to-pay: contingent valuation surveys, estimations based on a percentage of income or current expenditures. (Goldblatt,1999: Raje et al., 2002: Whittington et al., 1991/1990) The community willingness to pay should be determined on more than a �“rule of thumb�” based on a percentage of household income. It should be voiced by community members themselves, either directly in interviews or indirectly by costs that they currently pay for services.
�• What do people pay for water and sanitation services? �• What is considered an adequate level of service? �• How much money are people willing to pay to obtain this service?
- Construction/Implementation fee? - Monthly? - Yearly? - Per use?
�• What are people willing to contribute to construction and start-up capital costs?
- Monetary
88

- Non-monetary items - Are people willing to work to obtain this service? (labor, supplies, construction material,
tools)
�• What are people willing to pay to maintain an improved system?
- Indirectly: service fees - Directly: labor for maintenance or repairs, replacement parts or materials
Conduct an economic feasibility assessment to evaluate long-term project viability based on cost estimates, projected operation and maintenance costs, community willingness to pay, the need for outside resources, and the availability of outside funding.
An economic feasibility assessment is suggested in place of a traditional cost-benefit analysis. In international water and sanitation projects, benefits are often hard to quantify. There are data limitations that make it difficult to estimate the health and economic benefits that would traditionally be used to justify costs. The larger question in developing countries is the sustainability of the project. The measurable benefits will be negligible if the project is not maintained. In fact, sanitation systems such as latrines can have negative health impacts if they are not properly cleaned and used (Pickford, 1995). An economically sustainable project is one that offers long-term benefits (i.e. remains in operation) at an affordable price. The definition of an affordable price will be determined by what beneficiaries and government officials are willing to pay. There are many methods for determining the community willingness to pay (see above). Willingness to pay on the part of the government (or other aid organizations) can be determined based on the amount of grants, subsidies, or other funding currently directed at water and sanitation systems (see element 2,3). In an economical feasibility assessment, the project viability is determined by weighing cost estimates for construction, operation and maintenance, versus the willingness of the government and community to pay for it. For example, an unsustainable project may have sufficient funding and community support to construct the system, but operational costs exceed what the community and aid institutions are willing to pay. Decision makers will have to evaluate the long-term viability of the project based on the gap between anticipated support and expected costs.
�• What is the total cost to implement the project? �• What can the community contribute to these costs? �• What funding is available to implement the project? �• What is the estimated start-up cost? �• What are realistic estimations of operation and maintenance costs?
Note the danger of investing more money up front (high technology) to avoid operation and maintenance costs. The high cost of fixing these systems when they do require maintenance (and they will) may be quite inhibitory (Howe and Dixon, 1993).
�• What is the total annual cost per household (including capital and recurrent costs)? (for more details refer to Pickford, 1995)
89

�• What percentage of this is the community willing to pay? �• Will outside resources be needed for operation and maintenance? �• Will these resources be available?
90
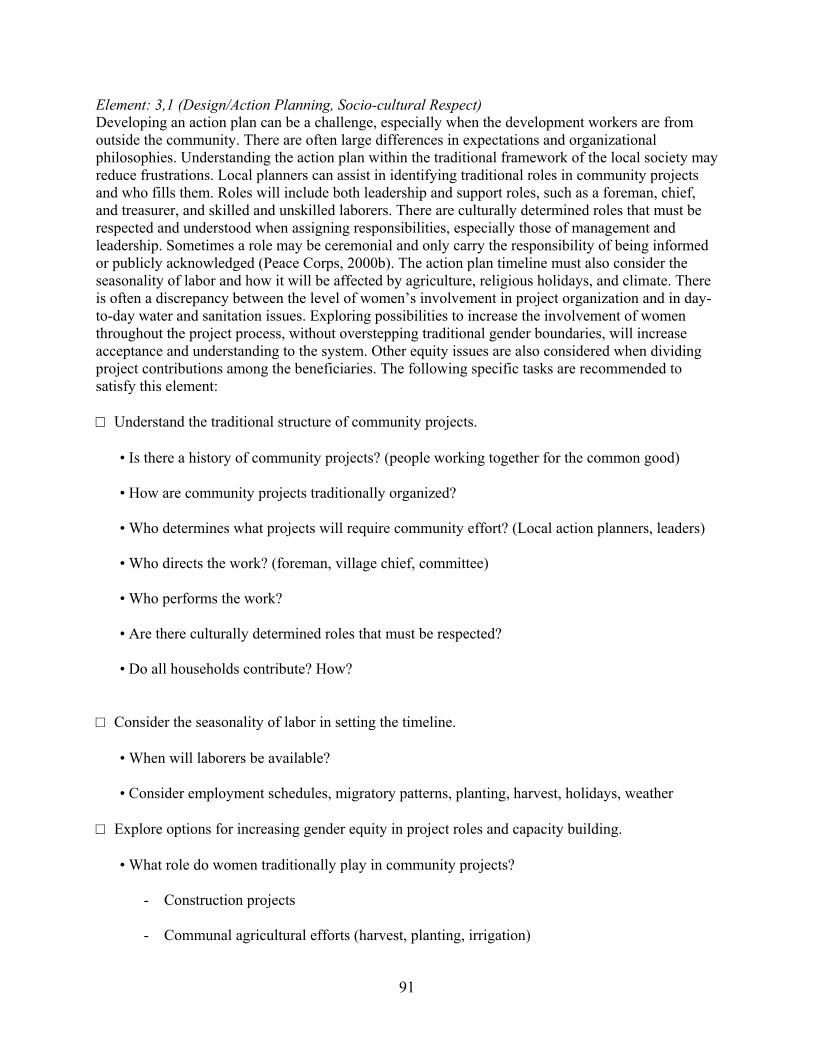
Element: 3,1 (Design/Action Planning, Socio-cultural Respect) Developing an action plan can be a challenge, especially when the development workers are from outside the community. There are often large differences in expectations and organizational philosophies. Understanding the action plan within the traditional framework of the local society may reduce frustrations. Local planners can assist in identifying traditional roles in community projects and who fills them. Roles will include both leadership and support roles, such as a foreman, chief, and treasurer, and skilled and unskilled laborers. There are culturally determined roles that must be respected and understood when assigning responsibilities, especially those of management and leadership. Sometimes a role may be ceremonial and only carry the responsibility of being informed or publicly acknowledged (Peace Corps, 2000b). The action plan timeline must also consider the seasonality of labor and how it will be affected by agriculture, religious holidays, and climate. There is often a discrepancy between the level of women�’s involvement in project organization and in day-to-day water and sanitation issues. Exploring possibilities to increase the involvement of women throughout the project process, without overstepping traditional gender boundaries, will increase acceptance and understanding to the system. Other equity issues are also considered when dividing project contributions among the beneficiaries. The following specific tasks are recommended to satisfy this element: Understand the traditional structure of community projects.
�• Is there a history of community projects? (people working together for the common good) �• How are community projects traditionally organized? �• Who determines what projects will require community effort? (Local action planners, leaders) �• Who directs the work? (foreman, village chief, committee) �• Who performs the work? �• Are there culturally determined roles that must be respected?
�• Do all households contribute? How?
Consider the seasonality of labor in setting the timeline.
�• When will laborers be available? �• Consider employment schedules, migratory patterns, planting, harvest, holidays, weather
Explore options for increasing gender equity in project roles and capacity building.
�• What role do women traditionally play in community projects?
- Construction projects - Communal agricultural efforts (harvest, planting, irrigation)
91

- Operation of water and sanitation services
�• What roles do women feel comfortable playing? �• Are there ways to increase the involvement of women in the current project?
- Ex: Bringing water to the site for mixing concrete or cleaning the work site. - Ex: Train them in operation and maintenance
Confirm that labor and resource contributions are equitably divided.
�• Among households? �• Among ethnic groups?
92
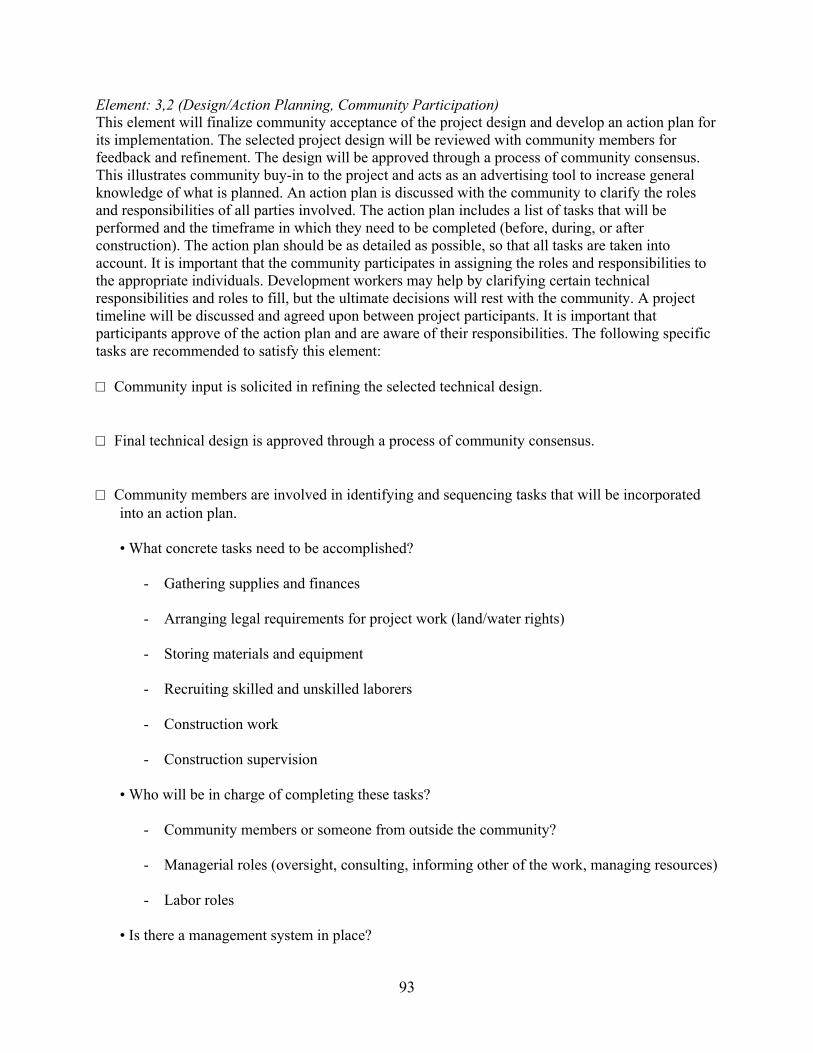
Element: 3,2 (Design/Action Planning, Community Participation) This element will finalize community acceptance of the project design and develop an action plan for its implementation. The selected project design will be reviewed with community members for feedback and refinement. The design will be approved through a process of community consensus. This illustrates community buy-in to the project and acts as an advertising tool to increase general knowledge of what is planned. An action plan is discussed with the community to clarify the roles and responsibilities of all parties involved. The action plan includes a list of tasks that will be performed and the timeframe in which they need to be completed (before, during, or after construction). The action plan should be as detailed as possible, so that all tasks are taken into account. It is important that the community participates in assigning the roles and responsibilities to the appropriate individuals. Development workers may help by clarifying certain technical responsibilities and roles to fill, but the ultimate decisions will rest with the community. A project timeline will be discussed and agreed upon between project participants. It is important that participants approve of the action plan and are aware of their responsibilities. The following specific tasks are recommended to satisfy this element: Community input is solicited in refining the selected technical design.
Final technical design is approved through a process of community consensus.
Community members are involved in identifying and sequencing tasks that will be incorporated
into an action plan.
�• What concrete tasks need to be accomplished?
- Gathering supplies and finances - Arranging legal requirements for project work (land/water rights) - Storing materials and equipment - Recruiting skilled and unskilled laborers - Construction work
- Construction supervision
�• Who will be in charge of completing these tasks?
- Community members or someone from outside the community? - Managerial roles (oversight, consulting, informing other of the work, managing resources) - Labor roles
�• Is there a management system in place?
93

- Is there an existing water board or committee? - Will it be necessary to establish a governing board for the system?
�• When do these tasks need to be completed?
- Develop a timeline - Set a schedule for task completion
�• How will the project be promoted in the community? �• Who will receive technical/ operational training? �• Who will receive health education (hygiene, hand-washing, proper use of system)? �• Are assumptions in roles and contributions explicitly stated? (Ex: If community members will
provide labor, meals for workers, or tools)
The community members and development workers approve of the timeline and responsibilities laid out in the action plan.
�• Are the roles and responsibilities of individuals and organizations explicitly stated?
- Performing the work - Overseeing progress - Consulting - Informing others of the work - Managing resources
�• Are all parties aware of their own roles and responsibilities, as well as, those of everyone else?
�• Are the skills, knowledge and attitude of individuals factored into role assignments? �• Does the timeline include tasks to be completed by both community members and development
workers? �• Does the timeline include dates for the community monetary contribution paid, resource
gathering, start of work, expected progress, completion?
94

Element: 3,3 (Design/Action Planning, Political Cohesion) Developing an action plan at the institutional level requires the same steps as at the community level. Partner institutions will be involved in identifying the tasks and delineating the separate roles and responsibilities of each group involved in the project (supervising, funding, information exchange, progress reporting, oversight and monitoring). It is important to remember that the role of some partners may merely be to be informed (government officials, religious leaders). The action plan includes financial arrangements, a realistic timeline for funding paid, work completion, and reporting requirements that considers the limitations and deadlines of each organization. Ultimately, a written action plan that defines tasks and responsibilities needs to be approved by the coordinating officials. In some areas it will be necessary to get the technical design approved by the authorities. The following specific tasks are recommended to satisfy this element: The roles and responsibilities of partner institutions are defined in a detailed action plan.
�• What level of involvement is each organization willing to commit to?
- Financial support - Consulting - Sub-contracting - Training and Education - Direct community involvement
�• What specific reporting or procedural requirements does each organization need?
- Progress and monitoring reports - Contracts - Site visits - Education or capacity building activities - Other paperwork
�• Who needs to be informed of project activities? �• Who will supervise the project?
�• Who will monitor progress? �• Who will work directly with the community? �• Who will recruit skilled laborers?
95

Agree on financial commitments.
�• Who will contribute to project financing?
- How much? - When will funds be available?
�• Who will control the project budget? �• What strings are attached to institutional funds?
- Earmarks - Reporting requirements
A timeline is drafted that meets the requirements of all institutions involved.
�• What are the funding and reporting schedules of the institutions? �• When will work start? �• When are progress and final reports due? �• When will work be completed? �• Are institutional deadlines respected?
Final project design and action plan are presented to partner institutions and local, regional, and/or national level authorities.
�• Are all parties aware of their role and the timeline agreed upon? �• Have all parties seen the finalized design? (Even if they are not directly involved, they
appreciate being informed.)
96

Element: 3,4 (Design/Action Planning, Economic Sustainability) This element includes confirmation of the budget and planning for resource procurement. The design and action plan are interconnected and several iterations may be necessary to increase cost effectiveness. Planning for the cost and choice of materials, procurement methods, and construction techniques may result in adjustments to the project design. The costs and availability of resources must be verified before the budget can be finalized. Cost effectiveness can be increased by using local prices, resources and labor whenever possible. A community liaison can suggest market prices and the possibility of manufacturing supplies or equipment on site. Many communities have local craftsmen that are ingenious at improvising tools or replicating work. The community contribution is finalized during the planning process. Commitments must be made for monetary and non-monetary contributions prior to the start of construction. Non-monetary contributions can consist of labor, tools, building supplies, and transportation. When the supply list and the community contribution have been discussed, the budget can be finalized to reflect the local situation. An action plan for resource procurement can be developed with a detailed schedule for material purchase, transporting, and manufacturing. Allow sufficient time for unexpected delays so that the construction process is not held up by deficiencies in resources. The following specific tasks are recommended to satisfy this element: Verify the costs and availability of resources.
�• Present an itemized budget for review by community members (they understand the local
market) �• What are the local prices? �• Do they fluctuate? By how much? (It is best to verify prices as close to the purchasing time as
possible) �• What is the currency conversion rate in the country? (Check the rate on the open market as it
can differ from the official rate) �• Can anything be improvised or constructed on site?
�• What about transportation costs? �• What do laborers cost? Unskilled? Skilled? �• Does the cost of labor vary depending on the time of year? (issue of availability) �• Are costs for training included in the budget?
Confirm the community contribution for money, materials, equipment, tools, and labor.
�• Who will provide the monetary contribution? How much? �• Who will provide tools and equipment? �• Is there a storage area for large tool and construction supplies?
97

�• How many laborers can the community contribute? �• Will meals be provided for laborers? By whom? �• Who will provide for food and housing for trainers from outside the community? �• Are individual contributions consistent with their ability to pay? �• The community makes a formal commitment to the agreed contribution.
Finalize budget based on local costs, available resources, and community contribution.
�• Include a contingency plan for unexpected costs. �• Can the budget adjust for alternative plans if required materials become unavailable?
Develop an action plan for resource procurement.
�• When will materials be required throughout the construction process? �• Where will materials be purchased? By whom? When? �• How will they be transported to the site? �• Is manufacture of materials required?
- Ex: breaking rocks into gravel or blacksmithing of parts - How long will it take? - How far in advance can it be performed?
�• Are skilled laborers required?
- When are they available? - Is a signed contract required?
�• Who will arrange for unskilled laborers?
98