development of a food grade recycling process for post ... 2 - food contact pp appendices...
TRANSCRIPT

Final Report - Appendices
Development of a Food Grade Recycling Process for Post-Consumer Polypropylene:Data from Extraction & Migration Tests
This document provides supplementary decontamination data from extraction and migration tests performed during the development of a process for post-consumer food grade polypropylene (PP).
Project code: MDP039 Research date: October 2010 – March 2011 Date: September 2011

WRAP’s vision is a world without waste, where resources are used sustainably. We work with businesses and individuals to help them reap the benefits of reducing waste, develop sustainable products and use resources in an efficient way. Find out more at www.wrap.org.uk
Written by: Robert Dvorak, Edward Kosior and Lesley Moody of Nextek Limited.
Front cover photography: Granulated polypropylene margarine tubs WRAP and Nextek Ltd believe the content of this report to be correct as at the date of writing. However, factors such as prices, levels of recycled content and regulatory requirements are subject to change and users of the report should check with their suppliers to confirm the current situation. In addition, care should be taken in using any of the cost information provided as it is based upon numerous project-specific assumptions (such as scale, location, tender context, etc.).The report does not claim to be exhaustive, nor does it claim to cover all relevant products and specifications available on the market. While steps have been taken to ensure accuracy, WRAP cannot accept responsibility or be held liable to any person for any loss or damage arising out of or in connection with this information being inaccurate, incomplete or misleading. It is the responsibility of the potential user of a material or product to consult with the supplier or manufacturer and ascertain whether a particular product will satisfy their specific requirements. The listing or featuring of a particular product or company does not constitute an endorsement by WRAP and WRAP cannot guarantee the performance of individual products or materials. This material is copyrighted. It may be reproduced free of charge subject to the material being accurate and not used in a misleading context. The source of the material must be identified and the copyright status acknowledged. This material must not be used to endorse or used to suggest WRAP’s endorsement of a commercial product or service. For more detail, please refer to WRAP’s Terms & Conditions on its web site: www.wrap.org.uk
Data from Extraction & Migration Tests 3
Acknowledgments This report provides decontamination data from analytical work that was performed on a number of recycling processes. WRAP and Nextek Ltd would like to thank Pira International Ltd for their work on the analytical assessments of the decontamination performance of the recycling processes. The data in this report has been obtained from Pira research reports 11A11J1298 (Generation of Challenge Test Data on Polypropylene Flakes and Pellets) and 11A11J1306 (Migration of surrogate compounds into 95% and 10% ethanol from challenge tested polypropylene).

Data from Extraction & Migration Tests 4
Glossary of Terms Decontamination A term used to describe the removal of contaminants from polymers Degassing Removal of gases (usually from polymer melts during extrusion) Devolatilisation A term used to describe the removal of volatiles (gas molecules) from polymer melts
during extrusion and from polymer pellets or flakes during decontamination in vacuum reactors
DP Directly printed (normally refers to polypropylene pots or tubs that are printed on the outer surface
EFSA European Food Standards Authority Extraction tests Analytical tests performed in a laboratory to measure levels of contaminants
(surrogates) present in contaminated polymer FID Flame ionisation detector: a GC non-specific detector with proven sensitivity for carbon
containing species Food contact Polymer or packaging which has been used in contact with food Food grade Polymer or packaging that is originally manufactured under conditions which make it
suitable for use in food contact applications FTIR Fourier Transform Mid Infra-red spectroscopy: an analytical technique permitting the
characterisation of principally organic species GC Gas Chromatography: analytical technique used to separate volatile components from
a mixture GC/MS Gas Chromatography/Mass Spectroscopy: a refined analytical technique combining gas
chromatography with mass spectroscopy to identify the eluted species Challenge test A test (defined by the US FDA) that is used to determine the capability of a recycling
process to remove specifically selected chemical surrogates and produce food grade polymer
HDPE High density polyethylene Injection moulding Plastic processing technique, which converts plastic pellets into a viscous, melt by heat
and shear prior to injection into a metal tool under high pressure. Cooling of the tool permits ejection of the cooled, solid moulded article
IPM Iso Propyl Myristate IML In-mould label LOD Level of detection MFR Melt Flow Rate; a rheological test method providing an approximate measure of
molecular weight and so providing an assessment of ease of flow within subsequent melt processing equipment
Migration test Migration testing usually requires analysis of the food simulants for one or more specific potential migrants (rather than the total migration of all substances). The testing involves determinations for specific substances and the analyses are more complex than the "total extraction" compliance tests and usually employ sophisticated, computer-controlled instrumentation that requires analytical expertise in chemical analysis.
Oligomer Materials with low molecular chain length are referred to as oligomers PE Polyethylene PET Polyethylene Terephthalate PP Polypropylene ppm Parts per million ppb Parts per billion PRF Plastic Recovery Facility Residence time Time spent under specific processing or decontaminating conditions rHDPE Recycled high density polyethylene rPET Recycled polyethylene terephthalate rPP Recycled polypropylene Surrogates Selected chemical compounds for a challenge test that simulate a range of chemicals
that could be misused by consumers THF Tetrahydrofuran Volatiles Molecules in a gaseous state (i.e. above their boiling point) US FDA United States Food and Drug Administration

Data from Extraction & Migration Tests 5
Table of Contents Report Summary .................................................................................................................................. 6 1.0 Challenge Test Decontamination Trial Sequence and Methodology ........................................ 7
1.1 Challenge .............................................................................................................................. 8 1.1 Decontamination Trial Sequence............................................................................................. 8 1.2 Description of Devolatilisation Trials of Printed PP Materials ..................................................... 9 1.3 Purpose of a Challenge Test ................................................................................................. 10
1.3.1 Conducting the Decontamination Test ...................................................................... 10 1.4 Preparation of PP Challenge Test Flake ................................................................................. 10
Appendix A: Generation of Challenge Test Data on Polypropylene Flakes and Pellets ...................... 12 2.0 Extraction Study & Test Background ..................................................................................... 12
2.1 Extraction Study Objectives .................................................................................................. 12 2.2 Experimental work: Analysis of the Chemically Spiked PP Flake and Pellets ............................. 12
2.2.1 Test Procedure Conditions ....................................................................................... 14 2.3 Screening of Printed PP Packaging ........................................................................................ 14
2.3.1 Headspace GC/MS Test Conditions ........................................................................... 14 2.3.2 Solvent Extraction GC/MS Test Conditions ................................................................ 15
2.4 Extraction Study Results: Analysis of the PP Pellets and Flake for Surrogates .......................... 15 2.5 Results of Screening Printed Packaging Samples from Trial 7 (PP/DP/B) and Trial 8 (PP/IML/B) 19
2.5.1 Headspace GC/MS Results ....................................................................................... 19 2.5.2 Solvent Extraction GC/MS ........................................................................................ 19
2.6 Summary of Challenge Test Results ...................................................................................... 19 Appendix B: Migration of Surrogate Compounds into 95% and 10% Ethanol from Recycled Polypropylene. ................................................................................................................................... 46 3.0 Migration of Surrogates into Food Simulants ........................................................................ 46
3.1 Experimental Work .............................................................................................................. 47 3.1.1 Migration Test Samples ........................................................................................... 47 3.1.2 Migration Tests ....................................................................................................... 47 3.1.3 Analysis - 10% Ethanol ........................................................................................... 47 3.1.4 Analysis - 95% Ethanol ........................................................................................... 47
3.2 Stability Tests in 10% and 95% Ethanol ............................................................................... 48 3.3 Validation Experiments......................................................................................................... 49
3.3.1 Validation for Surrogates in 10% Ethanol ................................................................. 49 3.3.2 Validation for Surrogates in 95% ethanol ................................................................. 50
3.4 Migration Results of 10% Ethanol Test Simulant .................................................................... 51 3.5 Migration Results of 95% Ethanol Test Simulant .................................................................... 52 3.6 Discussion and Conclusions .................................................................................................. 53 3.7 Conclusion of the Migration Results ...................................................................................... 53

Data from Extraction & Migration Tests 6
Report Summary This standalone report contains the technical results of WRAP’s work to develop a food grade recycling process for post-consumer polypropylene (PP). Please refer to the accompanying report “Development of a food grade recycling process for post-consumer polypropylene” (WRAP 2011) for a full account of the project methodology and conclusions. This report is intended for a technical audience such as plastics reprocessors and provides detailed information on the challenge test and migration test results obtained in the project. This may be used to inform further testing and development work in this area. In the EU, plastic packaging used for food and beverages can only be manufactured from a positive list of approved materials and substances that have been declared safe for food contact by the European Food Safety Authority (EFSA). For recycling of PP packaging, this means that the PP resin used for tubs/pots/bottles and trays used to package food and beverages is already food contact safe. However, there is a large volume of non-food PP packaging in the waste collection stream consisting of personal care and household chemical cleaning containers. Although in some cases these containers are manufactured from food safe virgin PP resin, once used, the resin absorbs compounds and substances from the products it stores. Because of the wide use of PP in non-food applications the preparation of the challenge test flake included contamination of the challenge test flake with substances found in post-consumer PP packaging originating from personal care and household chemical cleaning containers. In order to use recycled PP obtained from post-consumer feedstock for the manufacture of food contact materials and articles, the materials need to be proven to be safe and not transfer contaminants to the food. One way to achieve this is to process the feedstock through a cleaning (decontamination) technology to remove any such contaminants. This report provides information obtained during testing of polypropylene (PP) materials. The report ‘Development of a Food Grade Recycling Process for Post-Consumer Polypropylene’ describes a series of challenge test trials that were performed on virgin polypropylene using a number of specifically selected recycling technologies and processes. For the avoidance of doubt, the intention of the work was to find a process/processes capable of meeting the objectives of the project. No direct comparison of individual decontamination technologies can be drawn from the tables and information published throughout this report. The processes in this study were tested under different conditions, using different methodologies and are therefore not directly comparable. The Fraunhofer Institute for Process Engineering and Packaging (Fraunhofer IVV) was engaged to prepare the challenge test trial PP materials. The material preparation included mixing of the surrogate compounds (toluene, chlorobenzene, benzophenone, phenyl cyclohexane, n-hexyl salicylate and isopropyl myristate at nominal concentrations of approximately 500 – 1,000 mg/kg into a drum containing 50Kgs of virgin (white-coloured) PP flakes. Pira International Ltd a UK based analytical testing organisation was selected to perform the extraction and migration studies on the challenge tested polypropylene flakes and pellets from trials performed on the decontamination systems used in this project. The data in this analytical report has been prepared for Nextek Ltd by I. Cooper and D. Sullivan and is obtained from Pira research reports 11A11J1298 (Generation of Challenge Test Data on Polypropylene Flakes and Pellets) and 11A11J1306 (Migration of surrogate compounds into 95% and 10% ethanol from challenge tested polypropylene) This report contains two sections, which provide the data from the analytical work performed by Pira and include:
Appendix A: Generation of Challenge Test Data.
Appendix B: Migration of Surrogate Compounds.

Data from Extraction & Migration Tests 7
1.0 Challenge Test Decontamination Trial Sequence and Methodology The following flowchart shows the eight trials that were performed in this project. The challenge test material prepared by the Fraunhofer IVV was sent in air-tight steel drums to OHL, Gneuss and Company A (who later requested to remain anonymous) where it was devolatilised, extruded and melt filtered. Samples from each trial were collected, labelled and sent to Pira International for analysis. This trial methodology was developed to allow an assessment of the performance of individual extrusion systems under specific processing conditions and also to allow an assessment of flake decontamination in the OHL vacuum reactor over a measured period of time. This provided results of the impacts of time on decontamination efficiency of PP flake under constant vacuum at a determined temperature. This project explored novel decontamination processes for recycling of PP via:
Company B Extruder was investigated for the removal of printed PP based on past performance in this area.
The extruder has a very high devolatilisation surface area.
Extruder Company A was investigated due to its screw and vacuum degassing configuration.
The OHL rotary vacuum reactor, which allows for high vacuum devolatilisation and controllable residence time
for flakes and pellets.
The Gneuss MRS extruder, which is a single screw system with a counter flow multi-screw devolatilisation
zone, that gives extended residence time in the multi-screw extrusion section under a high vacuum
devolatilisation pump.
The flowchart shown in Figure 1 shows a sequence of trials that measure the decontamination performance of the stand-alone selected technologies on the PP challenge test material.
Fraunhofer challenge test flake extruded on the Company A Extruder (Trial 1: F/A).
Fraunhofer challenge test flake decontamination using OHL Vacuum Reactor (Trial 3: F/O).
Fraunhofer challenge test flake extruded on the Gneuss Multi Rotation System (Trial 4: F/G).
Trial 2 (F/O/A) was conducted on the Fraunhofer challenge test flake decontamination using OHL Vacuum Reactor followed by the Company A extrusion process. The chart also shows that two trials were performed to assess the effects of reversed decontamination equipment sequence on decontamination efficiency.
Fraunhofer challenge test flake extruded on the Gneuss Multi Rotation System and the pellets decontaminated
using the OHL Vacuum Reactor (Trial 5: F/G/O).
Fraunhofer challenge test flake decontaminated using OHL Vacuum Reactor and then extruded on the Gneuss
Multi Rotation System (Trial 6: F/O/G).

Data from Extraction & Migration Tests 8
Figure 1. Flowchart showing the trials performed with the three technologies to decontaminate PP challenge test flake and printed PP packaging.
1.1 Challenge
1.1 Decontamination Trial Sequence This section describes the sequence of six challenge tests that were designed to test the decontamination efficiency of the three selected processes, both as stand alone units of operation and also as a combination of processes. Trial 1: (F/A) was performed by extruding the Fraunhofer prepared challenge test material through the Company A extruder. This trial analysed the decontamination performance of a system under standard processing conditions, which are described in the following sections of this report. Trial samples from the trial were collected and sent to Pira for extraction analysis of surrogate compounds to determine decontamination efficiency. Trial 2: (F/O/A) was performed by decontaminating the Fraunhofer prepared challenge test material in the OHL rotary vacuum reactor over a measured period of time, under vacuum and at temperature. After decontamination in the OHL system the material was extruded and further decontaminated using the Company A extruder with vacuum and at high temperature. Trial samples from the trial were collected and sent to Pira for extraction analysis of surrogate compounds to determine decontamination efficiency. Trial 3: (F/O) was performed by decontaminating the Fraunhofer prepared challenge test material in the OHL rotary vacuum reactor over a measured period of time, under vacuum and at temperature. Trial samples from the trial were collected over specific periods of time and sent to Pira for extraction analysis of surrogate compounds to determine changes in decontamination efficiency over a period of time. Trial 4: (F/G) was performed by extruding the Fraunhofer prepared challenge test material through the Gneuss MRS extruder. This trial analysed the decontamination performance of a single screw extrusion system, which uses a counter flow rotating multi screw section. The trial was performed under standard processing conditions and is described in the following sections in detail. Trial samples from the trial were collected and sent to Pira for extraction analysis of surrogate compounds to determine decontamination efficiency.

Data from Extraction & Migration Tests 9
Trial 5: (F/G/O) was performed by extruding the Fraunhofer prepared challenge test material through the Gneuss MRS extruder. The processed material (in pellet format) was then sent to OHL where it was placed inside the vacuum reactor and decontaminated over a period of 6 hours under vacuum at a low temperature. Samples from the trial were collected before the OHL trial and at the end of it and sent to Pira for extraction analysis of surrogate compounds to determine decontamination efficiency. Trial 6: (F/O/G) was performed by decontaminating the Fraunhofer prepared challenge test material in the OHL rotary vacuum reactor over a measured period of time, under vacuum and at temperature. After decontamination in the OHL system the material was extruded and further decontaminated at high temperatures and under high vacuum through the Gneuss MRS extrusion system. Samples from the trial were collected over specific periods of time and sent to Pira for extraction analysis of surrogate compounds to determine decontamination efficiency. 1.2 Description of Devolatilisation Trials of Printed PP Materials Two additional trials specifically addressed different types of printing and labelling: Trial 7: (PP/DP/B) In this trial, directly printed PP flakes were processed through the Company B extruder to devolatilise and remove ink based volatiles and by-products via the high vacuum pump. Filtration of expected solid printing ink residues by-products was performed with a 100 m screen to ensure effective removal of any degraded ink pigments. Samples of pelletised PP resin were collected and sent to Pira to perform screening tests to identify the presence of residual substances in the polymer. Trial 8: (PP/IML/B) Run the PP flakes with in-mould labels through the Company B extruder to decontaminate and remove inks and ink based volatiles and by-products via the high vacuum pump. Filtration of expected solid printing ink residue by-products was performed down to 100 m to ensure effective removal of any degraded ink pigments. Samples of pelletised PP resin were collected and sent to Pira to perform screening tests to identify presence of residual substances in the polymer.

Data from Extraction & Migration Tests 10
1.3 Purpose of a Challenge Test The objective of a challenge test is to simulate the very worst-case contamination conditions that might be encountered during consumer use or misuse. In reality the number of containers that may be affected by consumer misuse would typically be very low however, as PP is also widely used for non-food packaging applications and there is documented presence of substances from detergent, personal care and household industrial chemical containers present in the material a challenge is needed to test that a recycling process can clean the material to European regulatory requirements. In a typical challenge test, the level of contaminants used (typically 500-750 ppm) and the quantity used (55 kg in one charge of the decontaminating process) would represent an event that is never likely to happen in normal processing of post-consumer packaging materials. The contaminants expected from consumer misuse are typically materials such as oils, fuels such as petrol, herbicides and pesticides as well as weed killers. These materials are not used in challenge tests but replaced by less harmful surrogate chemicals that represent these potential contaminants. A range of volatile and non-volatile compounds that are polar and non polar have been selected by the USFDA, ILSI and the Fraunhofer IVV as being good surrogates for these more harmful chemicals. The standard challenge test procedure is for the surrogates to be mixed into the flake material and allowed to be absorbed into the material over a period of 10 days at a temperature of 40C, simulating worst possible conditions. 1.3.1 Conducting the Decontamination Test Once the processing equipment is purged and running in a steady-state, the PP material containing the selected chemical surrogates is added as quickly as possible. During the run the processing conditions including residence times, temperatures and pressures / vacuums are recorded and samples taken at appropriate stages accounting for peak levels of the surrogate chemicals for analysis. After decontamination of the challenge test flake through a recycling process, the materials are collected in glass jars sealed with aluminium foil to ensure no change to the contamination of the materials occurs before the analytical tests are carried out. The decontaminated materials are tested for the presence of the surrogate chemicals through extraction techniques and analysis is then carried out to determine the residual levels. The extraction tests are conducted on the flakes or pellets and if required bottle or plaques using GCMS-FID techniques. If levels are sufficiently low (i.e. not detectable) then no further proof is needed. If residual levels are detected then migration tests are carried out on finished articles to comply with EFSA and USFDA regulations. Less than 10 ppb migration is the criterion for deciding if the material is food contact compliant. Where required bottles or plaques are made from the decontaminated pellets and are subjected to a migration test using simulants such as 10%, 50% or 95% v/v ethanol/water under well defined test conditions (i.e. 10 days at 20°C) relevant to a product type (aqueous, acidic, fatty) and its expected shelf life as these parameters determine the level of migration that is likely to occur. A migration test is usually performed, as this information is often needed for EFSA/USFDA submissions to obtain process approval from EFSA or a letter of non-objection from the US FDA. 1.4 Preparation of PP Challenge Test Flake Virgin, white coloured PP flake was obtained from Faerchplast for the challenge test preparation. The flake came from PP sheet regrind used by Faerchplast for the manufacture of white PP tubs, which are sold into the UK market. Virgin material was used to ensure that there was no chance of contamination of the test materials from unknown chemicals or chemical compounds that could interfere with the challenge test integrity and give false results. Due to the potential presence of compounds such as n-hexyl salicylate and isopropyl myristate from non-food PP containers a decision was made by WRAP and Nextek to add these surrogates into the challenge test and mix them together with surrogates normally used for challenge tests of PET and HDPE recycling processes. The challenge test flake preparation was performed by the Fraunhofer IVV (Institute for Process Engineering and Packaging) and involved mixing of the surrogate compounds (toluene, chlorobenzene, benzophenone, phenyl cyclohexane, n-hexyl salicylate and isopropyl myristate at nominal concentrations of approximately 500 – 1,000 mg/kg in 2 drums each containing 50Kgs of virgin (white-coloured) PP flakes. The 100 Kg of white PP material was steeped in this cocktail of typical surrogates over a period of 7 days at 60 °C and mixed daily to allow surrogate chemicals to be well distributed and fully absorbed by the flakes.

Data from Extraction & Migration Tests 11
Table 1. Surrogates used to contaminate PP challenge test flake
Materials Category
White PP flake
Base material
Toluene
Volatile Non Polar
Benzophenone
Non Volatile Polar
Chlorobenzene
Volatile Polar
Methyl stearate
Non Volatile Non Polar
Phenylcyclohexane
Non Volatile Non Polar
n-Hexyl Salicylate High Molecular Wt High Boiling Point
Iso-Propyl Myristate High Molecular Wt High Boiling Point
These surrogates cover a range of chemical types and behaviour with respect to polarity, volatility, molecular weights, boiling points and solvent power as applied to the specific plastic test material, PP. Washing trials of the PP challenge test flake were not performed in this project so that a worst-case contamination scenario was tested in the decontamination trials.

Data from Extraction & Migration Tests 12
Appendix A: Generation of Challenge Test Data on Polypropylene Flakes and Pellets 2.0 Extraction Study & Test Background In order to use recycled PP obtained from post-consumer feedstock for the manufacture of food contact materials and articles, the materials need to be proven to be safe and not transfer contaminants to foods or beverages. During the recycling of plastics, one way this is achieved is that the feedstock is processed through a cleaning procedure, which efficiently removes any contaminants that may be present in the polymer by using a range of steps that could include washing, mechanical abrasion, thermal desorption and migration. To establish that potential contaminants are removed by the recycling process it is necessary to perform trials and tests during which PP material is artificially dosed (Challenge Test) with a range of surrogate chemical compounds and then subjected to the cleaning process. Analysis of the cleaned material for the presence of the surrogate chemicals is then carried out to determine the residual levels. If levels of the chemical compounds are found to be sufficiently low then no further proof is needed. If residual levels are detected during analysis then migration tests are carried out on finished articles such as moulded plaques, trays or bottles and, for a satisfactory result, < 10 ppb migration into a food simulant is needed under European regulatory requirements. The challenge test data shows the level of decontamination of the spiked chemicals achieved by the recycling process. Determination of levels of surrogate chemicals in the samples collected during each recycling trial of the challenge tested polypropylene material was performed by extracting the surrogates from the flake and pellet materials. Samples containing pellets from extrusion and devolatilisation Trials 7 and 8 of polypropylene packaging containing printed flake and printed in mould labels were screened for contaminants that could be present, such as degraded ink residues. Protocols that have been drawn up covering this entire procedure for PET ‘Guidance and criteria for safe recycling of post-consumer polyethylene terephthalate into new food packaging applications’ R. Franz, F. Bayer and F. Welle, EU Contract No. FAIR-CT98-4318 : RECYCLABILITY. In this current study these same protocols have been applied to polypropylene, except that methyl stearate has been removed as a surrogate and replaced by n-hexylsalicylate and isopropylmyristate to simulate the presence of the last two chemicals in the post-consumer PP stream. Chromatograms obtained for the PP challenge samples are illustrated in Figures 1-13 of this Appendix. The extraction results are given in Table A-10. Extruded samples of the printed packaging were submitted for screening and were also analysed for surrogates and all replicates gave not detectable results. They were tested and the screening results for Trial 7, sample 3 (PP/DP/E) and Trial 8, sample 4 (PP/IML/E) are shown in Figures 14-15 of this Appendix. 2.1 Extraction Study Objectives The objectives of the extraction studies on the challenge test polypropylene samples were to determine levels of surrogate chemicals present in the polypropylene samples and to screen two separate samples for contaminants with ink residues from labels and direct print. 2.2 Experimental work: Analysis of the Chemically Spiked PP Flake and Pellets Triplicate samples of the flakes and pellets (≈5 g) were analysed for surrogate levels. These samples were extracted in 25 ml of tetrahydrofuran (THF) by heating in sealed vials at 60°C for 3 days. After shaking, the supernatant liquid was filtered and transferred to a 2 ml volumetric flask to which 20 µl of the internal standard had already been added. After mixing the solution was then transferred to a vial and injected for GC/MS analysis to determine the surrogate levels. Two mixed stock calibration standards were prepared by dissolving the substances in propan-2-ol as given in Table A-1. A diluted stock was prepared by dilution of 1 ml of the stock solution to 10 ml with propan-2-ol.

Data from Extraction & Migration Tests 13
Table A-1. Stock 1 for spiking and stability
Surrogate Stock conc. mg/l Diluted stock mg/l Toluene 1062 106.2 Chlorobenzene 1258 125.8 Benzophenone 796 79.6 Phenylcyclohexane 1276 127.6 Hexyl salicylate 1256 125.6 Isopropylmyristate 938 93.8
Table A-2. Stock 2 for standards
Surrogate Stock conc. mg/l Diluted stock mg/l Toluene 1024 102.4 Chlorobenzene 944 94.4 Benzophenone 1222 122.2 Phenylcyclohexane 1064 106.4 Hexylsalicylate 1180 118.0 Isopropylmyristate 1046 104.6
Table A-3. Stock 3 showing levels used for spiking
Surrogate Stock conc. mg/l Toluene 20974 Chlorobenzene 21776 Benzophenone 21048 Phenylcyclohexane 25562 Hexylsalicylate 19930 Isopropylmyristate 21500
An internal standard mixed solution was prepared containing toluene-d8, chlorobenzene d5, and benzophenone- d10,. The calibration working standards were prepared by adding 0, 10, 25, 50, 100, 250, 500, 1000 µl of the diluted stock solution 2, plus 100 µl of the internal standard solution to 10 ml of THF, giving the quantities in Table A-4 in µg/ml.
Table A-4.
Surrogate Amount in µg/ml Std 0 Std 1 Std 2 Std 3 Toluene 0 0.102 0.256 0.512 Chlorobenzene 0 0.094 0.234 0.472 Benzophenone 0 0.122 0.306 0.611 Phenylcyclohexane 0 0.106 0.266 0.532 Hexyl Salicylate 0 0.118 0.295 0.59 Isopropyl Myristate 0 0.105 0.262 0.523
Surrogate Amount in µg/ml Std 4 Std 5 Std 6 Std 7 Toluene 1.024 2.56 5.12 10.24 Chlorobenzene 0.944 2.34 4.72 9.44 Benzophenone 1.222 3.055 6.11 12.22 Phenylcyclohexane 1.064 2.66 5.32 10.64 Hexyl Salicylate 1.18 2.95 5.90 11.8 Isopropyl Myristate 1.046 2.615 5.23 10.46

Data from Extraction & Migration Tests 14
Stronger calibration working standards were prepared by adding 0.5,1.0 and 2.0 ml of the stock solution 2 plus 100 µl of the internal standard solution to 10 ml of THF, giving the quantities in Table A-5 in µg/ml.
Table A-5.
Surrogate Amount in µg/ml Std 8 Std 9 Std 10 Toluene 51.2 102.4 204.8 Chlorobenzene 47.2 94.4 188.8 Benzophenone 61.1 122.2 244.4 Phenylcyclohexane 53.2 106.4 212.8 Hexyl Salicylate 59 118 236 Isopropyl Myristate 52.3 104.6 209.2
2.2.1 Test Procedure Conditions The samples and standards were injected for GC/MS analysis using the following instrumental conditions: Column: 30 m x 0.25 mm HP5-MS; 30 m x 0.25 mm i.d MS 0.5 µm. Oven: 35°C hold 3 min, programmed to 250°C at 10°C/min hold 2 min. Injection Split ratio: 20.1 - 240°C. Detector SIM ions: (m/z) 91, 98, 99, 77, 112, 118, 104, 117, 105, 120, 182, 192, 102, 228. Retention time: (min) Toluene 5.2 Chlorobenzene 6.8 Phenylcyclohexane 14.9 Benzophenone 18.8 Hexyl Salicylate 19.3 Isopropyl Myristate 20.8 A calibration graph was drawn up of peak area ratio for the analyte and divided by an appropriate deuterated internal standard against µg/ml of analyte or, in the case of hexylsalicylate, isopropylmyristate and phenylcyclohexane the peak areas were divided by deuterated benzophenone peak area. The μg/ml values interpolated from the graphs for the sample extracts were multiplied by a factor of 25 and divided by the exact mass of polymer extracted to obtain the residual concentration in the polymer in mg/kg. Blank flakes used as control (virgin PP) samples (Sample 14) were spiked by adding 25 µl, 50 µl and 500 µl of the diluted stock solution 1 shown in Table A-1 to 5g of blank flake sample and extracted using THF for 3 days at 60°C. This is equivalent to nominal concentrations of about 0.5, 1.0 and 10 mg/kg in the polymer. Blank flakes (Sample 14) were also spiked by adding 100 µl of the stock solution 3 (Table A-1) to 5 g of blank flake and extracted using THF for 3 days at 60°C. This is equivalent to nominal concentrations of about 400 mg/kg in the polymer. Stability tests were set up by adding 250 µl (of stock solution 1) to 25 ml of THF and extracted for 3 days at 60°C. This is equivalent to nominal concentrations of about 10 mg/l in solution.
2.3 Screening of Printed PP Packaging Sample 3 from Trial 7 (PP/DP/E) and sample 4 from Trial 8 (PP/IML/E) were extracted with THF and analysed as described in Section 5.1 for surrogates. In addition, the two samples were screened for other contaminants by headspace GC/MS to look for volatiles and solvent extraction GC/MS to look for less volatile contaminants.
2.3.1 Headspace GC/MS Test Conditions 1 g of each sample (in triplicate) was weighed into headspace vials and sealed. The samples were injected by headspace for GC/MS analysis using the following instrumental conditions: Column: Optima 624LB 30 m x 0.32 mm i.d. 1.8 µm Oven: 40°C hold 2 min, programmed to 280°C at 10°C/min hold 4 min. Injection Split ratio: 10:1 280°C Detector: MS SCAN m/z 12 - 400 Incubation: 120°C for 1 h.

Data from Extraction & Migration Tests 15
2.3.2 Solvent Extraction GC/MS Test Conditions 10 g of each sample (in triplicate) was weighted into a vial with 10 ml of ethanol. The samples were placed in an incubator at 40°C for 48 hours. The extracts were then injected for GC/MS analysis in the full scan mode. Column: 30 m x 0.25 mm HP5-MS 0.25 µm. Oven: 40°C hold 2 min, programmed to 320°C at 10°C/min hold 15 min. Injection Splitless: 320°C Carrier gas: He 1 ml/min Detector: SCAN 12 - 750 2.4 Extraction Study Results: Analysis of the PP Pellets and Flake for Surrogates The calibration lines were found to be linear with a correlation coefficient of 0.998 or better. Figures 1-13 in this Appendix illustrate typical chromatograms. The results are given in Table A-10. Values in µg/ml for the test samples were interpolated from the calibration graph, divided by the mass of PP pellets and flakes (≈5 g) taken and multiplied by 25 (ml) to give the concentration of each surrogate in the PP in mg/kg. Printed materials from Trials 7 (PP/DP/E) sample 3, and 8 (PP/IML/E) sample 4, submitted for screening were also analysed for surrogates and all replicates gave no detectable results. Values in µg/ml for the test samples were interpolated from the calibration graph, divided by the mass of PP pellets and flakes (≈5 g) taken and multiplied by 25 (ml) to give the concentration of each surrogate in the PP in mg/kg. The limits of detection (LOD’s) were estimated from the calibration graph y-residuals and are equivalent to 3 x standard deviation of the blank. Pira have reported that these values are considered to be conservative.
Table A-6. Extraction results for all 13 samples including Sample 14 virgin PP blank comparison sample.
Table 6. Extraction into THF 72 hours 60˚C Sample 1 (Control sample test ‘PP Challenge Test Flake’ Sample 1 input Trial F/A) Contaminated
Sample 2 (‘Company A rPP trial Challenge Test Flake Rt + 5 Mins Trial F/A)
Sample 5 (‘OHL-Company A PP Trial (Rt +3Mins) Trial F/O/A

Data from Extraction & Migration Tests 16

Data from Extraction & Migration Tests 17
The limits of detection (LOD’s) were estimated from the calibration graph y-residuals and are equivalent to 3 x standard deviation of the blank. These values are considered to be conservative. During the analysis, the sensitivity of the technique was established by the use of calibration samples of the actual surrogate compounds. The ratio of the analytical result over the calibration concentration is known as the recovery rate. The specification for the challenge tests that the recovery rate must be in the range 85% to 115%. The recovery rates (and their averages) for the surrogate compounds as shown in Table A-7a/b and A-8 show that the procedure used to extract the surrogates is accurate and reproducible. Table 7a gives the recovery values obtained on spiking the blank polymer flake sample with surrogates at nominal levels of ~50 μg (equivalent to about 10 mg/kg in the polymer). The % recoveries were calculated by multiplying 100 x the quantity analyte interpolated from graph and dividing by the amount of analyte added (μg).

Data from Extraction & Migration Tests 18
Table A-7a. Recoveries calculated from spiked blank (Sample 14)
Surrogate Recovery results % (0.5 mg/kg)
Recovery results % (1.0 mg/kg)
Recovery results % (10 mg/kg)
Toluene 105 98 116 84 99 105 87 92 107
Chlorobenzene 98 85 116 76 88 104 74 87 102
Phenylcyclohexane * 64 114 * 66 101 * 67 96
Benzophenone * * 108 * * 95 * * 91
Hexyl Salicylate
* * 113
* * 101 * * 97
Isopropyl Myristate
* * 80 * * 71 * * 67
* Recoveries scattered due to levels less than or near LOD. Table 7b gives the recovery values obtained on spiking the blank polymer flake sample with surrogates at higher levels equivalent to about 400 mg/kg in the polymer. The % recoveries were calculated by multiplying 100 x the analyte concentration interpolated from graph and dividing by the concentration of analyte added (μg/ml).
Table A-7b. Recoveries calculated from spiked blank (Sample 14)
Surrogate Recovery results %
Toluene 109 105 107
Chlorobenzene 105 99 102
Phenylcyclohexane 102 99 100
Benzophenone 101 96 100
Hexyl Salicylate
99
95 100
Isopropyl Myristate
94 91 96
Data from Extraction & Migration Tests 19
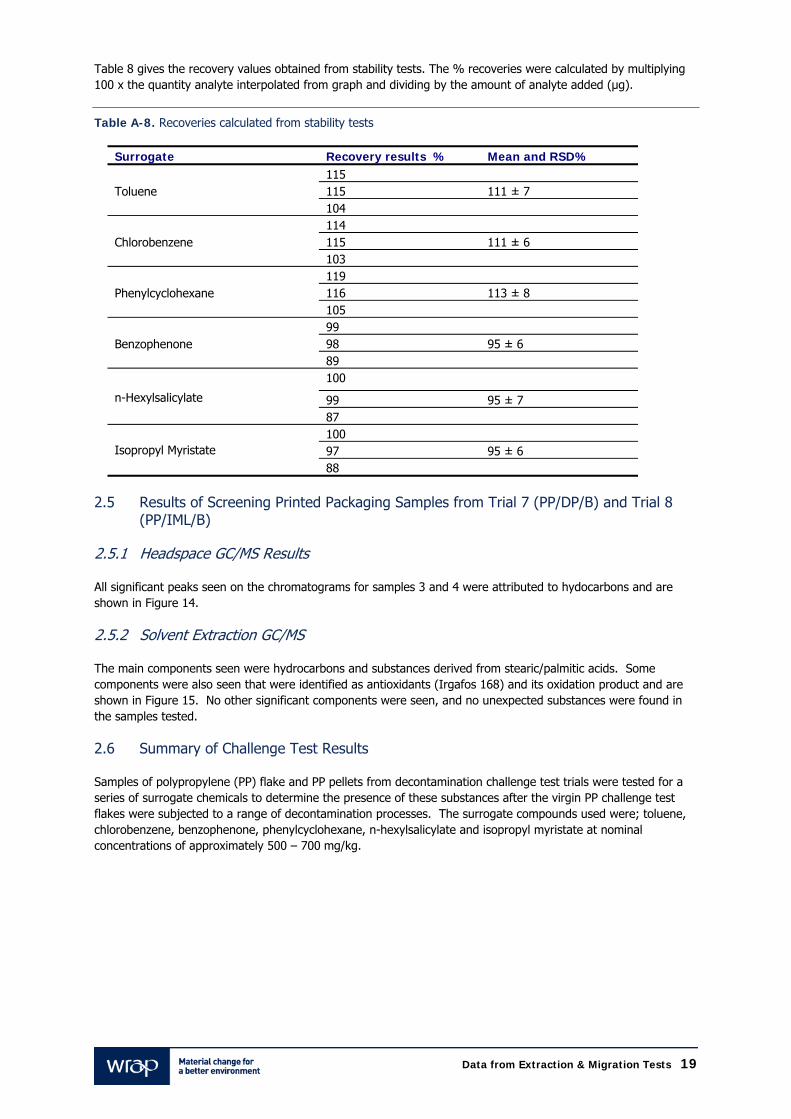
Table 8 gives the recovery values obtained from stability tests. The % recoveries were calculated by multiplying 100 x the quantity analyte interpolated from graph and dividing by the amount of analyte added (μg).
Table A-8. Recoveries calculated from stability tests
Surrogate Recovery results % Mean and RSD%
Toluene 115 115 111 ± 7 104
Chlorobenzene 114 115 111 ± 6 103
Phenylcyclohexane 119 116 113 ± 8 105
Benzophenone 99 98 95 ± 6 89
n-Hexylsalicylate
100
99 95 ± 7 87
Isopropyl Myristate
100 97 95 ± 6 88
2.5 Results of Screening Printed Packaging Samples from Trial 7 (PP/DP/B) and Trial 8
(PP/IML/B) 2.5.1 Headspace GC/MS Results All significant peaks seen on the chromatograms for samples 3 and 4 were attributed to hydocarbons and are shown in Figure 14. 2.5.2 Solvent Extraction GC/MS The main components seen were hydrocarbons and substances derived from stearic/palmitic acids. Some components were also seen that were identified as antioxidants (Irgafos 168) and its oxidation product and are shown in Figure 15. No other significant components were seen, and no unexpected substances were found in the samples tested. 2.6 Summary of Challenge Test Results Samples of polypropylene (PP) flake and PP pellets from decontamination challenge test trials were tested for a series of surrogate chemicals to determine the presence of these substances after the virgin PP challenge test flakes were subjected to a range of decontamination processes. The surrogate compounds used were; toluene, chlorobenzene, benzophenone, phenylcyclohexane, n-hexylsalicylate and isopropyl myristate at nominal concentrations of approximately 500 – 700 mg/kg.

Data from Extraction & Migration Tests 20
Table A-9. List of control material, challenge test material and printed material samples analysed from the 8 trials performed during the project
Sample No.
Test Trial Sample identification
1 Surrogate analysis Input Trial 1 (F/A)
Trial input material - control sample ‘PP challenge test flake’
2 Surrogate analysis Trial 1 (F/A)
‘Company A rPP Trial (Rt+5mins)’ Challenge test
3 Screening Trial 7 (PP/DP/B)
‘Company B PP Trial IMP-PP Sample 3’
4 Screening Trial 8 (PP/IML/B)
‘Company B PP Trial TFP-PP Sample 3’
5 Surrogate analysis Trial 2 (F/O/A)
‘OHL-Company A PP trial (Rt+3mins)’ Challenge test
6 Surrogate analysis Input Trial 3 (F/O)
Trial input material - control sample ‘PP Challenge Test Flake’ - Sample 2
7 Surrogate analysis Trial 3A (F/O)
‘OHL Flake-Sample 4’ - (Sample taken at 13.00) Challenge test
8 Surrogate analysis Trial 3B (F/O)
‘OHL Flake-Sample 7’ - (Sample taken at 15.30) Challenge test
9 Surrogate analysis Input Trial 4 (F/G)
Gneuss Trial control sample test ‘PP challenge test flake’
10 Surrogate analysis Trial 4 (1) (F/G)
‘Gneuss Trial’ Sample 4 (Rt+10mins)’ Challenge test
11 Surrogate analysis Trial 5 (F/G/O)
‘Gneuss –OHL trial’ ‘Sample 6’ (4hrs) Challenge test
12 Surrogate analysis Trial 4 (2) (F/G)
Input material for Trial 5 - (Repeat of sample 10)
13 Surrogate analysis Trial 6 (F/O/G)
‘OHL treated flake – Gneuss Sample 8 (Rt+12mins)’ Challenge test
14 Blank comparison Virgin PP flake input material * Where: blue denotes a challenge test trial, green denotes a trial on printed material and clear denotes control samples The 14 material samples were analysed for levels of the remaining surrogates by extraction using THF (tetrahydrofuran) for 72 h at 60°C followed by GC/MS analysis. The analyses were validated by spiking blank flakes (Sample 14) with each of the analytes at different levels and calculation of the recoveries (i.e. procedure consistency).
Data from Extraction & Migration Tests 21
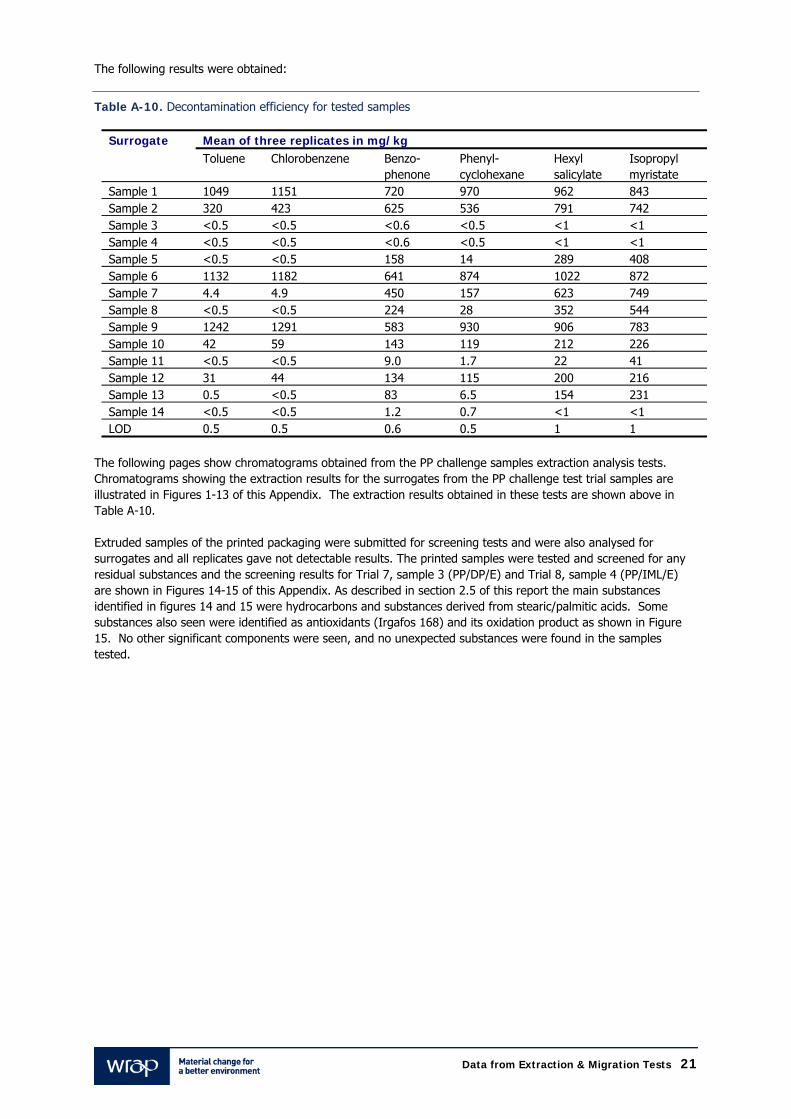
The following results were obtained:
Table A-10. Decontamination efficiency for tested samples
Surrogate Mean of three replicates in mg/kg Toluene Chlorobenzene Benzo-
phenone Phenyl-cyclohexane
Hexyl salicylate
Isopropyl myristate
Sample 1 1049 1151 720 970 962 843 Sample 2 320 423 625 536 791 742 Sample 3 <0.5 <0.5 <0.6 <0.5 <1 <1 Sample 4 <0.5 <0.5 <0.6 <0.5 <1 <1 Sample 5 <0.5 <0.5 158 14 289 408 Sample 6 1132 1182 641 874 1022 872 Sample 7 4.4 4.9 450 157 623 749 Sample 8 <0.5 <0.5 224 28 352 544 Sample 9 1242 1291 583 930 906 783 Sample 10 42 59 143 119 212 226 Sample 11 <0.5 <0.5 9.0 1.7 22 41 Sample 12 31 44 134 115 200 216 Sample 13 0.5 <0.5 83 6.5 154 231 Sample 14 <0.5 <0.5 1.2 0.7 <1 <1 LOD 0.5 0.5 0.6 0.5 1 1
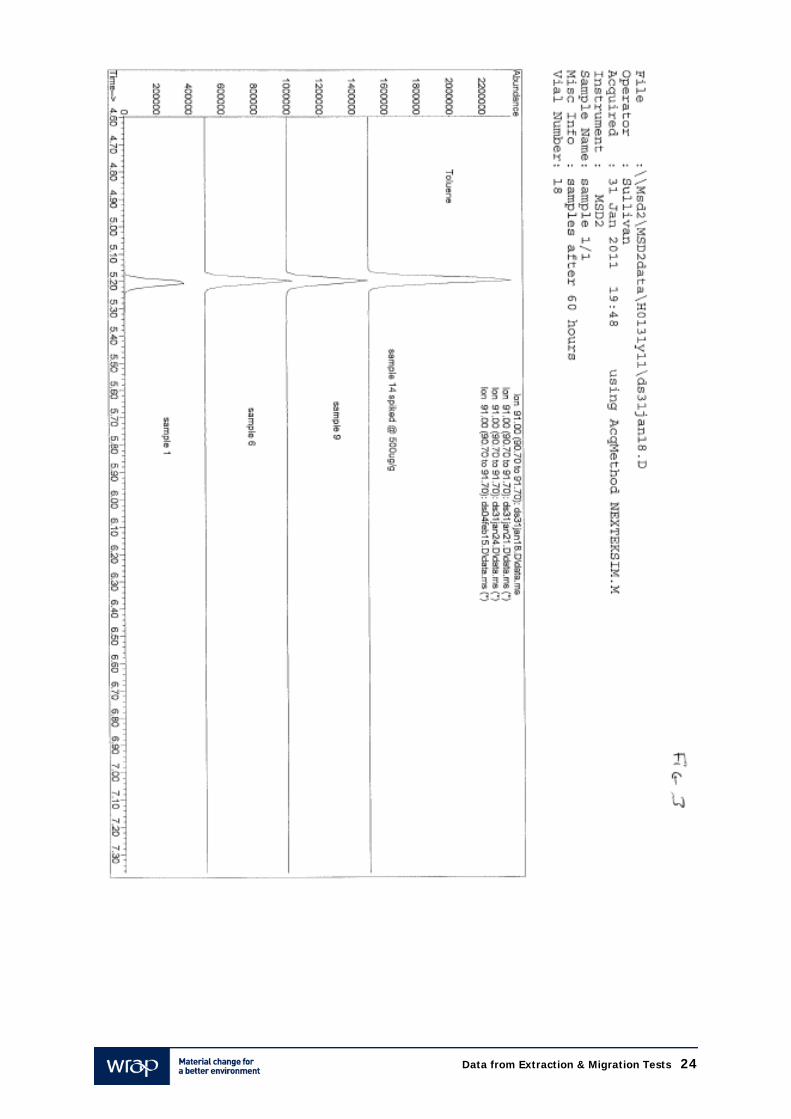
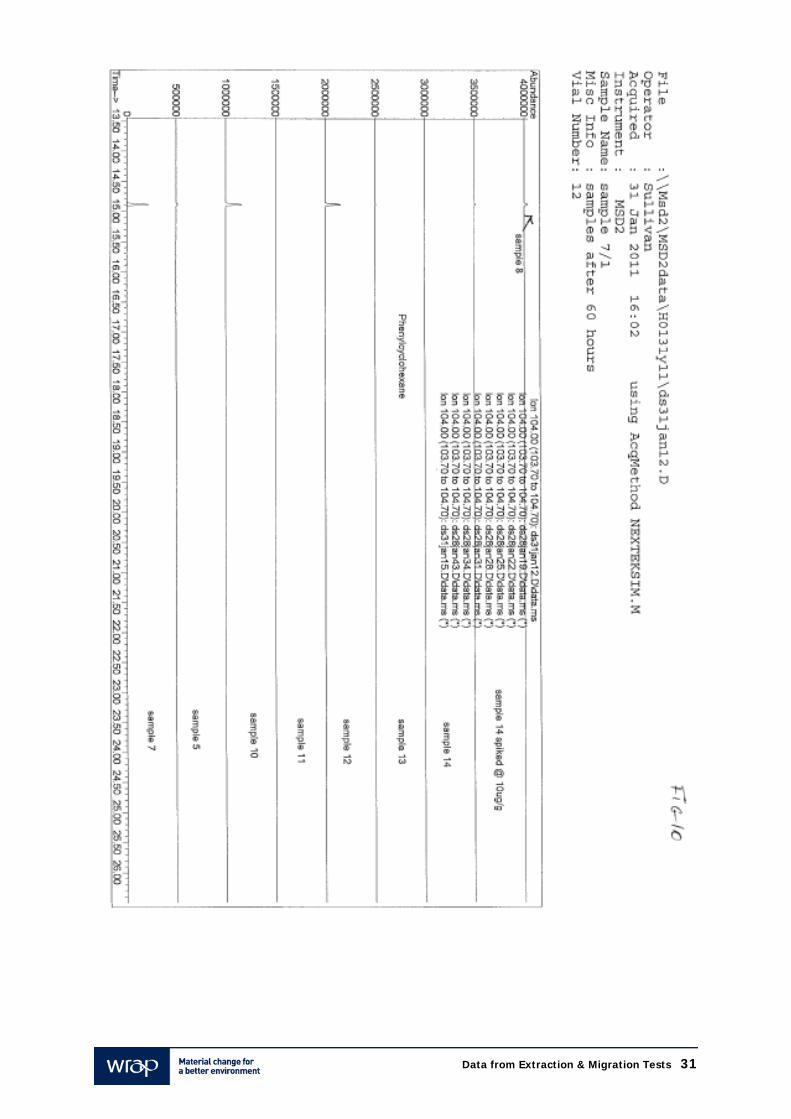
The following pages show chromatograms obtained from the PP challenge samples extraction analysis tests. Chromatograms showing the extraction results for the surrogates from the PP challenge test trial samples are illustrated in Figures 1-13 of this Appendix. The extraction results obtained in these tests are shown above in Table A-10. Extruded samples of the printed packaging were submitted for screening tests and were also analysed for surrogates and all replicates gave not detectable results. The printed samples were tested and screened for any residual substances and the screening results for Trial 7, sample 3 (PP/DP/E) and Trial 8, sample 4 (PP/IML/E) are shown in Figures 14-15 of this Appendix. As described in section 2.5 of this report the main substances identified in figures 14 and 15 were hydrocarbons and substances derived from stearic/palmitic acids. Some substances also seen were identified as antioxidants (Irgafos 168) and its oxidation product as shown in Figure 15. No other significant components were seen, and no unexpected substances were found in the samples tested.

Data from Extraction & Migration Tests 22

Data from Extraction & Migration Tests 23
Data from Extraction & Migration Tests 24

Data from Extraction & Migration Tests 25

Data from Extraction & Migration Tests 26

Data from Extraction & Migration Tests 27

Data from Extraction & Migration Tests 28

Data from Extraction & Migration Tests 29

Data from Extraction & Migration Tests 30
Data from Extraction & Migration Tests 31

Data from Extraction & Migration Tests 32

Data from Extraction & Migration Tests 33

Data from Extraction & Migration Tests 34

Data from Extraction & Migration Tests 35

Data from Extraction & Migration Tests 36
Data from Extraction & Migration Tests 37

Data from Extraction & Migration Tests 38

Data from Extraction & Migration Tests 39
Data from Extraction & Migration Tests 40

Data from Extraction & Migration Tests 41

Data from Extraction & Migration Tests 42

Data from Extraction & Migration Tests 43

Data from Extraction & Migration Tests 44

Data from Extraction & Migration Tests 45

Data from Extraction & Migration Tests 46
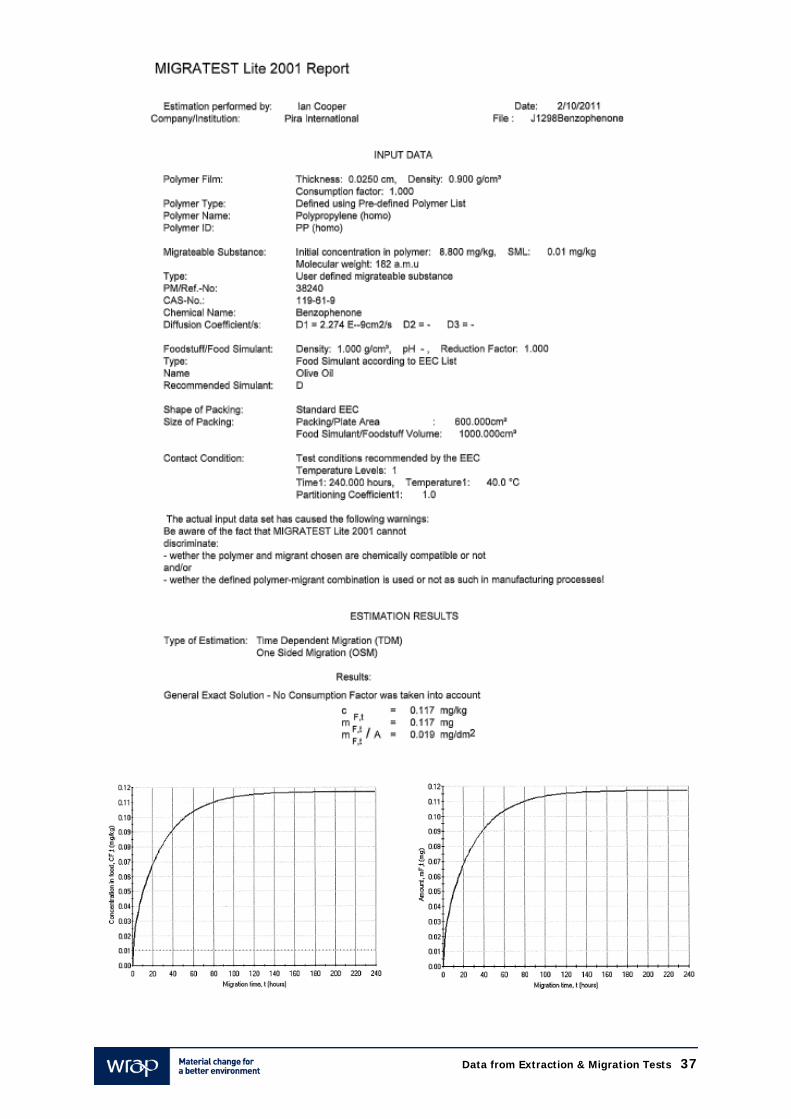
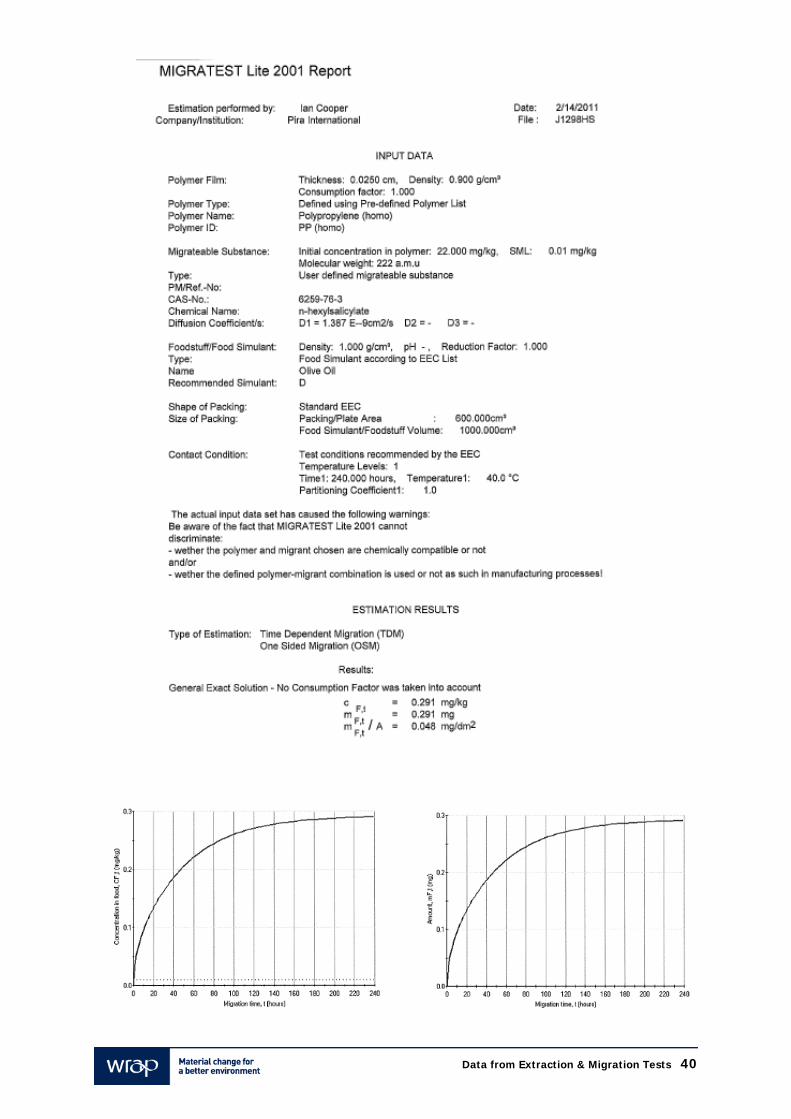
Appendix B: Migration of Surrogate Compounds into 95% and 10% Ethanol from Recycled Polypropylene. 3.0 Migration of Surrogates into Food Simulants The EU regulation EU 10/2011 requires that migration into food be less than 10 ppb under worst-case storage conditions. By defining the initial concentration of residual surrogate chemicals it is possible to then estimate if a recycled plastic can be used under a specific range of conditions and also to estimate the maximum % of recycled polymer could be used to satisfy the migration limit. The results obtained for sample 11 (Appendix A) allowed the use of a migration simulation program (Migratest) to be used to predict the potential migration of the higher molecular weight surrogates into olive oil as a food simulant under different conditions to help to decide the most appropriate migration tests to be subsequently conducted. The results are shown in Table B-1. The migration results for Toluene and Chlorobenzene were not tested since they were completely removed by the decontamination process.
Table B-1. Migration simulation for sample 11 from Trial 5 (F/G/O) for the key surrogates benzophenone, n-hexyl salicylate and isopropyl myristate
Surrogate Migration mg/kg at each test condition Sample 11 Trial 5 (F/G/O)
10 days 5°C 10 days at 20°C 10 days at 40°C
Benzophenone 0.021 0.063 0.117 Isopropyl myristate 0.058 0.176 0.517 n-hexylsalicylate 0.041 0.124 0.291
The migration test (Migratest) printouts are provided in Appendix A of this report. As the migration model is designed for compliance purposes it overestimates migration, so the values calculated are usually significantly overestimated. For butter and margarine a reduction factor of 2 needs to be applied to these results based on EU Regulation 10/20111 Considering the predicted values in the Migratest results, it was not likely that the migration of the substances would be less than 10 ppb for the 10 days at 40°C test condition with migration levels predicted to be greater than 100 ppb. It was however considered likely that test conditions of 10 days at 5°C would give values < 10 ppb, but results obtained at 20°C for 10 days were difficult to predict and would represent a challenging condition. In the migration studies performed on sample 11 from Trial 5 (F/G/O), 10% ethanol and 95% ethanol were selected as the most appropriate test simulants covering all aqueous, acidic and fatty foods. None of the surrogates studied were ‘acid sensitive’ therefore testing with 10% ethanol covered acidic foods. Moreover, Pira did not consider measurement of these substances in a vegetable oil down to low ppb levels to be feasible; therefore they selected 95% ethanol as the most appropriate alternative fat simulant as there is a significant amount of specific migration data showing a good correlation with olive/corn oil with polyolefins. The test conditions of 10 days at 20°C were chosen to cover the period up to 30 days storage at temperatures of up to 20°C.
1 COMMISSION REGULATION (EU) No 10/2011 of 14 January 2011 on plastic materials and articles intended to come into contact with food http://eur-lex.europa.eu/LexUriServ/LexUriServ.do?uri=OJ:L:2011:012:0001:0089:EN:PDF
Data from Extraction & Migration Tests 47
3.1 Experimental Work In order to perform migration studies, Nextek prepared injection moulded plaques from sample 11 in Trial 5 (F/G/O). As no toluene or chlorobenzene was detected and very low levels of the remaining surrogates were found, only phenyl-cyclohexane, benzophenone, hexyl salicylate and isopropyl myristate were tested during the migration analysis. 3.1.1 Migration Test Samples One set of plaques, from Sample 11 material, Trial 5 (F/G/O) were moulded in dimensions of 6 cm x 6 cm x 2mm thick square with an additional triangular area near gate 9 cm x 5 cm x 5 cm. 3.1.2 Migration Tests A square section 6 x 6 cm was cut from the samples for migration tests giving a surface area of 0.72 dm2 each. One plaque was placed in wide mouth jars containing either 72 ml of 10%v/v or 95% ethanol in triplicate. A blank jar was also set up containing blank food simulant only. Blank simulants, in triplicate, were spiked at levels between 30 and 50 ppb. These tests were stored for 10 days at 20°C alongside the migration tests. 3.1.3 Analysis - 10% Ethanol After exposure the plaques were removed and 25 ml of the 10% ethanol simulant transferred to 40 ml vials containing 1g of sodium sulphate. Deuterated Internal standard was added (250 μl benzophenone-d10) and then the mixed solution extracted with heptane. The heptane layer was transferred to a vial and injected for GC/MS analysis. 3.1.4 Analysis - 95% Ethanol After exposure the plaques were removed and 10 ml of the simulant transferred to 40 ml vials containing 20 ml of water and 1g of sodium sulphate. Deuterated Internal standard was added (100ul benzophenone-d10) and then the mixed solution extracted with heptane. The heptane layer was transferred to a vial and injected for GC/MS analysis. Two mixed stock calibration standards were prepared by dissolving the substances in propan-2-ol as given in Table B-2a and B-2b. A diluted stock was prepared by dilution of 100 μl of the stock solution to 10 ml with propan-2-ol.
Table B-2a. Stock 1 for stability
Surrogate Stock conc. mg/l Diluted stock mg/l Benzophenone 796 7.96 Phenylcyclohexane 1276 12.76 Hexyl salicylate 1256 12.56 Isopropylmyristate 938 9.38
Table B-2b. Stock 2 for standards
Surrogate Stock conc. mg/l Diluted stock mg/l Benzophenone 1222 12.22 Phenylcyclohexane 1064 10.64 Hexylsalicylate 1180 11.8 Isopropylmyristate 1046 10.46

Data from Extraction & Migration Tests 48
The calibration working standards were prepared by adding 0, 25, 60, 125 and 250 µl of the diluted stock solution 2 plus 250 µl of the internal standard solution to 25 ml of 10% ethanol, giving the quantities in Table B-3a in ppb.
Table B-3a. Calibration standards for 10% ethanol
Surrogate Amount in ppb Std 0 Std 1 Std 2 Std 3 Std 4 Benzophenone 0 12.2 29.3 61.1 122.2 Phenylcyclohexane 0 10.6 25.5 53.2 106.4 Hexyl Salicylate 0 11.8 28.3 59.0 118.0 Isopropylmyristate 0 10.5 25.1 52.3 104.6
The calibration working standards were prepared by adding 0, 10, 25, 50, 100 µl of the diluted stock solution 2 plus 100 µl of the internal standard solution to 10 ml of 95% ethanol, giving the concentrations in Table B-3b in ppb.
Table B-3b. Calibration standards for 95% ethanol
Surrogate Amount in ppb Std 0 Std 1 Std 2 Std 3 Std 4 Benzophenone 0 12.2 30.6 61.1 122.2 Phenylcyclohexane 0 10.6 26.6 53.2 106.4 n-Hexylsalicylate 0 11.8 29.5 59.0 118.0 Isopropylmyristate 0 10.5 26.2 52.3 104.6
The samples and standards were injected for GC/MS analysis using the following instrumental conditions: Column 30 m x 0.25 mm HP5-MS; 30 m x 0.25 mm i.d MS 0.5 µm. Oven 35°C hold 3 min, programmed to 250°C at 10°C/min hold 2 min. Injection Splitless 250°C. Detector SIM ions m/z 91, 98, 99, 77, 112, 118, 104, 117, 105, 120, 182, 192, 102, 228. Retention time (min): Phenylcyclohexane 14.9 Ion m/z104 Benzophenone 18.8 Ion m/z105 Hexyl Salicylate 19.3 Ion m/z120 Isopropyl myristate 20.8 Ion m/z102 A calibration graph was drawn up of peak area for each analyte divided by the deuterated internal standard against ppb of analyte. The ppb values interpolated from the graphs for the sample extracts were multiplied by a factor of 0.072 (volume taken for migration test in litres) and divided by the area of the plaque (0.72 dm2 taking both sides into account) to give the migration from the plaque in μg/dm2. This result was multiplied by 6 to give ppb in the food at the conventional EU packaging ratio of 6 dm2/kg. 3.2 Stability Tests in 10% and 95% Ethanol Table B-4a and B-4b give the recovery values obtained from stability tests. The % recoveries were calculated by multiplying 100 x the analyte concentration interpolated from graph and dividing by the concentration of analyte added (ppb).
Table B-4a. Recoveries calculated from stability tests in 10% ethanol
Surrogate Recovery results %
Mean and RSD %
Phenylcyclohexane 81 84 80 ± 5 75
Benzophenone 92 92 92

Data from Extraction & Migration Tests 49
92
Hexylsalicylate
42
44 47 ± 7 55
Isopropylmyristate
28 38 30 ± 6 26
Table B-4b. Recoveries calculated from stability tests in 95% ethanol
Surrogate Recovery results %
Mean and RSD %
Phenylcyclohexane 103 105 104 ± 1 104
Benzophenone 105 102 104 ± 2 106
Hexylsalicylate
118
109 112 ± 5 110
Isopropylmyristate
107 98 98 ± 10 88
3.3 Validation Experiments The following tables give the recovery values obtained from test solutions that were fortified with the analytes (at a concentration of interest ~ 10 ppb). The % recoveries were calculated by subtracting the concentration found in the unfortified solution from the concentration found in the fortified solution as interpolated from graph and dividing by the concentration of analyte added.
3.3.1 Validation for Surrogates in 10% Ethanol
Table B-5. Validation for phenylcyclohexane
Sample Spiked level Total found % Recovery Standard deviation %
ppb Sample spk1/1 10.64 10.65 100 Sample spk1/2 11.41 107 Sample spk1/3 11.04 104 Mean 104 3.6
Table B-6. Validation for benzophenone
Sample Spiked level Total found % Recovery Standard deviation %
ppb Sample spk1/1 12.2 14.30 94 Sample spk1/2 14.16 93 Sample spk1/3 14.66 96 Mean 952 1.7
2 Very small peak for benzophenone < LOD taken into account in calculation.

Data from Extraction & Migration Tests 50
Table B-7. Validation for n-hexylsalicylate
Sample Spiked level Total found % Recovery Standard deviation %
ppb Sample spk1/1 11.8 10.50 89 Sample spk1/2 10.68 91 Sample spk1/3 10.57 90 Mean 90 1
Table B-8. Validation for isopropylmyristate Sample Spiked level Total found % Recovery Standard
deviation % ppb Sample spk1/1 10.46 11.12 106 Sample spk1/2 11.14 107 Sample spk1/3 11.76 112 Mean 108 3.4 3.3.2 Validation for Surrogates in 95% ethanol
Table B-9. Validation for phenylcyclohexane Sample Spiked level Total found % Recovery Standard deviation
% ppb Sample spk1/1 10.64 10.18 96 Sample spk1/2 10.36 97 Sample spk1/3 10.51 99 Mean 97 2 Sample spk1/1 26.6 27.09 102 Sample spk1/2 24.21 91 Sample spk1/3 23.02 87 Mean 93 8
Table B-10. Validation for benzophenone Sample Spiked level Total found % Recovery Standard
Deviation % ppb Sample spk1/1 12.22 19.05 107 Sample spk1/2 19.77 109 Sample spk1/3 19.09 106 Mean 107 1.8 Sample spk1/1 30.55 35.9 98 Sample spk1/2 35.28 94 Sample spk1/3 36.24 98 Mean 97 2.2
Data from Extraction & Migration Tests 51
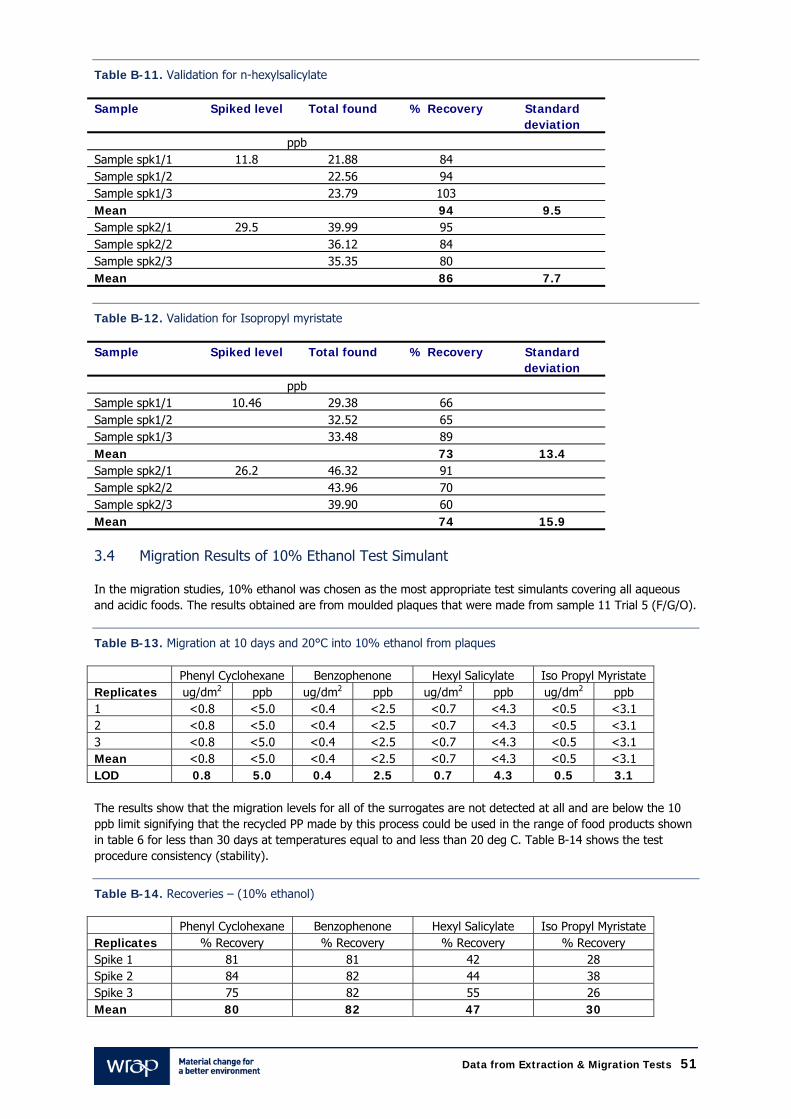
Table B-11. Validation for n-hexylsalicylate Sample Spiked level Total found % Recovery Standard
deviation ppb Sample spk1/1 11.8 21.88 84 Sample spk1/2 22.56 94 Sample spk1/3 23.79 103 Mean 94 9.5 Sample spk2/1 29.5 39.99 95 Sample spk2/2 36.12 84 Sample spk2/3 35.35 80 Mean 86 7.7
Table B-12. Validation for Isopropyl myristate Sample Spiked level Total found % Recovery Standard
deviation ppb Sample spk1/1 10.46 29.38 66 Sample spk1/2 32.52 65 Sample spk1/3 33.48 89 Mean 73 13.4 Sample spk2/1 26.2 46.32 91 Sample spk2/2 43.96 70 Sample spk2/3 39.90 60 Mean 74 15.9 3.4 Migration Results of 10% Ethanol Test Simulant In the migration studies, 10% ethanol was chosen as the most appropriate test simulants covering all aqueous and acidic foods. The results obtained are from moulded plaques that were made from sample 11 Trial 5 (F/G/O).
Table B-13. Migration at 10 days and 20°C into 10% ethanol from plaques Phenyl Cyclohexane Benzophenone Hexyl Salicylate Iso Propyl Myristate Replicates ug/dm2 ppb ug/dm2 ppb ug/dm2 ppb ug/dm2 ppb 1 <0.8 <5.0 <0.4 <2.5 <0.7 <4.3 <0.5 <3.1 2 <0.8 <5.0 <0.4 <2.5 <0.7 <4.3 <0.5 <3.1 3 <0.8 <5.0 <0.4 <2.5 <0.7 <4.3 <0.5 <3.1 Mean <0.8 <5.0 <0.4 <2.5 <0.7 <4.3 <0.5 <3.1 LOD 0.8 5.0 0.4 2.5 0.7 4.3 0.5 3.1 The results show that the migration levels for all of the surrogates are not detected at all and are below the 10 ppb limit signifying that the recycled PP made by this process could be used in the range of food products shown in table 6 for less than 30 days at temperatures equal to and less than 20 deg C. Table B-14 shows the test procedure consistency (stability).
Table B-14. Recoveries – (10% ethanol) Phenyl Cyclohexane Benzophenone Hexyl Salicylate Iso Propyl Myristate Replicates % Recovery % Recovery % Recovery % Recovery Spike 1 81 81 42 28 Spike 2 84 82 44 38 Spike 3 75 82 55 26 Mean 80 82 47 30
Data from Extraction & Migration Tests 52
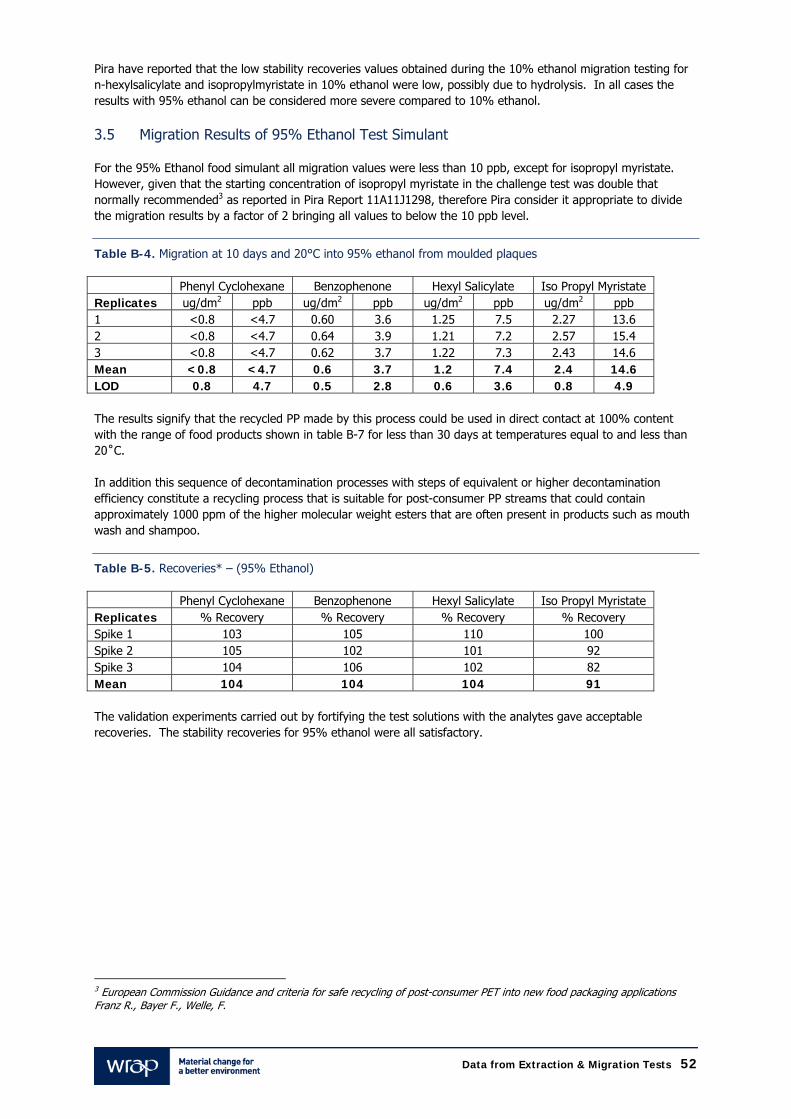
Pira have reported that the low stability recoveries values obtained during the 10% ethanol migration testing for n-hexylsalicylate and isopropylmyristate in 10% ethanol were low, possibly due to hydrolysis. In all cases the results with 95% ethanol can be considered more severe compared to 10% ethanol. 3.5 Migration Results of 95% Ethanol Test Simulant For the 95% Ethanol food simulant all migration values were less than 10 ppb, except for isopropyl myristate. However, given that the starting concentration of isopropyl myristate in the challenge test was double that normally recommended3 as reported in Pira Report 11A11J1298, therefore Pira consider it appropriate to divide the migration results by a factor of 2 bringing all values to below the 10 ppb level.
Table B-4. Migration at 10 days and 20°C into 95% ethanol from moulded plaques Phenyl Cyclohexane Benzophenone Hexyl Salicylate Iso Propyl Myristate Replicates ug/dm2 ppb ug/dm2 ppb ug/dm2 ppb ug/dm2 ppb 1 <0.8 <4.7 0.60 3.6 1.25 7.5 2.27 13.6 2 <0.8 <4.7 0.64 3.9 1.21 7.2 2.57 15.4 3 <0.8 <4.7 0.62 3.7 1.22 7.3 2.43 14.6 Mean <0.8 <4.7 0.6 3.7 1.2 7.4 2.4 14.6 LOD 0.8 4.7 0.5 2.8 0.6 3.6 0.8 4.9 The results signify that the recycled PP made by this process could be used in direct contact at 100% content with the range of food products shown in table B-7 for less than 30 days at temperatures equal to and less than 20˚C. In addition this sequence of decontamination processes with steps of equivalent or higher decontamination efficiency constitute a recycling process that is suitable for post-consumer PP streams that could contain approximately 1000 ppm of the higher molecular weight esters that are often present in products such as mouth wash and shampoo.
Table B-5. Recoveries* – (95% Ethanol) Phenyl Cyclohexane Benzophenone Hexyl Salicylate Iso Propyl Myristate Replicates % Recovery % Recovery % Recovery % Recovery Spike 1 103 105 110 100 Spike 2 105 102 101 92 Spike 3 104 106 102 82 Mean 104 104 104 91 The validation experiments carried out by fortifying the test solutions with the analytes gave acceptable recoveries. The stability recoveries for 95% ethanol were all satisfactory.
3 European Commission Guidance and criteria for safe recycling of post-consumer PET into new food packaging applications Franz R., Bayer F., Welle, F.

Data from Extraction & Migration Tests 53
3.6 Discussion and Conclusions Plaques, from Trial 5 (F/G/O) that had been injection moulded from challenge tested polypropylene were tested for migration using test conditions of 10 days at 20°C with food simulants 10% ethanol and 95% ethanol. The validation experiments carried out by fortifying the test solutions with the analytes gave acceptable recoveries. The stability recoveries for 95% ethanol were all satisfactory. However, the stability recoveries for n-hexylsalicylate and isopropylmyristate in 10% ethanol were low, possibly due to hydrolysis. In all cases the results with 95% ethanol can be considered more severe compared to 10% ethanol. The surrogate compounds benzophenone, phenylcyclohexane, n-hexylsalicylate and isopropylmyristate were measured in the food simulants. Migration of the surrogates into the food simulant 10% ethanol was at a not detectable level with limits of detection of 5 ppb (0.005 mg/kg) or better. The table below summarises the migration results with 95% ethanol in units of ppb (μg/kg) corrected to the food packaging ratio of 6 dm2/kg. Mean migration into 95% ethanol (ppb)
Phenylcyclohexane Benzophenone n-hexylsalicylate Isopropylmyristate Mean < 6 3.7 7.0 14.5 LOD 6 3 3.6 5
For the 95% Ethanol food simulant all migration values were less than 10 ppb, except for isopropyl myristate. However, given that the starting concentration of isopropyl myristate in the challenge test was double that normally recommended4 as reported in Pira Report 11A11J1298, therefore Pira consider it appropriate to divide the migration results by a factor of 2 bringing all values to below the 10 ppb level. For many food types the migration levels specified in the EU regulation 10/2011 are divided by a correction factor which is typically between 2 and 5 which would mean a further lowering of the critical migration concentration for that food product. 3.7 Conclusion of the Migration Results The results signify that the recycled PP made by this process could be used in direct contact at 100% content with the range of food products for less than 30 days at temperatures equal to and less than 20˚C. WRAP has applied for a patent for this process combination, consisting of an extruder with vacuum degassing such as the Gneuss MRS system, followed by a (rotary or column) vacuum reactor such as the OHL system and others. The application number is GB1103495.6.
4 European Commission Guidance and criteria for safe recycling of post-consumer PET into new food packaging applications Franz R., Bayer F., Welle, F.

www.wrap.org.uk/plastic