development of a new biosensor array and lab-on-a …
TRANSCRIPT

DEVELOPMENT OF A NEW BIOSENSOR ARRAY AND LAB-ON-A-CHIP
FOR PORTABLE APPLICATIONS
USING A LABEL-FREE DETECTION METHOD
by
SREENIVASA SARAVAN KALLEMPUDI
Submitted to the Graduate School of Engineering and Natural Sciences
in partial fulfillment of
the requirements for the degree of
Doctor of Philosophy
Sabancı University
Summer 2011

18-08-2011

iii
© Sreenivasa Saravan Kallempudi 2011
All Rights Reserved

iv
DEVELOPMENT OF A NEW BIOSENSOR ARRAY AND LAB-ON-A-CHIP FOR
PORTABLE APPLICATIONS USING A LABEL-FREE DETECTION METHOD
Sreenivasa Saravan Kallempudi
Electronics Engineering, Ph. D Thesis, 2011
Supervisor: Prof. Dr. Yasar Gurbuz
Keywords: Immunosensor, protein markers, lab-on-a-chip, microfluidics, microfabrication,
impedance spectroscopy, fourier transform impedance spectroscopy.
The detection and quantification of cardiac biomarkers in serum is crucial to diagnose patients in the early stage of a disease. The recent advances in microfluidics technology can improve diagnostics by reducing the application time and integrating several clinical analysis into a single, portable device called lab-on-a-chip (LOC). The development of such immunosensing LOC is a major thrust of the rapidly growing bionanotechnology industry. It involves a multidisciplinary research effort encompassing microfluidics, microelectronics and biochemistry. This thesis work focused on the development of immunoassays on microfabricated gold inter-digitated transducers (IDT) on silica and glass substrates. The concept of label-free, affinity-based biosensing is introduced with a special emphasis to impedance spectroscopy. Different protocols involving the covalent immobilization of cancer risk marker (human epidermal growth factor, hEGFR) and cardiac risk marker proteins C reactive protein (CRP), interleukin (IL-

v
6) and nicotinamide phosphoribosyltransferase (Nampt) single stranded deoxyribonucleic acid were investigated. For this, IDTs were fabricated using integrated circuit (IC) fabrication processes providing compatibility for the integration of electronic circuits, for single-chip and lab-on-a-chip biosensing applications.
The thesis also involves development of a poly dimethylsiloxane (PDMS)-based
fluidic system comprising on-chip actuated mechanism for multi-target immunosensing applications. The fluidic flow is controlled by an applied hydraulic pressure on the micropump. Label-free affinity type sensing was carried out using two different biological recognition elements (a) immunosensing approach using antibodies for hEGFR and IL-6 was employed and the function of the LOC was analyzed for detection of hEGFR and IL-6 as model analytes. A detection limit of 0.1ng/ml of hEGFR and IL-6 in serum was obtained without any signal amplification. (b) label-free affinity-based methodology using ssDNA aptamers specific for Nampt to develop an aptasensor and obtained a detection limit of 1 ng/ml in serum for Nampt, which is the most sensitive detection range with the application of the aptamer for Nampt.
vi
YENI BIYOSENSÖR DIZILERI VE TAŞINABILIR UYGULAMALAR IÇIN
ETIKETSIZ BIR ALGILAMA YÖNTEMI KULLANARAK YONGA ÜSTÜ
LABORATUVAR GELIŞTIRILMESI
Sreenivasa Saravan Kallempudi
EE, Doktora Tezi, 2011
Tez Danışmanı: Prof. Dr. Yaşar Gürbüz
Anahtar Kelimeler: Immünosensör, yonga üstü laboratuvar, mikro akışkanlar, mikro
üretim, Empedans spektroskopisi, fourier dönüşümlü empedans spektroskopisi.
Kan serumundaki kardiyak ve kanser biyo-işaretlerinin algılanması ve miktarlarının ölçülmesi hastalara erken tanı konulması için hayati önem taşımaktadır. Mikroakışkan teknolojisindeki en son gelişmeler, uygulama zamanını düşürerek ve birbirinden farklı klinik analizleri yonga üstü laboratuvar (LOC) olarak adlandırılan taşınabilir tek bir aygıt üzerinde birleştirerek hastalıkların teşhis edilmesini kolaylaştırabilir. Böyle bir yonga üstü laboratuvarın geliştirilmesi, hızla gelişen biyoteknoloji endüstrisisin bir ihtiyacı olup mikro akışkan, mikro elektronik ve biyokimya alanlarını kapsayan çok disiplinli bir araştırma gerektirmektedir.Bu tezdeki çalışmalar silikon ve cam tabanda üretilen altın interdigitated transdüserlerin (IDT) üstünde immünoeseylerin geliştirilmesi üzerine odaklanmıştır. Etiketsiz, afinite-temelli biyoalgılama konsepti empedans spektroskopisine özel önem verilerek sunulmaktadır. Anti-CRP, hEGFR, IL-6, aptamer ve Nampt ssDNA gibi risk teşkil eden proteinlerin kovalent bağlanmasıyla ilgili degişik protokoller
vii
incelenmiştir. Bunun için IDT’ler yonga üstü biyoalgılama uygulamaları için elektronik devrelerin entegre edilmesine uyum sağlayan, entegre devre üretim yöntemleriyle üretilmişlerdir.
Bu tez ayrıca çoklu hedef immunosensing uygulamaları için yonga üstü mekanizma
ile uyarılan PDMS-temelli bir LOC geliştirilmesini de içermektedir. Akışkan akışı bir mikro pompa üzerine uygulanan hidrolik basınç ile kontrol edilmektedir. Etiketsiz afinite tipi algılama iki farklı biyolojik tanımlama elementi kullanılarak yapılmıştır (a) hEGFR ve IL-6 için antikor kullanan immunosensing yöntemi kullanıldı ve LOC’un anti-hEGFR ve IL-6’i analitlerini algılamadaki işlevselliği analiz edilmiştir. Hiçbir sinyal güçlendirmesi olmaksızın, kandaki hEGFR ve IL-6 için algılama limiti 0.1ng/ml olarak elde edildi. (b) Aptasensör geliştirmek için Nampt için spesifik ssDNA aptamerleri kullanarak etiketsiz afinite temelli metodolojisi kullanıldı ve Nampt için 1ng/ml algılama limiti elde edildi. Bu Nampt için aptamer uygulanması ile elde edilen en hassas algılama aralığıdır.

viii
ACKNOWLEDGEMENT
At this day I look back and realize that all this would not have been possible without
the help and guidance of so many people. I am deeply grateful to everybody who has
helped to pave my way. The work presented in this thesis has been carried out at the
Microsystem Laboratory, Electronics Engineering at the Faculty of Engineering and
Natural Sciences at Sabanci University in Istanbul, Turkey. Financial support was provided
by the TUBITAK “The Scientific and Technological Council of Turkey” under PhD
fellowships for foreign citizens (BIDEB-2215) and Sabanci University Nanotechnology
Application Centre (SUNUM).
I would like to take the opportunity to show my heartfelt thanks to a number of
people in particular:
First of all, I would like to express my sincere gratitude to my supervisor Prof. Dr
Yasar Gurbuz for always having his door open, giving me support and guidance as well as
the freedom to develop my own ideas, and not least for giving me the opportunity to work
in his group. It has been a great honor and a true privilege to work under your guidance.
I wish to express my warm and sincere thanks to Dr Volkan Ozguz, Director,
SUNUM, who is always ready to answer my questions (sometimes non-sensual) about the
process and design rules. His understanding, encouraging and personal guidance have
provided a very strong basis for the present thesis.
I am also deeply grateful to, Dr Javed Niazi, for fruitfully and truthfully discussing
work and life and how to make a difference. Dr Anjum Qureshi, for her detailed and
constructive comments.
I am also thankful to Assoc. Prof. Ibrahim Tekin and Prof. Yusuf Menceloglu, for
their valuable comments and serving on my thesis committee.

ix
I would like to thank Bulent Koroglu of my lab who is always ready to share his
technical skills and help me with the laboratory settings. Thanks to the laboratory staff Ali
Kasal and Mehmet Dogan in our faculty. They never let me down whenever asking yet so
stupid questions and for so persistently teaching me Turkish language.
Furthermore, my precious times in Istanbul are made even more meaningful and
memorable, thank you to all my supportive friends, School of Engineering and Science and
others, especially my group members: Emre Heves, Ferhat Tasdemir, Huseyin Kayahan,
Irena Roci, Melik Yazici, M Burak Baran, Omer Ceylan, Samet Zihir and Zeynep Altintas.
It has been a great pleasure working together with you, sharing different views on life in
Turkey and I hope it was as rewarding for you as it was for me; I learned more from you
than you can imagine. Without the youngest member of my group, Tolga Dinc my thesis
was incomplete. Thank you for translating the abstract of my thesis.
Yildiz Uludag and Jee-Woong Park, whom I had, pleasure of fruitfully working
together with during their stay at Sabanci University.
I owe my loving thanks to my mother, Lalitha Kumari, my wife, Aparna, my sisters,
Bindu, Kiran and Vasu and my loving son, Sanjeev. Without their sacrifice,
encouragement and understanding, it would have been impossible for me to finish this
work timely.
“THANK YOU ALL!!”

x
TABLE OF CONTENTS ACKNOWLEDGEMENT viii LIST OF FIGURES xiv LIST OF TABLES xvii LIST OF ABBREVATIONS xviii
Chapter I 1 1. INTRODUCTION 1
1.1 Motivation for Cardiac Biomarker Detection and Background Information 1 1.2 Currently available Products in Market for the Diagnosis 3 1.3 The Need for Multiple Marker Quantification 4 1.4 Immunoanalysis 5
1.5 Label-free, Affinity-based Immunosensor 6
1.6 Microfluidic Technology 7
1.7 Aims and Scope of Work 10
1.8 Organization of Thesis 11
Chapter II 12
2. STRUCTURAL MODELIING AND FABRICATION OF TRANSDUCERS 12
2.1 Modeling 13
2.2 Fabrication of IDT Structures 15
2.2.1 Fabrication by Etch Stop Technique 15
2.2.2 Fabrication by Lift-Off Technique 17
2.3 Comparison of Modeled and Experimental results 18
xi
Chapter III 20 3. DESIGN, REALIZATION AND FLOW CHARACTERIZATION OF
MICROFLUIDIC SYSTEM 20
3.1 Design of Microfluidics 20
3.2 Modeling of the Microfluidic Device 23
3.3 Fabrication of Microfluidic system 26
3.4 Flow-rate Analysis of the Microfluidic system 28
Chapter IV 31 4. LAB-ON-A-CHIP FOR MULTI-TARGET IMMUNOSENSING APPLICATIONS 31
4.1 Surface Modification of Transducer 31
4.2 Immobilization of antibodies 32
4.3 Multiple protein marker detection 32
4.4 Electrochemical Measurements 33
4.5 Immunosensing LOC performance 34
4.6 Detection analysis 37
4.6.1 Change in Dielectric Properties Induced by Antibody-Antigen Interaction 37
4.6.2 Cole-Cole model for the detection of EGFR and IL-6 proteins 39
4.7 Kinetic analysis of hEGFR and IL-6 proteins Binding on
Sensor Surface 41 Chapter V 44
5. LABEL- FREE DETECTION AND QUANTIFICATION OF
NAMPT PROTEIN USING ssDNA APTAMER 44
5.1 The Importance of Nampt Protein 44
5.1.1 Advantages of Aptamer-based Biosensor Development 45

xii
5.2 Fabrication and Surface Modification of IDT arrays 46
5.3 Electrochemical Measurements 47
5.4 Response of Nampt in Buffer 48
5.5 Response of Nampt in Serum 49
5.5.1 Binding kinetics of ssDNA aptamer-Nampt in serum 50
Chapter VI 54 6. ALTERNATE ELECTRODE MATERIALS FOR BIOSENSOR
APPLICATIONS 54
6.1 Verification of SAM layer 56
6.2 Validation of Nickel Electrochemical Properties for Immunoassay Applications 58
6.2.1 Extraction of Polarizability, a Cole-Cole Model Parameter 59
Chapter VII 61
7. SUMMARY, CONCLUSION, AND SUGGESTIONS FOR
FUTURE WORK 61
7.1 Importance of Substrate 62
7.2 Method of Transduction 63
7.3 Detection modeling of IDTs 63
7.4 Linker Chemistry 64
7.5 Electrochemical Analysis 64
7.6 Protein complex formation and Its Influence 65
7.6.1 Size-dependent Variations of complex formation 65
7.6.2 Effect of Medium on Protein Complex 66
7.7 Summary of Achievements 66
7.7.1 Microfluidic System 66

xiii
7.7.2 Biomarker Detection 68
7.8 Conclusion 70
7.9 Future prospects 71 REFERENCE 73 APPENDIX 85
xiv
LIST OF FIGURES
Figure 1-1: Cardiovascular disease progression from pro-inflammatory to acute stage over time[11]. ................................................................................................................................ 5 Figure 1-2: Current immunosensing LOC in research[72]. Disadvantages: complex fabrication procedure, transduction principle and single target detection. ............................ 9 Figure 2-1: Schematic of the electrical model of a two port, interdigitated capacitor. ....... 13 Figure 2-2: Schematic of two-port interdigitated capacitors. .............................................. 14 Figure 2-3: Simulated value of capacitance vs. frequency of the interdigitated capacitor. Resonance is observed at 3.2 GHz. ..................................................................................... 15 Figure 2-4: Schematic representation of the process flow of the etch stop technique ........ 16 Figure 2-5: A representative of fabricated gold interdigitated capacitor on glass substrate 17 Figure 2-6: Photographic image of the fabricated (lift-off technique) IDT structure. ........ 18 Figure 2-7: Measured value of capacitance vs. frequency of the interdigitated transducer. 19 Figure 3-1: Schematic representation of the realized microfluidic system. ........................ 21 Figure 3-2: The operating mechanism of the immunosensing LOC. (a) Step 1: the analyte sample/wash buffer (20 µl) is dropped to fill the three inlets. Step-2: without closing the air vent with cover layer, a hydraulic load is applied by pressing the actuator with finger. Step 3: The actuator is released with load after closing the air vent with a cover layer and after few seconds the cover layer is removed to stop the fluid flow action for incubation. (b) Step 1: open the air vent and close the inlets with same inlet cover layer sequentially. Step 2: A hydraulic load is applied on the actuator to drain the collected waste through the air vent. ..................................................................................................................................... 23 Figure 3-3: Configuration of the radial motion when an uniform load (q) was applied in the lateral direction. ................................................................................................................... 24 Figure 3-4: Fabrication process flow the PDMS-based microfluidic system with pre-patterned glass as substrate for immunosensing applications. ............................................ 27 Figure 3-5: Photographic image of the fabricated PDMS-based microfluidic system with pre-patterned glass as substrate. .......................................................................................... 28

xv
Figure 3-6: Photographic representation of the experimental setup used for the flow characterization.................................................................................................................... 29 Figure 4-1: Schematic diagram of the bio-functionalization of the IDT surface. ............... 33 Figure 4-2: Photographic image of the hand-held format of measurement system. ........... 34 Figure 4-3: Relative change in capacitance obtained after anti-hEGFR immobilized IDTs were incubated with various concentrations of hEGFR antigens in serum in frequency range of 260-280 MHz. ....................................................................................................... 35 Figure 4-4: Relative change in capacitance obtained after anti-IL-6 immobilized IDTs were incubated with various concentrations of IL-6 antigens in serum in frequency range of 140-200 MHz. ............................................................................................................................. 37 Figure 4-5: Equivalent circuit; where R∞ is the high frequency impedance and Ro are static frequency impedance. .......................................................................................................... 40 Figure 4-6: Dose-dependent change in relative capacitance occurred after the Ab-Ag complex formation on IDT surface against varying concentrations of hEGFR at 270 MHz and IL-6 target in serum (0.1 to 10 ng/ml) at 170 MHz frequency. .................................... 42 Figure 5-1: Photographic image of the Ø 100 mm Si-SiO2 wafer with patterned gold-IDTs. Each wafer consisted of 45 IDT structures and can be used as an individual biosensing surfaces and replicates. ........................................................................................................ 47 Figure 5-2: Relative percentage change in capacitance obtained after Nampt ssDNA aptamer immobilized IDT’s after incubation with various concentrations of target in buffer. Inset figure shows a dose dependent change after the complex formation with varying concentrations of Nampt target in buffer at 500 MHz frequency. ...................................... 49 Figure 5-3: Relative percentage change in capacitance obtained after Nampt-ssDNA aptamer complex formed on IDTs after incubation with various concentrations of Nampt target in human serum sample. ............................................................................................ 50 Figure 5-4: Dose dependent change in relative percentage change in capacitance. The response occurred after the aptamer-target complex formation on IDT surface against varying concentrations of Nampt target in serum, at four different frequencies indicated in the figure legend. ................................................................................................................. 52 Figure 6-1: Capacitance measurements of Nickel IDT patterned on Si-SiO2 substrate. ..... 55 Figure 6-2: (a) FT-IR spectrum of the Nickel IDT surface after coating with MPA. (b) FT-IR spectrum of the EDC+NHS activated Nickel IDT surface. ............................................ 57

xvi
Figure 6-3: The change in normalized impedance values measured after incubating CRP antibody concentration (100 µg/ml) with series of antigen concentrations (0, 50, 250, 400, 800 ng/ml (CRP), 25, 800 ng/ml (BSA), and 800 ng/ml (PSA)) versus frequency as shown in the legend. ....................................................................................................................... 58

xvii
LIST OF TABLES
Table 1-1: Summary of CVD and cancer markers with their disease levels. ........................ 2 Table 1-2: Summary about products and their functions. ..................................................... 3 Table 3-1: Deliverable volumetric flow rate of the designed micro pump ......................... 25 Table 4-1: Variation of Cole-Cole parameters with specific interactions EGFR and IL-6 proteins and BSA (for non-specific interactions). ............................................................... 40 Table 5-1: Cole-Cole fitting parameters with specific interactions of Nampt ssDNA aptamer with its respective target. ....................................................................................... 53 Table 6-1: Variation of Cole-Cole polarizability parameter (m) with specific interactions (with CRP antibody-antigen) and non-specific interactions (with BSA and PSA). ............ 59 Table 7-1: Performance of the developed immunosensing LOC. ....................................... 67 Table 7-2: Examples showing detection range of IL-6 markers using different techniques. ............................................................................................................................................. 68 Table 7-3: Examples showing detection range of CRP markers using different label-free techniques. ........................................................................................................................... 69

xviii
LIST OF ABBREVATIONS
AAA Abdominal Aortic Aneurysm Ab Antibody Ag Antigen BSA Bovine Serum Albumin CRP C-reactive Protein CVD Cardiovascular Disease DNA Deoxyribonucleic acid ELISA Enzyme Linked Immunosorbent Assay FABP Fatty Acid Binding Protein FIA FluoroImmuno Assay HCl Hydrochloric acid IA Immunoassay IC Integrated Circuit IDT Interdigitated Transducer IL-2 Interleukin-2 MEMS Micro Electro Mechanical Systems MPA Mercaptopropionic acid MUDA Mercaptoundeconic acid MYO Myoglobin NaOH Sodium Hydroxide PC Polycarbonate PDMS Poly Dimethyl Siloxane QCM Quartz Crystal Microbalance RIA Radio Immuno Assay RNA Ribonucleic acid SAA Serum Amyloid A SPR Surface Plasma Resonance
TNF-α Tumor necrosis factor alpha WHO World Health Organization

1
Chapter I
1. INTRODUCTION
1.1 Motivation for Cardiac Biomarker Detection and Background Information
Millions of patients around the world are at risk of mortality from preventable
diseases like cardiovascular events and cancers. Recent reports by world health
organization (WHO) on cardiovascular diseases (CVDs) stated that these diseases
constitute one of the major cause of death in worldwide [1-5]. An estimated 17.1 million
people die each year that represents 30% of all global deaths. Of these deaths, an estimated
7.6 million were due to coronary heart disease and 5.7 million were due to stroke. Over
80% of CVD deaths take place in low- and middle-income countries and occur almost
equally in men and women. By 2015, almost 20 million people may die because of heart
disease and stroke. These are assumed to remain the major causes of death and some
cancer types[6] follow them. Lack of knowledge about the disease inflammation stage
could be the main reason why less than 10 % of the effected population is being treated.
There are different kinds of markers in human body which are the fundamental
indicators in the diagnosis of many CVD [7] and cancer [8] diseases. The levels of the
markers change in disease conditions. Table 1-1 summarizes the list of CVD and cancer
markers with respective concentrations of normal and disease levels. Moreover, some
markers such as interleukin-6, C-reactive protein and nicotinamide
phosphoribosyltransferase may represent more than one disease. The increase in the
specific marker levels above the normal level is the primary indication for a risk.

2
Table 1-1: Summary of CVD and cancer markers with their disease levels.
Protein Marker Type of Disease Normal
levels
Disease
levels
Reference
Interleukin-1β (IL-1) Cardiovascular risk
<70.0 pg/ml 120 pg/ml Pearson et al. (2003) Circulation 107, 499-511.
Interleukin-6 (IL-6) Cardiovascular risk (♥); Cancer risk
4.0 pg/ml 138 pg/ml (♥) Manukyan et al. (2008) Clin. Biochem. 41, 920-922.
Tissue necrosis factor (TNFα)
Cardiovascular risk
4.8 pg/ml 48 pg/ml Manukyan et al. (2008) Clin. Biochem. 41, 920-922.
Intercellular adhesion molecule-1 (ICAM-1)
Cardiovascular risk
227 ng/ml 513 ng/ml Secor et al. (1994) Infection and Immunity, 62, 2695-2701.
Selectin Cardiovascular risk
32 ng/ml 53 ng/ml Secor et al. (1994) Infection and Immunity, 62, 2695-2701.
Fibrinogen Cardiovascular risk
2.5 g/l 5.6 g/l Brown et al. (2005) Journal of American Medical Association (JAMA) 294, 1799-1809.
Serum amyloid A (SAA)
Cardiovascular risk
3.7 mg/l 2200 mg/l Wilkins et al. ClinChem (1994) 40, 1284-1290
C-reactive protein (CRP)
Cardiovascular risk (♥); Cancer risk
0.22mg/dl > 1 mg/dl (♥) Manukyan et al. (2008) Clin. Biochem. 41, 920-922.
Epidermal growth factor receptor (EGFR)
Cancer risk <8 ng/ml > 8 ng/ml Rubin et al. (1998) JNCI J Natl Cancer Inst. 90(11), 824-832.
Nicotinamide phosphoribosyltransferase(Nampt)
Diabetes (О); Cardiovascular risk; Cancer risk
15.8 ng/ml 31.9 ng/ml (О)
M.P. Chen et al. (2006) J Clin. Endocrinology and Metabolism, 91, 295-299.

3
1.2 Currently available Products in Market for the Diagnosis
The market comprises two types of participants including companies developing
biosensor-based devices and developers of biosensor technology. Key players engaged in
developing biosensor technology include Aga Matrix Inc., Cranfield Biotechnology
Center, Life Sensors Inc., M-Biotech, and Nova Biomedical. Leading manufacturers of
biosensor-based devices include - Abbott Point Of Care Inc., Affinity Sensors, Neosensors
Limited, Siemens Healthcare Diagnostics Inc, Animas Corporation, Life Scan Inc.,
Medtronic Diabetes, and Roche Diagnostics Ltd. Most players in the above list are catering
the diagnostic, prognostic needs of diabetic patients all over the world. Their products and
functions are provided in Table 1-2. To our knowledge, only Abott and Siemens health
care produce diagnostic device/cartridge for single CVD marker.
Table 1-2: Summary about products and their functions.
Company Product Information FunctionAga Matrix Inc. Key Note, KeyNote pro, Jazz,
PrestoBlood Glucose Monitoring Systems
Lifesensors Inc. SUMO pro, SUMO-3, SUMO star
Protein expression systems for bacteria`s
M-Biotech Alarm Monitoring system Blood Glucose Monitoring SystemsNova Biomedical MRI coils for scanning purposesAbott point of care Inc. I STAT 1, catridges for blood
gas, chemistry, coagulation and cardiac markers
Testing for Blood Gases, Electrolytes, Chemistries, Coagulation, Hematology, Glucose, and Cardiac Markers (cTnI)
Siemens Healthcare Diagnostics Inc.
Stratus® CS Acute Care™ Diagnostic System - Features & Benefits
Provides quantitative cardiac assays for fast, cost-effective evaluation of patients presenting with suspected myocardial ischemia.
Animas Corp. One touch ping Blood Glucose Monitoring SystemsLife Scan Inc. One Touch Ultra series Blood Glucose Monitoring SystemsMedtronic Diabetes Mini med paradigm REAL-Time Insulin Pump and
Continuous Glucose Monitoring System
Roche Diagnostic Ltd. Acuchek, Cobas, Coasay, Confirm
In-vitro diagnostics
4
The major disadvantages of the currently available products are the cost and the
inability to quantify multiple markers on a single cartridge. For example, troponin I
(cardiac marker) detecting cartridge from Abott point of care inc. costs $650 [9-10] which
is expensive for a single marker, and the expenses will enhance to detect multiple disease
markers. Thus, there is a need for alternate, cost effective diagnostic device for multiple
marker detection and quantification.
1.3 The Need for Multiple Marker Quantification
It is often difficult to distinguish those individuals with a moderate baseline risk who
might benefit from aggressive risk reduction strategies from the levels of a single protein
marker. For example, the inflammation of CVD is illustrated in Figure 1-1. Initially, the
pro-inflammatory risk markers (proteins) such as interleukin-1, tissue necrosis factor alpha,
and interleukin-6 are dominant during the early stages of CVD. As disease progresses to
acute stage, the marker proteins, such as myoglobin, serum amyloid A and C-reactive
protein are more active. It has been observed that the majority of the deaths occur after the
acute stage [11]. Therefore, additional tests are applied for the prediction of risk in disease
individuals may be needed and will enhance the individual’s diagnostic expenses. The
parallel analysis of multiple markers with a single test using small volumes of serum
sample greatly enhances the applicability of device in disease stage quantification with
minimized diagnostic expenses. Thus, potential candidates can be verified at the early
stage of disease.

5
• Interleukin-1 (IL-1)• Tissue Necrosis Factor α (TNFα)• Interleukin-6 (IL-6)
STAGE-1 (Early diagnosis)Pro-inflammatory
risk factors
STAGE-2 (Intermediary)
Adhesion molecules
• Intercellular adhesion molecule-1 (ICAM1)• Selectins
• Myoglobin• Serum amyloid A (SAA)• C-reactive protein (CRP)
STAGE-3 (Acute stage)Acute phase
reactants
Disease progression
Tim
e
Inflammation of cardiovascular disease
Figure 1-1: Cardiovascular disease progression from pro-inflammatory to acute stage over time[11].
1.4 Immunoanalysis
The key element in any immuno-based technique is the applied antibody (Ab) made
of globular proteins, produced by the immune system of the mammals as a defense against
foreign agents (antigen, Ag). Among the various immunochemical techniques [12],
immunoassays are more versatile and can be manipulated as various formats for particular
purposes ranging from quantitative laboratory tests [13-14] to simple “yes/no” screening
tests [15-16]. These advantages can be exploited in monitoring programs where great
number of samples needs to be analyzed.
Currently, laboratory-oriented affinity-based methods/sensing mechanisms are being
used for the detection and quantification of multiple-marker content of serum. These
include the enzyme-linked immunosorbent assay (ELISA) [17], radio immunosorbent

6
assay (RIA) [18] and flouroscence immunosorbent assay (FIA) [19]. These methods are
derived from the immunoassay technology, where signal detection is facilitated by the use
of enzyme/flouropore labels [20]. These methods have several limitations including the
requirement for complex reagents, qualifying the presence of the target molecules/analytes
only, generation of radioactive residues in RIA, fluorescent-labeling as in sandwich-type
arrays when applied to biological fluids limit the sensitivity due to background noise and
the necessity for heavy/expensive instrumentation [21]. Therefore, there is a clear need for
a clean and rapid method to quantify the levels of multiple proteins in serum to determine
potential disease candidates that may benefit from therapeutic interventions in the early
stages of diseases.
1.5 Label-free, Affinity-based Immunosensor
Alternatively, immunoassay technologies provide label-free mechanisms based on
the change of surface properties upon protein-target binding. Label-free affinity-type
biosensors are fast, inexpensive and do not require the use of detection labels (fluorescent,
radio or colorimetric) to facilitate measurements. Besides the time and expense benefits of
omitting the labeling step, label-free operation enables detection of target-probe binding in
real time [22], which is generally not possible with label-based systems. Real-time sensing
confesses at least two major advantages over endpoint detection. First, time averaging of
binding/unbinding events can improve measurement accuracy. Second, it allows
determination of affinity constants by curve-fitting the sensor output vs. time [23]. For
accurate results, effects including diffusion rate and steric hinderance must be accounted
for, just as in surface plasmon resonance (SPR) [24]. Furthermore, it is important to know
the relationship between the amount of bound target and sensor output as signal.
Interdigitated electrodes have been widely used and are still being explored by many
investigators for the development of label-free affinity-based sensing mechanisms [25-32].
The capacitance between the interdigitated electrodes can be described by the basic
capacitance equation (1.1).

7
dAC orεε= (1.1)
where εr is the relative dielectric constant, A is the electrode area, and d is the pitch
between two consecutive electrodes. When there is any change in the dielectric properties
of the material between the electrodes, a change in the capacitance will occur and it is
correlated to the bound target captured by the immobilized protein molecules on the
surface. The non-specific signal can be minimized simply by washing away the unbound
species on the sensor surface [33].
Thus, by using label-free sensors, detailed information on an interaction can be
obtained during the analysis while minimizing sample processing requirements and assay
run times. However, this technique has limitations due to technical and experimental
constraints, such as portability, control of sensor surface, high user expertise requirements.
With the recent advances in microfluidic technology, these constrains can be surpassed by
developing a device for the rapid measurement of protein levels in serum in small volumes.
1.6 Microfluidic Technology
The advent of micro-fabrication technologies plays a significant role for the
development of fluid-based devices at microscopic length scales. The introduction of novel
concept of chemical sensing was investigated by Manz et al. [34], provoked many
researchers for the development of microfluidic technologies in the application areas of
chemistry and life sciences, where several complex laboratory functions such as pre-
treatment, analyte sample separation, bio-chemical reaction, label/label-free detection, and
fluid handling were integrated onto a single chip and it can be referred as lab-on-a-chip
(LOC) [35-36]. The dexterity of LOC delivers numerous advantages such as low
consumption of reagents, integration to multiple processes, lower analysis time and higher
sensitivity and the reliability. Thus, LOC technologies are widely used in the applications
of drug discovery [37-39], controlled drug delivery [40-41], single/multiple cell analysis
[42-44], genome analysis [45-47], proteomics [48-49] and portable point-of-care systems
[50-52].

8
Current focus in developing microfluidics research can be broadly categorized as:
i. Application driven development of devices (LOC),
ii. Realization of new fluid transfer/control mechanism,
iii. Development of new, reliable and economical fabrication technology for these
devices.
Among the various applications of LOC, the immunoanalysis for the detection of
disease markers using LOC technology with on-chip actuated mechanism is not explored
to the extent.
The precise and low cost fluid control is hard to achieve without the integration of
on-chip fluidic components to the off-chip control systems. Thus, until recently, the precise
fluid control can only be achieved by the expensive and complex methods such as
externally controlled electro-kinetic flows and active components (micropumps and micro-
valves). Several groups developed the off-chip actuating mechanisms with the combination
of electro-hydrodynamic [53-55], electro-osmotic [56-57], electrostatic [58-59],
electromagnetic [60-61], magneto-hydrodynamic [62-63], piezoelectric [64-66],
thermopneumatic[67-69], and pneumatic [70-71] actuation principles through the actuating
sources/micropumps. Thus, an astonishing diversity is achieved on the micropump
concepts and devices as a result of wide spread research activities on micropumps,
reaching from peristaltic pumps to a large number of micro diaphragm pumps to the high-
pressure devices without any moving parts. However, no recognizable work has been
performed for the integration of biosensor platform to an on-chip actuated fluidic system.
Recently, alternate strategies have been extensively studied to develop on-chip
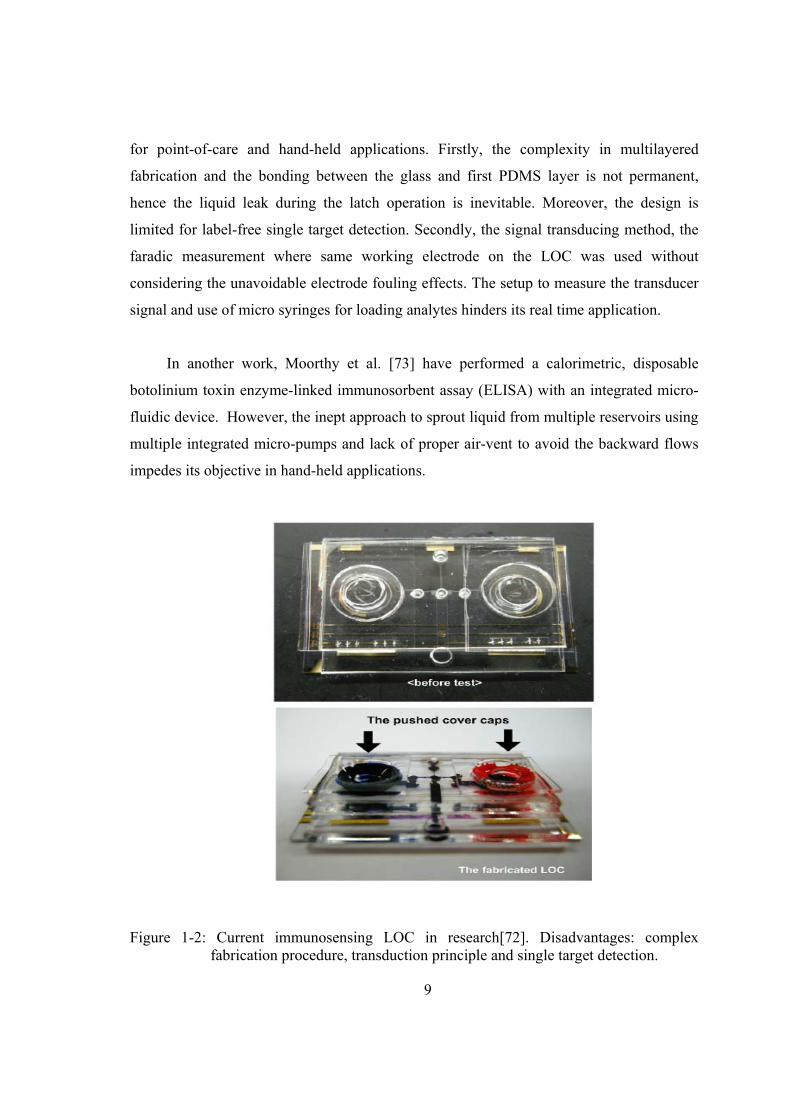
actuating mechanisms with no external instrumentation. For example, Park et al. [72], have
developed an electrochemical immunosensing disposable LOC integrated with latch
mechanism for hand operation for the detection of glucose (Figure 1-2). Hydraulic pressure
(pressing with the finger) is applied on the inlet section (reservoir cum actuator) to sprout
liquid into the reaction chamber. The methodology has severe drawbacks to be modified
9
for point-of-care and hand-held applications. Firstly, the complexity in multilayered
fabrication and the bonding between the glass and first PDMS layer is not permanent,
hence the liquid leak during the latch operation is inevitable. Moreover, the design is
limited for label-free single target detection. Secondly, the signal transducing method, the
faradic measurement where same working electrode on the LOC was used without
considering the unavoidable electrode fouling effects. The setup to measure the transducer
signal and use of micro syringes for loading analytes hinders its real time application.
In another work, Moorthy et al. [73] have performed a calorimetric, disposable
botolinium toxin enzyme-linked immunosorbent assay (ELISA) with an integrated micro-
fluidic device. However, the inept approach to sprout liquid from multiple reservoirs using
multiple integrated micro-pumps and lack of proper air-vent to avoid the backward flows
impedes its objective in hand-held applications.
Figure 1-2: Current immunosensing LOC in research[72]. Disadvantages: complex fabrication procedure, transduction principle and single target detection.

10
1.7 Aims and Scope of Work
Miniaturization of analytical systems [74] proved to be advantageous with regard to
reduction of the sample volumes and required reagents as well, allowing medical diagnosis
from as low as a drop of blood. Moreover, analysis times are usually shorter and several
assays can be integrated in a single system without extending the size and complexity of
the device. The aim of this research however also includes development of a multi-target
immunosensing LOC, which is integrated with an on-chip actuating micropump for
propelling the working fluids. One of the primary scopes of this thesis includes the
realization of an integrated hand-operating micropump using microfluidic technology,
development of stable label-free immunoassay for multiple targets and testing the LOC
with label-free immunoassay.
The development of such systems is not just transfer of an analytical assay to a
microsystem. The following challenges of this work to be considered in realizing a viable
microfluidic LOC:
i. The reduction of dimensions also reduces volumes which are accessible to the
transducer and may degrade the signal. Thus, effective and sensitive transducing
mechanisms to be implemented.
ii. Manipulating a surface for compatibility with conjugation of more than one protein
marker, while retaining protein recognition properties.
iii. Compatible and economical fabrication technologies to be adopted without
perturbing the protein analytical properties.
iv. The application of capillaries increases the flow resistance for pressurized flow of
liquid. At present the most important mechanism used to control liquid flow is
electro-kinetics which requires no additional components such as pumps or valves,
but the integration of electrodes usually platinum/gold and the application of
electric fields are needed. Thus, alternative methods such as on-chip actuation
pumps for liquid transportation were to be integrated.

11
Moreover, attempts are made to quantify proteins using specific aptamers by label-
free methodology and to investigate nickel as alternate transducing electrode material for
laboratory-based applications. The selection of protein markers is not the main objective of
this work, therefore, further guidance and support is to be received to complete these tasks
of the thesis.
1.8 Organization of Thesis
This thesis contains seven chapters that explain fabrication of IDTs, development of
microfluidic systems, integration of fabricated IDTs with fluidic system for
immunosensing, label-free aptasensing, alternate transducing electrode materials and
finally conclusions. A brief outline of each of the chapters is given below.
i. Chapter 2 contains the behavior and characteristics of the IDT at high
frequencies which was performed using ADS: MOMENTUM. The final
section presents the comparison of the simulation results to the experimental
test results of fabricated structures
ii. The design and fabrication of a portable PDMS-based microfluidic system with
on-chip actuated mechanism was discussed in Chapter 3.
iii. Chapter 4 presents the validation of the fluidic system as an immunosensing
LOC in which epidermal growth factor (EGFR) and interleukin (IL-6)
antibodies were used as model analytes.
iv. Chapter 5 details the application of label-free sensing approach using Nampt
specific ssDNA aptamer. The target levels were quantified in buffer as well as
serum (1-250 ng/ml).
v. Chapter 6 contains the investigation on alternate transducing electrode for
immunoassay applications.
vi. Chapter 7 elaborates on the efforts towards the physical realization of the
immunosensing LOC and summarizes the achievements of this research which
is followed by conclusions and suggestions for future work.
12
Chapter II
2. STRUCTURAL MODELIING AND FABRICATION OF TRANSDUCERS
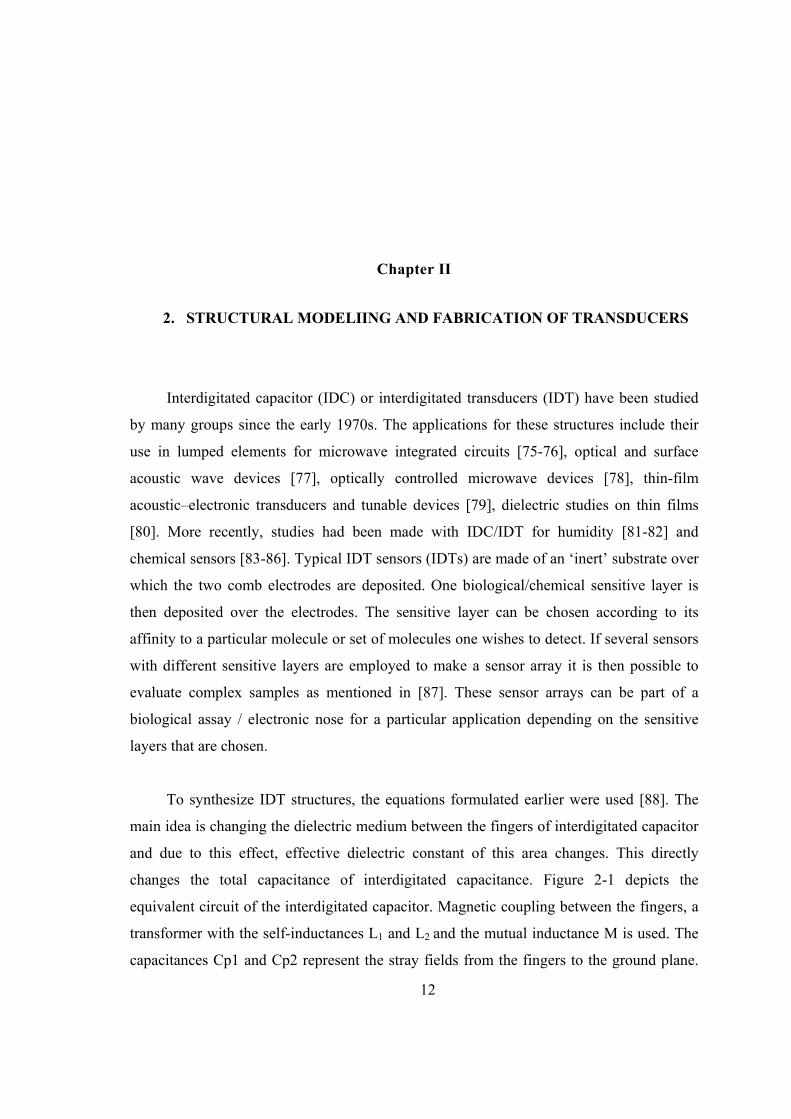
Interdigitated capacitor (IDC) or interdigitated transducers (IDT) have been studied
by many groups since the early 1970s. The applications for these structures include their
use in lumped elements for microwave integrated circuits [75-76], optical and surface
acoustic wave devices [77], optically controlled microwave devices [78], thin-film
acoustic–electronic transducers and tunable devices [79], dielectric studies on thin films
[80]. More recently, studies had been made with IDC/IDT for humidity [81-82] and
chemical sensors [83-86]. Typical IDT sensors (IDTs) are made of an ‘inert’ substrate over
which the two comb electrodes are deposited. One biological/chemical sensitive layer is
then deposited over the electrodes. The sensitive layer can be chosen according to its
affinity to a particular molecule or set of molecules one wishes to detect. If several sensors
with different sensitive layers are employed to make a sensor array it is then possible to
evaluate complex samples as mentioned in [87]. These sensor arrays can be part of a
biological assay / electronic nose for a particular application depending on the sensitive
layers that are chosen.
To synthesize IDT structures, the equations formulated earlier were used [88]. The
main idea is changing the dielectric medium between the fingers of interdigitated capacitor
and due to this effect, effective dielectric constant of this area changes. This directly
changes the total capacitance of interdigitated capacitance. Figure 2-1 depicts the
equivalent circuit of the interdigitated capacitor. Magnetic coupling between the fingers, a
transformer with the self-inductances L1 and L2 and the mutual inductance M is used. The
capacitances Cp1 and Cp2 represent the stray fields from the fingers to the ground plane.

13
The ohmic losses that occur due to the current flow through the fingers can be described by
two frequency dependent resistors Rf1 and Rf2. There resistances must be decreased for
instance using thicker metal layer to get rid of losses. The modification of IDT surface
during immunoassay process will increase the probe layer thickness on IDT fingers which
influences the surface conductive and capacitive properties and hence the variations of
parameter, Cg will be more dominant.
Figure 2-1: Schematic of the electrical model of a two port, interdigitated capacitor.
2.1 Modeling
Interdigitated transducing (IDT) structures were designed for the impedimetric
measurements and most IDT exist as multi-finger type of capacitors which are widely used
in microwave and RF applications [89]. Protein molecules are able to express their
biological functions only in frequency ranges less than 1 GHz [90]. To capture the
biological activity, avoid structural resonance during the impedimetric measurements and
to have resonance between 3-4 GHz, the IDT as shown in Figure 2-2 is designed. The
capacitor itself is defined between the two ports. The IDT was designed to have 24 finger-

14
like structures with dimensions of 800 µm in length, 40 µm in width with a pitch of 40 µm.
The grounding arm around the interdigitated structure is of 400 µm in width.
Figure 2-2: Schematic of two-port interdigitated capacitors.
The simulation of structures shown in Figure 2-2 at high frequencies is not easy and
electromagnetic simulators like MOMENTUM/HFSS should be used for high accuracy. In
this work, modeling and simulation of IDT is performed using ADS (Advance Design
System) MOMENTUM®. The structure, shown in Figure 2-2 is simulated with silicon as
substrate and gold as the transducing metal in the frequency range of 1 GHz to 5 GHz. One
of the ports is grounded during the simulations. From the simulated Scattering parameters
(S11) capacitance was extracted and plotted with respect to frequency (Figure 2-3). The
structural resonance is observed around 3.2 GHz. Above that frequency, inductive behavior
is observed.

15
Figure 2-3: Simulated value of capacitance vs. frequency of the interdigitated capacitor. Resonance is observed at 3.2 GHz.
2.2 Fabrication of IDT Structures
In the course of this work, either microglass slide substrates (7.5 X 5 cm2) or Si-SiO2
wafers (Ø 100 mm) were used and depending on substrate/wafer type, etch stop or lift-off
technique was employed for the patterning of sputter deposited metal layer. In the
lithographic process of patterning IDT features, mylar mask was used and each 4 inch
wafer can accommodate 45 IDT structures whereas glass substrates accommodate 8 IDTs.
Each IDT structure was designed to have 24 finger-like interdigitated electrodes with
dimensions of 800 µm in length, 40 µm in width with a pitch of 40 µm within a total active
area of 2.5 mm2.
2.2.1 Fabrication by Etch Stop Technique
To pattern metal on glass wafer, this technique is applied. Firstly, micro glass slides
were cleaned with 3:1 piranha solution at 1300 C. Next, a very thin tungsten layer of 20 nm
and gold layer of 200 nm thick were sputter deposited on the glass surface. Next, 1.8 μm
thick positive photo resist (HPR 504) is spun over the glass surface. Following this step the

16
glass slide was exposed to UV with a dose of 100 mJ/cm2 and then developed using
positive developer (OPD 4280). Finally, the electrodes were patterned by etching, the gold
using mixture of potassium iodide (KI) + iodine (I2) solution in 4:1 ratio, followed by
etching titanium layer using mixture of ammonium hydroxide (NH4OH) and hydrogen
peroxide (H2O2). Figure 2-4 presents the fabrication process flow of the etch stop
technique where as Figure 2-5presents the fabricated realized gold IDT structure on glass.
Figure 2-4: Schematic representation of the process flow of the etch stop technique

17
Figure 2-5: A representative of fabricated gold interdigitated capacitor on glass substrate
2.2.2 Fabrication by Lift-Off Technique
To pattern metal on wafers other than glass lift-off technique has been used. After
cleaning wafers with acetone, a 2.5 µm thick, dual tone photoresist (AZ 5214 E) was spin
coated and patterned on the SiO2 surface by exposing. Next, metal was deposited using
direct current (DC) sputter deposition. Following this step, acetone was used to lift-off the
nickel. Figure 2-6 shows the photographic image of the gold-IDT patterned using lift-off
technique which highlights the dimensions of the finger electrodes.

18
Figure 2-6: Photographic image of the fabricated (lift-off technique) IDT structure.
2.3 Comparison of Modeled and Experimental results
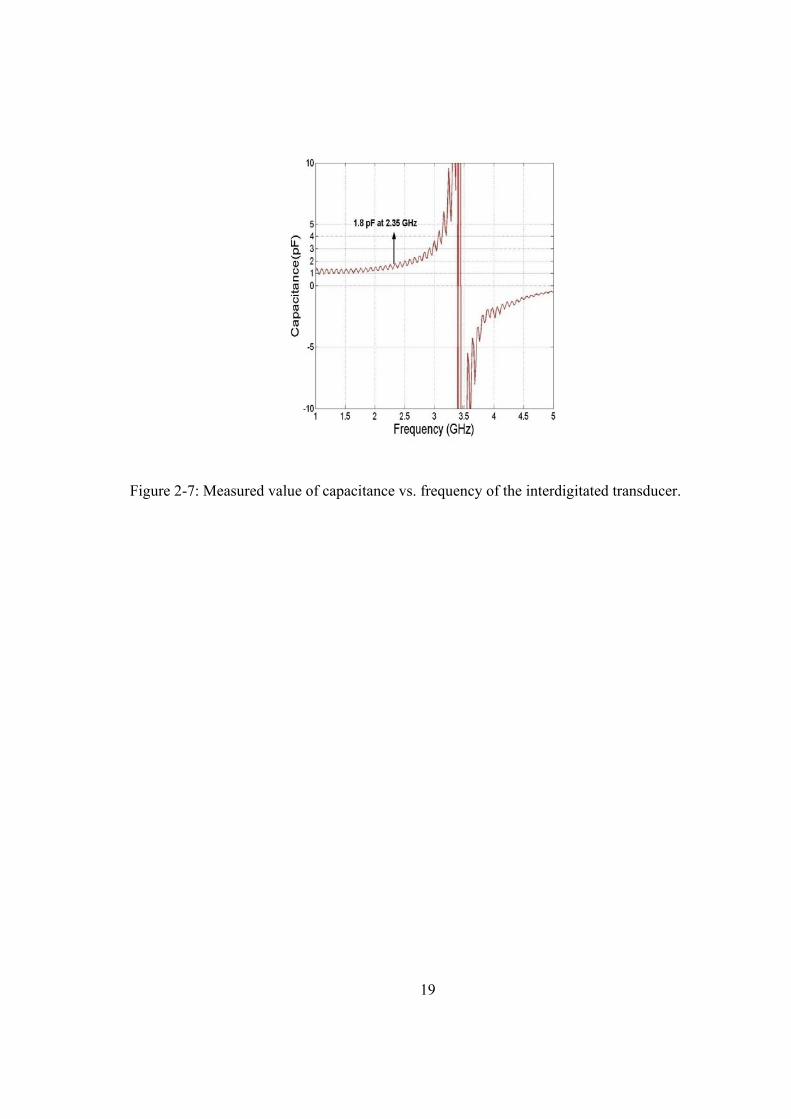
For comparison, Agilent S-parameter network analyzer (8720 ES) was used to
measure impedance parameters (S11) of the realized gold-IDT on Si-SiO2 substrate. The
resulting capacitance extracted from the measured S11 parameters was compared to the
simulation results and it is observed that the capacitance value at 2.354GHz is found from
the simulation as 1.829 pF, Figure 2-3 that is very close to measured value of 1.8 pF,
Figure 2-7. Moreover, fabricated IDT resonates around the same frequency of the
simulation model. Therefore, it is verified that the characteristic properties of the realized
structure are in good agreement with the simulated model.
19
Figure 2-7: Measured value of capacitance vs. frequency of the interdigitated transducer.
20
Chapter III
3. DESIGN, REALIZATION AND FLOW CHARACTERIZATION OF MICROFLUIDIC SYSTEM
As discussed in Chapters 1 and 2, the conjugation of protein assays to metal
interdigitated electrode was achieved in far higher densities than any other method for
immunodetection. Our previous studies reveal that the label-free detection using IDT is a
robust and stable technique to quantify disease markers [91-93]. Therefore, there should be
more emphasis on integrating the transducing platforms with novel fluid transporting
mechanisms (microfluidic system) rather than investigation of protein immobilization on
IDT structures. The work presented in this chapter focuses on the development of a novel
microfluidic system for immuno-analysis. The design facilitates parallel analysis of single
disease markers with different concentrations or multiple disease detection at the same
time.
3.1 Design of Microfluidics
The design of LOC consists of two stacked PDMS layers on glass layer. The middle
PDMS layer is used for channel structures and wastage reservoirs, whereas with the
application of hydraulic pressure (pressing with finger). The top PDMS layer is designed to
deform over the wastage reservoirs of middle layer. Essential components of system are an
actuation chamber and fluid channels. The actuation chamber is vented to the ambient
through an air vent/venting hole. Figure 3-1shows the schematic of the hand-operated
microfluidic system for immunosensing applications. The transfer of liquids is
accomplished by the relaxing of the elastic deformation caused by the release of hydraulic
pressure, which induces a thrust (negative pressure inside the channel). Thus, the driving

21
force utilized in this design does not require an external power source as in the case of an
off-chip actuated micro-fluidic systems.
Figure 3-1: Schematic representation of the realized microfluidic system.
In static assay immunoanalysis, the incubation period to allow the reaction to occur
on the transducer surface is essential. Thus for specific lab applications, the proposed
system with a series of coordinated steps would allow incubation in addition to the
complex experimental lab procedures such as loading of analytes or washing (cycle-1) and
draining (cycle-2) processes, as seen in Figure 3-2. During the cycle-1, an analyte sample
is loaded into the inlet ports. The sample spreads inside the molded wells due to the surface
tension and stops at the well boundary. By pump actuation, the analyte will run onto the
gold-IDT. The channel and the IDT surface will be washed by repeating cycle-1 with wash
buffer (1X PBS). After the completion of cycle-1 process, the sample analyte or washing
solution will be collected in the waste reservoir. During cycle-2, the inlets ports were

22
closed and the reservoir is emptied through the air vent. Thus, the two processes (cycle-1
and cycle-2) facilitate all lab procedures for immunosensing applications.
The reversible van der Waals contact of PDMS-PDMS is used in closing and
opening of all ports (inlet and air vent) with an additional PDMS cover layer. First, the
analyte sample is loaded into the inlet well connected to channel. After opening the air
vent, hydraulic pressure was created by pushing down the actuator on the wastage reservoir
chamber. Next, the closing of air vent using a removable PDMS cover layer and release of
hydraulic pressure creates a negative pressure inside the closed channel and sucks the
analyte sample into the channel, hence onto the surface of IDTs. The same mechanism is
used for washing the channel and sensor surface (Figure 3-2(a)). The loading and washing
steps fill the reservoir chamber which will be sprouted through the air vent by placing the
same cover layer on the inlets (Figure 3-2 (b)).
23
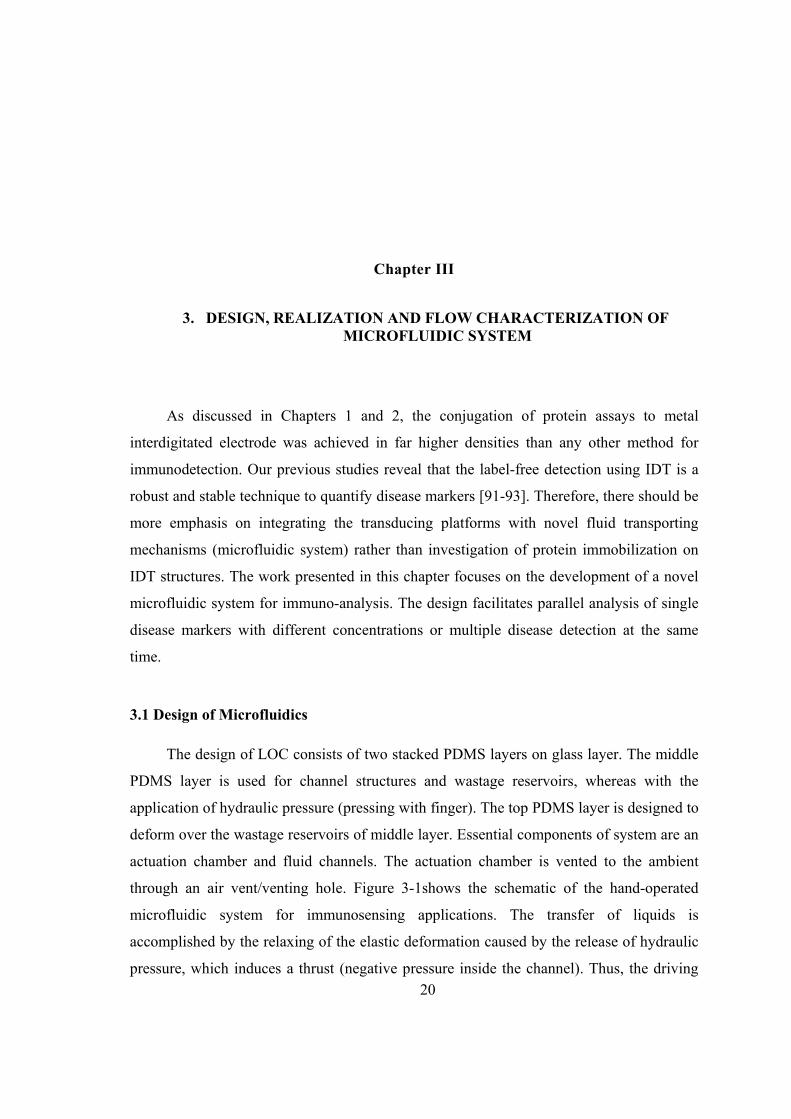
Figure 3-2: The operating mechanism of the immunosensing LOC. (a) Step 1: the analyte sample/wash buffer (20 µl) is dropped to fill the three inlets. Step-2: without closing the air vent with cover layer, a hydraulic load is applied by pressing the actuator with finger. Step 3: The actuator is released with load after closing the air vent with a cover layer and after few seconds the cover layer is removed to stop the fluid flow action for incubation. (b) Step 1: open the air vent and close the inlets with same inlet cover layer sequentially. Step 2: A hydraulic load is applied on the actuator to drain the collected waste through the air vent.
3.2 Modeling of the Microfluidic Device
The actuator was modeled as a circular diaphragm with clamped edges under a
uniform load/mechanical pressure in the lateral direction (z). Since the thickness of the
actuator (t) was smaller than the diameter (2a), we assume that the actuator layer thickness
would not change during operation. The actuation process is schematically shown in Figure
3-3and the displacement along the radial direction (deflection, w) can be expressed as,
[94]
( )222
64ra
Dqw −= (3.1)

w
ac
be
T
w
Fi
of
where D is
ctuator mate
e applied.
The m
herefore at
w
The flex
D
where E is m
igure 3-3: Cla
The vo
f deformatio
flexural ri
erial (in our
maximum d
r=0
maxw =
xural rigidity
(12=D
modulus of e
Configuratioateral direct
olume chang
on w=w0 at
∫=0
w
V
igidity whic
r case, PDM
deflection (
(64
aD
q
y can be giv
)1( 2
3
υ−Eh
elasticity (1:
on of the radtion.
ge for the a
the center c
∫0
0
2w
dwrπ
ch is deter
MS) and r is
(wmax) will
)4
ven as
)
:10 PDMS,
dial motion
actuating pu
can be expr
24
rmined from
s the distanc
l be at th
7.5e5 pa) a
n when an un
ump action
ressed as
m the mate
ce from the
e centre o
(3
(3
and υ is po
niform load
from flat w
(3
erial proper
centre whe
of diaphrag
3.2)
3.3)
oisonn`s rati
d (q) was ap
w=0 to a cer
3.4)
rties of the
ere load will
gm/actuator
io (0.5)
pplied in the
rtain degree
e
l
.
e
e

25
From eq. 3.1 we can obtained
( )rdrraD
qdw 22
644 −−=
(3.5)
by changing the limits and substituting eq. 8.5 in eq. 8.4, the volume change can be written
as
[ ]∫ =−=a
aD
qdrrarD
qV0
6223
192644π
(3.6)
Therefore, the volume flow rate of the actuator can be expressed as
6625.0602 afD
qVfV ccs ∗∗=∗∗∗= (3.7)
where, 60 is the conversion constant from the unit of volume change per second to the unit
of volume change per minute; fc is the frequency of the pumping motion of the actuator,
which strongly depend on material property and external load. Table 3-1 shows the
theoretical maximum volumetric flow rate, the designed micropump can deliver.
Table 3-1: Deliverable volumetric flow rate of the designed micro pump
Actuator type Radius (mm) Thickness (mm) Max. volumetric flow rate (µL/min)
Circular 10 2 29.16
To initiate the flow in the channel it is assumed that the change in volume of
actuating chamber during the application of hydraulic pressure is larger than the total
channel and inlet port volume. Therefore, the negative pressure created after release of

26
hydraulic load decreases the fluidic resistance in the micro channel running over the IDTs,
hence enables the sample to flow through the channel from inlet ports.
3.3 Fabrication of Microfluidic system
The glass substrates were pre-patterned with gold electrodes by using the etch stop
fabrication process as mentioned in Chapter 2. The microfluidic section of the LOC was
realized in polydimethylsiloxane (PDMS) by soft lithography. The channels and actuators
were microfabricated through coordinated casting, curing and bonding processes of
PDMS-PDMS and PDMS-glass. The microfluidic channels used to transfer the analyte
samples and incubation wells over the IDT area were formed of PDMS. A 3 mm thick
PDMS layer was dispensed onto a pre-patterned SU8 master supported on a silicon wafer
and degassed for 2 hrs. After curing the elastomer for 1 hr at 80 0C, the replica layer was
peeled off from the masters and the hole for main actuator was punched out. Each of the
incubation well has an enclosure cavity of 0.1344 mm3 in volume. The channel lines are
rectangular in cross-section which is 100 μm wide by 60 μm deep. A second layer of
PDMS was again dispensed onto the blank wafer to act as an actuator and the same casting
process was used while the thickness of this layer is 1.5 mm. The microfluidic channel
was then sealed by bonding the punched PDMS layer to a pre-patterned glass substrate
with a 30 sec oxygen plasma treatment to activate both surfaces prior to the bonding
process which was repeated to seal the second PDMS layer over the punched-out PDMS
layer. The whole assembly was cured for 1 hr at 80 0C. Finally, after punching out the inlet
and air vent ports, covered with a PDMS layer ( 1.5 mm) which make a reversible bond.
Figure 3-4 shows the fabrication process of the microfluidic.

27
Figure 3-4: Fabrication process flow the PDMS-based microfluidic system with pre-patterned glass as substrate for immunosensing applications.
Figure 3-5 shows the photographic image of the fabricated fluidic system which is of
60 X 45 X 5.5 mm3 in dimensions. Insight shows a magnified image of IDT; each planar
structured IDT constitutes an array of 24 gold interdigitated electrodes (GIDT) within an
area of 1.4 X 1.8 mm2.

28
Figure 3-5: Photographic image of the fabricated PDMS-based microfluidic system with pre-patterned glass as substrate.
3.4 Flow-rate Analysis of the Microfluidic system
The liquid flow rate was analyzed for the release of applied hydraulic load. A high-
speed, digital CCD camera (Phantom V311), which can run up to maximum of 500,000
frames per second was used to gather the images. The experimental setup to analyze the
flow-rate is shown in Figure 3-6. The majority of the images are recorded at 1000 fps and
the lens used is a macro lens with a field of view up to 2.8 mm at a focal length of 15 cm.

29
Figure 3-6: Photographic representation of the experimental setup used for the flow characterization.
The working fluid (a blue dye) was driven from the inlet liquid reservoir using
internal actuator action (cycle-1). We measured the flow rate of the system by releasing the
applied load. It is observed that the working fluid flows into the wastage reservoir through
the channel because the released hydraulic load decreases the fluidic resistance of the
channel over the ambient. When the actuator is released by removing the pushed down
finger, the measured average flow rate in the channel is 300 nl/sec, which is very lower
than the previous experimental value (15.4 µl/sec) [72]. Thus, from this experimental
observation, the physical washing of the chemical species on the IDTs be ruled out.
We have also observed that, the flow behavior depends only on the internal thrust
created inside the channel due to the relaxing of the actuator. Moreover, the internal thrust
created by the actuator can suddenly be released by removing the cover layer from the air

30
vent. Thus, both ends of the channel were open to ambient which minimizes the pressure
difference and hence liquid flow stops over the IDTs. Thus, this facility of the fluidic
system is proved advantageous in LOC applications where incubation is necessary for
chemical complex formations.

31
Chapter IV
4. LAB-ON-A-CHIP FOR MULTI-TARGET IMMUNOSENSING APPLICATIONS
The results presented in Chapter 3 demonstrated that fabricated fluidic system can be
used as LOC for immunosensing applications. To build upon the work described in
Chapter 3, an experiment was conducted on fluidic system for multi-target immunosensing.
Fluid was transferred without any external source by the release of micropump actuated by
hydraulic pressure (by pressing with a finger). Interdigitated transducer (IDT)-based
affinity-type sensors were employed for the detection and quantification of target
molecules in complex mixtures by affinity-based interactions. A single integrated micro-
pump is operated to perform all necessary washing and surface modification procedures.
The function of the hand-operated fluidic system as a LOC was tested with two target
biomarker protein models, such as human epidermal growth factor (hEGFR) and
interleukin (IL-6) antibodies. Each LOC consists of eight IDTs, three inlets and an air vent
(Figure 3-5). Additionally, three integrated microfluidic channels each of 100 µm width
were connected to the inlets and the actuating chamber which passes over the IDT surface.
4.1 Surface Modification of Transducer
The first stage in the development of immunosensing LOC was to optimize the
thiolization of the metal electrodes for the immobilization of protein. The protocols
developed for the stable immobilization were presented in Appendix A (optimization of
linker chemistry). The IDT surface was covalently modified with thiol linkers by self
assembly approach, which gives uniform layer of the linker molecule and the maximum

32
sample surface coverage. The IDT surface was then positively charged by activating with
EDC-NHS coupling, which readily binds protein antibodies.
4.2 Immobilization of antibodies
The SAM (MUDA) coated gold-IDT (GIDT) surface was activated using a mixture
of 0.1 M EDC and 0.05M NHS (1:1). Both reagents were prepared in sterile deionised
water and immediately mixed before use. Activation of each IDT was performed through
microfluidic channels of the system by cycle-1 process. After 4 hour incubation, the sensor
system was then washed with PBS buffer and antibody immobilization was performed.
Triplicate IDTs were coated with 30 µg/ml concentrations of anti-hEGFR and IL-6
antibodies in buffer. After the antibody immobilization process, the sensing platform was
washed with PBS and subjected to antigen binding along with appropriate controls.
4.3 Multiple protein marker detection
Multiple protein marker detection was performed using microfluidics system
fabricated as described in Chapter 3. hEGFR and IL-6 markers were used as target
biomarker proteins for simultaneous detection of cancer and cardiac diseases. In a healthy
individual, the normal level for hEGFR is lower than 8 ng/ml and for IL-6, it is lower than
100 pg/ml. Any level higher than the specified would drastically increase the risk of cancer
and cardiac diseases [95-97]. The EGFR (cancer marker) and IL-6 (cardiac marker) levels
were detected in the concentration range of 0.1-10 ng/ml in human serum. 10 ng/ml of each
marker was prepared in 100% human serum and lower concentrations were then diluted
from the stocks using normal serum. 50 ng/ml of BSA protein was used as negative control
on the antibody immobilized surface to validate the specificity of the binding between
target antibody-antigen pairs. Each concentration of the markers was measured in three
parallel and triplet measurements using network analyser for accuracy and error analysis. A
two hour incubation time was applied at the antigen binding step and the microfluidic
system was then carefully washed with PBS and dH2O prior to taking measurements. The
functionalization of the IDT surface is schematically shown in Figure 4-1.
33
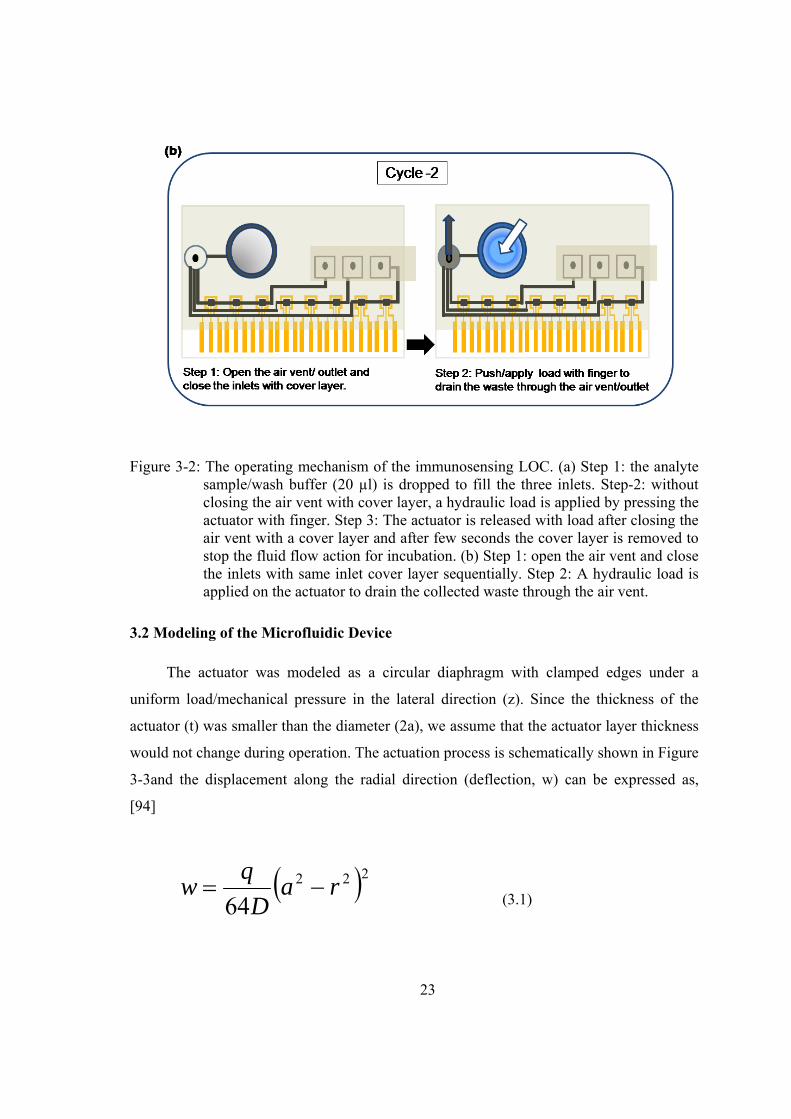
Figure 4-1: Schematic diagram of the bio-functionalization of the IDT surface.
4.4 Electrochemical Measurements
Impedimetric electrochemical measurements were performed using network analyzer
(Via echo 2500) which is portable and designed to operate between 4 MHz and 2.5 GHz
[98]. Triplet measurements were taken for each IDT of the LOC in the frequency range of
50 - 300 MHz and inter-assay analysis was performed. The S11 parameters during surface
functionalization and the immobilization were recorded. For the analysis, capacitance was
deduced from the S11 parameters. Figure 4-2 shows photographic image of the
electrochemical measurement setup. The deduced capacitance after antigen binding was
normalized with the values obtained from the respective antibody immobilization and the
results were analyzed as the normalized capacitance change (|ΔC|).
100*||%O
O
CCC
C−
=Δ (4.1)

34
where C and CO represent the capacitance after target binding and antibody
immobilization.
Figure 4-2: Photographic image of the hand-held format of measurement system.
4.5 Immunosensing LOC performance
The specificity of the sensor to hEGFR and IL-6 were derived from the specific
binding between the anti-hEGFR-hEGFR antigen, anti-IL-6-IL-6 antigen and no binding
with BSA, the negative control. In Figure 4-3 and Figure 4-4 we have observed a
significant change in |ΔC| for the hEGFR antigens (scan range: 230-280 MHz) and IL-6
antigens (scan range: 140-200MHz) concentrations. Further, it was found that the antigens
were clearly detected in the concentration range of 0.1 to 10 ng/ml.
The target antigens interact and bind to the specific antibody by which they achieve
certain active and vibrating three dimensional (3-D) conformations [99-100]. Thus, the
35
vibrations lead to the transfer of charges in the 3-D structure which predominantly
contribute to the frequency and consequently to the observed function. Hence, the
frequency of conformational vibration strongly depends on size of the 3-D structure and
surface charges that vary from one protein to another. For instance, the hEGFR (324 amino
acids) [101-102]is larger in size to IL6 (184 amino acids) [103]. Thus, the response of
IDTs treated with hEGFR protein is consistent in the range of 230-280 MHz whereas other
IDTs were consistent in the range of 140 to 200 MHz. Furthermore, with standard
experimental conditions (geometry of the IDTs and immobilization procedure), the |ΔC|
levels of IDTs with hEGFR complex are higher when compared to the responses of IDTs
with IL-6. Hence, the binding of an analyte to an immobilized molecule can be detected
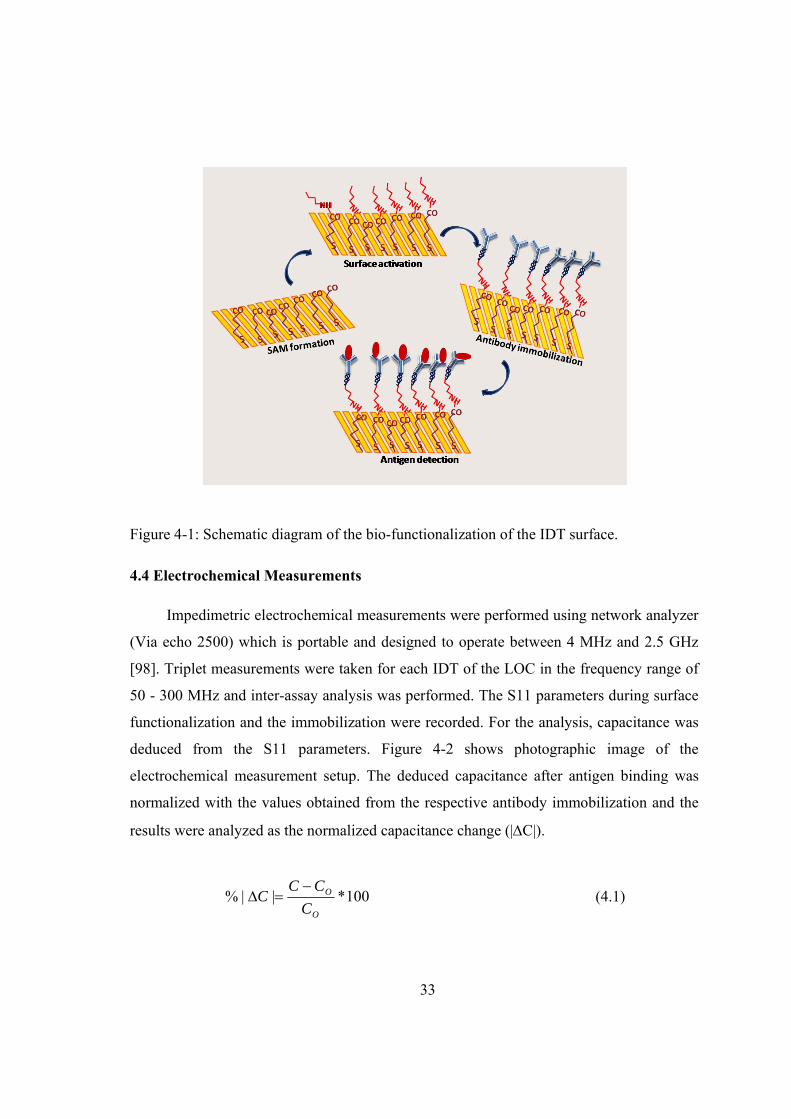
without labeling or secondary reactions using IDT measurements.
Figure 4-3: Relative change in capacitance obtained after anti-hEGFR immobilized IDTs were incubated with various concentrations of hEGFR antigens in serum in frequency range of 260-280 MHz.

36
It is observed from Figure 4-3 and Figure 4-4 that the binding/reaction process
involves a number of induced interactions between proteins (hEGFR and IL-6) and their
respective antigens. These interactions are highly selective, and this selectivity is defined
within the protein primary structure. The R1 and the R2 groups in any of the amino acid of
hEGFR/IL-6 [104] symbolizes alkyl side-chains, determining the electrical properties.
These R-groups are polar in nature [105] and the net charges vary with the interaction of
the R-group of anti- EGFR/IL-6 body with R- group of specific antigen and therefore
undergo local polarization process which influences the dielectric permittivity of the
surface. Therefore, the induced vibrations of the formed 3D structure due to the protein
binding lead to displacement of surface charges and cause a local disturbance of the
distribution of bound charges will occur at the dielectric interface [106] and these charges
move under strong confinement termed as dipole moment [105]. However, the physical
nature of these interactions is not yet well understood. Therefore, a hypothesis has been
developed in which the specific antibody-antigen interaction results in the polypeptides to
be chained in form of strings of connected dipoles; these dipole – dipole interactions
stimulate polarization on the sensor surface. The polarization cannot be measured directly
[107]; so a dielectric theory is invariably linked to polarization effects. The relation of the
antibody-antigen interactions with the dielectric properties is interpreted with the Cole-
Cole model [108].

37
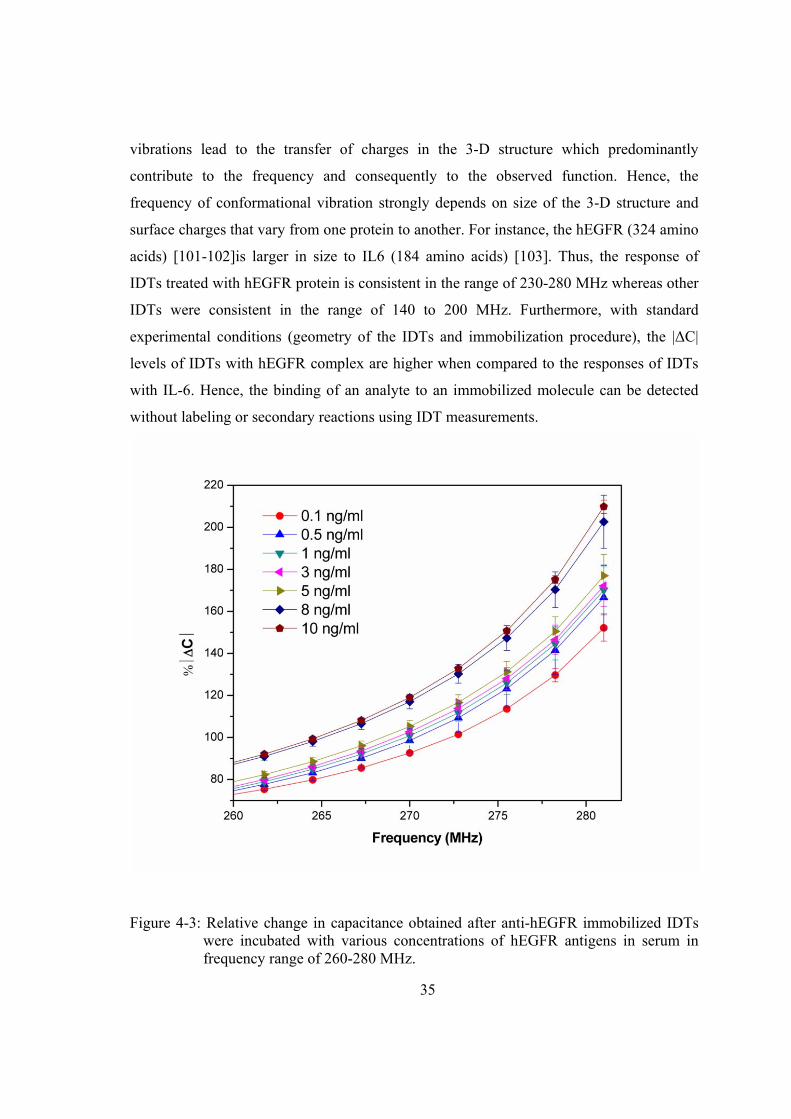
Figure 4-4: Relative change in capacitance obtained after anti-IL-6 immobilized IDTs were
incubated with various concentrations of IL-6 antigens in serum in frequency range of 140-200 MHz.
4.6 Detection analysis
4.6.1 Change in Dielectric Properties Induced by Antibody-Antigen Interaction
An IDT operates in a way that is very similar to a conventional parallel plate
capacitor where dielectric properties give information such as conductivity and permittivity
of the medium. The detection principle of conductivity and permittivity of medium is
based on capacitive coupling of the excitation signal produced by IDT electrodes [109].
Thus, the electric field lines always penetrate into the medium regardless of the position of
the electrodes (parallel or co-planar) [109]. Depending on the geometric configuration of
the electrodes, the electric field lines can penetrate deeper with wider electrode

38
configuration [109]. Therefore, the capacitance of the IDT always depends on the
geometry of the electrodes which is constant and the dielectric property of the medium.
While developing immunoassay on the IDT surface, different biochemical layers are
coated which increases the probe layer thickness and all biological samples have an
arrangement of electric charge carriers [110]. These charges are displaced by an external
electric field and polarized to neutralize the effect of the external electric field. This
dielectric response of each protein over the frequency spectrum is unique characteristic for
each of its kind [111].
The dielectric response of any material is represented in terms of its complex
dielectric permittivity ε* [112] and it is given as
"' εεε j−=∗ (4.2)
where the real part of permittivity ε΄ is called dielectric constant and is a measure of energy
stored from an external electric field in a material. The imaginary part of permittivity ε˝ is
called the loss factor and is a measure of the energy loss to an external electric field. The
loss factor is actually expressed as a function of both dielectric loss and conductivity and it
is given as
⎥⎦⎤
⎢⎣⎡ +−=∗
ωσεεε "'
dj (4.3)
where ε˝d is dielectric loss and σ is conductivity. Depending on their relaxation frequency
σ/ωε, a material falls into two categories: conductive material or dielectric material [112].
In general, when σ/ωε>>1, the material is considered as a good conductor or lossy
material. Similarly, the material is considered dielectrics or low-loss material if σ/ωε<<1.
Therefore, the intrinsic nature of the biochemical species would affect the imaginary part
of dielectric permittivity and hence the dielectric property of the coated medium changes.

39
However, the structure and nature of most protein/biological molecules are not defined to
the extent and direct measurements for complex dielectric permittivity are hard to achieve
[107]. Alternatively, the relationship between ε΄ and ε'' with frequency ω as the
independent parameter can be estimated using Cole-Cole model. It should be noted that
even when the conductivity of a material is zero, its complex dielectric permittivity may
have a non-zero imaginary part. The non-zero imaginary part is responsible for the energy
dissipation process due to dipole re-orientation and translational motion of charge carriers
[113].
4.6.2 Cole-Cole model for the detection of EGFR and IL-6 proteins
The Cole – Cole model has been successfully used to describe the experimental data
for the dielectric constant of many biomaterials as a function of frequency [114]. The
imaginary dielectric permittivity depends mainly on five parameters: the static impedance
Ro, the impedance at infinite frequency R∞, the relaxation time constant (τo), polarizability
(m) and an exponent factor c [114]. In principle, Ro and R∞ can be calculated from
measured S11 parameters by finding global minimum and global maximum, and the other
three parameters τo, m and c have to be treated as fitting parameters whose values can be
retrieved from the best fit to the experimental data using MATLAB (Appendix B). Thus,
the spectral response was reckoned by an equivalent circuit model with discrete elements,
as presented in Figure 4-5. The impedance of the equivalent network is given in equations
4.4-4.6. Using the equations an algorithm in MATLAB has been developed to obtain the
Cole–Cole parameters from experimental data.
⎭⎬⎫
⎩⎨⎧
⎥⎦
⎤⎢⎣
⎡+
−−= cjmoZZ
)(1111)()(ωτ
ω (4.4)
)(oZRo = (4.5)
[ ]moZR −=∞ 1)( (4.6)

Fi
H
in
in
co
bi
hE
m
T
igure 4-5: Efr
However, eq
nvestigation
nteraction m
onstants de
inding even
EGFR and
model using
able 4-1: Vp
Protein (Target bo
Anti-IL-6
IL-6(Ab-A
Anti-hEGF
hEGFR(Ab
BSA (cont
Equivalent cfrequency im
quation (4.2)
ns but quite
mechanism
duced by f
nts can be
IL-6 prote
the Cole-C
Variation ofproteins and
ound) P
Ag)
FR
b-Ag)
trol)
circuit; whempedance.
) is an emp
suitable for
such as the
fitting S11
estimated.
eins were m
ole model p
f Cole-Coled BSA (for n
olarizabilit
0.1623
0.5548
0.1751
0.7219
0.1927
ere R∞ is the
irical formu
r comparati
e binding e
parameters
Hence, th
matched wit
parameters.
e parameternon-specific
ty (m)
40
e high frequ
ulation, not
ive studies w
events [115
s before and
he spectral
th the spec
rs with specc interaction
Relaxatioconstant (τo10-10 se
2.82
6.4
2.59
10.1
2.74
uency imped
intended fo
where there
]. By comp
d after targ
impedimet
cific antibod
cific interacns).
on time ec)
2
1
9
16
4
dance and R
or detailed m
e is a known
paring the p
get binding
tric respons
dy-antigen
ctions EGF
Resista
9.8
6.7
9.6
5.9
8.9
Ro are static
mechanistic
n, dominant
polarization
stages, the
ses of both
interaction-
R and IL-6
ance (Zo)
848
733
639
924
971
c
c
t
n
e
h
-
6

41
The data for each protein at each stage (before and after complex formation) were
fitted separately and the fitting parameters owing to the specific antibody-antigen
interaction are shown in Table 4-1. By comparison, the polarizability/chargeability (m) for
anti-IL-6 (antibody) is the lowest (m=0.1623) as the size of protein is small and increases
after binding with IL-6 antigens (m=0.5548) which consistent to the increase in charge
distribution upon antigen-antibody complex formation. The same trend was observed with
hEGFR protein, whereas with the control protein (BSA) target binding did not occur. This
infers that anti-hEGFR/IL-6 do not have receptors for control proteins. Moreover, this
complies with the theoretical concept that the polarizability after antigen-antibody
interactions should increase as surface conduction properties associated with the movement
of protein bound charges change under the applied electric field [105]. The behavioral
response from Cole-Cole model and hypothesis of variation of polarizability can be well
correlated to the previously reported studies [116-117].
4.7 Kinetic analysis of hEGFR and IL-6 proteins Binding on Sensor Surface
The affinity of the sensor surface immobilized with anti-hEGFR and anti-IL-6
binding to their respective targets was determined by non-linear regression analysis. The
extracted dissociation constants (Kd) were within the highest concentration of targets
applied (10 ng/ml) (Figure 4-6). The binding kinetics of the antigen and the antibody
interaction was dependent on avidity i.e., the synergistic binding affinity of multiple
interactions. The binding affinity can be significantly increased when multiple protein sites
are available for binding. The lower the Kd value the stronger the binding according to the
Langmuir adsorption isotherm [118]. Here, IL-6 showed strong binding compared to
hEGFR. Thus, the density of the available binding sites greatly impacted the avidity effect,
resulting in an apparent affinity between the protein and target when binding sites are
clustered in a close proximity. Thus, higher concentrations of target would not increase the
effective area density of the proteins or binding to specific antigens because of saturation
of binding sites. Hence, we observed saturation occurred at target concentrationsof8 ng/ml
and 5 ng/ml for hEGFR and IL-6, respectively. The sensitivity of the IDT was dependent
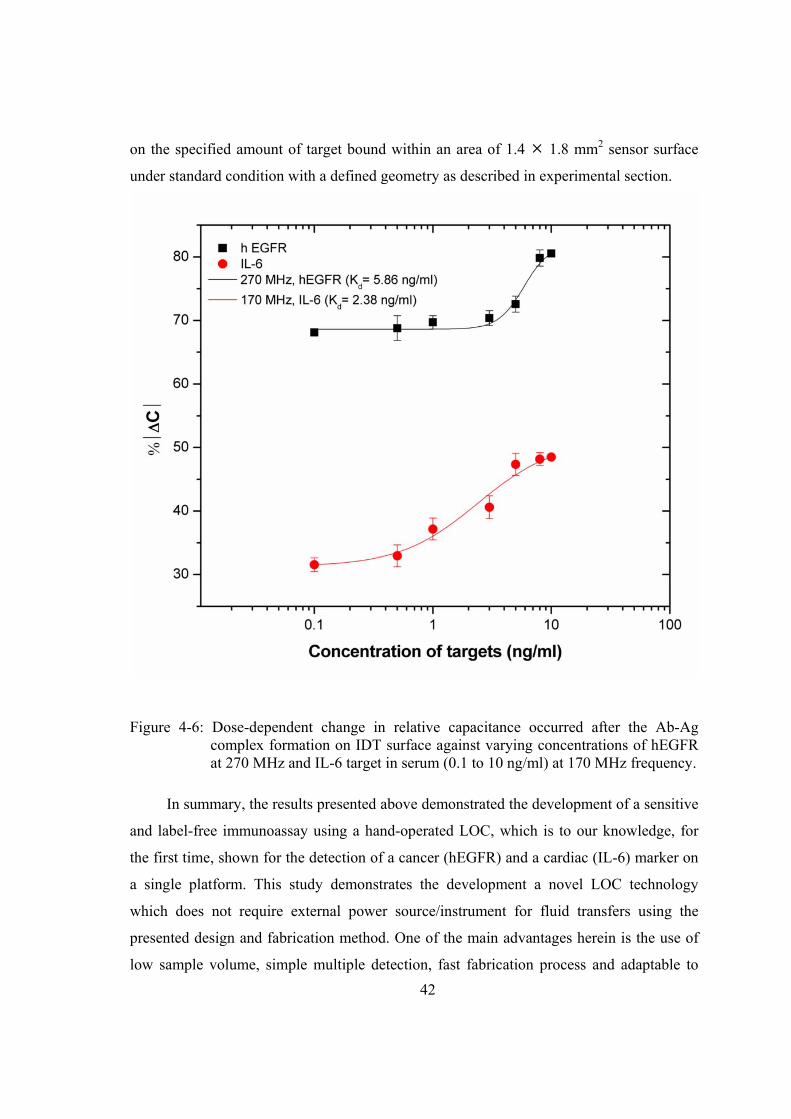
42
on the specified amount of target bound within an area of 1.4 1.8 mm2 sensor surface
under standard condition with a defined geometry as described in experimental section.
Figure 4-6: Dose-dependent change in relative capacitance occurred after the Ab-Ag complex formation on IDT surface against varying concentrations of hEGFR at 270 MHz and IL-6 target in serum (0.1 to 10 ng/ml) at 170 MHz frequency.
In summary, the results presented above demonstrated the development of a sensitive
and label-free immunoassay using a hand-operated LOC, which is to our knowledge, for
the first time, shown for the detection of a cancer (hEGFR) and a cardiac (IL-6) marker on
a single platform. This study demonstrates the development a novel LOC technology
which does not require external power source/instrument for fluid transfers using the
presented design and fabrication method. One of the main advantages herein is the use of
low sample volume, simple multiple detection, fast fabrication process and adaptable to

43
long incubation periods in immunosensing applications, which the current available
techniques fail to deliver [72, 119]. Thus, using label-free electrochemical-based
immunosensing methodology, we have demonstrated the detection mechanism and
sensitivity for hEGFR and IL-6 markers. Further, we have also modeled the detection
behavior using dielectric relaxation method and model parameters were obtained. This
model implies that the detection behavior or change in impedance upon antibody-antigen
interactions dominates the changes in dielectric properties between the capacitive IDT
finger electrodes.

44
Chapter V
5. LABEL- FREE DETECTION AND QUANTIFICATION OF NAMPT PROTEIN USING ssDNA APTAMER
The results presented in previous Chapter identify label-free detection methodology
as an alternate and reliable immunosensing approach for the quantification of protein
markers. We here extended the same approach for the determination of binding of single
stranded deoxyribonucleic acid (ssDNA) aptamers and Nampt protein target on an IDT
platform which contains 45 IDTs and each IDT works as an individual biosensor. Here,
ssDNA aptamers served as affinity ligands that specifically capture/bind Nampt protein.
These ssDNA aptamers were immobilized on gold IDTs and binding of Nampt to the
immobilized aptamers on IDTs was measured using the label-free method.
5.1 The Importance of Nampt Protein
The plasma Nampt levels are reported to have relation with obesity [120] and obese
related metabolic diseases, such as Type 2 diabetes mellitus (T2DM), cardiovascular
diseases [121-122] and hyperlipidemia [123] due to association with lipoprotein and
cholesterol. Moreover, Nampt was demonstrated to induce angiogenesis [124-125], hence
some studies have shown the correlation between the expression of the Nampt and the
various types of cancers[126]. For example, over expression of Nampt levels in colorectal
cancer [127-129], prostate cancer [130-131], gastric cancer [132], and breast cancer [133]
have been reported. In addition to these cancers and obese related diseases, various kinds
of diseases like polycystic ovary syndrome [134], chronic kidney disease [135], chronic
obstructive pulmonary disease [136] were also related. Therefore, Nampt was used as a
target protein to develop a label-free aptasensor for the first time.
45
Many research groups are involved in detection of this multifunctional biomarker
(Nampt) using enzyme linked immunosorbent assays (ELISA) [137-139]. However,
antibodies used in the ELISA possess some limitations with instability and functional
variations, and commercial ELISA with this antibody showed the discrepancies in clinical
studies [140]. Alternatively, aptamers are artificial oligonucleotides (DNA or RNA) with
the ability to recognize target molecules such as peptides, proteins, drugs, organic and
inorganic molecules or even whole cells, with high affinity and specificity can be utilized
for the biomarker detection. This specific recognition ability is conferred to these
oligonucleotides by virtue of their primary sequence that folds into a 3D globular shape
and specific for its target, here Nampt. Consequently, they have the chemical structure of
DNA or RNA, but behave functionally as antibodies.
5.1.1 Advantages of Aptamer-based Biosensor Development
The aptamers show an affinity for their targets comparable to, and sometimes even
better than, monoclonal antibodies [141]. They can also be selected against non-
immunogenic and toxic targets, because the Systematic Evolution of Ligands by
EXponential Enrichment (SELEX) process to produce aptamers does not rely on the
induction of an animal’s immune response, as is the case with antibody generation [142].
Aptamers are also very flexible. They can be easily labeled with reporter molecules, such
as fluorophores/enzymes and can be immobilized onto a surface, provided that the affinity
for its target is not affected [143]. As other important aspect, apart from their high target
affinity and the advantages described above, aptamers provide reusable affinity-based
biosensors, which was the major obstacle for the routine implementation of
immunosensors [144]. They can be easily regenerated by treatment with a denaturing agent
to break the aptamer-target complex [143]. When an aptamer is used as the biological
recognition element of a biosensor, it is termed an ‘aptasensor’. Thus, with the aptamer
stability and consistent working, many platforms that implemented the aptamer have been
reported in order to develop stable biosensor such as piezoelectric quartz crystal
microbalance biosensor [145], microfluidic device [146], surface plasmon resonance
biosensor [147] and gold nanoparticle based biosensor [148].

46
In the process of developing a label-free, affinity-based Nampt aptasensor, the
following amine modified Nampt specific ssDNA aptamer with the following sequence
was used :5’-NH2(CH2)6ATACCAGCTTATTCAATTGGGCAGGACAGGTGTCGGCT
TGATAGGCTGGGGTGTGTGTAGATAGTAAGTGCAATCT-3’that was previously
selected by FluMag-SELEX method [149] in our collaborator’s laboratory in South Korea.
5.2 Fabrication and Surface Modification of IDT arrays
The gold-IDT structures were patterned on Ø 100 mm silicon-silica (1µm) wafer
using the lift-off technique described in Chapter 2. The Nampt specific aptamer (5 µM)
was functionalized on the gold-IDT surface using protocol described in Appendix C.
Figure 5-1 shows the IDT structures while being functionalized. Various concentration of
the Nampt target protein (0-250 ng/ml) in binding buffer as well as serum was incubated
for 1 hour with the Nampt specific aptamer immobilized onto the IDT arrays. For the
confirmation of the specific detection of the aptamer, negative control samples with non-
specific proteins such as RBP4, vaspin and BSA were also incubated under identical
conditions.

47
Figure 5-1: Photographic image of the Ø 100 mm Si-SiO2 wafer with patterned gold-IDTs. Each wafer consisted of 45 IDT structures and can be used as an individual biosensing surfaces and replicates.
5.3 Electrochemical Measurements
For electrical measurement of the dielectric parameters (impedance/capacitance),
Karl-Suss (PM-5) RF probe station and agilent-8720ES S-parameter network analyzer
were used. The agilent 8720ES is a desktop network analyzer operates between 50 MHz
and 20 GHz. The scanned frequency range was between 50MHz and 1GHz. The network
analyzer was calibrated using SOLT (short-open-load-through) method and S-Parameter
data of the sensor were measured. The S11 parameters were measured at different stages of
surface modification processes. First, the parameters were measured with (a) blank IDT,
(b) IDT after SAM formation with the aptamer and ethanolamine blocking, (c) after
capturing of various concentrations of target and counter target on the aptamer-
immobilized IDTs. All measurements were performed in triplicates for the meaningful
statistical error analysis. The parameters were exported to Matlab and capacitance
components were extracted for the analysis. The changes in capacitance or dielectric
properties were compared (signal from blank, control, and after target capturing).

48
The percentage relative capacitance variations were calculated from the generated
data obtained within the 400–1000 MHz frequency range under standard assay conditions
using equation (5.1).
100arg0
0 ∗−
=Δcontrol
controlett
CCC
C (5.1)
where Ctarget is the capacitance after the binding of the Nampt target with SS DNA aptamer
at a particular concentration and Ccontrol is the capacitance before binding.
5.4 Response of Nampt in Buffer
The IDT-based biosensor showed consistent dose-dependent behavior in the range of
400-650 MHz frequency (Figure 5-2) for the detection of the Nampt in buffer and this
range was selected for the analysis. In this frequency range, biosensor chip showed
concentration dependent response only for the main target Nampt from 1 ng/ml to 50
ng/ml. The concentration higher than 50 ng/ml of Nampt did not show significant response
probably due to the saturated binding sites of the sensor surface. This may also have arised
from the competition between the captured Nampt and the free Nampt to bind on the
sensor surface containing immobilized aptamers. The limit of detection of this capacitive
biosensor was determined to be 1 ng/ml and a dynamic range was from 1 to 50 ng/ml
according to the linear fit derived from the extrapolated data points. With the view of the
clinical insight, this range can be considered to be in the clinical range because the
concentration of the Nampt in the patient suffering from T2DM is around 31.9 ng/ml and
the normal concentration is 15.8ng/ml [150]. To our knowledge, this is the first report
showing the lowest range for the Nampt detection using ssDNA aptamer.

49
Figure 5-2: Relative percentage change in capacitance obtained after Nampt ssDNA aptamer immobilized IDT’s after incubation with various concentrations of target in buffer. Inset figure shows a dose dependent change after the complex formation with varying concentrations of Nampt target in buffer at 500 MHz frequency.
5.5 Response of Nampt in Serum
While many sensors exhibit promising properties in aqueous buffer solution,
only few of them maintain their analytical properties when exposed to serum
samples because serum contains large amount of different proteins and other biological
molecules. Detection of a specific protein such as Nampt that exist in small concentration
is challenging task. However, in this study, our work focused on detection of Nampt in
complex serum utilizing the modified protocol that eliminates non-specific molecules
simply by washing away with appropriate buffer. This also ensured that only Nampt
protein was able to bind to aptamers on the IDTs surface. For this, initially, the Nampt
specific aptamer immobilized GID capacitor arrays were incubated with various
concentrations of Nampt (1-250 ng/ml) spiked in serum. After the incubation in serum

50
containing different concentration of Nampt, which specifically bind to ssDNA aptamers
leaving behind the non-specific serum proteins that were washed away using PBS buffer
and dried. These dried sensor surface were subjected to impedimetric measurements. As a
result, we observed dose dependent relative Nampt specific capacitive responses as a
function of frequency (Figure 5-3) without false positive signal. The binding of serum
spiked with the target Nampt with specific aptamer was achieved after the formation of
Nampt-aptamer complex due to the alternatively charged side chains of amino acids in
proteins and negatively charged ssDNA backbone [105]. The complex formation yield net
charge distribution on the GID surface and therefore undergo local polarization, hence
influence the dielectric properties on the sensor surface [108].
Figure 5-3: Relative percentage change in capacitance obtained after Nampt-ssDNA aptamer complex formed on IDTs after incubation with various concentrations of Nampt target in human serum sample.
5.5.1 Binding kinetics of ssDNA aptamer-Nampt in serum
Dose dependent analysis was performed with the help of Sigmaplot 10.0 program
assuming Langmuir adsorption isotherm and determination of affinity/dissociation constant

51
(Kd). The change of the capacitance against various concentrations of the Nampt spiked in
human serum was determined after incubating on IDTs with constant amount of ssDNA
aptamer. The capacitance response at four constant frequencies within the active frequency
range was chosen for the analysis (Figure 5-3). The kinetics of the binding reactions
between ssDNA aptamer and the target (Figure 5-4) were further supported by the
characteristic responses of the bound complex to the applied frequency, hence the
rotational relaxation time. The larger size/volume of the accumulating protein layer on the
capacitive biosensor surface tends to possess larger relaxation times arising from the
rotation of the protein molecules. Thus, the non-linear regression analysis confirms the
behavior of protein molecules including relaxation of proteins, and surface conduction
processes associated with movements of protein bound ions in a particular range of
frequency [106]. The data were fitted to non-linear regression analysis and the dissociation
constant assuming one aptamer binding to one target (ligand binding) was calculated to be
29.95, 33.37, 24.10 and 16.73 ng/ml at 700, 800, 900 and 1000 MHz, respectively. The
calculated dissociation constant suggests that maximum avidity was observed between 900
to 1000 MHz of frequencies. Therefore, that frequency range could be termed as activity
range for Nampt. Moreover, the aptamer and the target interactions were further verified
using the Cole-Cole model confirming the measured response was in accordance with the
theoretical model.

52
Figure 5-4: Dose dependent change in relative percentage change in capacitance. The response occurred after the aptamer-target complex formation on IDT surface against varying concentrations of Nampt target in serum, at four different frequencies indicated in the figure legend.
The data for Nampt aptamer at each stage (before and after target binding) was fitted
separately and the fitting parameters owing to the specific target binding interaction, is
shown in Table 5-1. The fitting parameter for polarizability did not vary much with control
targets whereas the levels with Nampt target elevated, inferring that moment of charges
between the ssDNA backbone and the targets occurred. Moreover, the polarizability after
Nampt target binding in serum is higher than target bound in buffer. This is because, serum
contains many other charged constituents that may have persisted and contributed to the
surface charge distribution despite of washing away all non-specific molecules. However,
for the analysis, this non-specific signal was also used to normalize with the data obtained
from appropriate negative controls under standard assay conditions.

53
Table 5-1: Cole-Cole fitting parameters with specific interactions of Nampt ssDNA aptamer with its respective target.
The label-free methodology developed for the detection of Nampt in this study can
be captured at detection limit concentrations as low as 1 ng/ml with dynamic range from 1-
50 ng/ml, which can cover the clinically important level because the plasma level of the
Nampt is 15 ng/ml.
Aptamer
(Target bound)
Polarizability
(m)
Relaxation time
constant (τo10-10 sec)
Resistance (Zo)
Nampt target
(buffer)
0.639 9.28 5.258
Nampt target
(serum)
0.813 14.82 4.149
Nampt ssDNA 0.151 3.14 7.961
Control 0.162 2.89 7.257

54
Chapter VI
6. ALTERNATE ELECTRODE MATERIALS FOR BIOSENSOR APPLICATIONS
Many challenges still remain with respect to commercialization of sensors and bulk
cost and the transducing electrode material is one of them. The work presented in this
Chapter focuses on the development of a thiol monolayer on other cost-effective, alternate
metals and to verify its immunosensing capabilities. The main challenge remains for metal
electrodes that are made other than gold. The formation of adherent and well-ordered SAM
[151] on such metals is a key issue and requires a strong interaction between the substrate
and the reactive moieties of the organic molecules in the form of a film. Researchers
successfully developed protocols for selectively immobilize biomaterials onto solid-state
(electrode) surface of the sensors / transducers. With this aim, there has been considerable
effort devoted for alkanethiols self assembled monolayers (SAMs) on gold surfaces and
functionalizing those surfaces with carbon nanotubes (CNTs) [152-154], nanoparticles
[152, 155-157] for biosensing applications. In spite of existence of numerous experimental
investigations in the area of biosensors, the material selection for the transducing platform
and the optimization in fabricating the transducers have not been well studied yet.
Therefore, nickel was considered to be a cost effective alternative to conventional/gold, as
a generic transducing platform for biosensing applications. For the first time to detect
cardiovascular risk markers, nickel was employed as an electrode material that has higher
durability and lower cost.
As explained in Chapter 2, the sputtered nickel was patterned as IDT structure
(Figure 2-2) using image reversal process on Ø 100 mm Si-SiO2 wafer. The surface of the
transducing surface was modified with the in-house developed protocol (Appendix A) and

55
for the immunoanalysis, CRP protein antibodies were immobilized. As performed in
Chapter 5, the same experimental procedure was adapted and S11 parameters were
measured at different stages. Interestingly, the nickel IDT structures have shown no
structural resonance between 50 MHz and 20 GHz (Figure 6-1). This is because, in low-
frequency region, the impedance parameter is practically constant. Thereafter, at medium
frequencies, due to the concentration of the current (i.e., reduction of the effective
conductor cross section), the capacitive behavior tends to decrease. This current
concentration modifies the magnetic field in the space between the nickel finger structures
and hence reduces the external inductance. Simultaneously, the magnetic field within
fingers is reduced, resulting in a decay of the internal inductance, which contributes to the
decay of the total inductance. At high frequencies, when the edge, proximity and skin
effects are fully pronounced, the inductance per unit length tends to a constant value [158].
Figure 6-1: Capacitance measurements of Nickel IDT patterned on Si-SiO2 substrate.

56
However, in the scope of this work, the coated SAM layer was first verified with FT-IR
and from the analysis developed in section 2.1, measurements were taken between 50MHz
and 4 GHz. The parameters were exported to Matlab and impedance (no inductance was
observed) components were extracted for the analysis. The deduced impedance after
antigen binding was normalized with the values obtained from the respective antibody
immobilization and the results were analyzed as the normalized impedance change (|ΔΖ|)
(same as equation 4.1 with impedance Z). However, further characterization of the Nickel
based IDTs is required to potentially use for biosensing applications.
6.1 Verification of SAM layer
The formation of SAM layer and surface activation of IDT surface was verified by
recording Fourier Transform Infrared (FT-IR) spectrum and correlated with reference
spectra [159]. All spectra were collected with 64 scans for the reference and the sample,
with 4 cm-1 resolution in the reflection mode. The FT-IR spectra obtained from MPA SAM
surface is shown in Figure 6-2(a). Since MPA contains the CH2 back bone, its spectrum
shows CH2 symmetric and CH2 asymmetric stretch modes around 2855 and 2950 cm-1.
The spectrum also reveals an out of plane mode rocking vibration of CH2 bond [160-161]
at 740 cm-1. The disappearance of the band at 2551.5 cm-1, corresponding to S-H band
stretch is an indication that the MPA is being adsorbed on nickel surface through the
sulphur group [161]. The stretch at 1150 cm-1 corresponds to anti symmetrical coupling
between C-O to C-C. Next, the SAM surface was activated by incubating EDC-NHS
mixture on MPA. The FT-IR spectrum of the activated surface is shown in Figure 6-2 (b).
The two features between 1500-1700 cm-1 correspond to the formation of ester [162]. The
spectra also reveal the formation of a bend vibration at 3300 cm-1, which corresponds to N-
H.
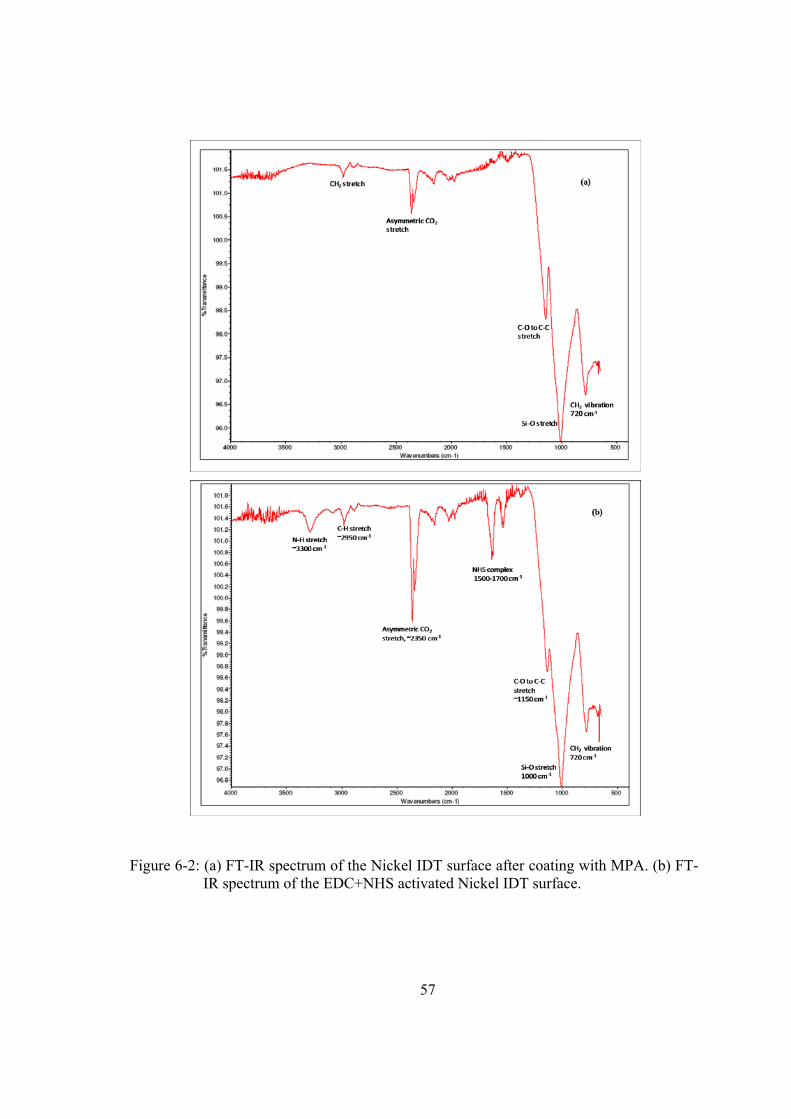
57
Figure 6-2: (a) FT-IR spectrum of the Nickel IDT surface after coating with MPA. (b) FT-IR spectrum of the EDC+NHS activated Nickel IDT surface.

58
6.2 Validation of Nickel Electrochemical Properties for Immunoassay Applications
In Figure 6-3, we observed a significant change in impedance for the CRP antigens
concentrations, which was in the frequency range of 50 MHz and 4 GHz. Also the
impedance measurements observed from various concentrations (25, 800 ng/ml) of BSA
and (500 ng/ml) of PSA (control proteins) as non-specific proteins are shown in Figure 6-3.
The non-specific proteins responses corresponded with the blank measurements while the
significant responses were obtained with the target CRP suggesting that the sensor surface
can be used as a potential alternative electrode material for biosensing applications.
However, detailed principle and underlying mechanism still needed to be explored.
0 1 2 3 40.1
0.2
0.3
0.4
0.50.60.70.80.9
1
2
| ΔZ
|
Frequency (GHz)
Conc. 800 ng/ml BSA Blank Conc. 25 ng/ml BSA Conc. 500 ng/ml PSA Conc. 50 ng/ml Conc 100 ng/ml Conc. 250 ng/ml Conc. 400 ng/ml Conc. 800 ng/ml
Figure 6-3: The change in normalized impedance values measured after incubating CRP antibody concentration (100 µg/ml) with series of antigen concentrations (0, 50, 250, 400, 800 ng/ml (CRP), 25, 800 ng/ml (BSA), and 800 ng/ml (PSA)) versus frequency as shown in the legend.

59
6.2.1 Extraction of Polarizability, a Cole-Cole Model Parameter
The developed detection model (Chapter 4) was verified by fitting the experimental
data acquired from immunoanalysis using nickel surface. The spectral impedimetric
responses are consistent with the specific antibody-antigen interaction-model deduced,
using the Cole-Cole model parameters.
Table 6-1: Variation of Cole-Cole polarizability parameter (m) with specific interactions (with CRP antibody-antigen) and non-specific interactions (with BSA and PSA).
The variation in polarizability (m) which is the difference of the polarization constant
before and after incubation of antigen onto antibody, owing to the specific antibody-
antigen interaction, is shown in Table 6-1. To comply with the theoretical concept, the
polarizability after antigen-antibody interactions should increase. The variation upto 800
ng/ml target antigen concentration was around ~0.30, (positive). The increase in
polarization constant after incubation is due to the rotation and the increase in the length of
protein molecule[163]. The polarizability constant remains unchanged (~ -0.09), when
control proteins (25, 800 ng/ml BSA and 500 ng/ml PSA) were applied onto CRP antibody
Concentration
(ng/ml)
Polarizability (m)
before incubation
Polarizability (m)
after incubation
Polarizability (m)
Difference
50 0.4077 0.6995 0.2918
100 0.3018 0.6020 0.3002
250 0.3090 0.6794 0.3794
400 0.3249 0.6474 0.3125
800 0.3405 0.6861 0.3456
25 (BSA) 0.3787 0.3282 -0.0505
800 (BSA) 0.4010 0.3106 -0.0904
500 (PSA) 0.5753 0.4611 -0.1142

60
surface. This infers that CRP antibodies do not have receptors for BSA and PSA control
proteins. Further, by observing the increase in polarization constant, which was consistent
with our previous results (Chapter 4 and Chapter 5) suggesting that nickel-based electrode
can be a cost effective alternative to the conventional electrode material such as gold.

61
Chapter VII
7. SUMMARY, CONCLUSION, AND SUGGESTIONS FOR FUTURE WORK
In this thesis the development and implementation of a microfluidic system for
immunosensing applications are described. Different materials, chemistries and
methodologies were considered with the objective of constructing a label-free, affinity-
based immunosensing microfluidic chip in which a sequential chemical modification
process occurs in a controlled fashion. A silicon master is fabricated by means of UV-
photolithography. The master is used as a mould to cast an elastomer containing actuating
and channel structures. The elastomer is irreversibly bonded to a gold patterned glass
substrate after having been functionalized in oxygen plasma. The device was then actuated
for fluid transfers by creating a pressure difference between the inlet and outlet. The
function of the fluidic system as a LOC is verified by testing with different protein
markers. In addition to this, label-free approach is also implemented for quantifying
protein-ssDNA aptamer complex formation in buffer and human serum.
To date no specific protocol has been defined for integrating fluidic components with
biosensor. Therefore, it is important to consider several key issues that this thesis is mainly
focused. Before concluding this work, in the development and integration of biosensor
with a microfluidic system, several critical points have to be discussed sequentially, for eg.,
(a) why semiconductor substrate materials were chosen for sensor platform, (b) label-free
method, (c) IDT geometry, (d) linker chemistry, (e) electrochemical analysis and (f) the
behavior of proteins after complex formations. Further extensive research is required to
address these issues for potential application of LOC in medical diagnostics or other vital
applications.

62
7.1 Importance of Substrate
Almost all types of biological recognition molecules can be attached to a solid
substrate through a very wide variety of attachment mechanisms ranging from physical
adsorption to an array of covalent binding procedures [164]. This guarantees an enormous
diversity in biosensor specificity. The manners of signal transduction are also just as
widespread, offering a suitable detection mechanism for every application, be it optical,
mass-sensitive or electrochemical. The type of transducer material offers yet another
degree of freedom since many materials can be functionalized with molecules using the
correct attachment chemistry. However, not all transducer materials are usable with every
type of transduction mechanism. A fluorescence detection strategy [165], for instance,
requires a substrate with an intrinsically low background such as glass, while the electrical
properties of the material has less importance. For example, SPR-based biosensors [166], a
glass-Au or glass-Ag platform is mandatory. In electrochemical impedance spectroscopy
(EIS) and field effect transistor (FET)-based transduction [167], semiconductors and
metals are the preferred substrate and transducer material, since their conductivity can be
controlled and cheap production methods are available. Diamond has proven to be an
attractive alternate substrate material [168]. It can be made electrically semiconducting and
it is chemically inert in a wide range of solutions that can be modified, inferring the desired
functionality for the covalent attachment of biomolecules. However, high production cost
is a serious disadvantage associated with the use of diamond substrates [169]. In EIS
approaches, the parasitic losses during the low frequency analysis should be minimized
[92], coating/oxidizing the semiconductor surface with a thin layer of dielectric decrease
the parasitic effects [170].
The work presented in this thesis focused on impedance-based measurements.
Semiconductor materials such as glass, oxidized silicon are our primary choice of substrate
materials.

63
7.2 Method of Transduction
Choosing a specific transduction principle depends largely on the type and purpose
of the experiment. Since we aimed at point-of-care (POC) applications, desirable assets of
every experiment are speed, reliability and cost. Reaction speed can be attained by
eliminating the need for target labeling and offering the possibility of monitoring the
recognition reaction in real-time and/or before and after analyte addition. A frontline
requirement for test reliability is the generation of a dense and stably attached molecular
layer on top of the substrate. Finally, cost is largely reflected by the required equipment
and this certainly influences the possible integration of the platform in a POC application.
When focusing on a fast, label-free, and real-time detection scheme, this immediately
eliminates any indirect optical transduction principle (colorimetric, chemiluminescent, and
fluorescent) [171]. Moreover, the required instrumentation for fluorescent detection usually
represents a vast investment [172]. Similarly, Amperometry [173], Potentiometry [174]
and conductometry [175] usually require enzymatic labels generating electro-active species
that amplify the response. The EIS, FET-based transduction, SPR and QCM are generally
considered to be capable of real-time and label-free analyte detection. However, SPR [166]
sets very clear restrictions for the type of transducer material to be used. In this approach,
Au or Ag will need to be bio-functionalized. QCM [176] is temperature sensitive and
cannot readily be miniaturized and modified into a simultaneous detection scheme for
many analytes. Thus, in this work label-free EIS method was used for taking the
electrochemical measurements.
7.3 Detection modeling of IDTs
The geometry of the IDT and the properties of the substrate on which IDT patterned
greatly influence the parameters resonant frequency, frequency of operation etc. Since the
IDT being used for capacitive-based impediometric detection of protein interactions, the
wide (400 µm) ground shielding arms placed around the IDT structure (Figure 2-2)
increases the capacitance range of frequency. This is because most protein-based
64
interactions involve transfer of charges [177] which change dielectric properties of the
medium.
7.4 Linker Chemistry
We developed few protocols (Appendix A) on the basis of the transducing
mechanism which constitute an efficient two-step reaction to covalently attach
protein/aptamer to metal electrode as an improvement and a significant simplification of
the procedure that was suggested by Wang et al [178]. In a first step, a short chained thiol
in ethanolic solution (3-MPA) was attached to metal electrode surface where the sulfur
atoms adsorb to the metal surface during 24 hr incubation. The resulting COOH modified
metal surface was then ideally functionalized for the subsequent attachment of
protein/aptamer. The cross-linker molecule EDC in presence of NHS joined the COOH-
group of the metal surface to the NH2-group of the protein into a peptide bond.
Our approach yields a very versatile, robust and efficient technique to covalently
bind functional proteins/aptamers to metal surfaces. Importantly, our EDC mediated
strategy offers the following advantages. It is a simple and reproducible two-step procedure
in which EDC is a zero-length cross linker. This means that the molecule will not be
present in the eventual peptide bond between the protein and the thiol on the metal
electrode surface. For this reason, the protein molecules will be closer to the surface which
is beneficial for electronic detection of the specific binding.
7.5 Electrochemical Analysis
This thesis is based on frequency-based EIS platform where S11 parameters were
measured by different stages (blank IDT, after SAM formation, with the protein/aptamer,
after capturing of various concentrations of target on the immobilized IDTs). All
measurements were performed in triplicates for the meaningful error analysis. The
parameters were exported to Matlab and capacitive components were extracted for the
analysis. The changes in capacitance or dielectric properties were compared (signal from
blank, control and after target capturing) in the analysis.

65
With the characterization of fabricated IDT structures (Appendix C) it is observed
that each IDT shows a variation of ~0.01-0.1 pF from the base DC capacitance of 2 pF.
Thus, to eliminate such small variations in result, each extracted value from an IDT is
normalized with its own previous measurement result.
7.6 Protein complex formation and Its Influence
The specific antibody-antigen interaction stimulate polarization on the sensor surface
and polarization is invariably linked to the dielectric properties[177]. Hence, the
impedance parameters vary with the protein complex formations. The level of protein
hybridization can be influenced by size/nature of proteins and medium.
7.6.1 Size-dependent Variations of complex formation
Basing on the number of amino acid side chains attached to the monomer unit, the
size of the protein marker is defined [179],for instance, IL6 (each monomer consists of 184
amino acids) [103]. When the protein markers bind to their respective target they
hybridize. The target antigens interact and bind to the specific antibody by which they
achieve certain active and vibrating three dimensional (3-D) conformations [99-100] which
consist of the formation of folds, twisting or compression of protein polypeptide chains.
The vibrations of protein molecule lead to the displacement of electric charges on their
surface and thus, a particular frequency can interact with these vibrations [180]. Moreover,
there is evidence that proteins have certain conducting or semi-conducting properties, a
charge moving through the protein backbone and passing different energy stages caused by
different amino acid side groups can produce sufficient conditions for a specific
electromagnetic radiation or absorption. Hence, the frequency of conformational vibration
strongly depends on size of 3-D structure which varies from one protein to another. Thus,
the response of IDTs treated with hEGFR protein is consistent in the range of 230-280
MHz (Figure 4-3) whereas IDTs immobilized with IL6 are consistent in the range of 140 to
200 MHz (Figure 4-4).
66
7.6.2 Effect of Medium on Protein Complex
The dielectric responses for target spiked in serum immobilized with aptamer
showed considerably higher changes when compared the same concentrations of target in
buffer (Figure 5-2 and Figure 5-3). This was probably because of several factors that can
affect the behavior of dielectric responses. For example, the charged constituents of serum
contribute the net charge transfer after target binding.
7.7 Summary of Achievements
Within the primary scope of this thesis for the development of LOC for multiple
disease marker detection, different experimental works was performed. Further, the
developed label-free technology was used to realize a Nampt aptasensor and verified the
use of nickel as a transducing electrode. To show the improvement of the work achieved in
this research a comparison of experimental results was carried with the existing literature.
7.7.1 Microfluidic System
Various experimental models [73, 119, 181] of instrument-free on-chip actuating
fluidic systems have been studied for the development of the two stacked PDMS-based
fluid transferring system. Every model has a set of limitations such as cost and complexity
in fabrication, need for skillful operation and application which hinder the future
developments. However, the developed fluidic system is manufactured using a single
mylar mask with a simple two step fabrication protocol. A single actuator is designed to
perform both sprouting and sucking of the liquid samples and an air vent was used to
control the fluid flow (forward/backward) by releasing the back-pressure of the actuator. In
this work, we achieved a controllable flow rate of 300 nl/sec with hand-operation which is
lower than 15.4 µl/sec [72]. Very low sample volume consumption (~ 60 µl) is an added
advantage. Moreover, the flexibility of the design to stop the liquid flow at any instant of
time can be used for incubation purposes in immunosensing LOC applications which is not
available with previous works. Table 7-1 summarizes the performance of the developed
immunosensing LOC.

67
Table 7-1: Performance of the developed immunosensing LOC.
LOC features Advantageous(+)/
Disadvantageous (-) Comments
Fabrication complexity
LOC is a two stacked PDMS layered device bonded onto a pre-patterned glass substrate.
++++
Very easy to fabricate and achieve the bonding alignment as there are only three stacked layers.
Fabrication expenses
With a single mask, master mould can be patterned and it can be used for multiple manufacturing processes.
++++
Each fabricated microfluidic system is < 5 USD.
Fluid
transfer
By the application of hydraulic load peristaltic action was generated.
++++
On-chip actuation mechanism.
Fluid
control
Without any need of external instruments the fluid flow is controlled.
++++
A cover layer on the air vent is used as fluid control unit.
Multiple biomarker detection
With two cognitive controls, a maximum of six markers can be quantified using a single LOC.
++++
In this work LOC is designed to detect two different types of disease markers (EGFR and IL-6).
Sample volume
For testing, 20 µl volume of serum sample is required.
++++
The volume of required sample is very low when compared to any available label-free immunosensing LOC [72, 119].
Analysis time
The protocol developed in this work need 1 hr.
-----
The surface functionalization protocols can be modified and analysis time can be minimized.
Portability
LOC is designed to fit on a microglass slide area of 7.5X5 cm2.
++++
In the design, on-chip actuator is placed separately which occupies larger area.

68
7.7.2 Biomarker Detection
Different investigators utilize different types of detection methodologies, even to
detect the same target [182]. Thus, being a label-free in approach for the detection of
biomarkers would be more advantageous and appropriate to compare our results with other
label-free techniques (such as QCM, SPR, and CV).
Table 7-2: Examples showing detection range of IL-6 markers using different techniques.
Method Type of Medium Sensitivity and Detected range Outcome of this
work
SPR Cell culture 0.78-12.5 ng/ml [183]
0.1-5 ng/ml in
serum
CV Buffer 5 E-10 to 5E-13 mM[184]
IDT Buffer 25 pg/ml to 25 ng/ml [185]
With the label-free methodology, there exists limited work performed for the
quantification of interleukin-6 marker (Table 7-2). Moreover, the amount of anti-IL6 used
in the experimentation was not clearly mentioned in the literature [183-184]. From our
laboratory we reported a detection limit of 25 pg/ml in buffer [185]. In this work, for 30
µg/ml of anti-IL6 on a specified area, we achieved a detection limit of 100pg/ml in serum,
and the use of serum is an added advantage for the detection in real patient samples. This
fair comparison provides that our label-free approach using IDT platform is more
functional with complex/biological background (in serum) while other methods use antigen
in buffer.

69
Table 7-3: Examples showing detection range of CRP markers using different label-free techniques.
Method Type of
Medium
Sensitivity and Detected range Outcome of
this work
QCM Buffer 0.13-25.016 ng/ml [186]
50-250 ng/ml
(buffer)
SPR Buffer 2-5 µg/ml [187]
Piezoresistive
cantilever
Buffer 10 ng/ml-1µg/ml [188]
The quantification of CRP protein was performed on nickel platform, where CRP
was used as a model analyte with an aim to investigate alternate transducing electrode for
biosensing applications. We observed a dynamic detection range of 50-250 ng/ml target for
a given anti-CRP concentration (100 µg/ml). This range falls within the concentration
levels of CRP-antigen in a cardiovascular disease risk conditions [189]. Table 7-3 shows
the comparison of the CRP detection range by other methods. One of the methods showing
lowest detection range has been reported by Kim et al [186] quantifying CRP in buffer
with a detection range of 0.13 to 25.016 ng/ml using 2 mg/ml concentration of anti-CRP
antibodies. The concentration of antibody used by other researchers as indicated above was
high when compared with our current approach. There exists a little information available
for the detection of other protein markers such as, hEGFR and Nampt using label-free
techniques. However, with ELISA techniques, a detection limit of 7-162 fmol/ml (21.50
fmol/ml ~ 850 ng/ml) in serum was reported for hEGFR [190]. We have obtained a
detection limit of 0.1 ng/ml for hEGFR and 1 ng/ml of Nampt using aptasensor in serum.
Although the detection limit was not as sensitive as ELISA, however, this label-free
method is rapid, less expensive and easy to use method for potential diagnostic
applications.

70
7.8 Conclusion
In conclusion, the ability to quantify the level of multiple disease markers from
serum is critical to ensure improved diagnosis and patient management in the early stages
of disease. Microfluidic LOC technologies have shown potential in the development of
point-of-care technologies for the rapid quantification of disease markers in serum [182].
Therefore, the aim of this thesis work was to design and fabricate a microfluidic
system/device that could be integrated with an immunosensing platform for multiple
disease markers detection. In particular, the fluidic device is designed to operate without
any need for additional instrumentation to drive the working fluids from which the disease
markers to be detected.
In this thesis, we have developed a prototype of an on-chip actuated microfluidic
system. The system is designed to transfer fluid with the application of hydraulic load on
the single integrated actuator for immunosensing applications. Label-free affinity-based
immunosensing methodology was implemented to verify the use of fluidic system as a lab-
on-a-chip (LOC) with integrated biosensing platform. We focused on multi-target detection
using this LOC. With dose dependent analysis, we achieved a detection limit of 0.1 ng/ml
for hEGFR and 0.1 ng/ml IL-6 concentrations in serum using specific antibodies. An array
setup with multiple markers is proposed that it offers at least one negative control to
analysis cycle can be executed for detection of target proteins. The developed microfluidics
system can be hand-actuated and easily integrated to a platform where there is no
availability of external fluid driving mechanisms or power sources. This new prototype
enabled both consistent capacitance reading and also real-time detection to be performed in
complex serum. The realized fluidic system with integrated biosensor platform will be
extended from a proof-of-principle into a clinical setting. We wish to extend our novel on-
chip actuating mechanism to other fields such as delivery of sensitive samples, for field-
portable and point-of-care (POC) applications.
The work presented in this thesis laid the groundwork for the development of a
prototype of a LOC for real-time and label-free impedimetric immunosensing applications.
71
Although the target biomarkers used in this study are of intrinsically different nature and
their respective effects on the impedance introduced us to the fundamental events that
occur during antigen/target recognition. This will be developed further into a prototype of
an immunosensor with the ability to discriminate between two different targets/antigens
comparable in charge distribution. Eventually, the sensitivity and specificity of the sensor
will be challenged with patient whole serum. In addition, no external equipment is needed
to drive the fluid which provides neat flow of bio-fluids/wash buffers and can maintain a
stable environment on the IDT surface. This rather innovating approach, combining low
cost, system stability and reliability, holds promise to grow into a valuable complementary
technique for the widely applied endpoint microarrays.
In addition, theoretical Cole-Cole model parameters were extracted that
demonstrated the impedimetric properties of the surface upon the protein complex
formation. The model also implies that dielectric properties dominated the fringing effects
between the finger electrodes. Further, we have demonstrated that the label-free affinity-
based methodology can be used in realizing aptasensors for the detection of protein
molecules where the classical use of antibodies were replaced by specific aptamers.
7.9 Future prospects
Electronic signal readout from the IDTs, for instance, the width and pitch of the
electrical contact arrays to transfer the bio-analytical signal introduces signal loss and
increase the overall size of the LOC system. This can be surpassed with new compact
designs of assemblies/fixtures. A major limitation comes from the less stability of
integrated biological molecule for sensing specific target during the development of a high-
throughput miniaturized LOC-based immunosensor system. First of all, any attempt to
regenerate the active, antibody-modified sensor surface will often result in the inactivation
of these bio-recognition molecules (antibodies). Secondly, the production of monoclonal
antibodies is a very complicated and tedious procedure, expensive and difficult to obtain
for few target biomarkers. Therefore, alternative biological sensing elements, such as
chemically synthetic aptamers are to be explored to replace classical use of antibodies.

72
This thesis has provided a suitable biosensing platform with sufficient flexibility to
implement alternative setups. Thanks to our interdisciplinary expertise, these new
pathways towards biosensor development allow the establishment of new and exciting
research initiatives. All together, the groundwork was laid for obtaining a reliable and
sensitive impedimetric sensing scheme for proteins using antibodies and aptamers.
However, many demands are yet to be met and several factors needed to be taken into
consideration in order to use LOC applicable in routine clinical diagnostics. A prerequisite
for both types of sensors is their compatibility with ‘real-life’ samples for use in routine
diagnostics and research. The LOC-based impedimetric biosensor needs to be expanded
from a proof-of-principle into a sensor that retains its sensitivity and specificity when
challenged with patients’ samples for analysis. Though we tested for a few proteins in
serum, the impedimetric immunosensor must still remain functionally active in
physiologically relevant ranges in whole serum. Both the immunosensing LOC and the
hand-held readout not only need to be miniaturized for portability and easy handling, but
also to decrease analysis time into the minute-scale. For the immunosensor, this
miniaturization will also ensure a point-of-care application. In order to comply with all of
these demands, the first task at hand is the optimization of crucial parameters. These
include surface functionalization methods, density of probes, target concentration, novel
and miniaturized sensor designs for electro-chemical transducing and reliable fabrication
schemes in order to obtain a specific, sensitive and reliable impedance response at chosen
frequency. These issues will form the subjects of subsequent research projects and
challenges that lay before us.

73
REFERENCE [1] S. Sans, H. Kesteloot, D. Kromhout, The burden of cardiovascular diseases mortality in Europe, European heart journal, 18 (1997) 1231. [2] W. Koenig, M. Sund, M. Frohlich, H. Fischer, H. Lowel, A. Doring, W. Hutchinson, M. Pepys, C-reactive protein, a sensitive marker of inflammation, predicts future risk of coronary heart disease in initially healthy middle-aged men: results from the MONICA (Monitoring Trends and Determinants in Cardiovascular Disease) Augsburg Cohort Study, 1984 to 1992, Circulation, 99 (1999) 237. [3] C. Hennekens, J. Buring, J. Manson, M. Stampfer, B. Rosner, N. Cook, C. Belanger, F. LaMotte, J. Gaziano, P. Ridker, Lack of effect of long-term supplementation with beta carotene on the incidence of malignant neoplasms and cardiovascular disease, New England Journal of Medicine, 334 (1996) 1145. [4] H. Tunstall-Pedoe, K. Kuulasmaa, P. Amouyel, D. Arveiler, A. Rajakangas, A. Pajak, Myocardial infarction and coronary deaths in the World Health Organization MONICA Project. Registration procedures, event rates, and case-fatality rates in 38 populations from 21 countries in four continents, Circulation, 90 (1994) 583. [5] S. Sans, Chronic diseases and call to action, International Journal of Epidemiology, (2010). [6] P. Farmer, J. Frenk, F.M. Knaul, L.N. Shulman, G. Alleyne, L. Armstrong, R. Atun, D. Blayney, L. Chen, R. Feachem, Expansion of cancer care and control in countries of low and middle income: a call to action, The Lancet, (2010). [7] D.A. Morrow, J.A. de Lemos, Benchmarks for the assessment of novel cardiovascular biomarkers, Circulation, 115 (2007) 949. [8] J.A. Ludwig, J.N. Weinstein, Biomarkers in cancer staging, prognosis and treatment selection, Nature Reviews Cancer, 5 (2005) 845-856. [9] M. Network, i STAT blood analysis chip: A new approach to point of care diagnostics enabled by microfluidics and biosensors, in, Retrieved April, 2007. [10] C. waived, in, San Diego, 2003-2010. [11] C.N. Serhan, S.D. Brain, C.D. Buckley, D.W. Gilroy, C. Haslett, L.A.J. O’Neill, M. Perretti, A.G. Rossi, J.L. Wallace, Resolution of inflammation: state of the art, definitions and terms, The FASEB journal, 21 (2007) 325. [12] M.P. Marco, S. Gee, B.D. Hammock, Immunochemical techniques for environmental analysis I. Immunosensors, Trends in Analytical Chemistry, 14 (1995) 341-350. [13] G.X. Brogan Jr, S. Friedman, C. McCuskey, D.S. Cooling, L. Berrutti, H.C. Thode Jr, J.L. Bock, Evaluation of a new rapid quantitative immunoassay for serum myoglobin versus CK-MB for ruling out acute myocardial infarction in the emergency department, Annals of emergency medicine, 24 (1994) 665-671. [14] R.M. Lequin, Enzyme immunoassay (EIA)/enzyme-linked immunosorbent assay (ELISA), Clinical Chemistry, 51 (2005) 2415. [15] K.E.I. Vanoosthuyze, J. Cor, C.H. Van Peteghem, Development of a fast and simple method for determination of -agonists in urine by extraction on Empore membranes and detection by a test strip immunoassay, Journal of Agricultural and Food Chemistry, 45 (1997) 3129-3137. [16] R.W. Rosenstein, Solid phase chromatographic immunoassay, in, Google Patents, 1997.

74
[17] P. Wright, E. Nilsson, E. Van Rooij, M. Lelenta, M. Jeggo, Standardisation and validation of enzyme-linked immunosorbent assay techniques for the detection of antibody in infectious disease diagnosis, Revue scientifique et technique (International Office of Epizootics), 12 (1993) 435. [18] M. Battaglia, D. Pewsner, P. Juni, M. Egger, H.C. Bucher, L.M. Bachmann, Accuracy of B-type natriuretic peptide tests to exclude congestive heart failure: systematic review of test accuracy studies, Archives of internal medicine, 166 (2006) 1073. [19] A. Warsinke, A. Benkert, F. Scheller, Electrochemical immunoassays, Fresenius' Journal of Analytical Chemistry, 366 (2000) 622-634. [20] C.H. Self, D.B. Cook, Advances in immunoassay technology, Current Opinion in Biotechnology, 7 (1996) 60-65. [21] J.P. Gosling, A decade of development in immunoassay methodology, Clinical Chemistry, 36 (1990) 1408. [22] P. Skladal, Advances in electrochemical immunosensors, Electroanalysis, 9 (1997) 737-745. [23] R. Karlsson, P.S. Katsamba, H. Nordin, E. Pol, D.G. Myszka, Analyzing a kinetic titration series using affinity biosensors, Analytical Biochemistry, 349 (2006) 136-147. [24] P. Schuck, Use of surface plasmon resonance to probe the equilibrium and dynamic aspects of interactions between biological macromolecules, Annual review of biophysics and biomolecular structure, 26 (1997) 541. [25] A. Newman, K. Hunter, W. Stanbro, The capacitive affinity sensor: a new biosensor, in, 1986, pp. 596–598. [26] R. Taylor, I. G. Marenchic, and E. J. Cook, Anal. Chim. Acta, 213 (1988) 131. [27] R.F. Taylor, I.G. Marenchic, R.H. Spencer, Antibody- and receptor-based biosensors for detection and process control, Analytica Chimica Acta, 249 (1991) 67-70. [28] H. Maupas, C. Saby, C. Martelet, N. Jaffrezic-Renault, A.P. Soldatkin, M.-H. Charles, T. Delair, B. Mandrand, Impedance analysis of Si/SiO2 heterostructures grafted with antibodies: an approach for immunosensor development, Journal of Electroanalytical Chemistry, 406 (1996) 53-58. [29] H. Maupas, A.P. Soldatkin, C. Martelet, N. Jaffrezic-Renault, B. Mandrand, Direct immunosensing using differential electrochemical measurements of impedimetric variations, Journal of Electroanalytical Chemistry, 421 (1997) 165-171. [30] A. Gebbert, M. Alvarez-Icaza, W. Stoecklein, R.D. Schmid, Real-time monitoring of immunochemical interactions with a tantalum capacitance flow-through cell, Analytical Chemistry, 64 (1992) 997-1003. [31] W. Laureyn, D. Nelis, P. Van Gerwen, K. Baert, L. Hermans, R. Magnee, J. Pireaux, G. Maes, Nanoscaled interdigitated titanium electrodes for impedimetric biosensing, Sensors and Actuators B: Chemical, 68 (2000) 360-370. [32] T. Hang, A. Guiseppi-Elie, Frequency dependent and surface characterization of DNA immobilization and hybridization, Biosensors and Bioelectronics, 19 (2004) 1537-1548.

75
[33] A. Qureshi, J. Niazi, S. Kallempudi, Y. Gurbuz, Label-free capacitive biosensor for sensitive detection of multiple biomarkers using gold-interdigitated capacitor arrays, Biosensors and Bioelectronics, (2010). [34] A. Manz, N. Graber, H. Widmer, Miniaturized total chemical analysis systems: a novel concept for chemical sensing, Sensors and actuators B: Chemical, 1 (1990) 244-248. [35] N.T. Nguyen, S.T. Wereley, Fundamentals and applications of microfluidics, Artech House Publishers, 2002. [36] O. Geschke, H. Klank, P. Tellemann, Microsystem Engineering of Lab-on-a-chip Devices, Wiley Online Library, 2004. [37] P.S. Dittrich, A. Manz, Lab-on-a-chip: microfluidics in drug discovery, Nature Reviews Drug Discovery, 5 (2006) 210-218. [38] H. Salimi-Moosavi, R. Szarka, P. Andersson, R. Smith, D.J. Harrison, Biology lab-on-a chip for drug screening, in, Kluwer Academic Publishers, 1998, pp. 69. [39] B.H. Weigl, R.L. Bardell, C.R. Cabrera, Lab-on-a-chip for drug development, Advanced Drug Delivery Reviews, 55 (2003) 349-377. [40] S. Zafar Razzacki, P.K. Thwar, M. Yang, V.M. Ugaz, M.A. Burns, Integrated microsystems for controlled drug delivery, Advanced drug delivery reviews, 56 (2004) 185-198. [41] R.E. Oosterbroek, A. Berg, Lab-on-a-Chip: Miniaturized systems for (bio) chemical analysis and synthesis, Elsevier Science, 2003. [42] M. Brischwein, E. Motrescu, E. Cabala, A. Otto, H. Grothe, B. Wolf, Functional cellular assays with multiparametric silicon sensor chips, Lab Chip, 3 (2003) 234-240. [43] A.R. Wheeler, W.R. Throndset, R.J. Whelan, A.M. Leach, R.N. Zare, Y.H. Liao, K. Farrell, I.D. Manger, A. Daridon, Microfluidic device for single-cell analysis, Analytical chemistry, 75 (2003) 3581-3586. [44] N. Bontoux, L. Dauphinot, T. Vitalis, V. Studer, Y. Chen, J. Rossier, M. Potier, Integrating whole transcriptome assays on a lab-on-a-chip for single cell gene profiling, Lab on a Chip, 8 (2008) 443-450. [45] L. Roberts, New chip may speed genome analysis, Science, 244 (1989) 655. [46] A. Valouev, D.S. Johnson, A. Sundquist, C. Medina, E. Anton, S. Batzoglou, R.M. Myers, A. Sidow, Genome-wide analysis of transcription factor binding sites based on ChIP-Seq data, Nature methods, 5 (2008) 829. [47] B.M. Paegel, R.G. Blazej, R.A. Mathies, Microfluidic devices for DNA sequencing: sample preparation and electrophoretic analysis, Current opinion in biotechnology, 14 (2003) 42-50. [48] P. Hawtin, I. Hardern, R. Wittig, J. Mollenhauer, A.M. Poustka, R. Salowsky, T. Wulff, C. Rizzo, B. Wilson, Utility of lab on a chip technology for high throughput nucleic acid and protein analysis, Electrophoresis, 26 (2005) 3674-3681. [49] S. Mouradian, Lab-on-a-chip: applications in proteomics, Current opinion in chemical biology, 6 (2002) 51-56. [50] C.H. Ahn, J.W. Choi, G. Beaucage, J.H. Nevin, J.B. Lee, A. Puntambekar, J.Y. Lee, Disposable smart lab on a chip for point-of-care clinical diagnostics, Proceedings of the IEEE, 92 (2004) 154-173.

76
[51] B. Samel, V. Nock, A. Russom, P. Griss, G. Stemme, A disposable lab-on-a-chip platform with embedded fluid actuators for active nanoliter liquid handling, Biomedical microdevices, 9 (2007) 61-67. [52] R. Sista, Z. Hua, P. Thwar, A. Sudarsan, V. Srinivasan, A. Eckhardt, M. Pollack, V. Pamula, Development of a digital microfluidic platform for point of care testing, Lab on a Chip, 8 (2008) 2091-2104. [53] A. Richter, H. Sandmaier, An electrohydrodynamic micropump, in, IEEE, 1990, pp. 99-104. [54] C.L. Chen, S. Selvarasah, S.H. Chao, A. Khanicheh, C. Mavroidis, M.R. Dokmeci, An electrohydrodynamic micropump for on-chip fluid pumping on a flexible parylene substrate, in, IEEE, 2007, pp. 826-829. [55] J. Darabi, M. Rada, M. Ohadi, J. Lawler, Design, fabrication, and testing of an electrohydrodynamic ion-drag micropump, Microelectromechanical Systems, Journal of, 11 (2002) 684-690. [56] C.H. Chen, J.G. Santiago, A planar electroosmotic micropump, Microelectromechanical Systems, Journal of, 11 (2002) 672-683. [57] S. Debesset, C. Hayden, C. Dalton, J. Eijkel, A. Manz, An AC electroosmotic micropump for circular chromatographic applications, Lab on a Chip, 4 (2004) 396-400. [58] T. Bourouina, Design and simulation of an electrostatic micropump for drug-delivery applications, Journal of Micromechanics and Microengineering, 7 (1997) 186. [59] Y. Ji, C. Jian-mei, Research on terminal behavior of electrostatic micropump [J], Journal of Zhejiang University (Engineering Science), 5 (2005). [60] C. Yamahata, F. Lacharme, M.A.M. Gijs, Glass valveless micropump using electromagnetic actuation, Microelectronic engineering, 78 (2005) 132-137. [61] C. Yamahata, C. Lotto, E. Al-Assaf, M. Gijs, A PMMA valveless micropump using electromagnetic actuation, Microfluidics and Nanofluidics, 1 (2005) 197-207. [62] J. Jang, S.S. Lee, Theoretical and experimental study of MHD (magnetohydrodynamic) micropump, Sensors and Actuators A: Physical, 80 (2000) 84-89. [63] L. Huang, W. Wang, M. Murphy, K. Lian, Z.G. Ling, LIGA fabrication and test of a DC type magnetohydrodynamic (MHD) micropump, Microsystem technologies, 6 (2000) 235-240. [64] H. Van Lintel, F. Van de Pol, S. Bouwstra, A piezoelectric micropump based on micromachining of silicon, Sensors and Actuators, 15 (1988) 153-167. [65] R. Linnemann, P. Woias, C.D. Senfft, J. Ditterich, A self-priming and bubble-tolerant piezoelectric silicon micropump for liquids and gases, in, IEEE, 1998, pp. 532-537. [66] K. Junwu, Y. Zhigang, P. Taijiang, C. Guangming, W. Boda, Design and test of a high-performance piezoelectric micropump for drug delivery, Sensors and Actuators A: Physical, 121 (2005) 156-161. [67] F. Van de Pol, H. Van Lintel, M. Elwenspoek, J. Fluitman, A thermopneumatic micropump based on micro-engineering techniques, Sensors and Actuators A: Physical, 21 (1990) 198-202.

77
[68] O.C. Jeong, S.S. Yang, Fabrication and test of a thermopneumatic micropump with a corrugated p+ diaphragm, Sensors and Actuators A: Physical, 83 (2000) 249-255. [69] O.C. Jeong, S.S. Yang, Fabrication of a thermopneumatic micropump with aluminum flap valves, Journal Korean Physical Society, 37 (2000) 873-877. [70] S.B. Huang, M.H. Wu, Z. Cui, G.B. Lee, A membrane-based serpentine-shape pneumatic micropump with pumping performance modulated by fluidic resistance, Journal of Micromechanics and Microengineering, 18 (2008) 045008. [71] Y.N. Yang, S.K. Hsiung, G.B. Lee, A pneumatic micropump incorporated with a normally closed valve capable of generating a high pumping rate and a high back pressure, Microfluidics and Nanofluidics, 6 (2009) 823-833. [72] S.W. Park, J.H. Lee, K. Kim, H.C. Yoon, S.S. Yang, An electrochemical immunosensing lab-on-a-chip integrated with latch mechanism for hand operation, Journal of Micromechanics and Microengineering, 19 (2009) 025024. [73] J. Moorthy, G.A. Mensing, D. Kim, S. Mohanty, D.T. Eddington, W.H. Tepp, E.A. Johnson, D.J. Beebe, Microfluidic tectonics platform: A colorimetric, disposable botulinum toxin enzyme-linked immunosorbent assay system, ELECTROPHORESIS, 25 (2004) 1705-1713. [74] L.J. Kricka, Miniaturization of analytical systems, Clinical chemistry, 44 (1998) 2008. [75] G.D. Alley, Interdigital Capacitors and Their Application to Lumped-Element Microwave Integrated Circuits, Microwave Theory and Techniques, IEEE Transactions on, 18 (1970) 1028-1033. [76] R. Hoffmann, Handbook of microwave integrated circuits, (1987). [77] J. Wei, Distributed capacitance of planar electrodes in optic and acoustic surface wave devices, Quantum Electronics, IEEE Journal of, 13 (2002) 152-158. [78] P. Herczfeld, G. Ed, Special issue on applications of lightwave technology to microwave devices, IEEE Trans. Microwave Theory Tech, 38 (1990). [79] H. Wu, Z. Zhang, F. Barnes, C. Jackson, A. Kain, J. Cuchiaro, Voltage tunable capacitors using high temperature superconductors and ferroelectrics, Applied Superconductivity, IEEE Transactions on, 4 (2002) 156-160. [80] K. Kotani, I. Kawayama, M. Tonouchi, Dielectric Response of c-Oriented SrBi2Ta2O9 Thin Films Observed with Interdigital Electrodes, Jpn. J. Appl. Phys, 41 (2002) 6790-6792. [81] M. Zaretsky, J. Melcher, C. Cooke, Moisture sensing in transformer oil using thin-film microdielectrometry, Electrical Insulation, IEEE Transactions on, 24 (2002) 1167-1176. [82] W. Qu, W. Wlodarski, A thin-film sensing element for ozone, humidity and temperature, Sensors and Actuators B: Chemical, 64 (2000) 42-48. [83] C. Hagleitner, A. Hierlemann, D. Lange, A. Kummer, N. Kerness, O. Brand, H. Baltes, Smart single-chip gas sensor microsystem, Nature, 414 (2001) 293-296. [84] R. Casalini, M. Kilitziraki, D. Wood, M. Petty, Sensitivity of the electrical admittance of a polysiloxane film to organic vapours, Sensors and Actuators B: Chemical, 56 (1999) 37-44. [85] H. Endres, S. Drost, Optimization of the geometry of gas-sensitive interdigital capacitors, Sensors and Actuators B: Chemical, 4 (1991) 95-98.
78
[86] R. Zhou, A. Hierlemann, U. Weimar, W. Göpel, Gravimetric, dielectric and calorimetric methods for the detection of organic solvent vapours using poly (ether urethane) coatings, Sensors and Actuators B: Chemical, 34 (1996) 356-360. [87] U. Weimar, W. Göpel, Chemical imaging: II. Trends in practical multiparameter sensor systems, Sensors and Actuators B: Chemical, 52 (1998) 143-161. [88] S. Gevorgian, T. Martinsson, P. Linner, E. Kollberg, CAD models for multilayered substrate interdigital capacitors, Microwave Theory and Techniques, IEEE Transactions on, 44 (2002) 896-904. [89] A.M. Niknejad, C. Doan, S. Emami, M. Dunga, X. Xi, J. He, R. Brodersen, C. Hu, Next generation CMOS compact models for RF and microwave applications, in, IEEE, pp. 141-144. [90] S. Grimnes, Ø.G. Martinsen, Bioimpedance and bioelectricity basics, Academic press, 2008. [91] A. Quershi, Y. Gurbuz, W.P. Kang, J.L. Davidson, A novel interdigitated capacitor based biosensor for detection of cardiovascular risk marker, Biosensors and Bioelectronics, In Press, Corrected Proof. [92] K. Saravan, O. Gul, H. Basaga, U. Sezerman, Y. Gurbuz, Label-Free Biosensors for the Detection and Quantification of Cardiovascular Risk Markers, Sensor letters, 6 (2008) 1–5. [93] A. Qureshi, Y. Gurbuz, J. Niazi, Label-free detection of cardiac biomarker using aptamer based capacitive biosensor, Procedia Engineering, 5 (2010) 828-830. [94] S. Timoshenko, S. Woinowsky-Krieger, S. Woinowsky, Theory of plates and shells, McGraw-Hill New York, 1959. [95] H. Sasaki, H. Yukiue, K. Mizuno, A. Sekimura, A. Konishi, M. Yano, M. Kaji, M. Kiriyama, I. Fukai, Y. Yamakawa, Elevated serum epidermal growth factor receptor level is correlated with lymph node metastasis in lung cancer, International Journal of Clinical Oncology, 8 (2003) 79-82. [96] G. Manukyan, K. Ghazaryan, Z.A. Ktsoyan, M. Tatyan, Z. Khachatryan, G. Hakobyan, V. Mkrtchyan, D. Kelly, A. Coutts, R. Aminov, Cytokine profile of Armenian patients with Familial Mediterranean fever, Clinical biochemistry, 41 (2008) 920-922. [97] W. Schippinger, N. Dandachi, P. Regitnig, G. Hofmann, M. Balic, R. Neumann, H. Samonigg, T. Bauernhofer, The predictive value of EGFR and HER-2/neu in tumor tissue and serum for response to anthracycline-based neoadjuvant chemotherapy of breast cancer, American journal of clinical pathology, 128 (2007) 630. [98] I. AEA Technology, in, AEA Technology, Inc. , Carlsbad, 2011. [99] I. Cosic, Macromolecular bioactivity: is it resonant interaction between macromolecules?-Theory and applications, Biomedical Engineering, IEEE Transactions on, 41 (1994) 1101-1114. [100] I. Cosic, The resonant recognition model of macromolecular bioactivity: Theory and applications, Birkh auser Verlag (Basel and Boston), 1997. [101] K. Schwechheimer, S. Huang, W.K. Cavenee, EGFR gene amplification - rearrangement in human glioblastomas, International Journal of Cancer, 62 (1995) 145-148.

79
[102] A. Kumar, E.T. Petri, B. Halmos, T.J. Boggon, Structure and clinical relevance of the epidermal growth factor receptor in human cancer, Journal of Clinical Oncology, 26 (2008) 1742. [103] T. Orita, M. Oh-eda, M. Hasegawa, H. Kuboniwa, K. Esaki, N. Ochi, Polypeptide and carbohydrate structure of recombinant human interleukin-6 produced in Chinese hamster ovary cells, Journal of biochemistry, 115 (1994) 345. [104] S. GRIMNES, Ø. MARTINSEN, Bioimpedance and Bioelectricity Basics, 2000 London, in, Academic Press. [105] R. Pethig, D. Kell, The passive electrical properties of biological systems: their significance in physiology, biophysics and biotechnology, Physics in medicine and biology, 32 (1987) 933. [106] S. Grimnes, Ø. Martinsen, Bioimpedance and bioelectricity basics, Academic press, 2008. [107] R.S. Sethi, Transducer aspects of biosensors, Biosensors and Bioelectronics, 9 (1994) 243-264. [108] K. Cole, R. Cole, Dispersion and absorption in dielectrics. I. alternating current field, Journal of Chemical Physics, 9 (1941) 341. [109] A.V. Mamishev, K. Sundara-Rajan, F. Yang, Y. Du, M. Zahn, Interdigital sensors and transducers, Proceedings of the IEEE, 92 (2004) 808-845. [110] S. Linse, P. Brodin, C. Johansson, E. Thulin, T. Grundström, S. Forsén, The role of protein surface charges in ion binding, (1988). [111] C. Gabriel, S. Gabriel, E. Corthout, The dielectric properties of biological tissues: I. Literature survey, Physics in medicine and biology, 41 (1996) 2231. [112] W. Tinga, S. Nelson, Dielectric properties of materials for microwave processing-tabulated, J. Microwave Power, 8 (1973) 23-65. [113] M. Zahn, B.C. Lesieutre, A.V. Mamishev, Interdigital dielectrometry sensor design and parameter estimation algorithms for non-destructive materials evaluation, in, Massachusetts Institute of Technology, 1999. [114] J. Xiang, N. Jones, D. Cheng, F. Schlindwein, Direct inversion of the apparent complex-resistivity spectrum, Geophysics, 66 (2001) 1399-1404. [115] S. Gabriel, R. Lau, C. Gabriel, The dielectric properties of biological tissues: III. Parametric models for the dielectric spectrum of tissues, Physics in medicine and biology, 41 (1996) 2271. [116] S. Carrara, V. Bhalla, C. Stagni, L. Benini, A. Ferretti, F. Valle, A. Gallotta, B. Ricc , B. Samor Label-free cancer markers detection by capacitance biochip, Sensors and Actuators B: Chemical, 136 (2009) 163-172. [117] J. Heeres, S. Kim, B. Leslie, E. Lidstone, B. Cunningham, P. Hergenrother, Identifying Modulators of Protein- Protein Interactions Using Photonic Crystal Biosensors, Journal of the American Chemical Society, 131 (2009) 18202-18203. [118] R. Fowler, A Statistical Derivation of Langmuir's Adsorption Isotherm, in, Cambridge Univ Press, 1935, pp. 260-264. [119] S. Park, J. Lee, H. Yoon, B. Kim, S. Sim, H. Chae, S. Yang, Fabrication and testing of a PDMS multi-stacked hand-operated LOC for use in portable immunosensing systems, Biomedical Microdevices, 10 (2008) 859-868. [120] D.G. Haider, K. Schindler, G. Schaller, G. Prager, M. Wolzt, B. Ludvik, Increased plasma visfatin concentrations in morbidly obese subjects are reduced after

80
gastric banding, Journal of Clinical Endocrinology and Metabolism, 91 (2006) 1578-1581. [121] T.D. Filippatos, H.S. Randeva, C.S. Derdemezis, M.S. Elisaf, D.P. Mikhailidis, Visfatin/PBEF and Atherosclerosis-Related Diseases, Current Vascular Pharmacology, 8 (2010) 12-28. [122] T.B. Dahl, A. Yndestad, M. Skjelland, E. Oie, A. Dahl, A. Michelsen, J.K. Damas, S.H. Tunheim, T. Ueland, C. Smith, B. Bendz, S. Tonstad, L. Gullestad, S.S. Froland, K. Krohg-Sorensen, D. Russell, P. Aukrust, B. Halvorsen, Increased expression of visfatin in macrophages of human unstable carotid and coronary atherosclerosis - Possible role in inflammation and plaque destabilization, Circulation, 115 (2007) 972-980. [123] Y.C. Chang, T.J. Chang, W.J. Lee, L.M. Chuang, The relationship of visfatin/pre-B-cell colony-enhancing factor/nicotinamide phosphoribosyltransferase in adipose tissue with inflammation, insulin resistance, and plasma lipids, Metabolism, 59 93-99. [124] S.R. Kim, S.K. Bae, K.S. Choi, S.Y. Park, H.O. Jun, J.Y. Lee, H.O. Jang, I. Yun, K.H. Yoon, Y.J. Kim, M.A. Yoo, K.W. Kim, M.K. Bae, Visfatin promotes angiogenesis by activation of extracellular signal-regulated kinase 1/2, Biochemical and Biophysical Research Communications, 357 (2007) 150-156. [125] R. Adya, B.K. Tan, A. Punn, J. Chen, H.S. Randeva, Visfatin induces human endothelial VEGF and MMP-2/9 production via MAPK and PI3K/Akt signalling pathways: novel insights into visfatin-induced angiogenesis, Cardiovasc. Res., 78 (2008) 356-365. [126] T.Q. Bi, X.M. Che, Nampt/PBEF/visfatin and cancer, Cancer Biology & Therapy, 10 (2010) 119-125. [127] S.E. Hufton, P.T. Moerkerk, R. Brandwijk, A.P. de Bruine, J.W. Arends, H.R. Hoogenboom, A profile of differentially expressed genes in primary colorectal cancer using suppression subtractive hybridization, FEBS Letters, 463 (1999) 77-82. [128] J.R. van Beijnum, P.T.M. Moerkerk, A.J. Gerbers, A.P. de Brune, J.W. Arends, H.R. Hoogenboom, S.E. Hufton, Target validation for genomics using peptide-specific phage antibodies: A study of five gene products overexpressed in colorectal cancer, International Journal of Cancer, 101 (2002) 118-127. [129] T.E. Nakajima, Y. Yamada, T. Hamano, K. Furuta, T. Matsuda, S. Fujita, K. Kato, T. Hamaguchi, Y. Shimada, Adipocytokines as new promising markers of colorectal tumors: Adiponectin for colorectal adenoma, and resistin and visfatin for colorectal cancer, Cancer Science, 101 (2010) 1286-1291. [130] B. Wang, M.K. Hasan, E. Alvarado, H. Yuan, H. Wu, W.Y. Chen, NAMPT overexpression in prostate cancer and its contribution to tumor cell survival and stress response, Oncogene, 30 (2011) 907-921. [131] S.T. Patel, T. Mistry, J.E.P. Brown, R. Adya, H.S. Randeva, K. Desai, A novel role for the adipokine visfatin in prostate cancer, Bju Int, 103 (2009) 20-20. [132] T.E. Nakajima, Y. Yamada, T. Hamano, K. Furuta, T. Gotoda, H. Katai, K. Kato, T. Hamaguchi, Y. Shimada, Adipocytokine levels in gastric cancer patients: resistin and visfatin as biomarkers of gastric cancer, Journal of Gastroenterology, 44 (2009) 685-690.

81
[133] J.G. Kim, E.O. Kim, B.R. Jeong, Y.J. Min, J.W. Park, E.S. Kim, I.S. Namgoong, Y.I. Kim, B.J. Lee, Visfatin Stimulates Proliferation of MCF-7 Human Breast Cancer Cells, Molecules and Cells, 30 (2010) 341-345. [134] R. Gen, E. Akbay, N. Muslu, K. Sezer, F. Cayan, Plasma visfatin level in lean women with PCOS: relation to proinflammatory markers and insulin resistance, Gynecological Endocrinology, 25 (2009) 241-245. [135] M.I. Yilmaz, M. Saglam, J.J. Carrero, A.R. Qureshi, K. Caglar, T. Eyileten, A. Sonmez, E. Cakir, M. Yenicesu, B. Lindholm, P. Stenvinkel, J. Axelsson, Serum visfatin concentration and endothelial dysfunction in chronic kidney disease, Nephrology dialysis transplantation, 23 (2008) 959-965. [136] X.J. Liu, Y.L. Ji, J. Chen, S.Q. Li, F.M. Luo, Circulating visfatin in chronic obstructive pulmonary disease, Nutrition, 25 (2009) 373-378. [137] A. Garten, S. Petzold, A. Barnikol-Oettler, A. Korner, W.E. Thasler, J. Kratzsch, W. Kiess, R. Gebhardt, Nicotinamide phosphoribosyltransferase (NAMPT/PBEF/visfatin) is constitutively released from human hepatocytes, Biochemical and Biophysical Research Communications, 391 (2010) 376-381. [138] V. Catalan, J. Gomez-Ambrosi, A. Rodriguez, B. Ramirez, C. Silva, F. Rotellar, J.A. Cienfuegos, J. Salvador, G. Fruhbeck, Association of increased Visfatin/PBEF/NAMPT circulating concentrations and gene expression levels in peripheral blood cells with lipid metabolism and fatty liver in human morbid obesity, Nutr Metab Cardiovas, 21 (2011) 245-253. [139] G. Aust, M. Uptaite-Patapoviene, M. Scholz, O. Richter, S. Rohm, M. Bluher, Circulating Nampt and RBP4 levels in patients with carotid stenosis undergoing carotid endarterectomy (CEA), Clin Chim Acta, 412 (2011) 1195-1200. [140] K.D. Nusken, E. Nusken, M. Petrasch, M. Rauh, J. Dotsch, K.D. Nusken, M. Petrasch, Preanalytical influences on the measurement of visfatin by enzyme immuno assay, Clinica Chimica Acta, 382 (2007) 154-156. [141] C.K. O'Sullivan, Aptasensors-the future of biosensing?, Analytical and bioanalytical chemistry, 372 (2002) 44-48. [142] E.N. Brody, L. Gold, Aptamers as therapeutic and diagnostic agents, Reviews in Molecular Biotechnology, 74 (2000) 5-13. [143] T. Mairal, V. Cengiz Özalp, P. Lozano Sánchez, M. Mir, I. Katakis, C.K. O’Sullivan, Aptamers: molecular tools for analytical applications, Analytical and Bioanalytical Chemistry, 390 (2008) 989-1007. [144] S. Tombelli, M. Minunni, M. Mascini, Analytical applications of aptamers, Biosensors and Bioelectronics, 20 (2005) 2424-2434. [145] C. Yao, Aptamer-based piezoelectric quartz crystal microbalance biosensor array for the quantification of IgE Biosensors and Bioelectronics, 24 (2009) 2499-2503 [146] Y. Xu, Aptamer-based microfluidic device for enrichment, sorting, and detection of multiple cancer cells, Anal Chem, 81 (2009) 7436–7442. [147] S.J. Lee, B.S. Youn, J.W. Park, J.H. Niazi, Y.S. Kim, M.B. Gu, ssDNA aptamer-based surface plasmon resonance biosensor for the detection of retinol binding protein 4 for the early diagnosis of type 2 diabetes, Anal Chem, 80 (2008) 2867-2873. [148] W.J. Wang, C.L. Chen, M.X. Qian, X.S. Zhao, Aptamer biosensor for protein detection using gold nanoparticles, Anal Biochem, 373 (2008) 213-219.

82
[149] R. Stoltenburg, C. Reinemann, B. Strehlitz, FluMag-SELEX as an advantageous method for DNA aptamer selection, Analytical and Bioanalytical Chemistry, 383 (2005) 83-91. [150] M.P. Chen, F.M. Chung, D.M. Chang, J.C.R. Tsai, H.F. Huang, S.J. Shin, Y.J. Lee, Elevated plasma level of visfatin/pre-B cell colony-enhancing factor in patients with type 2 diabetes mellitus, Journal of Clinical Endocrinology and Metabolism, 91 (2006) 295-299. [151] S. Choi, J. Chae, Methods of reducing non-specific adsorption in microfluidic biosensors, Journal of Micromechanics and Microengineering, 20 (2010) 075015. [152] P. Hu, A. Fasoli, J. Park, Y. Choi, P. Estrela, S.L. Maeng, W.I. Milne, A.C. Ferrari, Self-assembled nanotube field-effect transistors for label-free protein biosensors, Journal of Applied Physics, 104 (2008) 074310. [153] K. Lee, P.R. Nair, A. Scott, M.A. Alam, D.B. Janes, Device considerations for development of conductance-based biosensors, Journal of Applied Physics, 105 (2009) 102046. [154] S.B. Tooski, Sense toxins/sewage gases by chemically and biologically functionalized single-walled carbon nanotube sensor based microwave resonator, Journal of Applied Physics, 107 (2010) 014702. [155] K. Lee, S. Lee, J.-R. Kim, B.K. Cho, Quantitative detection of magnetic particles in a chromatographic membrane by a giant magnetoresistance sensor, Journal of Applied Physics, 105 (2009) 07E713. [156] S.M.H. Rafsanjani, T. Cheng, S. Mittler, C. Rangan, Theoretical proposal for a biosensing approach based on a linear array of immobilized gold nanoparticles, Journal of Applied Physics, 107 (2010) 094303. [157] L. Wang, K. Yang, C. Clavero, A.J. Nelson, K.J. Carroll, E.E. Carpenter, R.A. Lukaszew, Localized surface plasmon resonance enhanced magneto-optical activity in core-shell Fe--Ag nanoparticles, Journal of Applied Physics, 107 (2010) 09B303. [158] A.R. Djordjevic, T.K. Sarkar, Closed-form formulas for frequency-dependent resistance and inductance per unit length of microstrip and strip transmission lines, Microwave Theory and Techniques, IEEE Transactions on, 42 (1994) 241-248. [159] B. Smith, Fundamentals of Fourier transform infrared spectroscopy, CRC, 1996. [160] Y. Zhou, H. Shi, Y. Zhao, Y. Men, S. Jiang, J. Rottstegge, D. Wang, Confined crystallization and phase transition in semi-rigid chitosan containing long chain alkyl groups. [161] A. Morales-Cruz, R. Tremont, R. Martínez, R. Romañach, C. Cabrera, Atomic force measurements of 16-mercaptohexadecanoic acid and its salt with CH3, OH, and CONHCH3 functionalized self-assembled monolayers, Applied Surface Science, 241 (2005) 371-383. [162] S. Sam, L. Touahir, J. Salvador Andresa, P. Allongue, J. Chazalviel, A. Gouget-Laemmel, C. Henry de Villeneuve, A. Moraillon, F. Ozanam, N. Gabouze, Semiquantitative Study of the EDC/NHS Activation of Acid Terminal Groups at Modified Porous Silicon Surfaces, Langmuir, 26 (2009) 809-814. [163] I. Cosic, E. Pirogova, V. Vojisavljevic, J. Fang, Electromagnetic properties of biomolecules, FME Transactions, 34 (2011) 71-80.

83
[164] C.D. Hodneland, M. Mrksich, Biomolecular surfaces that release ligands under electrochemical control, Journal of the American Chemical Society, 122 (2000) 4235-4236. [165] K. Schugerl, B. Hitzmann, H. Jurgens, T. Kullick, R. Ulber, B. Weigal, Challenges in integrating biosensors and FIA for on-line monitoring and control, Trends in Biotechnology, 14 (1996) 21-31. [166] J. Homola, S.S. Yee, G. Gauglitz, Surface plasmon resonance sensors: review, Sensors and Actuators B: Chemical, 54 (1999) 3-15. [167] H.K. Lyu, H.J. Choi, K.P. Kim, Y.S. Han, J.K. Shin, Impedance Characteristics of Gold-Extended-Gate Electrodes for Biosensor Applications, Sensor Letters, 9 (2011) 152-156. [168] A. Kraft, Doped diamond: A compact review on a new, versatile electrode material, Int. J. Electrochem. Sci, 2 (2007) 355-385. [169] N. Chaniotakis, N. Sofikiti, Novel semiconductor materials for the development of chemical sensors and biosensors: A review, Analytica chimica acta, 615 (2008) 1-9. [170] A. Franciosi, P. Philip, S. Chang, A. Wall, A. Raisanen, N. Troullier, P. Soukiassian, Electronic promoters and semiconductor oxidation: Alkali metals on Si (111) surfaces, Physical Review B, 35 (1987) 910. [171] M.M.F. Choi, Progress in enzyme-based biosensors using optical transducers, Microchimica Acta, 148 (2004) 107-132. [172] R.G. Smith, N. D'Souza, S. Nicklin, A review of biosensors and biologically-inspired systems for explosives detection, Analyst, 133 (2008) 571-584. [173] J. Wang, Amperometric biosensors for clinical and therapeutic drug monitoring: a review, Journal of pharmaceutical and biomedical analysis, 19 (1999) 47-53. [174] R. Koncki, Recent developments in potentiometric biosensors for biomedical analysis, Analytica chimica acta, 599 (2007) 7-15. [175] N. Jaffrezic-Renault, S.V. Dzyadevych, Conductometric microbiosensors for environmental monitoring, Sensors, 8 (2008) 2569-2588. [176] I. Mannelli, M. Minunni, S. Tombelli, M. Mascini, Quartz crystal microbalance (QCM) affinity biosensor for genetically modified organisms (GMOs) detection, Biosensors and bioelectronics, 18 (2003) 129-140. [177] R. Pethig, D.B. Kell, The passive electrical properties of biological systems: their significance in physiology, biophysics and biotechnology, Physics in medicine and biology, 32 (1987) 933. [178] H. Wang, S. Chen, L. Li, S. Jiang, Improved method for the preparation of carboxylic acid and amine terminated self-assembled monolayers of alkanethiolates, Langmuir, 21 (2005) 2633-2636. [179] J. Andrade, V. Hlady, Protein adsorption and materials biocompatibility: a tutorial review and suggested hypotheses, Biopolymers/Non-Exclusion HPLC, (1986) 1-63. [180] H. Frohlich, Coherent excitation in active biological systems, New York, Plenum Press, 1986. [181] J.D. Zahn, A. Deshmukh, A.P. Pisano, D. Liepmann, Continuous on-chip micropumping for microneedle enhanced drug delivery, Biomedical Microdevices, 6 (2004) 183-190.

84
[182] M.I. Mohammed, M.P.Y. Desmulliez, Lab-on-a-chip based immunosensor principles and technologies for the detection of cardiac biomarkers: a review, Lab Chip, (2010). [183] T.H. Chou, C.Y. Chuang, C.M. Wu, Quantification of Interleukin-6 in cell culture medium using surface plasmon resonance biosensors, Cytokine, 51 (2010) 107-111. [184] C. Berggren, B. Bjarnason, G. Johansson, An immunological Interleukine-6 capacitive biosensor using perturbation with a potentiostatic step, Biosensors and Bioelectronics, 13 (1998) 1061-1068. [185] A. Qureshi, J.H. Niazi, S. Kallempudi, Y. Gurbuz, Label-free capacitive biosensor for sensitive detection of multiple biomarkers using gold interdigitated capacitor arrays, Biosensors and Bioelectronics, 25 (2010) 2318-2323. [186] N. Kim, D.K. Kim, Y.J. Cho, Development of indirect-competitive quartz crystal microbalance immunosensor for C-reactive protein, Sensors and Actuators B: Chemical, 143 (2009) 444-448. [187] M.H.F. Meyer, M. Hartmann, M. Keusgen, SPR-based immunosensor for the CRP detection--a new method to detect a well known protein, Biosensors and Bioelectronics, 21 (2006) 1987-1990. [188] K.W. Wee, G.Y. Kang, J. Park, J.Y. Kang, D.S. Yoon, J.H. Park, T.S. Kim, Novel electrical detection of label-free disease marker proteins using piezoresistive self-sensing micro-cantilevers, Biosensors and Bioelectronics, 20 (2005) 1932-1938. [189] F.G. Hage, A.J. Szalai, The role of C-reactive protein polymorphisms in inflammation and cardiovascular risk, Current Atherosclerosis Reports, 11 (2009) 124-130. [190] R.R. Kumar, A. Meenakshi, N. Sivakumar, Enzyme immunoassay of human epidermal growth factor receptor (hEGFR), Human antibodies, 10 (2001) 143-148.

85
APPENDIX
A. Assay Design And Optimization
Buffers and solutions In the following section, a summary is given entailing the source of purchased solutions and the compositions of buffers that are prepared and being used throughout the thesis. Basic: 1.2 M NaOH 74% NH4OH Acidic: 1.2 M HCl 90% H2SO4 100% HNO3 Salts: 1 M NaCl 1 M KCl Conjugation buffer 1X PBS, containing: 0.05% Tween 20 10 X Phosphate buffer saline (PBS), pH 7.2 1.29 M NaCl 0.05 M Na2HPO4.2H2O 0.015 M KH2PO4
Purchased materials/chemicals GOx 50KU (168,800 units/g), phosphate buffer saline (PBS, pH=7.4), potassium iodide, Iodine, acetone, Isopropyl alcohol, 3 mercaptopropionic acid (3 MPA), 10 mercaptoundeconic acid (10 MUDA), 1-ethyl-3-(3-dimethylaminopropyl) carbodiimide(EDC), N-hydroxysuccinimide (NHS) are purchased from Sigma-Aldrich. Β-D-glucose, disodium hydrogen phosphate, sodium dihydrogen phosphate, potassium ferrocyanide, potassium chloride, hydro fluoric acid, nitric acid, sodium acetate were all acquired from Merck, Darmstadt, Germany. All solutions used in the experiments were prepared with deionized water (18.2 MΩ/cm, Millipore). Wafers/Substrates and electrode materials During the course of this thesis, silicon (Si), silicon dioxide (SiO2) 1 µm thick grown on Silicon wafers and Micro glass slides as substrates are utilized as base units for sensor surfaces. The metals like gold, titanium (adhesion promoter, to the gold), and nickel are used as electrode materials.

86
Wafer cleaning procedure Pre-fabrication cleaning is performed on all wafers and substrates used in experiments. RCA-1 Cleaning This process of cleaning is utilized for removal of organic contaminants. The application was performed with 1:1:5 solution of NH4OH (ammonium hydroxide) + H2O2 (hydrogen peroxide) + H2O (water) at 75 or 80 °C typically for 10 minutes. The treatment results in the formation of a thin silicon dioxide layer (about 10 Angstrom) on the silicon surface, along with a certain degree of metallic contamination (notably Iron) that shall be removed in subsequent step (RCA-2). This is followed by transferring the wafers into a DI water bath. RCA-2 cleaning In removal of the metallic contaminants deposited during RCA-1 clean, this process is performed with 1:1:6 solution of HCl + H2O2 + H2O at 75 or 80 °C. The treatment effectively removes the remaining traces of metallic (ionic) contaminants. This is followed by transferring the wafers into a DI water bath. Piranha cleaning This process (also known as piranha etch) is applied to remove organic impurities from the substrate surface. This is performed with 3:1 solution of H2SO4 (sulfuric acid) and H2O2 (hydrogen peroxide) at 1300 C for 15 minutes. This mixture is a strong oxidizer, it will remove most organic matter, and it will also hydroxylate most surfaces (add OH groups), making them extremely hydrophilic (water compatible). Plasma cleaning The use of plasma is an effective way to clean wafers/substrates without using hazardous solvents. Plasma is an ionized gas capable of conducting electricity and absorbing energy from an electrical supply. Manmade plasma is generally created in a low-pressure environment. When a gas absorbs electrical energy, its temperature increases causing the ions to vibrate faster and “scrub” a surface. We used equipment, DSE ICP DRIE at 50 W for 30 seconds to 1 minute with oxygen and argon as plasma gases. Optimization of linker molecule chemistry Adsorption, entrapment, and covalent attachment are the leading techniques employed for the immobilization of biomolecules onto solid metal supports. Adsorption of biomolecules is simple and mild. Entrapment of biomolecules in a polymer or within a membrane sealing appears to be straightforward, but in fact, there are technical snags when the analyte is large, movement through the polymer or membrane may be restricted. Thus throughout this thesis covalent attachment method was preferred over others for biomolecule binding. In this section a series of procedures/protocols involving the use of SAMs are described which exploit the covalent functionalization/modification of gold with organo-sulfur

87
compounds (3 MPA, MUDA) and/or silicon/silicon dioxide/glass with silanes (MPTS, APTS). Silanization During earlier stage of thesis work, silanization technique was employed for functionalization of active sensor surface. There are numerous ways to silanize surface and covalently attach biomolecules. This section concentrates on the methodology used in silanizing, the pre-fabricated IDT structures on glass/SiO2-Si substrates. The critical part of covalently modification is the preparation of the solid support to generate reactive hydroxyls. Thus surface cleaning was performed as explained in section 3.1.2.1. Protocol 1 (3-glycidoxypropyl)-trimethoxysilane (GPTS) was occasionally used for protein attachment. The epoxide group must be hydrolyzed and modified for reaction with the biomolecule directly or with cross linkers. Once the epoxide group is opened, additional modifications can be performed to get the desired reactive group. Immerse the wafer/substrate with pre fabricated IDTs in 2-10 % GPTS solution in 95% EtOH in ddH20 for 1 h at room temperature. Remove the silanized wafer/substrate from the solution and dry at 50 0C for 6 h. Immobilize proteins onto the silanized IDTs and incubate for 2 h at RT. Rinse the protein coated IDTs with PBS and can be stored or used for antigen incubation. Protocol 2 Octadecyltriethoxysilane (ODTS) was also employed for covalently linking the biomolecules. Immerse the wafer/substrate with pre fabricated IDTs in 2 % ODTS solution in Toulene and incubate for 24 h at RT. Remove the silanized wafer/substrate from the solution and rinse the wafer/substrate with Toulene. After nitrogen drying at RT for 5 mins, the silanized IDTs are protonated by EDC-NHS coupling. After 4 h incubation at RT, protein immobilization is performed on the IDTs. The modified IDTs can be stored or used for antigen incubation. Alkane thiolization During the course of thesis, the structural understanding of thiol compounds on metals was developed. In this section, design methods to reduce the nonspecific adsorption (NSA) of alkanethiol SAMs, which are popular linker molecules in biosensor applications. Different design parameters were studied for two different chain-length SAMs (n = 2 and 10). However, in the interest of this work the following protocol is developed and utilized. Protocol 3

88
The following 10 mM, MPA,/MUDA, and 1 mM, cysteamine solutions were employed for alkanethiolating the patterned metal IDTs. Basing on the need for different reactive group different alkanethiol is utilized. The fabricated IDT structures are cleaned using plasma as explained in section 3.. 1-10 mM solution of appropriate thiol is prepared in EtOH. The wafers/substrates were incubated in the solution for 24 h at RT. After cleaning the wafers with ddH2O the thiol SAMs are activated/protonated using EDC-NHS coupling solutions. On activated IDTs the proteins were immobilized and incubated for 2 h at RT. The modified IDTs can be stored or used for antigen incubation and measurement.
B. Matlab code for Cole-Cole model parameter extraction
clear all; X=XLSREAD(‘Filename’); x1=X(:,1); x2=X(:,2); x3=X(:,3); NN=size(x1); N=size(x1); p=ones(1,NN);%for field data q=ones(1,NN);%for theoretically estimated data Dt=rand(1,N);%white noise, this is for testing robustness for n=1:NN %calculate field data p(n)=x2(n).*(cos(x3(n)./1000)+i.*sin(x3(n)./1000)); end; %Intermediate variable buffers Mu=ones(1,N-1); %mu Le=ones(1,N-1); %lambda Ph=ones(1,N-1); %phi Ps=ones(1,N-1); %psi A=ones(1,N-1); %for A_k C=ones(1,N-1); %for C_k D=ones(1,N-1); %for D_k %Parameters CC0=-1; %c PP0=-1; %rho_0 MM0=0; %m TT0=0; %tau %Set searching interval for Golden Section Algorithm

89
%GN=20; %Number of sub-intervals GN=20; g0=1;%the optimal interval Smin=0;%smallest S CM=0; ECMIN=0; EV=ones(1,2); EP=ones(1,2); EX=ones(1,2); EM=ones(1,2);%For swap indexes COUNTMAX=100; %limit of iteration for gi=1:GN gd=0.998/GN; CH=0.001+gi*gd; CL=CH-gd; %For swap indexes CM=0; ECMIN=0; DC=CH-CL; %Calculate intermediate variables for k=1:N-1 Mu(k)=real(1/(p(k+1)-p(k))); Le(k)=imag(1/(p(k+1)-p(k))); Ph(k)=real(p(k+1)/(p(k+1)-p(k))); Ps(k)=imag(p(k+1)/(p(k+1)-p(k))); end; COUNT=0; %Count the number for golden iteration ID=1;%Index if the new testing point: ID=1 means new testing point is at %lower position (0.382), ID=2 means new testing point is at higher position (0.618) %set first two testiong points C1=CL+(CH-CL)*(1-0.618); C2=CL+(CH-CL)*0.618; %For golden section algorithm while DC>0.001&COUNT<COUNTMAX if COUNT==0 ID=1; elseif COUNT==1 ID=2; end; if ID==1 c=C1; else c=C2; end; %For calculating A,C,D;
90
SN=sin(c*pi/2); CS=cos(c*pi/2); for k=1:N-1 % w1=x1(k); w2=x1(k+1); D(k)=w2^c/(w1^c-w2^c); w1=x1(k)*2*pi; w2=x1(k+1)*2*pi; D(k)=w2^c/(w1^c-w2^c); A(k)=CS*w1^c*D(k); C(k)=SN*w1^c*D(k); end; %For calculating P S1=0; S2=0; for k=1:N-1 w1=x1(k)*2*pi; w2=x1(k+1)*2*pi; P1=(A(k)*Mu(k)+C(k)*Le(k)); P2=(w1^c*D(k))^2; S1=S1+P1; S2=S2+P2; end; P=S1/S2; %For calculating H S1=0; S2=0; for k=1:N-1 w1=x1(k)*2*pi; w2=x1(k+1)*2*pi; H1=A(k)*(Ph(k)+D(k))+C(k)*Ps(k); H2=(w1^c*D(k))^2; S1=S1+H1; S2=S2+H2; end; H=S1/S2; %Construct M, L M=ones(2*N-2,1); L=ones(2*N-2,1); for k=1:N-1 M(2*k-1)=A(k)*P-Mu(k); M(2*k)=C(k)*P-Le(k); L(2*k-1)=A(k)*H-Ph(k)-D(k); L(2*k)=C(k)*H-Ps(k); end; %Estimate parameters for given c %Assume p0 is real EP(ID)=inv(M'*M)*M'*L;% estimate rho_0 p0t=EP(ID); EX(ID)=P*p0t-H;% estimate tau^c Xt=EX(ID); CS=cos(c*pi/2); SN=sin(c*pi/2); S1=0; S2=0; for k=1:N O=(CS+i*SN)*(x1(k)*2*pi)^c*Xt; Q=abs(O/(1+O)); P=abs(1-p(k)/p0t); S1=S1+Q*P; S2=S2+Q*Q; end;

91
EM(ID)=S1/S2; %estimate m mt=EM(ID); %Calculate estimated value rho(k) for given c for n=1:N % q(n)=p0t*(1-mt*(1-1/(1+(CS+i*SN)*(x1(n))^c*Xt))); q(n)=p0t*(1-mt*(1-1/(1+(CS+i*SN)*(x1(n)*2*pi)^c*Xt))); end; %Get best interval if gi==1 g0=1; Smin=S; %Get parameter c cr=CC0; %Get parameter rho_0 p0r=PP0; %Get parameter tau tr=0; if XX0>0; tr=XX0^(1/cr); end; %Get parameter m; mr=MM0; else if S<Smin g0=gi; Smin=S; %Get parameter c cr=CC0; %Get parameter rho_0 p0r=PP0; %Get parameter tau tr=0; if XX0>0; tr=XX0^(1/cr); end; %Get parameter m; mr=MM0; end; end; end; %For overall error CS=cos(cr*pi/2); SN=sin(cr*pi/2); for n=1:NN

92
% q(n)=p0r*(1-mr*(1-1/(1+(CS+i*SN)*(w(n)*tr)^cr))); q(n)=p0r*(1-mr*(1-1/(1+(CS+i*SN)*(x1(n)*2*pi*tr)^cr))); end; S=0; for n=1:NN S=S+(real(p(n))-real(q(n)))^2+(imag(p(n))-imag(q(n)))^2; end; %Show result %S %overall error %COUNT %number of iterations p0r % rho_0 tr % tau mt % m
C. Structural Characterization of Fabricated IDT on Glass
The reproducibility of IDT fabrication process was investigated by measuring the dry capacitances of the electrodes. The variation between the consequent measurements of the same IDE (Figure D-1(a)) and the measurement differences between different IDEs (Figure D-1(b)) were minimal, showing that the optimised fabrication process produces good quality IDEs and the custom made PCB provides good connection between the IDEs and the LCR meter. Hence the developed system is suitable for use as a prototype biosensor.
Figure D-1:(a) Each IDE on a glass slide was measured three times and the averages of the readings were plotted in the graph. (b) Capacitance measurements of IDEs in three different glass slides were compared.
2.332.70 2.32
0.0
1.0
2.0
3.0
4.0
5.0
slide 1 (n=3) slide 2 (n=4) slide 3 (n=6)
Ca
pa
cit
an
ce
(pF
)
2.7
2.0 2.0 2.12.3 2.4
0
1
2
3
4
1 2 3 4 5 6
Cap
acit
an
ce (
pF
)
A B
Interdigitaded electrodes