development of a physiologically based pharmacokinetic
TRANSCRIPT
Inhalation Toxicology, 2009; 21(6): 552–582
R e s e a R c h a R t i c l e
Development of a physiologically based pharmacokinetic (PBPK) model for methyl iodide in rats, rabbits, and humans
Lisa M. Sweeney1, Christopher R. Kirman2, Shawn A. Gannon3, Karla D. Thrall4, Michael L. Gargas1, and John H. Kinzell5,6
1The Sapphire Group, Inc., Dayton, Ohio, USA, 2The Sapphire Group, Inc., Beachwood, Ohio, USA, 3Haskell Laboratory, E.I. DuPont de Nemours and Company, Newark, Delaware, USA, 4Battelle Pacific Northwest Laboratory, Richland, Washington, USA, 5Arysta LifeScience Corporation, Cary, North Carolina, USA, and 6Current address: Xeris Pharmaceuticals, Inc., San Rafael, California, USA
Address for Correspondence: Lisa M. Sweeney, The Sapphire Group, Inc., 2661 Commons Boulevard, Second Floor, Dayton, Ohio 45431, USA. E-mail: [email protected] or [email protected]
(Received 14 October 2008; accepted 05 November 2008)
Introduction
Methyl iodide (MeI) has been proposed as an alternative to methyl bromide as a pre-plant soil fumigant that does not deplete stratospheric ozone. As a result of this use, the most likely route of exposure to workers and bystanders is inhalation.
The metabolism of MeI has been studied and has been found to follow three general pathways: (1) conjugation with glutathione (GSH), liberating iodide (I−) with further metabolism of methyl glutathione to S-methyl cysteine and methanethiol; (2) oxidation by cytochrome P-450 to formal-dehyde; and (3) direct alkylation of cellular macromolecules, such as proteins and DNA. It is believed that oxidation by
P-450 is only a minor pathway in the overall kinetics of MeI (Chamberlain et al., 1998b).
In inhalation toxicity studies performed as part of the fumigant registration process, three effects have been iden-tified in animals that warrant consideration in developing toxicity reference values for human health risk assessment: nasal lesions (rat), acute neurotoxicity (rat), and late-term fetal resorptions (rabbit).
Uncertainties in the risk assessment of MeI can be reduced using an internal measure of target tissue dose that is linked to the likely mode of action (MOA) for the toxic-ity of MeI. Supporting discussions of mode of action and the key toxicity studies may be found in the companion
ISSN 0895-8378 print/ISSN 1091-7691 online © 2009 Informa UK LtdDOI: 10.1080/08958370802601569
abstractMethyl iodide (MeI) has been proposed as an alternative to methyl bromide as a pre-plant soil fumigant that does not deplete stratospheric ozone. In inhalation toxicity studies performed in animals as part of the registration process, three effects have been identified that warrant consideration in developing toxicity reference values for human risk assessment: nasal lesions (rat), acute neurotoxicity (rat), and fetal loss (rabbit). Uncertainties in the risk assessment can be reduced by using an internal measure of target tissue dose that is linked to the likely mode of action (MOA) for the toxicity of MeI, rather than the external exposure concentration. Physiologically based phar-macokinetic (PBPK) models have been developed for MeI and used to reduce uncertainties in the risk assessment extrapolations (e.g. interspecies, high to low dose, exposure scenario). PBPK model-derived human equivalent concentrations comparable to the animal study NOAELs (no observed adverse effect levels) for the endpoints of interest were developed for a 1-day, 24-hr exposure of bystanders or 8 hr/day exposure of workers. Variability analyses of the PBPK models support application of uncertainty factors (UF) of approximately 2 for intrahuman pharmacokinetic variability for the nasal effects and acute neurotoxicity.
Keywords: Methyl iodide; physiologically based pharmacokinetic (PBPK) modeling; iodide; glutathione
http://www.informapharmascience.com/iht
Inha
latio
n T
oxic
olog
y D
ownl
oade
d fr
om in
form
ahea
lthca
re.c
om b
y C
DC
Inf
orm
atio
n C
ente
r on
07/
10/1
2Fo
r pe
rson
al u
se o
nly.
MeI PBPK model 553
article by Kirman et al. (2009). Inhalation exposures to MeI in rats have resulted in lesions of the nasal olfactory epi-thelium (NOE) following acute and subchronic exposures. The weight of evidence supports the use of GSH depletion in the olfactory epithelium as an appropriate MOA for this endpoint. Neurotoxic effects have also been identified in acutely exposed rats. A mode of action for acute neurotox-icity of MeI is likely related to peak parent compound con-centration in the brain based on analogies to other small, halogenated hydrocarbons and the observed duration of effects. Late-term fetal rabbit deaths have been observed in MeI-exposed animals. A mode of action related to thyroid effects due to elevated iodide concentrations in the fetus is supported by recent studies and described in Kirman et al. (2009).
To properly evaluate the toxicokinetics of MeI in rats, rabbits, and humans, computational fluid dynamics-phys-iologically based pharmacokinetic (CFD-PBPK) models for all three species were developed. The CFD portions of the model were considered key for assessing local dosim-etry relevant to nasal lesions in rats and potential portal of entry impacts on systemic kinetics of MeI that could be rel-evant in all species. Physiologically based pharmacokinetic (PBPK) models have been developed for MeI and used to reduce uncertainties in the risk assessment extrapolations (e.g. interspecies, high to low dose, exposure scenario). As a part of model development, chemical-specific partition coefficients were derived for human, rabbit, and rat tissues,
and whole body metabolism of MeI in the rabbit was char-acterized. Additional laboratory studies were conducted to support model development and the results are reported in companion articles in this issue (Corley et al., 2009; DeLorme et al., 2009; Himmelstein et al., 2009; Poet et al., 2009; Thrall et al., 2009a, 2009b).
Methods
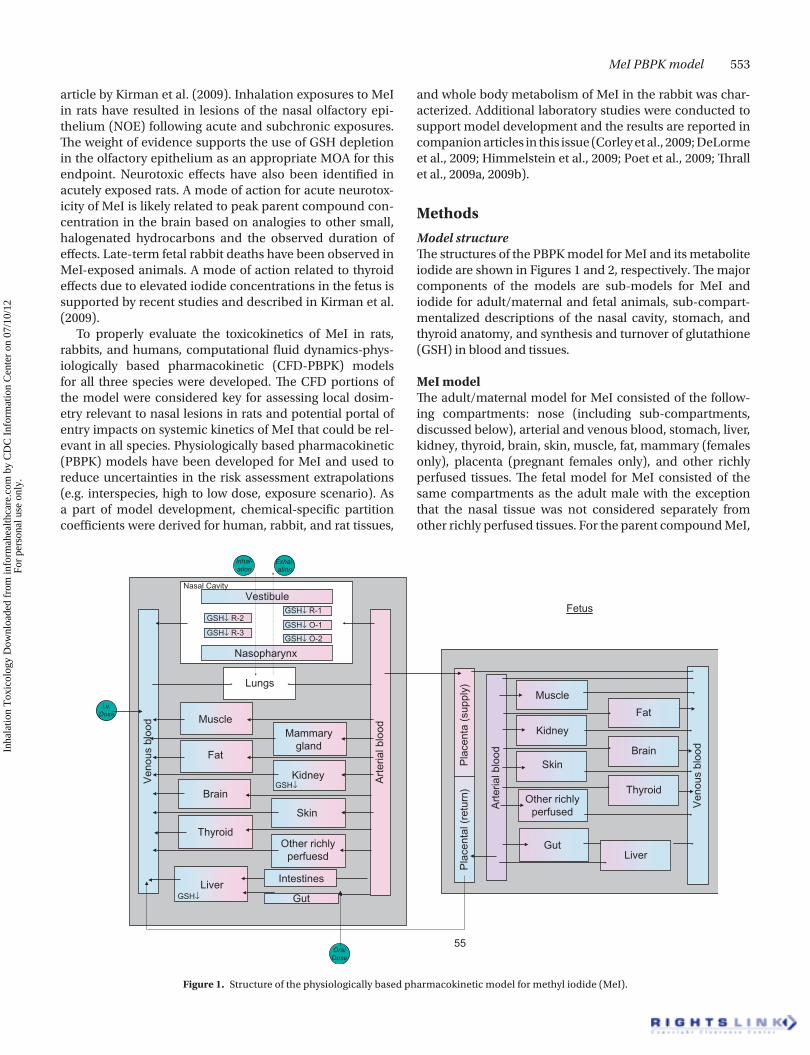
Model structureThe structures of the PBPK model for MeI and its metabolite iodide are shown in Figures 1 and 2, respectively. The major components of the models are sub-models for MeI and iodide for adult/maternal and fetal animals, sub-compart-mentalized descriptions of the nasal cavity, stomach, and thyroid anatomy, and synthesis and turnover of glutathione (GSH) in blood and tissues.
MeI modelThe adult/maternal model for MeI consisted of the follow-ing compartments: nose (including sub-compartments, discussed below), arterial and venous blood, stomach, liver, kidney, thyroid, brain, skin, muscle, fat, mammary (females only), placenta (pregnant females only), and other richly perfused tissues. The fetal model for MeI consisted of the same compartments as the adult male with the exception that the nasal tissue was not considered separately from other richly perfused tissues. For the parent compound MeI,
55
Art
eria
l blo
od
Skin
Other richlyperfuesd
Fetus
Brain
Kidney
Gut
Skin
Kidney
Muscle
MuscleMammary
gland
Art
eria
l blo
od
Ven
ous
bloo
d
Pla
cent
al (
retu
rn)
Pla
cent
a (s
uppl
y)
Ven
ous
bloo
d
Other richlyperfused
Lungs
Vestibule
Nasopharynx
Liver
Brain
Fat
Thyroid
GSH↓ R-2GSH↓ R-1
GSH↓ O-1
GSH↓ O-2GSH↓ R-3
GSH↓
GSH↓
Nasal Cavity
Inhal-ation
i.v.Dose
OralDose
Exhal-ation
Intestines
Fat
Thyroid
LiverGut
Figure 1. Structure of the physiologically based pharmacokinetic model for methyl iodide (MeI).
Inha
latio
n T
oxic
olog
y D
ownl
oade
d fr
om in
form
ahea
lthca
re.c
om b
y C
DC
Inf
orm
atio
n C
ente
r on
07/
10/1
2Fo
r pe
rson
al u
se o
nly.

554 L. M. Sweeney et al.
all tissue compartments except nasal sub-compartments were considered to be flow limited.
The anatomy of the adult nasal cavity and corresponding model structure were described by Frederick et al. (2002). Briefly, during inhalation, a gas enters the nose through the nasal vestibule, then the airflow splits into two sepa-rate streams that pass over epithelial tissues (respiratory and olfactory epithelium), and the streams recombine in the nasopharynx before entering the lung. The gas diffuses from the air stream into the mucus layer, nasal tissue layers, and blood exchange region, where it equilibrates with the nasal blood supply. During exhalation, the flow is reversed so the model simulates cyclic breathing conditions.
The model provides for diffusion of MeI from the nasal lumen through a mucus layer, the epithelial cell layers, and the blood exchange layer. The diffusion path from the nasal lumen to the blood exchange region of the olfactory compartments is made up of a mucus layer, underlying the epithelial cell layer described mathematically as four lay-ered sub-compartments, and the blood exchange layer. This layered characterization of the epithelium approximates the concentration gradient across nasal tissue from the mucus layer to the vascularized region under the basal lamina. The model allows for diffusion from the blood exchange region, up to the epithelium and mucus, as well as diffusion from the gas phase, through mucus, to the epithelium. Minor modifications to the model code (described in Frederick et al., 1998, 2002) consisted of modifying flow equations to ensure mass balance, and eliminating duplicative param-eters (e.g. previously breathing frequency and breath length were independently specified, when the parameters were inversely related).
Metabolism of MeI by gluthathione S-transferases (GSTs) was modeled as occurring in the adult liver, kidney, stom-ach and intestines (rat only), skin (rat and human), and nasal olfactory and respiratory epithelium and fetal liver. Nonenzymatic conjugation of MeI and GSH was assumed to be first order with respect to the concentration of each reac-tant and was modeled as occurring in all tissues except fat and the nose. The predicted concentration of GSH in a given tissue was modeled assuming first order endogenous loss (due to export or degradation processes), balanced by zero order input (from import or synthesis) for unexposed ani-mals and humans, and losses due to conjugation with MeI. The minor reaction of MeI with proteins was assumed to liberate inconsequential amounts of I− and was neglected.
Iodide modelThe structures of the adult/maternal and fetal iodide models were described in detail by Merrill et al. (2003) and Clewell et al. (2003a). The compartments (and sub-compartments) for the adult/maternal iodide model are blood (plasma and red blood cells), stomach (gastrointestinal (GI) contents, tissue, and blood), liver, kidney, thyroid (colloid, follicle, and stroma), skin (tissue and blood), muscle, fat, mammary (tissue and blood: females only), placenta (tissue and blood: pregnant females only), and other richly perfused tissues. The fetal model for iodide consisted of the same compart-ments as for the adult male. Clewell et al. (2003a) neglected fat in the rat fetal model because the amount of this tissue was considered negligible; however, for the rabbit model presented here, a fetal fat compartment was included. Because the iodide model does not contain brain or nose compartments, iodide produced as a result of MeI–GSH
G.I.
Liver
Kidney
Thyroid
Fat
Slowly perfused
Richly perfused
Placenta
Doe
Fetus
Slowly perfused
Richly perfusedBloodTissue
Skin TissueBlood
ColloidFollicleStroma
BloodTissueContents
Blood PlasmaRBCs
FromMeImetab.
PlasmaRBCs
Blood
G.I.BloodTissue
Contents
Liver
Kidney
Thyroid
Skin TissueBlood
ColloidFollicleStroma
FromMeImetab.Urine
Fat
Figure 2. Structure of the physiologically based pharmacokinetic model for iodide (Clewell et al., 2003a; Merrill et al., 2003).
Inha
latio
n T
oxic
olog
y D
ownl
oade
d fr
om in
form
ahea
lthca
re.c
om b
y C
DC
Inf
orm
atio
n C
ente
r on
07/
10/1
2Fo
r pe
rson
al u
se o
nly.

MeI PBPK model 555
conjugation in these tissues was accounted for in the other richly perfused tissues of the iodide model. Where tissue sub-compartments were employed, iodide uptake was described by permeability area cross-products and parti-tion coefficients. Active transport of iodide into mammary, placenta, thyroid follicle, thyroid lumen, gastric tissue, and skin by the sodium-iodide symporter (NIS) was described as saturable. The kidney was separately described to account for urinary excretion of iodide.
Model parametersModel parameters are provided in Table 1 (anatomy/physi-ology, except nasal), Table 2 (rabbit nasal anatomy), Table 3 (GSH concentrations), Table 4 (protein content and GSH turnover), Table 5 (MeI partition coefficients), Table 6 (metab-olism parameters), Table 7 (rabbit and human iodide param-eters), and Table 8 (child-specific nasal physiology). Rat and human nasal parameters used were previously reported by Frederick et al. (2002). Male rat iodide parameters used were also previously reported (Merrill et al., 2003). To the extent possible, species and life-stage specific parameter values were identified, but when unavailable for a given species and life stage, values from other species and life stages were used, as noted in the source/comment column of the parameter tables. When available, anatomical, physiological, and bio-chemical parameters from the relevant pharmacokinetic and toxicity studies were substituted for the baseline parameters.
Anatomical and physiologicalAnatomical parameters and airflow distribution for the New Zealand White (NZW) rabbit nose were determined by Corley et al. (2009). The averages of values determined for three rabbits were used in the modeling. Breathing fre-quency and tidal volume in unanesthetized NZW rabbits exposed to 20 ppm MeI were determined by DeLorme et al. (2009) using whole-body plethysmography.
Species-specific anatomical and physiological data for the nulliparous, pregnant, and fetal rabbit were derived from the published literature for NZW rabbits to the extent possible. For pregnant and fetal rabbits, data specific to late term (ges-tation days 20–30) were preferred. In some instances, data from neonatal rabbits were used as surrogate for late-term fetal animal data.
Anatomical and physiological parameters for the rat and human nose were taken from Frederick et al. (1998), with the exception of human nasal blood flow and human olfactory nasal mucosa thickness (discussed below). Breathing fre-quency and tidal volume in unanesthetized Sprague Dawley rats exposed to 25 or 100 ppm MeI were determined by DeLorme et al. (2009) using whole-body plethysmography.
Human-specific data for blood flow to parts of the nose were available and were used in place of an “estimated” value (Frederick et al., 1998) that was based on blood flow to the rat nose (Stott et al., 1983). The value of Drettner and Aust (1974), 0.26 l/cm2/sec for blood flow to the human maxil-lary sinus, was selected and assumed to be representative of the entire nose. This value was scaled using the surface area
of the nasal regions used in this model to arrive at a value of 2.4 ml/min (0.147 L/hr) for fractional blood flow to the nose (QNC) = 0.00045. This value is equivalent to 0.30–0.40 ml/min/g (Johansson & Kumlien, 1988), and similar to the value of 0.33 ml/min/g determined by Bende (1983) for human nasal mucosa. More recently, Midttun and Sejrsen (1996) have reported flows of 0.171 and 0.149 ml/g/min in two human subjects. Kelley and DuBois (1998) have estimated from nitrous oxide uptake that a nasal blood flow equivalent to 16.7 ml/min is in equilibrium with inhaled gases. Though Kelley and DuBois emphasize that this does not necessar-ily represent total nasal blood flow, it is supportive of other values derived for human nasal blood flow. The value deter-mined by Drettner and Aust (1974) is advantageous because it is based on a reasonable number of subjects (n = 7) and can be scaled by nasal surface area, which is generally better characterized for humans than nasal tissue weight, as sur-face area can be measured noninvasively.
A species-specific value for the thickness of the human olfactory nasal mucosa (epithelium and blood exchange layer) was identified in the literature and used in place of the value estimated from the rat (Frederick et al., 1998). While the thickness of the human olfactory epithelial layer (WOE, in the model) is slightly less than that of rats (human adults and newborns, 0.006 cm (Sangari et al., 2000) vs. rat, 0.008 cm (Frederick et al., 1998)), the human mucosa appears to be much thicker. Frederick et al. (1998) report that the blood exchange layer thickness in the rat is approx-imately 0.005 cm, for a total mucosa thickness of ~0.013 cm. Saunders et al. (1995) measured septal thickness in 28 grid areas of 10 normal adult human cadavers; across these 28 areas, the average mucosal thickness was 0.14 cm, approxi-mately 10 times thicker than the rat mucosa. The thickness is expected to be greater in the living subject because of vascular expansion (Saunders et al., 1995). Tasman et al. (1999) used sonography to measure mucosal thickness in living subjects, and they measured septal mucosa thick-nesses of 0.13–0.64 cm (mean: 0.32 cm) in 24 subjects. For modeling purposes, we have used a mucosal thickness of 0.14 cm (blood exchange layer thickness (WOX, in the model) of 0.14 cm–0.006 cm = 0.134 cm) and consider this to be a conservative estimate of human mucosal thickness.
In an effort to evaluate the potential effects of MeI exposure on sensitive subpopulations, parameters spe-cific to the nasal and respiratory physiology of children were identified. A study by Inagi (1992) measured and reported the thickness of the nasal mucosa in cadavers of subjects of all ages. The average lamina propria height for infants (1 year) to aged adults was approximately 1 mm. This compares well with the value of 1.4 mm described for adults from a study performed on British cadavers (Saunders et al., 1995). The thickness of the lamina propria reported in the fetal/infant group by Inagi is approximately 0.5 mm (Inagi, 1992: Figure 13, pp. 95–1181) (WOX = 0.05 cm, in the model). The body weight, tidal volume, respiratory rate, nasal surface area, and nasal volume parameters for a 3-month-old child
Inha
latio
n T
oxic
olog
y D
ownl
oade
d fr
om in
form
ahea
lthca
re.c
om b
y C
DC
Inf
orm
atio
n C
ente
r on
07/
10/1
2Fo
r pe
rson
al u
se o
nly.

556 L. M. Sweeney et al.
Table 1. Physiology.
Parameter (units) Symbol Rat RabbitRabbit
(pregnant)Fetal
rabbitMale
humanFemale human
Pregnant human
Fetal human,
gestation week 18 Source/comment
Body weight (kg) BW 0.25 3 4 0.022a 70 58 61.1 0.26884 Default value; reported experimental values used when available; fetal weight calculated from maternal weight and fractional fetal weight
Pulmonary ventilation (L/hr-kg0.74)
QPC 20 16.5 30 NAb 20 24.75 24.75 NA Gargas et al. (1986, 1990) (rat); DeLorme et al. (2009) (rabbit); pregnant rabbit QPC estimated from Nuwayhid (1979) cardiac output; Brown et al. (1997) (human)
Alveolar ventilation (L/hr-kg0.74)
QAC 14 11 = QCC NA 14 16.5 NA Gargas et al. (1986, 1990) (rat); DeLorme et al. (2009) (rabbit); Nuwayhid (1979) (pregnant rabbit cardiac output GD 20–30); Brown et al. (1997) (human)
Cardiac output (L/hr-kg0.74)
QC(F)Cc = QAC = QAC 20 6.1 = QAC 16.5 = QAC 7.5 Gargas et al. (1986, 1990); Jarai (1969) (neonatal rabbit, used for fetal rabbit); Luecke et al. (1994) (fetal human)
Fractional blood flow to fat
QF(F)C 0.09 0.08 0.08 0.05 0.085 0.085 0.09 0.002 Gargas et al. (1986, 1990) (rat), Brown et al. (1997) (human, rabbit estimated from rodent data); Jarai (1969) (neonatal rabbits, adjusted for lack of placental flow); Gentry et al. (2002) (pregnant human)
Fractional blood flow to skin
QD(F)C 0.058 0.09 0.06 0.065 0.058 0.058 0.056 0.058 Brown et al. (1997) (rat, human), Johnson et al. (1985) (rabbit, non-pregnant and GD 29); Jarai (1969) (neonatal rabbits, adjusted for lack of placental flow); tissue blood flow for pregnant and nonpregnant women (Gentry et al., 2002)
Fractional blood flow to slowly perfused tissues
QS(F)C 0.278 0.42 0.34 0.167 0.191 0.191 0.183 0.16 Brown et al. (1997) skeletal muscle (rat, human); Johnson et al. (1985) carcass-fat (rabbit); Jarai (1969) (neonatal rabbits, adjusted for lack of placental flow); tissue blood flow for pregnant and nonpregnant women (Gentry et al., 2002)
Fractional blood flow to other richly perfused tissues
QR(F)C 0.1622 0.093529 0.132529 0.03069 0.124 0.119 0.1236 0.092 Determined by mass balance
Fractional blood flow to stomach
QG(F)C 0.015 0.052 0.052 0.035 0.052 0.052 0.05 0.052 Delp et al. (1991) (rat); Reeves et al. (1988) (rabbit); human estimated; tissue blood flow for pregnant and nonpregnant women (Gentry et al., 2002)
Fractional blood flow to intestines
QIC 0.218 0.115 0.121 NA 0 0 0 NA Delp et al. (1991) (rat); Johnson et al. (1985) (portal–stomach flow rate) (rabbit, nonpregnant and GD 29)
Table 1. Continued on next page
Inha
latio
n T
oxic
olog
y D
ownl
oade
d fr
om in
form
ahea
lthca
re.c
om b
y C
DC
Inf
orm
atio
n C
ente
r on
07/
10/1
2Fo
r pe
rson
al u
se o
nly.

MeI PBPK model 557
Fractional blood flow to liver (excluding GI: rat, rabbit)
QL(F)C 0.009 0.009 0.01 0.138 0.175 0.175 0.168 0.17 Delp et al. (1998) (rat); Johnson et al. (1985, rabbit, nonpregnant and GD29); Brown et al. (1997) (human); Boda et al. (1971) and Jarai (1969) (fetal and newborn rabbits); tissue blood flow for pregnant and nonpregnant women (Gentry et al., 2002)
Fractional blood flow to kidneys
QK(F)C 0.14 0.12 0.11 0.159 0.175 0.175 0.168 0.16 Brown et al. (1997) (rat, human); Johnson et al. (1985, rabbit, nonpregnant and GD 29): Boda et al. (1971) (fetal rabbit); tissue blood flow for pregnant and non-pregnant women (Gentry et al., 2002)
Fractional blood flow to brain
QBr(F)C 0.02 0.01 0.01 0.025 0.114 0.114 0.109 0.14 Brown et al. (1997) (rat, human); Johnson et al. (1985, rabbit, nonpregnant and GD 29); Jarai (1969) (neonatal rabbits, adjusted for lack of placental flow); tissue blood flow for pregnant and nonpregnant women (Gentry et al., 2002)
Fractional blood flow to thyroid
QT(F)C 0.0028 0.000471 0.000471 0.00031 0.016 0.016 0.015 0.016 Delp et al. (1998) (rat); Nilsson & Bill (1984) (rabbit); Brown et al. (1997) (human); tissue blood flow for pregnant and nonpregnant women (Gentry et al., 2002)
Fractional blood flow to mammary
QMC 0.002 0.005 0.05 0 0 0.005 0.0074 0 Johnson et al. (1985) (rabbit, nonpregnant and GD 29); Hanwell & Linzel (1973) (rat: as cited by Clewell et al., 2003a); Gargas et al. (2000) (human); pregnant human QM calculated as linear increase with tissue wt (Gentry et al. 2002)
Fractional blood flow to placenta
Qpl(F)C 0 0 0.029 0.33 0 0 0.02 0.15 Nuwayhid (1979) (maternal rabbits, GD 20–30); Lorijn et al. (1980) (fetal lambs, used for fetal rabbits): Gentry et al. (2002) (pregnant human QPl)
Fractional blood flow to nose
QNC 0.005 0.005 0.005 0 0.00045 0.00045 0.00045 0 Stott et al. (1983) (rat value used for rats and rabbits); Drettner & Aust (1974) (human maxillary sinus, scaled by area, used for all humans)
Fractional blood flow to nasopharynx
QNPC 0.001 0.001 0.001 0 0.001 0.001 0.001 0 Frederick et al. (2002)
Fraction of body weight in fat
VF(F)C 0.08 0.08 0.08 0.0628 0.21 0.327 0.343 0.0048 Gargas et al. (1986, 1990) (rat); Brown et al. (1997) (human, rabbit estimated based on rodents); Jarai (1969) (neonatal rabbits); Luecke et al. (1995) (fetal human)
Table 1. Continued
Parameter (units) Symbol Rat RabbitRabbit
(pregnant)Fetal
rabbitMale
humanFemale human
Pregnant human
Fetal human,
gestation week 18 Source/comment
Table 1. Continued on next page
Inha
latio
n T
oxic
olog
y D
ownl
oade
d fr
om in
form
ahea
lthca
re.c
om b
y C
DC
Inf
orm
atio
n C
ente
r on
07/
10/1
2Fo
r pe
rson
al u
se o
nly.

558 L. M. Sweeney et al.
Fraction of body weight in skin
VD(F)C 0.19 0.17 0.14 0.247 0.037 0.037 0.035 0.677 Brown et al. (1997) (rat, human), Johnson et al. (1985, rabbit, nonpregnant and GD 29); Jarai (1969) (neonatal rabbits); mass balance (fetal human, 3.4% unperfused, Luecke et al., 1994)
Fraction of body weight in slowly perfused tissues
VS(F)C 0.484 0.486 0.443 0.310 0.474 0.351 0.323 0.099 0.91 – (sum of other tissue fractions) (0.8 – VFC – VDC – VFETC – VH C– VMC – VPLC); muscle, Luecke et al. (1994) (fetal human)
Fraction of body weight in other richly perfused tissues
VR(F)C 0.01435 0.05590 0.05592 0.0439 0.05720 0.05720 0.05950 0.02784 0.11 – (VLC + VKC + VNC + VBC + VTC + VGC) adult; 0.19 for fetal to compensate for larger % brain and liver
Fraction of body weight in stomach
VG(F)C 0.0046 0.01 0.01 0.01 0.0021 0.0021 0.0020 0.0003 Brown et al. (1997) (rat and adult human), Reeves et al. (1988) (rabbit); total human fetal stomach volume, Nagata et al. (1990), fraction as tissue, Macarulla-Sanz et al. (1996)
Fraction of body weight in intestines
VIC 0.038 Splanchnic tissues – (liver and stomach)
Fraction of body weight in liver
VL(F)C 0.04 0.035 0.035 0.09 0.026 0.026 0.025 0.052 Gargas et al. (1986, 1990) (rat)/Brown et al. (1997) (human); Johnson et al. (1985) (rabbit, nonpregnant and GD 29); Karnak et al. (1999) (GD 25 fetal rabbits); Luecke et al. (1994) (fetal human)
Fraction of body weight in kidneys
VK(F)C 0.0073 0.007 0.007 0.014 0.0044 0.0044 0.0042 0.009 Brown et al. (1997) (rat and human), Johnson et al. (1985) (rabbit, pregnant and GD 29); Jarai (1969) (neonatal rabbits); Luecke et al. (1994) (fetal human)
Fraction of body weight in brain
VBr(F)C 0.0057 0.002 0.002 0.032 0.02 0.02 0.019 0.1 Brown et al. (1997) (rat, human); Johnson et al. (1985, rabbit, nonpregnant and GD 29); Jarai (1969) (neonatal rabbits); Luecke et al. (1994) (fetal human)
Fraction of body weight in thyroid
VTtot(F)C
0.00005 0.00010 0.000077 0.00010 0.00030 0.00030 0.00030 0.00086 Brown et al. (1997) (rat, nonpregnant rabbit); Thrall et al. (2009a) (pregnant rabbit), Yokoyama et al. (1986) (per Merrill et al., 2005) (human); Bocian-Sobkowska et al. (1992) (fetal human)
Fraction of body weight in mammary
VMC 0.01 0.005 0.03000 0 0.00001 0.0062 0.009 NA Johnson et al. (1985) (rabbit, nonpregnant and GD 29); Knight et al. (1984) (rat: as cited by Clewell et al., 2003a); Luecke et al. (1994) (pregnant human)
Fraction of body weight in placenta
VPlC 0.00001 0.00001 0.0080 0 0.00001 0.00001 0.002 NA Nuwayhid (1979) (rabbits, GD 20–30); Luecke et al. (1994) (pregnant human)
Table 1. Continued
Parameter (units) Symbol Rat RabbitRabbit
(pregnant)Fetal
rabbitMale
humanFemale human
Pregnant human
Fetal human,
gestation week 18 Source/comment
Table 1. Continued on next page
Inha
latio
n T
oxic
olog
y D
ownl
oade
d fr
om in
form
ahea
lthca
re.c
om b
y C
DC
Inf
orm
atio
n C
ente
r on
07/
10/1
2Fo
r pe
rson
al u
se o
nly.

MeI PBPK model 559
Fraction of body weight as fetal litter
VFetC 0.00001 0.00001 0.044 0 0 0.00001 0.0044 NA Thrall et al. (2009a) (pregnant rabbit); Luecke et al. (1994) (pregnant human)
Viable fetuses per litter
Nfet 8 1 NA Thrall et al. (2009a) (pregnant rabbit)
Fraction of body weight in blood
VH(F)C 0.074 0.059 0.055 0.1 0.079 0.079 0.084 0.058 Prince (1982) (rabbits, nonpregnant, and GD 28 or 29); Brown et al. (1997) (rat, human); Harris et al. (1983) (neonatal used for fetal rabbit); Luecke et al. (1994) (pregnant human)
Fraction of blood in arterial blood
VHAC 0.25 0.25 0.25 0.25 0.25 0.025 0.25 0.25 Brown et al. (1997)
Fraction of blood in RBC
VRBC(F)C 0.46 0.33 0.33 0.49 0.46 0.46 0.46 0.46 Prince (1982) (rabbits, nonpregnant, GD 28 or 29), Harris et al. (1983) (neonatal used for fetal rabbit), ICRP (1975) (human)
Fraction of blood in plasma
Vplas(F)C 0.54 0.67 0.67 0.51 0.54 0.54 0.54 0.54 1-VRBC
Fraction of total thyroid volume as colloid
VDT(F)C 0.244 NA 0.45 0.183 0.15 0.15 0.15 0.25 Merrill et al. (2003) (rat), Clewell et al. (2003a) (pregnant and fetal rat value used for pregnant and fetal rabbit); Merrill et al. 2005 (human male, used for all adult humans); Bocian-Sobkowska et al. (1992) (fetal)
Fraction thyroid blood and stroma (fraction of VT)
VTB(F)C 0.157 NA 0.091 0.203 0.276 0.276 0.276 0.4 Merrill et al. (2003) (rat), Clewell et al. (2003a) (pregnant and fetal rat value used for pregnant and fetal rabbit), Merrill et al. 2005 (human male, used for all adult humans); Bocian-Sobkowska et al. (1992) (fetal)
Fraction GI blood (fraction of VG)
VGB(F)C 0.0411 0.136 0.136 0.136 0.041 0.041 0.041 0.041 ICRP (1975) (rat), Katayama et al. (1990) (rabbit); Merrilll et al. (2005) (human)
Fraction of stomach juice contents (fraction of BW)
VGJ(F)C 0.0168 0.021 0.021 0.015 0.071 0.071 0.071 0.0006 Yu et al. (2002) (rat); Thrall et al. (2009a) (pregnant rabbit used for all adults; fetal rabbit) Licht & Deen, 1988 (per Merrill et al. 2005) (human); total human fetal stomach volume Nagata et al. (1990) – fraction as contents, Macarulla-Sanz et al. (1996)
Fraction mammary blood (fraction of VM)
VMBC 0.18 0.18 NA Clewell et al. (2003b)
Fraction of placenta blood (fraction of VPl)
VPlBC NA 0.3 0.3 0.3 NA 0.3 0.3 NA Brownfield et al. (1978) (rabbit)
Fraction skin blood (fraction of VD)
VDBC 0.02 0.02 0.02 0.02 0.08 0.08 0.08 0.08 Katayama et al. (1990) (rabbit); Brown et al. (1997) (rat, human)
aNumbers in italics are calculated within the model.bNA = not applicable.c(F) denotes fetal parameters in the model, e.g. QCC = adult cardiac output, QCFC = fetal cardiac output.
Table 1. Continued
Parameter (units) Symbol Rat RabbitRabbit
(pregnant)Fetal
rabbitMale
humanFemale human
Pregnant human
Fetal human,
gestation week 18 Source/comment
Inha
latio
n T
oxic
olog
y D
ownl
oade
d fr
om in
form
ahea
lthca
re.c
om b
y C
DC
Inf
orm
atio
n C
ente
r on
07/
10/1
2Fo
r pe
rson
al u
se o
nly.

560 L. M. Sweeney et al.
were used to describe infant physiology (Kimbell et al., 2005) (Table 8). Kimbell et al. (2005) provided age-spe-cific nasal volumes and surface areas, but did not further subdivide these volumes and areas into the nasal vesti-bule, olfactory and respiratory regions, and nasopharynx as in Frederick et al. (1998, 2002). The relative fractional areas and volumes of the different regions were assumed to be the same in adults and children, and the ratio of tidal volume to body weight (TVOL/BW) was assumed
to be constant. The nasal epithelium width and lamina propria width reported by Inagi for the fetal/infant group were used to model nasal infant exposure.
Anatomical and physiological data for other tissues in the rat and adult human were generally taken from Brown et al. (1997), if available in that reference. Parameters for the fetal human correspond to gestation week (GW) 18, based on developmental equivalence for the iodide mode of action in rabbit fetal thyroid (Howdeshell, 2002).
Table 2. Rabbit nose parameters.
Parameter (units) Symbol Value Source
Proportion of nasal air flow entering the respiratory patch compartment INST1 0.10875 Corley et al. (2009)
Proportion of nasal air flow entering the anterior olfactory compartment INST2 0.13325 Corley et al. (2009)
Proportion of nasal air flow entering the posterior olfactory compartment INST3 0.1585 Corley et al. (2009)
Proportion of nasal air flow exiting the posterior olfactory compartment INST4 0.1585 Corley et al. (2009)
Surface area of olfactory epithelium (cm2) SAOLF 17.42 Corley et al. (2009)
Surface area of dorsal respiratory patch (cm2) SADR 13.38 Corley et al. (2009)
Surface area of ventral respiratory epithelium, region 1 (cm2) SAWR1 39.71 Corley et al. (2009)
Surface area of ventral respiratory epithelium, region 2 (cm2) SAWR2 15.98 Corley et al. (2009)
Surface area or nasal vestibule (squamous epithelium) (cm2) SASQ 3.08 Estimated from rat (BW0.7 scaling)
Suface area of nasopharynx (cm2) SANP 0.7 Estimated from rat (BW0.7 scaling)
Volume of the dorsal meatus respiratory patch lumen (cm3) VDMR 0.089 Corley et al. (2009, total volume, rat volume fraction)
Volume of the dorsal meatus olfactory region lumen (cm3) VDMO1 0.0055 Corley et al. (2009, total volume, rat volume fraction)
Volume of the dorsal meatus ethmoid olfactory lumen (cm3) VDMO2 1.5 Corley et al. (2009, total volume, rat volume fraction)
Volume of the anterior region respiratory lumen (cm3) VRMR1 2.0 Corley et al. (2009, total volume, rat volume fraction)
Volume of the posterior region respiratory lumen (cm3) VRMR2 2.0 Corley et al. (2009, total volume, rat volume fraction)
Volume of the vestibular region lumen (cm3) VSQA 0.16 Corley et al. (2009, total volume, rat volume fraction)
Volume of the nasopharynx lumen (cm3) VNPA 0.016 Corley et al. (2009, total volume, rat volume fraction)
Table 3. Initial GSH concentrations in mM.
Tissue Symbol RatAdult rabbit
Fetal rabbit
Adult human
Fetal human, BW 18 Source/comment
Blood GSHH0 1.07 0.55 0.4 1.07 1.07 Potter & Tran (1993) (rat, also used for humans); Sloter et al. (2009) (pregnant and fetal rabbit)
Skin GSHD0 1.07 1.07 1.07 1.07 1.07 Potter & Tran (1993) (rat)
Slowly perfused tissues GSHD0 0.72 0.72 0.72 1.13 1.13 Potter & Tran (1993) (rat muscle, also used for rabbit); Sweeney et al. (2003) (human muscle)
Richly perfused tissues GSHR0 2.27 2.27 2.27 2.59 2.69 Potter & Tran (1993) (rat, also used for rabbit); Sweeney et al. (2003) (human)
Stomach GSHG0 5.66 5.66 5.66 3.61 3.61 Potter & Tran (1993) (rat, also used for rabbit); Sweeney et al. (2003) (human)
Intestines GSHI0 1.92 1.92 NA NA NA Potter & Tran (1993) (rat duodenum, small intestine, cecum, large intestine and colon averaged on a tissue weight basis; also used for rabbit)
Liver GSHL0 5.7 7.09 2.0 5.63 7.4 Potter & Tran (1993) (rat); Sloter et al. (2009) (pregnant rabbit); Sweeney et al. (2003) (human)
Kidneys GSHK0 3.78 1.67 3.78 1.39 1.39 Potter & Tran (1993) (rat); Sloter et al. (2009) (pregnant rabbit); Sweeney et al. (2003) (human)
Brain GSHBr0 1.93 1.93 1.93 2.99 1.63 Rikans & Moore (1988) (rat); Sweeney et al. (2003) (adult human); Zalani et al. (1987) fetal human
Thyroid GSHT0 1.9 1.9 1.9 1.9 1.9 Sedlak & Lindsay (1968) (average of sheep and bovine thyroid)
Mammary GSHM0 1.5 1.5 NA 1.5 NA Fujikake & Ballatori (2002) (rat)
Placenta GSHPl0 NA 0.54 NA 0.54 NA Qanungo & Mukherjea (2000) (human, BW 12–24)
Nasal olfactory epithelium GSHOE0 3.54 1.77 NA 0.8 NA Potter et al. (1995) (rat); Sloter et al. (2009) (pregnant rabbit); Frederick et al. (2002) (human)
Nasal respiratory epithelium GSHRE0 4.21 1.28 NA 0.9 NA Potter et al. (1995) (rat); Sloter et al. (2009) (pregnant rabbit); Frederick et al. (2002) (human)
Inha
latio
n T
oxic
olog
y D
ownl
oade
d fr
om in
form
ahea
lthca
re.c
om b
y C
DC
Inf
orm
atio
n C
ente
r on
07/
10/1
2Fo
r pe
rson
al u
se o
nly.

MeI PBPK model 561
Biochemical (glutathione)Baseline GSH concentrations for the rat and GSH turnover rates for the rat were taken from Potter and Tran (1993) and Potter et al. (1995). Turnover rates determined for the adult
rat were used for all species and life stages. Rabbit tissue GSH concentrations for blood, liver, kidney, and nasal res-piratory and olfactory epithelium were determined by Sloter et al. (2009). Adult human tissue GSH concentrations were
Table 4. Tissue protein content and GSH turnover rates.
Tissue
Weight fraction of protein First order GSH loss (hr−1)
Symbol Valuea Symbol Valueb
Fat (adipose) VprotFC 0.044
Skin VprotDC 0.246 KDGSHD 0.014
Slowly perfused tissue VprotSC 0.198c KDGSHS 0.006c
Other richly perfused tissue VprotRC 0.13d KDGSHR 0.044d
Stomach VprotGC 0.17 KDGSHG 0.073
Intestines VprotIC 0.129 KDGSHI 0.044
Liver VprotLC 0.176 KDGSHL 0.142
Kidneys VprotKC 0.177 KDGSHK 0.55
Brain VprotBrC 0.1 KDGSHBr 0.044d
Thyroid VprotTC 0.14 KDGSHT 0.044d
Mammary VprotMC 0.174 KDGSHM 0.044d
Placenta VprotPlC 0.12 KDGSHPl 0.044d
Red blood cells VprotRBCC 0.347 KDGSHH 0.007e
Plasma VprotPlasC 0.068
Nasal olfactory epithelium VprotNC 0.178 KDGSHOE 0.19f
Nasal respiratory epithelium VprotNC 0.178 KDGSHRE 0.16g
aHuman tissue value from Duck (1990) unless otherwise noted; used for all species and lifestages.bRat tissue value from Potter & Tran (1993) unless otherwise noted; used for all species and life stages.cValue for skeletal muscle.dValue for intestine.eWhole blood.fFit to rat GSH data (Himmelstein et al., 2009).gPotter et al. (1995).
Table 5. Blood:air and tissue:air partition coefficients for MeI (mean ± standard error).
Tissue Symbol Rat Rabbita Humanb
Blood PB(F) 39.3 ± 5.5 16 ± 0.8, 12 ± 2.2c 18 ± 0.6, 17.1 ± 0.9, 17.6d
Fat PFA 88.8 ± 2.3 87.3 ± 3.9 88
Skin PDA 7.5 ± 2.3e 6.4 ± 0.5e 6.9
Slowly perfused tissues PSA 7.5 ± 2.3a 6.4 ± 0.5a 6.9
Richly perfused tissues PRA 9f 7.9f 8.4
Stomach PGA 9f 7.9f 8.4
Liver PLA 24.1 ± 2.8 13.3 ± 3.0 18.7
Kidney PKA 8.4 ± 1.1 9.0 ± 2.0 8.7
Brain PBrA 9.5 ± 1.2 6.7 ± 0.5 8.1
Thyroid PTA 11.4 ± 1.8 38.9 ± 3.6 25.2
Mammary PMA 40g 40g 40
Placenta PPlA NA 6.8 ± 1.1 6.8 ± 1.1
Nasal olfactory tissue POEA 5.7 ± 0.9h 8.3 ± 0.7h 7
Nasal respiratory tissue PREA 5.7 ± 0.9h 8.3 ± 0.7h 7
Mucus PMUA 3.9 ± 0.7i 3.9 ± 0.7i 3.9 ± 0.7
Mucus:epithelium PME 1j 1j 1aNongravid female rabbit value used for all rabbits except fetal blood and placenta.bAverage of rat and rabbit values, except for blood.cAdult/fetal.dFemale, male, and fetal (average of male and female).eMuscle value used for skin and slowly perfused tissues.fAverage of brain and kidney values.gEstimated from PFA and PRA based on tissue composition (Duck, 1990).hPooled nasal tissue (30°C).iSaline value (30°C).jFrederick et al. (2002).
Inha
latio
n T
oxic
olog
y D
ownl
oade
d fr
om in
form
ahea
lthca
re.c
om b
y C
DC
Inf
orm
atio
n C
ente
r on
07/
10/1
2Fo
r pe
rson
al u
se o
nly.

562 L. M. Sweeney et al.
taken from values compiled by Sweeney et al. (2003). Fetal human tissue GSH concentrations were identified from the literature, as specified in Table 3.
Chemical specific: partition coefficientsTo describe the uptake of MeI into body tissues and fluids, blood:air and tissue:air partition coefficients were deter-mined for relevant species and life stages. Blood:air parti-tion coefficients were determined using blood from adult humans, adult rats, and adult and fetal rabbits. Tissue:air partition coefficients were determined using the following tissues from adult rats and rabbits: adipose, muscle, kidney, brain, thyroid, placenta (rabbit only), and pooled nasal tis-sue. The saline:air partition coefficient was also determined to serve as a surrogate for nasal mucus.
Human blood was collected from volunteer Haskell Laboratory employees by Stine-Haskell site medical staff and used on the day of collection. Male Sprague Dawley rats (Crl:CD(SD)IGSBR) were obtained from Charles River Laboratory, Inc. (Raleigh, NC). Female New Zealand White rabbits (Hra:(NZW)SPF) were obtained from Covance Research Products, Inc. (Denver, PA). Pregnant NZW rab-bits were obtained from Western Oregon Rabbit Company (Philomath, OR) and arrived at Battelle (accredited by the American Association for Laboratory Animal Science (AALAS)) on gestational day 17.
All animals were housed singly in stainless steel, wire-mesh cages suspended above cage boards. Each cage rack contained only animals of one sex. Nesting material was not provided for the rabbits because the does were euthanized
Table 6. Chemical-specific rate parameters.
Parameter Symbol RatAdult rabbit
Fetal rabbit
Adult human
Fetal human, GW 18 Units Source/comment
Maximal rate of GST conjugation in the liver (normalized to body weight)
VMAXL(F)C 831 402 3.3 1820 14.9 mg/hr-kg0.7 Poet et al. (2009) (rat, female rabbit, fetal rabbit, female adult human); fetal human assumed to be same percentage of adult rate as observed in rabbit
Enzyme affinity of methyl iodide for glutathione conjugation in liver
KML(F) 3.6 6.6 0.74 11 1.2 mg/L Poet et al. (2009) (rat, female rabbit, fetal rabbit, female adult human)
Enzyme affinity of GSH for glutathione conjugation
KMGSH 0.53 0.53 0.53 0.53 0.53 mM Caccuri et al. (1997)
MeI–GST conjugation capacity of kidneys
VMAXKC 0.72 1.19 0 1.14 0.0 mg/hr-kg0.7 Fit to data (rat); Poet et al. (2009) (female rabbit, fetal rabbit); human rate estimate from measured in vitro rate (Poet et al. (2009)), adjusted for observed rat in vivo/invitro discrepancy
Enzyme affinity of methyl iodide for glutathione conjugation in kidney
KMK 1.9 10.5 10.5 1.8 1.8 mg/L Poet et al. (2009) (rat, female rabbit, fetal rabbit, female adult human)
MeI–GST conjugation capacity of skin
VMAXDC 48 0 0 76 0 mg/hr-kg0.7 Rat and human rates estimated from measured in vitro kidney rate (Poet et al. 2009), scaled on a tissue volume basis
Enzyme affinity of methyl iodide for glutathione conjugation in skin
KMD 1.9 NA NA 1.8 NA mg/L Assumed equal to kidney (Poet et al., 2009)
MeI–GST conjugation capacity of NOE
VMAXOEC 2 11,300 NA 2 NA mg/ml tissue/hr Chamberlain et al. (1998b) (rat) (also used for human); Poet et al. (2009)
Enzyme affinity of methyl iodide for glutathione conjugation in nasal olfactory epithelium
KMOE 5.6 3534 NA 5.6 NA mg/L Fit to data (rat), also used for human; Poet et al. (2009) (pregnant rabbit)
MeI–GST conjugation capacity of NRE
VMAXREC 0.34 328 NA 0.34 NA mg/ml tissue/hr Chamberlain et al. (1998b) (rat) (also used for human); Poet et al. (2009)
Enzyme affinity of methyl iodide for glutathione conjugation in nasal respiratory epithelium
KMRE 1.4 379 NA 1.4 NA mg/L Fit to data (rat); Poet et al. (2009) (pregnant rabbit)
Nonenzymatic conjugation of MeI and GSH
K2MEIGSH 0.05 0.053 0.05 0.053 0.053 L/mmol-hr Average rates from control incubations, Chamberlain et al. (1998b)
Nonspecific protein binding rate
K2MEIP 0.12 0.116 0.12 0.116 0.116 L/kg protein/hr Linear regression to data, Chamberlain et al. (1998b), rat olfactory tissue
Inha
latio
n T
oxic
olog
y D
ownl
oade
d fr
om in
form
ahea
lthca
re.c
om b
y C
DC
Inf
orm
atio
n C
ente
r on
07/
10/1
2Fo
r pe
rson
al u
se o
nly.

MeI PBPK model 563
Table 7. Iodide parameters.
Parameter SymbolPregnant human
Human fetus
Pregnant rabbit Fetal rabbit Units Source/comment
Slowly perfused tissues/ plasma partition coefficient (PC)
PS_I 0.21 0.21 0.21 0.21 (none) Merrill et al. (2005)
Rapidly perfused tissues/ plasma PC
PR_I 0.4 0.4 0.4 0.4 (none) Merrill et al. (2005)
Fat/plasma PC PF_I 0.05 0.05 0.05 0.05 (none) Merrill et al. (2005)
Kidney/plasma PC PK_I 1.09 1.09 1.09 1.09 (none) Merrill et al. (2005)
Liver/plasma PC PL_I 0.44 0.44 0.44 0.44 (none) Merrill et al. (2005)
Stomach tissue/plasma PC PG_I 0.5 0.5 0.4 0.4 (none) Merrill et al. (2005) (human); this study (rabbit)
Stomach juice/stomach tissue PC
PGJ_I 2 2 2 2 (none) Merrill et al. (2005)
Skin/plasma PC PSK_I 0.7 0.7 0.7 0.7 (none) Merrill et al. (2005)
Thyroid follicle/plasma PC PT_I 0.15 0.15 0.4 0.4 (none) Merrill et al. (2005) (human); this study (rabbit)
Thyroid colloid/follicle PC PTL_I 7 7 7 7 (none) Merrill et al. (2005)
Red blood cell/plasma PC PRBC_I 1 1 1 1 (none) Merrill et al. (2005)
Placenta/plasma PC PPL_I 0.4 NA 0.4 NA (none) Clewell et al. (2003a)
Mammary/plasma PC PM_I 0.66 NA 0.66 NA (none) Clewell et al. (2003a)
Maximal rate of iodide uptake, thyroid follicle
VMAXC_TI 1.22 × 10⁵ 1.39 × 10⁵ 2000 2.0 × 10⁵ ng/h/kg0.75 Pregnant and fetal human estimated from other models (see text); rabbit, this study
Maximal rate of iodide uptake, thyroid colloid
VMAXC_DTI 7.00 × 10⁷ 7.0 × 10⁷ 4.0 × 10⁴ 4000 ng/h/kg0.75 Pregnant and fetal human estimated from other models (see text); rabbit, this study
Maximal rate of iodide uptake, skin
VMAXC_SI 7.2 × 10⁴ 8.4 × 10⁵ 0 7000 ng/h/kg0.75 Pregnant and fetal human estimated from other models (see text); rabbit, this study
Maximal rate of iodide uptake, gastric tissue
VMAXC_GI 4.5 × 10⁵ 9.0 × 10⁵ 0 3.0 × 10⁶ ng/h/kg0.75 Pregnant and fetal human estimated from other models (see text); rabbit, this study
Maximal rate of iodide uptake, mammary
VMAXC_MI 9.05 × 10⁴ NA 8.0 × 10⁵ NA ng/h/kg0.75 Pregnant human estimated from pregnant rat* geometric mean of (human/rat) ratios for iodide uptake in other tissues; rabbit, this study
Maximal rate of iodide uptake, placenta
VMAXC_PLI 1.24 × 10⁵ NA 4 × 10⁶/4 × 105
NA ng/h/kg0.75 Pregnant human estimated from pregnant rat* geometric mean of (human/rat) ratios for iodide uptake in other tissues; rabbit, this study (fit to Sloter et al., 2009 data, fit to Thrall et al., 2009a data)
Maximal rate of iodide binding to blood proteins
VMAXC_BI 200 NA 0 NA ng/h/kg0.75 Merrill et al. (2005)
Affinity constants for thyroid follicle, gastric, and skin uptake of iodide
KM_TI, KM_GI, KM_SI
4.0 × 10⁶ 4.0 × 10⁶ 4.0 × 10⁶ 1.0 × 10⁶ ng/L Merrill et al. (2005) (human); this study (rabbit)
Affinity constant for thyroid colloid uptake of iodide
KM_DTI 1.0 × 10⁹ 1.0 × 10⁹ 1.0 × 10⁹ 1.0 × 10⁹ ng/L Merrill et al. (2005)
Affinity constant for mammary uptake of iodide
KM_MI 4.0 × 10⁶ NA 4.0 × 10⁵ NA ng/L Merrill et al. (2005) (same KM_I used for all tissues except thyroid lumen); rabbit, this study
Affinity constant for placenta uptake of iodide
KM_PLI 4.0 × 10⁶ NA 4.0 × 10⁷ NA ng/L Merrill et al. (2005) (same KM_I used for all tissues except thyroid lumen); rabbit, this study
Affinity constant for binding of iodide in blood
KMB_I 7.84.0 × 105 NA NA NA ng/L Merrill et al. (2005)
Table 7. Continued on next page
Inha
latio
n T
oxic
olog
y D
ownl
oade
d fr
om in
form
ahea
lthca
re.c
om b
y C
DC
Inf
orm
atio
n C
ente
r on
07/
10/1
2Fo
r pe
rson
al u
se o
nly.

564 L. M. Sweeney et al.
prior to parturition. Cages and cage racks were changed at least every other week and cages on the racks were reposi-tioned every other week. Animal rooms were maintained at a temperature of 18–26°C (targeted to 22–24°C) and a relative humidity of 30–70% (targeted to 40–60%). Animal rooms were artificially illuminated (fluorescent light) on an approximate 12-hour light/dark cycle. All animals were provided tap water ad libitum. Rats were fed PMI Nutrition International, LLC
Certified Rodent LabDiet 5002 ad libitum. Nonpregnant rabbits were fed approximately 125 grams per day of PMI Nutrition International, LLC Certified Rabbit LabDiet 5322. Certified low-fiber rabbit feed (PMI Nutrition, Richmond, IN) and water were provided to pregnant rabbits ad libitum. Pregnant rabbit diets were supplemented with Timothy hay cubes (Oxbow Hay Co., Murdock, NE). Rats and nonpreg-nant rabbits were sacrificed by CO
2 inhalation and then
Permeability area cross product (PA) for (fetal) gastric blood to gastric tissue
PAG(F)C_I 0.16 0.02 0.05 0.1 L/h/kg0.75 Pregnant and fetal human estimated from other models (see text); rabbit, this study
PA for (fetal) gastric tissue to gastric juice
PAGJ(F)C_I 12 6 0.01 0.03 L/h/kg0.75 Pregnant and fetal human estimated from other models (see text); rabbit, this study
PA for (fetal) thyroid stoma to follicle
PAT(F)C_I 0.0006 0.0006 0.0001 0.01 L/h/kg0.75 Pregnant and fetal human estimated from other models (see text); rabbit, this study
PA for (fetal) thyroid follicle to colloid
PADT(F)C_I 0.0001 0.1 4.0 × 10⁻⁷ 0.0004 L/h/kg0.75 Pregnant and fetal human estimated from other models (see text); Clewell et al. (2003a) (rat values used for rabbit)
PA for (fetal) skin blood to tissue
PASK(F)C_I 0.01 0.002 0.03 0.02 L/h/kg0.75 Pregnant and fetal human estimated from other models (see text); rabbit, this study
PA for mammary blood to tissue
PAMC_I 0.04 NA 0.01 NA L/h/kg0.75 Pregnant human estimated from pregnant rat* geometric mean of (human/rat) ratios for iodide permeability in other tissues; rabbit, same as rat value (Clewell et al. 2003a)
PA for placental blood to tissue PAPLC_I 0.02 NA 0.005 NA L/h/kg0.75 Pregnant human estimated from pregnant rat* geometric mean of (human/rat) ratios for iodide permeability in other tissues; rabbit, same as rat value (Clewell et al. 2003a)
PA for plasma to red blood cells
PARBCC_I 1 1 1 1 L/h/kg0.75 Merrill et al. (2005)
Urinary excretion rate CLUC_I 0.066 NA 0.06 NA L/h/kg0.75 Pregnant and fetal human estimated from other models (see text); rabbit, this study
Incorporation of iodide into hormones
CLPRODC 0.003 NA 0.03 NA L/h/kg0.75 Pregnant and fetal human estimated from other models (see text); Clewell et al. (2003a) (rat values used for rabbit)
Secretion of incorporated iodide into plasma
CSECRC 1.0 × 10⁻⁶ NA 1.0 × 10⁻⁶ NA L/h/kg0.75 Pregnant and fetal human estimated from other models (see text); Clewell et al. (2003a) (rat values used for rabbit)
Removal of incorporated iodide
CLDEIODC 0.0009 NA NA NA L/h/kg0.75 Merrill et al. (2005)
Removal of iodide bound to plasma
CLUNBC 0.0009 NA NA NA L/h/kg0.75 Merrill et al. (2005)
Transfer from maternal placenta to fetus
CLTRANS1C 0.15 NA 0.07 NA L/h/kg0.75 Human, adjusted to match fetal:maternal ratios of Rayburn et al. (2008); rabbit, this study
Transfer from fetal blood to mother/doe
CLTRANS2C NA 0.12 NA 0.015 L/h/kg0.75 Clewell et al. (2001) (human); rabbit, this study
Table 7. Continued
Parameter SymbolPregnant human
Human fetus
Pregnant rabbit Fetal rabbit Units Source/comment
Inha
latio
n T
oxic
olog
y D
ownl
oade
d fr
om in
form
ahea
lthca
re.c
om b
y C
DC
Inf
orm
atio
n C
ente
r on
07/
10/1
2Fo
r pe
rson
al u
se o
nly.

MeI PBPK model 565
exsanguinated. The tissues were removed from the animal and any excess fat or connective tissue was removed. The tis-sue was collected into a labeled and appropriately sized bag or vial, and frozen until time of use. Blood was used fresh or kept refrigerated until time of use. Pregnant rabbit dams and fetuses were euthanized by an overdose of Euthasol (Virbac A H, Inc., Fort Worth, TX) administered intravenously via the ear vein prior to collection of fetal blood and placenta.
Appropriate amounts of test substance as either liquid or pure vapor (106 ppm) were diluted in Tedlar bags (SKC Inc., Eighty Four, PA) containing a known volume of room air. Further vapor phase dilutions were made for calibration or exposure purposes. Work was conducted with gas-tight syringes. Aliquots of gasbag standards were transferred to reaction vials via gas-tight syringe. A vent needle and a sepa-rate syringe containing a volume of standard ≥ 2 times the volume of the vial was inserted through the septum of the reaction vial. The vial was then flushed with the syringe con-taining the standard. Both syringes were removed and the vial was placed in a temperature-controlled shaker for analysis.
Tissue-to-air partition coefficients (PCs) were quanti-fied by adaptation of a previously described procedure (Teo et al., 1994). Frozen or refrigerated samples were thawed at room temperature. Liquid samples were pipetted
(0.5–2 ml) into reaction vials. Solid samples were minced using scissors and/or razor blades. Approximately 0.2–0.5 grams of homogenized sample were transferred into reaction vials. The vials were sealed after the sample was added. MeI (10,000 ppm final concentration) was added after pre-heating at 37°C (30°C for nasal tissue and saline) for 5 minutes in a heated shaker. The vials were analyzed with a programmable x−y−z robotic multipurpose sam-pler (MPS2; Gerstel, Baltimore, MD). Headspace samples (100 l) were analyzed at 1, 1.5, 2, 2.5, and 3 hours from the start of incubation. The partition coefficient (PC) was cal-culated using the following equation: PC = (GCarea
reference ×
Vvial
) − [GCareatissue
× (Vvial
− Vtissue
)]/(GCareatissue
× Vtissue
) where GC is gas chromatography and V is the volume of the vial or tissue. The volume of the tissue was recorded by volume or weight as appropriate.
Regression analysis of the time-course PC values were used to estimate the PC from the data obtained for each tis-sue or saline (n = 3–5 vials per matrix) according to the follow-ing equation: y = a × e(b × x) where the PC is the intercept a at x = 0 hours, b is the slope, x is time (hours), and y corresponds to regression fit of the apparent PC time-course values. The regression analysis was performed using a commercially available graphics program (Origin 7.0 SR0; OriginLab
Table 8. Parameters for child nasal modeling.
Parameter Symbol UnitAdult
human 3 mo 1 yr 5 yrs 10 yrs 15 yrs Fraction
Surface area of olfactory epithelium, region 1 SAOLF1 cm2 13.2 1.6 2.4 5.3 8.2 11.7 0.05
Surface area of olfactory epithelium, region 2 SAOLF2 cm2 0.1 0.01 0.02 0.04 0.06 0.09 0.00
Surface area of dorsal respiratory patch SADR cm2 10.1 1.2 1.9 4.0 6.2 9.0 0.04
Surface area of ventral respiratory epithelium, region 1
SAWR1 cm2 42.1 5.1 7.8 16.8 26.0 37.4 0.17
Surface area of ventral respiratory epithelium, region 2
SAWR2 cm2 72.3 8.7 13.3 28.9 44.7 64.3 0.29
Surface area of nasal vestibule (squamous epithelium)
SASQ cm2 32.4 3.9 6.0 13.0 20.0 28.8 0.13
Surface area of nasopharynx SANP cm2 75.8 9.1 14.0 30.3 46.9 67.4 0.31
Total nasal surface area 246 29.7 45.3 98.4 152.1 218.8
Volume of the dorsal meatus respiratory patch lumen
VDMR cm3 0.738 0.050 0.087 0.227 0.400 0.663 0.02
Volume of the dorsal meatus olfactory region lumen
VDMO1 cm3 0.554 0.037 0.065 0.170 0.300 0.498 0.02
Volume of the dorsal meatus ethmoid olfactory lumen
VDMO2 cm3 0.1 0.01 0.01 0.03 0.05 0.09 0.00
Volume of the anterior region respiratory lumen VRMR1 cm3 3.5 0.24 0.41 1.08 1.89 3.14 0.11
Volume of the posterior region respiratory lumen VRMR2 cm3 5.2 0.35 0.61 1.60 2.82 4.67 0.16
Volume of the vestibular region lumen VSQA cm3 4.8 0.32 0.57 1.47 2.60 4.31 0.14
Volume of the nasopharynx lumen VNPA cm3 18.3 1.24 2.16 5.62 9.91 16.44 0.55
Total nasal volume 33.192 2.242 3.916 10.197 17.971 29.82
Body Weight (kg) 61 6 10 20 33 57
Tidal volume (ml) 630 62 103 207 341 589
Respirations per minute (min21) 15 32 36 26 23 15
L/min 9.45 2.0 3.7 5.3 8 9
Note. Adult human values per Frederick et al. (1998, 2002). Assume fractional surface areas and volumes are constant across ages. Assume TVOL/BW = constant across ages. Age-specific resting (sitting) breathing rate, BW, nasal volume and nasal surface area (SA) from Kimbell et al., 2005. Breathing rates in Kimbell et al. (2005) were based on ICRP (1994). Assume that nasal SA presented in poster is mm2, not cm2 as indicated in table column.
Inha
latio
n T
oxic
olog
y D
ownl
oade
d fr
om in
form
ahea
lthca
re.c
om b
y C
DC
Inf
orm
atio
n C
ente
r on
07/
10/1
2Fo
r pe
rson
al u
se o
nly.

566 L. M. Sweeney et al.
Corporation, Northampton, MA). Results were reported as the PC ± 1 standard error (SE) calculated by Origin.
Chemical specific: metabolismThe metabolism of MeI via reaction with GSH was measured in vitro using headspace techniques. Chamberlain et al. (1998a) determined maximal GSH reaction rates in cytosolic fractions of the liver, nasal respiratory epithelium, and nasal olfactory epithelium of male Wistar rats. Maximal rates for nasal respiratory and olfactory epithelium were scaled to per gram tissue rates (Green et al., 2001). Poet et al. (2009) deter-mined metabolic rates for male Sprague Dawley rat liver and kidney, adult female NZW rabbit liver, kidney, nasal olfactory and respiratory epithelium (pooled), fetal rabbit liver and kidney, and human liver and kidney. Rates for nasal tissue were normalized to tissue volume, and rates for other tissues were normalized to body weight (BW)0.7 based on experi-ment-specific data (rats and rabbits) or supplier-reported yields (human) (Poet et al., 2009). Human rate parameters for MeI–GSH conjugation in nasal tissue were estimated as equal to those of the rat (on a per gram tissue weight basis) because it was possible to validate the rates from rats against in vivo data (Himmelstein et al., 2009), but it was not possible to validate the rabbit rates due to a lack of consistent GSH depletion (Sloter et al., 2009). The values of rabbit nasal GSH conjugation capacities and affinity constants (V
max and K
m)
seem unrealistically high (Poet et al., 2009); our interpreta-tion of these data is that K
m is “high”, but could not be defined
under the experimental conditions. Rather than arbitrarily select a K
m and then calculate V
max from the experimentally
determined Vmax
/Km
ratio, we have opted to simply use the parameters as reported. In addition, the rate of GSH metabo-lism in the rabbit nose has little to no significance for the endpoint of concern in that species (late fetal death).
Chemical-specific parameters for iodide disposition in the rat and human were taken from Merrill et al. (2003, 2005). Where appropriate, parameters for the pregnant or fetal human were estimated from the parameter values for the male human (Merrill et al., 2005), adjusted by the ratio of the values in the pregnant or fetal rat (Clewell et al., 2003a) and male rat (Merrill et al., 2003) per Clewell et al. (2001). Clewell et al. (2001) was the source of baseline values for iodide exchange rate constants for transfer between the pregnant woman and human fetus. The rate of transfer of iodide from the human placenta into the fetus (CLTRANS1C) has been modified to reflect a human fetal:maternal serum iodide ratio of 1.2. This human fetal: maternal serum iodide ratio is the average of the ratios for 121 preterm and term deliv-eries reported in a recent study (Rayburn et al., 2008). This modification of placental iodide transfer was accomplished by increasing CLTRANS1C from 0.12 to 0.15. The use of this value is conservative, as the human fetal:maternal serum iodide ratio during the window of susceptibility is more likely to be approximately 0.9, the ratio observed for preterm deliveries (Rayburn et al., 2008).
Chemical-specific parameters for iodide disposition in the pregnant and fetal rabbit were determined by fit to the
data of Sloter et al. (2009) and Thrall et al. (2009a). Starting values for model parameters were taken from the pregnant and fetal rat model (Clewell et al., 2003a).
Simulation and parameter fittingSimulations and parameter fitting were conducted using ACSLSim (AEgis Technologies Group) using the Euler inte-gration algorithm, with a step size of 1× 10⁻⁸ hr, 1 × 10⁻⁷ hr, or 1 × 10⁻⁶ hr for rats, rabbits, and humans (to allow accurate simulation of cyclic breathing), on a Dell Optiplex GX260 with a Pentium 4 processor or Dell Latitude D800 with a Pentium M processor.
Supporting experimentsUptake of MeI by rat and rabbit nasal cavityThe rat exposure methodology consisted of anesthetizing a male Sprague Dawley rat using ketamine/xylazine and inserting a 1.0-mm outer diameter (PE 20) tube into the nasal cavity of the animal to a depth of approximately 2 cm from the tip of the nose (within the nasopharynx). The ani-mal was positioned inside the head-out plethysmograph and the assembly was placed inside a 9.1-L glass chamber. Animal breathing frequency, tidal volume, and minute volume were measured using the head-out plethysmo-graph. MeI concentrations in the rat nasal cavity were maintained by a continuous supply of MeI (1 L/min for 10 minutes to fill the chamber, then 200 ml/min to maintain concentrations). Exposures were limited to approximately 30 minutes due to the use of a closed system and the dura-tion of anesthesia. Additional details are available in Thrall et al. (2009b).
The rabbit exposure methodology was similar to the rat exposure methodology with the following alterations. The rabbit exposure system consisted of anesthetizing a nulliparous female NZW rabbit using ketamine/xylazine/acepromazine and inserting the tube into the nasal cavity of the animal to a depth of approximately 6.5 cm from the tip of the nose. A 20-L glass chamber was used to accom-modate the rabbit plethysmograph system, and the volume of the plethysmograph system was 7.74 L. Rather than maintaining constant MeI concentrations in the chamber, an initial volume of MeI was injected, and concentrations monitored approximately every 7 minutes. Nonspecific loss to the plethysmograph system (with no animal) was also determined. Additional details are available in Thrall et al. (2009b).
In vivo gas uptake (whole body metabolism) by rabbitFemale New Zealand White rabbits (2900–3200 g, approxi-mately 12–15 weeks of age) were obtained from Western Oregon Rabbit Company (Philomath, OR). Animals were housed in wire-bottom cages with polycarbonate resting boards and were acclimated in a humidity- and tempera-ture-controlled room with a 12-hr light/dark cycle. Certified high-fiber rabbit feed (PMI Nutrition, Richmond, IN) and water were provided ad libitum. Diets were supplemented with Timothy hay cubes (Oxbow Hay Co., Murdock, NE).
Inha
latio
n T
oxic
olog
y D
ownl
oade
d fr
om in
form
ahea
lthca
re.c
om b
y C
DC
Inf
orm
atio
n C
ente
r on
07/
10/1
2Fo
r pe
rson
al u
se o
nly.

MeI PBPK model 567
Animals were acclimated to the gas uptake chamber for up to 5 days prior to use.
The closed atmosphere exposure system was constructed using a 20-L glass aquarium with gas inlet and outlet fittings fashioned into a ¼-inch-thick stainless-steel lid. A ½-inch foam rubber gasket was fitted between the rim of the aquar-ium and the stainless-steel lid. The chamber atmosphere was recirculated using a metal bellows (Model MB 118) stainless-steel metal pump (Senior Operations, Inc., Sharon, MA) at 10 L/min. Carbon dioxide was removed with SodaSorb (W.R. Grace & Co., Atlanta, GA). Oxygen concentration in the cham-ber was maintained at 19–21% by slowly adding ultra-high-purity (UHP) O
2 when an audible O
2 alarm (Cole-Parmer,
Vernon Hills, IL) signaled that concentrations had dropped below 20%. The pressure in the chamber was continually monitored using a Cole-Parmer digital pressure gauge and stayed constant throughout the experiment. During use, the outside of the chamber was covered with laboratory bench top paper to help keep the rabbit tranquil and still.
Each experiment utilized a single, unanesthetized rabbit. MeI was added as a liquid through a heated septum fitting 12 inches upstream of the chamber in a volume to achieve the desired initial starting concentrations. The volumes of injected MeI were sufficiently small that volatilization was rapid. The chamber atmosphere was monitored prior to the addition of MeI and for the duration of the exposure phase (4 hours). Studies conducted with an empty chamber found the nonspecific loss of MeI to be independent of concen-tration, and less than 5%/hr. Nonspecific loss of MeI to the body of the rabbit (9.4%) was determined using a deceased animal and all other exposure conditions were identical to studies with live animals.
Rat GSH depletion/iodide studyGroups of three rats were exposed to 0, 25, or 100 ppm MeI for up to 6 hours per day for 2 days in a combined pharma-cokinetic–mechanistic study (Himmelstein et al., 2009). Blood was collected for serum iodide analysis and liver, kid-ney, nasal respiratory epithelium, and nasal olfactory epi-thelium were collected for GSH analysis at t = 0, 3, 6, 9, 24, 27, 30, 33, and 48 hours from the beginning of the first exposure. Analytical details and mechanistic aspects of the study are described in greater detail in Himmelstein et al. (2009).
Rabbit GSH depletion/iodide studiesGroups of rabbits were exposed to 0, 20, or 25 ppm MeI for up to 6 hours per day for 4 days in a pilot study with limited pharmacokinetic data collection (25 ppm) and a lowest observed adverse effect level (LOAEL)-equivalent study (20 ppm) with time-course pharmacokinetics (Sloter et al., 2009). Blood was collected for serum iodide analysis and liver, kidney, nasal respiratory epithelium, and nasal olfactory epithelium were collected for GSH analysis throughout the study. Analytical details and mechanistic aspects of the studies are described in greater detail in Sloter et al. (2009).
Hb adductsHemoglobin adducts were measured in blood samples col-lected in conjunction with the rat 25- and 100-ppm MeI exposures. The S-methyl cysteine residues were isolated and measured (Himmelstein et al., 2009).
Additional validation dataA 19-year-old man (height = 176 cm, weight = 85 kg) attempted to commit suicide by injecting approximately 6 ml (14 g) MeI into his left cubital vein. The serum concentration of MeI in this patient was measured approximately 3 hours after the injection (Robertz-Vaupel et al., 1991).
Data analysisHEC derivationKey endpoints were identified by the US Environmental Protection Agency (US EPA, 2004). Modes of action and cor-responding internal dose metrics related to these effects are discussed in detail in Kirman et al. (2009). Human equivalent concentrations (HECs) were calculated for a given endpoint by first calculating the rat/rabbit value of the relevant dose metric under the no observed adverse effect levels (NOAEL) conditions identified by the key studies. A 24-hour expo-sure for a human that produces the same internal dose was determined by simulating continuous human exposures to varying concentrations of MeI until the concentration pro-ducing the rat/rabbit NOAEL-equivalent internal dose was identified.
Simulation of repeated exposureFor the rabbit developmental study, the repeated expo-sure simulations were conducted using the version of the PBPK model where the nose is not a distinct compartment. These simulations have been shown to be equivalent to those with a nose compartment, but may be conducted more rapidly.
The kinetic profile for fetal serum iodide in rabbits exposed to 2 ppm MeI was observed to be essentially identical for each exposure by the completion of 2 weeks of daily exposure (see “Results”). Therefore the 1-day fetal iodide area under the curve (AUC) calculated for day 14 of exposure (AUC at 336 hrs – AUC at 312 hrs) was used as the NOAEL-equivalent internal dose for 2 ppm. The kinetic pro-file for rabbit fetal serum iodide stabilized more rapidly at 10 ppm (see “Results”), and the AUC for day 5 was used as the NOAEL-equivalent internal dose for 10 ppm.
The exposure of bystanders was assumed to occur only once, so a single exposure day was simulated, but the human fetal iodide AUC was calculated for 96 hrs (until essentially all the iodide is eliminated). For workers, it was assumed that previous exposures would have caused baseline iodide levels to increase. It was determined that after 6 days of exposure to MeI the daily iodide kinetics profile would be the same for subsequent exposures. Fetal iodide AUC for the final exposure day was calculated as the AUC at 240 hrs (10 days) minus the AUC at 144 hrs, thus integrating the
Inha
latio
n T
oxic
olog
y D
ownl
oade
d fr
om in
form
ahea
lthca
re.c
om b
y C
DC
Inf
orm
atio
n C
ente
r on
07/
10/1
2Fo
r pe
rson
al u
se o
nly.

568 L. M. Sweeney et al.
AUC from the final day of exposure over the exposure day and 3 subsequent days without exposure. That is, in these simulations, the workers are exposed for 6 days, to build up iodide, and AUC from the exposure of interest, the 7th day, is integrated over that 7th day and 3 subsequent days until the iodide is fully removed.
Sensitivity analysis/variability analysisNormalized sensitivity coefficients (SCs) were calculated for changes in predicted dose metrics of potential inter-est for changes in model parameter values. In the analyses presented here, sensitivity was determined by increasing the parameter values by 1% and dividing the fractional change in the model prediction by the 1% fractional change in the input parameter.
Variability analyses were conducted to assess the impact of parameter variability/uncertainty on peak brain MeI predictions for the humans exposed to MeI. The variability analysis accounts for both the model sensitivity and the known or estimated variability in the input parameter (Licata et al., 2001; Sweeney et al., 2003, 2004). Coefficient of varia-tion (CV
i) values were calculated from experimental data or
estimates taken from the published literature for parameters with |SC| > 0.1. Based on the product of |SC| and CV
i, a limited
number of parameters with the greatest potential to impact variability were selected for Monte Carlo simulation. The majority of model variability is generally well represented by the variability of a limited number of parameters (Sweeney et al., 2001, 2003). Parameter distributions were developed for these parameters, used to generate 2000 trials, and simulated in ACSL. Of 1467 trials simulated for peak brain concentration of MeI, 12 were eliminated from the analysis due to computational instability and physiological improb-ability/impossibility (produced minimal or negative flow to the richly perfused tissues).
Results and discussion
Partition coefficientsThe PCs for brain, fat, kidney, muscle, and nasal tissue were similar across animal species (Table 5). The rabbit thyroid PC was three times higher than the rat thyroid PC. The rat liver PC was twice as high as the rabbit liver PC. The rat blood PC was 2.5 times higher than the rabbit blood PC (rat: 39, rabbit: 16). The human blood PC (18) was more similar to the rabbit blood PC than the rat blood PC. There was no significant difference between male and female human blood PCs. The rabbit fetal blood PC (12) was simi-lar to the rabbit maternal blood PC (16).
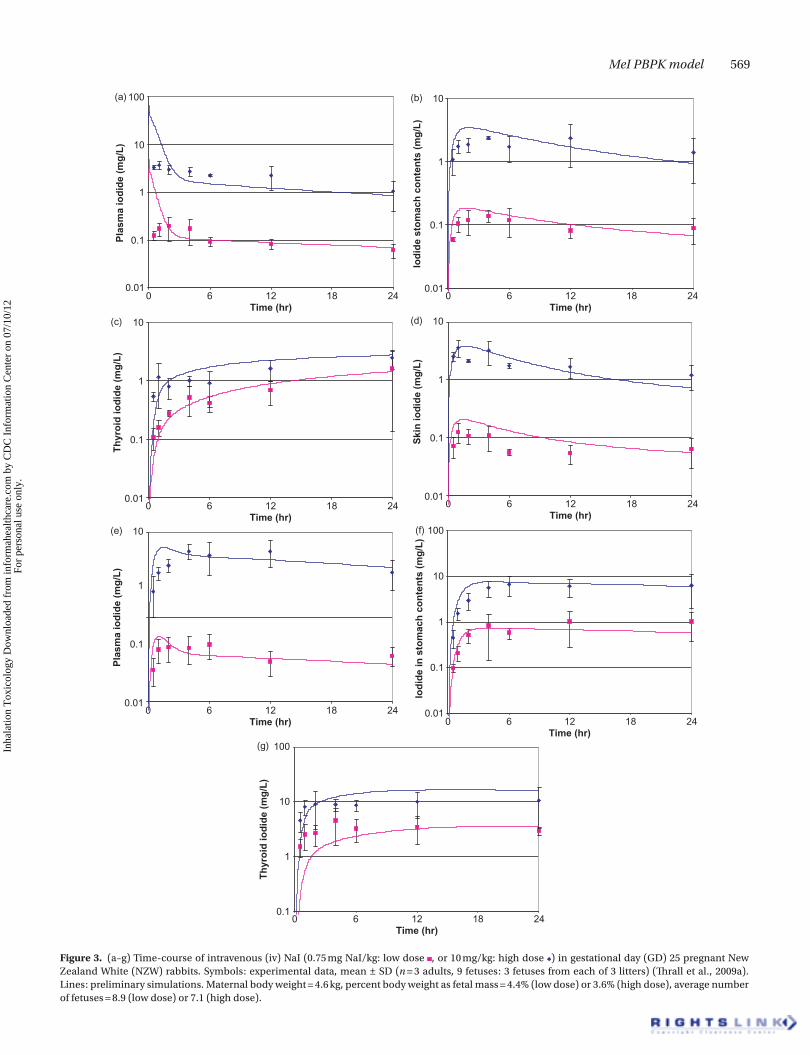
Rabbit model developmentPreliminary iodide disposition values for the pregnant and fetal rabbit were developed based on the data of Thrall et al. (2009a). In this study, gestational day (GD) 25 pregnant rab-bits were dosed with radiolabeled iodide by intravenous injection, and blood, plasma, and tissue levels of iodide determined at 0.5, 1, 2, 4, 6, 12, and 24 hours post-dosing. The
model fits to the data are depicted in Figure 3. In general, pla-cental and mammary uptake, urinary elimination rate, and transfer rates between doe and fetus determined the plasma iodide profiles in the doe and the fetus. Adjustment of other, tissue-specific parameters (e.g. permeability, partitioning) to reproduce the observed tissue concentration profiles did not have a large impact on blood iodide kinetics. Thus, the parameters generated in this phase of the analysis are considered to accurately reproduce tissue kinetics of iodide when blood kinetics is accurately predicted.
For MeI-exposed rabbits, the fit of the model to the iodide data (Sloter et al., 2009) is shown in Figure 4. Computational difficulties were encountered with prolonged simulations of the rabbit nasal model, so a modification of the model was made with systemic uptake eliminated from the nose (alveolar uptake only). The predicted iodide concentrations from the two versions of the model indicate minimal difference (Figure 4a), so the alveolar uptake model was used for the prolonged simu-lations shown in Figure 4b and c. Parameter adjustments that were made to fit this data set reduced the quality of the fit to the Thrall et al. (2009a) data (Figure 5). The discrepancies may be the result of dose-dependencies that have not been correctly parameterized in the current model description. For example, transfer of iodide from fetus to doe is described as first-order with respect to fetal plasma concentrations, but in reality may be limited by uptake from blood to the fetal side of the placenta at higher iodide concentrations. While a refined rabbit iodide model would be desirable, the current description accurately reproduces plasma iodide concentrations observed in MeI (20 or 25 ppm)-exposed does and fetuses over a 4-day period and thus should reliably calculate plasma iodide dose metrics for species extrapolation purposes.
An additional parameter adjustment was made for simu-lation of the pregnant rabbit iodide data set. The pulmonary ventilation was estimated from the cardiac output determined in GD 20–30 NZW rabbits (Nuwayhid, 1979) rather than the pulmonary ventilation rate measured by DeLorme et al. (2009) (16.5 L/hr-kg0.75), which indicates alveolar ventilation (QAC) and cardiac output (QCC) = 11.0 L/hr-kg0.75. Pulmonary ventilation was estimated as 1.5 × cardiac output (Brown et al., 1997). Literature reports of cardiac output in nonanesthetized NZW rabbits are variable. Normalized cardiac output calcu-lated from the data of Johnson et al. (1985) results in estimates of QCC = 16 and 17 L/hr-kg0.75 for nonpregnant and GD 29 rabbits, while Nuwayhid’s data yield QCC = 13, 26, and 20 for nonpregnant, GD 10–19, and GD 20–30 female NZW rabbits, respectively. The pulmonary ventilation value used to simu-late the data for MeI-exposed rabbits is higher than measured by DeLorme et al. (2009) but is consistent with the range of cardiac outputs observed for pregnant NZW rabbits.
Using the GSH conjugation rates determined in vitro (Poet et al., 2009), modest GSH depletion was predicted for the rab-bit liver over the course of a 6-hr experiment (data not shown). Small decreases may not readily be identified in vivo due to normal variability and diurnal variation. The model predicted, however, that GSH would be totally depleted in the nasal tis-sues in less than 6 hrs. These predictions were not consistent
Inha
latio
n T
oxic
olog
y D
ownl
oade
d fr
om in
form
ahea
lthca
re.c
om b
y C
DC
Inf
orm
atio
n C
ente
r on
07/
10/1
2Fo
r pe
rson
al u
se o
nly.
MeI PBPK model 569
Figure 3. (a–g) Time-course of intravenous (iv) NaI (0.75 mg NaI/kg: low dose , or 10 mg/kg: high dose ) in gestational day (GD) 25 pregnant New Zealand White (NZW) rabbits. Symbols: experimental data, mean ± SD (n = 3 adults, 9 fetuses: 3 fetuses from each of 3 litters) (Thrall et al., 2009a). Lines: preliminary simulations. Maternal body weight = 4.6 kg, percent body weight as fetal mass = 4.4% (low dose) or 3.6% (high dose), average number of fetuses = 8.9 (low dose) or 7.1 (high dose).
0.01
0.1
1
10
100
0 6 12 18 24Time (hr)
0 6 12 18 24Time (hr)
Plas
ma
iodi
de (m
g/L)
(a)
0.01
0.1
1
10
100
0 6 12 18 24Time (hr)
Iodi
de in
sto
mac
h co
nten
ts (m
g/L)
(f)
0.01
0.1
1
10
Iodi
de s
tom
ach
cont
ents
(mg/
L)
(b)
0 6 12 18 24Time (hr)
0.01
0.1
1
10
Skin
iodi
de (m
g/L)
(d)
0 6 12 18 24Time (hr)
0.01
0.1
1
10
Thy
roid
iodi
de (m
g/L)
(c)
0 6 12 18 24Time (hr)
0.01
0.1
1
10
Plas
ma
iodi
de (m
g/L)
(e)
0 6 12 18 24Time (hr)
0.1
1
10
100
Thyr
oid
iodi
de (m
g/L)
(g) Inha
latio
n T
oxic
olog
y D
ownl
oade
d fr
om in
form
ahea
lthca
re.c
om b
y C
DC
Inf
orm
atio
n C
ente
r on
07/
10/1
2Fo
r pe
rson
al u
se o
nly.

570 L. M. Sweeney et al.
with the experimental data indicating no significant declines in nasal GSH following MeI exposure (Sloter et al., 2009). The discrepancy could result from model misspecifications regarding delivery of MeI to nasal epithelium, differences in in vitro and in vivo rates of metabolism of the delivered MeI, or in the GSH synthesis (turnover) rate in these tissues.
The rabbit breathing parameters reported by DeLorme et al. (2009) and Thrall et al. (2009b) are very different. DeLorme reports that control and unexposed rabbits took ~128 breaths per minute (bpm), with a tidal volume of only 3.6 ± 1.3 ml in control rabbits and 5.1 ± 1.2 ml in exposed rab-bits. This difference was not statistically significant. Corley et al. (2009) report nasal lumen volumes of ~5.5–6.1 ml in 4.3–4.8-kg rabbits. The DeLorme report does not provide body weight at time of testing; the animals weighed ~2 kg at time of testing (M. DeLorme, personal communication). Thrall et al. (2009b) measured breathing rates in anesthetized, restrained animals in which a probe had been placed in the nose for monitoring MeI concentrations. In these animals (body weight = 2.8–3.5 kg), breathing frequency was 38–52 bpm and tidal volume was 2.8–12.9 ml/kg (average ~22 ml).
Simulation of closed-chamber uptake of MeI by nonpreg-nant female rabbits is shown in Figure 6. For these simula-tions, the best fit was achieved using a tidal volume equal to 3.5 ml, 40% less than the average reported by DeLorme et al. (2009) for MeI-exposed rabbits (5.1 ± 1.2 ml), but similar to the value measured for control rabbits (3.7 ± 1.3 ml). The respiration rate reported by DeLorme et al. (2009) for unan-esthetized, unrestrained rabbits was used unchanged.
Studies designed to evaluate nasal uptake of MeI by rab-bits were conducted by Thrall et al. (2009b). Use of the tidal
Figure 5. (a, b) Time-course of iv NaI (0.75 mg NaI/kg: low dose, or 10 mg/kg: high dose) in GD 25 pregnant NZW rabbits. Symbols: experi-mental data, mean ± SD (n = 3 adults, 9 fetuses: 3 fetuses from each of 3 litters) (Thrall et al., 2009a). Lines: simulations with parameters deter-mined from fit to Sloter et al. (2009) data. Maternal and fetal weights and numbers per Figure 3.
(a)
0.01
0.1
1
10
100
0 6 12 18 24Time (hr)
Pla
sma
iodi
de (
mg/
L)
(b)
0.1
1
10
100
0 6 12 18 24Time (hr)
Pla
sma
iodi
de (
mg/
L)
(a) Serum iodide, MeI exposed Does (20 ppm)
1,000
10,000
100,000
0 6 12 18 24Time (hr)
Seru
m Io
dide
(ng/
ml)
Seru
m Io
dide
(ng/
ml)
Fetal
Maternal
Fetal--full model
Maternal--full model
Maternal--alveolaruptake modelFetal--alveolaruptake model
(b) Serum iodide, MeI exposed Does (20 ppm)
1,000
10,000
100,000
0 6 12 18 24 30 36 42 48 54 60 66 72 78Time (hr)
Seru
m Io
dide
(ng/
ml)
(c)
1,000
10,000
100,000
0 6 12 18 24 30 36 42 48 54 60 66 72 78Time (hr)
FetalMaternalMaternal--modelFetal--model
Serum iodide, MeI exposed Does (25 ppm)
FetalMaternalFetal--modelMaternal--model
Figure 4. (a–c) Serum iodide in maternal and fetal rabbits exposed to MeI 6 hrs/day on GD 23–26. Symbols: experimental data, mean ± SD (n = 5 adults, 4–9 fetal samples) (Sloter et al., 2009). Lines: simulation. Maternal body weight = 4 kg, average number of fetuses = 8, tidal volume = 11.2 ml. (a) 20 ppm, simulations with alveolar uptake only (upper) or nasal and alve-olar uptake (lower); (b) 20 ppm, alveolar uptake simulation; (c) 25 ppm, alveolar uptake simulation.
Inha
latio
n T
oxic
olog
y D
ownl
oade
d fr
om in
form
ahea
lthca
re.c
om b
y C
DC
Inf
orm
atio
n C
ente
r on
07/
10/1
2Fo
r pe
rson
al u
se o
nly.

MeI PBPK model 571
volumes and breathing frequencies measured in this study resulted in large over-predictions of chamber uptake dur-ing exposure (i.e. the rabbits did not absorb as much MeI as the model would suggest). To match the chamber uptake observed in these studies, it was necessary to adjust the tidal volumes by a factor of 7, which reduces the tidal volume to the range reported by DeLorme et al. (2009). The source of this large discrepancy is unclear, but may be related to changes in blood flow distribution and partitioning related to restraint and/or anesthesia rather than a misspecification of the tidal volume. The predictions of MeI concentration in the nasopharynx were generally within a factor of 2 of the meas-ured concentrations when tidal volume was adjusted to pro-duce a fit to the chamber uptake measurements (Figure 7).
Rat model developmentThe fits of the rat model to serum iodide and tissue GSH measured in MeI-exposed rats are shown in Figures 8 and 9. Use of the ventilation parameters measured by DeLorme et al. (2009) (QPC = 40 L/hr-kg0.75) resulted in predicted tis-sue GSH depletion exceeding that observed experimentally. The lower ventilation rate for rats used by Gargas et al. (1986) was used instead, and pulmonary ventilation rate was calcu-lated from this rate (QAC = QPC × 2/3).
Minimal depletion of liver GSH in rats exposed to 25 ppm MeI was observed, when compared to unexposed controls. At 100 ppm, there appears to be a lag before liver GSH deple-tion starts. In order for the model to show similar behavior, GSH conjugation in the stomach and intestines (tissues which receive portal blood flow prior to the liver receiving the blood) was included (Sherratt et al., 1997). Additional GST metabolism was included in the skin (Arfsten et al., 2004). Rates for stomach and intestines were estimated as being equal to the rates measured in vitro for the kidney, on a per gram tissue weight basis. GST expression in skin is expected to be lower, on a tissue weight basis, but the total
tissue volume is larger. Total GST metabolism in the skin was estimated as equal to the in vitro rate in the kidney.
GSH depletion in the rat kidney was much less than would be expected on the basis of blood flow to this organ and the conjugation rate measured in vitro (Poet et al. 2009). Observed GSH depletion at both 25 and 100 ppm was reproduced by the model when the rate used was only 1.5% of the measured rate. It is possible that kidney GSTs in the Sprague Dawley rat are inhibited by methylglutathione (MeGSH) (Mangold & Abdel-Monem, 1983), a product of MeI–GSH conjugation, but this effect was not observed in vitro due to dilution in buffer.
Recovery of GSH levels in the rat olfactory epithelium (Himmelstein et al., 2009) was much faster than expected based on the GSH turnover rate for this tissue reported by Potter et al. (1995). Therefore, the turnover rate was increased from 0.016/hr to 0.19/hr to match the data. While Potter and Tran (1993) and Malmezat et al. (2000) determined similar GSH turnover rates for liver (0.14/hr vs. 0.16/hr), for all other tissues common to the two studies (muscle, lung, small intestine, large intestine, and blood) the rates of Malmezat et al. (2000) were higher by factors of 2–9.
Hemoglobin adducts measured in MeI-exposed rats (Himmelstein et al., 2009) showed an approximately linear increase with exposure concentration, consistent with the linear increase in area under the blood concentration–time curve (blood AUC) (Table 9).
Agreement between the model and rat nasopharyngeal concentrations of MeI (Thrall et al., 2009b) was very good using the measured ventilation parameters for four of the six animals (Figure 10). (It should be noted that the model did not incorporate the time for the chamber to fill and reach the target concentration.) For two of six animals, the quality of the fit was significantly poorer. The measured parameters of these two animals indicated a very small tidal volume (similar to the volume of the rat nasal lumen) and very high breathing frequency. These factors may have altered the airflow patterns such that the model does not accurately describe the mass transfer characteristics. Another possibility is that these two animals were breathing at least partially through their mouths, which could alter the plethysmograph’s interpretation of breathing patterns and would tend to increase concentrations at the nasopharynx. We believe that these breathing changes are the effects of anesthesia and/or the presence of the nasal probe and are unlikely to occur in normally exposed rats.
Human model validationThe human model was tested against data from an unsuc-cessful suicide attempt in which a young man injected himself with MeI (Robertz-Vaupel et al., 1991). The model predicted a blood concentration of 15 mg MeI/L 3 hours after injection, whereas the measured concentration was approximately 60 mg/L. If the pulmonary ventilation and cardiac output were reduced to 20% of normal values, the model could accurately predict the measured concentra-tion. The individual was somnolent and suffering from central nervous system effects, so some decrease in ven-tilation and cardiac output would be expected, but the
Figure 6. Closed chamber uptake of MeI by unanesthetized nulliparous female NZW rabbits. Symbols: experimental data. Lines: simulation with tidal volume = 3.5 ml. BW = 3.0–3.2 kg (individually measured body weights used for each simulation).
0.01
0.1
1
10
100
0 1 2 3 4Time (hr)
Met
hyl i
odid
e co
ncen
trat
ion
(ppm
)
Inha
latio
n T
oxic
olog
y D
ownl
oade
d fr
om in
form
ahea
lthca
re.c
om b
y C
DC
Inf
orm
atio
n C
ente
r on
07/
10/1
2Fo
r pe
rson
al u
se o
nly.

572 L. M. Sweeney et al.
Figure 7. (a–i) Nasal and closed chamber uptake of anesthetized, restrained nulliparous female NZW rabbits. Symbols: experimental data (Thrall et al., 2009b). Lines: simulations using measured body weights (2.7–3.4 kg) and respiration rates (if available), tidal volumes one-seventh of measured vol-umes. Group average respiration rates and tidal volumes were used for animals I-6977 and I-6867.
(a)
0
10
20
30
40
50
60
70
0 2 4 6 8 10 12 14Time, min
Mel
Con
c., p
pm
Mel
Con
c., p
pmM
el C
onc.
, ppm
Con
c., (
ppm
)
Con
c., (
ppm
)
Con
c., (
ppm
)
Con
c., (
ppm
)
Mel
Con
c., p
pm
0
10
20
30
40
50
60
70
Mel
Con
c., p
pm
Chamber conc.
Nasal probe
(b) MeI Gas Uptake Rabbit Exposure w/Nasal Monitoring7/22/2004, Rabbit I-6977
0 5 10 15 20 25 30 35
0 5 10 15 20 25 30 35
40 45Time (min)
0 5 10 15 20 25 30 35 40 45Time (min)
0 5 10 15 20 25 30 35 40 45Time, min
0 5 10 15 20 25 30 35 40
nasal MeI concchamber concnasopharynx (average--model)Chamber
Gas uptake
Nasal probe
MeI Gas Uptake Rabbit Exposure w/Nasal Monitoring7/22/2004, Rabbit I-6867
(c) MeI Gas Uptake Rabbit Exposure w/Nasal Monitoring08/13/2004, Rabbit I-7581
0
5
10
15
20
25
30
35
40
45
50
Time (min)
0 5 10 15 20 25 30 35Time (min)
0 5 10 15 20 25 30 35Time (min)
(d) MeI Gas Uptake Rabbit Exposure w/Nasal Monitoring07-27-2004, Rabbit I-6978
0.0
2.0
4.0
6.0
8.0
10.0
12.0
14.0
16.0
18.0
nasal concchamber concaverage in nasopharynx (model)Chamber concentration
Gas uptake
Nasal probe
(e) MeI Gas Uptake Rabbit Exposure w/Nasal Monitoring10 ppm Exposure, 7-28-2004, Rabbit I-7104
0.0
1.0
2.0
3.0
4.0
5.0
6.0
7.0
8.0
9.0
10.0
Gas uptake
(f) MeI Inhalation Exposure, Rabbit (~10 ppm), Nasal Probe MeasurementAugust 13, 2004, Rabbit I-7463
0.0
1.0
2.0
3.0
4.0
5.0
6.0
7.0
8.0
9.0
10.0
Chamber concentration
(g) MeI Gas Uptake Rabbit Exposure w/Nasal Monitoring2 ppm Chamber Exposure7-29-2004, RabbitI-7373
0
500
1,000
1,500
2,000
2,500
3,000
3,500
4,000
Time (min)
0 5 10 15 20 25 30 35 40Time (min)
Gas uptake
(h) MeI Inhalation Exposure, Rabbit (~10 ppm), Nasal ProbeMeasurement
August 13, 2004, Rabbit I-7463
0.0
1.0
2.0
3.0
4.0
5.0
6.0
7.0
8.0
9.0
10.0
Chamber concentration
(i) MeI Gas Uptake Rabbit Exposure w/Nasal Monitoring2 ppm Chamber Exposure7-29-2004, Rabbit I-7371
0
200
400
600
800
1,000
1,200
1,400
1,600
1,800
nasal concchamber concnasopharynx (average--model)Chamber concentration (model)
nasal concchamber concnasopharynx concentration(average--model)Chamber
Inha
latio
n T
oxic
olog
y D
ownl
oade
d fr
om in
form
ahea
lthca
re.c
om b
y C
DC
Inf
orm
atio
n C
ente
r on
07/
10/1
2Fo
r pe
rson
al u
se o
nly.

MeI PBPK model 573
magnitude of the effect cannot be determined from the case report. We consider these results to be supportive evidence of the model’s ability to predict MeI kinetics in the human.
Model application to HEC derivationNasal lesionsOlfactory lesions were observed in rats exposed to 70 ppm MeI, with a corresponding NOAEL of 21 ppm for 6 hrs/day, 5 days/week for 4 weeks (Kirkpatrick, 2002). Reed et al. (1995) exposed male Wistar rats to 100 ppm MeI for durations of 0.5, 1, 2, 3, 4, or 6 hrs, and sacrificed the animals 24 hours post-exposure. No signs of nasal toxicity were observed in the animals exposed for 0.5 or 1 hr. Slight effects were observed in the nasal cavity of rats exposed for 2 hrs, with more severe effects observed in animals exposed for longer durations. Thus this study indicates an acute NOAEL of 100 ppm for a 1-hr exposure (100 ppm-hr), a similar cumulative, daily
Figure 8. Serum iodide in MeI-exposed rats (25 or 100 ppm, 6 hrs/day for 2 days). Symbols: experimental data, mean ± SD (n = 3) (Himmelstein et al., 2009). Lines: simulations.
1,0000 10 20 30
Time (hr)
Serum iodide
40 50 60
10,000
Ser
um io
dide
(ug/
L)
100,000
Figure 9. (a–d) Tissue glutathione (GSH) concentrations in MeI-exposed rats. Symbols: experimental data, mean ± SD (n = 3) (Himmelstein et al., 2009). Lines: simulations.
(a) Rat Kidney GSH
0
0.5
1
1.5
2
2.5
0 5 10 15 20 25 30Time (hr)
Glu
tath
ione
Con
cent
ratio
n (m
M)
0 5 10 15 20 25 30Time (hr)
Glu
tath
ione
Con
cent
ratio
n (m
M)
(b) Rat Liver GSH
0
2
4
6
8
10
12
(c) Rat Olfactory
0
0.5
1
1.5
2
2.5
3
3.5
0 6 12 18 24Hour of experiment
GS
H C
once
ntra
tion
(mM
)
Olfactory 25
Olfactory 100
Dorsal olfactory 25 ppm sim
Ethmoid olfactory 25 ppm sim
Dorsal olfactory 100 ppmmodelEthmoid olfactory 100 ppm sim
GS
H C
once
ntra
tion
(mM
)
(d) Rat Respiratory
0
0.5
1
1.5
2
2.5
0 5 10 15 20 25 30Hour of experiment
25 ppm
100 ppm
dorsal resp 25 ppm sim
ventral, anterior resp 25 ppmsimVentral, posterior resp 25 ppmsimdorsal resp 100 ppm model
ventral anterior resp 100 ppm
Ventral posterior resp 100 ppmmodel
Inha
latio
n T
oxic
olog
y D
ownl
oade
d fr
om in
form
ahea
lthca
re.c
om b
y C
DC
Inf
orm
atio
n C
ente
r on
07/
10/1
2Fo
r pe
rson
al u
se o
nly.

574 L. M. Sweeney et al.
exposure to the NOAEL identified by Kirkpatrick (2002) (21 ppm × 6 hr = 126 ppm-hr). An endpoint of 50% GSH depletion in the dorsal olfactory epithelium for a constant exposure was selected as a potential point of departure for risk assessment
that protects against nasal effects observed in the rat based on: (1) MeI-specific data indicating that GSH depletion must exceed approximately 50% for acute exposure to produce nasal effects, (2) the published literature indicating that
Table 9. Increase in mean S-methyl cysteine concentration in globin from rats exposed to MeI.
Exposure concentration (ppm)
Daily adduct increase (nmol/g globin)a Arterial AUC (h-mg/L)
Venous AUC (h-mg/L)
Volume weighted blood AUC (h-mg/L)
Apparent adduct formation rate (adduct increase/AUC)
25 20.2 5.1 3.4 3.8 5.3
100 92.1 20.8 14.3 16.0 5.8aHimmelstein et al. (2009).
Figure 10. (a–f ) Nasal uptake of anesthetized, restrained male Sprague Dawley rats. Symbols: experimental data (Thrall et al., 2009b). Lines: simulations using measured body weights (0.31–0.38 kg), tidal volumes, and respiration rates.
(a)
0100200300400500600700800900
1,0001,100
0 5 10 15 20 25 30 35 40 45Time (min)
0 5 10 15 20 25 30 35 40 45Time (min) 0 5 10 15 20 25 30 35 40 45
Time (min)
0 5 10 15 20 25 30 35 40 45Time (min)
Nas
opha
ryng
eal C
onc.
(ppb
)N
asop
hary
ngea
l Con
c. (p
pb)
Nas
opha
ryng
eal C
onc.
(ppb
)N
asop
hary
ngea
l Con
c. (p
pb)
(b)
0
100
200
300
400
500
600
700
0 5 10 15 20 25 30 35 40Time (min)
(c)
0
100
200
300
400
500
600 (d)
0
100
200
300
400
500
600
(e) Note: animal had very shallow breathing
0
100
200
300
400
500
600
700
0 5 10 15 20 25 30 35 40 45Time (min)
Con
c. (p
pb)
Con
c. (p
pb)
(f) Note: animal had very shallow breathing
0
100
200
300
400
500
600
700
800
900
Inha
latio
n T
oxic
olog
y D
ownl
oade
d fr
om in
form
ahea
lthca
re.c
om b
y C
DC
Inf
orm
atio
n C
ente
r on
07/
10/1
2Fo
r pe
rson
al u
se o
nly.

MeI PBPK model 575
sustained GSH depletion below 50% of control is necessary (but not sufficient) for GSH depletion-related extrahepatic toxicity (see Appendix 1). The adult human model indicates that depletion of GSH in the dorsal olfactory epithelium to 50% of control would be achieved after 24 hours of expo-sure to 72 ppm MeI. For workers exposed for 8 hrs, 50% GSH depletion would be achieved by the end of the shift at an exposure concentration of 110 ppm. A higher HEC was determined for this 8-hr scenario than for the 24-hr scenario because more than 8 hrs of exposure would be required to reach steady-state with respect to nasal GSH levels.
There is potential for variable exposure based on antici-pated use (e.g. initially higher concentrations shortly after application), and maximal GSH depletion is sensitive to the “concentration” component, even when concentration × duration is held constant (data not shown). HECs with an alternative GSH depletion target of 25% (with constant exposure) were also developed to evaluate this potential exposure. When the target is 25% depletion at 24 hrs, the 24-hr adult HEC is 36 ppm and the 8-hr (worker) HEC is 50 ppm; these HECs are approximately one-half of the values that were determined for the scenario with 50% depletion in the whole tissue. For a 3-month-old child, the 24-hr HEC for 25% depletion of olfactory GSH is 8.2 ppm under these conditions. However, while children’s nasal tissue thickness has been found to be less than adults’ (Inagi, 1992), the cor-responding blood flow to this tissue (as a percentage of car-diac output) was not decreased in the current simulations, resulting in a greater simulated MeI delivery to the lamina propria (blood exchange region), on the basis of mass of chemical per volume of tissue per unit of time. Nasal tissue volume and blood flow are likely to be correlated, but due to the lack of data on nasal blood flow in children, the more conservative assumption regarding blood flow was retained for these simulations.
Alternatively, others have recommended that GSH deple-tion in only the epithelial layer of the olfactory tissue be con-sidered in deriving a toxicity reference value for nasal effects of MeI (Barton, 2007). If only the epithelial layer is consid-ered, the HECs for 50% depletion of GSH are 4.5 ppm for an adult bystander, 4.6 for a 3-month-old infant bystander, and 5.8 for a worker. In the epithelial portion of the tissue, the MeI levels (and, therefore, extent of GSH depletion) are largely insensitive to the tissue volume and perfusion because the tissue MeI levels are driven by achieving equilibrium with inhaled air; thus, GSH depletion in the epithelial layer was predicted to be similar in adults and children exposed to a given concentration of MeI for the same duration.
NeurotoxicityAcute neurotoxicity was observed in rats after a single, 6-hr exposure to 93 ppm MeI with a corresponding NOAEL of 27 ppm (Schaefer, 2002). Peak concentration of MeI in the brain was used for interspecies extrapolation, yielding an HEC of 10 ppm. Because brain concentration of MeI approaches steady state within a few hours, this HEC is applicable to both 24-hr and 8-hr (worker) exposures.
The absence of glutathione S-transferase theta 1 (GSTT-1) activity has been identified as a toxicokinetically significant polymorphism. People who are lacking this enzyme would have lower susceptibility to the potential nasal and develop-mental toxicity of MeI, but would be at greater risk for acute neurotoxicity, because reduced metabolism of MeI could result in higher concentrations reaching the brain. This pos-sibility has been explored via PBPK modeling. Chamberlain et al. (1998b) assessed the contribution of different GST iso-zymes to the metabolism of MeI by co-incubation of rat nasal or liver homogenate, GSH, and MeI with various GST sub-strates. The known GSTT-1 substrate cumene hydroperoxide completely inhibited the formation of methylglutathione by nasal homogenate; in liver homogenate, co-incubation with this substrate reduced methylglutathione formation by 85%. Co-incubation of liver homogenate, GSH, and MeI with the alpha GST substrate androstenedione resulted in 28% inhi-bition of methylglutathione formation. Based on these data, a reasonable estimation for MeI–GSH conjugation activity in a GSTT-1 null human would be no extrahepatic metabolism and liver metabolism which is 15% of control. The acute neurotoxicity HEC for a GSTT-1 individual was calculated to be 7 ppm, a factor of 1.4 lower than derived for a person with full GST activity.
Developmental toxicityFetal loss has been demonstrated after exposure of rabbit does to 20 ppm MeI for 6 hours/day on gestation days 6–28 (Nemec et al., 2009). To develop the HECs, it was assumed that toxicity in rabbits might occur from 1 day of exposure to 20 ppm, but not 10 ppm MeI.
In the course of these simulations, it became clear that, especially at lower MeI exposure concentrations, a substan-tial amount of iodide remains in the fetal plasma from one exposure day to the next. As a result, the 1-day fetal iodide AUC on the first day of exposure is much lower than the 1-day fetal iodide AUC on subsequent days (Figure 11). The most appropriate HEC would be derived from a fetal rabbit plasma iodide AUC relevant to the window of susceptibility
0
5,000,000
10,000,000
15,000,000
20,000,000
25,000,000
0 50 100 150 200 250 300 350 400Time (hr)
Seru
m io
dide
(ng/
L)
Figure 11. Simulated serum iodide concentrations in the fetuses of pregnant does repeatedly exposed to 10 ppm (upper line) or 2 ppm (lower line) MeI 6 hrs/day.
Inha
latio
n T
oxic
olog
y D
ownl
oade
d fr
om in
form
ahea
lthca
re.c
om b
y C
DC
Inf
orm
atio
n C
ente
r on
07/
10/1
2Fo
r pe
rson
al u
se o
nly.

576 L. M. Sweeney et al.
for the observed fetal losses, i.e. GD 23–26 (Nemec et al., 2009). The relevant single day of exposure to produce the critical effect during the study is one that was preceded by 17 or more days of MeI exposure (Nemec et al., 2009). Therefore, the most appropriate 1-day AUC is not the 1-day AUC for the first day of exposure (GD 6), but rather an AUC that reflects the likely iodide profile that occurred during the window of susceptibility.
When prior exposure of the rabbit to 10 ppm MeI to achieve steady state is taken into account in the model, the calculated bystander HEC is 26 ppm for this endpoint. The worker (8 hr/day) HEC is calculated as 60 ppm. A more conservative approach to this endpoint (Barton, 2007) is to assume that developmental toxicity is related to fetal rab-bit iodide levels on the first day of exposure (rather than steady-state levels). Using this assumption, HECs of 7.4 ppm and 23 ppm would be derived for bystanders and workers, respectively.
Sensitivity and variability analysesNasal toxicityA sensitivity analysis for human fractional olfactory GSH decline was conducted for 24 hours of exposure, assuming a concentration of 0.27 ppm, the infant HEC of 8.2 divided by a total UF of 30. The model parameters that had normalized sensitivity coefficients (SCs) greater than 0.1 or less than –0.1 are reported in Table 10.
NeurotoxicityA sensitivity analysis for peak concentration of MeI in the human brain was conducted using a simplified version of the model without the “nose” section, due to the large com-putational burden of running the cyclic breathing model, and was conducted at an exposure concentration of 3 ppm. The model parameters that had normalized sensitivity coef-ficients (SCs) greater than 0.1 or less than −0.1 are reported in Table 10. The variability analysis was conducted using a Monte Carlo approach (Sweeney et al., 2001) and utilized the full PBPK model, including the nose section. Because the human brain concentration achieves 90% of steady state within 3 hours, simulations were limited to this exposure time. Parameter distributions were generated in Crystal Ball (Decisioneering, Inc.) for tidal volume (TVOL) and res-piratory rate (RPMIN) (in place of QAC from the simplified model), blood:air partition coefficient (PB), brain:air parti-tion coefficient (PBrA), fractional blood flow to skin (QDC), fractional blood flow to the stomach (QGC), and fractional blood flow to the liver (QLC). Coefficients of variation for the parameters are reported in Table 10. Coefficients of vari-ation for PB and PBrA were determined from partition coef-ficient estimates derived for each replicate vial. Values were exported to create a command file for ACSL simulations. The baseline value for peak brain concentration of MeI (without Monte Carlo simulation) was 0.09278 mg/L. Based on 1455 successful simulations, the mean was 0.09499, median 0.092355, and 95th percentile value 0.147787 mg/L. The 95th percentile value/median value = 1.6 is therefore
recommended as the intraspecies (human) pharmacoki-netic uncertainty factor (UF
H,PK) for the acute neurotoxicity
endpoint. This value is also sufficient to protect GSTT-1 null individuals (1.4-fold lower HEC) as noted above.
Developmental toxicityA sensitivity analysis of the steady-state daily plasma iodide AUC of the rabbit fetus is of interest due to the use of this dose metric in determining the developmental HEC. In addi-tion, the same analysis was conducted for maternal plasma AUC. By considering the sensitivity analyses of both the doe and the fetus, those parameters that affect predictions of the fetus, but not the doe, can be identified. The results are summarized below (Table 11). Maternal iodide AUC was most strongly influenced by the parameters determining the systemic delivery of MeI (concentration, ventilation rate, and blood:air partition coefficient) and the urinary elimina-tion of iodide. Some, but lower, sensitivity was observed for parameters defining the delivery of systemic MeI to the liver (blood flow rates to the portal organs, i.e. the stomach and intestines), where it is metabolized to iodide. These param-eters had approximately equal impact on maternal and fetal iodide levels. Fetal iodide levels were also sensitive to parameters defining placental iodide uptake and transport, and the number of fetuses. The influence of fetal weight on the fetal plasma AUC was very small.
Discussion of model confidence
In the absence of information supporting the contrary, the default assumption in noncancer risk assessment is that lab-oratory animals and humans are similar with respect to the toxicokinetics and toxicodynamics of a chemical. This valid-ity of the default assumption is uncertain, which obligates the use of uncertainty factors for toxicokinetics/dynamics (e.g. 100 comprising 10 for interspecies, and 10 for intraspe-cies variability) to ensure a degree of health protectiveness in risk assessment. Improvements in our understanding of chemical kinetics in laboratory animals, even when corre-sponding information is not available for humans, does not invalidate the default assumption. Rather, any improvement in our understanding of chemical kinetics in laboratory ani-mals, as occurs with the development of a validated PBPK model in animals, should be extended to predictions made for human exposures. In this way, the crude default assump-tion in risk assessment (e.g. animal external dose = human external dose) becomes more refined and specific (e.g. rat tissue partition = human tissue partition) so that the risk assessment also becomes more refined (e.g. validated ani-mal internal dose = preliminary human internal dose). More importantly, as this information is collected, uncertainty in the risk assessment is reduced, which in turn should reflect in a reduction in the default uncertainty factor of 100.
In the absence of human data to validate the PBPK model predictions, confidence in the predictions is, by necessity, lower than it would be if these data were available to con-duct a robust risk assessment (e.g. validated animal internal
Inha
latio
n T
oxic
olog
y D
ownl
oade
d fr
om in
form
ahea
lthca
re.c
om b
y C
DC
Inf
orm
atio
n C
ente
r on
07/
10/1
2Fo
r pe
rson
al u
se o
nly.

MeI PBPK model 577
Table 10. Sensitivity coefficients (SC) and coefficients of variation (CV) for parameters included in variability analyses.
Parameter
Sensitivity coefficient for dose metric
CV Source of CV
Maximum fractional
olfactory GSH decline
Peak brain MeI
Alveolar ventilation rate (QAC) — 0.14 0.15 Allen et al. (1996)
Tidal Volume 0.54 — NA NA
Respiratory frequency 0.51 — NA NA
Cardiac output/alveolar ventilation ratio (QCADJ) — –0.70 0.15 Allen et al. (1996)
Blood:air partition coefficient (PB) — –0.84 0.12 Gannon et al. (2004)
Brain:air partition coefficient (PBrA) — 1 0.21 Gannon et al. (2004)
Mucus:air partition coefficient (PMuA) 0.45 — 0.038 NA
Olfactory epithelium:air partition coefficient 0.06 — NA NA
Fractional blood flow to liver (QLC) –0.25 –0.42 0.3 Allen et al. (1996)
Fractional blood flow to skin (QDC) –0.09 –0.14 0.3 Allen et al. (1996)
Fractional blood flow to stomach (QGC) –0.07 –0.13 0.3 Allen et al. (1996)
Fractional blood flow to nose (QNC) 0.46 — 0.3 Allen et al. (1996)
Affinity constant for iodomethane–GSH conjugation in olfactory epithelium (KMOE)
–0.28 — NA NA
Maximum capacity for iodomethane–GSH conjugation in olfactory epithelium (VMAXOEC)
0.28 — NA NA
Initial GSH concentration in olfactory epithelium (GSHOE0) –0.99 — NA NA
Turnover rate of GSH in olfactory epithelium (KDGSHOE) –0.94 — NA NA
Width of olfactory mucus (WOM) –0.12 — NA NA
Width of olfactory blood exchange later (WOX) –0.82 — NA NA
Surface area of olfactory epithelium (SAOLLF1) –0.46 — NA NA
Fraction of olfactory epithelium in anterior region (OL1) 0.46 — NA NA
Diffusion constant for iodomethane in olfactory tissue (KOLF) 0.13 — NA NA
Diffusion constant for iodomethane in mucus (KMUC) 0.10 — NA NA
Fraction of nasal blood flow to olfactory epithelium (FOLFQ) 0.46 — NA NA
Exposure concentration (CONC) 1 1 0 NA
Note. All sensitivity analyses were for a 24-hour exposure. Exposure concentrations used in these analyses were 0.27 ppm (olfactory GSH, 8.2 ppm HEC for nasal endpoint divided by a UF of 30), 10 ppm (brain MeI, HEC for transient neurotoxicity).
Table 11. Results of a sensitivity analysis on model parameters from PBPK modeling of iodomethane-exposed rabbits at steady state (assumed Nemec et al., 2009 study hours 312–336). The dose metric was the 1-day plasma iodide AUC.
Parametera
Normalized sensitivity coefficient, 10 ppm exposure
Normalized sensitivity coefficient, 2 ppm exposure
Maternal Fetal Maternal Fetal
Alveolar ventilation rate (QAC) 0.92 0.85 0.90 0.90
Perfusion/ventilation ratio (QCADJ) 0.16 0.14 0.11 0.13
Blood:air partition coefficient (PB) 0.25 0.25 0.23 0.24
Blood flow to the stomach (QGC) 0.07 0.08 0.09 <0.05
Blood flow to the intestines (QIC) 0.16 0.14 0.18 0.13
Blood flow to the kidneys (QKC) <0.05 <0.05 −0.09 <0.05
Fractional volume of the fetus (percent of maternal weight) (VFETC) <0.05 0.05 <0.05 <0.05
Number of fetuses (NFET) <0.05 −0.99 <0.05 −0.99
Placenta:air partition coefficient for iodide (PPL-I) <0.05 1.01 <0.05 0.99
Permeability-area product for iodide in the placenta (PAPLC_I) <0.05 −0.93 <0.05 −0.93
Affinity constant for placental uptake of iodide (KM_PLI) <0.05 −0.85 <0.05 −0.91
Maximal rate of iodide uptake by the placenta (VMAXC_PLI) <0.05 0.93 <0.05 0.93
Urinary excretion rate of iodide (CLUC_I) −0.89 −0.82 −0.94 −0.86
Rate of transfer from the placenta to the fetus (CLTRANS1C) <0.05 1.01 <0.05 0.99
Rate of transfer from the fetus to the placenta (CLTRANS2C) <0.05 −0.99 <0.05 0.99
Iodomethane concentration (CONC) 1.01 0.99 1.01 1.00aNormalized sensitivity coefficients of parameters not listed in this table were <0.05 for both dose metrics.
Inha
latio
n T
oxic
olog
y D
ownl
oade
d fr
om in
form
ahea
lthca
re.c
om b
y C
DC
Inf
orm
atio
n C
ente
r on
07/
10/1
2Fo
r pe
rson
al u
se o
nly.
578 L. M. Sweeney et al.
dose = validated human internal dose). However, even with-out human validation data, confidence in the PBPK model predictions can be considerably higher than the crude default assumption on the sole basis that we have a better under-standing of the chemical’s behavior in the test species. PBPK models have been applied in risk assessments without the benefit of human validation data. For example, the human PBPK model developed for formaldehyde is considered to be very a robust model, and yet data are not available for human validation (Conolly et al., 2004). In summary, human valida-tion data should be viewed as a goal, rather than a prerequi-site, for PBPK model application in risk assessment.
The confidence in the PBPK model predictions for MeI in humans may differ from one internal dose measure to another, which in turn is dependent upon the endpoint and its mode of action (Kirman et al., 2009). Confidence in the PBPK model predictions for each of the key endpoints iden-tified for MeI are summarized below.
• Reproductive/developmental effects in rabbits. Based upon a consideration of the mode of action, the repro-ductive/developmental effects of MeI in rabbits are best explained by the impact of excess iodide on the fetal thyroid. The iodide component of the MeI PBPK comes from a validated model for perchlorate in humans (Clewell et al., 2001; Merrill et al., 2003, 2005) and includes kinetics data for iodide in humans, including during pregnancy for both maternal and fetal tissues (including that for the target tissue, thyroid) (Aboul-Khair et al., 1966; Dydek & Blue, 1988; Nurnberger & Lipscomb, 1952). The maternal human (and other adult) data were more numerous than the fetal data. For this reason, the iodide portion of the MeI PBPK model should be considered validated for predicting human internal doses. Accordingly, confidence in the PBPK model predictions for the reproductive/development effects of iodide in rabbits is considered moderate using fetal iodide and high using maternal iodide, and the uncertainty factors used in the risk assessment should be small in comparison to the default value of 100.
• Neurological effects in rats. Based upon a consideration of the mode of action, the neurological effects of MeI in rats are best explained by the impact of the parent chemical on the central nervous system. The compo-nent of the human PBPK model for the parent chemical has not been validated, but it is based upon measured values for partition coefficient (in human blood) and metabolism in quantitatively important human tissues (i.e. liver and kidney). The metabolic pathways for MeI are well understood and have been quantified in PBPK models in animals and humans for a number of halo-genated solvents (methylene chloride, trichloroethyl-ene, tetrachloroethylene). In addition, a human PBPK model has been developed for a structurally similar chemical, methyl chloride (Jonsson et al., 2001). The results of the Jonsson et al. (2001) analysis indicated that the tissue partition coefficients determined in rats
were consistent with the values estimated for humans via Markov chain Monte Carlo evaluation of human kinetics data. Confidence in the PBPK model predic-tions for the neurological effects of MeI in rats is con-sidered medium-to-high, and the uncertainty factors used in the risk assessment should be smaller than the default value of 100.
• Nasal effects in rats. Based upon a consideration of the mode of action, the nasal effects of MeI in rats are best explained by the impact of GSH depletion in nasal tis-sue. The component of the human PBPK model for the GSH depletion in the nose has not been validated, but it is based upon measured values for the nasal tissue partition coefficient (rather than a different tissue) and the human blood:air partition coefficient. Nasal models have been developed for a number of chemicals (ethyl acrylate, vinyl acetate, methyl methacrylate, acrylic acid), which include the impact on local GSH levels, for the purposes of extrapolating from laboratory animals to humans (Andersen et al., 2000, 2002; Frederick et al., 2001, 2002; Sweeney et al., 2004). Confidence in the PBPK model predictions for the nasal effects of MeI in rats is considered medium, and the uncertainty factors used in the risk assessment should be smaller than the default value of 100. However, GSH depletion results largely from its metabolism by GSTT-1, and the activity of this enzyme is generally high in the respiratory tract of rodents (Mainwaring et al., 1996; Sherratt et al., 1997), though qualitatively does not appear to be important in the human respiratory tract (Sherratt et al., 1997) or in human nasal tissue (Aceto et al., 1989; Krishna et al. 1995). The activity of human vs. rat GST toward MeI is expected to be 13-fold less, as indicated by the difference in specific activity of purified wild type hGSTT-1 and a mutant form with Trp replaced by Arg at residue 234 (analogous to the rodent form of this enzyme) toward MeI (Shokeer et al., 2005). Considering that human nasal GST metabolism is likely to be overestimated by the current model parameter values, confidence is high that the PBPK model predictions are health protective based upon the assumption that rat and human nasal GST activity is equivalent.
Conclusions
PBPK models have been developed that successfully repro-duce the observed serum iodide, tissue GSH, and chamber and nasopharyngeal MeI concentrations for rats and rabbits exposed to toxicologically relevant concentrations of MeI. As is typical in PBPK modeling, some parameters had to be adjusted from what would have been expected based on information derived from other studies and the literature. It is reasonable to consider the impact that parallel adjust-ments that were, or were not, made to the human model would have on the calculated HECs.
In the rat and rabbit model development, adjustments were made that required ventilation to be decreased (rat
Inha
latio
n T
oxic
olog
y D
ownl
oade
d fr
om in
form
ahea
lthca
re.c
om b
y C
DC
Inf
orm
atio
n C
ente
r on
07/
10/1
2Fo
r pe
rson
al u
se o
nly.

MeI PBPK model 579
GSH/iodide, rabbit nasal uptake, and closed chamber) or increased (rabbit iodide). The predicted human peak brain concentration was slightly sensitive to the ventilation rate, but olfactory GSH depletion was not. Because apparent in vivo kidney metabolism in the rat was substantially less than predicted from in vitro data, the human rate was also adjusted downward. Neither peak brain concentration nor olfactory GSH was sensitive to the maximal rate of metabo-lism in the kidney. However, if kidney metabolism was increased dramatically, there would be more MeI cleared from the blood, so arterial concentrations of MeI would be somewhat lower, supplying less MeI to the brain and nasal tissues. Thus, the adjustment to kidney metabolism in the human has a conservative effect on HEC calculation, increasing concentrations in the brain and supplying more MeI to the nose to be conjugated with GSH. It is unclear how a change in kidney metabolism of MeI would affect systemic iodide kinetics because of “first pass” urinary clearance of any iodide generated in the kidney.
The PBPK models developed for MeI have been used to reduce uncertainties in the risk assessment extrapolations (e.g. interspecies, dose dependence, exposure scenario) using internal measures of target tissue dose linked to the likely mode of action for the toxic effect in question. PBPK model-derived human equivalent concentrations based on internal dosimetry are recommended for use in risk assessment as 24-hour exposure equivalents to animal study NOAELs.
Appendix 1. Relationship between the extent of extrahepatic GSH depletion and toxicity
Nasal GSH concentrations corresponding to a 1-hr, 100-ppm exposure to MeI (a no-effect exposure, per Reed et al., 1995) have been reported by Chamberlain et al. (1998a) for Wistar rats and Himmelstein et al. (2009) for Fischer 344 rats. Chamberlain et al. (1998a) measured olfactory GSH levels of 45% of control in Wistar rats and Himmelstein et al. measured olfactory GSH levels of 52% of control after 1 hour of exposure to 100 ppm MeI. Similarly, simulation of the no-effect exposure of 21 ppm for 6 hrs/day (Kirkpatrick, 2002) yields an estimated dorsal olfactory epithelium GSH deple-tion to 61% of control.
Other researchers have presented data supporting the perspective that, in order for GSH-related toxicity to be produced, GSH concentrations in extrahepatic tissues (including nasal tissue) must (1) drop below 50% of control and (2) remain depleted. For example, Biaglow et al. (1986) state, “Apparently, spontaneous peroxidative damage to normal tissue such as liver can occur with GSH depletion to 10–20% of control and with other normal tissue when GSH reaches 50% of control.” Frederick et al. (1992) note that “glutathione concentration varies with circadian rhythm in some tissues (i.e. reaching a minimum of approximately 50% of the nominal steady state value), and effects on tis-sue glutathione concentration within this range would be assumed to be associated with negligible toxicity.” Similarly, Plopper et al. (2001) found that “at least 50% of
the intracellular GSH pool must be lost before [lung] cell organelle changes are apparent” and “unless more than half of the Clara cells in a local epithelial population have lost 75% or more of their initial GSH concentration, the toxic cellular changes appear to be reversible.” Uhlig and Wendel (1992) suggested that, for all tissues, GSH stores need to be depleted to 30% of control levels before toxicity is observed in humans.
It should be noted that GSH depletion alone does not appear to be sufficient to produce toxicity. The contribu-tion of increasing duration (sustained GSH depletion) to GSH-related toxicity has also been noted by researchers. Frederick et al. (1992) used GSH depletion AUC to dem-onstrate a relationship between ethyl acrylate-induced GSH depletion and forestomach lesions. Lee et al. (2005) conclude that “continuous, severe perturbation of GSH in RNM [respiratory nasal mucosa] following repeated high PO [propylene oxide] exposures may lead to inflammatory lesions and cell proliferation.”
Acknowledgments
Financial support was provided by Arysta LifeScience Corporation. We are grateful to Drs. Rick Corley, Jim Morris, and Torka Poet (PNNL), Drs. Matt Himmelstein, Ray Kemper, and Mike DeLorme (DuPont-Haskell Laboratory), Ed Kaiser (Exygen) and Dr. Eddie Sloter (WIL Laboratories) for provid-ing preliminary data to expedite modeling. We also thank Elaine Merrill (Geo-Centers), who provided the perchlorate/iodide model code. We appreciate valuable discussions with Drs. Paul Schlosser and Hugh Barton (US EPA) regarding model parameter values and application of the model in risk assessment.
Declaration of interest: The authors report no conflicts of interest. The authors alone are responsible for the content and writing of the paper.
ReferencesAboul-Khair, S.A., Buchanan, T.J., Crooks, J., and Turnbull, A.C. 1966.
Structural and functional development of the human foetal thyroid. Clin. Sci. 31:415–424.
Aceto, A., Di Ilio, C., Angelucci, S., Longo, V., Gervasi, P.G., and Federici, G. 1989. Glutathione transferases in human nasal mucosa. Arch. Toxicol. 63:427–431.
Allen, B.C., Covington, T.R., and Clewell, H.J. 1996. Investigation of the impact of pharmacokinetic variability and uncertainty on risks predicted with a pharmacokinetic model for chloroform. Toxicology 111:289–303.
Andersen, M.E., Green, T., Frederick, C.B., and Bogdanffy, M.S. 2002. Physiologically based pharmacokinetic (PBPK) models for nasal tissue dosimetry of organic esters: assessing the state-of-knowledge and risk assessment applications with methyl methacrylate and vinyl acetate. Regul. Toxicol. Pharmacol. 36:234–245.
Andersen, M., Sarangapani, R., Gentry, R., Clewell, H., Covington, T., and Frederick, C.B. 2000. Application of a hybrid CFD-PBPK nasal dosimetry model in an inhalation risk assessment: an example with acrylic acid. Toxicol. Sci. 57:312–325.
Arfsten, D., Johnson, E., Thitoff, A., Jung, A., Wilfong, E., Lohrke, S., Bausman, T., Eggers, J., and Bobb, A. 2004. Impact of 30-day oral dosing with N-acetyl-L-cysteine on Sprague-Dawley rat physiology. Int. J. Toxicol. 23:239–247.
Inha
latio
n T
oxic
olog
y D
ownl
oade
d fr
om in
form
ahea
lthca
re.c
om b
y C
DC
Inf
orm
atio
n C
ente
r on
07/
10/1
2Fo
r pe
rson
al u
se o
nly.
580 L. M. Sweeney et al.
Barton, H. 2007. Iodomethane: review of methyl iodide PBPK/PD model. DP barcode D312630; PC code 000011, TXR # 0054604. Memorandum to Elizabeth Mendez dated June 14, 2007. US EPA, Office of Research and Development, Research Triangle Park, NC.
Bende, M. 1983. Blood flow with 133Xe in human nasal mucosa in relation to age, sex and body position. Acta Otolaryngol. 96:175–179.
Biaglow, J.E., Varnes, M.E., Roizen-Towle, L., Clark, E.P., Epp, E.R., Astor, M.B., and Hall, E.J. 1986. Biochemistry of reduction of nitro heterocycles. Biochem. Pharmacol. 35:77–90.
Bocian-Sobkowska, J., Malendowicz, L.K., and Wozniak, W. 1992. Morphometric studies on the development of human thyroid gland in early fetal life. Histol. Histopathol. 7:415–420.
Boda, D., Belay, M., Eck, E., and Csernay, L. 1971. Blood distribution of the organs examined by 86 Rb uptake under intrauterine conditions and in the newborn, in normal and hypoxic rabbits. Biol. Neonate 18:71–77.
Brown, R.P., Delp, M.D., Lindstedt, S.L., Rhomberg, L.R., and Beliles, R.P. 1997. Physiological parameter values for physiologically based pharmacokinetic models. Toxicol. Ind. Health 13:407–484.
Brownfield, G.L., Gilbert, R.D., and Power, G.G. 1978. Maternal placental vascular compliance in rabbits. Am. J. Physiol. 234:H289–H292.
Caccuri, A.M., Antonini, G., Nicotra, M., Battistoni, A., Lo Bello, M., Board, P.G., Parker, M.W., Ricci, G. 1997. Catalytic mechanism and role of hydroxyl residues in the active site of theta class glutathione S-transferases. Investigation of Ser-9 and Tyr-113 in a glutathione S-transferase from the Australian sheep blowfly, Lucilia cuprina. J. Biol. Chem. 272:29681–29686.
Chamberlain, M.P., Lock, E.A., Gaskell, B.A., and Reed, C.J. 1998a. The role of glutathione S-transferase and cytochrome P450-dependent metabolism in the olfactory toxicity of methyl iodide in the rat. Arch. Toxicol. 72:420–428.
Chamberlain, M.P., Lock, E.A., and Reed, C.J. 1998b. Investigations of the pathways of toxicity of methyl iodide in the rat nasal cavity. Toxicology 129:169–181.
Clewell, R.A., Merrill, E.A., and Robinson, P.J. 2001. The use of physiologically based models to integrate diverse data sets and reduce uncertainty in the prediction of perchlorate and iodide kinetics across life stages and species. Toxicol. Ind. Health. 17:210–222.
Clewell, R.A., Merrill, E.A., Yu, K.O., Mahle, D.A., Sterner, T.R., Fisher, J.W., and Gearhart, J.M. 2003a. Predicting neonatal perchlorate dose and inhibition of iodide uptake in the rat during lactation using physiologically-based pharmacokinetic modeling. Toxicol. Sci. 74:416–436.
Clewell, R.A., Merrill, E.A., Yu, K.O., Mahle, D.A., Sterner, T.R., Mattie, D.R., Robinson, P.J., Fisher, J.W., and Gearhart, J.M. 2003b. Predicting fetal perchlorate dose and inhibition of iodide kinetics during gestation: a physiologically-based pharmacokinetic analysis of perchlorate and iodide kinetics in the rat. Toxicol. Sci. 73:235–255.
Conolly, R.B., Kimbell, J.S., Janszen, D., Schlosser, P.M., Kalisak, D., Preston, J., and Miller, F.J. 2004. Human respiratory tract cancer risks of inhaled formaldehyde: dose-response predictions derived from biologically-motivated computational modeling of a combined rodent and human dataset. Toxicol. Sci. 82:279–296.
Corley, R.A., Minard, K.R., Trease, L.L., Trease, H.E., Harkema, J.R., Kimbell, J.S., Gargas, M.L., and Kinzell, J.H. 2009. Magnetic resonance imaging and computational fluid dynamics (CFD) simulations of rabbit nasal airflows for the development of hybrid CFD/PBPK models. Inhal. Toxicol. Epub ahead of print. DOI: 10.1080/08958370802598005.
DeLorme, M.P., Himmelstein, M.W., Kemper, R.A., Kegelman, T.A., Gargas, M.L., and Kinzell, J.H. 2009. Evaluation of respiratory parameters in rats and rabbits exposed to methyl iodide. Inhal. Toxicol. Epub ahead of print. DOI: 10.1080/08958370802596926.
Delp, M.D., Evans, M.V., and Duan, C. 1998. Effects of aging on cardiac output, regional blood flow and body composition in Fischer-344 rats. J. Appl. Physiol. 85:1813–22.
Delp, M.D., Manning, R.O., Bruckner, J.V., and Armstrong, R.B. 1991. Distribution of cardiac output during diurnal changes of activity in rats. Am. J. Physiol. 261:H1487–H1493.
Drettner, B., and Aust, R. 1974. Plethysmographic studies of the blood flow in the mucosa of the human maxillary sinus. Acta Otolaryngol. 78:259–263.
Duck, F.A. 1990. Physical properties of tissue. San Diego: Academic Press.Dydek, G.J., and Blue, P.W. 1988. Human breast milk excretion of iodine-131
following diagnostic and therapeutic administration to a lactating patient with Graves’ disease. J. Nucl. Med. 29:407–410.
Frederick, C.B., Bush, M.L., Lomax, L.G., Black, K.A., Finch, L., Kimbell, J.S., Morgan, K.T., Subramaniam, R.P., Morris, J.B., and Ultman, J.S.
1998. Application of a hybrid computational fluid dynamics and physiologically based inhalation model for interspecies dosimetry extrapolation of acidic vapors in the upper airways. Toxicol. Appl. Pharmacol. 152:211–231.
Frederick, C.B., Gentry, P.R., Bush, M.L., Lomax, L.G., Black, K.A., Finch, L., Kimbell, J.S., Morgan, K.T., Subramaniam, R.P., Morris, J.B., and Ultman, J.S. 2001. A hybrid computational fluid dynamics and physiologically based pharmacokinetic model for comparison of predicted tissue concentrations of acrylic acid and other vapors in the rat and human nasal cavities following inhalation exposure. Inhal. Toxicol. 13:359–376.
Frederick, C.B., Lomax, L.G., Black, K.A., Finch, L., Scribner, H.E., Kimbell, J.S., Morgan, K.T., Subramaniam, R.P., and Morris, J.B. 2002. Use of a hybrid computational fluid dynamics and physiologically based inhalation model for interspecies dosimetry comparisons of ester vapors. Toxicol. Appl. Pharmacol. 183:23–40.
Frederick, C.B., Potter, D.W., Chang-Mateu, M.I., and Andersen, M.E. 1992. A physiologically based pharmacokinetic and pharmacodynamic model to describe the oral dosing of rats with ethyl acrylate and its implications for risk assessment. Toxicol. Appl. Pharmacol. 114:246–260.
Fujikake, N., and Ballatori, N. 2002. Glutathione secretion into rat milk and its subsequent gamma-glutamyltranspeptidase-mediated catabolism. Biol. Neonate 82:134–138.
Gannon, S.A., et al. 2005. Iodomethane: in vitro partition coefficients in rat and rabbit tissues and human blood. Unpublished report, DuPont Haskell Laboratory, Newark, Delaware.
Gargas, M.L., Andersen, M.E., and Clewell, H.J., 3rd. 1986. A physiologically based simulation approach for determining metabolic constants from gas uptake data. Toxicol. Appl. Pharmacol. 86:341–352.
Gargas, M.L., Clewell, H.J., III, and Andersen, M.E. 1990. Gas uptake inhalation techniques and the rates of metabolism of chloromethanes, chloroethanes, and chloroethylenes in the rat. Inhal. Toxicol. 2:295–319.
Gargas, M.L., Tyler, T.R., Sweeney, L.M., Corley, R.A., Weitz, K.K., Mast, T.J., Paustenbach, D.J., and Hays, S.M. 2000. A toxicokinetic study of inhaled ethylene glycol monomethyl ether (2-ME) and validation of a physiologically based pharmacokinetic model for the pregnant rat and human. Toxicol. Appl. Pharmacol. 165:53–62.
Gentry, P.R., Covington, T.R., Andersen, M.E., and Clewell, H.J., III. 2002. Application of a physiologically based pharmacokinetic model for isopropanol in the derivation of a reference dose and reference concentration. Regul. Toxicol. Pharmacol. 36:51–68.
Green, T., Lee, R., Toghill, A., Meadowcroft, S., Lund, V., and Foster, J. 2001. The toxicity of styrene to the nasal epithelium of mice and rats: studies on the mode of action and relevance to humans. Chem. Biol. Interact. 137:185–202.
Hanwell, A., and Linzell, J.L. 1973. The time course of cardiovascular changes in lactation in the rat. J. Physiol. 233:93–109.
Harris, W.H., Jansen, V.D., and Yamashiro, S. 1983. Plasma and erythrocyte volumes of newborn rabbits delivered after 30 days of gestation. Lab. Anim. 17:294–297.
Himmelstein, M.W., Kegelman, T.A., DeLorme, M.P., Everds, N.E., O’Connor, J.C., Kemper, R.A., Nabb, D.L., Mileson, B.E., and Bevan, C. 2009. Two-day inhalation toxicity study of methyl iodide in the rat. Inhal. Toxicol. Epub ahead of print. DOI: 10.1080/08958370802596892.
Howdeshell, K.L. 2002. A model of the development of the brain as a construct of the thyroid system. Environ. Health Perspect. 110(suppl. 3):337–348.
ICRP 1975. Reference Man. Anatomical, Physiological, and Metabolic Characteristics. Pergamon Press, Oxford.
ICRP 1994. Human Resipiratory Tract Model for Radiological Protection. Oxford, Pergamon Press.
Inagi, K. 1992. Histological study of mucous membranes in the human nasal septum. Nippon Jibiinkoka Gakkai Kaiho 95:1174–1189.
Jarai, I. 1969. The redistribution of cardiac output on cold exposure in new-born rabbits. J. Physiol. 202:559–567.
Johansson, P., and Kumlien, J. 1988. Blood flow in the rabbit maxillary sinus mucosa during experimentally induced acute sinusitis. Acta Otolaryngol. 106:299–305.
Johnson, R.L., Gilbert, M., Meschia, G., and Battaglia, F.C. 1985. Cardiac output distribution and uteroplacental blood flow in the pregnant rabbit: a comparative study. Am. J. Obstet. Gynecol. 151:682–686.
Jonsson, F., Bois, F.Y., and Johanson, G. 2001. Assessing the reliability of PBPK models using data from methyl chloride-exposed, non-conjugating human subjects. Arch. Toxicol. 75:189–199.
Karnak, I., Muftuoglu, S., Cakar, N., and Tanyel, F.C. 1999. Organ growth and lung maturation in rabbit fetuses. Res. Exp. Med. (Berl.) 198:277–287.
Inha
latio
n T
oxic
olog
y D
ownl
oade
d fr
om in
form
ahea
lthca
re.c
om b
y C
DC
Inf
orm
atio
n C
ente
r on
07/
10/1
2Fo
r pe
rson
al u
se o
nly.
MeI PBPK model 581
Katayama, K., Ohtani, H., Murai, A., Kakemi, M., and Koizumi, T. 1990. Kinetic studies on drug disposition in rabbits. II. Dose dependent pharmacokinetics of sulfamethizole. J. Pharmacobiodyn. 13:108–119.
Kelley, P.M., and DuBois, A.B. 1998. Comparison between the uptake of nitrous oxide and nitric oxide in the human nose. J. Appl. Physiol. 85:1203–1209.
Kimbell, J.S., Kalisak, D.L., Conolly, R.B., Miller, F.J., and Jarabek, A.M. 2005. A mechanistic model of lifetime cancer risk for inhalation exposures to reactive gases. Poster #1304, Society of Toxicology Annual Meeting, March, 2005; New Orleans, Louisiana.
Kirkpatrick, D.T. 2002. A 13-week inhalation toxicity study (with a 4-week interim necropsy) of iodomethane in albino rats. WIL-418015. WIL Research Laboratories, Ashland, OH, January 28.
Kirman, C.R., Sweeney, L.M., Gargas, M.L., and Kinzell, J.H. 2009. Evaluation of possible modes of action for acute effects of methyl iodide in laboratory animals. Inhal. Toxicol.; Epub ahead of print. DOI: 10.1080/08958370802601510.
Knight, C.H., Docherty, A.H., and Peaker, M. 1984. Milk yield in rats in relation to activity and size of the mammary secretory cell population. J. Dairy Res. 51:29–35.
Krishna, N.S., Getchell, T.V., Dhooper, N., Awasthi, Y.C., and Getchell, M.L. 1995. Age- and gender-related trends in the expression of glutathione S-transferases in human nasal mucosa. Ann. Otol. Rhinol. Laryngol. 104:812–822.
Lee, M.S., Faller, T.H., Kreuzer, P.E., Kessler, W., Csanady, G.A., Putz, C., Rios-Blanco, M.N., Pottenger, L.H., Segerback, D., Osterman-Golkar, S., Swenberg, J.A., and Filser, J.G. 2005. Propylene oxide in blood and soluble nonprotein thiols in nasal mucosa and other tissues of male Fischer 344/N rats exposed to propylene oxide vapors–relevance of glutathione depletion for propylene oxide-induced rat nasal tumors. Toxicol. Sci. 83:177–189.
Licata, A.C., Dekant, W., Smith, C.E., and Borghoff, S.J. 2001. A physiologically based pharmacokinetic model for methyl tert-butyl ether in humans: implementing sensitivity and variability analyses. Toxicol. Sci. 62:191–204.
Licht, W.R., and Deen, W.M. 1988. Theoretical model for predicting rates of nitrosamine and nitrosamide formation in the human stomach. Carcinogenesis. 9:2227–37.
Lorijn, R.H., Nelson, J.C., and Longo, L.D. 1980. Induced fetal hyperthyroidism: cardiac output and oxygen consumption. Am. J. Physiol. 239:H302–H307.
Luecke, R.H., Wosilait, W.D., and Young, J.F. 1995. Mathematical representation of organ growth in the human embryo/fetus. Int. J. Biomed. Comput. 39:337–347.
Luecke, R.H., Wosilait, W.D., Pearce, B.A., and Young, J.F. 1994. A physiologically based pharmacokinetic computer model for human pregnancy. Teratology 49:90–103.
Macarulla-Sanz, E., Nebot-Cegarra, J., and Reina-de la Torre, F. 1996. Computer-assisted stereological analysis of gastric volume during the human embryonic period. J. Anat. 188(Pt 2):395–401.
Mainwaring, G.W., Nash, J., Davidson, M., and Green, T. 1996. Isolation of a mouse theta glutathione S-transferase active with methylene chloride. Biochem. J. 314(Pt 2):445–448.
Malmezat, T., Breuille, D., Capitan, P., Mirand, P.P., and Obled, C. 2000. Glutathione turnover is increased during the acute phase of sepsis in rats. J. Nutr. 130:1239–1246.
Mangold, J.B., and Abdel-Monem, M.M. 1983. Stereochemical aspects of conjugation reactions catalyzed by rat liver glutathione S-transferase isozymes. J. Med. Chem. 26:66–71.
Merrill, E.A., Clewell, R.A., Robinson, P.J., Jarabek, A.M., Gearhart, J.M., Sterner, T.R., and Fisher, J.W. 2005. PBPK model for radioactive iodide and perchlorate kinetics and perchlorate-induced inhibition of iodide uptake in humans. Toxicol. Sci. 83:25–43.
Merrill, E.A., Clewell, R.A., Gearhart, J.M., Robinson, P.J., Sterner, T.R., Yu, K.O., Mattie, D.R., and Fisher, J.W. 2003. PBPK predictions of perchlorate distribution and its effect on thyroid uptake of radioiodide in the male rat. Toxicol. Sci. 73:256–269.
Midttun, M., and Sejrsen, P. 1996. Blood flow rate in arteriovenous anastomoses and capillaries in thumb, first toe, ear lobe, and nose. Clin. Physiol. 16:275–289.
Nagata, S., Koyanagi, T., Horimoto, N., Satoh, S., and Nakano, H. 1990. Chronological development of the fetal stomach assessed using real-time ultrasound. Early Hum. Dev. 22:15–22.
Nemec, M., Sloter, E., Stump, D., Holson, J., Kirkpatrick, D., and Kinzell, J. 2009. Prenatal developmental toxicity studies of inhaled methyl iodide vapor in rabbits reveal a susceptible window of exposure inducing late gestational fetotoxicity. Inhal. Toxicol. Epub ahead of print. DOI: 10.1080/08958370802596876.
Nilsson, S.F., and Bill, A. 1984. Vasoactive intestinal polypeptide (VIP): effects in the eye and on regional blood flows. Acta Physiol. Scand. 121:385–392.
Nurnberger, C.E., and Lipscomb, A.L. 1952. Transmission of radioiodine (I131) to infants through human maternal milk. JAMA 150:1398–1400.
Nuwayhid, B. 1979. Hemodynamic changes during pregnancy in the rabbit. Am. J. Obstet. Gynecol. 135:590–596.
Plopper, C.G., Van Winkle, L.S., Fanucchi, M.V., Malburg, S.R., Nishio, S.J., Chang, A., and Buckpitt, A.R. 2001. Early events in naphthalene-induced acute Clara cell toxicity. II. Comparison of glutathione depletion and histopathology by airway location. Am. J. Respir. Cell. Mol. Biol. 24:272–281.
Poet, T.S., Wu, H., Corley, R.A., and Thrall, K.D. 2009. In vitro GSH conjugation of methyl iodide in rat, rabbit, and human blood and tissues. Inhal. Toxicol. Epub ahead of print. DOI: 10.1080/08958370802598203.
Potter, D.W., and Tran, T.B. 1993. Apparent rates of glutathione turnover in rat tissues. Toxicol. Appl. Pharmacol. 120:186–192.
Potter, D.W., Finch, L., and Udinsky, J.R. 1995. Glutathione content and turnover in rat nasal epithelia. Toxicol. Appl. Pharmacol. 135:185–191.
Prince, H. 1982. Blood volume in the pregnant rabbit. Q. J. Exp. Physiol. 67:87–95.
Qanungo, S., and Mukherjea, M. 2000. Ontogenic profile of some antioxidants and lipid peroxidation in human placental and fetal tissues. Mol. Cell. Biochem. 215:11–19.
Rayburn, W., Robinson, A., Braverman, L.E., He, X.M., Pino, S., Gargas, M.L., and Kinzell, J.H. 2008. Iodide concentrations in matched maternal serum, cord serum and amniotic fluid from preterm and term human pregnancies. Reprod. Toxicol. 25:129–132.
Reed, C.J., Gaskell, B.A., Banger, K.K., and Lock, E.A. 1995. Olfactory toxicity of methyl iodide in the rat. Arch. Toxicol. 70:51–56.
Reeves, P.T., Minchin, R.F., and Ilett, K.F. 1988. Measurement of organ blood flow in the rabbit. J. Pharmacol. Methods 20:187–196.
Rikans, L. E., and Moore, D.R. 1988. Effect of aging on aqueous-phase antioxidants in issues of male Fischer rats. Biochim. Biophys. Acta 966:269–275.
Robertz-Vaupel, G.M., Bierl, R., and von Unruh, G. 1991. Intravenöse Methyljodidintoxikation–Detoxikation durch Hämoperfusion. Anasthesiol. Intensivmed. Notfallmed. Schmerzther. 26:44–47.
Sangari, S.K., Sengupta, P., Pradhan, S., and Khatri, K. 2000. Vascularization of developing human olfactory neuroepithelium - a morphometric study. Cells Tissues Organs 166:349–353.
Saunders, M.W., Jones, N.S., Kabala, J., and Lowe, J. 1995. An anatomical, histological and magnetic resonance imaging study of the nasal septum. Clin. Otolaryngol. Allied Sci. 20:434–438.
Schaefer, G.J. 2002. An acute neurotoxicity study of iodomethane in rats. WIL-418008. WIL Research Laboratories, Ashland, OH. January 7.
Sedlak, J., and Lindsay, R.H. 1968. Estimation of total, protein-bound, and nonprotein sulfhydryl groups in tissue with Ellman’s reagent. Anal. Biochem. 25:192–205.
Sherratt, P.J., Pulford, D.J., Harrison, D.J., Green, T., and Hayes, J.D. 1997. Evidence that human class Theta glutathione S-transferase T1-1 can catalyse the activation of dichloromethane, a liver and lung carcinogen in the mouse. Comparison of the tissue distribution of GST T1-1 with that of classes Alpha, Mu and Pi GST in human. Biochem. J. 326(Pt 3):837–846.
Shokeer, A., Larsson, A.K., and Mannervik, B. 2005. Residue 234 in glutathione transferase T1-1 plays a pivotal role in the catalytic activity and the selectivity against alternative substrates. Biochem. J. 388:387–392.
Sloter, E.D., Nemec, M., Stump, D., Holson, J., Kirkpatrick, D., Gargas, M., and Kinzell, J. 2009. Methyl iodide induced fetal hypothyroidism implicated in late-stage fetal death in rabbits. Inhal. Toxicol. Epub ahead of print. DOI: 10.1080/08958370802596942.
Stott, W.T., Dryzga, M.D., and Ramsey, J.C. 1983. Blood-flow distribution in the mouse. J. Appl. Toxicol. 3:310–312.
Sweeney, L.M., Andersen, M.E., and Gargas, M.L. 2004. Ethyl acrylate risk assessment with a hybrid computational fluid dynamics and physiologically based nasal dosimetry model. Toxicol. Sci. 79:394–403.
Sweeney, L.M., Gargas, M.L., Strother, D.E., and Kedderis, G.L. 2003. Physiologically based pharmacokinetic model parameter estimation and sensitivity and variability analyses for acrylonitrile disposition in humans. Toxicol. Sci. 71:27–40.
Sweeney, L.M., Tyler, T.R., Kirman, C.R., Corley, R.A., Reitz, R.H., Paustenbach, D.J., Holson, J.F., Whorton, M.D., Thompson, K.M., and Gargas, M.L. 2001. Proposed occupational exposure limits for select ethylene glycol
Inha
latio
n T
oxic
olog
y D
ownl
oade
d fr
om in
form
ahea
lthca
re.c
om b
y C
DC
Inf
orm
atio
n C
ente
r on
07/
10/1
2Fo
r pe
rson
al u
se o
nly.

582 L. M. Sweeney et al.
ethers using PBPK models and Monte Carlo simulations. Toxicol. Sci. 62:124–139
Tasman, A.J., Soor, A., Zaiss, M., and Weidauer, H. 1999. The septal mucosa decongests with naphazoline: a study of mucosal dynamics with sonography. Am. J. Rhinol. 13:411–417.
Teo, S.K., Kedderis, G.L., and Gargas, M.L. 1994. Determination of tissue partition coefficients for volatile tissue-reactive chemicals: acrylonitrile and its metabolite 2-cyanoethylene oxide. Toxicol. Appl. Pharmacol. 128:92–96.
Thrall, K.D., Morris, J.E., Sasser, L.b., Creim, J.A., Gargas, M.L., Kinzell, J.H., and Corley, R.A. 2009a. Studies supporting the development of a PBPK model for methyl iodide: the pharmacokinetics of sodium iodide (NaI) in pregnant rabbits. Inhal. Toxicol.Epub ahead of print. DOI: 10.1080/08958370802598286.
Thrall, K.D., Woodstock, A.D., and Soelberg, J.J. 2009b. A real-time methodology to evaluate the nasal absorption of volatile compounds in intact animals. Inhal. Toxicol.Epub ahead of print. DOI: 10.1080/08958370802601452.
Uhlig, S., and Wendel, A. 1992. The physiological consequences of glutathione variations. Life Sci. 51:1083–1094.
US EPA. 2004. Response to Arvesta’s proposed testing strategy for iodomethane. Memorandum from Elizabeth Mendez to Mary Waller, March 21, 2004.
Yokoyama, N., Nagayama, Y., Kakezono, F., Kiriyama, T., Morita, S., Ohtakara, S., Okamoto, S., Morimoto, I., Izumi, M., Ishikawa, N. et al. 1986. Determination of the volume of the thyroid gland by a high resolutional ultrasonic scanner. J. Nucl. Med. 27:1475–1479.
Yu, K.O., Narayanan, L., Mattie, D.R., Godfrey, R.J., Todd, P.N., Sterner, T.R., Mahle, D.A., Lumpkin, M.H., and Fisher, J.W. 2002. The pharmacokinetics of perchlorate and its effect on the hypothalamus-pituitary-thyroid axis in the male rat. Toxicol. Appl. Pharmacol. 182:148–159.
Zalani, S., Bharaj, B.S., and Rajalakshmi, R. 1987. Ascorbic acid and reduced glutathione concentration of human fetal tissues in relation to gestational age, fetal size and maternal nutritional status. Int. J. Vitam. Nutr. Res. 57:411–419.
Inha
latio
n T
oxic
olog
y D
ownl
oade
d fr
om in
form
ahea
lthca
re.c
om b
y C
DC
Inf
orm
atio
n C
ente
r on
07/
10/1
2Fo
r pe
rson
al u
se o
nly.