development of a portable remote sensing system for ... · pdf filedevelopment of a portable...
TRANSCRIPT
Development of a Portable Remote Sensing System for Measurement of Diesel Emissions from Passing Diesel Trucks
FINAL REPORT
Hamid R. Rahai, Ph.D. and Bei Lu, Ph.D.
Center for Energy and Environmental Research and Services (CEERS) College of Engineering
California State University Long Beach
CSULB-METRANS contract number 07-350808 08-22
April 8, 2011

2
Disclaimer
The contents of this report reflect the views of the author, who is responsible for the facts and the accuracy of the information presented herein. This document is disseminated under the sponsorship of the Department of Transportation, University Transportation Centers Program, and California Department of Transportation in the interest of information exchange. The U.S. Government and California Department of Transportation assume no liability for the contents or use thereof. The contents do not necessarily reflect the official views or policies of the State of California or the Department of Transportation. This report does not constitute a standard, specification, or regulation.

3
Abstract
A wireless remote-sensing system has been developed for measurement of NOx
and particulate matters (PM) emissions from passing diesel trucks. The NOx measurement system has a UV light source with quartz fiber optics that focused the light source into a spectrometer. The signals from the spectrometer was routed through a wireless antenna to a remote computer and NOx measurements were performed by comparing the spectra of the receiving signals to a reference spectrum for compliance. Laboratory measurements were performed with the exhaust of a stationary 3-cylinder diesel engine and field tests were with a diesel-powered forklift truck. Results of the remote sensing system were compared with direct exhaust measurements. For NOx measurement, comparing the variance of the spectrum between the 200-300 nm wavelengths with direct diesel engine exhaust measurement, an approximate NOx/variance ratio of 0.5 was found for the stationary measurement and ratios of 0.3-0.4 were obtained for transient measurements.
PM measurements were performed by both a TSI DustTrak model 8520 and a
remote MiniPCS particle counter-sizer system from Measurement Science Enterprise (MSE). Results of the PM measurements from these devices were comparable, indicating the potential of the MiniPCS system for remote sensing PM measurements.

4
Table of Contents
DISCLAIMER 2 ABSTRACT 3 TABLE OF CONTENTS 4 LIST OF FIGURES 5 LIST OF TABLES 6 DISCLOSURE 7 ACKNOWLEDGEMENT 8 BACKGROUND 9 MEASUREMENT SYSTEMS, PROCEDURE AND TECHNIQUES 10 RESULTS AND DISCUSSIONS 14 CONCLUSIONS 20 IMPLEMENTATION 21 REFERENCES 22

5
LIST OF FIGURES Figures Page
1. Remote NOx measurement system.……………………………………………..11
2. Laboratory test set-up ………………………………………………………...…12
3. Field tests with a diesel-powered Forklift truck in closed and open environments……………………………………………………………………12
4. The MiniPCS unit …………………………………………………………...…13
5. Comparison of the output spectrum from the spectrum analyzer and receiving computer during the laboratory trial …………………………………………….14
6. Spectra (a) without emitted gas, (b) with NO gas at 25 torr concentration, and (c) with NO gas at 1.8 torr concentration ………..……………………...………….15
7. Spectra of NO gas with air enrainment ……...………………………………….15
8. Spectra of the exhaust, (a) continuous flow, (b) intermittent flow……………..16
9. Comparisons between NOx measurements from remote sensing system and direct exhaust measurements………………………………………………………….17
10. Spectra of absorption energy for field test with lift truck, (a) lift truck stationary, (b) lift truck in transit…………………………………………………………..17
11. Variation of the PM measurements from continuous exhaust, (a) DustTrak, (b) MiniPCS…………………………………………………………….………….19
12. Variation of the PM measurements for lift truck in transit, (a) DustTrak, (b) MiniPCS ……….………………………………………………………………19

6
LIST OF TABLES Tables:
1. The MiniPCS specifications…………………………………………………….14 2. Ratio of direct NOx measurement to the variance of the spectrum energy from the
remote-sensing system…………………………………………………………...18

7
3. Disclosure Project was funded in entirety under this contract to California Department of Transportation.
8
Acknowledgments This study was supported with a grant from METRANS research program. The authors would like to thank METRANS executive committee for their support. The supports of CSULB graduate assistants, Victor Muro and Ehsan Shamloo, CEERS technical support staff, Mr. Mike Fritz and Mr. Joe Wardell of CSULB Mechanical and Aerospace Engineering technicians, and Dr. Darius Modarress of Measurement Science Enterprises, Inc., are gratefully acknowledged.
9
3.2. BACKGROUND
On-road vehicles, ships and aircrafts are major sources of air pollution. Local concentrations of NOx and other pollutant gases such as CO, CO2 and HC create unhealthy conditions with immediate symptoms such as eye and respiratory irritations. Long-term exposures to these pollutants create severe health problems with children and old adults being at the highest risk. A recent study by Gauderman et al (2004) on the effects of pollution on the children’s health in Los Angles has shown that pollution stunt lung growth in children and can cause premature death or life time health problems. On the average diesel-fueled vehicles are about 20-40% more fuel efficient and their greenhouse gases is about 15% less than the comparable gasoline-fueled engines. However, the major adverse effects of the diesel engines are their NOx and PM emissions. The U.S. Standards for tailpipe emissions of NOx have been tightened over the past years and effective with 2009 model year, California and Federal Tier 2 vehicle emission standards for NOx emission for the new vehicles operating in the U.S. is now set at an average of 0.07 grams/mile. This tight regulation for diesel NOx emission requires diesel engine manufacturer to incorporate various advanced technologies such as exhaust gas recirculation and selective catalytic reduction (SCR) filter for reducing diesel NOx emission. According to the California Air Resources Board (CARB) in 2010, on road heavy-duty diesel trucks are estimated to account for up to 28% or 559 tons per day of oxides of nitrogen (NOx) and up to 12 % of PM emissions inventory statewide. Truck idling also contributes significantly to these emissions. Idling emissions are considerable at the port terminals and distribution centers where long waiting hours are required for loading and unloading operations, as well as at rest areas and traffic stops, among others. CARB has proposed regulation to reduce idling emissions from new trucks starting with the 2008 model year. The regulation requires manufacturers to either meet an emissions standard or have a timer system that automatically shut off the engine after five minutes of continuous idling. In addition, proposals and regulations are under consideration or have been adapted to require diesel truck operators to either switch to low sulfur diesel fuel or retrofit their engines and exhaust systems with emission control devices that reduce diesel engine emissions. These regulations have direct impact on the nearly 6000 existing trucks serving the two major ports of Los Angeles and Long Beach. Implementation of these regulations should result in significant improvements in local air quality. However, a major task with the execution of the new regulations is verification of emissions abatement of the retrofitted truck. Exploratory remote sensing devices (RSD) have been used since mid 80s to measure tail pipe emissions of on-road vehicles (Popp et al, 1999, Bishop et al, 2001, 2004, Pokharel et al, 2002). An RSD system include infrared (IR) and ultraviolet (UV) light sources with corresponding detectors for measurements of hydrocarbons (HC), carbon monoxides (CO), carbon dioxides (CO2), and nitrogen oxides (NOx). For the exploratory RSD system, the light sources are passed through a beam splitter and one beam is used as a reference and the other beam is spanned across the road at an elevation above the ground to match the tail pipe location. The spanned beam is focused on carbon monoxide (CO), carbon dioxide (CO2), hydrocarbon (HC), and NO detectors. For the IR light source, a
10
rotating cylinder with surface mirrors will focus the light source on the CO, CO2, and HC detectors and for the UV light source, a quartz fiber optic cable (detector) will focus the UV light on the NO detector. These detectors absorb the corresponding pollutant at an absorbance band and results are compared with reference spectra for analysis. Since in combustion engines most NOx are in the form of NO, then the system is effectively measures NOx emission. The exploratory RSD systems are usually placed on a truck or a van with continuous attendance of an operator to monitor the system and to upload the information obtained from the processors. The objective of the present investigation was to develop a stand-alone system for NOx and PM measurements from passing vehicles in areas without power outlets or access. The system can be placed across freeway exits, single lane roads or at boarders and weight stations to check the emissions of the trucks, for meeting the state and federal standards.
3.0. MEASUREENT SYSTEMS, PROCEDURE AND TECHNIQUES 3.1 NOx Measurements
The system components consist of a light source, fiber optics cable bundle, a spectrometer, two RF modems and antennas, a laptop computer, and a standalone solar power supply. Figures 1 shows the laboratory set-up. The light source was a 30 watt Oriel Apex Deuterium light source model 70635 that emits a high level of UV radiation with minimum VIS and IR and a collimated output diameter of 33 mm. A Newport Corporation spectrometer model OSM2-400UV connected to a fiber optics bundle cable was used to capture the UV light. Data can be stored, archived and transported on removable Smart Media memory card or simply stored into the instruments onboard memory for future retrieval. For the present investigation, the spectrometer was connected to a Digi’s Xtend-PKG RF modem with antenna for uploading the spectrum data to a remote computer. The range of the antenna is up to 30 miles. The remote computer was connected to a similar modem-antenna for receiving the data. Data transfer was accomplished through RF control software.
For the laboratory testing, first, the system components were placed on a portable
rack and connected to the wall outlet. Nearly pure NO gas was used to assess the accuracy of the spectrometer and its spectrum. The components were then placed on two specially-made tripods and the system was tested with the exhaust of a Vanguard 3-cylinder liquid-cooled aspired diesel engine with a maximum output power of 20 BHP at 3600 rpm (figure 2). The exhaust NOx emissions were also measured with a portable ENERAC micro-emissions analyzer model 500 which is capable of measuring accurately the ambient temperature, stack temperature, oxygen, nitric oxide (0-2000 PPM), nitrogen dioxide (0-1000 PPM), carbon monoxide (0-2000 PPM), sulfur dioxide (0-2000 PPM) and stack draft. Other parameters calculated were combustion efficiency, percent carbon dioxide, excess air, oxides of nitrogen, emissions of CO, NO, NO2, NOx, and SO2 in LBS/Million BTU or in GRAMS/BHH. The sensors were replaced and the unit was calibrated in summer 2009. During the emission measurements, the unit was operating at the full range. The analyzer was connected to a Dell Laptop and data was recorded automatically at 30 sec. interval for 5-10 minutes. The average NOx measured

11
with the exhaust emission analyzer was compared with the corresponding spectrum obtained with the UV RSD and also to the spectrum of pure NO for further calibration and assessment. The unit was then field tested using a diesel-powered lift truck (figure 3). A portable solar power system was used to supply power to the system. It consisted of a 250 Watt solar panel, a backup battery, a voltage regulator and an inverter.
Transient measurements of diesel NOx were made with the lift truck passing
through the light source at different speeds and results were compared with the exhaust emission measured using the portable diesel emission analyzer. Using the calibration data, the output spectrum of the UV system was adjusted to represent the NOx emission of the lift truck.
Figure 1. Remote NOx measurement system
Engine
Oriel Apex Deuterium Light Source 70635
Newport OSM2-400UV MinispectrometerPipe
Fibre optic
Digi Xtend RF Modem
Digi Xtend RF Modem
Computer with analysis software
Test side
Data Collection and Analysis side

12
Figure 2. Laboratory test set-up
Figure 3. Field tests with a diesel-powered Forklift truck in closed and open environments.
3.2. PM Measurements
The remote PM measurements were performed with a TSI DustTrak model 8520 and MiniPCS systems from Measurement Science Enterprise (MSE), Inc. , The DustTrak uses light scattering technology to determine mass concentration in real-time. A continuous stream draws aerosol sample into a section of a sensing chamber which is illuminated by a small laser beam light. Particles in the aerosol sample scatter light in all directions where some are collected and focused on a photodetector which converts the light into the voltage. The voltage is linearly proportional to the mass concentration of the aerosol. The scattered light depends upon the particle size. The smallest detectable particle for this unit is about 0.1 µm. The unit is supplied with three different inlet nozzles for different size particle measurements. For the present investigations, the 2.5 µm inlet nozzle was used. The time interval for collecting samples was set at 1 second. The unit was placed in an environmental enclosure with rechargeable battery for

13
continuous unattended sampling. The aerosol sampling inlet is attached to the outside of the enclosure and is connected to unit inside via tubing. The unit can be operated without recharge between 8 hours to one month based on the sampling rate.
Figure 4 shows the Mini PCS unit and its components. Table 1 shows its specifications. The MiniPCS provide the time-of-arrival (TOA), the time-of-departure (TOD), the concentration and particle size distribution of the dust plume at specific locations. Particle size dynamic range is from 0.5 to 100 microns. The device is able to work effectively in particle concentrations from 0.01 to 10
5 particles per cc. It provides on-board recording,
remote triggering and communication, and on-board Global Positioning System for time and location determination.
Figure 4. The MiniPCS unit

14
Table 1. The MiniPCS specifications.
4.0. RESULTS AND DISCUSSION NOx Measurements:
Before the onset of the laboratory and field tests, the NOx remote sensing system was tested with comparison between the local spectrum signal and the corresponding signal received via wireless antenna. Figure 5 shows comparison of the output spectrum from the spectrum analyzer and the receiving computer during the laboratory trial which confirms the reliability and accuracy of the remote-sensing system.
Figure 5. Comparison of the output spectrum from the spectrum analyzer and receiving computer during the laboratory trial.
Figure 6 shows the base spectrum without any gas released, % NO gas transmitted with 25 torr and 1.8 torr concentrations. For both high and low concentrations, the spectra show three prominent peaks at 204.9, 214.8, and 226.1 nm which are in agreements with spectrum for nearly pure NO gas. Figure 7 shows the

15
corresponding spectra with air entrainment into the NO gas to generate NO2. As it shows, with increased dilution, the prominent peaks decay and are not as distinct as before.
(a) (b)
(c)
Figure 6. Spectra (a) without emitted gas, (b) with NO gas at 25 torr concentration, and (c) with NO gas at 1.8 torr concentration.
Figure 7. Spectra of NO gas with air entrainment
0
200
400
200 300 400 500
Rela
tive
irrad
ianc
e
Wavelength (nm)
Reference Scan
0200
200 300 400 500
Wavelength (nm)
%Transmission (NO)
20406080
100
200 300 400 500
Wavelength (nm)
%Transmission (NO)

16
Figure 8 shows the spectra of both continuous and intermitted exhausts from the remote sensing system during the laboratory trial. The intermittent condition was achieved by rotating the flexible exhaust pipe in a plane perpendicular to the UV light 90 degrees every 5 seconds. For the continuous flow condition the spectra shows nearly the same distribution while for the intermittent condition, while the spectra shape does not change, but there are slight variations in the level of absorption energy. This variation is due to the diffusion process which affects the concentration of the exhaust gas at the measurement location.
(a) (b)
Figure 8. Spectra of the exhaust, (a) continuous flow, (b) intermittent flow.
Figure 9 shows variation of PPM NOx from direct exhaust measurements and variances of the absorption spectra between the 200-300 nm wavelength, for both continuous and intermittent conditions. The direct measurement of the exhaust stays nearly constant at about 180 PPM and the variances of the absorption energy stays at about 90 for the continuous exhaust and between 70-80 for the intermittent exhaust.
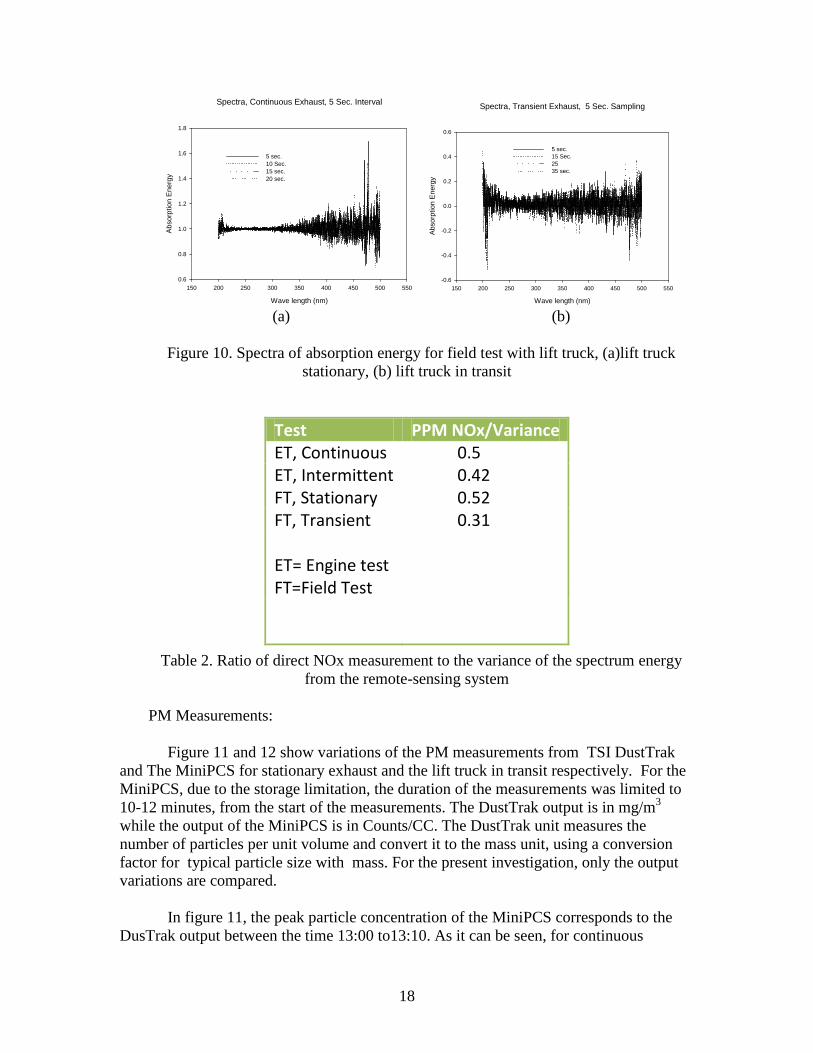
Figure 10 shows the absorption energy spectra from the plumes of the diesel forklift,
when it is standing stationary below the remote sensing system and when it is in transient passing under the UV light at a slow speed. For the stationary condition, except for some
Spectra, Continuous Exhaust, 5 Sec. Interval
Wave length (nm)
150 200 250 300 350 400 450 500 550
Abs
orpt
ion
Ene
rgy
0.0
0.2
0.4
0.6
0.8
1.0
1.2
5 sec.10 Sec.15 sec.20 sec.
Spectra, Intermittent Exhaust, 5 Sec. Interval, 5 Sec. Sampling
Wave length (nm)
150 200 250 300 350 400 450 500 550
Abs
orpt
ion
Ene
rgy
-0.2
0.0
0.2
0.4
0.6
0.8
1.0
5 sec.15 Sec.2535 sec.

17
variations near the 200 nm wavelength, the spectra stay nearly constant at 1, between the 200-300 nm wavelength. However, for the transient exhaust, the spectra energy fluctuate significantly around the zero value with the most of the energy concentrated near the 200 nm wavelength.
Table 2 shows the ratio of the variances of the absorption energy to the direct
measurements for continuous, intermittent, and transient conditions. For the continuous condition, the ratio is nearly constant at 0.5, while for the intermittent, it reduces to 0.42 and for the transient condition when the truck plume crosses the UV light at a slow speed, it reduces further to 0.31. The reduction is due to the diffusion process. These results indicate that the best approach for NOx measurement using a remote sensing device is to have the system housed in a top closed station that can prevent fast diffusion of the plume where the accuracy of the measurement could be sustained.
Figure 9. Comparisons between NOx measurements from remote sensing system and
direct exhaust measurements.
Time, Sec.
0 100 200 300 400
Var
ianc
e or
PP
M N
Ox
40
60
80
100
120
140
160
180
200
Absorption Energy, Continuous ExhaustAbsorption Energy, Intermittent ExhaustPPM NOx, Continuous ExhaustPPM NOx, Intermittent Exhaust
18
(a) (b)
Figure 10. Spectra of absorption energy for field test with lift truck, (a)lift truck
stationary, (b) lift truck in transit
Table 2. Ratio of direct NOx measurement to the variance of the spectrum energy
from the remote-sensing system PM Measurements:
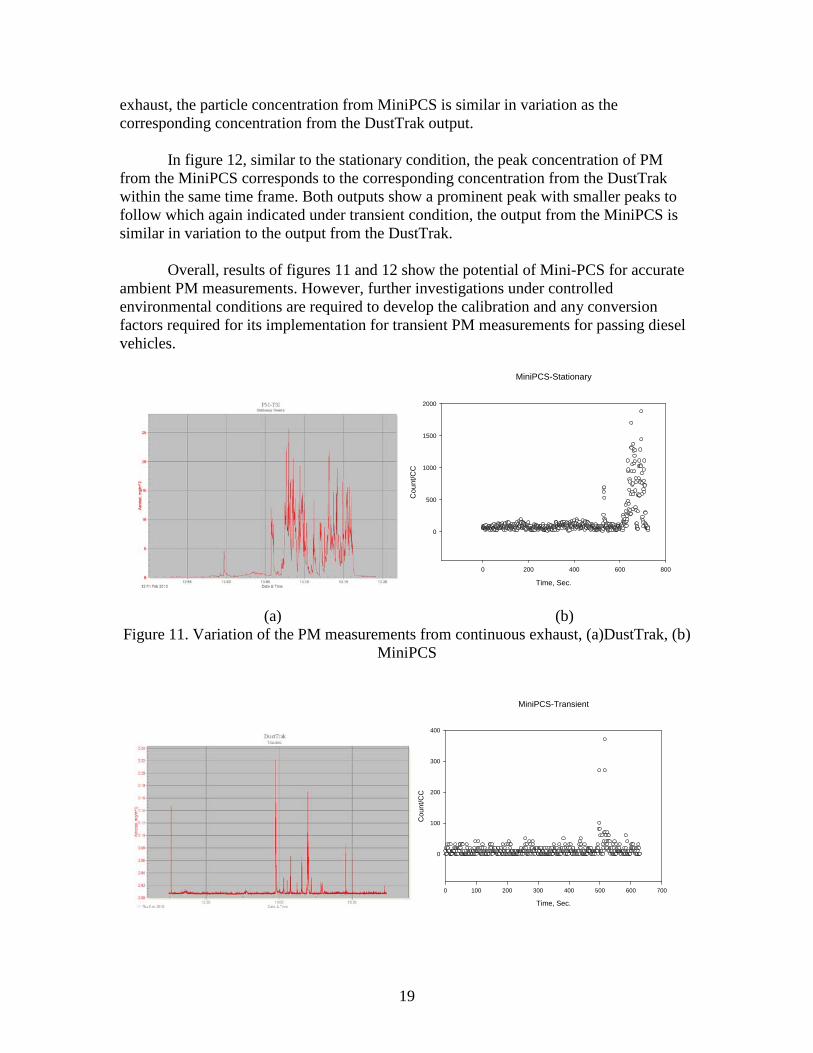
Figure 11 and 12 show variations of the PM measurements from TSI DustTrak
and The MiniPCS for stationary exhaust and the lift truck in transit respectively. For the MiniPCS, due to the storage limitation, the duration of the measurements was limited to 10-12 minutes, from the start of the measurements. The DustTrak output is in mg/m3
while the output of the MiniPCS is in Counts/CC. The DustTrak unit measures the number of particles per unit volume and convert it to the mass unit, using a conversion factor for typical particle size with mass. For the present investigation, only the output variations are compared.
In figure 11, the peak particle concentration of the MiniPCS corresponds to the
DusTrak output between the time 13:00 to13:10. As it can be seen, for continuous
Spectra, Continuous Exhaust, 5 Sec. Interval
Wave length (nm)
150 200 250 300 350 400 450 500 550
Abs
orpt
ion
Ene
rgy
0.6
0.8
1.0
1.2
1.4
1.6
1.8
5 sec.10 Sec.15 sec.20 sec.
Spectra, Transient Exhaust, 5 Sec. Sampling
Wave length (nm)
150 200 250 300 350 400 450 500 550
Abs
orpt
ion
Ene
rgy
-0.6
-0.4
-0.2
0.0
0.2
0.4
0.6
5 sec.15 Sec.2535 sec.
Test PPM NOx/Variance ET, Continuous 0.5 ET, Intermittent 0.42 FT, Stationary 0.52 FT, Transient 0.31 ET= Engine test
FT=Field Test
19
exhaust, the particle concentration from MiniPCS is similar in variation as the corresponding concentration from the DustTrak output.
In figure 12, similar to the stationary condition, the peak concentration of PM
from the MiniPCS corresponds to the corresponding concentration from the DustTrak within the same time frame. Both outputs show a prominent peak with smaller peaks to follow which again indicated under transient condition, the output from the MiniPCS is similar in variation to the output from the DustTrak.
Overall, results of figures 11 and 12 show the potential of Mini-PCS for accurate
ambient PM measurements. However, further investigations under controlled environmental conditions are required to develop the calibration and any conversion factors required for its implementation for transient PM measurements for passing diesel vehicles.
MiniPCS-Stationary
Time, Sec.
0 200 400 600 800
Cou
nt/C
C
0
500
1000
1500
2000
(a) (b) Figure 11. Variation of the PM measurements from continuous exhaust, (a)DustTrak, (b)
MiniPCS
MiniPCS-Transient
Time, Sec.
0 100 200 300 400 500 600 700
Cou
nt/C
C
0
100
200
300
400

20
Figure 12. Variation of the PM measurements for lift truck in transit, (a)DustTrak, (b) MiniPCS

21
5.0. CONCLUSIONS AND RECOMMENDATIONS
A remote sensing device with wireless antenna has been developed for measurements of NOx and PM emissions from passing diesel trucks. The NOx measurement system consisted of a UV light source, a spectrum analyzer with fiber optics cable, wireless modem and antennas, receiving computer and a portable solar power system. The system was calibrated with a pure NO gas and then tested in the laboratory with the exhaust of a stationary diesel engine and on road with a traveling diesel-powered forklift. Results of the system calibration were in agreement with published results for the NO spectrum. Comparison between RSD results of the NO emission of the stationary diesel engine and on road vehicle with the corresponding results from the tailpipe emission analyzer shows a constant scaling factor while for the moving truck the ratio of the variance of the absorption spectrum to the direct tailpipe NOx measurement is reduced and has some variations. Based on these experiments, it is recommended that the remote sensing device is used in an enclosed environment where the plume diffusion is not significant.
The PM measurement were performed with a TSI DustTrak model 8520 and a
MiniPCS system from MSE, Inc. Comparison of the results from these devices for stationary and transient conditions show good agreements, indicating that the MiniPCS could accurately be used for remote sensing PM measurement from passing diesel trucks.
22
6.0. IMPLEMENTATION The next phase of the project is to develop an industrial prototype unit of the remote
emission measurement system and field test it with diesel trucks on California roads. The system could be installed at emission stations along highways and freeways where diesel trucks drive through these stations and their emissions are measured and compared with the standard reference values for compliance. The system could also be installed at the ports, along the borders, and other locations with high level of diesel truck traffics.

23
REFERENCES
Bishop, G.A., Burgard, D.A. and Stedman, D.H., “On-Road Remote Sensing of Automobile Emissions in the La Brea Area: Year 3 ,” final report to CRC for Contract No. E-23-4., May 2004.
Bishop, G.A., Morris, J.A., Stedman, D.H., Cohen, L., Countess, R.J., Countess,
S.J., maly, P., and Scherer, S., “ The Effect of Altitude on Heavy-Duty Diesel Truck on-Road Emissions,” Environ. Sci. Technol. 2001, 35, 1574-1578.
Guderman, et al, “ The effect of Air Pollution on Lung Development from 10 to
18 Years of Age,” The new England Journal of Medicine, Vol. 351, No. 11, September 2004.
Hilton, M., Lettington, A.H., and Wilson, C.W., “Gas Turbine Exhaust Emissions
Monitoring using Nonintrusive Infrared Spectroscopy,” J. of Engineering for Gas Turbines and Power, Transactions of the ASME, Vol. 120, July 1998, pp. 514-518.
Pokharel, S.S., Bishop, G.A., and Stedman, D.H., “On-Road Remote Sensing of
Automobile Emissions in the Los Angles Area: Year 3 (Riverside),” final report to CRC for Contract No. E-23-4., June 2002.
Popp, P.J., Bishop, G., and Stedman, D.H., “ Development of a High-Speed
Ultraviolet Spectrometer for Remote Sensing of Mobile Source Nitric Oxides Emissions,” J. Air&Waste Manage. Assoc., 49, 1463-1468, 1999.