development of a portable retroreflectometer
TRANSCRIPT

Research Report UKTRP-83-9
DEVELOPMENT OF A PORTABLE RETROREFLECTOMETER
by
Kenneth R. Agent Research Engineer
and
Jerry G. Pigman --- Re£ea�eh---Eng4cnee't"� -------------
Kentucky Transportation Research Program College of Engineering University of Kentucky
in cooperation with Department of Highways
Commonwealth of Kentucky
The contents of this report reflect the views of the authors who are responsible for the facts and
accuracy of the data presented herein. The contents do not necessarily reflect the official views or
policies of the University of Kentucky nor of the Kentucky Department of Highways. This report does not
constitute a standard, spec�fication, or regulation.
April 1983
brought to you by COREView metadata, citation and similar papers at core.ac.uk
provided by University of Kentucky

Technical Keport Documentation Page ·-·
I. Report No. ------- - - ---- - --
,--.,_,,.,..,.,.,,._,qr �\cccss,an No. 3. Recipient's Catalog No. -l I
··--- . ------ · · ·-------4. Title and Subtitle 5. Report Dote
Development of a Portable Retroreflectometer 1983 AJ'ril ··-6. Performing Orgon1zot1on Code
--- - ---
8. Performing Orgon1zotion Report No. 7 Author's)
K . R . Agent and J. G. Pigman UKTRP-83-9 � 9, Performing Orgoni zot1on No:Jme end "\ ,, ,:, � � s 10. Work Unil No. (TRAIS)
Kentucky Transportation Research Program College of Engineering 11. Contract or Grant No. University of Kentucky
KYP-73-48 Lexington, Kentucky 40506-0043 13. Type of Report and Per�od Covered
---·-·
12. Sponsonng Agency Nome and Add•ess
Kentucky Department of Transportation Interim State Office Building
I Frankfort, Kentucky 40622 14. Sponsoring Agency Code
·---- - - --- ·--
. ... __ J.5_ .. _$.up-p-l-em-e-n-I-Gt-y-.N-o.le-S----- ------------------------·----·-·-·---------- ____ ,_, -- ---· ·-·-·------ - . --
Study T itle: Evaluation and Application of
----
16. Abstract
- ....... ,_
Roadway
----·
Delineation
-· ..... . . ----- ---·-
Techniques
,_,_, ---- . ___ , ' ·-·---
There is a need for a portable retroreflectometer which can perform reflectivity measurements in the f ield. This could eliminate the need for subjective ratings or taking samples of materials from the field to test in the laboratory. This report describes the development of a portable retroflectometer (PRR).
A PRR was built with the objective of approximating the angles of incidence and divergence used in the ESNA Reflex-Photometer (ESNA). Tests showed a good relation-ship between readings taken with the PRR and ESNA. The recommendation was made that the PRR is suitable for use as a means of measuring reflectivity in the field. How-ever, the PRR should be used concurrently with subjective ratings and future modi-fications, with the objective of improving measurement consistency, are warranted .
17. Key Words 18. Distribution Statement
Pavement Narkings Refle!'tivity Portable Retroreflectometer
19. Security Clossif. (of this reoortl
_ _ r Secun ty Closs, f. (of this page) 21. No. ai Pages I 22. P n ce
L I �orm DOT F 1700.7 '8-721 Reproduction of completed page authorized
.... -··
I !
I
I
I I I I I i I
I
............ ·------·-·---

TABLE OF CONTENTS
Page
Introduction. . . . . . . . . . . . . . . . . . . . . . . . . . . . . . . . . . . . . . . . . . . . . . . . . 1
Description of Portable Retroreflectometer. . . . . . . . . . . . . . . . . . . 2
Relationship between PRR and ESNA. . . . . . . . . . . . . . . . . . . . . . . . . . . . 2
Consistency of Measurements. . . . . . . . . . . . . . . . . . . . . . . . . . . . . . . . . . 3
Summary . . . . . . • . . . . . . • . . . • • . . . . • . • . . . . • • . . . . • • • • • . . . • • . . • . . • • . 4
Recommendations . . . • • . . . . • . . . • . • . . . . . . . . • . • . . . . • • . . • . • . . • • . • • • 4
References. . . . . . . . . • . • • . . . . • • . • . . . • . . . . • . • . • . • . . . . • . . . • • • . . . . 4
Figures . . . . . • • . . . . . . . . . . . . • . . . • . . . • • . • . . • • • • . • • . . . . • . . • . . . . . . 5
Tables . . . . • . • • . . . • • • . . . . • • • . . . . . . . . . . . . . . . • . • • . . . • • • . . • . . . • . • 10

INTRODUCTION Council, documents development of a portable retroreflectometer (2) . It was
The need for a portable concluded that the apparatus could be used retroreflectometer is apparent to those to accurately measure the relative amount who are involved in the evaluation of of reflected light for the entrance and pavement marking materials. Adequate observation angles built into it. The means of measuring reflectivity of instrument is also inexpensive, with an pavement marking materials have been estimated cost of $250. A disadvantage available for many years. However, it has was the reflectometer readings correlated always been necessary to take samples of with light tunnel readings at an the materials from the field and test them observation angle of 2 degrees and in a laboratory to obtain a quantative entrance angle of 75 degrees rather than measure of reflectivity. Field divergence angles of 0.2 and 0.5 degrees evaluations of pavement marking materials and an incidence angle of 86 degr.ees. to determine reflectivity have generally This latter geometry represents the been accomplished subjectively. A rating standard tunnel or an instrument similar panel of 3 to 10 people usually view the to the ESNA Reflex-Photometer. Other markings at night and rate each material's states have built portable reflectivity on a scale of 1 to 10. The retroreflectometers (3) , but documentation procedure outlined under ASTM D-713 is has not generally been available •
. . . . use<L£requentJ-¥"•-·- -As .. 4.S-- the.=se. -w4.-t-h.- most; .. ··--·-· ---· ···--A-·-mueh· · -m<H�'e··-e-xpen.sci.-ve·-4.-ns·to-r-umeat-·-has-
subjective ratings, many variables can been developed by Gamma Scientific affcet the ebser--ver' s rat-i-ng. Paint Incorporated. 'l'he instrument is available stripes, in particular, are difficult to for purchase in the price range of $10,000 rate because almost indiscernible - $20,000. Specifications indicate that differences exist between most paints and the angle of incidence can be varied from bead types. In those cases, it would be 7 5 to 89 degrees and the angle of valuable to have an instrument which could divergence can be varied from 0.2 to 2.0 quantitatively measure and detect the degrees. No record of any practical small differences between the various application of this unit by a highway specimens. agency is available.
Some recent developments in The instrument used by the Kentucky instruments to measure pavement marking Department of Highways to quantitatively reflectivity have been reported in an measure reflectivity in the laboratory is evaluation report by the Federal Highway an ESNA Reflex-Photometer, manufactured by Administration (1) . The report documents the Elastic Stop-Nut Corporation of a study that had the objective to identify America (4) . The procedure employed in and evaluate instruments capable of the use of the ESNA Reflex-Photometer measuring retroreflectivity of pavement involves measurement of light intensity traffic stripes under dayl�gbt conditions inc1aent upon the mater�al to be tested in the field. Four instruments were and the reflected light from the material identified and evaluated. Two of those at the photo cell location. were manufactured in Europe and two others The optical system of the ESNA were developed in the United States, but Reflex-Photometer. is relatively simple. were not commercially available. All of Output from a lamp is directed through a the instruments had some capability of focusing lens coaxial with the photometer measuring retroreflectivity of pavement axis. Both the intensity of the light marking materials; however, the study beam and the divergence of the beam can be concluded that a new instrument varied by means of iris diaphragms. The incorporating some characteristics of each beam of light passes through an aperture of the tested instruments should be in the photo cell and strikes the test developed. specimen. The reflected beam is returned
Another report, by the Virginia to the photo cell, and its intensity is Highway and Transportation Research recorded.
-1-

This report describes the development of a portable retroreflectometer (PRR) . The objective was to build a PRR that could be used in the evaluation of various pavement marking materials.
DESCRIPTION OF PORTABLE RETROREFLECTOMETER (PRR)
The test PRR consists of a lamp that directs its light through a double convex collimating lens onto a mirror. The light is then reflected off the mirror (which is mounted at a 45-degree angle) and onto the material to be tested. An approximate 10-inch by 2-inch hole is cut into the bottom of the PRR to allow light to reach the test material. Reflected light from the specimen is then returned to a second Jllirrru::�!:hat:_rlired:a._.l:he __ heam ..... nLligh:Linto .. _. an iodide-type photo detector. The
--intens;L-ty Qf th�-ght is measu4"ed---an<l then displayed on a digital printout. A photograph of the interior of the PRR is shown in Figure 1. The PRR is approximately 25-1/2 inches long, 11-1/4 inches high, and 5-3/8 inches deep. The instrument is shown with the side cover removed and the lamp on; however, the open area was covered with plastic and the interior was filled with smoke in order to trace the light rays (the lamp was partially covered for this photograph to allow better tracing of the light rays) . A significant amount of the light beam does reach the reflective material. From the photograph, it is difficult to detect the light reflected from the sample and
-ba-ck onto the second mir rot. Even though this light is not clearly visible, it does return and is reflected off the second mirror into the photo detector. Light absorbing materials were placed inside the PRR to reduce the amount of internally reflected light. This allowed measurements on a nonreflective surface. to approach zero.
When field measurements are taken, a standard section of reflective tape is used for calibration (Figure 2) . Before each reading, the PRR is set to read 500 on the calibration tape. Although it is difficult to distinguish in the
photographs, a piece of foam weatherstrip tape was placed around the bottom edge of the PRR. This was necessary to prevent light from entering at the pavement. The foam conforms to a relatively smooth pavement surface; however, readings can not be taken when the pavement surface is very uneven.
A schematic diagram showing the optic arrangement of the PRR is presented in Figure 3. The angle of incidence (angle between incident light on illuminated area and the normal to the reflecting surface) is 86.8 degrees. The angle of the divergence (angle between incident light on illuminated area and the light being returned or the observer's line of sight) is 1. 9 degrees. A schematic diagram of the electrical circuitry of the PRR is presented in Figure 4.
--- - --- -The _____ tes.t.--�--ERR----- --was- - ---.cons.t.ructad-- ----�--�
primarily with existing materials so a east of the supplies used--was--------ne-t----available. However, it is estimated that the cost of purchasing the necessary supplies plus the cost of constructing the unit would be in the range of $1,000.
RELATIONSHIP BETWEEN PRR AND ESNA
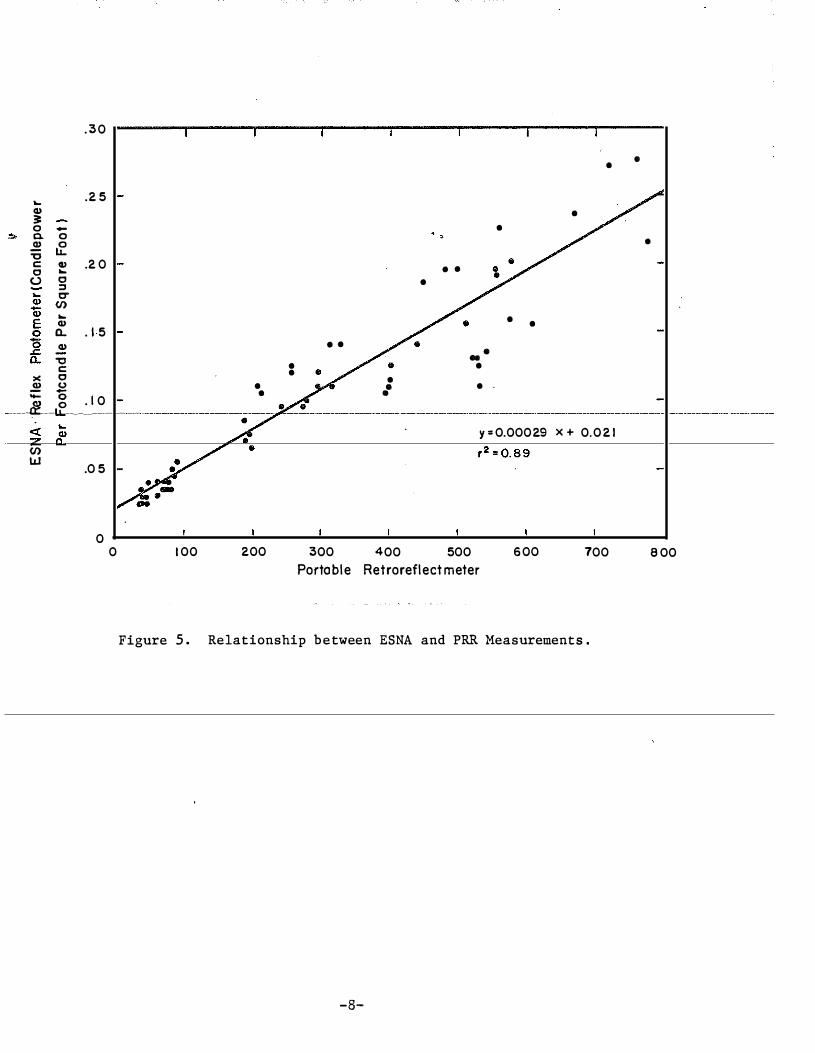
Since the readings from the PRR are dimensionless, it was necessary to relate the PRR reading to some measurement procedure which yields known quantities. The comparison measurement device selected was the ESNA Reflex-Photometer (ESNA) , which gives specific reflectivity in terms of candlepower per footcandle per square foot of material (4). The ESNA measurements were taken at an incidence angle of 86 degrees and a 0.5-degree divergence angle.
Samples taken during a study to evaluate various types of pavement tape were used to determine the relationship
(5) . In that study, samples of the tape were removed periodically from the highway for reflectivity measurements by the ESNA. Using all of those samples of worn tape along with samples of new tape enabled a wide range of reflectivity values to be included.
Before the tape samples could be
-2-

tested by the ESNA, they had to be placed on a plate approximately 9 inches by 3 inches. A total of 57 tape samples were included in the analysis. A summary of the sample reflectivity measurements from the ESNA and the PRR is given in Table 1. For the PRR data, one sample was used to calibrate before each measurement. Measurements were taken until a consistent average could be found.
A plot of the ESNA-versus-PRR measurements is given in Figure 5. Linear regression was used to find a best-fit line for the data. That line, along with the equation, is given in Figure 5. The coefficient of determination (r-squared) was 0.89, which shows a good relationship between the ESNA and PRR measurements. The relationship found was:
marking reflectivity and y = specific reflectivity (SR)
of marking in terms of candlepower per footcandle per square foot.
To effectively use the PRR to determine when a pavement marking becomes ineffective, the specific reflectivity level or PRR reading at which reflectivity becomes unacceptable must be known. Standard specifications are given for reflective type pavement striping tape
( 6) . However, those standards apply to initial reflectivity requirements as opposed to minimum SR values after the tape has been exposed to traffic. As a guide, minimum initial wet SR values of 0. 09 for white and 0. 08 for yellow tape are given.
y = 0. 00029 X + 0.021 (1) Tape samples with known specific in __ Jffiich __ y _= _ _E_S_NA___measnrement ___ _
tape sample, and _ m-- __ m_m ___ _reflect i vi t y_ 1 eve ls ___ and__J.'RR_r_eadings. __ we_r_e _______ _ _ _ _ _ ______ _
rated subjectively to estimate the minimum x = FRR measure of tape
sample. One additional step was necessary to
be able to take a PRR reading and translate it directly into a specific reflectivity measurement. The dimensions of the tape samples were not the same as the opening in the bottom of the PRR. The difference was such that the PRR measurements taken on the test samples had to be adjusted upward to account for the large amount of surface area exposed by the opening in the PRR. A series of measurements were conducted to relate readings taken with the full opening and with the opening covered to expose the same area as the tape samples. The following equation was found (with a coefficient of determination of 0.98) :
y = 0 • 88 X - 3 • 1 ( 2) in which y = measurement with opening
covered to represent tape sample, and
x = measurement with full opening.
Substituting this value for "y" from Equation 2 for "x" in Equation 1 yields an equation that relates a measurement -from the PRR in the field to a comparable ESNA measurement with known units:
y = 0,000255 X + Q,Q20 (3) in which x = PRR field measurement of
value It "as esti-��-lP!lRtlRC<----reading under 80 was unacceptable for white tape samples. A lower minimum should be applied to yellow stripes. Data taken with the PRR show that a yellow stripe reading will be about 75 percent that for a similar white stripe. Therefore, it was estimated that a PRR reading under 60 was unacceptable for yellow stripes.
CONSISTENCY OF MEASUREMENTS
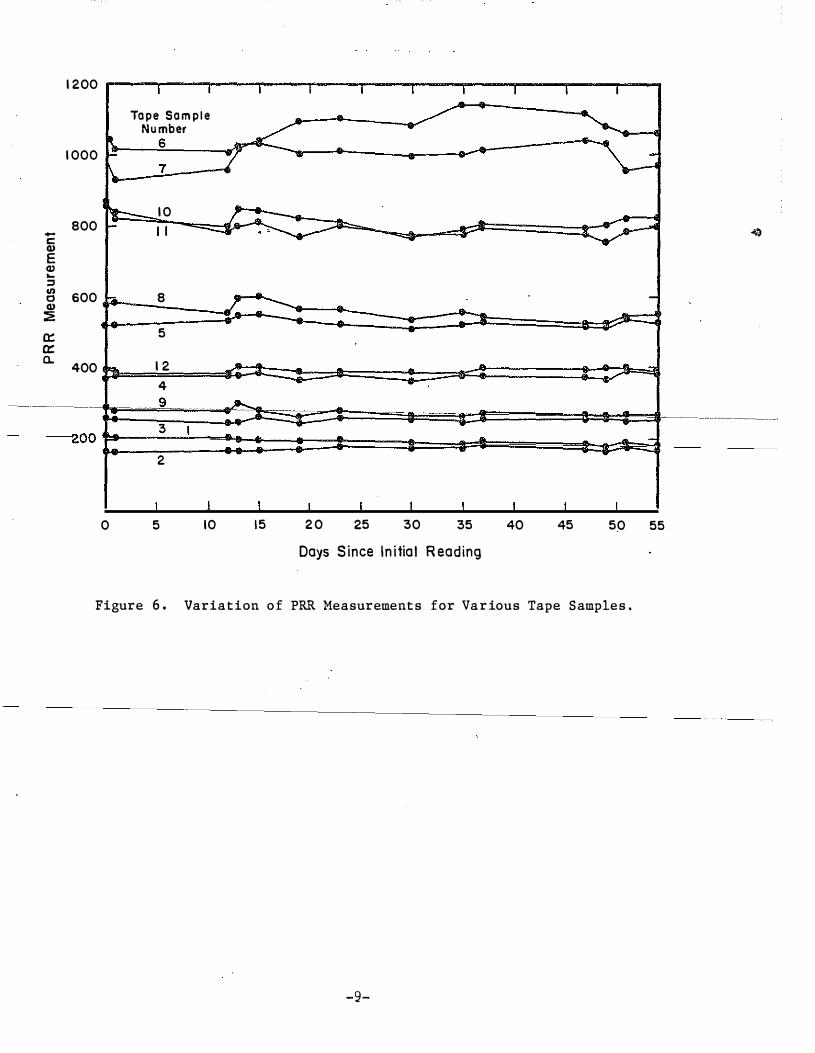
As a method of testing the consistency of data collected by the PRR, a series of 14 measurements were taken over a 54-day period on samples from various types of pavement tapes. Samples of 12 different tapes were used. Tapes that would give a wide range in reflectivity readings were used. A tabulation of the data is given in Table 2. Each number represents an average of at least three measurements. Measurements on each sample were taken each day until a consistent average was obtained. The tape samples were placed on a piece of plywood and measurements were taken periodically. This allowed a test of the consistency over time of measurements using the PRR since the reflectivity of the samples
-3-

would not change. A plot of the data given in Table 2
is shown in Figure 6. The variation, particularly for samples with lower readings, was small. It is significant to note that the relative order of the measurements taken on any given day remained very consistent. The order varied only for the tapes with the highest reflectivity measurements.
Measures of the consistency or disperion of the PRR measurements are given in Table 3. The range of data and standard deviation show that measurement consistency was adequate, although the variation tended to be larger for the more reflective tapes.
SUMMARY
RECOMMENDATIONS
The portable retroreflectometer, as currently constructed, is suitable for use as a means of measuring reflectivity of lane delineations in the field. However, results do not indicate it should be used as a complete replacement for subjective observations. Also, future modifications, with the objective of improving its consistency, are warranted.
1.
REFERENCES
"Evaluation of Retro Reflective Measurement Devices," Federal Highway Administration, Offices of Research and Development, Report No. FHWATS-81-213, June 1981.
���-�-�� � � m ______ 2_,�-�- Shepard, ����� _]'._� ___ ]2,_;_� __ _ :'Evalua tion -·�·�.f .. __ . �
A portable retroreflectometer (PRR) Portable Retroreflectometer for Use on was r'.OnRt:rnl".te.il tJit:h t'.hP objective of using it as a supplement or replacement for subjective ratings. The angles of incidence and divergence approximated those used in tests with the standard ESNA Reflex-Photometer (ESNA) . A good relationship was found between PRR measurements and specific reflectivity (SR) measurements taken with the ESNA. An equation relating PRR measurements to SR values was found along with an estimate of the point at which reflectivity becomes unacceptable. Tests showed the PRR gave reasonably consistent results, although an improvement could be made in this area. The PRR, as currently constructed, would be most effective when comparing various tyJ'eS of l'avemeat marking materials providing the measurements are taken in a short time period. Comparison of data taken several months or over a year apart becomes more difficult because of the problem of obtaining consistency in the measurements over long periods of time.
Pavement Markinli Materials_, .. Virginia Highway and Transportation Research Council, November 1981.
3. Michigan Department of Transportation, Research Notes, Testing and Research Division, Number 7, December 1979.
4. Rizenbergs, R. L. ; "Development of Specifications for Reflex-Reflective Materials," Research Report 2 98, Division of Research, Kentucky Department of Highways, October 1970.
S. Pigman, J. G. ; and Agent, K. R. ; "Evaluation of Pavement Tape as Lane Delineation," Report UKTRP-81-19, University of Kentucky Transportation Research Program, Report UKTRP-81-19, November 1981.
6. Standard Speeifieatians far Read and
-4-
Bridge Construction, Kentucky Department of Transportation, Bureau of Highways, 1979.

Figure 1. Photograph of Interior of Portable Retroreflectometer.
Figure 2. Field Measurement Using Portable Retroreflectometer .
-5-

F E
AE = 0.875 Inches CF = 0.375 Inches EB = 14.9 Inches FB = 16.9 Inches
Angle of Divergence (D)= G- H=3.17°-1.27° = 1.9°
Angle of Incidence = 90° - G = 86.8°
Figure 3. Schematic D iagram of Optic Arrangement.
-6-
c
Reflective Material

..
• 7 +Vin +Vo
Ro)'tllun .. ,,�
-vo •
•
Figure 4.
+i�V
.:r_- IO}'f �
- IS V .I.IOO,u.t �
_2.o40r
L.mmp W82
.I
5.6 K
2.·10
•••
-ISV �- _ ��- - � � --··""- ________ ___ .L ___ _
Schematic D iagram of Electrical C ircuitry.
-7 -
PWR + -
SW2
'rl- �----••
� ., 3: 0 0.
.2:! "C c: c (.)
-0 � ., � c :::1 tT
en � .,
a. .,
"'0 c: >< c .2:! <.>
.30
. 25
.2 0
. 15
• •
• •
••
•
• ..
• •
.. . •
•
•
• •
• •
'; g .10 �----0::�--1.1.--------�- �---
<( en w .05
0 0
y=0.00029 X+ 0.021
100 200 300 400 500 600 700 Portable Retroreflectmeter
Figure 5. Relationship between ESNA and PRR Measurements.
-8-
0
•
800
1200 I I
Tape Sample Number
6 1000 r
7 ,_
...... 10 800 - ,.:: II r:: .,
E ., ... :::> "' 600 0 ., :& 8
::E 0::: 5 0::: 0..
400 ... 12 4 9 ··�·-··-
3
I I
� .7
9
r� .... . "'· ......
.... J ..... -
•
�
.... �
I I
�-
··�-· � �·
I
_...
I I I
� -
...
�
-
---�·00 I ..... """
2
I I I 0 5 10 15
1 I I I 20 25 30 35
Days Since Initial Reading
I I 40 45
-..-
I 50 55
Figure 6. Variation of PRR Measurements for Various Tape Samples.
-9-
- �- -
�
---� -

TABLE 1. SUMMARY OF COMPARISON OF ESNA REFLEX-PHOTOMETER AND PORTABLE RETROREFLECTOMETER REFLECTIVITY MEASUREMENTS
REFLECTIVITY READING*
SAMPLE NUMBER DESCRIPTION
1 New Stamark Removable (White) 2 New Stamark Removable (Yellow) 3 New Stamark Removable (Yellow) 4 New Stamark Removable (White) 5 New Stamark Removable (White) 6 New Stamark (Regular)(White) 7 New Prismo Plastix HR-90 (White) 8 New Prismo Plastix HR-90 (White) 9 New Prismo Plastix HT-90 (White)
10 New Scotchlane (White) 11 New Scotchlane (White) 12 New Stamark Temporary (White) 13 New Stamark Temporary (White) 14 New Scotchlane (White)
�---1-s--�-----�-N�ew-Stama�k-ll:eg�u�a1:-E�Wfti-t-<:>j--�- -�- - - - - -
16 New Stamark Temporary (White) 17 used Stamark Regular (Whi-re-)
18 Used Stamark Regular (Edgeline)(White) 19 Used Scotchlane (White) 20 Used Scotchlane (White) 21 Used Stamark Regular (IVhite) 22 Used Stamark Regular (Laneline)(White) 23 Used Stamark Regular (Laneline)(White) 24 Used Stamark Regular (Centerline)(White) 25 Used Stamark Regular (White) 26 Used Stamark Regular (White) 27 Used Stamark Removable (Laneline)(White) 28 Used Stamark Removable (Laneline)(White) 29 Used Stamark Removable (Edgeline)(White) 30 Used Stamark Removable (Laneline)(White) 31 Used Stamark Removable (Laneline)(White) 32 Used Stamark (Centerline)(White) 33 Used Scotchlane (Edgeline)(White) 34 Used Scotchlane (Edgeline)(White) 35 Used Scotchlane (Edgeline)(IVhite) 36 Used Stamark Removable (White) 37 New Stamark Removable (Yellow) 38 New Stamark Removable (Yellow)
PORTABLE ESNA RETROREFLECTOMETER
.195 500
.125 403
.105 214
.195 483
.zoo 579
.085 189
.055 93
.050 86
.035 40
.275 762
.215 779
.135 542
.130 531
.225 561
.nLS --�- _ _ 19J _____ ----··-····-·-·-
.130 525
.040
.035 47
.270 721
.235 671
.030 48
.025 48
.030 64
.030 41
.025 38
.025 41
.040 80
.035 85
.065 201
.035 78
.035 73
.035 74
.120 260
.125 26fl .125 532 .045 88 .115 403 .110 402
* Specific reflectivity in terms of candlepower per footcandle per square foot of material at an incidence angle of 86 degrees and a 0.5 degree divergence angle.
-10:-
·-·--···--···-··"-""'�·-·� .. ·--·�

TABLE 1. SUMMARY OF COMPARISON OF ESNA REFLEX-PHOTOMETER AND PORTABLE RETROREFLECTOMETER REFLECTIVITY MEASUREHENTS (continued)
SAMPLE NUMBER DESCRIPTION
41 New Stamark Removable (Yellow) 42 New Scotchlane (Yellow) 43 New Scotchlane (Yellow) 44 New Scotchlane (Yellow) 45 Used Stamark Removable (White) 46 Used Stamark Removable (Laneline)(White) 47 Stamark Removable (Edgeline)(White) 49 Used Stamark Removable (Yellow) so Used Stamark Removable (Yellow) 51 Used Stamark Removable (Yellow) 52 Used Stamark Removable (White) 53 Used Stamark Removable (White) 57 Used Scotchlane (Yellow) 58 Used Scotchlane (Yellow)
REFLECTIVITY READING*
PORTABLE ESNA RETROREFLECTOMETER
.no 209
.195 555
.185 452
.190 559
.040 so
.040 73
.llO 298
.100 280
.095 276
.095 244
.no 319
.120 298
.140 314
.140 331 59---- - ----Use<i-Beo-t-eh±-ane-+Yel-lew-)----- --- ------------------ -- - - -o-L4Q_ _____ _ _ _ ___illi_L_ - --- - ---
61 Used Stamark Removable (Edgeline)(White) .070 192 � Scotchlane (Edgeline) (White) . 55 513
66 New Stamark Bisymmetric 1. 75 Grade (White) .155 609 67 New Stamark Bisymmetric 1. 75 Grade (White) .160 578
* Specific reflectivity in terms of candlepower per footcandle per square foot of material at an incidence angle of 86 degrees and a 0.5 degree divergence angle.
-11-
----·---·�·-··-

'ABLE 2. CONSISTENCY OF MEASUREMENTS
PORTABLE RETROREFLECTOMETER HEASUREHENT
TAPE DAYS SINCE FIRST READING :AMPLE 1Ul1BER 0 1 12 13 15 19 23 30 35 37
1 212 207 206 201 198 198 200 194 187 197 2 170 168 167 169 169 172 181 176 178 188 3 259 257 246 248 263 245 259 260 250 260 4 373 379 378 380 287 368 382 364 384 378 5 521 522 534 548 551 532 522 511 521 528 6 1057 1017 1005 1027 1033 1004 1010 996 1001 1013 7 995 928 957 1018 1036 1091 1098 1084 1142 1144 8 578 586 555 598 600 566 536 536 558 544 9 295 283 280 303 281 262 280 265 264 275
10 861 842 782 707 810 767 799 772 776 793 11 867 818 798 847 841 820 811 767 788 806 12 400 387 382 406 404 391 390 390 387 403
----·------·---·------·---··----·----·--·------·--·--·--·----·----· -- -- --- -- --- -- - - - -----·--·---·----
TABLE 3 . SUMMARY OF PRR MEASUREMENTS ON TAPE SAMPLES
TAPE SAMPLE STANDARD CONFIDENCE
NUMBER AVERAGE RANGE DEVIATION INTERVAL*
1 196 187-212 8.6 191-201
2 174 167-188 5.7 171-177
3 255 245-263 5.5 252-258
4 378 364-393 7.9 373-383
5 527 511-551 118 520-534
6 1011 954-1057 26.1 995-1027
7 1058 928-1144 62.6 1020-1096
8 559 524-600 23.9 545-573
9 276 264-303 11.7 269-283
10 793 754-861 27.8 776-810
11 814 767-867 24.8 799-829
12 395 382-406 7.2 391-399
* Two-sided 95-percent confidence interval. ** The standard deviation divided by the average.
-12.-
47 49 51 54
188 182 192 184 175 172 177 169 257 257 �3 252 374 366 393 383 514 512 536 527
1038 1029 954 967 1116 1078 1058 1060
524 523 543 551 270 265 272 267 775 754 783 796 793 802 822 821 397 402 400 394
- - -- - - - - - - -- - - -
COEFFICIENT OF VARIATION**
.044
.033
.022
.021
.022
.026
.059
.043
.042
.035
.030
.018
.... ·---·--·----·------·-