development of a rapid identification system for listeria ... · the genus listeria consists of six...
TRANSCRIPT
Institut für Mikrobiologie
Zentralinstitut für Ernährungs-und Lebensmittelforschung Weihenstephan
Technische Universität München
Development of a rapid identification system for Listeria
at the species, and Listeria monocytogenes at the serovar level
by Artificial Neural Network analysis of Fourier Transform
Infrared Spectra
Cecilia A. Rebuffo-Scheer
Vollständiger Abdruck der von der Fakultät Wissenschaftszentrum Weihenstephan für
Ernährung, Landnutzung und Umwelt der Technischen Universität München zur
Erlangung des akademischen Grades eines Doktors der Naturwissenschaften
(Dr. rer. nat.)
genehmigten Dissertation.
Vorsitzender Univ.-Prof. Dr. Dirk Haller
Prüfer der Dissertation 1. Univ.-Prof. Dr. Siegfried Scherer
2. Univ.-Prof. Dr. Dieter Naumann
Die Dissertation wurde am 17.01.2008 bei der Technischen Universität München
eingereicht und durch die Fakultät Wissenschaftszentrum Weihenstephan für
Ernährung, Landnutzung und Umwelt am ……….. angenommen.

II
Acknowledgement
The PhD thesis presented here has been accomplished at the Institute of Microbiology, ZIEL
Weihenstephan, Technical University of Munich under supervision of Prof. Dr. Siegfried
Scherer.
My most profound thank you goes to Prof. Scherer who gave me the possibility to write my
PhD thesis at the institute he is heading. It was a pleasure for me to work in my project under
his excellent supervision. I also want to thank him for having dedicated so much of his time to
me, especially for discussions, which I really enjoyed and which encouraged me a lot during
my work. I have learnt so much from him.
I am very grateful to Prof. Dieter Naumann from the Robert Koch Institute, Berlin, and his co-
worker Maren Stämmler for introducing me to the FTIR spectroscopy method. I especially
thank Prof. Naumann for his helpful suggestions regarding my project and for accepting the
co-chair of the examination committee. This really honours me.
I would like to thank the “Vereinigung der Förderer und Freunde des Forschungszentrums für
Milch und Lebensmittel Weihenstephan e.V.” for their financial support throughout my work.
My project was supported, in part, by the FEI (Forschungskreis der Ernährungsindustrie e. V.,
Bonn), the AiF (Arbeitskreis für industrielle Forschung) and the German Ministry of
Economics and Technology.
I thank Dr. Jürgen Schmitt for kindly introducing me to the NeuroDeveloperTM software and
for assisting me in designing the ANN.
Special thanks goes to Gertrud Huit and Angela Felsl for supplying me with strains from the
Weihenstephan collection and to those who kindly provided me with strains from their
collections especially Prof. H. Hof from Mannheim.
The constructive critics of Dr. H. Seiler and the helpful assistance of Lisa Rieder were greatly
appreciated.
I would like to thank Dr. Mareike Wenning for our interesting scientific discussions and the
FTIR group for the pleasant atmosphere in the lab.
I thank all my colleagues at the institute for the nice working atmosphere and for the kind
moments during the time of my work at the institute.
Thanks goes to Dr. Alejandra Bosch and Prof. Dr. Osvaldo Yantorno for their support from
the other site of the ocean.
I would like to thank my husband Michael Scheer for his immense support and
encouragement all the time. I thank my parents for their constant encouragement throughout
my life.
III
The present thesis is based on the following reviewed and accepted for publication papers or
submitted manuscripts.
Rebuffo-Scheer, C. A., J. Dietrich, M. Wenning and S. Scherer. 2007. Identification of
five Listeria species based on infrared spectra (FTIR) using macro-samples is superior over a
micro-sample approach.
This paper represents chapter 2 of this thesis and has been submitted for publication. The
major part of the experimental work was perfomed or supervised by myself. Jochen Dietrich
carried out part of the experimental work. I wrote the major part of the publication.
Rebuffo, C. A., J. Schmitt, M. Wenning, F. von Stetten, and S. Scherer. 2006. Reliable
and Rapid Identification of Listeria monocytogenes and Listeria Species by Artificial Neural
Network-Based Fourier Transform Infrared Spectroscopy. Appl. Environ. Microbiol.
72:994-1000.
This paper represents chapter 3 of this thesis and constitutes the core of my research. It has
been published in Applied Environmental Microbiology, a Journal of the American Society
for Microbiology (ASM). The major part of the experimental work was performed and
supervised by myself while Felix von Stetten sequenciated the strains and Jürgen Schmitt
assisted me designing the ANN. I wrote the main part of the publication.
Rebuffo-Scheer, C. A., J. Schmitt, and S. Scherer. 2007. Differentiation of Listeria
monocytogenes Serovars by using Artificial Neural Network Analysis of Fourier-Transformed
Infrared Spectra. Appl. Environ. Microbiol. 73:1036-1040.
This paper represents chapter 4 of this thesis and has been published in Applied
Environmental Microbiology, a journal of the ASM. I carried out the experimental work and
wrote the major part of the publication.

Table of contents
IV
Table of contents
Acknowledgement ................................................................................................................... II
Table of contents.....................................................................................................................IV
Table of Tables ..................................................................................................................... VII
Table of Figures...................................................................................................................VIII
Symbols and abbreviations....................................................................................................IX
Preface .................................................................................................................................... X
Summary .................................................................................................................................XI
Zusammenfassung...............................................................................................................XIII
1 General Introduction.................................................................................................. 1
1.1 General characteristics of the genus Listeria ................................................................ 1
1.2 Differentiation of Listeria at species level and detection of the human pathogen
L .monocytogenes ....................................................................................................................... 1
1.3 Serovars of Listeria....................................................................................................... 4
1.4 Serovar differentiation of L. monocytogenes strains .................................................... 5
1.5 FTIR spectroscopy of microorganisms......................................................................... 6
1.6 Methods of analysis of the FTIR data of microorganisms............................................ 7
Aim and achievement of the work ........................................................................................ 10
2 Identification of five Listeria species based on infrared spectra (FTIR) using
macro-samples is superior over a micro-sample approach .................................. 12
2.1 Summary..................................................................................................................... 12
2.2 Introduction................................................................................................................. 12
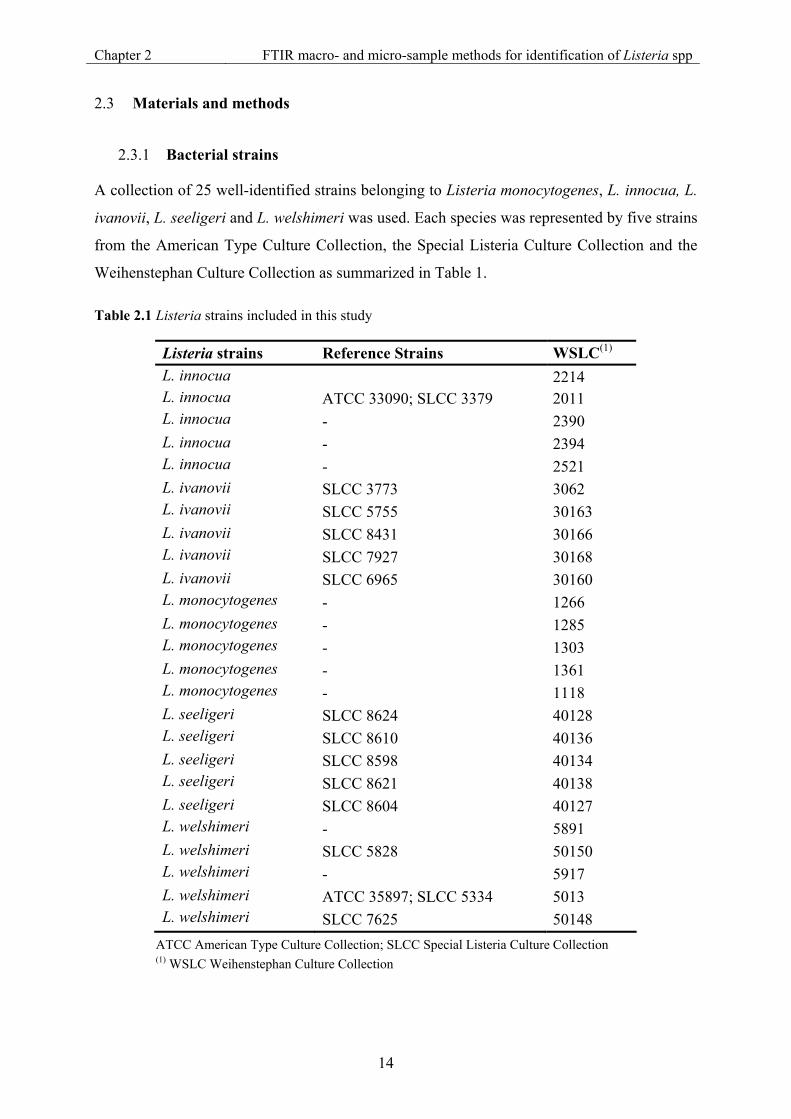
2.3 Materials and methods ................................................................................................ 14
2.3.1 Bacterial strains .......................................................................................................... 14
2.3.2 Sample preparation and growth conditions ................................................................ 15

Table of contents
V
2.3.3 Recording of spectra and data evaluation................................................................... 15
2.3.4 Heterogeneity of the microcolonies............................................................................ 16
2.3.5 Variation of the number of strains per species in the library...................................... 16
2.4 Results and discussion ................................................................................................ 17
2.5 Conclusions................................................................................................................. 25
2.6 Acknowledgement ...................................................................................................... 25
3 Reliable and Rapid Identification of Listeria monocytogenes and Listeria Species
by Artificial Neural Network-Based Fourier Transform Infrared Spectroscopy
.................................................................................................................................... 26
3.1 Summary..................................................................................................................... 26
3.2 Introduction................................................................................................................. 26
3.3 Materials and Methods ............................................................................................... 28
3.3.1 Bacterial strains .......................................................................................................... 28
3.3.2 Reference strain set: Sequence analysis of the iap and thy gene ................................ 28
3.3.3 Identification of the validation strain set isolates ....................................................... 30
3.3.4 Measurement of FT-IR spectra ................................................................................... 30
3.3.5 Univariate FT-IR analysis........................................................................................... 31
3.3.6 Artificial Neural Network based FT-IR identification ............................................... 31
3.3.7 Validation of FT-IR identification procedures ........................................................... 32
3.4 Results and discussion ................................................................................................ 33
3.4.1 Modular architecture of the Artificial Neural Network .............................................. 33
3.4.2 Validation of the spectral reference databases............................................................ 34
3.4.3 Influence of the number of the reference strains on the identification success .......... 38
3.4.4 Comparison of API and FT-IR/ANN based Listeria identification............................ 39
3.5 Acknowledgement ...................................................................................................... 41
4 Differentiation of Listeria monocytogenes serovars by using Artificial Neural
Network Analysis of Fourier-Transformed Infrared Spectra.............................. 42
4.1 Summary..................................................................................................................... 42

Table of contents
VI
4.2 Introduction................................................................................................................. 42
4.3 FTIR spectra of Listeria monocytogenes reflect serogroup and serovar specific markers ....................................................................................................................... 44
4.4 Construction and optimization of the Artificial Neuronal Nets ................................. 46
4.5 Validation of FTIR based serovar differentiation....................................................... 47
4.6 Comparison of FTIR and PCR based serovar differentiation..................................... 49
4.7 Conclusion .................................................................................................................. 50
4.8 Acknowledgments ...................................................................................................... 50
5 General conclusions .................................................................................................. 51
6 References.................................................................................................................. 53
7 Appendixes ................................................................................................................ 64
7.1 Appendix I: List of reference strains for the FTIR database for Listeria species....... 64
7.2 Appendix II: List of strains for the external validation for Listeria species............... 70
7.3 Appendix III: List of reference strains for the FTIR database for Listeria monocytogenes serovar ............................................................................................... 76
7.4 Appendix IV: List of strains for the external validation for Listeria monocyogenes serovar......................................................................................................................... 79
Curriculum Vitae ................................................................................................................... 83

Table of Tables
VII
Table of Tables
Page
Table 1.1 Literature overview: Comparison of identification methods for food,
environmental, and clinical for Listeria spp............................................................. 3
Table 1.2 Compositions of somatic (O) and flagellar (H) antigens in Listeria serotypes ......... 4
Table 2.1 Listeria strains used to compare the FTIR micro- and macro-sample methods ...... 14
Table 2.2 Correct identification of Listeria species by FTIR micro- and macro-sample
methods................................................................................................................... 18
Table 3.1 Internal validation of the Listeria species infrared spectral reference database...... 36
Table 3.2 External validation of the identification potential of univariate FT-IR, ANN
and API using 277 Listeria strains not included in the reference dataset ............... 37
Table 3.3 Comparison of the Sensitivity, Specificity and Accuracy of ANN and API
identification procedures. ........................................................................................ 40
Table 4.1 Internal validation of the Listeria serovar infrared spectral reference database...... 48
Table 4.2 External validation of the infrared spectral reference database for Listeria
monocytogenes serovar identification ..................................................................... 49
Table of Figures
VIII
Table of Figures
Page
Fig. 2.1 Typical first derivative spectra of five Listeria species.............................................. 17
Fig. 2.2 First derivative of the average spectra (µ), and average ± standard deviation (µ ± σ)
spectra.. ....................................................................................................................... 19
Fig. 2.3 Spectral heterogeneity within two different microcolonies of L. monocytogenes
WSLC 1929 (A1) and L. seeligeri WSLC 40134 (A2). ............................................... 21
Fig. 2.4 Spectral heterogeneity expressed as spectral distance (SD) versus size of the
microcolony for different Listeria species.................................................................. 22
Fig. 2.5 Identification success depends on the number of strains per species in the library ... 24
Fig. 3.1 First derivative of a Listeria FTIR spectrum. The regions of the infrared spectra
contributing most significantly to the differentiation of the five Listeria species...... 32
Fig. 3.2 (a) Hierarchical cluster analysis of the first derivative of 243 Listeria spectra included
in the reference data set. (b) Architecture of the neural network for the identification
of Listeria species. ...................................................................................................... 34
Fig. 3.3 Comparison of the external validation of the ANN model using three different
reference data sets including 100, 171, and 243 strains.............................................. 39
Fig. 4.1 Typical first derivatives of infrared spectra of 12 Listeria monocytogenes serovars. 44
Fig. 4.2 (A) Hierarchical cluster analysis of the first derivative of 106 L. monocytogenes
strains belonging to 12 serovars, and included in the reference dataset. (B) Artificial
Neural Network classification scheme for the discrimination of serogroups and
serovars. ...................................................................................................................... 46
Symbols and abbreviations
IX
Symbols and abbreviations
ANN Artificial Neural Network
API-Listeria Analytical Profile Index of Listeria
ATCC American Type Culture Collection
BHI Brain Heart Infusion medium
CAMP Christie–Atkins–Munch–Petersen test
DNA Deoxyribonucleic Acid
ELISA Enzyme Linked Immunosorbent Assay
ELFA Enzyme Linked Fluorescent Assay
FTIR Fourier Transform Infrared Spectroscopy
Macro-samples Fourier Transform Infrared macrospectroscopy method
Micro-samples Fourier Transform Infrared microspectroscopy method
HCA Hierarchical Cluster Analysis
iap gene invasive associated proteins
IR Infrared
L. Listeria LDA Linear Discriminant Analysis
L. m. Listeria monocytogenes MIR Mid-Infrared spectral Region
PCA Principal Component Analysis
PCR Polymerase Chain Reaction
SLCC Special Listeria Culture Collection
spp species
subsp. subspecies
thy gene thymidylate synthase gene
TSA Tryptone Soy Agar
WSLC Weihenstephan Culture Collection
Preface
X
Preface
The genus Listeria consists of six different species: Listeria monocytogenes, L. innocua, L.
ivanovii, L. seeligeri, L. welshimeri and L. grayi of which L. monocytogenes is the species that
has been involved in 99% of all human listeriosis cases caused by consumption of
contaminated food products (Mead et al. 1999). The ubiquity of Listeria enables them to enter
the food-processing environment and food chain. Their ability to grow under extreme
conditions (refrigeration temperature, low pH, high salt concentration) increases the risk of
food contamination. Although Listeria have been less frequently identified compared to other
food-borne diseases they account for the majority of death of any food-borne pathogen
(Lynch et al. 2006) resulting in a high mortality rate of about 30%. This makes L.
monocytogenes a serious human pathogen (Mead et al. 1999).
Usually, the presence of any Listeria species in food is an indicator of poor hygiene in the
food production chain and reflects the potential risk of contamination with L. monocytogenes
strains. Therefore, during the last decade interest has grown to develop high discriminatory
methods for species to be used in the food industry in order to create an effective control
strategy. Although several methods have been proposed, they are still of limited potential to
routine laboratories incorporating high costs, complexity and unreliable differentiation of all
species.
Fourier Transform Infrared Spectroscopy (FTIR) is a physicoquemical method that
fingerprints the whole microbial cells allowing their differentiation at different taxonomic
levels with high-resolution power (Helm et al. 1991a). One advantage of this technique is the
use of extensive reference libraries containing spectra from well-identified microbes which,
combined with adequate computer data processing systems, such as Hierarchical Cluster
Analysis and Artificial Neural Network (ANN), enables a rapid and semi automated
identification of unknown strains.
In the present work, a classification system (Listeria database) based on FTIR combined with
ANN which integrates the differentiation of Listeria at species (chapter 3) and L.
monocytogenes at subspecies (serovar) level (chapter 4) has been established. Therefore,
biochemical, microbiological, molecular biological, immunological and physicoquemical
methods were applied. A detailed study and strict standardization of the parameters which
influence the differentiation of Listeria by FTIR was carried out (chapter 2). The construction,
optimization as well as the validation of the Listeria database is extensively described and
their high potential in the routine laboratory is discussed.

Summary
XI
Summary
Fourier Transform Infrared Spectroscopy combined with extensive reference microbial
databases is advantageous for the routine identification of microorganisms compared with
conventionally available methods. Although a number of studies have used FTIR
spectroscopy to identify microbes, the extraction of complex pattern information from the
microbial infrared spectra remains difficult when a large amount of data has to be analysed.
Therefore, the successful in the identification of microorganisms using this computer-based
method requires not only the use of comprehensive reference spectral databases but also
effective data-processing methods capable of extracting the subtle discriminant information
"encoded” in the spectra.
The present thesis comprises the application of the FTIR spectroscopy to (i) decide, by
comparative analysis, between two different vibrational spectroscopic techniques, FTIR-
macrospectroscopy (further on called macro-sample) and FTIR-microspectroscopy (further on
called micro-sample), which of both is the most convenient method to apply for the
differentiation of Listeria at species level; (ii) establish, optimize and validate a new
classification system for Listeria at the species level using the pattern recognition and
supervised method known as Artificial Neural Network (ANN) analysis. Moreover, their
performance has been compared to univariate analysis and the standard API identification
system for Listeria, and (iii) develop an ANN based FTIR subnet in order to additionally
identify L. monocytogenes serogroups and serovars.
(i) The first part of this work was aimed to compare the FTIR macro- and micro-sample
methods when used for the identification of Listeria species. For this purpose and once the
growth and measurement conditions were optimized two model spectral databases, the one
obtained with FTIR macro-sample and the other with the FTIR-micro-sample technique, were
created using 25 well-identified strains of Listeria monocytogenes, L. innocua, L. ivanovii, L.
seeligeri, and L. welshimeri. The identification capacity at the species level of these model
libraries was then evaluated at the species level in an internal validation. Results showed
higher correct identification values for the macro-sample (92.8%) than for the micro-sample
(79.2%) model. Moreover, the worst performance of the micro-sample model was yielded
with the species L. innocua, L. ivanovii and L. monocytogenes in part due to the influence of
the spectral heterogeneity of microcolonies as well as due to the insufficient discrimination
features expressed in exponential growth cells in the microcolony. Thus, the optimal
performance in respect to identification accuracy was achieved by the macro-sample model.
Summary
XII
(ii) Based on the results from the first part of this work, FTIR- macrospectroscopy was
applied for the construction of a new classification system for Listeria at the species level
based on a comprehensive reference spectral database including 243 well-defined reference
strains of Listeria monocytogenes, L. innocua, L. ivanovii, L. seeligeri, and L. welshimeri.
Two different analysis models, the multivariate ANN- and univariate-based FTIR, were
developed using the same reference data set of 243 strains. After optimising the parameters
for data analysis, the potential of these two models was evaluated in an external validation
procedure using a data set of 277 isolates not included in the reference database. The
univariate FTIR analysis model allowed a correct identification of 85.2% of all strains and
93% of the L. monocytogenes strains. Thereby the use of the ANN-based analysis
significantly enhanced the differentiation success to 96% for all Listeria species including a
success rate of 99.2% for L. monocytogenes identification. Besides this, the 277 test isolates
were also identified by the standard phenotypical API Listeria system. This commercial kit
was able to identify 88% of all strains and 93% of L. monocytogenes strains. These results
demonstrate that ANN-based FTIR identification of Listeria species is the superior method.
Starting from a pure culture, this technique allows the cost-efficient and rapid identification of
Listeria species within 25 h and is suitable for the use in a routine food microbiological
laboratory.
(iii) Furthermore, FTIR spectroscopy combined with ANN was also applied to design a
classification system for the differentiation between 12 serovars of the pathogen L.
monocytogenes using a database of 106 well-defined strains. The validation of the
classification system was performed using a test set of 166 L. monocytogenes isolates. This
yielded into a 98.8% correct identification rate at serogroup and a 91.6% at the serovar level.
Importantly, 40 out of 41 potentially epidemic serovar 4b strains were unambiguously
identified. The comparison of the FTIR- and PCR-based serovar differentiation method
indicated that the former is superior for serogroup as well as for serovar determination. This
part of the work clearly proves the high potential of the ANN based FTIR technique to
discriminate L. monocytogenes to species, serogroup and serovar level. The FTIR technique
may be further used as a tool to gain additional information on the pathogenic potential of
isolates located in the food-processing chain.
Finally, the integration of both, the Listeria species and serovars classification system offers
the possibility to simultaneously identify Listeria at species level, L. monocytogenes at
serogroup and serovar level in a single step by simply measuring an infrared spectrum of an
unknown isolate.

Zusammenfassung
XIII
Zusammenfassung
Die Fourier Transform Infrarot Spektroskopie (FTIR), in Verbindung mit vollständigen
mikrobiellen Referenzdatenbanken, ist für die Routineidentifizierung von Mikroorganismen
den herkömmlichen Methoden überlegen.
Obwohl in einigen Studien die FTIR Methode zur Identifizierung von Mikroben verwendet
wurde ist die Extrahierung komplexer Musterinformationen von mikrobiellen Infrarotspektren
schwierig wenn dafür ein großer Datensatz analysiert werden muss.
Demnach benötigt es zur erfolgreichen Identifizierung von Mikroorganismen, unter
Verwendung der komputerbasierten FTIR Methode, nicht nur umfangreiche
Referenzdatenbanken sonder auch Datenverarbeitungsmethoden, die dazu fähig sind auch
feine Informationen aus den Spektren zu extrahieren.
Thema der vorliegenden Doktorarbeit war die Anwendung der FTIR Spektroskopie um (i),
unter Durchführung einer komparativen Analyse, zu analysieren welche der beiden
schwingenden spektroskopischen Methoden, die FTIR-Makrospektroskopie (im Weiteren
Makro-Probe genannt) oder die FTIR-Mikrospektroskopie (im Weiteren Mikro-Probe
genannt), die bevorzugte Methode zur Differenzierung von Listerien auf Speziesebene ist
sowie um (ii) ein neues Klassifizierungssystem, unter Verwendung einer pattern recognition
Überwachungsmethode, der Künstlichen Neuronalen Netze (KNN) Analyse, für Listerien auf
Speziesebene zu entwickeln, zu optimieren sowie zu validieren. Des Weiteren wurde die
Leistungsfähigkeit der FTIR Methode, unter Verwendung der KNN Analysetechnik, mit der
univariaten Analysemethode sowie der Standard API Differenzierungsmethode für Listerien
verglichen sowie (iii) ein zusätzliches KNN, basierend auf FTIR entwickelt um L.
monocytogenes Serogruppen sowie Serovaren zu identifizieren.
(i) Der erste Teil dieser Arbeit diente dem Vergleich der Makro- und Mikro-Probemethode,
die zur Identifizierung von Listerien verwendet wurden. Sobald die Wachstums- und
Messkonditionen erfüllt waren, wurden für diesen Zweck zwei Modelspektraldatenbanken
kreiert, eine unter Verwendung der FTIR-Makro- und eine andere unter Verwendung der
FTIR-Mikro-Probemethode. Bei beiden Methoden wurden 25 gut identifizierte Stämme der
Arten Listerien monocytogenes, L. innocua, L. ivanovii, L. seeligeri und L. welshimeri
verwendet. Die Identifizierungsfähigkeit dieser Modelbibliotheken, auf Speziesebene, wurde
in einer internen Validierung bestimmt. Der Vergleich der Ergebnisse erwies höhere korrekte
Identifizierungswerte für die Makro- (92.8%) als für die Mikro-Probemethode (79.2%). Des
Weiteren wurden die schlechtesten Ergebnisse der Mikro-Probemethode in Verbindung mit
Zusammenfassung
XIV
den Spezies, L. innocua, L. ivanovii und L. monocytogenes, erzielt was wiederum sowol auf
die starke Beeinflussung von der Kolonienheterogenität und deren Diskriminierung als auch
auf die wenniger ausgeprägten Diskriminierunsmerkmale der Mikrokolonienzellen in
Wachstumphase basierte. Demnach ist die Makro-Probe die leistungsstärkere Methode.
(ii) Basierend auf den Ergebnissen des ersten Teils dieser Arbeit wurde die FTIR
Makrospektroskopiemethode angewendet um ein Klassifizierungssystem für Listerien auf
Speziesebene zu entwerfen. Grundlage dessen wurde eine komplexe Spektraldatenbank,
welche 243 gut definierte Stämme von Listerien monocytogenes, L. innocua, L. ivanovii, L.
seeligeri sowie L. welshimeri enthielt. Zwei Modelle, das multivariate KNN sowie das
univariate FTIR Model, wurden unter Anwendung des gleichen Referenzdatensatzes von 243
Stämmen, entwickelt. Nachdem die Parameter für die Datenanalyse optimiert waren wurde
das Potential beider Modelle bewertet. Dies geschah in Form eines externen
Validierungsverfahrens unter Anwendung eines Datensatzes von 277 Isolaten, welche nicht
Bestandteil der Referenzdatenbank waren. Das univariate FTIR Analysemodel ermöglichte
eine Identifizierung von 85,2% aller Stämme sowie 93% aller L. monocytogenes Stämme.
Unter Anwendung der KNN verbesserte sich die Differenzierungsrate beträchtlich auf 96%
aller Listerienarten. Die Identifizierungsrate bei den L. monocytogenes Stämmen erhöhte sich
sogar auf 99,2%. Die 277 Testisolate wurden ebenfalls von dem standardphänotypischen API
Listerien System identifiziert, welches 88% aller Stämme sowie 93% aller L. monocytogenes
Stämme identifizierte. Anhand dieser Ergebnisse zeigte sich, dass die KNN, basierend auf
FTIR, die überlegende Methode zur Identifizierung von Listerien ist. Diese Methode
ermöglicht eine kostengünstige- sowie schnelle Identifizierung von Listerien, innerhalb von
25 h basierend auf Reinkulturen, und ist demnach zur Anwendung in der Routine von
Lebensmittelmikrobiologielabors geeignet.
(iii) Des Weiteren wurde die FTIR Spektroskopie, in Verbindung mit KNN, auch für die
Gestaltung eines Klassifizierungssystems zur Differenzierung zwischen 12 Serovaren der
pathogenen L. monocytogenes verwendet. Diese basierten auf eine Datenbank von 106, gut
definierten, Stämme. Die Validierung des Klassifizierungssystems wurde unter Anwendung
eines Testsets bestehend aus 166 L. monocytogenes Isolaten durchgeführt. Diese ergab eine
korrekte Identifizierung von 98,8% auf Serogruppen- sowie 91,6% auf Serovarebene. Hierbei
gilt es zu unterstreichen, dass von 41 potentiel epidemienverursachender Stämme der Serovar
4b 40 Stämme richtig identifiziert wurden. Der Vergleich der FTIR- mit der PCR Methode
zeigte, dass die FTIR Methode der PCR Methode sowie in der Identifizierung der
Serogruppen als auch der Serovaren überlegen ist. Dieser Teil der Arbeit bestätigt das hohe

Zusammenfassung
XV
Potential der KNN, basierend auf FTIR, zur Identifizierung von L. monocytogenes auf
Spezies-, Serogruppen- und Serovarebene. Eine weitere Anwendung könnte die FTIR
Methode in der Lebensmittelindustrie finden wo sie als Instrument zur Identifizierung
pathogener Isolate dienen kann.
Basierend auf der Messung eines einzelnen Spektrums der unbekannten Isolate bietet die
Integration des Listerien Spezies- und des Serovarklassifizierungssystems die Möglichkeit,
zur gleichen Zeit, in einem Vorgang, Listerien auf Speziesebene sowie L. monocytogenes auf
Serogruppen- und Serovarebene zu identifizieren.

Chapter 1 Introduction
1
1 General Introduction
1.1 General characteristics of the genus Listeria
The genus Listeria comprises six species: Listeria monocytogenes, L. innocua, L. ivanovii, L.
seeligeri, L. welshimeri and L. grayi (Rocourt 1999). Two subspecies of L. ivanovii have been
described: L. ivanovii subsp. ivanovii and L. ivanovii subsp. londoniensis (Rocourt 1999). L.
murrayi, which was once a separate species in the genus Listeria, is now included in the
species L. grayi (Rocourt et al. 1992). All of these species are widespread in the environment
though only L. monocytogenes is considered to be a significant human and animal pathogen.
In very rare cases human infections have been reported due to L. ivanovii and L. seeligeri
(Rocourt 1986, Snapir et al. 2006).
Listeria species are phenotypical and genetically closely related bacteria which make their
differentiation very difficult. This drawback reflects a potential risk for persistent
contamination of processing facilities with the pathogen L. monocytogenes since it can
withstand a variety of environmental stresses including low temperatures (4°C) as well as
extreme pH and osmolarity conditions.
Moreover, L. monocytogenes has recently been associated with a wide variety of foods (e.g.
hot dogs (Donnelly 2001), fresh meats and fish, raw vegetables, diary products, including
cheeses, butter, and milk (Jemmi and Stephan 2006).
1.2 Differentiation of Listeria at species level and detection of the human pathogen
L .monocytogenes
L. monocytogenes is a significant public health threat and among all pathogens the bacterium
responsible for the majority of death and food recalls as reported by the Centre of Disease
Control in Atlanta last year covering all foodborne-disease outbreaks in the United States
(Lynch et al. 2006). The disease caused by this bacterium, which is named listeriosis, is
acquired by ingesting contaminated food products and does mainly affect
immunocrompromised persons, pregnant women and newborns. The ability of the bacterium
to grow under extreme conditions increases the risk of food contamination. Moreover, L.
monocytogenes has recently received increasing attention not only due to large–scale
outbreaks associated with a wide variety of foods, but also due to the increasing occurrence of
international foodborne disease outbreaks related to world-wide distribution of long-life
products raising new microbial safety problems and demands. Consequently, the monitoring

Chapter 1 Introduction
2
of food-production at all levels will contribute to detect potentially pathogenic strains and will
therefore lead to decreased contamination in the food supply.
Many of the official methods used to identify Listeria are regulated by international agencies,
such as the Food and Drug Administration (FDA), cannot differentiate between Listeria
species. The lack of this capacity is critical in particular from the perspective of food hygiene
since the presence of non-pathogenic species has frequently been found to be a marker of a
subsequent L. monocytogenes contamination in diary plants (Loessner 2002, Rudolf and
Scherer 2001). Furthermore, an unreliable control of Listeria may produce a risk of persistent
contamination in the food processing environment for an extended period of time (Tompkin
2002). Therefore, a rapid and reliable differentiation of L. monocytogenes from the other
species of the genus is necessary for the food industry in order to adopt an effective quality
assurance strategy.
A comprehensive review of the methods developed in the last two decades for the
identification and typing of Listeria and L. monocytogenes in food and environmental samples
is summarized in Table 1.1. This table shows that expensive, time-consuming and laborious
biochemical and phenotypical standard methods, i.e. the sugar fermentation and CAMP test or
commercial systems which are unable to differentiate between species, such as chromogenic
media, are often used. The review also shows that rapid molecular and immunological
procedures have been developed, though they are limited to the detection of the genus or the
pathogen L. monocytogenes only. Furthermore, sensitive microarrays have been proposed.
However, they are of limited potential for routine laboratories due to high costs.
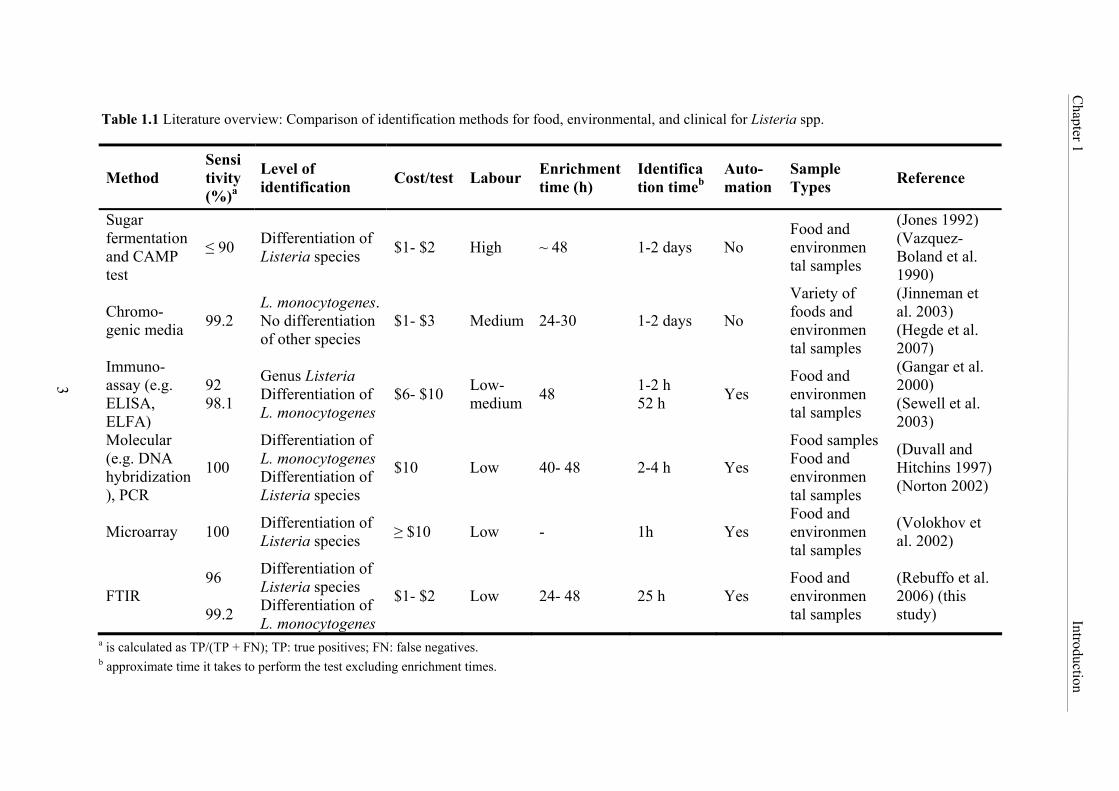
Table 1.1 Literature overview: Comparison of identification methods for food, environmental, and clinical for Listeria spp.
Method Sensi tivity (%)a
Level of identification Cost/test Labour Enrichment
time (h) Identifica tion timeb
Auto-mation
Sample Types Reference
Sugar fermentation and CAMP test
≤ 90 Differentiation of Listeria species $1- $2 High ~ 48 1-2 days No
Food and environmen tal samples
(Jones 1992) (Vazquez-Boland et al. 1990)
Chromo-genic media 99.2
L. monocytogenes. No differentiation of other species
$1- $3 Medium 24-30 1-2 days No
Variety of foods and environmen tal samples
(Jinneman et al. 2003) (Hegde et al. 2007)
Immuno-assay (e.g. ELISA, ELFA)
92 98.1
Genus Listeria Differentiation of L. monocytogenes
$6- $10 Low- medium 48 1-2 h
52 h Yes Food and environmen tal samples
(Gangar et al. 2000) (Sewell et al. 2003)
Molecular (e.g. DNA hybridization), PCR
100
Differentiation of L. monocytogenes Differentiation of Listeria species
$10 Low 40- 48 2-4 h Yes
Food samples Food and environmen tal samples
(Duvall and Hitchins 1997) (Norton 2002)
Microarray 100 Differentiation of Listeria species ≥ $10 Low - 1h Yes
Food and environmen tal samples
(Volokhov et al. 2002)
FTIR 96 99.2
Differentiation of Listeria species Differentiation of L. monocytogenes
$1- $2 Low 24- 48 25 h Yes Food and environmen tal samples
(Rebuffo et al. 2006) (this study)
a is calculated as TP/(TP + FN); TP: true positives; FN: false negatives. b approximate time it takes to perform the test excluding enrichment times.
Chapter 1 Introduction
3

Chapter 1 Introduction
4
1.3 Serovars of Listeria
The first studies on the chemical structure of the Listeria cell walls undertaken by Ullmann
and Cameron (1969) revealed the presence of specific antigenic structures (O- and H-
antigens) (Ullmann and Cameron 1969) which were later biochemically described by Fiedler
et al. (Fiedler 1984). More recent studies found out that the O antigenic structures are defined
by the nature and quantitative ratios of sugars substituents of the teichoic acid. Thus, based on
the serological properties of these O antigens, six different serogroups (1/2, 3, 4, 5, 6, and 7)
could be assigned to Listeria (Fiedler 1988). Additionally, Listeria species express flagellar
(H) antigens which by its unique combination with somatic O antigens determine the serovar
(serotype) of individual strains. Therefore, 15 different serovars have been identified for all
species by serological typing using specific and standardized sera. A total of 15 O-antigens
(subtypes I-XV) and H-antigens (subtypes A-D) were described by Seeliger & Jones, 1986
(table 1.2). In L. monocytogenes 13 serotypes (1/2a, 1/2b, 1/2c, 3a, 3b, 3c, 4a, 4b, 4c, 4d, 4e,
4ab and 7) have been recognized, 7 serotypes (1/2a, 1/2b, 3b, 4a, 4b, 4c, and 6b) in L.
seeligeri, 3 serotypes (1/2b, 6a, and 6b) in L. innocua and L. welshimeri and one in L. ivanovii
(i.e. 5) (Seeliger and Jones 1986).
Table 1.2 Compositions of somatic (O) and flagellar (H) antigens in Listeria serotypes (based on
Seeliger & Jones, 1986)
Serotype O antigens H antigens 1/2a I, II A, B 1/2b I, II A, B, C 1/2c I, II B, D 3a II, IV A, B 3b II, IV A, B, C 3c II, IV B, D 4a (V), VI, IX A, B, C 4b V, VI A, B, C 4c V, VII A, B, C 4d (V), VI, VIII A, B, C 4e V, VI, (VIII), (IX) A, B, C 7 XII, XIII A, B, C 5 (V), VI, (VIII), X A, B, C 6a V, (VI), (VII), (IX), XV A, B, C 6b (V), (VI), (VII), IX, X, XI A, B, C

Chapter 1 Introduction
5
1.4 Serovar differentiation of L. monocytogenes strains
We note, as mentioned above, that serotypes are shared among Listeria species and therefore
can not be used to differentiate between species. Besides the identification of Listeria species,
the serovar differentiation is particularly useful to determine the prevalence of specific
serotypes in epidemiological studies and for tracking the source of contaminations. Current
serotyping of L. monocytogenes in the routine laboratory using the methods available is quite
rare because of the limited availability of commercial systems and the costs their use inherits
(Seeliger and Langer 1979) as well as the time needed for their application (Palumbo et al.
2003). Furthermore, many PCR-based methods have been developed, however, they are
limited to differentiate to the serogroup level (Comi et al. 1997, Doumith et al. 2004a,
Jinneman and Hill 2001, Manzano et al. 1998), or only differentiate few serovars (Zhang and
Knabel 2005). The implementation of a rapid and inexpensive serotyping method will allow a
more accurate survey of foods and food processing facilities for the presence of potential
pathogenic serovars of L. monocytogenes.
It is known that the repertoire of strains capable of contaminating food is wider than that of
strains recovered from patients with listeriosis. On the other hand, it has been observed that
most clinical isolates belong to serovars 1/2a, 1/2b and 4b. Among these, the majority of
strains which have caused large outbreaks are serovar 4b (Kathariou 2000). In contrast, most
food strains belong to serovar 1/2c (Jacquet et al. 2002, Yildirim et al. 2004). This
controversy in the distribution of the serovars in clinical and food isolates arouses the interest
to study their origin. Thus it is especially interesting that all serotypes posses the same
virulence factors and hence have the same potential to cause diseases which suggests that
there may exist a variation in the regulation of expression among serotypes (Kathariou 2002).
Several findings support this opinion such as the existence of two different forms of a cell-
surface protein internalin in clinical and food serovars that determine biomarkers for
pathogenic potential (Jacquet et al. 2004), as well as the expression of specific genetic
markers by epidemic serovar 4b clones which confer special virulence attributes to these
strains involved in food contamination (Liu et al. 2006, Yildirim et al. 2004).
Although a lot of studies about the virulence of L. monocytogenes have contributed to a better
understanding of its pathogenesis, they have not sufficiently elucidated the virulence related
with food safety. Furthermore, at this time, limited information exists concerning the
virulence of L. monocytogenes since only a few well-known strains of serovar 1/2a and 4b
have been studied. Therefore, in order to discover a potential relationship between serovars

Chapter 1 Introduction
6
and pathogenic potential, new differentiation methods for serovars will help to develop
science-based approaches to regulate the presence of L. monocytogenes in food.
Thus, the serovar differentiation of the species L. monocytogenes implicated in major food-
borne listeriosis outbreaks is not only necessary to confirm sources of outbreaks and monitor
reservoirs of potentially epidemic strains, but also to gain additional knowledge regarding the
relation between the serovar and pathogenic potential in Listeria monocytogenes strains.
1.5 FTIR spectroscopy of microorganisms
The use of infrared spectroscopy for the identification of microorganisms was first suggested
in the 1950’s by the groups of Bordner and Thomas (Bordner et al. 1956, Thomas and
Greenstreet 1954). However, due to technical limitations at that time the method could only
be implemented in the 90ies when Naumann and his co-workers introduced the Fourier
Transform Infrared Spectroscopy (FTIR) to the field of microbiology (Naumann et al. 1991).
FTIR spectroscopy is used to characterize microorganisms based on measurements of their
whole chemical composition (Naumann et al. 1991, Naumann et al. 1996). Considering
microorganisms as complex chemical systems, the FTIR spectroscopy uses the vibrational
spectroscopic properties of all cellular compounds to obtain their chemical fingerprint.
Indeed, the characteristic absorption of energy by the different constituents of microbial cells
determines their characteristic spectrum when they are irradiated with infrared light. This
infrared spectrum shows a complex pattern of band contours which represent the fingerprint
of the bacterium. In this study, we use the mid-infrared spectral region (MIR) of the
electromagnetic spectrum which covers the range between 4,000-500 cm-1. For an easier
interpretation of the infrared spectra of complex biological materials the group of Naumann
defined in the MIR range five spectral regions dominated by different functional groups.
Thus, for the major cellular components (nucleic acids, proteins, carbohydrates, and lipids)
specific spectral regions were assigned (Helm et al. 1991a).
All phenotype-based method may suffer by the fact that the expression of some cellular
constituents often varies with changing external conditions. Therefore, the characterization of
microbial cells by FTIR spectroscopy requires the establishment of a standardized protocol
for cultivation, sampling procedure and sample preparation, as well as the determination of
data acquisition and evaluation in order to obtain reliable and reproducible results (Naumann
2001).

Chapter 1 Introduction
7
FTIR spectroscopy has frequently been applied for differentiations at various taxonomic
levels of microorganisms. Nevertheless, in many of such studies the inclusion of few strains,
covering only part of biodiversity within a species, lead to insufficient separation between the
different groups i.e., the differentiation of Listeria species was not always possible (Holt et al.
1995, Lefier et al. 1997), or the differentiation of all serovars in Escherichia coli and
Salmonella enterica was not resolved (Helm et al. 1991a, Kim et al. 2005). However, the
identification of microorganisms by this method is advantageous since it allows the
application of large spectral libraries of well-characterized microorganisms. For instance, for
identifications at the species level a good representation of the intra-group (intra-species)
microbiodiversity increases the inter-group (inter-species) separation and thus enhances the
species differentiation (Helm et al. 1991b, Kümmerle et al. 1998, Maquelin et al. 2003),
(Oberreuter et al. 2002a). Therefore, the creation of a comprehensive and universal reference
database for all species and serovars of Listeria will allow reproducible identification results
in routine analysis.
1.6 Methods of analysis of the FTIR data of microorganisms
The collection of thousands of spectra from different microorganisms needed for the
construction of a comprehensive and valid database requires the use of appropriated statistical
analysis methods for their analysis and interpretation. Chemometrics are mathematical,
statistical or graphical methods used to improve the understanding of chemical information.
These methods extract, in an efficient way, unique and redundant information from complex
data such as spectra. There are two different categories of chemometric procedures. The first,
the so called univariate statistical analysis, considers only a single property of a spectrum (e.g.
a single intensity at a given wave number) leaving a wealth of information stored in the
spectra unused whereas the second method, the multivariate statistical analysis method, is
more advantageous since several properties of the spectra can be evaluated at the same time
maximising thereby the information extracted. This pattern recognition technique aims at the
classification of pattern based on either a priori knowledge or on statistical information
extracted from the patterns. Among these techniques unsupervised and supervised learning
methods are of particular interest when IR spectra of microorganisms have to be analized
(Schmitt and Udelhoven 2001).
Unsupervised methods provide grouping schemes within complex data sets indicating
similarity or relationships between the members of the group without the need to assign a
priori the identity of the data. In this category of techinques Hierarchical Cluster Analysis

Chapter 1 Introduction
8
(HCA) and Principal Component Analysis (PCA) are included which are frequently used for
classification problems. Since the HCA was used in this work it needs further explaination.
HCA: This method groups spectra in clusters based on their similarity. Their results are
represented by a hierarchical tree called dendrogram. The distances between the spectra
in a cluster as well as between the different clusters in a dendrogram are depending on
the method or algorithm used for the cluster analysis. In this work the following
methods were used:
Average linkage: In this method the distance between two clusters is calculated as the
average distance between all pairs of objects in these two different clusters (Sneath and
Sokal 1973).
Ward’s algorithm: This method is distinctive from the previous one because it uses an
analysis of variance approach to evaluate the distances between clusters. In short, this
method attempts to minimize the Sum of Squares (SS) of any two (hypothetical)
clusters that can be formed at each step (Ward 1963).
In contrast, supervised methods use a data set of well-known data for the establishment of a
model which then permits the assignment of the identity of the unknown data. In this category
of techniques are included the Linear Discriminant Analysis (LDA) and the Artificial Neural
Network (ANN) (Naumann 2001). The ANN was used in this work and is therefore further
explained here below.
Artificial Neural Networks: are data-processing methods based on an analogy with the
structure and function of the brain. They are built from simple units, called neurons,
which are linked by connections called synapses. Each neuron corresponds to a pattern
that we want to analyse and different neurons are placed in different layers which are
connected to each other by synapses forming the networks. The information to be
analysed, called inputs, flows from the neurons of the first layer to the others in the
second layer and so on until the neurons in the last layer. Finally, the inputs will be
converted in outputs as a result of this processing.
The goal of the network is to learn or to find the structure of the classification system to
be developed by repetitive exposure to data, estimation of output error and subsequent
feedback. When a desired output is known the difference between the actual input and
the desired output will be used as error signal for the so called supervised learning
process. This learning process is made by iterative changes of the values of the neuronal
network parameters. For supervised learning the most widely known algorithm is the

Chapter 1 Introduction
9
backpropagation error and its improved form, the resilient propagation (Rprop), which
was used in this work (Riedmiller and Braun 1993).
The pattern of connectivity or architecture of the network reflects their complexity and
behaviour. The optimal network architecture has to be established empirically and their
accuracy must be validated using an independent data set. In this work two and four
layers were needed to design the optimal schemes for the reliable classification of
Listeria to species and serovar level respectively.
The combination of FTIR spectroscopy with computer-based data evaluation is particularly
required for an effective extraction of the information contained in the spectra. Unsupervised
methods such as HCA are insufficient for the complete information extraction when a great
amount of data has to be analysed. Therefore, advanced supervised methods such as ANN are
definitely required to improve the discrimination capacity since they present a great potential
to handle multiclass problems. Thus, the ability of ANN to classify infrared spectra of
biological samples provides a means to improve the identification of unknown samples.

Aim and achievement of the work
10
Aim and achievement of the work
The application of FTIR spectroscopy for the identification of microorganisms in the routine
microbiological laboratory has become important during the last years since large spectral
databases for the identification of microorganisms were constructed. Even though these
libraries constitute a better alternative than conventionally available methods, the optimal
extraction of the huge amount of information contained in the spectra is generally not possible
when univariate methods are used for analysis.
The main intention of this PhD work was to assess whether the application of advanced
supervised methods of data-analysis, such as the Artificial Neural Network (ANN), improve
the discrimination capacity of the FT-IR technique. For this purpose, the following had to be
investigated:
first of all the adequate IR spectroscopic technique had to be defined and optimized
for the classification of Listeria species.
In order to achieve this, the results obtained by the application of both the FTIR macro-
and –micro-sample methods should be compared. In this context the standardization of
the sampling procedure and sample preparation for both methods, a detailed analysis of
the factors which influence the success in the identification, namely the addition of
more strains per species, the colony heterogeneity as well as age of the culture, among
others, had to be carried out.
Thereafter, (i) in order to evaluate the success in the differentiation of Listeria at
species level on the basis of their spectral differences two different data-analysis
methods had to be used.
Having in mind these aims, univariate and the multivariate classification models had to
be established for species classification using the same data set of Listeria reference
strains. Further, by using a large set of independent strains not contained in the
reference database, it had to be evaluated whether an improvement in the identification
of Listeria species, and especially of the pathogen L. monocytogenes, could be achieved
when multivariate ANN methods are applied instead of univariate methods.
(ii) Furthermore, the identification capacity of the ANN had to be compared with
already established and officially recognised methods for routine identification of
Listeria.
Aim and achievement of the work
11
Specifically, the superiority of ANN based FTIR methods should be compared with the
API Listeria identification system based on physiological characteristics and which is
widely used in routine microbiological laboratories.
Thereafter, the established FTIR based ANN classification method for Listeria
species had to be extended to allow further the subspecies differentiation of the
pathogen L. monocytogenes at the serovar level.
To achieve this aim ANN-based classification models had to be established for sub-
species typing of Listeria monocytogenes that allow the accurate detection of potentially
pathogenic strains and provide insights into the pathogenic potential of strains isolated
from the food processing chain.

Chapter 2 FTIR macro- and micro-sample methods for identification of Listeria spp
12
2 Identification of five Listeria species based on infrared spectra (FTIR)
using macro-samples is superior over a micro-sample approach
2.1 Summary
Based on infrared spectra (FTIR), microorganisms can be identified by using both macro-
samples and micro-samples. This work is aimed to compare identification of the five closely
related Listeria species L. innocua, L. ivanovii, L. monocytogenes, L. seeligeri, and L.
welshimeri by both methods. The overall identification success for 25 strains was 92.8% for
the former and 79.2% for the latter method, respectively. The worst performance of the micro-
samples method was found for L. innocua, L. ivanovii, and L. monocytogenes, while L.
seeligeri and L. welshimeri did not show significant differences between the techniques.
Identification success was mainly influenced by the age of cells and spatial heterogeneity of
the microcolonies as analyzed by the micro-samples method. Spectra of Listeria cells near
stationary phase exhibited more species-specific markers and, therefore, allowed for a better
discrimination than the spectra of growing cells. Furthermore, heterogeneity of cell
composition at different locations in microcolonies of L. innocua, L. ivanovii and L.
monocytogenes resulted in a limited discrimination success of the micro-samples method. We
conclude that, at least in case of Listeria, the macro-samples method is superior over the
micro-samples method, although the latter is the faster technique.
2.2 Introduction
The accurate differentiation of Listeria species in general and Listeria monocytogenes in
particular, which is a human foodborne pathogen (Gasanov et al. 2005, Liu 2006), has
become an important task for the food industry and public health authorities (Kathariou 2002,
Rudolf and Scherer 2001). The differentiation of microorganisms in routine laboratories
requires sensitive, reproducible, rapid, automated and inexpensive methods. Although many
phenotypic and genetic methods have been developed (Liu 2006) few have so far met all of
the above-mentioned criteria.
Naumann and coworkers introduced Fourier Transform Infrared Spectroscopy (FTIR) to
microbiology (Naumann et al. 1991). Since then, various contributions have been published,
aiming to improve FTIR based identification of microbes [summarized in (Maquelin et al.
2002, Naumann et al. 1991, Wenning et al. 2007)]. Among them, FTIR macrospectroscopy
(called macro-sample method in this paper) is already used in routine laboratories. This

Chapter 2 FTIR macro- and micro-sample methods for identification of Listeria spp
13
method uses infrared spectra of dried films of pure microorganism cultures, which are carried
by sample wheels or on a microtiter plate format for measurement of the spectra. These are
then identified by comparison with extensive reference libraries, containing spectra from a
large variety of well-defined microbes. This method allows the identification of microbes in
only 25 hours using a suspension of cells scraped off from a confluent lawn of a pure culture
(Helm et al. 1991, Kümmerle et al. 1998, Oberreuter et al. 2002b). Recently, we applied this
technique to develop a superior artificial neural network for the reliable identification of
Listeria species, even down to the serovar level (Rebuffo et al. 2006, Rebuffo-Scheer et al.
2007b).
Another, promising FTIR technique is FTIR microspectroscopy (called micro-sample method
in this paper) which combines FTIR spectroscopy with microscopy, thus allowing direct
measurement of spectra of small microcolonies obtained by a replica stamping technique
directly from agar plates after dilution plating. One of the major advantages of this approach
is that the identification time can be significantly reduced, thus allowing the identification of
clinically relevant bacteria after 6- 10 h (Choo-Smith et al. 2001, Ngo-Thi et al. 2003, Sandt
et al. 2006) and yeasts after 10 h (Essendoubi et al. 2005, Ngo-Thi et al. 2003), instead of 24 h
needed for the macro-sample technique. More important, this method can differentiate
microorganisms without the need to produce pure cultures (Maquelin et al. 2003, Wenning et
al. 2002, Wenning et al. 2006), thus further speeding up identification. Moreover,
identification of bacteria down to the subspecies level can be achieved by the micro-sample
method (Kirschner et al. 2001, Rebuffo-Scheer et al. 2007a). However, there are also reports
which state that differentiation of some species of Staphylococcus and Pseudomonas could
not be achieved by the micro-sample method (Sandt et al. 2006).
Until now, limited data are available concerning the factors which influence the results
obtained by both methods and no comparison of the performance of both methods has been
published. Therefore, we decided to compare the macro-sample and the micro-sample
methods in order to evaluate which approach is more suitable for the identification of Listeria
species. Two spectral databases were compiled and their identification capacity to the species
level was compared. Additionally, a systematic analysis of the factors which influence the
identification capacity was carried out including the heterogeneity of microcolony growth and
the age of the cells. We suggest that the macro-sample technique is more reliable for
identification of the closely related species of Listeria than the micro-sample technique.
Chapter 2 FTIR macro- and micro-sample methods for identification of Listeria spp
14
2.3 Materials and methods
2.3.1 Bacterial strains
A collection of 25 well-identified strains belonging to Listeria monocytogenes, L. innocua, L.
ivanovii, L. seeligeri and L. welshimeri was used. Each species was represented by five strains
from the American Type Culture Collection, the Special Listeria Culture Collection and the
Weihenstephan Culture Collection as summarized in Table 1.
Table 2.1 Listeria strains included in this study
Listeria strains Reference Strains WSLC(1)
L. innocua 2214 L. innocua ATCC 33090; SLCC 3379 2011 L. innocua - 2390 L. innocua - 2394 L. innocua - 2521 L. ivanovii SLCC 3773 3062 L. ivanovii SLCC 5755 30163 L. ivanovii SLCC 8431 30166 L. ivanovii SLCC 7927 30168 L. ivanovii SLCC 6965 30160 L. monocytogenes - 1266 L. monocytogenes - 1285 L. monocytogenes - 1303 L. monocytogenes - 1361 L. monocytogenes - 1118 L. seeligeri SLCC 8624 40128 L. seeligeri SLCC 8610 40136 L. seeligeri SLCC 8598 40134 L. seeligeri SLCC 8621 40138 L. seeligeri SLCC 8604 40127 L. welshimeri - 5891 L. welshimeri SLCC 5828 50150 L. welshimeri - 5917 L. welshimeri ATCC 35897; SLCC 5334 5013 L. welshimeri SLCC 7625 50148
ATCC American Type Culture Collection; SLCC Special Listeria Culture Collection (1) WSLC Weihenstephan Culture Collection
Chapter 2 FTIR macro- and micro-sample methods for identification of Listeria spp
15
2.3.2 Sample preparation and growth conditions
In this study all Listeria strains were grown on tryptone soy agar (TSA) culture media for
both the infrared-macro and –micro measurements by optimizing the temperature and growth
time.
For the macro-sample method the standardized parameters 24 h and 30°C were applied. The
sample preparation was performed as described elsewhere (Rebuffo et al. 2006). Per
measurement, approximately 109 cells were used which is equivalent of approximately 1 mg
wet weight. For the infrared micro-sample measurements, one full platinum loop of bacteria
cells was suspended in 100 µl sterile water and then used for a dilution series down to 10-4.
100 µl of this dilution were plated onto TSA agar (Merck, Germany) using a Drigalski spatula
to allow single colony growth for 18 h at 25°C. These growth conditions were established for
all Listeria species to obtain microcolonies with adequate biomass for reproducible
measurements as described previously for strains of Mycobacteria sp. with different
generation times (Rebuffo-Scheer et al. 2007a). These microcolonies were transferred by
replica stamping from the agar plate onto an infrared transparent ZnSe carrier and air dried for
15 min for the microscopic measurements. A microcolony of 120 µm diameter contains
roughly 105 cells which is equivalent to approximately 10-4 mg wet weight.
2.3.3 Recording of spectra and data evaluation
Data acquisition and evaluation of the macro-sample method were performed as described
previously (Rebuffo et al. 2006). For the micro-sample measurements microcolonies of 80 to
180 µm in diameter were used to collect the IR-spectra with an IRscope II coupled to an IFS
28B spectrometer (Bruker Optics, Karlsruhe, Germany) in the spectral region between 700
and 4,000 cm-1. These measurements were performed in transmission mode using the
following parameters: 6 cm-1 resolution, zero-filling factor of 4 and Blackmann-Harris-3
Term apodization, 15x Cassegrain-objective and 128 interferograms which were averaged for
each spectrum.
All strains were stamped three times from independent bacterial cultures. From each of these
replicas 10 microcolonies were measured. Evaluation and processing of the spectral data were
performed using the software OPUS 4.2 (Bruker Optics, Germany) as described previously
for the macro-sample measurements (Rebuffo et al. 2006). Prior to data processing and in
order to ensure an adequate quality of the spectra for identification, values of minimum and
maximum absorbance as well as values of noise and water vapor content of the spectra were
determined for each spectrum.
Chapter 2 FTIR macro- and micro-sample methods for identification of Listeria spp
16
To establish the micro- and macro-sample databases, ten independent spectra measurements,
obtained for each of the strains were included in each library (Rebuffo et al. 2006). First
derivatives of the spectra and spectral regions from 900 to 1,200, 1,250 to 1,650 and 2,830 to
3,030 cm-1 were used. Afterwards, the identification performance of the two libraries was
evaluated in an internal validation process.
In an internal validation process the capacity to correctly identify a given model can be
evaluated. The so called “leave-one-out” method was used in this work. To apply this method
to the macro- and micro-samples, we had to build various spectral libraries. When one
spectrum was left out from the library containing n spectra, this spectrum was used to test
against the new library comprising n-1 spectra. This process was repeated in a way that each
spectrum in the library was used once as the validation data. The results of this validation
procedure were expressed in terms of identification capacity of the model. Thus, the results
for correct identification were determined at the species level in the following spectral
windows: 900-1,200, 1,250-1,650 and 2,830-3,030 cm-1 using a cut-off value for the spectral
distance SD < 0.5 (using a repro-level of 30). This implies that the SD value between a left
out spectrum and the spectra comprised in the library must be less than 0.5 to be counted as a
correct identification at the species level. Finally, the results of identification of all spectra
tested were averaged for strains belonging to the same species in order to give the correct
identification at species level.
2.3.4 Heterogeneity of the microcolonies
Heterogeneity within the microcolonies was measured by linear mapping across the
microcolony imprints using a PC-controlled x, y-stage with 10 µm steps in x and y direction.
At each marked position on the colony imprints the spectra were collected with a resolution of
6 cm-1, aperture size of 30 µm, and 128 scans. First derivative of the spectra from each
measured position was calculated and subjected to cluster analysis using the average linkage
algorithm and scaling to first range method in the spectral region between 800 and 1,800 cm-1
to calculate the spectral distance (SD) value. This value determines the spectral heterogeneity
of the microcolony.
2.3.5 Variation of the number of strains per species in the library
A total of twelve spectral libraries containing different strain sets of the five Listeria species
were compiled for both the macro- and micro-sample technique. When constructing three
libraries, by using the micro-sample method, we did start with 10 different strains per species

Chapter 2 FTIR macro- and micro-sample methods for identification of Listeria spp
17
followed by three consecutive additional sets of 10 strains per species, in order to finally
arrive at 40 strains per species. This allowed the construction of 12 different libraries
containing different strain combinations. The same has been done by using the macro-sample
method. Then, each of these libraries was internally evaluated as described in the above data
evaluation paragraph. The results of these internal validations were then averaged for each
strain set separately.
2.4 Results and discussion
Figure 2.1 shows typical first derivative of infrared macro-sample measurements of the five
Listeria species included in this study. The most relevant differences observed between the
five species are displayed. As can be seen, the polysaccharide region between 900 and 1,200
cm-1 exhibits the most important differences among the Listeria species.
80010001200140016001800
Rel
ativ
e A
bsor
ptio
n
Wavenumber (cm-1)
- - - L. ivanovii WSLC 3062L. seeligeri WSLC 40127
- - - L. welshimeri WSLC 5891L. monocytogenes WSLC 1285L. innocua WSLC 2394
80010001200140016001800
Rel
ativ
e A
bsor
ptio
n
Wavenumber (cm-1)
- - - L. ivanovii WSLC 3062L. seeligeri WSLC 40127
- - - L. welshimeri WSLC 5891L. monocytogenes WSLC 1285L. innocua WSLC 2394
- - - L. ivanovii WSLC 3062L. seeligeri WSLC 40127
- - - L. welshimeri WSLC 5891L. monocytogenes WSLC 1285L. innocua WSLC 2394
Fig. 2.1 Typical first derivative spectra of five Listeria species: L. ivanovii WSLC 3062, L. seeligeri
WSLC 40127, L. welshimeri WSLC 5891, L. monocytogenes WSLC 1285, and L. innocua WSLC 2394

Chapter 2 FTIR macro- and micro-sample methods for identification of Listeria spp
18
measured with macro-samples. The most important spectral differences found between the species are
highlighted in the polysaccharide region between 900 and 1,200 cm-1.
Identification accuracy at the species level by both methods is shown in table 2, based on an
internal validation assay as described in the material and methods section. A higher
identification rate was achieved with the macro-sample (92.8%) to the micro-sample (79.2%)
method. The worst performance of the micro-sample method was found for L. innocua (72%),
L. ivanovii (64%) and L. monocytogenes (80%) as compared to the species L. seeligeri
(100%) and L. welshimeri (88%). Based on these differences and considering the fact that a
standardized protocol for cultivation, conditions of measurement, and data interpretation was
used throughout, we suggest that biological factors such as growth phase or colony
heterogeneity may influence identification success.
Table 2.2 Correct identification of Listeria species by FTIR micro- and macro- sample methods
Species FTIR-macro Correct identification*
FTIR-micro Correct identification*
L. innocua 100% 72% L. ivanovii 100% 64% L. monocytogenes 88% 80% L. seeligeri 92% 100% L. welshimeri 84% 88%
* Values have been calculated based on an internal validation procedure as described in the material and methods section.
The reproducibility of the macro- and micro-sample measurements was studied for each strain
by using ten independent measurements carried out for each strain under standard conditions
over a few weeks. The first derivative of the average (µ) and the average ± standard deviation
(µ ± σ) spectra as well as their normalization were calculated for all strains using the software
OPUS 4.2 (Bruker Optics, Germany) in order to highlight the spectral variances. These
variances are displayed in Fig. 2.2 for some Listeria strains in the spectral region from 900 to
1,680 cm-1 where the most evident spectral variances were observed.
When the macro-sample measurements were analysed in the whole infrared spectra (from 700
to 4,000 cm-1) very slightly or even no differences were found between the µ spectrum and
the µ ± σ spectrum for the same strain. These results were achieved for macro-sample
measurements of all Listeria strains and indicate a high spectral reproducibility which is
illustrated in the Fig. 2.2.

Chapter 2 FTIR macro- and micro-sample methods for identification of Listeria spp
19
On the other hand, the reproducibility of the micro-sample measurements was found to be
different in the different species of Listeria. Reproducibility of measurements in L. innocua
and L. monocytogenes was dependent on the strain and the spectral region analysed. In Fig.
2.2, for example, strain L. innocua WSLC 2214 presents less spectral variance than strain L.
innocua WSLC 2394. Furthermore, the reproducibility of the last strain varies with the
spectral region analysed. This was also found for L. monocytogenes strains, whereas L.
ivanovii strains exhibit, in general, less reproducibility irrespectively of the strain.
Conversely, all L. seeligeri and L. welshimeri strains present the same good spectral
reproducibility of the micro-sample measurements as the strain L. seeligeri WSLC 40136
which is shown in Fig. 2.2.
9001000110012001300140015001600
Rel
ativ
e A
bsor
ptio
n
L. innocua WSLC 2214
L. innocua WSLC 2394
L. monocytogenes WSLC 1361
L. monocytogenes WSLC 1285
L. seeligeri WSLC 40136
L. ivanovii WSLC 30166
Wavenumber cm-1
9001000110012001300140015001600
Rel
ativ
e A
bsor
ptio
n
9001000110012001300140015001600
Rel
ativ
e A
bsor
ptio
n
L. innocua WSLC 2214
L. innocua WSLC 2394
L. monocytogenes WSLC 1361
L. monocytogenes WSLC 1285
L. seeligeri WSLC 40136
L. ivanovii WSLC 30166
Wavenumber cm-1
Fig. 2.2 First derivative of the average spectra (µ) (solid line), and average ± standard deviation (µ ±
σ) spectra (dashed line) were normalized. The spectra in black represent the µ and µ ± σ spectra of the
micro-sample measurements, and the spectra in grey represent the µ and µ ± σ spectra of the macro-

Chapter 2 FTIR macro- and micro-sample methods for identification of Listeria spp
20
sample measurements. Both were calculated by using ten independent measurements carried out for
each strain.
By using the macro-sample method a confluent and dense bacterial lawn on the agar plate was
obtained for all species of Listeria when they were cultivated 24 hours at 30°C. During this
bacterial growth, both, the modification of the medium composition (i.e. starvation for
nutrients, oxygen, etc) as well as the increment of the bacterial density, lead to some
variations in the bacterial environment on the agar plates. Such limitations may induce
bacterial cells to enter the stationary phase and undergo phenotypical changes. This culture
phase was described by Sandt and coworkers as characterized by a high degree of interspecies
discrimination which is due to the expression of differential features of species (Sandt et al.
2006). Unlike the macro-sample method, the micro-sample method measures Listeria
microcolonies grown on agar plates at 25°C and 18 hours which involves cells in exponential
growth. It was previously described that young microcolony cells present a lower interspecies
diversity compared to bacterial cells from a 24 hours old stationary phase lawn culture (Sandt
et al. 2006). The same author also suggested that the age of the culture is the only factor that
influences the discrimination power of the micro-sample method.
The cellular composition and, therefore, the infrared spectrum, depends on the composition of
the medium which was kept constant in our assay. Also, it varies with temperature and time.
Thus, the same 25 strains were grown for 18 h to a nearly confluent lawn at 25°C, and their
infrared macro-sample spectra collected. These infrared macro-sample spectra were compared
with cells grown at 30°C for 24 h to a confluent lawn. In parallel, spectra of microcolonies
were measured which were grown under the same conditions. While only negligible variation
was observed between the infrared macro-sample spectra, the infrared micro–sample spectra
showed large differences when the same strains were compared (results not shown). These
results indicate that the structure of microcolonies and the composition of cells within the
colonies may affect the identification success of the micro-sample method. Furthermore,
additional peaks were observed in the infrared macro-sample spectra of all Listeria species in
the species discriminative region (polysaccharide region 900-1,200 cm-1) and in the region
from 1,500 to 1,550 cm-1, when grown at 30°C for 24 h, which is in line with the conclusions
of Sandt and co-workers (Sandt et al. 2006), who found such changes to increase the
discriminative potential of older cell’s spectra in other microorganisms.
FT-IR spectra obtained from microbial microcolonies exhibit some variance which may be
indicative of the heterogeneity within the microcolonies (Choo-Smith et al. 2001, Ngo-Thi et

Chapter 2 FTIR macro- and micro-sample methods for identification of Listeria spp
21
al. 2003, Rebuffo-Scheer et al. 2007a, Sandt et al. 2006, Wenning et al. 2002). Therefore, we
evaluated whether the colony heterogeneity has an influence on the identification success. A
linear mapping across the microcolony imprint was performed for all Listeria species. For
example, Fig. 2.3A1 and Fig. 2.3A2 display the linear mapping procedure across the
microcolony imprint of L. monocytogenes WSLC 1929 and L. seeligeri WSLC 40134,
respectively, in order to study the spectral heterogeneity within a colony. Spectra were
collected at several positions separated by 10 µm steps. As can be seen in the dendrograms of
Fig. 2.3, the spectra collected at different positions of L. monocytogenes microcolonies
showed a higher heterogeneity (Fig. 2.3B1) compared to those derived from L. seeligeri
microcolonies (Fig. 2.3B2). Strains of the species L. innocua and L. ivanovii were similar to
L. monocytogenes while L. welshimeri strains exhibited the same characteristics as L.
seeligeri strains (data not shown).
L. seeligeri WSLC 40134
Colony diameter 120 µm
L. monocytogenes WSLC 1929
Colony diameter 120 µm
Spectral Distance
012345678
12
53
46
78
910
Positionswhitin
thecolony
00.10.20.30.40.50.60.7
1349
5827
61011
Spectral Distance Positionswhitin
thecolony
A1 A2
__________1
23456789
10 __________1
__________1
23456789
10
__ __ __
10µm
__________1
23456789
10 __________1
__________1
23456789
10 __________1
23456789
10 __________1
__________1
23456789
10
__ __ __
10µm
__ __ __
10µm
___________
23456789
10
1
11___________
___________
23456789
10
1
11
__ __ __
10µm
___________
23456789
10
1
11___________
___________
23456789
10
1
11___________
23456789
10
1
11___________
___________
23456789
10
1
11
__ __ __
10µm
__ __ __
10µm
B1 B2
L. seeligeri WSLC 40134
Colony diameter 120 µm
L. monocytogenes WSLC 1929
Colony diameter 120 µm
Spectral Distance
012345678
12
53
46
78
910
Positionswhitin
thecolony
Spectral Distance
012345678
12
53
46
78
910
012345678 012345678
12
53
46
78
910
12
53
46
78
910
Positionswhitin
thecolony
00.10.20.30.40.50.60.7
1349
5827
61011
Spectral Distance Positionswhitin
thecolony
00.10.20.30.40.50.60.7
1349
5827
61011
00.10.20.30.40.50.60.7 00.10.20.30.40.50.60.7
1349
5827
61011
1349
5827
61011
Spectral Distance Positionswhitin
thecolony
A1 A2
__________1
23456789
10 __________1
__________1
23456789
10
__ __ __
10µm
__________1
23456789
10 __________1
__________1
23456789
10 __________1
23456789
10 __________1
__________1
23456789
10
__ __ __
10µm
__ __ __
10µm
___________
23456789
10
1
11___________
___________
23456789
10
1
11
__ __ __
10µm
___________
23456789
10
1
11___________
___________
23456789
10
1
11___________
23456789
10
1
11___________
___________
23456789
10
1
11
__ __ __
10µm
__ __ __
10µm
B1 B2
Fig. 2.3 Spectral heterogeneity within two different microcolonies of L. monocytogenes WSLC 1929
(A1) and L. seeligeri WSLC 40134 (A2). Each colony imprint obtained by the replica technique was
approximately 120 µm in diameter. The marked positions on the colony imprints are the centers of
various measuring positions. B1 and B2 display the dendrograms calculated from the first derivative
of the spectra collected at the different positions within the microcolonies. Spectra were recorded
between 800 and 1,800 cm-1, dendrograms were constructed using the average linkage algorithm and
the "scaling to first range" method.
Interestingly, the microcolony shape in Listeria varies among the species. We observed that
different strains of Listeria exhibit two different types of microcolony shapes when growing
on the same solid medium. This is visualized in the microcolony imprints of Fig. 2.3A1 and

Chapter 2 FTIR macro- and micro-sample methods for identification of Listeria spp
22
A2. L. innocua and L. ivanovii microcolonies exhibit a characteristic halo in the centre similar
to the L. monocytogenes strains (Fig. 2.3A1) whereas L. seeligeri and L. welshimeri strains
show a slightly plan microcolony shape (Fig. 2.3A2).
In addition, spectral heterogeneity was measured for microcolony sizes between 70 to 280
µm. In general, the heterogeneity as indicated by the spectral distance value increased with
colony size (Fig. 2.4). Spatial spectral heterogeneity therefore increases with the age of a
colony, indicating different cellular compositions at different locations of the colonies.
0
2
4
6
8
10
12
14
16
18
50 100 150 200 250 300colony diameter (µm)
Het
erog
enei
ty (S
D)
L. ivanovii WSLC 3715
L. ivanovii WSLC 30151
L. innocua WSLC 2395
L. innocua WSLC 2380
L. monocytogenes WSLC 1075
L. monocytogenes WSLC 1929
L. welshimeri WSLC 50148 L. welshimeri
WSLC 5013L. Seeligeri WSLC 40134L. Seeligeri WSLC 4007
Fig. 2.4 Spectral heterogeneity expressed as spectral distance (SD) versus size of the microcolony for
different Listeria species. Two different strains per species are shown. For details see Materials and
methods.
In this study, the heterogeneity values achieved for Listeria species are comparable with those
reported for other microorganisms with low colony heterogeneity (Ngo-Thi et al. 2003,
Rebuffo-Scheer et al. 2007a). This indicates the existence of small differences in the

Chapter 2 FTIR macro- and micro-sample methods for identification of Listeria spp
23
biochemical composition between different zones of the microcolony. However, qualitative
characteristics specific to the L. innocua, L. ivanovii and L. monocytogenes microcolonies are
evident from their colony shapes as well as their spectral reproducibility.
Microcolonies are microbial populations developing by the proliferation of individual cells on
a solid medium. During bacterial growth different colony architectures have been observed
for different Listeria strains growing on the same medium, probably correlating with
physiological adaptations of the cells in response to nutrients and O2 availability which are
different in different locations of the colony. Examples for such adaptation processes are the
reduction of the cells sizes (Herbert and Foster 2001) and changes in gene expression (Gray et
al. 2006, Mauder et al. 2006). Thus, it may be possible that in the microcolony stage a
complex superposition of peculiar cellular components hides species differencing spectral
features. For this reason, the influence of the colony shape in L. innocua, L. ivanovii and L.
monocytogenes strains may determine in part the low identification success (table 2). This is
supported by the low spectral reproducibility which was observed for these three species
when using the micro-sample method.
It is well known that FTIR based identification of microbes strongly depends on the number
of strains per species contained in the spectral reference library which must reflect as much of
the intraspecific biodiversity of a species as possible (Oberreuter et al. 2002b, Rebuffo et al.
2006). Therefore, a total of twelve libraries containing different strain sets of the five Listeria
species (10, 20, 30, and 40 strains per species with three different strain combinations,
respectively) were compiled for both techniques under consideration. (See materials and
methods for technical details). As expected, a clear improvement of differentiation success
was observed when more strains per species were included (Fig. 2.5). However, this
improvement differs between the macro- and the micro-sample methods. Based on these
results we do not expect that the micro-sample method will yield satisfactory identification
results for the pathogen Listeria monocytogenes, even if large numbers of different strains are
included in the spectral reference libraries. This is in part due to the influence of the spectral
heterogeneity of microcolonies as well as to the insufficient discrimination features expressed
in exponential growth cells.

Chapter 2 FTIR macro- and micro-sample methods for identification of Listeria spp
24
65
70
75
80
85
90
95
100
0 10 20 30 40 50
No. of strains/species
Cor
rect
Iden
tific
atio
n(%
)
Sample Wheel
Microscope
65
70
75
80
85
90
95
100
0 10 20 30 40 50
No. of strains/species
Cor
rect
Iden
tific
atio
n(%
)
Sample Wheel
Microscope
65
70
75
80
85
90
95
100
0 10 20 30 40 50
No. of strains/species
Cor
rect
Iden
tific
atio
n(%
)
Sample Wheel
Microscope
65
70
75
80
85
90
95
100
0 10 20 30 40 50
No. of strains/species
Cor
rect
Iden
tific
atio
n(%
)
Sample Wheel
Microscope
Fig. 2.5 Identification success depends on the number of strains per species in the library. A total of
twelve libraries containing different strain sets of the five Listeria species were compiled for each
technique. The results obtained for each library of the macro-sample method (Sample Wheel) are
represented by grey symbols while those of the micro-sample method (Microscope) are represented by
black symbols. When constructing three libraries, by using the micro-samples method, we did start
with 10 different strains per species followed by three additional, consecutive sets of 10 strains per
species to arrive at 40 strains per species. This allowed the construction of 12 different libraries
containing different strain combinations. The same has been done by using the macro-sample method.
Then, each of these libraries was internally evaluated as described in the material and methods section.
The results of the internal validations are represented by the symbols triangle, rhombus and square.
The values of these internal validations were then averaged for each strain set separately for both, the
macro- and micro-sample methods. The curves represent an average of the correct identification
results for each library.

Chapter 2 FTIR macro- and micro-sample methods for identification of Listeria spp
25
2.5 Conclusions
In this work we have applied the FTIR micro- and macro-sample method to the differentiation
of five very closely related bacterial species, one of them being an important human pathogen.
In this case, the micro-sample method yields unsatisfactory results, even if spectral reference
libraries with considerable coverage of intraspecific and interspecific biodiversity are
available. This may hold generally if very similar microorganisms are to be differentiated.
However, in case of a larger biodiversity of a taxonomic group, the micro-sample method
may well be the method of choice. For instance, it was used successfully for the rapid analysis
of complex microbial multi-species consortia mainly composed of coryneform bacteria
(Wenning et al. 2006) and for the identification of atypical Mycobacterium species (Rebuffo-
Scheer et al. 2007a), which display a considerably larger interspecific biodiversity than
Listeria species.
2.6 Acknowledgement
This work was supported in part by the FEI (Forschungskreis der Ernährungsindustrie e. V.,
Bonn), the AiF (Arbeitskreis für industrielle Forschung), and the Ministry of Economics and
Technology, project no. 14126
Chapter 3 Identification of Listeria species by ANN-based FTIR
26
3 Reliable and Rapid Identification of Listeria monocytogenes and Listeria
Species by Artificial Neural Network-Based Fourier Transform
Infrared Spectroscopy
3.1 Summary
Differentiation of the species within the genus Listeria is important for the food industry but
only few reliable methods are available so far. While a number of studies have used Fourier
Transform Infrared (FT-IR) spectroscopy to identify bacteria, the extraction of complex
pattern information from the infrared spectra remains difficult. Here, we apply the artificial
neural network technology (ANN), which is an advanced multivariate data-processing method
of pattern analysis, to identify Listeria infrared spectra at the species level. A hierarchical
classification system based on ANN analysis for Listeria FT-IR spectra was created based on
a comprehensive reference spectral database including 243 well-defined reference strains of
Listeria monocytogenes, L. innocua, L. ivanovii, L. seeligeri, and L. welshimeri. In parallel, a
univariate FT-IR identification model was developed. To evaluate the potential, a set of 277
isolates from diverse geographical origin, but not included in the reference database, were
assembled and used as an independent external validation for species discrimination.
Univariate FT-IR analysis allowed the correct identification of 85,2% of all strains, and 93%
of the L. monocytogenes strains. ANN based analysis enhanced differentiation success to 96%
for all Listeria species, including a success rate of 99.2% for correct L. monocytogenes
identification. The identity of the 277 strain test set was also determined using the standard
phenotypical API Listeria system. This kit was able to identify 88% of the test isolates and
93% L. monocytogenes strains. These results demonstrate the high reliability and strong
potential of ANN-based FT-IR spectra analysis for identification of the five Listeria species
under investigation. Starting from a pure culture, this technique allows the cost-efficient and
rapid identification of Listeria species within 25 hours and is suitable for use in a routine
food-microbiological laboratory.
3.2 Introduction
The genus Listeria currently embraces six species: L. monocytogenes, L. ivanovii, L. innocua,
L. welshimeri, L. seeligeri, and L. grayi, based on DNA homology, 16S rRNA homology,
chemotaxonomic properties, and multilocus enzyme analysis (Rocourt 1999). All of these
species are widespread in the environment, but only L. monocytogenes is considered to be an
Chapter 3 Identification of Listeria species by ANN-based FTIR
27
opportunistic pathogen for humans and animals. Occasionally, human infections due to L.
ivanovii and L. seeligeri have also been reported (Cummins et al. 1994, Lessing 1994,
Rocourt 1986). Since most of the Listeria species are found as food contaminants, which may
indicate a potential risk for subsequent contamination by L. monocytogenes, their presence
require immediate action by the food company. For instance, L. innocua has frequently been
found as a marker organism of a L. monocytogenes contamination in dairy plants (Hahn 1990,
Loessner 2002, Rudolf and Scherer 2001). Therefore, a rapid and reliable differentiation of L.
monocytogenes from the other species of the genus is particularly important for the food
industry with respect to an effective quality assurance strategy.
For the identification of Listeria at the species level in routine laboratories, time-consuming,
laborious and sometimes unreliable biochemical and phenotypical standard methods such as
sugar fermentations and the CAMP test are often used (Bubert et al. 1997, Jones 1992). Easy
and rapid identification systems commercially available often fail to accurately identify
atypical strains, due to the lack of basic classification marker reactions (Bille et al. 1992,
Gracieux et al. 2003, Johnson 1993, Paillard et al. 2003). Therefore, fast molecular methods
and immunological procedures have been developed. However, most of them are limited to
detect only the genus Listeria or only L. monocytogenes (Allerberger et al. 1997, Bubert et al.
1994, Deneer and Boychuk 1991, Ninet et al. 1992, Norton 2002, Olsen et al. 1995). Some
other methods are laborious for species discrimination (Cocolin et al. 2002, Farber and
Addison 1994, Jersek et al. 1996) or failed to identify all Listeria species (Howard et al. 1992,
Manzano et al. 2000, Vaneechoutte et al. 1998). Recently developed sensitive and specific
microarray techniques are still of limited potential for routine laboratories due to high cost
and the requirement of highly skilled personnel (Volokhov et al. 2002).
Fourier transform-infrared spectroscopy (FT-IR) is a vibrational spectroscopic technique with
high resolution power which is able to distinguish microbial cells at different taxonomic
levels (Helm et al. 1991a). One attractive application of this inexpensive and rapid technique
is the identification of unknown strains using an extensive reference library containing spectra
from well-identified microbes (Goodacre et al. 1996, Helm et al. 1991, Kümmerle et al. 1998,
Maquelin et al. 2003, Oberreuter et al. 2002b, Wenning et al. 2002). The identification is
achieved by calculating the over-all difference between a test spectrum and all reference
spectra. A test strain is assigned to the source of the nearest reference spectrum (Helm et al.
1991). However, such a procedure is univariate and does not consider patterns of individual
differences at different wavelengths leaving a wealth of information stored in the spectra
Chapter 3 Identification of Listeria species by ANN-based FTIR
28
unused. In case of the differentiation of closely related species within the same genus,
advanced multivariate methods for data analysis are therefore required.
Investigation of Listeria species using FT-IR spectroscopy has been undertaken previously
(Holt et al. 1995, Lefier et al. 1997). However, these studies included only a single strain per
species and even in this simple case the unequivocal clustering of different spectra of the
same strain was not always possible. It remained therefore unclear whether FT-IR
spectroscopy would have the capacity to differentiate the Listeria species, especially if the
technique is applied to a strain selection covering at least a significant part of the natural
microbiodiversity of the species. If many strains from several species are included in the
analysis, self learning systems such as artificial neural networks (ANNs) may be able to
extract the information stored in the spectra of such a broad database and greatly enhance the
species-specific differentiation of bacterial isolates, when a comprehensive reference dataset
is used (Maquelin et al. 2003, Schmitt and Udelhoven 2001, Udelhoven et al. 2000). In the
present study, ANNs have therefore been applied to establish a classification system for
Listeria FT-IR spectra and its performance has been compared to univariate -FT-IR analysis
and the standard phenotypical API differentiation of Listeria. We report that the semi-
automated, ANN-based FT-IR technique allows reliable identification of Listeria species in
25 hours and is suitable for use in a routine microbiological laboratory.
3.3 Materials and Methods
3.3.1 Bacterial strains
A list of all 520 Listeria strains used in this study can be found in Appendix I and II in the
Appendix section.
3.3.2 Reference strain set: Sequence analysis of the iap and thy gene
A reference strain set of 243 well-defined strains of Listeria monocytogenes, L. innocua, L.
ivanovii, L. seeligeri, and L. welshimeri from international culture collections (ATCC and
SLCC) and the Weihenstephan Listeria collection (WSLC) served to establish a spectral
reference dataset (see Appendix I of chapter 7). A total of 164 strains of this set have been
identified by DNA-sequence analysis of the complete iap gene and thymidylate synthase gene
(the thy gene) and the remaining strains have been identified by a multiplex PCR system
developed by Bubert et al. (1999).

Chapter 3 Identification of Listeria species by ANN-based FTIR
29
For the sequence analysis of the iap and thy genes 9 ml of liquid culture grown in 10 ml of
BHI (Brain Heart Infusion, Oxoid, England) broth at 30°C was harvested, resuspended in 2
ml of purified water and kept at –20°C. Eight microliters of this lysat served as a template for
a 100 µl PCR reaction. Thermal cycling was performed in a Techne Cyclone Gradient cycler
(Pequlab, Erlangen, Germany). The iap gene was PCR amplified and sequenced using the
primers iap-P-V/57 (5’-ATG AAT ATG AAA AAA GCA ACT ATC GC), and iap-P-R/57
(5’-TTA TAC GCG ACC GAA GCC AA). These primers bind at the 5’ and 3’ ends of the
iap gene, covering the entire iap sequence and were designed by ClustalW
(http://www.ebi.ac.uk/clustalw/) alignments of Entrez Nucleotides database Listeria
sequences (http://www.ncbi.nlm.nih.gov/entrez/query.fcgi?db=Nucleotide). The internal
primer iap_F700/58 (5’-GTC ATG GAA TAA TTT ATC T[G/T]C TTC TTC) was used for
DNA sequencing. PCR was performed using 50 µl AB-Gene 2x Reddy Mix with 1.5 mM
MgCl2 (AB-Gene, Hamburg), 8 µl of lysate, 1 µl of each primer [50 pmol/µl], and 40 µl of
purified water. Thermal cycling conditions were 5 min at 95°C, followed by 29 cycles of 20 s
at 95°C, 30 s at 50°C, and 1 min 40 s at 72°C.
The thy gene was PCR amplified and sequenced using the primers thy_2_F/62 (5’-GAG GAA
ATG ATG GAA CGC TGG GA), and thy_1_R/60 (5’-TAT T[G/C]C C[A/G]G CGC GGT
CTT GTG). These primers bind in the non coding region of the thy gene, and were designed
based on one L. monocytogenes thy sequence provided by Pascale Cossart (Institute Pasteur,
France), and homologous GenBank sequences identified by Blast search
(http://www.ncbi.nlm.nih.gov/BLAST/). All primers were checked using Netprimer
(http://www.premierbiosoft.com/netprimer/netprlaunch/netprlaunch.html). PCR was
performed as described for the iap gene, using the following thermal cycling conditions: 5
min at 95°C, followed by 27 cycles, each consisting of 20 s at 95°C, 30 s at 54°C, and 1 min
50 s at 72°C. PCR products were purified using QIAquick 96 PCR Purification Kit (Qiagen,
Hilden, Germany). Sequencing was performed at Sequiserve (Willi Metzger, Vaterstetten,
Germany). The complete coding region of the thy gene was sequenced. Sequences were
aligned using ClustalW (http://genius.embnet.dkfz-heidelberg.de/menu/w2h/w2hdkfz/ or
http://www.ebi.ac.uk/clustalw/) and edited using Jalview (http://[email protected]
heidelberg.de/menu/w2h/w2hdkfz/ or http://www.ebi.ac.uk/~michele/jalview/). Dendrograms
were constructed using Jalview.

Chapter 3 Identification of Listeria species by ANN-based FTIR
30
3.3.3 Identification of the validation strain set isolates
A set of 277 strains representing five species of Listeria of diverse habitats (foods,
environment, animals and humans from South and North America, Central, North and South
Europe) were used for the external validation of the ANN model. This strain set will be
referred to in the rest of this paper as the external validation strain set (see Appendix II of
chapter 7). These strains have been identified by a phenotypic API-Listeria test (bioMérieux,
Marcy-l’Etoile, France) according to the manufacturer’s instructions. Additionally, these
strains were examined for the presence of hemolysis activity using a tube test with an
erythrocyte suspension. Briefly, the serum was carefully removed from fresh, sterile and
defibrinated sheep blood (Oxoid, England), and a 2% (vol/vol) suspension of the erythrocytes
was made in phosphate-buffered saline (pH 7.2). A total of 1ml of Listeria culture grown
overnight at 37°C in brain heart infusion broth was mixed with 1ml of the erythrocyte
suspension. After incubation for 24 h at 37°C, the presence or absence of hemolysis was
observed.
The Multiplex PCR system developed by Bubert et al. (1999) was used for the differentiation
of Listeria spp. belonging to the external validation strain set when API and FT-IR
identification was discordant. DNA was prepared by using one loop of bacterial cells which
were homogenized in 200 µl Mili-Q water. Cells were disrupted using 0.5 g zirconia/silica-
beads (0.1 mm diameter, Roth, Karlsruhe, Germany) by shaking two times at 6.5 m s-1 for 45
s in a Hybaid RiboLyser-cell disrupter™ (Middlesex, UK). Afterwards, the lysate was
separated by centrifugation at 13,000 x g for 3.5 min. DNA amplification reactions were
carried out in 50 µl final volume containing 25 µl Reddy Mix [75 mM Thris-HCL (pH 8.8),
20mM (NH4)2SO4, 1.5 mM MgCl2, 0.01% (v/v) Tween 20, 0.2 mM of each
deoxyribonucleoside triphosphate, 1.25 U of Taq polymerase] from PCR Master Mix,
ABgene (Surrey, UK), 8 µl of lysate, and 1mM of each primer. The primer combination and
PCR conditions were as described previously (Bubert et al. 1999).
3.3.4 Measurement of FT-IR spectra
The strains stored at – 80°C were streaked and subcultured on agar plates of tryptone soy agar
(TSA) (Oxoid, Basingstoke, Hampshire, England) for 24 h. The growth temperature was 37 ±
2°C. The sample preparation for the IR absorbance measurements was performed as described
by Oberreuter et al. (Oberreuter et al. 2002b). Prior to the spectral measurements, the sample
holder was sealed with a KBr cover plate to prevent contamination of the spectrometer. The
spectra were recorded and evaluated according to Oberreuter et al. (Oberreuter et al. 2002b).

Chapter 3 Identification of Listeria species by ANN-based FTIR
31
For data processing such as calculation of derivatives and normalization, the software OPUS
version 4.2 for Windows NT (Bruker, Germany) was used. First derivatives of the original IR
spectra were calculated using a 9-point Savitzky-Golay filter to minimize problems from
unavoidable baseline shifts. It was observed that the identification quality increases with the
inclusion of additional repetitive measurements per strain in the reference dataset. Best
identification was achieved with ten independent measurements (from independent bacterial
cultures) of each strain being included in the reference database to ensure a sufficient
coverage of biological variance of growth and sampling procedure, although a standard and
strict operation procedure was established (data not shown). The success of ANN modeling
strongly depends on the quality of the spectra (Schmitt and Udelhoven 2001). Therefore, the
thresholds for minimum absorbance (0.25) and maximum absorbance (1.20) for detector
linearity, signal-noise (S/N) ratio with a noise maximum of 1.5 x 10⁻⁴ U, and a water vapor
content of the spectral measurements of <3 x 10⁻⁴ U were predefined, and this quality test
procedure was applied to each spectrum.
3.3.5 Univariate FT-IR analysis
The selection of relevant spectral ranges and establishment of the cutoff values of spectral
distance (SD) for the identification of Listeria at the species level were done. In order to
establish the SD value, three independent measurements of five strains of each Listeria
species were used. The calibration of their SD threshold value for a correct identification of
an isolate at species level was done using a procedure based on Oberreuter et al. (Oberreuter
et al. 2002b). In our case the windows from 900 to 1,200, 1,250 to 1,650, and 2,830 to 3,030
cm-1 (all weight factors were 30) and a cutoff value of the SD 0.5 were used. This implies that
the spectral distance between an isolate and the first hit of the identification hit list must be
<0.5 to yield a valid identification at the species level. Then, 10 repetitive measurements from
independent sample preparations of all reference strains were performed, resulting in 2,430
spectra, which were added to the reference spectral library.
3.3.6 Artificial Neural Network based FT-IR identification
Before artificial neural network analysis, hierarchical cluster analysis (HCA) of the spectra in
the reference library was used as a first step in developing the Listeria species identification
scheme based on ANN. The HCA was performed using the first derivative of the original
spectra as input in the regions 700 to 1,200, 1,500 to 1,800, and 2,800 to 3,100 cm-1,
correlation with scaling to first range and Ward’s algorithm according to the OPUS software

Chapter 3 Identification of Listeria species by ANN-based FTIR
32
(Bruker). The two major groupings resulting from this HCA were used to establish the first
layer of the two-layered neural network. Afterwards, the subsequent subnets were optimized
for the respective classification at the species level.
For the ANN analysis, 2,430 spectra of the reference dataset were randomly distributed into a
training set (8 spectra of each strain), pre-validation set (1 spectrum of each strain), and test
set (1 spectrum of each strain). Prior to the artificial neural network analysis the spectral
windows between 700 and 1,800 cm-1, and 2,800 and 3,100 cm-1 were predefined in a data
pre-processing step. For spectral feature selection, the most discriminative 61 wavelengths
(Fig. 3.1) were selected based on the calculation of the covariance of the spectra data points
(Schmitt and Udelhoven 2001). The Synthon NeuroDeveloper® software (Synthon,
Heidelberg, Germany) was used to perform feature selection and to establish a two-layer
neural network with 61 input neurons, one hidden unit, and two output units. For each
classification level, a fully-connected feed-forward neural network was trained using the
Rprop algorithm (Schmitt and Udelhoven 2001).
1000150020002500300035004000
A. U
Wavenumber (cm-1)
5001000150020002500300035004000
A. U
Wavenumber (cm-1)
500
Fig. 3.1 First derivative of a Listeria FTIR spectrum. The regions of the infrared spectra contributing
most significantly to the differentiation of the five Listeria species are highlighted. A.U., arbitrary
units.
3.3.7 Validation of FT-IR identification procedures
To test both FT-IR univariate and FT-IR artificial neural network identification models, an
internal validation was performed. One randomly selected spectrum of each strain in the

Chapter 3 Identification of Listeria species by ANN-based FTIR
33
database was excluded and used to construct a test set. This test set containing independent
spectra of each reference strain was used to test the reference dataset and the results
determined at species level.
As a final test of performance, the validation strain set of 277 independent Listeria isolates,
whose spectra were not included in the reference database, was identified by both univariate
and ANN methods in an external validation.
3.4 Results and discussion
3.4.1 Modular architecture of the Artificial Neural Network
A modular ANN model was constructed for species identification at the basis of Hierarchical
Cluster Analysis (HCA) groupings. HCA is a technique which groups IR spectra based on the
overall similarity to other spectra. This technique can be applied “unsupervised”, due to its
ability to perform the comparisons mathematically without predetermined information. In
contrast, the ANN model was used as a “supervised” method of analysis based on a learning
procedure which can classify unknown samples into predetermined groups. The similarity
between the species observed in the HCA analysis, representing the Listeria reference spectra
dataset, provided information to develop modules of ANN with optimized classification
performance through individual feature selection and network architecture. The modules are
later integrated in one ANN classification system (Schmitt and Udelhoven 2001). Figure 3.2a
shows the two major groups resulting from the cluster analysis which were used to establish
the first level of the ANN architecture comprising the L. innocua-L. ivanovii-L. welshimeri
net and the L. monocytogenes-L. seeligeri net. Then, according to the outputs of this first level
in the ANN classification scheme, specialized networks were activated at a second level,
determining the species-specific subnetworks (Fig. 3.2b). Based on this classification scheme,
the discrimination of Listeria down to the species level resulted from the projection of an
unknown Listeria spectrum from the first level to the second level. When, in the first level,
this spectrum is predicted to belong to one of the nets at this level, the output from this first
level is projected to the second level to distinguish between the respective species available in
the respective subnet.
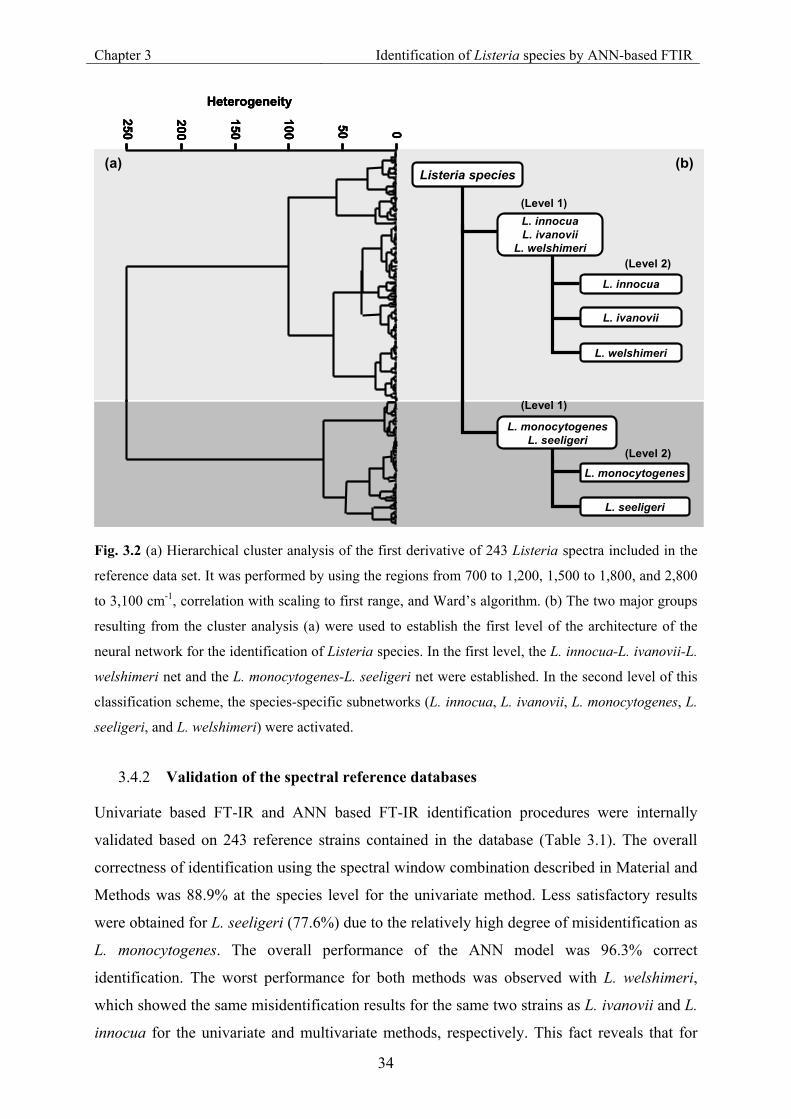
Chapter 3 Identification of Listeria species by ANN-based FTIR
34
050
100
150
200
250
Heterogeneity
Listeria species
L. innocuaL. ivanovii
L. welshimeri
L. innocua
L. monocytogenesL. seeligeri
L. welshimeri
L. ivanovii
L. monocytogenes
L. seeligeri
(a) (b)
(Level 1)
(Level 1)
(Level 2)
(Level 2)
050
100
150
200
250
Heterogeneity
Listeria species
L. innocuaL. ivanovii
L. welshimeri
L. innocua
L. monocytogenesL. seeligeri
L. welshimeri
L. ivanovii
L. monocytogenes
L. seeligeri
(a) (b)
050
100
150
200
250
Heterogeneity
Listeria species
L. innocuaL. ivanovii
L. welshimeri
L. innocua
L. monocytogenesL. seeligeri
L. welshimeri
L. ivanovii
L. monocytogenes
L. seeligeri
(a) (b)
(Level 1)
(Level 1)
(Level 2)
(Level 2)
Fig. 3.2 (a) Hierarchical cluster analysis of the first derivative of 243 Listeria spectra included in the
reference data set. It was performed by using the regions from 700 to 1,200, 1,500 to 1,800, and 2,800
to 3,100 cm-1, correlation with scaling to first range, and Ward’s algorithm. (b) The two major groups
resulting from the cluster analysis (a) were used to establish the first level of the architecture of the
neural network for the identification of Listeria species. In the first level, the L. innocua-L. ivanovii-L.
welshimeri net and the L. monocytogenes-L. seeligeri net were established. In the second level of this
classification scheme, the species-specific subnetworks (L. innocua, L. ivanovii, L. monocytogenes, L.
seeligeri, and L. welshimeri) were activated.
3.4.2 Validation of the spectral reference databases
Univariate based FT-IR and ANN based FT-IR identification procedures were internally
validated based on 243 reference strains contained in the database (Table 3.1). The overall
correctness of identification using the spectral window combination described in Material and
Methods was 88.9% at the species level for the univariate method. Less satisfactory results
were obtained for L. seeligeri (77.6%) due to the relatively high degree of misidentification as
L. monocytogenes. The overall performance of the ANN model was 96.3% correct
identification. The worst performance for both methods was observed with L. welshimeri,
which showed the same misidentification results for the same two strains as L. ivanovii and L.
innocua for the univariate and multivariate methods, respectively. This fact reveals that for
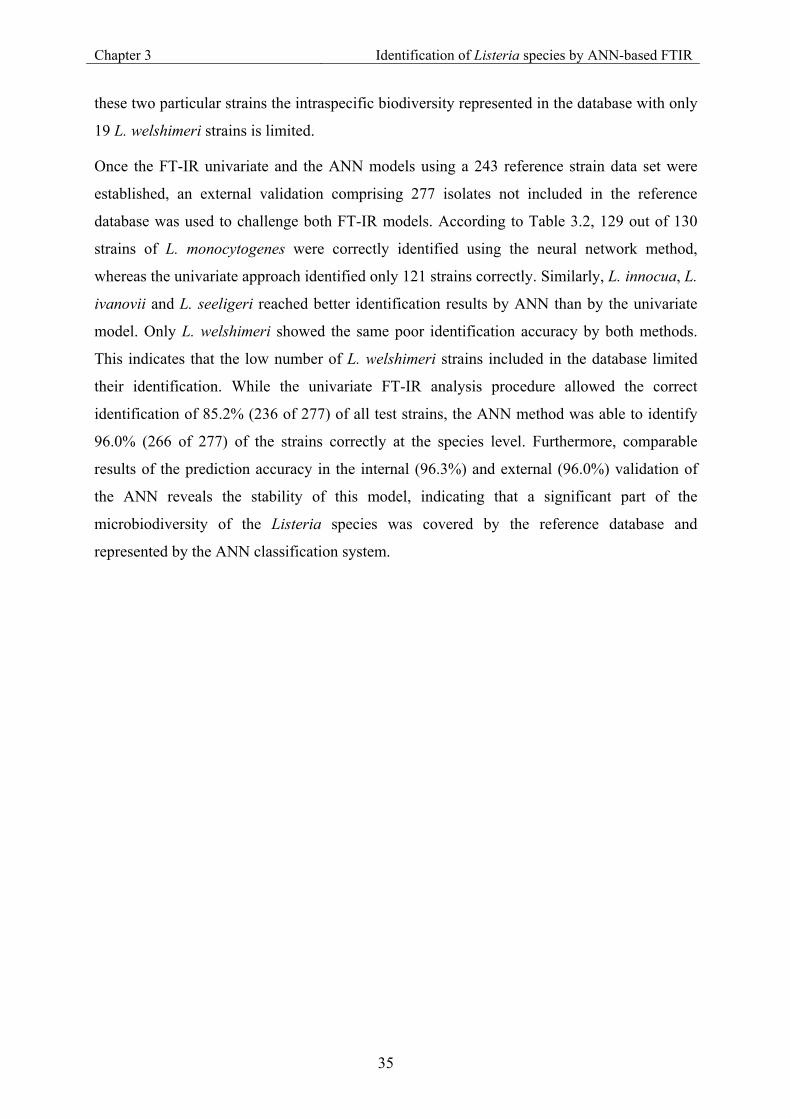
Chapter 3 Identification of Listeria species by ANN-based FTIR
35
these two particular strains the intraspecific biodiversity represented in the database with only
19 L. welshimeri strains is limited.
Once the FT-IR univariate and the ANN models using a 243 reference strain data set were
established, an external validation comprising 277 isolates not included in the reference
database was used to challenge both FT-IR models. According to Table 3.2, 129 out of 130
strains of L. monocytogenes were correctly identified using the neural network method,
whereas the univariate approach identified only 121 strains correctly. Similarly, L. innocua, L.
ivanovii and L. seeligeri reached better identification results by ANN than by the univariate
model. Only L. welshimeri showed the same poor identification accuracy by both methods.
This indicates that the low number of L. welshimeri strains included in the database limited
their identification. While the univariate FT-IR analysis procedure allowed the correct
identification of 85.2% (236 of 277) of all test strains, the ANN method was able to identify
96.0% (266 of 277) of the strains correctly at the species level. Furthermore, comparable
results of the prediction accuracy in the internal (96.3%) and external (96.0%) validation of
the ANN reveals the stability of this model, indicating that a significant part of the
microbiodiversity of the Listeria species was covered by the reference database and
represented by the ANN classification system.

Table 3.1 Internal validation of the Listeria infrared spectral reference database
Univariate FT-IR analysis ANN identification Species
N° of Strains tested
Correct Identification
% (No)
Mis-identificationa
% (No)
No identificationb
% (No).
Correct identification
% (No)
Mis-identificationc
% (No)
No identificationd
% (No)
L. innocua 65 95.4 (62) 3.1 (2) 1.5 (1) 98.5 (64) 1.5 (1) -
L. ivanovii 41 87.8 (36) 12.2 (5) - 95.1 (39) 4.9 (2) -
L. monocytogenes 69 91.3 (63) 8.7 (6) - 97.1 (67) 2.9 (2) -
L. seeligeri 49 77.6 (38) 22.4 (11) - 96.0 (47) 4.0 (2) -
L. welshimeri 19 89.5 (17) 10.5 (2) - 90.0 (17) 10.0 (2) - Total
243 88.9 (216) 11.0 (26) 0.1 (1) 96.3 (234) 3.7 (9) - a Strains yielding an Spectral Distance (SD) value below or equal to the threshold value of 0.5 used for correct identification of Listeria species, but their identification corresponded to a different species. b Strains yielding an SD value higher than the threshold value of 0.5 used for correct identification of Listeria species. c Strains yielding identification results corresponding to a different species. d Strains not yielding identification.
Chapter 3 Identification of Listeria species by A
NN
-based FTIR
36
Table 3.2 External validation of the identification potential of univariate FT-IR, ANN and API using 277 Listeria strains not included in the reference dataset
Univariate FT-IR analysis ANN identification API Listeria Species
N° of Strains tested
Correct Identification
% (No.)
Mis-identificationa
% (No.)
No Identificationb
% (No.)
Correct Identification
% (No.) Mis-identificationc
% (No.)
No identificationd
% (No.)
Correct identification
% (No.)
Mis-identificatione
% (No.)
No identificationf
% (No.)
L. innocua 60 91.7 (55) 8.3 (5) - 93.3 (56) 6.7 (4) - 90.0 (54) 8.3 (5) 1.7 (1) L. ivanovii 28 71.4 (20) 28.6 (8) - 96.4 (27) 3.6 (1) - 89.3 (25) 3.6 (1) 7.1 (2) L. monocyto genes 130
93.0 (121) 7.0 (9) - 99.2 (129) 0.8 (1) - 93.1 (121) 6.9 (7) 1.5 (2)
L. seeligeri 48 64.6 (31) 35.4 (17) - 93.8 (45) 6.2 (3) - 75.0 (36) 2.1 (1) 22.9 (11) L. welshimeri 11 81.8 (9) 18.2 (2) - 81.8 (9) 18.2 (2) - 72.7 (8) - 27.3 (3) Total 277 85.2 (236) 14.8 (41) - 96.0 (266) 4.0 (11) - 88.0 (244) 5.1 (14) 6.9 (19)
a Strains yielding a Spectral Distance value SD below or equal to the threshold value of 0.5 used for correct identification of Listeria species, but their
identification corresponded to an incorrect species. b Strains yielding a Spectral Distance value SD higher than the threshold value of 0.5 used for correct identification of Listeria species. c Strains yielding identification results corresponded to an incorrect species. d Strains yielding not identification results. e Strains yielding identification results corresponded to an incorrect species. f Strains yielding none or multiple results.
Chapter 3 Identification of Listeria species by A
NN
-based FTIR
37
Chapter 3 Identification of Listeria species by ANN-based FTIR
38
3.4.3 Influence of the number of the reference strains on the identification success
Three ANN reference databases with 100, 171 and 243 randomly chosen strains, respectively,
were compiled. The same 277 validation strain set described above was identified by all three
databases (Fig. 3.3). In general, as expected, the inclusion of more biological intraspecies
variability leads to an improvement of interspecies differentiation. This is in accordance with
previous studies for other microbes (Maquelin et al. 2003, Oberreuter et al. 2002b).
Oberreuter et al. (Oberreuter et al. 2002b) reported for the coryneform bacteria that, on
average, 5 to 10 strains of a species are needed to achieve an identification success of
approximately 90%. We have observed that the species of the genus Listeria require more
strains per species (around 20 to 25) to better cover the natural intraspecies variability range
(see chapter 2). Hence, a good representation of the species biodiversity in the reference
database will allow a reasonable identification capacity. We have observed that the addition
of more L. innocua strains not only improved the identification results of L. innocua, but also
improved those of L. ivanovii. This is in agreement with the observation that L. ivanovii was
mostly misidentified as L. innocua by the ANN models based on analysis of 100 and 171
strains (data not shown). This was supported by the noticeable increase of correct L. ivanovii
identification from 89.3% to 96.4% when only a single strain of L. ivanovii was added to the
ANN model with 171 strains. It was also noted that inclusion of more L. monocytogenes and
L. seeligeri strains yielded a large improvement of their correct identifications. While for L.
monocytogenes the identification success is near to perfect (99.2%), L. welshimeri
identification results did not improve when ANN based on 171 strains was compared to ANN
comprising all 243 strains. This led us to speculate that the species L. welshimeri contains
strains whose FT-IR absorption differences are not mainly due to specific cellular structures.
Therefore, the database must include more strains for L. welshimeri to cover the entire
biological variance of this species.

Chapter 3 Identification of Listeria species by ANN-based FTIR
39
L. innocua
L. ivanovii
L. monocyt.
L. seeligeri
L. welshim.
55
60
65
70
75
80
85
90
95
100
50 100 150 200 250
N° of strains
Corr
ect i
dent
ifica
tion
(%)
(25)(40)
(69)
(30)
(47)
(20)
(40)
(49)
(10)
(17) (19)
(65)
(27)
(15)
(41)
L. innocua
L. ivanovii
L. monocyt.
L. seeligeri
L. welshim.
55
60
65
70
75
80
85
90
95
100
50 100 150 200 250
N° of strains
Corr
ect i
dent
ifica
tion
(%)
(25)(40)
(69)
(30)
(47)
(20)
(40)
(49)
(10)
(17) (19)
(65)
(27)
(15)
(41)
Fig. 3.3 Comparison of the external validation of the ANN model using three different reference data
sets including 100, 171, and 243 strains. The number of strains per species included in each data set is
indicated in parentheses.
3.4.4 Comparison of API and FT-IR/ANN based Listeria identification
Considering that the API Listeria system has been listed as one of the preferred rapid methods
for the biochemical identification of Listeria species in the routine microbiology food
laboratory (Hitchins 2003), we applied this technique as a second identification method to the
277 isolates of the validation strain set. This system allows a 24-h identification of all Listeria
species, based on 10 sugar fermentation reactions and enzymatic reactions in microtubes,
usually without the need for additional tests (Bille et al. 1992). Discordances between the FT-

Chapter 3 Identification of Listeria species by ANN-based FTIR
40
IR-ANN method and API analysis were found for 39 out of the 277 strains. To resolve this
conflicting data, multiplex PCR of the iap gene was performed (Bubert et al. 1999). This
method confirmed the FT-IR-ANN results for 28 of the 39 discordances. On the other side,
the multiplex PCR confirmed the API test for 6 strains only. The remaining 5 of the 39
discordant strains were unidentified by the API kit and were misidentified by the ANN
method. The API Listeria test kit therefore provided a correct identification for 244 of the 277
isolates (88.0%), while the FT-IR-artificial neural network correctly identified 266 of the 277
isolates (96.0%) (Table 3.2). In this study, the API Listeria system misidentified 14 (5.1%) of
the isolates. Most important, seven strains of the pathogenic species L. monocytogenes were
misidentified as the nonpathogenic L. innocua, due to ambiguous results from the DIM
reaction of the API test system. Additionally, for 10 strains the hemolysis test has been used
as a supplementary test when the API Listeria system indicated inconclusive results. Several
publications on the identification capacity of the API for Listeria species reported similar
limitations (Bille et al. 1992, Johnson 1993, Paillard et al. 2003).
Table 3.3 Comparison of the Sensitivity, Specificity and Accuracy of ANN and API identification
procedures.
Method No. of strains* TP TN FP FN Sensitivity
(%) Specificity
(%) Accuracy
(%) ANN 277 129 142 5 1 99.2 96.6 97.8 API Listeria 277 121 144 3 9 94.6 96.0 95.7
Abbreviations: TP, true positives; TN, true negatives; FP, false positives; FN, false negatives. Sensitivity is calculated as TP/(TP+FN), specificity is TN/(TN+FP), and accuracy is (TN+TP)/(TN+TP+FN+FP) * These strains were not included in the reference database.
Based on the identification of the 277 validation-strain set, the sensitivity, specificity and
accuracy of the two methods in terms of their reliability to detect the human pathogen L.
monocytogenes were evaluated. Sensitivity is defined as the ability of a test to detect a true L.
monocytogenes sample when it is truly present. Specificity is defined as the ability of the test
to detect the presence of L. monocytogenes in the sample when it is truly not present;
accuracy relates to the closeness of the results to the true identification (American College of
Physicians 2005, Dytham 1999). The data in Table 3.3 clearly demonstrate for all three
parameters that ANN-based FT-IR identification is the superior method. No other
phenotypical method so far described in the literature provides an overall correct
identification of 96% for all Listeria species and a success rate of 99.2% for correct L.
monocytogenes identification. ANN-based FT-IR identification therefore appears to be a
Chapter 3 Identification of Listeria species by ANN-based FTIR
41
promising technique for the semiautomated and rapid identification of Listeria species in 25 h
in a routine food microbiological laboratory.
3.5 Acknowledgement
This work was supported in part by the FEI (Forschungskreis der Ernährungsindustrie e.V.,
Bonn), the AiF (Arbeitskreis für industrielle Forschung) and the Ministry of Economics and
Technology, project No. 14126N. We thank Prof. Dr. Hof, Mannheim (Germany), Prof. Dr.
Wagner, Vienna (Austria), Dr. Buck, Wangen (Germany), Dr. Montel, Aurillac (France),
Karina Pellicer and Dr. Echeverría, La Plata (Argentina), Biserka Becker and Prof. Dr.
Holzapfel, Karlsruhe (Germany), Dr. Schmidt (Germany), Dr. Eliskases-Lechner, Rotholz
(Austria), and Dr. Bubert (Germany) for kindly providing Listeria strains and Dr. Pascale
Cossart, Paris (France) for providing us with the thymidilate synthase gene sequence of L.
monocytogenes. Special thanks to Jochen Dietrich and Stefanie Rubenwolf for practical
support in our laboratory.

Chapter 4 Differentiation of Listeria monocytogenes serovars by ANN-based FTIR
42
4 Differentiation of Listeria monocytogenes serovars by using Artificial
Neural Network Analysis of Fourier-Transformed Infrared Spectra
4.1 Summary
A classification system based on Fourier Transform Infrared (FTIR) spectroscopy combined
with artificial neural network (ANN) analysis was designed to differentiate 12 serovars of
Listeria monocytogenes using a reference database of 106 well-defined strains. External
validation was performed using a test set of another 166 L. monocytogenes strains. The O
antigens (serogroup) of 164 strains (98.8%) could be identified correctly, and H antigens were
correctly determined in 152 (91.6%) of the test strains. Importantly, 40 out of 41 potentially
epidemic serovar 4b strains were unambiguously identified. FTIR analysis is superior to PCR-
based systems for serovar differentiation and has potential for the rapid, simultaneous
identification of both species and serovar of an unknown Listeria isolate by simply measuring
a whole-cell infrared spectrum.
4.2 Introduction
Human listeriosis, caused by the pathogen Listeria monocytogenes, mainly is a consequence
of the ingestion of contaminated food products and remains a significant public health
problem (Gray et al. 2006, Kathariou 2002, Rudolf and Scherer 2001). Since many different
contamination routes for this ubiquitous bacterium have been reported (Lemunier et al. 2005,
Paillard et al. 2005, Wagner et al. 2005), the development of rapid and accurate typing
methods is of particular importance. A substantial number of sensitive, discriminatory and
reproducible typing technologies have therefore been developed (Liu 2006).
L. monocytogenes expresses O-somatic and H-flagellar antigens which, by their unique
combination, determine the serovar (serotype) of individual strains. Thirteen serovars have
been found in this species by using specific and standardized sera (Seeliger and Langer 1979).
However, traditional serotyping presents a number of limitations such as the commercial
availability and high cost of sera, as well as limited reproducibility. Palumbo et al. (Palumbo
et al. 2003) therefore proposed a low-cost enzyme-linked immunosorbent assay combined
with commercial antisera for the differentiation of L. monocytogenes serovars. This method,
nevertheless, is of limited potential for application in routine laboratories due to the complex
and laborious protocol. Consequently, very few diagnostic laboratories offer conventional
serotyping of L. monocytogenes.

Chapter 4 Differentiation of Listeria monocytogenes serovars by ANN-based FTIR
43
Most clinical isolates belong to serovars 1/2a, 1/2b and 4b; among these, the majority of
strains which have caused large outbreaks are serovar 4b (Kathariou 2000). In contrast, most
food strains belong to serovar 1/2c (Jacquet et al. 2002, Yildirim et al. 2004). There is now
considerable evidence that epidemic serovar 4b clones express specific virulence biomarkers
(Jacquet et al. 2004) and carry distinct genetic markers (Liu et al. 2006, Yildirim et al. 2004).
So far, only a few well-known strains of serovar 1/2a and 4b have been used to study the
virulence of L. monocytogenes. Virulence attributes specific to other clinical or food related
serovars cannot yet effectively be addressed. Although there are no specific legal
specifications for serotyping in terms of food safety or risk assessment at this time, serovar
differentiation may be helpful in the future when additional knowledge concerning the
relation between the serovar and pathogenic potential of Listeria monocytogenes becomes
avalailable (Kathariou 2002).
Infrared spectra of microorganisms reflect the overall structure of the molecular constituents
of the cell (Naumann et al. 1991, Naumann et al. 1996), and Fourier transform infrared
spectroscopical (FTIR) analysis of intact cells has been used to distinguish bacteria at
different taxonomic levels (Helm et al. 1991a). Extensive reference libraries containing
thousands of spectra of well-characterized microorganisms can be used for the rapid
identification of unknown isolates at the species level (Helm et al. 1991, Kümmerle et al.
1998, Maquelin et al. 2003, Oberreuter et al. 2002b, Wenning et al. 2002). A powerful
method for data-processing to interpret these complex spectral patterns is an important key for
a successful identification. Advanced multivariate methods such as artificial neural networks
(ANN) have been shown to be especially advantageous for the analysis of subtle differences
at, and partially below, the species level (Goodacre et al. 1996, Schmitt and Udelhoven 2001,
Udelhoven et al. 2000). Recently, Rebuffo et al. (Rebuffo et al. 2006) described a superior
ANN-based FTIR method for the identification of Listeria monocytogenes and related
Listeria species.
FTIR studies on Escherichia coli and Salmonella enterica for differentiation of serotypes
based on variations in their lipopolysaccharide have been undertaken (Helm et al. 1991a, Kim
et al. 2005). However, neither study used a sufficient number of strains to be statistically
relevant or resolved the differentiation of all serovars. Therefore, it remains unclear whether
FTIR spectroscopy potentially may differentiate the serovars of pathogens, in particular if the
technique is applied to a large number of strains covering a significant part of the intraspecific
biodiversity. In this study, we therefore applied FTIR combined with ANN to a large and
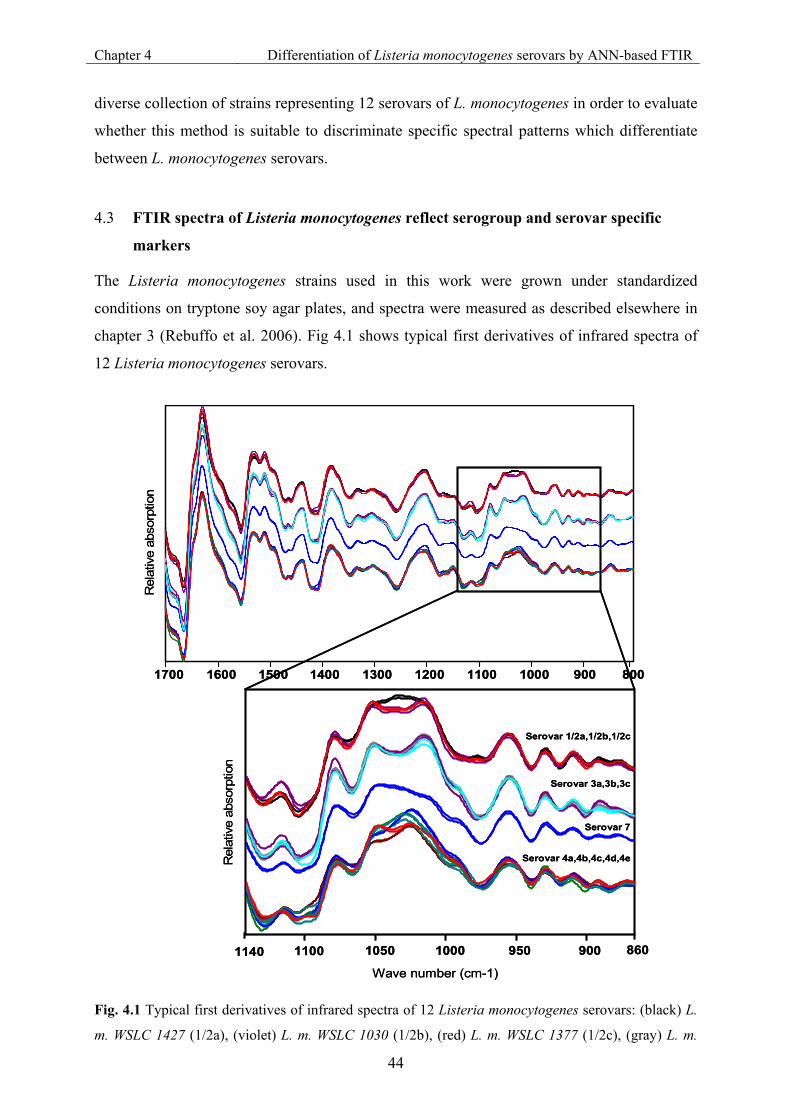
Chapter 4 Differentiation of Listeria monocytogenes serovars by ANN-based FTIR
44
diverse collection of strains representing 12 serovars of L. monocytogenes in order to evaluate
whether this method is suitable to discriminate specific spectral patterns which differentiate
between L. monocytogenes serovars.
4.3 FTIR spectra of Listeria monocytogenes reflect serogroup and serovar specific
markers
The Listeria monocytogenes strains used in this work were grown under standardized
conditions on tryptone soy agar plates, and spectra were measured as described elsewhere in
chapter 3 (Rebuffo et al. 2006). Fig 4.1 shows typical first derivatives of infrared spectra of
12 Listeria monocytogenes serovars.
90010001100120013001400150016001700 800
Serovar 1/2a,1/2b,1/2c
Serovar 3a,3b,3c
Serovar 7
Serovar 4a,4b,4c,4d,4e
900950100010501100
Rel
ativ
e ab
sorp
tion
1140 860
Wave number (cm-1)
Rel
ativ
e ab
sorp
tion
90010001100120013001400150016001700 800
Serovar 1/2a,1/2b,1/2c
Serovar 3a,3b,3c
Serovar 7
Serovar 4a,4b,4c,4d,4e
900950100010501100
Rel
ativ
e ab
sorp
tion
1140 860
Wave number (cm-1)
Rel
ativ
e ab
sorp
tion
Fig. 4.1 Typical first derivatives of infrared spectra of 12 Listeria monocytogenes serovars: (black) L.
m. WSLC 1427 (1/2a), (violet) L. m. WSLC 1030 (1/2b), (red) L. m. WSLC 1377 (1/2c), (gray) L. m.

Chapter 4 Differentiation of Listeria monocytogenes serovars by ANN-based FTIR
45
WSLC 1485 (3a), (violet) L. m. WSLC 1444 (3b), (sky-blue) L. m. WSLC 11082 (3c), (brown) L. m.
WSLC 1939 (4a), (red) L. m. WSLC 1634 (4b), (blue) L. m. WSLC 11094 (4c), (gray) L. m. WSLC 1045
(4d), (green) L. m. WSLC 1761 (4e), (blue) L. m. WSLC 1932 (7). Each strain is represented by two
independent spectra to show the reproducibility of the measurements. Spectra are stacked to clearly
show the spectral differences among the four serogroups (1/2, 3, 7 and 4). The polysaccharide region
(1,200-900 cm-1) has been expanded to show the subtle differences between and within the serogroups.
L. m. (Listeria monocytogenes); WSLC (Weihenstephan Listeria Collection).
At a first glance, the polysaccharide region between 900 to 1,200 cm-1 displays the most
prominent spectral differences among the four serogroups (1/2, 3, 7 and 4). This indicates that
carbohydrate containing structures are involved in serogroup discrimination. Moreover, subtle
spectral differences within each serogroup due to serovar-specific markers were observed.
FTIR spectra of 106 L. monocytogenes strains, including the 69 reference strains of L.
monocytogenes studied by Rebuffo et al. (Rebuffo et al. 2006) and comprising all known
serovars (see Appendix III of chapter 7) were used for hierarchical cluster analysis (HCA)
(Fig. 4.2A). This HCA was performed as described by Rebuffo et al. (Rebuffo et al. 2006)
using the first derivative of the original spectra covering the regions from 900 to 1,200 and
1,400 to 1,800 cm-1. One major cluster corresponded to the serogroups 1/2, 3 and 7, while
another cluster corresponded to serogroup 4. This observation is in accordance with two
distinct structural types of teichoic acids found previously for serogroups 1/2, 3 and 7 versus
serogroup 4 (Fiedler 1984).
A serogroup 4-specific gene cassette which is absent in serovar 1/2b strains has been found
(Lei et al. 2001), and DNA array studies of 13 genes involved in cell wall biosynthesis
revealed the same grouping of L. monocytogenes serovars (Doumith et al. 2004b) .
These two major serovar groups were used to establish level 1 of a four-layered neural net
(Fig. 4.2B). The construction and optimization of the ANN are described in more detail in the
section below (4.4 of this chapter).

Chapter 4 Differentiation of Listeria monocytogenes serovars by ANN-based FTIR
46
Serovar 4a, 4b, 4c, 4d, 4e7Serovar 3a, 3b, 3cSerovar 1/2a, 1/2b, 1/2c
0
20
40
60
80
100
120
140
160
180
200
Het
erog
enei
ty
Serovar 4a, 4b, 4c, 4d, 4eSerovar 1/2a, 1/2b, 1/2c
Serovar 3a, 3b, 3cSerovar 7
Serovar4d
Serovar 4b,4d
Serovar 4e
Serovar 4b, 4d, 4e
Serovar 4a, 4c
Serovar4c
Serovar 3a, 3b, 3c
Serovar 1/2a, 1/2b, 1/2c
Serovar1/2b
Serovar 1/2a,1/2b
Serovar 1/2c
Serovar 7
Serovar3b
Serovar 3a,3b
Serovar 3c
Level 1
Level 2
Level 3
Level 4 Serovar 1/2a
Serovar 3a
Serovar 4b
Serovar 4a
(A)
(B)
Art
ifici
al N
eura
l Net
wor
kH
iera
rchi
calC
lust
er A
naly
sis
Fig. 4.2 (A) Hierarchical cluster analysis of the first derivative of 106 L. monocytogenes strains
belonging to 12 serovars, and included in the reference dataset. Spectral regions used: 900- 1,200 cm-1,
and 1,400- 1,800 cm-1, correlation with scaling to first range, and Ward‘s algorithm. (B) Artificial
Neural Network classification scheme for the discrimination of serogroups and serovars.
4.4 Construction and optimization of the Artificial Neuronal Nets (ANN)
For the ANN development, 1,060 spectra of independent cultures (10 spectra per strain) were
randomly distributed into a training set (8 spectra of each strain), a prevalidation set (1
spectrum of each strain) and a test set (1 spectrum of each strain). The NeuroDeveloperTM
software (Synthon GmbH, Heidelberg, Germany, www.synthon-analytics.com) was used in
order to perform spectral preprocessing and to establish a modular, hierarchical ANN with
four levels of spectral classification (Udelhoven et al. 2003).

Chapter 4 Differentiation of Listeria monocytogenes serovars by ANN-based FTIR
47
Spectral preprocessing was performed prior to the artificial neural network development by
using spectral windows between 1,800- 1,400 and 1,200- 900 cm-1 based on first derivates
containing differential information of the molecular composition in FT-IR spectra of bacteria
(Fig. 4.1). This pre-selection was further enhanced by a subsequent feature selection
algorithm based on covariance analysis followed by a ranking, selecting the most
discriminative wavelengths. These wavelengths have been applied to a fully connected feed-
forward artificial neural network training using the Rprop (Resilient back-propagation)
algorithm (Schmitt and Udelhoven 2001). Each module was trained individually and
optimized using individual feature selection procedure and network architecture. Module one,
for first level classification, was established with 15 input and 2 outputs neurons, module 2
for level 2 with 30 input and 3 output neurons and 20 input and 2 output, module 3 for level 3
with 90 input and 2 output and 7 input and 2 output neurons, and module 4 for level 4 with
122 input and 2 output neurons.
The information flow during classification runs from the first to the fourth level, the outputs
of the first level, in the ANN classification scheme, determine the activation of the specialized
subnetworks at a second level. The same procedure is used for the subsequent subnetworks
until the serovar-specific subnets are obtained. Finally, all optimized specific subnetworks are
integrated in a single ANN classification system as shown in Fig. 4.2B. Based on this
classification scheme, success of prediction of the serovars and serogroups resulted from the
projection of an unknown L. monocytogenes spectrum from the first level to the lower levels
of the ANN scheme and were externally validated with 166 independant spectra using the
fully established modular system.
4.5 Validation of FTIR based serovar differentiation
The identification potential of this ANN was evaluated by an internal validation (compare
Rebuffo et al. (Rebuffo et al. 2006). This internal validation (Table 4.1) resulted in a correct
identification of 100 % of the somatic antigens (serogroup level). However, only 94.3 % of
the flagellar antigens (serovar level) could be identified.
Then, an external validation was performed using a test set of 166 Listeria monocytogenes
strains isolated from food, the environment, animals and humans. These represented 12
serovars and included the 130 L. monocytogenes strains used for external validation by
Rebuffo et al (Rebuffo et al. 2006) (see Appendix IV).

Chapter 4 Differentiation of Listeria monocytogenes serovars by ANN-based FTIR
48
Table 4.1 Internal validation of the infrared spectral reference database
No. of strains:
For which H-flagellar antigens (serovar)
Listeria monocytogenes
Serovars Tested For which O-somatic antigens (serogroup) correctly identified
Correctly identified Misidentified
1/2a 23 23 21 2a 1/2b 7 7 7 - 1/2c 11 11 10 1b 3a 8 8 8 - 3b 12 12 12 - 3c 4 4 4 - 4a 3 3 3 - 4b 24 24 22 2c 4c 2 2 1 1c 4d 9 9 9 - 4e 2 2 2 - 7 1 1 1 -
Total
106 106 (100%) 100 (94.3%) 5.7 (6%) a Strains misidentified as serovar 1/2c. b Strain misidentified as serovar 1/2a. c Strains misidentified as serovar 4d.
These strains were either identified at the species level according to chapter 3 (Rebuffo et al.
2006) and serotyped based on agglutination reactions with antisera for L. monocytogenes
(Denka Seiken Co., Japan) according to the instructions of the manufacturer or had been
previously serotyped by a reference laboratory. The external validation (Table 4.2) resulted in
the correct typing rate of 98.8 % at the serogroup level and 91.6 % at the serovar level.
Importantly, 40 out of 41 potentially outbreak-causing serovar 4b strains were identified
correctly. From 87 serovar 1/2a plus 1/2b strains, 84 were assigned to either one of these two
serovars. Five serovar 1/2b strains were misidentified as 1/2a. In total, only 3.1 % of the
potentially pathogenic serovars 1/2a, 1/2b and 4b were grouped with a potentially
nonpathogenic serovar. However, both internal and external validations were somewhat
biased since only a few strains of serovars 3c, 4a, 4c, 4e, and 7 were available, which is due to
the fact that these are rarely isolated from food and never from patients.

Chapter 4 Differentiation of Listeria monocytogenes serovars by ANN-based FTIR
49
Table 4.2 External validation of the infrared spectral reference database
No. of strains: For which O-somatic antigens (serogroup) For which H-flagellar
antigens (serovar)
Listeria monocytogenes
Serovars Tested Correctly identified Misidentified Correctly
identified Misidentified
1/2a 59 57 2a 56 3b 1/2b 36 36 - 31 5c 1/2c 11 11 - 10 1c 3a 3 3 - 3 - 3b 5 5 - 5 - 3c 2 2 - 1 1d 4a 1 1 - 1 - 4b 41 41 - 40 1e 4c 3 3 - 2 1f 4d 2 2 - 1 1f 4e 2 2 - 1 1f 7 1 1 - 1 -
Total
166 164 (98.8%) 2 (1.2%) 152 (91.6%) 14 (8.4%) a Strains misidentified as serogroup 3. b Strains misidentified as serovar 1/2c. c Strain(s) misidentified as serovar 1/2a. d Strain misidentified as serovar 3b. e Strain misidentified as serovar 4d. f Strain misidentified as serovar 4b.
4.6 Comparison of FTIR and PCR based serovar differentiation
Due to the importance of serotyping L. monocytogenes, a few PCR-based methods have been
proposed. However, some are limited to differentiation of strains into only two or three
serovar groups (Comi et al. 1997, Jinneman and Hill 2001, Manzano et al. 1998) or to
differentiation of only two serovars from the others (Zhang and Knabel 2005). Others are
more complicated since two or even three independent PCRs reactions are needed (Borucki
and Call 2003, Jinneman and Hill 2001). In contrast, the PCR system developed by Doumith
et al. (Doumith et al. 2004a), in a one-step multiplex PCR, allows the differentiation of L.
monocytogenes strains into four “serovar groups”. Group 1 comprises serovars 1/2a and 3a;
group 2 comprises serovars 1/2c and 3c; group 3 contains serovars 1/2b, 3b and 7; and group
4 serovars 4b, 4d, and 4e. However, individual serovars cannot be separated. We applied this
PCR system to the 166 strains of our external-validation strain set. The PCR-based method
correctly differentiated 159 (4 not typeable and 3 incorrectly typed [see table in Appendix IV
of chapter 7]) out of the 166 strains (95.8%) to the serovar group level, which is comparable
to its previous validation (Doumith et al. 2005). FTIR-based serotyping was able to correctly

Chapter 4 Differentiation of Listeria monocytogenes serovars by ANN-based FTIR
50
discriminate 164 out of the 166 strains (98.8%) at the serogroup level. In addition, FTIR is
much more discriminatory since 91.6% of the individual serovars can be determined (Table
4.2).
4.7 Conclusion
Rebuffo et al. (Rebuffo et al. 2006) have previously described an ANN-based FTIR method
for the reliable identification of all Listeria species in only 25 hours (chapter 3). Here, we
report on the development of a L. monocytogenes ANN subnet in order to additionally
identify serogroups and serovars. The integration of both classification systems now offers the
possibility to simultaneously identify Listeria at the species level, L. monocytogenes at the
serogroup level, and most L. monocytogenes at the serovar level in a single step by simply
measuring an infrared spectrum of a pure Listeria culture. Our data indicate that this method
is superior to molecular approaches for L. monocytogenes serovar determination. We suggest
that FTIR identification and serotyping constitute a rapid and inexpensive tool which may be
suitable for diagnostic laboratories. This tool may be used routinely in food control to gain
additional information on the pathogenic potential of strains isolated from the food-processing
chain.
4.8 Acknowledgments
This work was supported in part by the FEI (Forschungskreis der Ernährungsindustrie e. V.,
Bonn), the AiF (Arbeitskreis für industrielle Forschung), and the Ministry of Economics and
Technology, project No. 14126N. We thank H. Hof, Mannheim, Germany; C. Montel,
Aurillac, France; and K. Pellicer, La Plata, Argentina, for kindly providing Listeria
monocytogenes strains.
Chapter 5 General conclusions
51
5 General conclusions
A comparative analysis of the identification results of Listeria to the species level using
FTIR-macro- and FTIR–micro-samples methods demonstrated that the FTIR-macro-samples
method is the most adequate to apply for Listeria. The study of the factors which influence
the discrimination of Listeria species using FTIR-micro-samples method showed a limitation
when cells of young colonies were used since these present a lower interspecies diversity,
compared to bacterial cells from a lawn culture being 24 hours old, and in stationary phase
such as in the FTIR –macro-samples method. Additionally, the heterogeneity of the cell
growth increased with the colony size and is species and strain dependent. This interferes with
the discrimination of L. innocua, L. ivanovii, and L. monocytogenes. We therefore state that
the age of the culture does represent an important factor that influences the discrimination
power of the method and that the cell growth heterogeneity represents an additional factor to
be considered when FTIR- micro-samples method is used. Furthermore, in order to obtain an
identification success of approximately 90% each species of Listeria should be represented in
the database by 20 to 25 strains to cover the natural intraspecies variability.
FTIR spectroscopy combined with a large and standardized microorganism database presents
a great potential for the identification of Listeria species in routine analysis. Particularly, for
the differentiation of closely related species of Listeria the use of the advanced multivariate
and supervised analysis method, the Artificial Neural Network improves the discrimination
capacity due to a better extraction of information contained in the spectra. So far, no other
phenotypical method has been described in the literature that provides an overall correct
identification rate of 96% for all Listeria species and a success rate of 99.2% for correct L.
monocytogenes identification in a rapid, simple and cost-efficient procedure. Therefore, we
conclude that the use of a database including a number of strains which cover the entire
biological variance of each species in combination with ANN analysis will allow a reliable
interspecies differentiation.
The observation of serogroup- and serovar-specific markers in the FTIR spectra of L.
monocytogenes strains has revealed the sensitivity of the FTIR method for the discrimination
of specific patterns below the species level. Despite the closeness of the chemical structure of
the different serogroups of L. monocytogenes, the FTIR method combined with ANN allows a
successful discrimination of all serogroups and serovars at a success rate of 98.8% and 91.8%
respectively. Additionally, a correct identification rate of 97% for the potentially pathogenic
serovars 1/2a, 1/2b, and 4b demonstrates the capability of this method to be used for effective

Chapter 5 General conclusions
52
detection and control of contamination sources. Furthermore, the comparison of these results
with those obtained by the most discriminatory PCR-based method showed the superiority of
the ANN based of FTIR when used for the serogroup and independent serovar differentiation.
Finally, the most attractive feature of this new technology is the capability of a simultaneous
identification and typing of Listeria strains in one test, a powerful feature that none of the
other tests can offer. Furthermore, unambiguous Listeria species and Listeria monocytogenes
serovar differentiation from isolates with different geographical origins demonstrate the
capacity of the ANN based FTIR method to be used in different laboratories as universal
reference database. Moreover, this standardized classification system lends itself to high-
throughput and semi-automation, and shows a great promise for future routine applications in
food control and the epidemiological identification of Listeria.

References
53
6 References
Allerberger, F., M. Dierich, G. Petranyi, M. Lalic, and A. Bubert. 1997. Nonhemolytic
strains of Listeria monocytogenes detected in milk products using VIDAS immunoassay kit.
Zentralbl. Hyg. Umweltmed. 200:189-195.
American College of Physicians. 2005. Sensitivity, Specificity definition.
http://www.acponline.org. [Online.]
Bille, J., B. Catimel, E. Bannerman, C. Jacquet, M. N. Yersin, I. Caniaux, D. Monget,
and J. Rocourt. 1992. API Listeria, a new and promising one-day system to identify Listeria
isolates. Appl. Environ. Microbiol. 58:1857-1860.
Bordner, R. H., P. W. Kabler, B. A. Kenner, J. W. Riddle, S. W. Rockwood, and H. J.
Stevenson. 1956. Bacterial identification by infrared spectrophotometry. J. Bacteriol. 72:593-
603.
Borucki, M. K., and D. R. Call. 2003. Listeria monocytogenes serotype identification by
PCR. J. Clin. Microbiol. 41:5537-5540.
Bubert, A., I. Hein, M. Rauch, A. Lehner, B. Yoon, W. Goebel, and M. Wagner. 1999.
Detection and differentiation of Listeria spp. by a single reaction based on multiplex PCR.
Appl. Environ. Microbiol. 65:4688-4692.
Bubert, A., J. Riebe, N. Schnitzler, A. Schonberg, W. Goebel, and P. Schubert. 1997.
Isolation of catalase-negative Listeria monocytogenes strains from listeriosis patients and their
rapid identification by anti-p60 antibodies and/or PCR. J. Clin. Microbiol. 35:179-183.
Bubert, A., P. Schubert, S. Kohler, R. Frank, and W. Goebel. 1994. Synthetic peptides
derived from the Listeria monocytogenes p60 protein as antigens for the generation of
polyclonal antibodies specific for secreted cell-free L. monocytogenes p60 proteins. Appl.
Environ. Microbiol. 60:3120-3127.
Choo-Smith, L. P., K. Maquelin, T. van Vreeswijk, H. A. Bruining, G. J. Puppels, N. A.
Ngo Thi, C. Kirschner, D. Naumann, D. Ami, A. M. Villa, F. Orsini, S. M. Doglia, H.
Lamfarraj, G. D. Sockalingum, M. Manfait, P. Allouch, and H. P. Endtz. 2001.
Investigating microbial (micro)colony heterogeneity by vibrational spectroscopy. Appl.
Environ. Microbiol. 67:1461-1469.

References
54
Cocolin, L., K. Rantsiou, L. Iacumin, C. Cantoni, and G. Comi. 2002. Direct identification
in food samples of Listeria spp. and Listeria monocytogenes by molecular methods. Appl.
Environ. Microbiol. 68:6273-6282.
Comi, G., L. Cocolin, C. Cantoni, and M. Manzano. 1997. A RE-PCR method to
distinguish Listeria monocytogenes serovars. FEMS Immunol. Med. Microbiol. 18:99-104.
Cummins, A. J., A. K. Fielding, and J. McLauchlin. 1994. Listeria ivanovii infection in a
patient with AIDS. J. Infect. 28:89-91.
Deneer, H. G., and I. Boychuk. 1991. Species-specific detection of Listeria monocytogenes
by DNA amplification. Appl. Environ. Microbiol. 57:606-609.
Donnelly, C. W. 2001. Listeria monocytogenes: a continuing challenge. Nutr. Rev. 59:183-
194.
Doumith, M., C. Buchrieser, P. Glaser, C. Jacquet, and P. Martin. 2004a. Differentiation
of the major Listeria monocytogenes serovars by multiplex PCR. J. Clin. Microbiol. 42:3819-
3822.
Doumith, M., C. Cazalet, N. Simoes, L. Frangeul, C. Jacquet, F. Kunst, P. Martin, P.
Cossart, P. Glaser, and C. Buchrieser. 2004b. New aspects regarding evolution and
virulence of Listeria monocytogenes revealed by comparative genomics and DNA arrays.
Infect. Immun. 72:1072-1083.
Doumith, M., C. Jacquet, P. Gerner-Smidt, L. M. Graves, S. Loncarevic, T. Mathisen, A.
Morvan, C. Salcedo, M. Torpdahl, J. A. Vazquez, and P. Martin. 2005. Multicenter
validation of a multiplex PCR assay for differentiating the major Listeria monocytogenes
serovars 1/2a, 1/2b, 1/2c, and 4b: toward an international standard. J. Food Prot. 68:2648-
2650.
Duvall, R. E., and A. D. Hitchins. 1997. Pooling of noncollaborative multilaboratory data
for evaluation of the use of DNA probe test kits in identifying Listeria monocytogenes strains.
J. Food Prot. 60:995-997.
Dytham, C. 1999. Statistics, variables and distributions, p. 30-42, Choosing and Using
Statistics. Blackwell Science, Ltd., USA.
Essendoubi, M., D. Toubas, M. Bouzaggou, J. M. Pinon, M. Manfait, and G. D.
Sockalingum. 2005. Rapid identification of Candida species by FT-IR microspectroscopy.
Biochim. Biophys. Acta 1724:239-247.
References
55
Farber, J. M., and C. J. Addison. 1994. RAPD typing for distinguishing species and strains
in the genus Listeria. J. Appl. Bacteriol. 77:242-250.
Fiedler, F. 1988. Biochemistry of the cell surface of Listeria strains: a locating general view.
Infection 16 Suppl 2:S92-97.
Fiedler, F., Seger, J., Schrettenbrunner, A., Seeliger, H. P. R. 1984. The biochemistry of
murein and cell wall teichoic acids in the genus Listeria. System. Appl. Microbiol. 5:360-376.
Gangar, V., M. S. Curiale, A. D'Onorio, A. Schultz, R. L. Johnson, and V. Atrache.
2000. VIDAS enzyme-linked immunoflourescent assay for detection of Listeria in foods:
collaborative study. J. AOAC Int. 83:903-918.
Gasanov, U., D. Hughes, and P. M. Hansbro. 2005. Methods for the isolation and
identification of Listeria spp. and Listeria monocytogenes: a review. FEMS Microbiol. Rev.
29:851-875.
Goodacre, R., E. M. Timmins, P. J. Rooney, J. J. Rowland, and D. B. Kell. 1996. Rapid
identification of Streptococcus and Enterococcus species using diffuse reflectance-absorbance
Fourier transform infrared spectroscopy and artificial neural networks. FEMS Microbiol. Lett.
140:233-239.
Gracieux, P., S. M. Roche, P. Pardon, and P. Velge. 2003. Hypovirulent Listeria
monocytogenes strains are less frequently recovered than virulent strains on PALCAM and
Rapid' L. mono media. Int. J. Food. Microbiol. 83:133-145.
Gray, M. J., N. E. Freitag, and K. J. Boor. 2006. How the bacterial pathogen Listeria
monocytogenes mediates the switch from environmental Dr. Jekyll to pathogenic Mr. Hyde.
Infect. Immun. 74:2505-2512.
Hahn, G., Hammer P. 1990. Listerien-freie Käse - höhere Sicherheit für den Verbraucher.
Dtsch. Milchwirtsch. 33:1120-1125.
Hegde, V., C. G. Leon-Velarde, C. M. Stam, L. A. Jaykus, and J. A. Odumeru. 2007.
Evaluation of BBL CHROMagar Listeria agar for the isolation and identification of Listeria
monocytogenes from food and environmental samples. J. Microbiol. Methods 68:82-87.
Helm, D., H. Labischinski, and D. Naumann. 1991. Elaboration of a procedure for
identification of bacteria using Fourier-Transform IR spectral libraries: a stepwise correlation
approach. J. Microbiol. Methods 14:127-142.

References
56
Helm, D., H. Labischinski, and D. Naumann. 1991b. Elaboration of a procedure for
identification of bacteria using Fourier-Transform IR spectral libraries: a stepwise correlation
approach. J. Microbiol. Methods 14:127-142.
Helm, D., H. Labischinski, G. Schallehn, and D. Naumann. 1991a. Classification and
identification of bacteria by Fourier-transform infrared spectroscopy. J. Gen. Microbiol.
137:69-79.
Herbert, K. C., and S. J. Foster. 2001. Starvation survival in Listeria monocytogenes:
characterization of the response and the role of known and novel components. Microbiology
147:2275-2284.
Hitchins, A. D. 2003. Detection and Enumeration of Listeria monocytogenes in Foods. U. S
Departament of Health and Human Services. U. S. Food and Drug Administration. Center for
Food Safety & Applied Nutrition. [Online.]
Holt, C., D. Hirst, A. Sutherland, and F. MacDonald. 1995. Discrimination of species in
the genus Listeria by Fourier transform infrared spectroscopy and canonical variate analysis.
Appl. Environ. Microbiol. 61:377-378.
Howard, P. J., K. D. Harsono, and J. B. Luchansky. 1992. Differentiation of Listeria
monocytogenes, Listeria innocua, Listeria ivanovii, and Listeria seeligeri by pulsed-field gel
electrophoresis. Appl. Environ. Microbiol. 58:709-712.
Jacquet, C., M. Doumith, J. I. Gordon, P. M. Martin, P. Cossart, and M. Lecuit. 2004. A
molecular marker for evaluating the pathogenic potential of foodborne Listeria
monocytogenes. J. Infect. Dis. 189:2094-2100.
Jacquet, C., E. Gouin, D. Jeannel, P. Cossart, and J. Rocourt. 2002. Expression of ActA,
Ami, InlB, and listeriolysin O in Listeria monocytogenes of human and food origin. Appl.
Environ. Microbiol. 68:616-622.
Jemmi, T., and R. Stephan. 2006. Listeria monocytogenes: food-borne pathogen and
hygiene indicator. Rev. Sci. Tech. 25:571-580.
Jersek, B., E. Tcherneva, N. Rijpens, and L. Herman. 1996. Repetitive element sequence-
based PCR for species and strain discrimination in the genus Listeria. Lett. Appl. Microbiol.
23:55-60.
Jinneman, K. C., and W. E. Hill. 2001. Listeria monocytogenes lineage group classification
by MAMA-PCR of the listeriolysin gene. Curr. Microbiol. 43:129-133.

References
57
Jinneman, K. C., J. M. Hunt, C. A. Eklund, J. S. Wernberg, P. N. Sado, J. M. Johnson,
R. S. Richter, S. T. Torres, E. Ayotte, S. J. Eliasberg, P. Istafanos, D. Bass, N. Kexel-
Calabresa, W. Lin, and C. N. Barton. 2003. Evaluation and interlaboratory validation of a
selective agar for phosphatidylinositol-specific phospholipase C activity using a chromogenic
substrate to detect Listeria monocytogenes from foods. J. Food Prot. 66:441-445.
Johnson, J. L., and C. P. Lattuada. 1993. Comparison of nucleic acid hybridization assays
and biochemical characterization tests for the confirmation of Listeria monocytogenes. J.Food
Prot. 56:834-840.
Jones, D. a. S., H.P. R. 1992. The genus Listeria, p. 1595-1616. In A. Balows, Trüper, H.G.,
Dworkin, M., Harder, W., and Schleifer, K.-H. (ed.), The Prokaryotes, 2 nd ed, vol. 2.
Springer-Verlag, Berlin.
Kathariou, S. 2000. Pathogenesis determinants of Listeria monocytogenes, p. 295-314. In J.
W. Cary, J. E. Linz and D. Bhatnagar (ed.), Microbial foodborne diseases. Technomics
Publishing Co., Inc., Lancaster, Pa.
Kathariou, S. 2002. Listeria monocytogenes virulence and pathogenicity, a food safety
perspective. J. Food Prot. 65:1811-1829.
Kim, S., B. L. Reuhs, and L. J. Mauer. 2005. Use of Fourier transform infrared spectra of
crude bacterial lipopolysaccharides and chemometrics for differentiation of Salmonella
enterica serotypes. J. Appl. Microbiol. 99:411-417.
Kirschner, C., K. Maquelin, P. Pina, N. A. Ngo Thi, L. P. Choo-Smith, G. D.
Sockalingum, C. Sandt, D. Ami, F. Orsini, S. M. Doglia, P. Allouch, M. Mainfait, G. J.
Puppels, and D. Naumann. 2001. Classification and identification of enterococci: a
comparative phenotypic, genotypic, and vibrational spectroscopic study. J. Clin. Microbiol.
39:1763-1770.
Kümmerle, M., S. Scherer, and H. Seiler. 1998. Rapid and reliable identification of food-
borne yeasts by Fourier-transform infrared spectroscopy. Appl. Environ. Microbiol. 64:2207-
2214.
Lefier, D., D. Hirst, C. Holt, and A. G. Williams. 1997. Effect of sampling procedure and
strain variation in Listeria monocytogenes on the discrimination of species in the genus
Listeria by Fourier transform infrared spectroscopy and canonical variates analysis. FEMS
Microbiol. Lett. 147:45-50.

References
58
Lei, X. H., F. Fiedler, Z. Lan, and S. Kathariou. 2001. A novel serotype-specific gene
cassette (gltA-gltB) is required for expression of teichoic acid-associated surface antigens in
Listeria monocytogenes of serotype 4b. J. Bacteriol. 183:1133-1139.
Lemunier, M., C. Francou, S. Rousseaux, S. Houot, P. Dantigny, P. Piveteau, and J.
Guzzo. 2005. Long-term survival of pathogenic and sanitation indicator bacteria in
experimental biowaste composts. Appl. Environ. Microbiol. 71:5779-5786.
Lessing, M. P., G. D. Curtis, and I. C. Bowler. 1994. Listeria ivanovii infection. J. Infect.
29:230-231.
Liu, D. 2006. Identification, subtyping and virulence determination of Listeria
monocytogenes, an important foodborne pathogen. J. Med. Microbiol. 55:645-659.
Liu, D., M. L. Lawrence, L. Gorski, R. E. Mandrell, A. J. Ainsworth, and F. W. Austin.
2006. Listeria monocytogenes serotype 4b strains belonging to lineages I and III possess
distinct molecular features. J. Clin. Microbiol. 44:214-217.
Loessner, M., and S. Scherer. 2002. Listerien-Aktuelle Lage und Entwicklung neuer Schutz-
und Reifungskulturen, p. 173-178, Deutsche Molkerei-Zeitung, Deutschland.
Lynch, M., J. Painter, R. Woodruff, and C. Braden. 2006. Surveillance for foodborne-
disease outbreaks--United States, 1998-2002. MMWR Surveill. Summ. 55:1-42.
Manzano, M., L. Cocolin, C. Cantoni, and G. Comi. 1998. A rapid method for the
identification and partial serotyping of Listeria monocytogenes in food by PCR and restriction
enzyme analysis. Int. J. Food Microbiol. 42:207-212.
Manzano, M., L. Cocolin, C. Cantoni, and G. Comi. 2000. Temperature gradient gel
electrophoresis of the amplified product of a small 16S rRNA gene fragment for the
identification of Listeria species isolated from food. J. Food Prot. 63:659-661.
Maquelin, K., L. Choo-Smith, C. Kirschner, N. A. Ngo Thi, D. Naumann, and G.
Puppels. 2002. Vibrational Spectroscopic Studies of Microorganisms. In P. R. Griffiths (ed.),
Handbook of Vibrational Spectroscopy. John Wiley & Sons Ltd, Chichester, U.K.
Maquelin, K., C. Kirschner, L. P. Choo-Smith, N. A. Ngo-Thi, T. van Vreeswijk, M.
Stammler, H. P. Endtz, H. A. Bruining, D. Naumann, and G. J. Puppels. 2003.
Prospective study of the performance of vibrational spectroscopies for rapid identification of
bacterial and fungal pathogens recovered from blood cultures. J. Clin. Microbiol. 41:324-329.

References
59
Mauder, N., R. Ecke, S. Mertins, D. I. Loeffler, G. Seidel, M. Sprehe, W. Hillen, W.
Goebel, and S. Muller-Altrock. 2006. Species-specific differences in the activity of PrfA,
the key regulator of listerial virulence genes. J. Bacteriol. 188:7941-7956.
Mead, P. S., L. Slutsker, V. Dietz, L. F. McCaig, J. S. Bresee, C. Shapiro, P. M. Griffin,
and R. V. Tauxe. 1999. Food-related illness and death in the United States. Emerg. Infect.
Dis. 5:607-625.
Naumann, D. 2001. FT-Infrared and FT-Raman spectroscopy in biomedical research, p. 323-
377. In B. Yan (ed.), Infrared and Raman spectroscopy of biological materials. Marcel
Dekker, New York.
Naumann, D., D. Helm, and H. Labischinski. 1991. Microbiological characterizations by
FT-IR spectroscopy. Nature 351:81-82.
Naumann, D., C. P. Schultz, and D. Helm. 1996. What can infrared spectroscopy tell us
about the structure and composition of intact bacterial cell?, p. 279-310. In H. Mantsch, H.,
Chapmann, D. (ed.), Infrared spectroscopy of biomolecules. Wiley-Liss, New York.
Ngo-Thi, N. A., C. Kirschner, and D. Naumann. 2003. Characterization and identification
of microorganisms by FT-IR microspectrometry. J. Mol. Struct. 661-662:371-380.
Ninet, B., E. Bannerman, and J. Bille. 1992. Assessment of the Accuprobe Listeria
monocytogenes culture identification reagent kit for rapid colony confirmation and its
application in various enrichment broths. Appl. Environ. Microbiol. 58:4055-4059.
Norton, D. M. 2002. Polymerase chain reaction-based methods for detection of Listeria
monocytogenes: toward real-time screening for food and environmental samples. J. AOAC
Int. 85:505-515.
Oberreuter, H., J. Charzinski, and S. Scherer. 2002a. Intraspecific diversity of
Brevibacterium linens, Corynebacterium glutamicum and Rhodococcus erythropolis based on
partial 16S rDNA sequence analysis and Fourier-transform infrared (FT-IR) spectroscopy.
Microbiology 148:1523-1532.
Oberreuter, H., H. Seiler, and S. Scherer. 2002b. Identification of coryneform bacteria and
related taxa by Fourier-transform infrared (FT-IR) spectroscopy. Int. J. Syst. Evol. Microbiol.
52:91-100.

References
60
Olsen, J. E., S. Aabo, W. Hill, S. Notermans, K. Wernars, P. E. Granum, T. Popovic, H.
N. Rasmussen, and O. Olsvik. 1995. Probes and polymerase chain reaction for detection of
food-borne bacterial pathogens. Int. J. Food Microbiol. 28:1-78.
Paillard, D., V. Dubois, R. Duran, F. Nathier, C. Guittet, P. Caumette, and C. Quentin.
2003. Rapid identification of Listeria species by using restriction fragment length
polymorphism of PCR-amplified 23S rRNA gene fragments. Appl. Environ. Microbiol.
69:6386-6392.
Paillard, D., V. Dubois, R. Thiebaut, F. Nathier, E. Hoogland, P. Caumette, and C.
Quentin. 2005. Occurrence of Listeria spp. in effluents of French urban wastewater treatment
plants. Appl. Environ. Microbiol. 71:7562-7566.
Palumbo, J. D., M. K. Borucki, R. E. Mandrell, and L. Gorski. 2003. Serotyping of
Listeria monocytogenes by enzyme-linked immunosorbent assay and identification of mixed-
serotype cultures by colony immunoblotting. J. Clin. Microbiol. 41:564-571.
Rebuffo, C. A., J. Schmitt, M. Wenning, F. von Stetten, and S. Scherer. 2006. Reliable
and Rapid Identification of Listeria monocytogenes and Listeria Species by Artificial Neural
Network-Based Fourier Transform Infrared Spectroscopy. Appl. Environ. Microbiol. 72:994-
1000.
Rebuffo-Scheer, C. A., C. Kirschner, M. Staemmler, and D. Naumann. 2007a. Rapid
species and strain differentiation of non-tubercoulous mycobacteria by Fourier-Transform
Infrared microspectroscopy. J. Microbiol. Methods 68:282-290.
Rebuffo-Scheer, C. A., J. Schmitt, and S. Scherer. 2007b. Differentiation of Listeria
monocytogenes serovars by using artificial neural network analysis of Fourier-transformed
infrared spectra. Appl. Environ. Microbiol. 73:1036-1040.
Riedmiller, M., and H. Braun. 1993. A direct adaptive method for faster backpropagation
learning:The RPROP algorithm, p. 586-591, Proceedings of the IEEE international
conference on neural networks (ICNN).
Rocourt, J. 1999. The Genus Listeria and Listeria monocytogenes: Phylogenetic Position,
Taxonomy, and Identification, p. 1-20. In a. E. M. E. Ryser (ed.), Listeria, Listeriosis, and
Food Safety, 2nd ed., New York.
Rocourt, J., P. Boerlin, F. Grimont, C. Jacquet, and J. C. Piffaretti. 1992. Assignment of
Listeria grayi and Listeria murrayi to a single species, Listeria grayi, with a revised
description of Listeria grayi. Int. J. Syst. Bacteriol. 42:171-174.

References
61
Rocourt, J., H. Hof, A. Schrettenbrunner, R. Malinverni, and J. Bille. 1986. Acute
purulent Listeria seeligeri meningitis in an immunocompetent adult. Schweiz. Med.
Wochenschr. 116:248-251.
Rudolf, M., and S. Scherer. 2001. High incidence of Listeria monocytogenes in European
red smear cheese. Int. J. Food Microbiol. 63:91-98.
Sandt, C., C. Madoulet, A. Kohler, P. Allouch, C. De Champs, M. Manfait, and G. D.
Sockalingum. 2006. FT-IR microspectroscopy for early identification of some clinically
relevant pathogens. J. Appl. Microbiol. 101:785-797.
Schmitt, J., and T. Udelhoven. 2001. Use of artificial neural networks in biomedical
diagnosis, p. 379-419. In B. Yan (ed.), Infrared and Raman spectroscopy of biological
materials. Marcel Dekker, New York.
Seeliger, H. P. R., and D. Jones. 1986. Genus Listeria, p. 1235-1245. In a. J. G. Holt (ed.),
Bergey's manual of systematic bacteriology, vol. 2. The Williams & Wilkins Co., Baltimore.
Seeliger, H. P. R., and B. Langer. 1979. Serotyping of Listeria monocytogenes and related
species. Methods Microbiol. 13:31-49.
Sewell, A. M., D. W. Warburton, A. Boville, E. F. Daley, and K. Mullen. 2003. The
development of an efficient and rapid enzyme linked fluorescent assay method for the
detection of Listeria spp. from foods. Int. J. Food Microbiol. 81:123-129.
Snapir, Y. M., E. Vaisbein, and F. Nassar. 2006. Low virulence but potentially fatal
outcome-Listeria ivanovii. Eur. J. Intern. Med. 17:286-287.
Sneath, P. H., and R. R. Sokal. 1973. Numerical taxonomy. W. H. Freeman and Company,
San Francisco.
Thomas, L. C., and J. E. S. Greenstreet. 1954. The identification of microorganisms by
infrared spectrophotometry. Spectrochim. Acta 6:302-319.
Tompkin, R. B. 2002. Control of Listeria monocytogenes in the food-processing
environment. J. Food Prot. 65:709-725.
Udelhoven, T., D. Naumann, and J. Schmitt. 2000. Development of a Hierarchical
Classification System with Artificial Neural Networks and FT-IR Spectra for the
Identification of Bacteria. Appl. Spectrosc. 54:1471-1479.
Udelhoven, T., M. Novozhilov, and J. Schmitt. 2003. The NeuroDeveloper: a tool for
modular neural classification of spectroscopic data. Chemom. Intell. Lab. Syst. 66:219-226.

References
62
Ullmann, W. W., and J. A. Cameron. 1969. Immunochemistry of the cell walls of Listeria
monocytogenes. J. Bacteriol. 98:486-493.
Vaneechoutte, M., P. Boerlin, H. V. Tichy, E. Bannerman, B. Jager, and J. Bille. 1998.
Comparison of PCR-based DNA fingerprinting techniques for the identification of Listeria
species and their use for atypical Listeria isolates. Int. J Syst. Bacteriol. 48 Pt 1:127-139.
Vazquez-Boland, J. A., L. Dominguez, J. F. Fernandez, E. F. Rodriguez-Ferri, V.
Briones, M. Blanco, and G. Suarez. 1990. Revision of the validity of CAMP tests for
Listeria identification. Proposal of an alternative method for the determination of haemolytic
activity by Listeria strains. Acta Microbiol. Hung. 37:201-206.
Volokhov, D., A. Rasooly, K. Chumakov, and V. Chizhikov. 2002. Identification of
Listeria species by microarray-based assay. J. Clin. Microbiol. 40:4720-4728.
Wagner, M., D. Melzner, Z. Bago, P. Winter, M. Egerbacher, F. Schilcher, A. Zangana,
and D. Schoder. 2005. Outbreak of clinical listeriosis in sheep: evaluation from possible
contamination routes from feed to raw produce and humans. J. Vet. Med. B. Infect. Dis. Vet
.Public Health 52:278-283.
Ward, J. H. 1963. Hierarchical grouping to optimize an objective function, p. 236-244, J.
Am. Stat. Assoc., vol. 58.
Wenning, M., S. Scherer, and D. Naumann. 2007. Infrared Spectroscopy in the
Identification of Micro-organisms, Vibrational Spectroscopy in Medical Diagnosis, Naumann
D, Diem D ed, (in review process).
Wenning, M., H. Seiler, and S. Scherer. 2002. Fourier-transform infrared
microspectroscopy, a novel and rapid tool for identification of yeasts. Appl. Environ.
Microbiol. 68:4717-4721.
Wenning, M., V. Theilmann, and S. Scherer. 2006. Rapid analysis of two food-borne
microbial communities at the species level by Fourier-transform infrared microspectroscopy.
Environ. Microbiol. 8:848-857.
Yildirim, S., W. Lin, A. D. Hitchins, L. A. Jaykus, E. Altermann, T. R. Klaenhammer,
and S. Kathariou. 2004. Epidemic clone I-specific genetic markers in strains of Listeria
monocytogenes serotype 4b from foods. Appl. Environ. Microbiol. 70:4158-4164.

References
63
Zhang, W., and S. J. Knabel. 2005. Multiplex PCR assay simplifies serotyping and
sequence typing of Listeria monocytogenes associated with human outbreaks. J. Food Prot.
68:1907-1910.
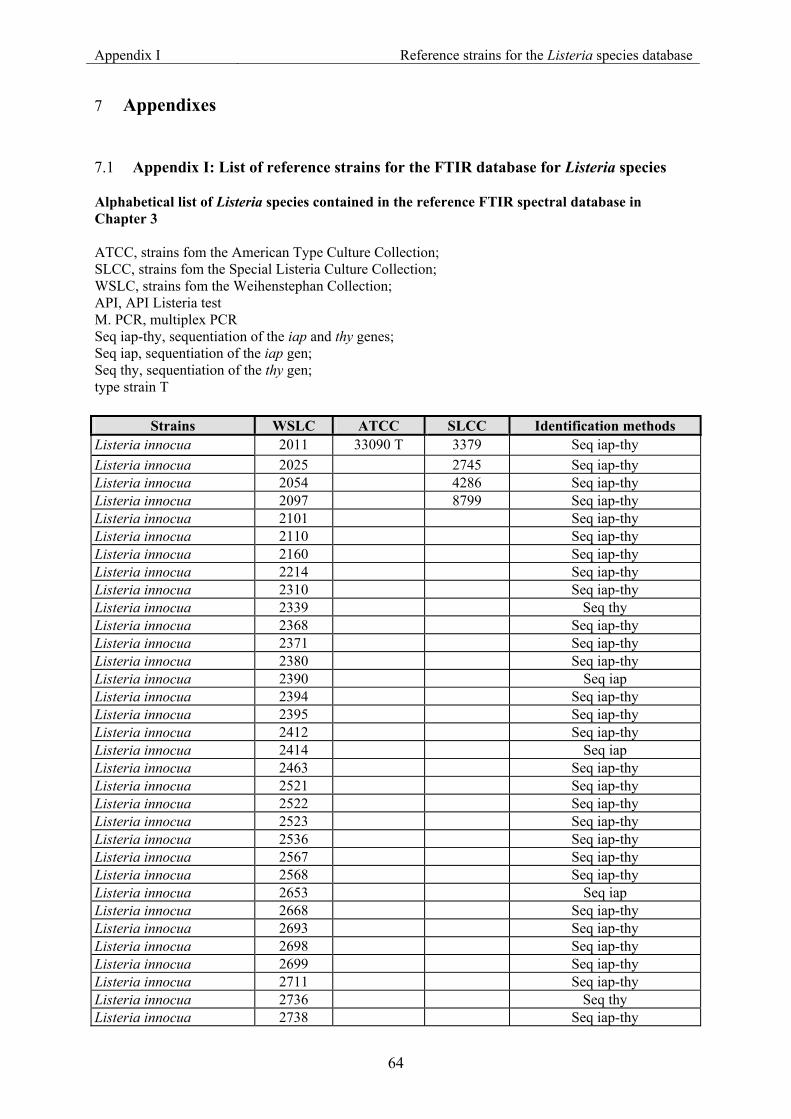
Appendix I Reference strains for the Listeria species database
64
7 Appendixes
7.1 Appendix I: List of reference strains for the FTIR database for Listeria species
Alphabetical list of Listeria species contained in the reference FTIR spectral database in Chapter 3 ATCC, strains fom the American Type Culture Collection; SLCC, strains fom the Special Listeria Culture Collection; WSLC, strains fom the Weihenstephan Collection; API, API Listeria test M. PCR, multiplex PCR Seq iap-thy, sequentiation of the iap and thy genes; Seq iap, sequentiation of the iap gen; Seq thy, sequentiation of the thy gen; type strain T
Strains WSLC ATCC SLCC Identification methods Listeria innocua 2011 33090 T 3379 Seq iap-thy Listeria innocua 2025 2745 Seq iap-thy Listeria innocua 2054 4286 Seq iap-thy Listeria innocua 2097 8799 Seq iap-thy Listeria innocua 2101 Seq iap-thy Listeria innocua 2110 Seq iap-thy Listeria innocua 2160 Seq iap-thy Listeria innocua 2214 Seq iap-thy Listeria innocua 2310 Seq iap-thy Listeria innocua 2339 Seq thy Listeria innocua 2368 Seq iap-thy Listeria innocua 2371 Seq iap-thy Listeria innocua 2380 Seq iap-thy Listeria innocua 2390 Seq iap Listeria innocua 2394 Seq iap-thy Listeria innocua 2395 Seq iap-thy Listeria innocua 2412 Seq iap-thy Listeria innocua 2414 Seq iap Listeria innocua 2463 Seq iap-thy Listeria innocua 2521 Seq iap-thy Listeria innocua 2522 Seq iap-thy Listeria innocua 2523 Seq iap-thy Listeria innocua 2536 Seq iap-thy Listeria innocua 2567 Seq iap-thy Listeria innocua 2568 Seq iap-thy Listeria innocua 2653 Seq iap Listeria innocua 2668 Seq iap-thy Listeria innocua 2693 Seq iap-thy Listeria innocua 2698 Seq iap-thy Listeria innocua 2699 Seq iap-thy Listeria innocua 2711 Seq iap-thy Listeria innocua 2736 Seq thy Listeria innocua 2738 Seq iap-thy

Appendix I Reference strains for the Listeria species database
65
Strains WSLC ATCC SLCC Identification methods Listeria innocua 2739 Seq iap-thy Listeria innocua 2740 Seq iap-thy Listeria innocua 2743 Seq iap-thy Listeria innocua 2745 Seq iap-thy Listeria innocua 2760 Seq iap-thy Listeria innocua 5908 Seq iap-thy Listeria innocua 5909 Seq iap-thy Listeria innocua 5910 Seq iap-thy Listeria innocua 5911 Seq iap-thy Listeria innocua 5912 Seq iap-thy Listeria innocua 5914 Seq iap-thy Listeria innocua 5918 Seq iap-thy Listeria innocua 5919 Seq iap-thy Listeria innocua 5920 Seq iap-thy Listeria innocua 5921 Seq iap-thy Listeria innocua 5922 Seq iap-thy Listeria innocua 5923 Seq iap-thy Listeria innocua 5924 Seq iap-thy Listeria innocua 20109 8818 Seq iap-thy Listeria innocua 20125 8844 Seq iap-thy Listeria innocua 21058 API, M.PCR Listeria innocua 21059 API, M.PCR Listeria innocua 21060 API, M.PCR Listeria innocua 21061 API, M.PCR Listeria innocua 21062 API, M.PCR Listeria innocua 21063 API, M.PCR Listeria innocua 21064 API, M.PCR Listeria innocua 21065 API, M.PCR Listeria innocua 21066 API, M.PCR Listeria innocua 21107 7298 API, M.PCR Listeria innocua 21108 API, M.PCR Listeria innocua 21109 API, M.PCR Listeria ivanovii 3009 4769 Seq iap-thy Listeria ivanovii 3010 19119 T 2379 Seq iap-thy Listeria ivanovii 3027 4713 Seq iap-thy Listeria ivanovii 3050 4719 Seq iap-thy Listeria ivanovii 3058 3584 Seq iap-thy Listeria ivanovii 3059 3706 Seq iap-thy Listeria ivanovii 3060 3765 Seq thy Listeria ivanovii 3061 3772 Seq iap-thy Listeria ivanovii 3062 3773 Seq iap-thy Listeria ivanovii 3716 Seq iap-thy Listeria ivanovii 3718 Seq iap-thy Listeria ivanovii 3867 Seq iap-thy Listeria ivanovii 3870 Seq iap-thy Listeria ivanovii 3873 Seq iap-thy Listeria ivanovii 3874 Seq iap-thy Listeria ivanovii 3875 Seq iap-thy Listeria ivanovii 3876 Seq iap-thy Listeria ivanovii 3877 Seq iap-thy Listeria ivanovii 3878 Seq iap-thy

Appendix I Reference strains for the Listeria species database
66
Strains WSLC ATCC SLCC Identification methods Listeria ivanovii 3879 Seq iap-thy Listeria ivanovii 3881 2028 Seq iap-thy Listeria ivanovii 3883 2102 Seq iap-thy Listeria ivanovii 3884 2379 Seq iap-thy Listeria ivanovii 3885 4706 Seq iap-thy Listeria ivanovii 3886 4770 Seq iap-thy Listeria ivanovii 3906 Seq iap-thy Listeria ivanovii 30151 8854 Seq iap-thy Listeria ivanovii 30152 5638 Seq iap-thy Listeria ivanovii 30153 4121 Seq iap-thy Listeria ivanovii 30154 5579 API, M.PCR Listeria ivanovii 30155 2443 API, M.PCR Listeria ivanovii 30156 6967 API, M.PCR Listeria ivanovii 30157 7926 API, M.PCR Listeria ivanovii 30158 5843 API, M.PCR Listeria ivanovii 30159 6966 Seq iap-thy Listeria ivanovii 30160 6965 Seq iap-thy Listeria ivanovii 30161 5486 API, M.PCR Listeria ivanovii 30162 5756 API, M.PCR Listeria ivanovii 30163 5755 Seq iap-thy Listeria ivanovii 30166 8431 Seq iap-thy Listeria ivanovii 30168 7927 Seq iap-thy Listeria monocytogenes 1034 2482 API, M.PCR Listeria monocytogenes 1040 15313 T 53 API, M.PCR Listeria monocytogenes 1075 8811 API, M.PCR Listeria monocytogenes 1118 Seq thy Listeria monocytogenes 1153 Seq thy Listeria monocytogenes 1175 Seq thy Listeria monocytogenes 1182 Seq thy Listeria monocytogenes 1211 Seq thy Listeria monocytogenes 1266 API, M.PCR Listeria monocytogenes 1303 Seq iap-thy Listeria monocytogenes 1361 Seq iap-thy Listeria monocytogenes 1363 API, M.PCR Listeria monocytogenes 1364 API, M.PCR Listeria monocytogenes 1370 Seq iap-thy Listeria monocytogenes 1377 API, M.PCR Listeria monocytogenes 1383 Seq iap-thy Listeria monocytogenes 1399 API, M.PCR Listeria monocytogenes 1400 API, M.PCR Listeria monocytogenes 1411 API, M.PCR Listeria monocytogenes 1413 API, M.PCR Listeria monocytogenes 1416 Seq iap-thy Listeria monocytogenes 1425 API, M.PCR Listeria monocytogenes 1427 API, M.PCR Listeria monocytogenes 1451 API, M.PCR Listeria monocytogenes 1452 API, M.PCR Listeria monocytogenes 1456 API, M.PCR Listeria monocytogenes 1670 Seq thy Listeria monocytogenes 1685 API, M.PCR Listeria monocytogenes 1856 Seq iap-thy

Appendix I Reference strains for the Listeria species database
67
Strains WSLC ATCC SLCC Identification methods Listeria monocytogenes 1857 Seq iap-thy Listeria monocytogenes 1858 API, M.PCR Listeria monocytogenes 1859 Seq iap-thy Listeria monocytogenes 1860 API, M.PCR Listeria monocytogenes 1861 API, M.PCR Listeria monocytogenes 1862 API, M.PCR Listeria monocytogenes 1863 Seq iap-thy Listeria monocytogenes 1864 Seq iap-thy Listeria monocytogenes 1865 Seq iap-thy Listeria monocytogenes 1929 Seq iap-thy Listeria monocytogenes 1931 Seq iap-thy Listeria monocytogenes 1932 Seq iap-thy Listeria monocytogenes 1933 Seq iap-thy Listeria monocytogenes 1935 Seq iap-thy Listeria monocytogenes 1936 Seq iap-thy Listeria monocytogenes 1937 Seq iap-thy Listeria monocytogenes 1938 Seq iap-thy Listeria monocytogenes 1940 Seq iap-thy Listeria monocytogenes 1941 Seq iap-thy Listeria monocytogenes 1942 Seq iap-thy Listeria monocytogenes 11042 API, M.PCR Listeria monocytogenes 11043 API, M.PCR Listeria monocytogenes 11044 API, M.PCR Listeria monocytogenes 11046 API, M.PCR Listeria monocytogenes 11047 API, M.PCR Listeria monocytogenes 11078 5543 API, M.PCR Listeria monocytogenes 11079 7140 API, M.PCR Listeria monocytogenes 11080 7381 API, M.PCR Listeria monocytogenes 11081 7392 API, M.PCR Listeria monocytogenes 11082 6753 API, M.PCR Listeria monocytogenes 11083 6848 API, M.PCR Listeria monocytogenes 11084 7207 API, M.PCR Listeria monocytogenes 11086 5069 API, M.PCR Listeria monocytogenes 11087 5070 API, M.PCR Listeria monocytogenes 11088 4925 API, M.PCR Listeria monocytogenes 11089 4954 API, M.PCR Listeria monocytogenes 11090 6277 API, M.PCR Listeria monocytogenes 11102 7093 API, M.PCR Listeria monocytogenes 11103 7002 API, M.PCR Listeria monocytogenes 11105 7069 API, M.PCR Listeria seeligeri 4268 Seq iap-thy Listeria seeligeri 4345 Seq iap-thy Listeria seeligeri 4389 Seq iap-thy Listeria seeligeri 4449 Seq iap-thy Listeria seeligeri 4450 Seq iap-thy Listeria seeligeri 4453 Seq iap-thy Listeria seeligeri 4457 Seq iap-thy Listeria seeligeri 4462 Seq iap-thy Listeria seeligeri 4491 Seq thy Listeria seeligeri 4600 Seq iap Listeria seeligeri 4601 Seq iap Listeria seeligeri 4664 Seq iap-thy
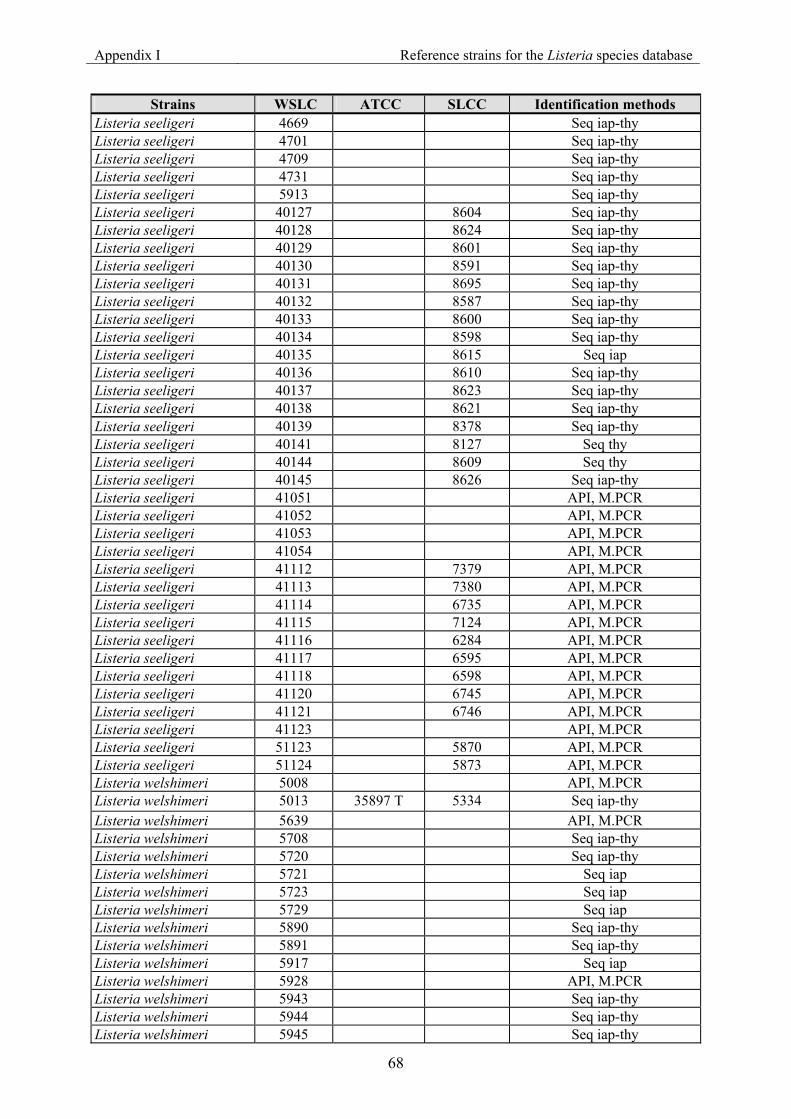
Appendix I Reference strains for the Listeria species database
68
Strains WSLC ATCC SLCC Identification methods Listeria seeligeri 4669 Seq iap-thy Listeria seeligeri 4701 Seq iap-thy Listeria seeligeri 4709 Seq iap-thy Listeria seeligeri 4731 Seq iap-thy Listeria seeligeri 5913 Seq iap-thy Listeria seeligeri 40127 8604 Seq iap-thy Listeria seeligeri 40128 8624 Seq iap-thy Listeria seeligeri 40129 8601 Seq iap-thy Listeria seeligeri 40130 8591 Seq iap-thy Listeria seeligeri 40131 8695 Seq iap-thy Listeria seeligeri 40132 8587 Seq iap-thy Listeria seeligeri 40133 8600 Seq iap-thy Listeria seeligeri 40134 8598 Seq iap-thy Listeria seeligeri 40135 8615 Seq iap Listeria seeligeri 40136 8610 Seq iap-thy Listeria seeligeri 40137 8623 Seq iap-thy Listeria seeligeri 40138 8621 Seq iap-thy Listeria seeligeri 40139 8378 Seq iap-thy Listeria seeligeri 40141 8127 Seq thy Listeria seeligeri 40144 8609 Seq thy Listeria seeligeri 40145 8626 Seq iap-thy Listeria seeligeri 41051 API, M.PCR Listeria seeligeri 41052 API, M.PCR Listeria seeligeri 41053 API, M.PCR Listeria seeligeri 41054 API, M.PCR Listeria seeligeri 41112 7379 API, M.PCR Listeria seeligeri 41113 7380 API, M.PCR Listeria seeligeri 41114 6735 API, M.PCR Listeria seeligeri 41115 7124 API, M.PCR Listeria seeligeri 41116 6284 API, M.PCR Listeria seeligeri 41117 6595 API, M.PCR Listeria seeligeri 41118 6598 API, M.PCR Listeria seeligeri 41120 6745 API, M.PCR Listeria seeligeri 41121 6746 API, M.PCR Listeria seeligeri 41123 API, M.PCR Listeria seeligeri 51123 5870 API, M.PCR Listeria seeligeri 51124 5873 API, M.PCR Listeria welshimeri 5008 API, M.PCR Listeria welshimeri 5013 35897 T 5334 Seq iap-thy Listeria welshimeri 5639 API, M.PCR Listeria welshimeri 5708 Seq iap-thy Listeria welshimeri 5720 Seq iap-thy Listeria welshimeri 5721 Seq iap Listeria welshimeri 5723 Seq iap Listeria welshimeri 5729 Seq iap Listeria welshimeri 5890 Seq iap-thy Listeria welshimeri 5891 Seq iap-thy Listeria welshimeri 5917 Seq iap Listeria welshimeri 5928 API, M.PCR Listeria welshimeri 5943 Seq iap-thy Listeria welshimeri 5944 Seq iap-thy Listeria welshimeri 5945 Seq iap-thy

Appendix I Reference strains for the Listeria species database
69
Strains WSLC ATCC SLCC Identification methods Listeria welshimeri 50146 7622 Seq iap-thy Listeria welshimeri 50147 6199 Seq iap-thy Listeria welshimeri 50148 7625 Seq iap-thy Listeria welshimeri 50150 5828 Seq iap-thy

Appendix II External validation set for Listeria species database
70
7.2 Appendix II: List of strains for the external validation for Listeria species
Alphabetical list of Listeria isolates in the test strain dataset in chapter 3 Gly, strains in the Glycerin- stock in Weihenstephan; WSLC, strains fom the Weihenstephan Collection; API; strains differentiated using the API Listeria test Hemol., hemolysis test FT-IR, strains identified by the Infrared spectroscopic method; M. PCR, strains differentiated using the Multiplex PCR method.
Strains WSLC Gly Identification methods Origin Isolated from L. innocua 3040 API, FT-IR Germany gully L. innocua 3041 API, FT-IR unknown unknown L. innocua 3044 API, FT-IR Germany environmental L. innocua 3045 API, FT-IR Germany wash water L. innocua 3046 API, FT-IR Germany cheese L. innocua 3047 API, FT-IR Germany swabs L. innocua 3048 API, FT-IR Germany gully L. innocua 3049 API, FT-IR, M.PCR, Hemol. Germany gully L. innocua 3061 API, FT-IR Germany gully L. innocua 3062 API, FT-IR Germany gully L. innocua 3063 API, FT-IR Germany floor L. innocua 3065 API, FT-IR Germany gully L. innocua 3066 API, FT-IR Germany gully L. innocua 3067 API, FT-IR, M.PCR Germany swabs L. innocua 3076 API, FT-IR Germany swabs L. innocua 3078 API, FT-IR Germany swabs L. innocua 3079 API, FT-IR Germany swabs L. innocua 3080 API, FT-IR Germany swabs L. innocua 3085 API, FT-IR Germany cheese L. innocua 3086 API, FT-IR Germany cheese L. innocua 3087 API, FT-IR Germany cheese L. innocua 3088 API, FT-IR Germany cheese L. innocua 3089 API, FT-IR Germany swabs L. innocua 3090 API, FT-IR Germany swabs L. innocua 3091 API, FT-IR Germany swabs L. innocua 3093 API, FT-IR Germany swabs L. innocua 3096 API, FT-IR, M.PCR, Hemol. Germany cheese L. innocua 3097 API, FT-IR Germany cheese L. innocua 1636 API, FT-IR United states unknown L. innocua 1705 API, FT-IR Germany unknown L. innocua 2012 API, FT-IR Denmark unknown L. innocua 2014 API, FT-IR unknown unknown L. innocua 2021 API, FT-IR unknown unknown L. innocua 2022 API, FT-IR unknown unknown L. innocua 2023 API, FT-IR, M.PCR unknown unknown L. innocua 2024 API, FT-IR unknown unknown L. innocua 2035 API, FT-IR, M.PCR, Hemol. unknown unknown L. innocua 2051 API, FT-IR unknown unknown L. innocua 2052 API, FT-IR unknown unknown
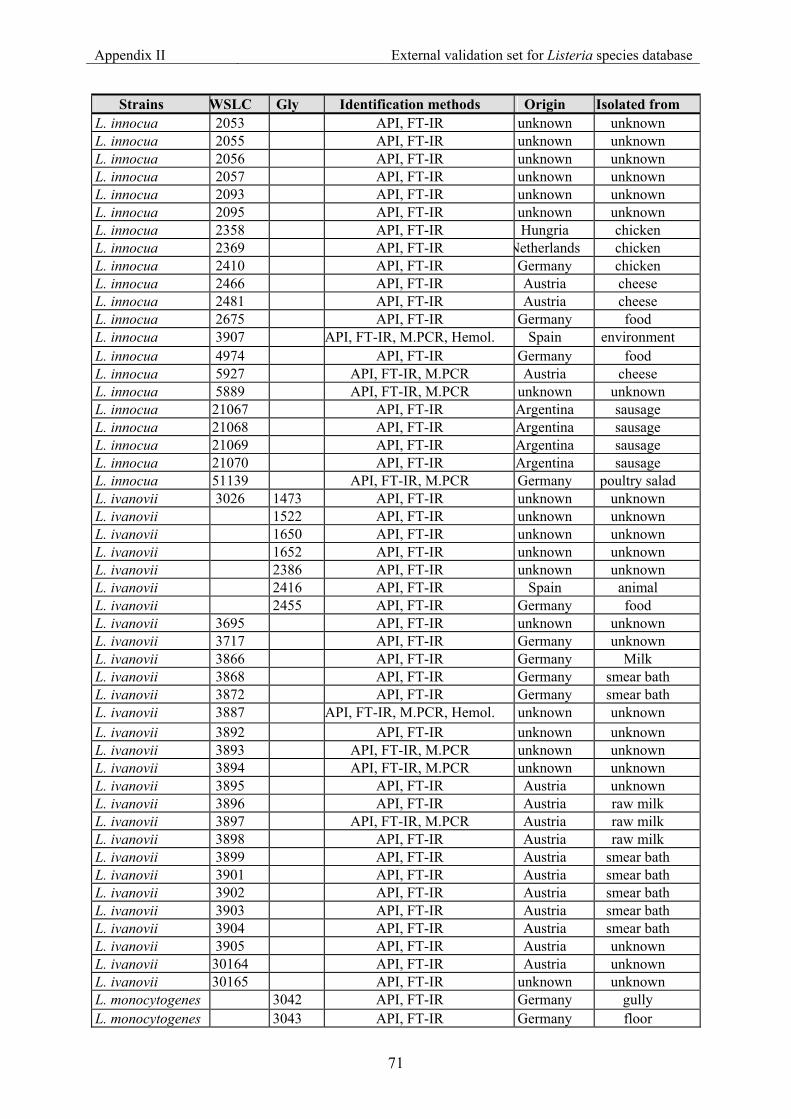
Appendix II External validation set for Listeria species database
71
Strains WSLC Gly Identification methods Origin Isolated from L. innocua 2053 API, FT-IR unknown unknown L. innocua 2055 API, FT-IR unknown unknown L. innocua 2056 API, FT-IR unknown unknown L. innocua 2057 API, FT-IR unknown unknown L. innocua 2093 API, FT-IR unknown unknown L. innocua 2095 API, FT-IR unknown unknown L. innocua 2358 API, FT-IR Hungria chicken L. innocua 2369 API, FT-IR Netherlands chicken L. innocua 2410 API, FT-IR Germany chicken L. innocua 2466 API, FT-IR Austria cheese L. innocua 2481 API, FT-IR Austria cheese L. innocua 2675 API, FT-IR Germany food L. innocua 3907 API, FT-IR, M.PCR, Hemol. Spain environment L. innocua 4974 API, FT-IR Germany food L. innocua 5927 API, FT-IR, M.PCR Austria cheese L. innocua 5889 API, FT-IR, M.PCR unknown unknown L. innocua 21067 API, FT-IR Argentina sausage L. innocua 21068 API, FT-IR Argentina sausage L. innocua 21069 API, FT-IR Argentina sausage L. innocua 21070 API, FT-IR Argentina sausage L. innocua 51139 API, FT-IR, M.PCR Germany poultry salad L. ivanovii 3026 1473 API, FT-IR unknown unknown L. ivanovii 1522 API, FT-IR unknown unknown L. ivanovii 1650 API, FT-IR unknown unknown L. ivanovii 1652 API, FT-IR unknown unknown L. ivanovii 2386 API, FT-IR unknown unknown L. ivanovii 2416 API, FT-IR Spain animal L. ivanovii 2455 API, FT-IR Germany food L. ivanovii 3695 API, FT-IR unknown unknown L. ivanovii 3717 API, FT-IR Germany unknown L. ivanovii 3866 API, FT-IR Germany Milk L. ivanovii 3868 API, FT-IR Germany smear bath L. ivanovii 3872 API, FT-IR Germany smear bath L. ivanovii 3887 API, FT-IR, M.PCR, Hemol. unknown unknown L. ivanovii 3892 API, FT-IR unknown unknown L. ivanovii 3893 API, FT-IR, M.PCR unknown unknown L. ivanovii 3894 API, FT-IR, M.PCR unknown unknown L. ivanovii 3895 API, FT-IR Austria unknown L. ivanovii 3896 API, FT-IR Austria raw milk L. ivanovii 3897 API, FT-IR, M.PCR Austria raw milk L. ivanovii 3898 API, FT-IR Austria raw milk L. ivanovii 3899 API, FT-IR Austria smear bath L. ivanovii 3901 API, FT-IR Austria smear bath L. ivanovii 3902 API, FT-IR Austria smear bath L. ivanovii 3903 API, FT-IR Austria smear bath L. ivanovii 3904 API, FT-IR Austria smear bath L. ivanovii 3905 API, FT-IR Austria unknown L. ivanovii 30164 API, FT-IR Austria unknown L. ivanovii 30165 API, FT-IR unknown unknown L. monocytogenes 3042 API, FT-IR Germany gully L. monocytogenes 3043 API, FT-IR Germany floor

Appendix II External validation set for Listeria species database
72
Strains WSLC Gly Identification methods Origin Isolated from L. monocytogenes 3064 API, FT-IR, M.PCR, Hemol. Germany wash water L. monocytogenes 3068 API, FT-IR Germany gully L. monocytogenes 3071 API, FT-IR, M.PCR Germany soft cheese L. monocytogenes 3072 API, FT-IR Germany soft cheese L. monocytogenes 3073 API, FT-IR Germany gully L. monocytogenes 3074 API, FT-IR Germany smear bath L. monocytogenes 3075 API, FT-IR unknown unknown L. monocytogenes 3077 API, FT-IR, M.PCR Germany gully L. monocytogenes 3092 API, FT-IR Germany smear bath L. monocytogenes 1042 API, FT-IR unknown unknown L. monocytogenes 1043 API, FT-IR unknown unknown L. monocytogenes 1044 API, FT-IR unknown unknown L. monocytogenes 1046 API, FT-IR unknown unknown L. monocytogenes 1116 API, FT-IR unknown unknown L. monocytogenes 1117 API, FT-IR unknown unknown L. monocytogenes 1119 API, FT-IR unknown unknown L. monocytogenes 1120 API, FT-IR unknown unknown L. monocytogenes 1121 API, FT-IR unknown unknown L. monocytogenes 1122 API, FT-IR unknown unknown L. monocytogenes 1376 API, FT-IR Netherlands soup hen L. monocytogenes 1475 API, FT-IR Austria cheese L. monocytogenes 1476 API, FT-IR Austria cheese L. monocytogenes 1482 API, FT-IR Austria cheese L. monocytogenes 1483 API, FT-IR Austria cheese L. monocytogenes 1484 API, FT-IR Austria cheese L. monocytogenes 1486 API, FT-IR Austria cheese L. monocytogenes 1487 API, FT-IR Austria cheese L. monocytogenes 1489 API, FT-IR Austria cheese L. monocytogenes 1490 API, FT-IR Austria cheese L. monocytogenes 1493 API, FT-IR Austria cheese L. monocytogenes 1497 API, FT-IR Austria cheese L. monocytogenes 1498 API, FT-IR Austria cheese L. monocytogenes 1499 API, FT-IR Austria cheese L. monocytogenes 1504 API, FT-IR Austria cheese L. monocytogenes 1506 API, FT-IR Austria cheese L. monocytogenes 1510 API, FT-IR Austria cheese L. monocytogenes 1511 API, FT-IR Austria cheese L. monocytogenes 1512 API, FT-IR Austria cheese L. monocytogenes 1514 API, FT-IR Austria cheese L. monocytogenes 1516 API, FT-IR Austria cheese L. monocytogenes 1551 API, FT-IR Germany unknown L. monocytogenes 1552 API, FT-IR Germany unknown L. monocytogenes 1556 API, FT-IR Germany unknown L. monocytogenes 1557 API, FT-IR, M.PCR, Hemol. Germany unknown L. monocytogenes 1558 API, FT-IR Germany unknown L. monocytogenes 1559 API, FT-IR Germany unknown L. monocytogenes 1564 API, FT-IR Germany unknown L. monocytogenes 1571 API, FT-IR Germany unknown L. monocytogenes 1574 API, FT-IR Germany unknown L. monocytogenes 1575 API, FT-IR Germany unknown L. monocytogenes 1576 API, FT-IR, M.PCR Germany unknown
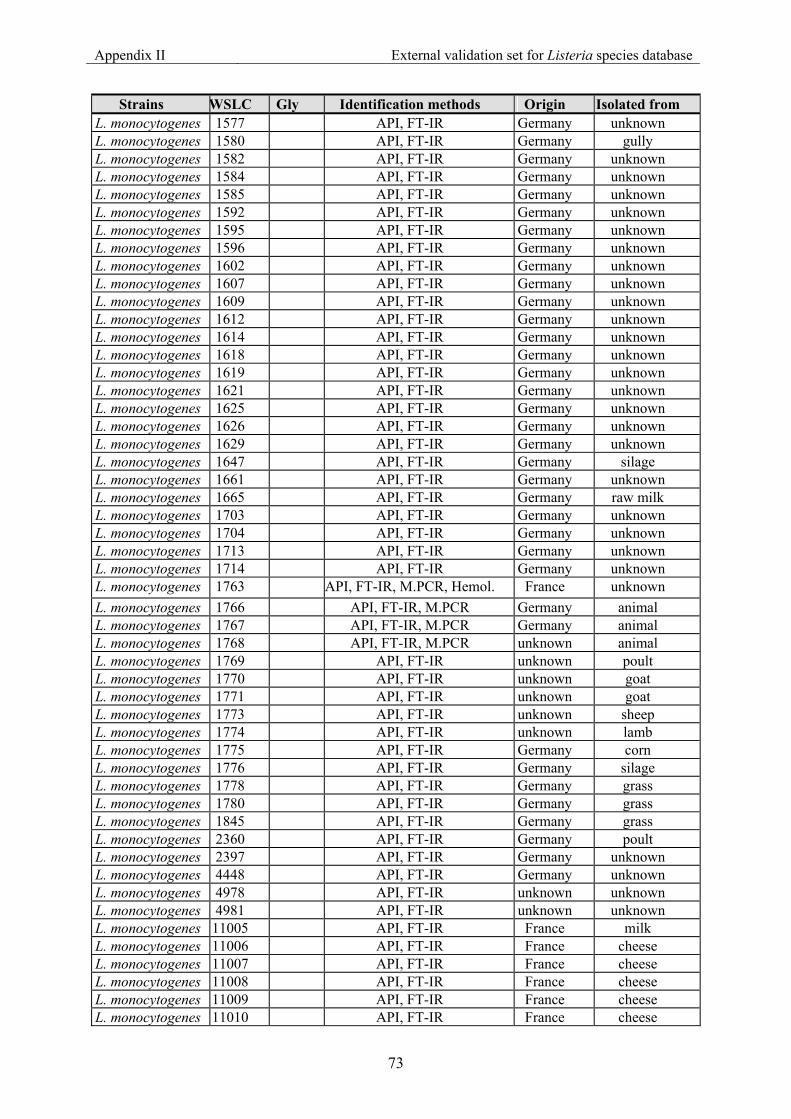
Appendix II External validation set for Listeria species database
73
Strains WSLC Gly Identification methods Origin Isolated from L. monocytogenes 1577 API, FT-IR Germany unknown L. monocytogenes 1580 API, FT-IR Germany gully L. monocytogenes 1582 API, FT-IR Germany unknown L. monocytogenes 1584 API, FT-IR Germany unknown L. monocytogenes 1585 API, FT-IR Germany unknown L. monocytogenes 1592 API, FT-IR Germany unknown L. monocytogenes 1595 API, FT-IR Germany unknown L. monocytogenes 1596 API, FT-IR Germany unknown L. monocytogenes 1602 API, FT-IR Germany unknown L. monocytogenes 1607 API, FT-IR Germany unknown L. monocytogenes 1609 API, FT-IR Germany unknown L. monocytogenes 1612 API, FT-IR Germany unknown L. monocytogenes 1614 API, FT-IR Germany unknown L. monocytogenes 1618 API, FT-IR Germany unknown L. monocytogenes 1619 API, FT-IR Germany unknown L. monocytogenes 1621 API, FT-IR Germany unknown L. monocytogenes 1625 API, FT-IR Germany unknown L. monocytogenes 1626 API, FT-IR Germany unknown L. monocytogenes 1629 API, FT-IR Germany unknown L. monocytogenes 1647 API, FT-IR Germany silage L. monocytogenes 1661 API, FT-IR Germany unknown L. monocytogenes 1665 API, FT-IR Germany raw milk L. monocytogenes 1703 API, FT-IR Germany unknown L. monocytogenes 1704 API, FT-IR Germany unknown L. monocytogenes 1713 API, FT-IR Germany unknown L. monocytogenes 1714 API, FT-IR Germany unknown L. monocytogenes 1763 API, FT-IR, M.PCR, Hemol. France unknown L. monocytogenes 1766 API, FT-IR, M.PCR Germany animal L. monocytogenes 1767 API, FT-IR, M.PCR Germany animal L. monocytogenes 1768 API, FT-IR, M.PCR unknown animal L. monocytogenes 1769 API, FT-IR unknown poult L. monocytogenes 1770 API, FT-IR unknown goat L. monocytogenes 1771 API, FT-IR unknown goat L. monocytogenes 1773 API, FT-IR unknown sheep L. monocytogenes 1774 API, FT-IR unknown lamb L. monocytogenes 1775 API, FT-IR Germany corn L. monocytogenes 1776 API, FT-IR Germany silage L. monocytogenes 1778 API, FT-IR Germany grass L. monocytogenes 1780 API, FT-IR Germany grass L. monocytogenes 1845 API, FT-IR Germany grass L. monocytogenes 2360 API, FT-IR Germany poult L. monocytogenes 2397 API, FT-IR Germany unknown L. monocytogenes 4448 API, FT-IR Germany unknown L. monocytogenes 4978 API, FT-IR unknown unknown L. monocytogenes 4981 API, FT-IR unknown unknown L. monocytogenes 11005 API, FT-IR France milk L. monocytogenes 11006 API, FT-IR France cheese L. monocytogenes 11007 API, FT-IR France cheese L. monocytogenes 11008 API, FT-IR France cheese L. monocytogenes 11009 API, FT-IR France cheese L. monocytogenes 11010 API, FT-IR France cheese

Appendix II External validation set for Listeria species database
74
Strains WSLC Gly Identification methods Origin Isolated from L. monocytogenes 11011 API, FT-IR France cheese L. monocytogenes 11012 API, FT-IR France cheese L. monocytogenes 11013 API, FT-IR France cheese L. monocytogenes 11014 API, FT-IR France cheese L. monocytogenes 11015 API, FT-IR France cheese L. monocytogenes 11016 API, FT-IR France cheese L. monocytogenes 11017 API, FT-IR France cheese L. monocytogenes 11018 API, FT-IR France cheese L. monocytogenes 11019 API, FT-IR France feed L. monocytogenes 11021 API, FT-IR France feces L. monocytogenes 11022 API, FT-IR France cheese L. monocytogenes 11023 API, FT-IR France cheese L. monocytogenes 11024 API, FT-IR France cheese L. monocytogenes 11025 API, FT-IR France milk filter L. monocytogenes 11026 API, FT-IR France teat L. monocytogenes 11027 API, FT-IR France cheese L. monocytogenes 11028 API, FT-IR France cheese L. monocytogenes 11030 API, FT-IR France ground cellar L. monocytogenes 11031 API, FT-IR France cheese L. monocytogenes 11032 API, FT-IR France cheese L. monocytogenes 11033 API, FT-IR France cheese L. monocytogenes 11034 API, FT-IR France cheese L. monocytogenes 11035 API, FT-IR France ground cellar L. monocytogenes 11039 API, FT-IR France cheese L. monocytogenes 11040 API, FT-IR France cheese L. monocytogenes 11071 API, FT-IR France cheese L. seeligeri 1482 API, FT-IR unknown unknown L. seeligeri 1483 API, FT-IR unknown unknown L. seeligeri 1534 API, FT-IR, M.PCR unknown unknown L. seeligeri 1535 API, FT-IR unknown unknown L. seeligeri 1604 API, FT-IR unknown unknown L. seeligeri 1605 API, FT-IR unknown unknown L. seeligeri 1607 API, FT-IR unknown unknown L. seeligeri 1608 API, FT-IR unknown unknown L. seeligeri 2447 API, FT-IR unknown unknown L. seeligeri 2453 API, FT-IR unknown unknown L. seeligeri 2454 API, FT-IR unknown unknown L. seeligeri 2464 API, FT-IR unknown unknown L. seeligeri 3900 API, FT-IR, M.PCR Austria smear bath L. seeligeri 4007 API, FT-IR unknown unknown L. seeligeri 4386 API, FT-IR unknown raw milk L. seeligeri 4387 API, FT-IR unknown raw milk L. seeligeri 4433 API, FT-IR Germany unknown L. seeligeri 4441 API, FT-IR, M.PCR, Hemol. Germany unknown L. seeligeri 4454 API, FT-IR, M.PCR Germany unknown L. seeligeri 4546 API, FT-IR unknown unknown L. seeligeri 4547 API, FT-IR unknown cheese L. seeligeri 4548 API, FT-IR, M.PCR unknown cheese L. seeligeri 4549 API, FT-IR unknown cheese L. seeligeri 4550 API, FT-IR unknown cheese L. seeligeri 4666 API, FT-IR, M.PCR unknown raw milk
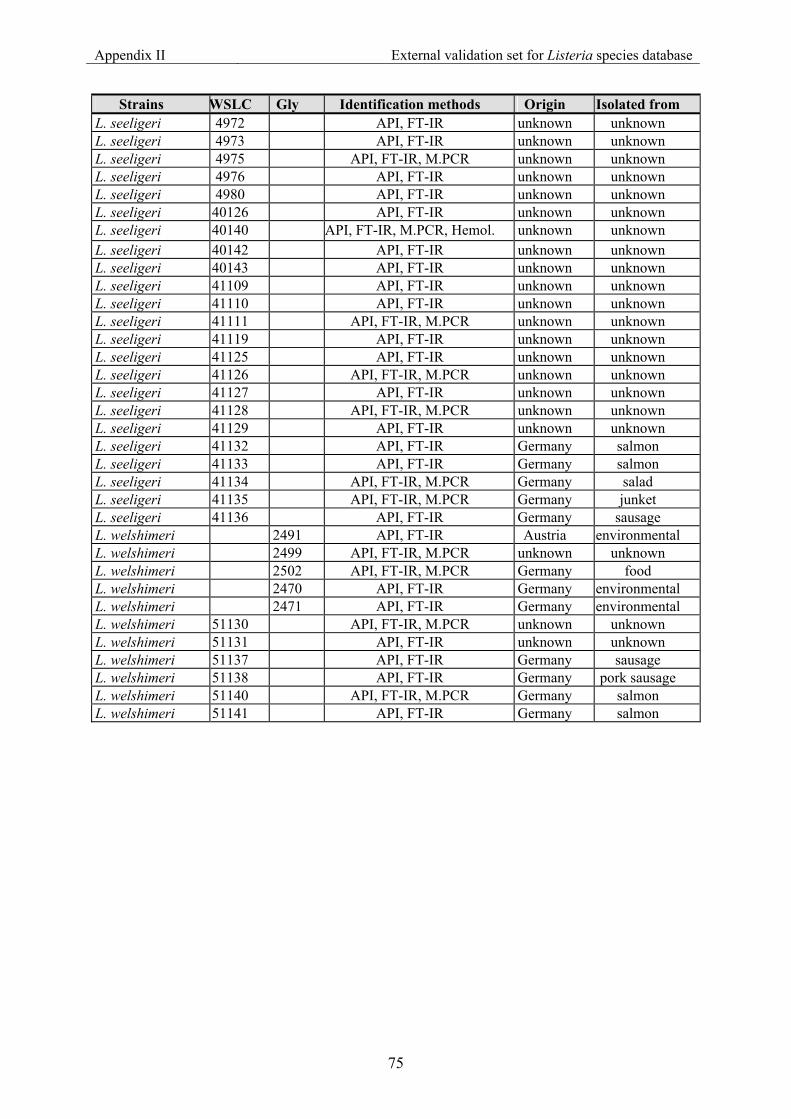
Appendix II External validation set for Listeria species database
75
Strains WSLC Gly Identification methods Origin Isolated from L. seeligeri 4972 API, FT-IR unknown unknown L. seeligeri 4973 API, FT-IR unknown unknown L. seeligeri 4975 API, FT-IR, M.PCR unknown unknown L. seeligeri 4976 API, FT-IR unknown unknown L. seeligeri 4980 API, FT-IR unknown unknown L. seeligeri 40126 API, FT-IR unknown unknown L. seeligeri 40140 API, FT-IR, M.PCR, Hemol. unknown unknown L. seeligeri 40142 API, FT-IR unknown unknown L. seeligeri 40143 API, FT-IR unknown unknown L. seeligeri 41109 API, FT-IR unknown unknown L. seeligeri 41110 API, FT-IR unknown unknown L. seeligeri 41111 API, FT-IR, M.PCR unknown unknown L. seeligeri 41119 API, FT-IR unknown unknown L. seeligeri 41125 API, FT-IR unknown unknown L. seeligeri 41126 API, FT-IR, M.PCR unknown unknown L. seeligeri 41127 API, FT-IR unknown unknown L. seeligeri 41128 API, FT-IR, M.PCR unknown unknown L. seeligeri 41129 API, FT-IR unknown unknown L. seeligeri 41132 API, FT-IR Germany salmon L. seeligeri 41133 API, FT-IR Germany salmon L. seeligeri 41134 API, FT-IR, M.PCR Germany salad L. seeligeri 41135 API, FT-IR, M.PCR Germany junket L. seeligeri 41136 API, FT-IR Germany sausage L. welshimeri 2491 API, FT-IR Austria environmental L. welshimeri 2499 API, FT-IR, M.PCR unknown unknown L. welshimeri 2502 API, FT-IR, M.PCR Germany food L. welshimeri 2470 API, FT-IR Germany environmental L. welshimeri 2471 API, FT-IR Germany environmental L. welshimeri 51130 API, FT-IR, M.PCR unknown unknown L. welshimeri 51131 API, FT-IR unknown unknown L. welshimeri 51137 API, FT-IR Germany sausage L. welshimeri 51138 API, FT-IR Germany pork sausage L. welshimeri 51140 API, FT-IR, M.PCR Germany salmon L. welshimeri 51141 API, FT-IR Germany salmon
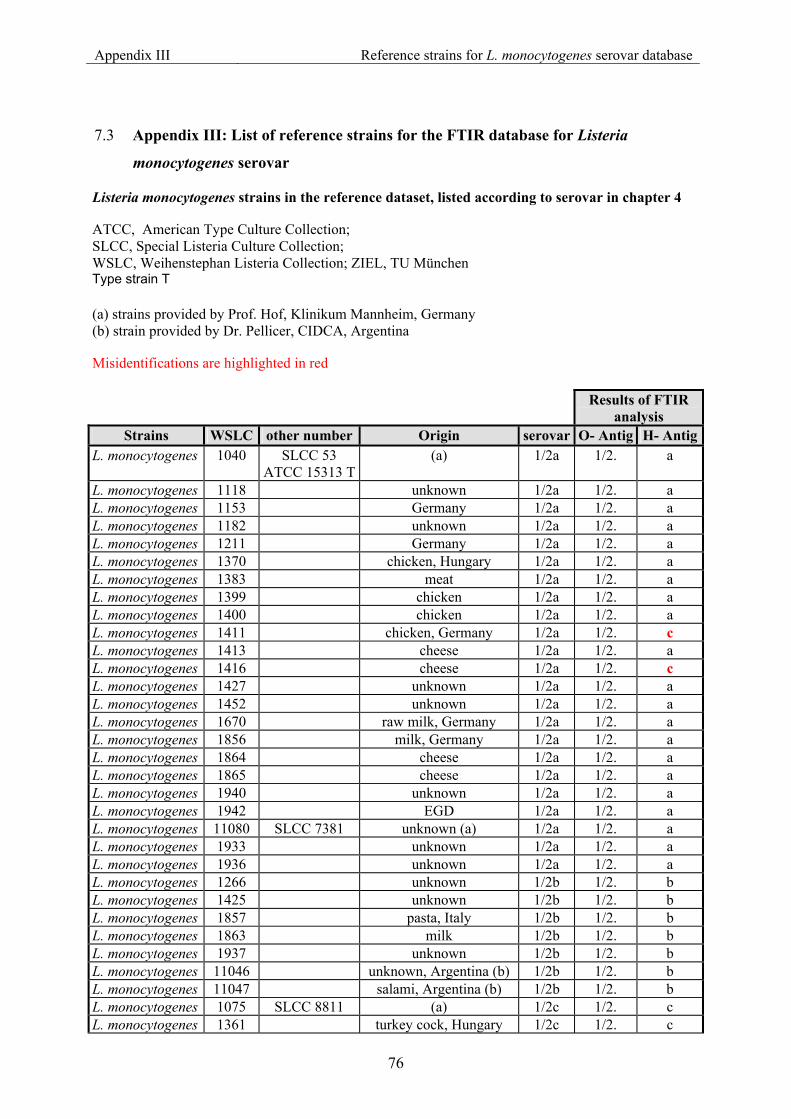
Appendix III Reference strains for L. monocytogenes serovar database
76
7.3 Appendix III: List of reference strains for the FTIR database for Listeria
monocytogenes serovar
Listeria monocytogenes strains in the reference dataset, listed according to serovar in chapter 4 ATCC, American Type Culture Collection; SLCC, Special Listeria Culture Collection; WSLC, Weihenstephan Listeria Collection; ZIEL, TU München Type strain T (a) strains provided by Prof. Hof, Klinikum Mannheim, Germany (b) strain provided by Dr. Pellicer, CIDCA, Argentina Misidentifications are highlighted in red
Results of FTIR
analysis Strains WSLC other number Origin serovar O- Antig H- Antig
L. monocytogenes 1040 SLCC 53 ATCC 15313 T
(a) 1/2a 1/2. a
L. monocytogenes 1118 unknown 1/2a 1/2. a L. monocytogenes 1153 Germany 1/2a 1/2. a L. monocytogenes 1182 unknown 1/2a 1/2. a L. monocytogenes 1211 Germany 1/2a 1/2. a L. monocytogenes 1370 chicken, Hungary 1/2a 1/2. a L. monocytogenes 1383 meat 1/2a 1/2. a L. monocytogenes 1399 chicken 1/2a 1/2. a L. monocytogenes 1400 chicken 1/2a 1/2. a L. monocytogenes 1411 chicken, Germany 1/2a 1/2. c L. monocytogenes 1413 cheese 1/2a 1/2. a L. monocytogenes 1416 cheese 1/2a 1/2. c L. monocytogenes 1427 unknown 1/2a 1/2. a L. monocytogenes 1452 unknown 1/2a 1/2. a L. monocytogenes 1670 raw milk, Germany 1/2a 1/2. a L. monocytogenes 1856 milk, Germany 1/2a 1/2. a L. monocytogenes 1864 cheese 1/2a 1/2. a L. monocytogenes 1865 cheese 1/2a 1/2. a L. monocytogenes 1940 unknown 1/2a 1/2. a L. monocytogenes 1942 EGD 1/2a 1/2. a L. monocytogenes 11080 SLCC 7381 unknown (a) 1/2a 1/2. a L. monocytogenes 1933 unknown 1/2a 1/2. a L. monocytogenes 1936 unknown 1/2a 1/2. a L. monocytogenes 1266 unknown 1/2b 1/2. b L. monocytogenes 1425 unknown 1/2b 1/2. b L. monocytogenes 1857 pasta, Italy 1/2b 1/2. b L. monocytogenes 1863 milk 1/2b 1/2. b L. monocytogenes 1937 unknown 1/2b 1/2. b L. monocytogenes 11046 unknown, Argentina (b) 1/2b 1/2. b L. monocytogenes 11047 salami, Argentina (b) 1/2b 1/2. b L. monocytogenes 1075 SLCC 8811 (a) 1/2c 1/2. c L. monocytogenes 1361 turkey cock, Hungary 1/2c 1/2. c
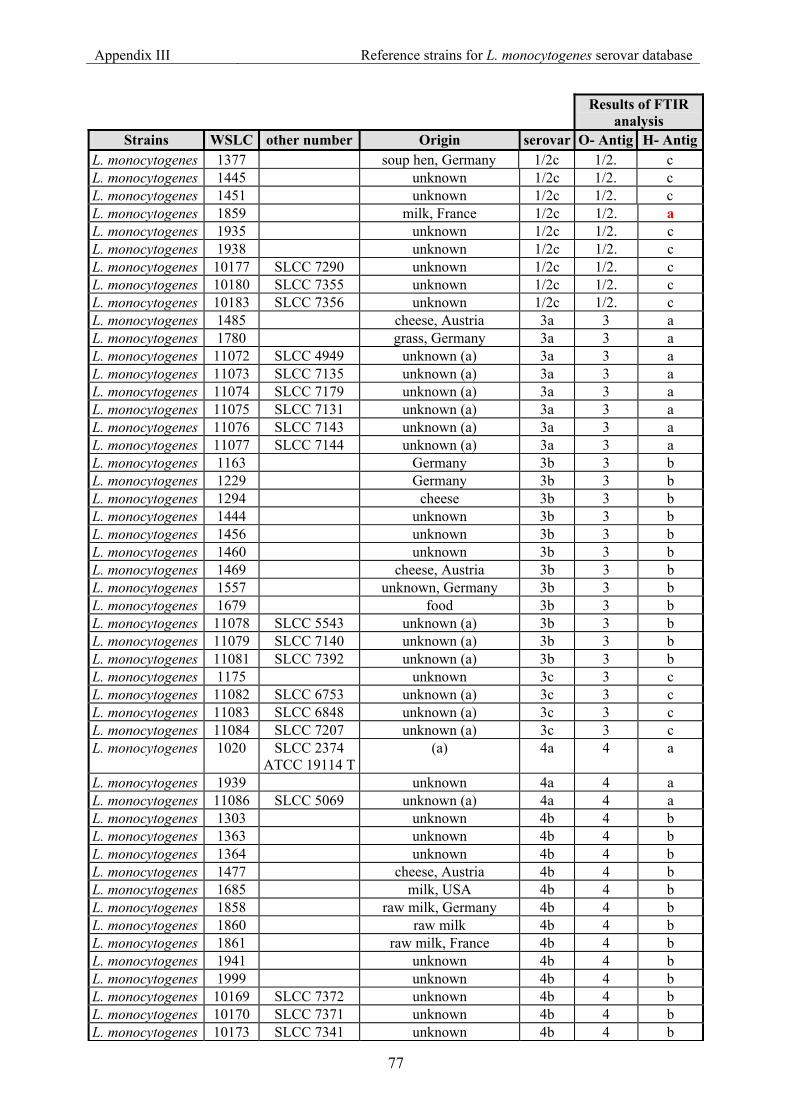
Appendix III Reference strains for L. monocytogenes serovar database
77
Results of FTIR analysis
Strains WSLC other number Origin serovar O- Antig H- AntigL. monocytogenes 1377 soup hen, Germany 1/2c 1/2. c L. monocytogenes 1445 unknown 1/2c 1/2. c L. monocytogenes 1451 unknown 1/2c 1/2. c L. monocytogenes 1859 milk, France 1/2c 1/2. a L. monocytogenes 1935 unknown 1/2c 1/2. c L. monocytogenes 1938 unknown 1/2c 1/2. c L. monocytogenes 10177 SLCC 7290 unknown 1/2c 1/2. c L. monocytogenes 10180 SLCC 7355 unknown 1/2c 1/2. c L. monocytogenes 10183 SLCC 7356 unknown 1/2c 1/2. c L. monocytogenes 1485 cheese, Austria 3a 3 a L. monocytogenes 1780 grass, Germany 3a 3 a L. monocytogenes 11072 SLCC 4949 unknown (a) 3a 3 a L. monocytogenes 11073 SLCC 7135 unknown (a) 3a 3 a L. monocytogenes 11074 SLCC 7179 unknown (a) 3a 3 a L. monocytogenes 11075 SLCC 7131 unknown (a) 3a 3 a L. monocytogenes 11076 SLCC 7143 unknown (a) 3a 3 a L. monocytogenes 11077 SLCC 7144 unknown (a) 3a 3 a L. monocytogenes 1163 Germany 3b 3 b L. monocytogenes 1229 Germany 3b 3 b L. monocytogenes 1294 cheese 3b 3 b L. monocytogenes 1444 unknown 3b 3 b L. monocytogenes 1456 unknown 3b 3 b L. monocytogenes 1460 unknown 3b 3 b L. monocytogenes 1469 cheese, Austria 3b 3 b L. monocytogenes 1557 unknown, Germany 3b 3 b L. monocytogenes 1679 food 3b 3 b L. monocytogenes 11078 SLCC 5543 unknown (a) 3b 3 b L. monocytogenes 11079 SLCC 7140 unknown (a) 3b 3 b L. monocytogenes 11081 SLCC 7392 unknown (a) 3b 3 b L. monocytogenes 1175 unknown 3c 3 c L. monocytogenes 11082 SLCC 6753 unknown (a) 3c 3 c L. monocytogenes 11083 SLCC 6848 unknown (a) 3c 3 c L. monocytogenes 11084 SLCC 7207 unknown (a) 3c 3 c L. monocytogenes 1020 SLCC 2374
ATCC 19114 T(a) 4a 4 a
L. monocytogenes 1939 unknown 4a 4 a L. monocytogenes 11086 SLCC 5069 unknown (a) 4a 4 a L. monocytogenes 1303 unknown 4b 4 b L. monocytogenes 1363 unknown 4b 4 b L. monocytogenes 1364 unknown 4b 4 b L. monocytogenes 1477 cheese, Austria 4b 4 b L. monocytogenes 1685 milk, USA 4b 4 b L. monocytogenes 1858 raw milk, Germany 4b 4 b L. monocytogenes 1860 raw milk 4b 4 b L. monocytogenes 1861 raw milk, France 4b 4 b L. monocytogenes 1941 unknown 4b 4 b L. monocytogenes 1999 unknown 4b 4 b L. monocytogenes 10169 SLCC 7372 unknown 4b 4 b L. monocytogenes 10170 SLCC 7371 unknown 4b 4 b L. monocytogenes 10173 SLCC 7341 unknown 4b 4 b
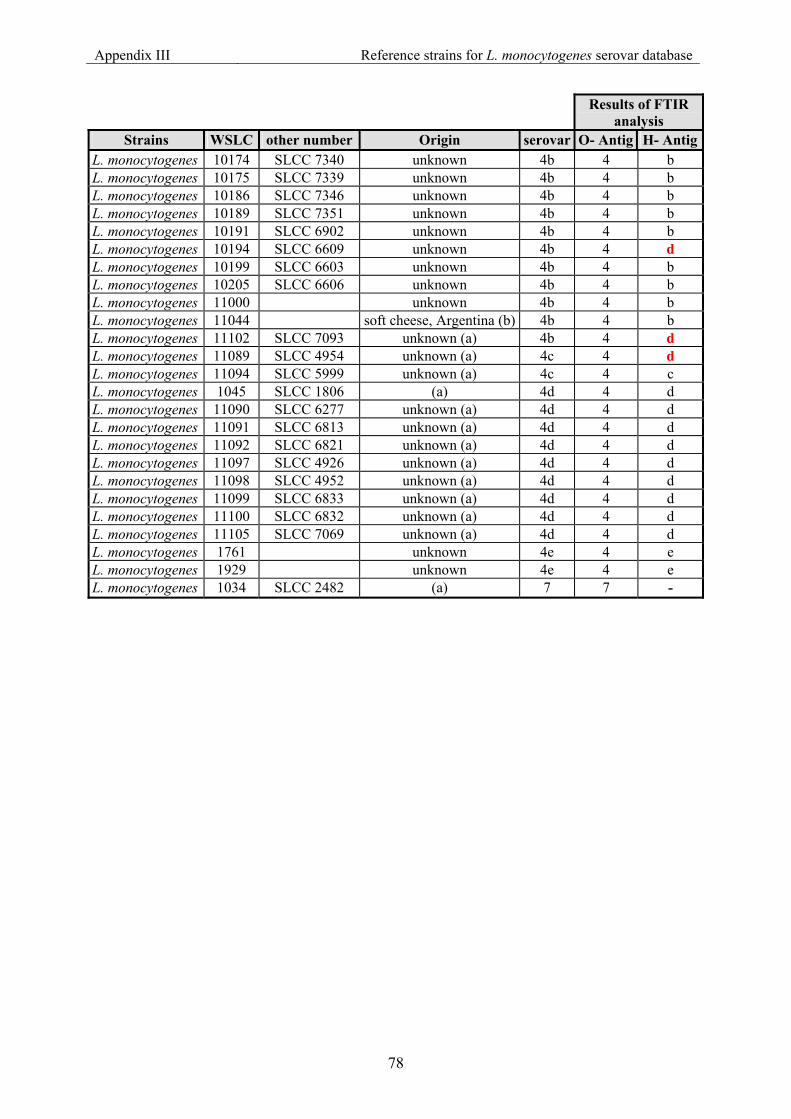
Appendix III Reference strains for L. monocytogenes serovar database
78
Results of FTIR analysis
Strains WSLC other number Origin serovar O- Antig H- AntigL. monocytogenes 10174 SLCC 7340 unknown 4b 4 b L. monocytogenes 10175 SLCC 7339 unknown 4b 4 b L. monocytogenes 10186 SLCC 7346 unknown 4b 4 b L. monocytogenes 10189 SLCC 7351 unknown 4b 4 b L. monocytogenes 10191 SLCC 6902 unknown 4b 4 b L. monocytogenes 10194 SLCC 6609 unknown 4b 4 d L. monocytogenes 10199 SLCC 6603 unknown 4b 4 b L. monocytogenes 10205 SLCC 6606 unknown 4b 4 b L. monocytogenes 11000 unknown 4b 4 b L. monocytogenes 11044 soft cheese, Argentina (b) 4b 4 b L. monocytogenes 11102 SLCC 7093 unknown (a) 4b 4 d L. monocytogenes 11089 SLCC 4954 unknown (a) 4c 4 d L. monocytogenes 11094 SLCC 5999 unknown (a) 4c 4 c L. monocytogenes 1045 SLCC 1806 (a) 4d 4 d L. monocytogenes 11090 SLCC 6277 unknown (a) 4d 4 d L. monocytogenes 11091 SLCC 6813 unknown (a) 4d 4 d L. monocytogenes 11092 SLCC 6821 unknown (a) 4d 4 d L. monocytogenes 11097 SLCC 4926 unknown (a) 4d 4 d L. monocytogenes 11098 SLCC 4952 unknown (a) 4d 4 d L. monocytogenes 11099 SLCC 6833 unknown (a) 4d 4 d L. monocytogenes 11100 SLCC 6832 unknown (a) 4d 4 d L. monocytogenes 11105 SLCC 7069 unknown (a) 4d 4 d L. monocytogenes 1761 unknown 4e 4 e L. monocytogenes 1929 unknown 4e 4 e L. monocytogenes 1034 SLCC 2482 (a) 7 7 -

Appendix IV External Validation set for L. monocytogenes serovar
79
7.4 Appendix IV: List of strains for the external validation for Listeria monocyogenes
serovar
Listeria monocytogenes isolates in the external validation set, listed according to serovar in chapter 4 ATCC, American Type Culture Collection; SLCC, Special Listeria Culture Collection; WSLC, Weihenstephan Listeria Collection; ; ZIEL, TU München Gly, strains in the Glycerin- stock in the Weihenstephan Collection; ZIEL, TU München (a) strains provided by Prof. Hof, Klinikum Mannheim, Germany (b) strains provided by Dr. Montel, INRA, France (c) strain provided by Dr. Pellicer, CIDCA, Argentina Multiplex PCR was performed according to Doumith et al. (3) Misidentifications and Non-identifications are highlighted in red
Results of FTIR
analysis Strains WSLC other
number Origin Serovar O-
Antig H-
Antig
Results ofMultiplex
PCR
L. monocytogenes 1237 smear cheese, Germany 1/2a 1/2. a 1/2a,3a L. monocytogenes 1271 Germany 1/2a 1/2. a 1/2a,3a L. monocytogenes 1297 unknown 1/2a 1/2. a 1/2a,3a L. monocytogenes 1376 soup hen, Netherlands 1/2a 1/2. a 1/2a,3a L. monocytogenes 1475 cheese, Austria 1/2a 1/2. a 1/2c,3c L. monocytogenes 1483 cheese, Austria 1/2a 3 a 1/2a,3a L. monocytogenes 1484 cheese, Austria 1/2a 1/2. a 1/2a,3a L. monocytogenes 1486 cheese, Austria 1/2a 1/2. a 1/2a,3a L. monocytogenes 1487 cheese, Austria 1/2a 1/2. a 1/2a,3a L. monocytogenes 1490 cheese, Austria 1/2a 1/2. a 1/2a,3a L. monocytogenes 1558 Germany 1/2a 1/2. a 1/2a,3a L. monocytogenes 1559 Germany 1/2a 1/2. a 1/2a,3a L. monocytogenes 1571 Germany 1/2a 1/2. a 1/2a,3a L. monocytogenes 1575 Germany 1/2a 1/2. a 1/2a,3a L. monocytogenes 1582 gully 1/2a 1/2. a 1/2a,3a L. monocytogenes 1584 Germany 1/2a 1/2. a 1/2a,3a L. monocytogenes 1596 Germany 1/2a 1/2. a 1/2a,3a L. monocytogenes 1607 Germany 1/2a 1/2. a 1/2a,3a L. monocytogenes 1612 Germany 1/2a 1/2. c 1/2a,3a L. monocytogenes 1618 Germany 1/2a 1/2. a 1/2a,3a L. monocytogenes 1647 silage 1/2a 1/2. a 1/2a,3a L. monocytogenes 1665 raw milk 1/2a 1/2. a 1/2a,3a L. monocytogenes 1714 Germany 1/2a 1/2. a 1/2a,3a L. monocytogenes 1767 SLCC 7152 animal, Germany (a) 1/2a 1/2. a 1/2a,3a L. monocytogenes 1768 SLCC 6447 animal (a) 1/2a 1/2. a 1/2a,3a L. monocytogenes 1769 SLCC 6448 poult (a) 1/2a 1/2. a 1/2a,3a L. monocytogenes 1770 SLCC 6449 goat (a) 1/2a 1/2. a 1/2a,3a L. monocytogenes 1771 SLCC 6450 goat (a) 1/2a 1/2. a 1/2a,3a L. monocytogenes 1774 SLCC 6445 lamb (a) 1/2a 1/2. a 1/2a,3a
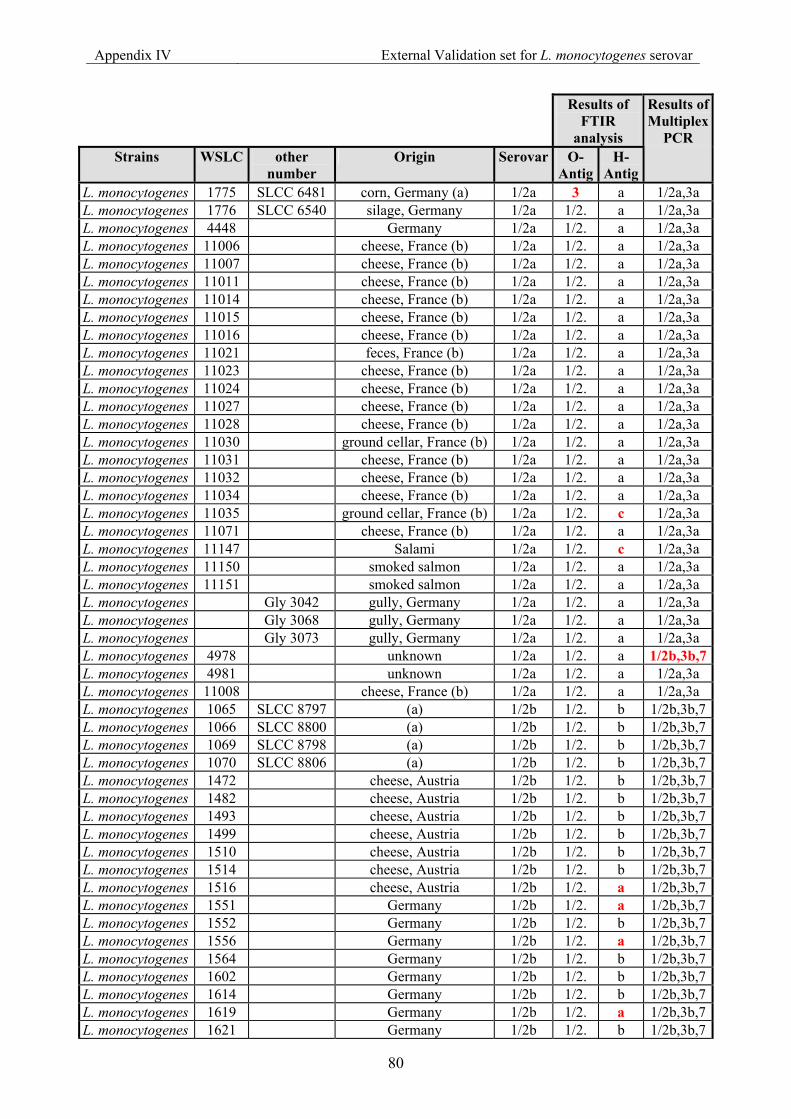
Appendix IV External Validation set for L. monocytogenes serovar
80
Results of FTIR
analysis Strains WSLC other
number Origin Serovar O-
Antig H-
Antig
Results ofMultiplex
PCR
L. monocytogenes 1775 SLCC 6481 corn, Germany (a) 1/2a 3 a 1/2a,3a L. monocytogenes 1776 SLCC 6540 silage, Germany 1/2a 1/2. a 1/2a,3a L. monocytogenes 4448 Germany 1/2a 1/2. a 1/2a,3a L. monocytogenes 11006 cheese, France (b) 1/2a 1/2. a 1/2a,3a L. monocytogenes 11007 cheese, France (b) 1/2a 1/2. a 1/2a,3a L. monocytogenes 11011 cheese, France (b) 1/2a 1/2. a 1/2a,3a L. monocytogenes 11014 cheese, France (b) 1/2a 1/2. a 1/2a,3a L. monocytogenes 11015 cheese, France (b) 1/2a 1/2. a 1/2a,3a L. monocytogenes 11016 cheese, France (b) 1/2a 1/2. a 1/2a,3a L. monocytogenes 11021 feces, France (b) 1/2a 1/2. a 1/2a,3a L. monocytogenes 11023 cheese, France (b) 1/2a 1/2. a 1/2a,3a L. monocytogenes 11024 cheese, France (b) 1/2a 1/2. a 1/2a,3a L. monocytogenes 11027 cheese, France (b) 1/2a 1/2. a 1/2a,3a L. monocytogenes 11028 cheese, France (b) 1/2a 1/2. a 1/2a,3a L. monocytogenes 11030 ground cellar, France (b) 1/2a 1/2. a 1/2a,3a L. monocytogenes 11031 cheese, France (b) 1/2a 1/2. a 1/2a,3a L. monocytogenes 11032 cheese, France (b) 1/2a 1/2. a 1/2a,3a L. monocytogenes 11034 cheese, France (b) 1/2a 1/2. a 1/2a,3a L. monocytogenes 11035 ground cellar, France (b) 1/2a 1/2. c 1/2a,3a L. monocytogenes 11071 cheese, France (b) 1/2a 1/2. a 1/2a,3a L. monocytogenes 11147 Salami 1/2a 1/2. c 1/2a,3a L. monocytogenes 11150 smoked salmon 1/2a 1/2. a 1/2a,3a L. monocytogenes 11151 smoked salmon 1/2a 1/2. a 1/2a,3a L. monocytogenes Gly 3042 gully, Germany 1/2a 1/2. a 1/2a,3a L. monocytogenes Gly 3068 gully, Germany 1/2a 1/2. a 1/2a,3a L. monocytogenes Gly 3073 gully, Germany 1/2a 1/2. a 1/2a,3a L. monocytogenes 4978 unknown 1/2a 1/2. a 1/2b,3b,7L. monocytogenes 4981 unknown 1/2a 1/2. a 1/2a,3a L. monocytogenes 11008 cheese, France (b) 1/2a 1/2. a 1/2a,3a L. monocytogenes 1065 SLCC 8797 (a) 1/2b 1/2. b 1/2b,3b,7L. monocytogenes 1066 SLCC 8800 (a) 1/2b 1/2. b 1/2b,3b,7L. monocytogenes 1069 SLCC 8798 (a) 1/2b 1/2. b 1/2b,3b,7L. monocytogenes 1070 SLCC 8806 (a) 1/2b 1/2. b 1/2b,3b,7L. monocytogenes 1472 cheese, Austria 1/2b 1/2. b 1/2b,3b,7L. monocytogenes 1482 cheese, Austria 1/2b 1/2. b 1/2b,3b,7L. monocytogenes 1493 cheese, Austria 1/2b 1/2. b 1/2b,3b,7L. monocytogenes 1499 cheese, Austria 1/2b 1/2. b 1/2b,3b,7L. monocytogenes 1510 cheese, Austria 1/2b 1/2. b 1/2b,3b,7L. monocytogenes 1514 cheese, Austria 1/2b 1/2. b 1/2b,3b,7L. monocytogenes 1516 cheese, Austria 1/2b 1/2. a 1/2b,3b,7L. monocytogenes 1551 Germany 1/2b 1/2. a 1/2b,3b,7L. monocytogenes 1552 Germany 1/2b 1/2. b 1/2b,3b,7L. monocytogenes 1556 Germany 1/2b 1/2. a 1/2b,3b,7L. monocytogenes 1564 Germany 1/2b 1/2. b 1/2b,3b,7L. monocytogenes 1602 Germany 1/2b 1/2. b 1/2b,3b,7L. monocytogenes 1614 Germany 1/2b 1/2. b 1/2b,3b,7L. monocytogenes 1619 Germany 1/2b 1/2. a 1/2b,3b,7L. monocytogenes 1621 Germany 1/2b 1/2. b 1/2b,3b,7

Appendix IV External Validation set for L. monocytogenes serovar
81
Results of FTIR
analysis Strains WSLC other
number Origin Serovar O-
Antig H-
Antig
Results ofMultiplex
PCR
L. monocytogenes 1629 Germany 1/2b 1/2. b 1/2b,3b,7L. monocytogenes 1661 animal feces 1/2b 1/2. b 1/2b,3b,7L. monocytogenes 1703 Germany 1/2b 1/2. b 1/2b,3b,7L. monocytogenes 1763 France 1/2b 1/2. a 1/2b,3b,7L. monocytogenes 1766 SLCC 7151 animal, Germany (a) 1/2b 1/2. b 1/2b,3b,7L. monocytogenes 11010 cheese, France (b) 1/2b 1/2. b 1/2b,3b,7L. monocytogenes 11017 cheese, France (b) 1/2b 1/2. b 1/2b,3b,7L. monocytogenes 11018 cheese, France (b) 1/2b 1/2. b 1/2b,3b,7L. monocytogenes 11019 feed, France (b) 1/2b 1/2. b 1/2b,3b,7L. monocytogenes 11039 cheese, France (b) 1/2b 1/2. b 1/2b,3b,7L. monocytogenes Gly 3043 floor, Germany 1/2b 1/2. b 1/2b,3b,7L. monocytogenes Gly 3071 soft cheese, Germany 1/2b 1/2. b 1/2b,3b,7L. monocytogenes Gly 3072 soft cheese, Germany 1/2b 1/2. b 1/2b,3b,7L. monocytogenes Gly 3074 smearing, Germany 1/2b 1/2. b 1/2b,3b,7L. monocytogenes Gly 3075 Germany 1/2b 1/2. b 1/2b,3b,7L. monocytogenes Gly 3092 smearing, Germany 1/2b 1/2. b 1/2b,3b,7L. monocytogenes 11005 milk, France (b) 1/2b 1/2. b 1/2b,3b,7L. monocytogenes 1017 SLCC 5778 (a) 1/2c 1/2. c 1/2c,3c L. monocytogenes 1076 SLCC 8812 (a) 1/2c 1/2. c 1/2c,3c L. monocytogenes 1077 SLCC 8813 (a) 1/2c 1/2. c 1/2c,3c L. monocytogenes 1091 SLCC 8848 (a) 1/2c 1/2. c 1/2c,3c L. monocytogenes 1285 chicken 1/2c 1/2. c 1/2c,3c L. monocytogenes 1430 chicken, Germany 1/2c 1/2. c 1/2c,3c L. monocytogenes 1489 cheese, Austria 1/2c 1/2. c 1/2c,3c L. monocytogenes 1497 cheese, Austria 1/2c 1/2. a 1/2c,3c L. monocytogenes 1498 cheese, Austria 1/2c 1/2. c 1/2c,3c L. monocytogenes 1609 Germany 1/2c 1/2. c 1/2c,3c L. monocytogenes 1625 Germany 1/2c 1/2. c 1/2c,3c L. monocytogenes 11152 smoked salmon 1/2c 1/2. c 1/2a,3a L. monocytogenes 1459 Germany 3a 3 a 1/2a,3a L. monocytogenes 1461 Germany 3a 3 a 1/2a,3a L. monocytogenes 11149 smoked salmon 3a 3 a 1/2a,3a L. monocytogenes 1455 Germany 3b 3 b 1/2b,3b,7L. monocytogenes 1464 Germany 3b 3 b 1/2b,3b,7L. monocytogenes 1704 Germany 3b 3 b 1/2b,3b,7L. monocytogenes 2397 Germany 3b 3 b 1/2b,3b,7L. monocytogenes Gly 3077 gully, Germany 3b 3 b 1/2b,3b,7L. monocytogenes 1443 Germany 3c 3 b 1/2c,3c L. monocytogenes 11085 SLCC 1693 (a) 3c 3 c 1/2a,3a L. monocytogenes 11087 SLCC 5070 (a) 4a 4 a no resultL. monocytogenes 1016 SLCC 5637 (a) 4b 4 b 4b,d,e L. monocytogenes 1063 SLCC 8793 (a) 4b 4 b 4b,d,e L. monocytogenes 1064 SLCC 8795 (a) 4b 4 b 4b,d,e L. monocytogenes 1067 SLCC 8802 (a) 4b 4 b 4b,d,e L. monocytogenes 1071 SLCC 8792 (a) 4b 4 b 4b,d,e L. monocytogenes 1226 unknown 4b 4 b 4b,d,e L. monocytogenes 1283 Germany 4b 4 b 4b,d,e L. monocytogenes 1284 Germany 4b 4 b 4b,d,e
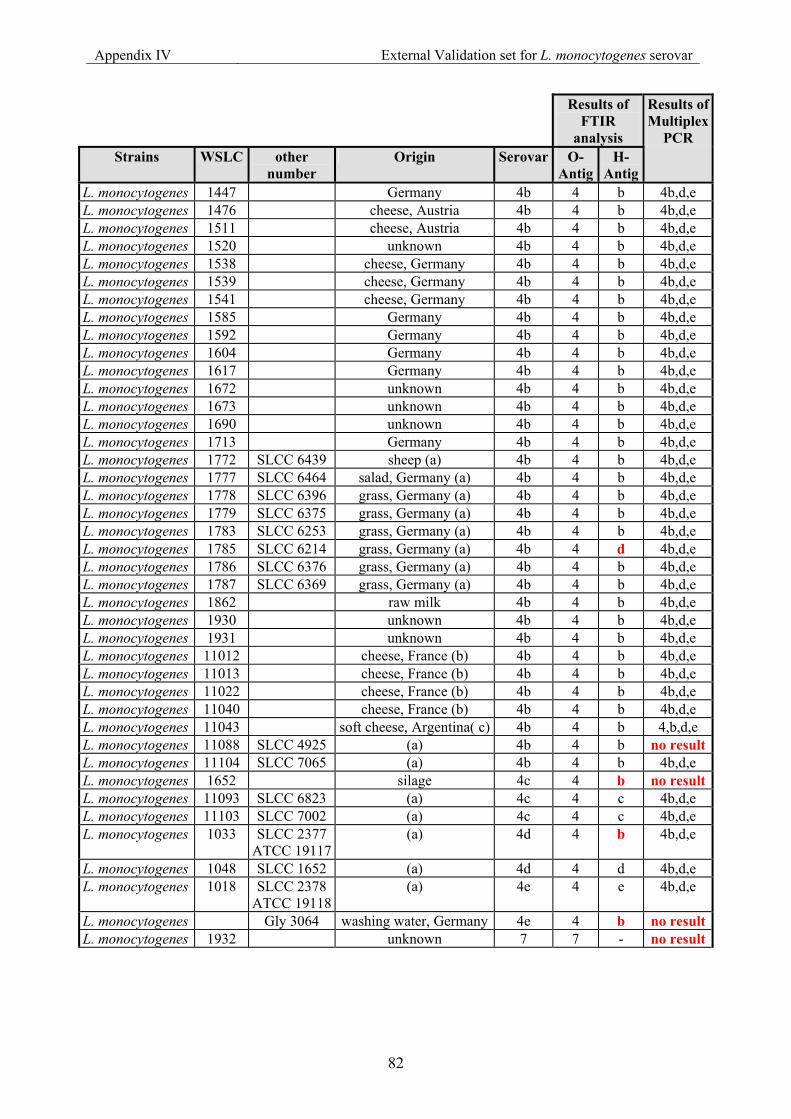
Appendix IV External Validation set for L. monocytogenes serovar
82
Results of FTIR
analysis Strains WSLC other
number Origin Serovar O-
Antig H-
Antig
Results ofMultiplex
PCR
L. monocytogenes 1447 Germany 4b 4 b 4b,d,e L. monocytogenes 1476 cheese, Austria 4b 4 b 4b,d,e L. monocytogenes 1511 cheese, Austria 4b 4 b 4b,d,e L. monocytogenes 1520 unknown 4b 4 b 4b,d,e L. monocytogenes 1538 cheese, Germany 4b 4 b 4b,d,e L. monocytogenes 1539 cheese, Germany 4b 4 b 4b,d,e L. monocytogenes 1541 cheese, Germany 4b 4 b 4b,d,e L. monocytogenes 1585 Germany 4b 4 b 4b,d,e L. monocytogenes 1592 Germany 4b 4 b 4b,d,e L. monocytogenes 1604 Germany 4b 4 b 4b,d,e L. monocytogenes 1617 Germany 4b 4 b 4b,d,e L. monocytogenes 1672 unknown 4b 4 b 4b,d,e L. monocytogenes 1673 unknown 4b 4 b 4b,d,e L. monocytogenes 1690 unknown 4b 4 b 4b,d,e L. monocytogenes 1713 Germany 4b 4 b 4b,d,e L. monocytogenes 1772 SLCC 6439 sheep (a) 4b 4 b 4b,d,e L. monocytogenes 1777 SLCC 6464 salad, Germany (a) 4b 4 b 4b,d,e L. monocytogenes 1778 SLCC 6396 grass, Germany (a) 4b 4 b 4b,d,e L. monocytogenes 1779 SLCC 6375 grass, Germany (a) 4b 4 b 4b,d,e L. monocytogenes 1783 SLCC 6253 grass, Germany (a) 4b 4 b 4b,d,e L. monocytogenes 1785 SLCC 6214 grass, Germany (a) 4b 4 d 4b,d,e L. monocytogenes 1786 SLCC 6376 grass, Germany (a) 4b 4 b 4b,d,e L. monocytogenes 1787 SLCC 6369 grass, Germany (a) 4b 4 b 4b,d,e L. monocytogenes 1862 raw milk 4b 4 b 4b,d,e L. monocytogenes 1930 unknown 4b 4 b 4b,d,e L. monocytogenes 1931 unknown 4b 4 b 4b,d,e L. monocytogenes 11012 cheese, France (b) 4b 4 b 4b,d,e L. monocytogenes 11013 cheese, France (b) 4b 4 b 4b,d,e L. monocytogenes 11022 cheese, France (b) 4b 4 b 4b,d,e L. monocytogenes 11040 cheese, France (b) 4b 4 b 4b,d,e L. monocytogenes 11043 soft cheese, Argentina( c) 4b 4 b 4,b,d,e L. monocytogenes 11088 SLCC 4925 (a) 4b 4 b no resultL. monocytogenes 11104 SLCC 7065 (a) 4b 4 b 4b,d,e L. monocytogenes 1652 silage 4c 4 b no resultL. monocytogenes 11093 SLCC 6823 (a) 4c 4 c 4b,d,e L. monocytogenes 11103 SLCC 7002 (a) 4c 4 c 4b,d,e L. monocytogenes 1033 SLCC 2377
ATCC 19117(a) 4d 4 b 4b,d,e
L. monocytogenes 1048 SLCC 1652 (a) 4d 4 d 4b,d,e L. monocytogenes 1018 SLCC 2378
ATCC 19118(a) 4e 4 e 4b,d,e
L. monocytogenes Gly 3064 washing water, Germany 4e 4 b no resultL. monocytogenes 1932 unknown 7 7 - no result

Curriculum Vitae Cecilia A. Rebuffo-Scheer
Personal details
Date of Birth: December 10th, 1968 Civil status: Married Nationality: Argentine E-Mail: [email protected] Languages: English and German: good, Spanish: mother tongue
Education
Ph.D. in Microbiology Institute of Microbiology, Prof. Dr. S. Scherer, ZIEL Weihenstephan, Technical University of Munich, Freising, Germany.
March 2003 – Sept. 2007
Diploma Thesis in Microbiology Department of Biophysics, Prof. Dr. D. Naumann, Robert Koch Institute, Berlin, Germany
Nov. 2001 - Feb. 2003
Lic. Biochemistry National University of La Plata (UNLP), Buenos Aires, Argentine
Oct. 1998 – April 2001
Lic. Chemistry National University of La Plata (UNLP), Buenos Aires, Argentine
April 1988 – Sept. 1998
Work experience
Co-Head of Medical trial for Schering AG. Multicenter study in an open-label trial to investigate the efficacy of an experimental drug on patients
Clinical laboratory, La Plata, Buenos Aires, Argentine
May 2001 - Nov. 2001
Trainee in department of analytical chemistry and microbiology
Clinical laboratory, La Plata, Buenos Aires, Argentine
March 1999 - March 2001 (part time)
Trainee in laboratory of bacterial vaccines. Characterization of extracellular metabolites during the growing of Bordetella pertussis as biofilm by chemical analysis and FT-IR spectroscopy
National Institute of Biotechnology (CINDEFI), La Plata, Buenos Aires, Argentine
May 2001 - Oct. 2001 (part time)
Intern in food centre. Study of the cryoscopic effect of calcium in the stability of yoghurt
Centre of food conservation (CIDCA) and Institute of physical chemistry (INIFTA), La Plata, Argentina
Feb.1995 – Dec. 1996 (part time)
