development of a short-range travel demand management
TRANSCRIPT

30 TRANSPORTATION RESEARCH RECORD 1280
Development of a Short-Range Travel Demand Management Program: The l-35W Experience
KATHERINE F. TURNBULL, RICHARD H. PRATT, J. RICHARD KuzMYAK,
AND ERIC SCHREFFLER
Travel demand management (TDM) i a technique being used in many me!ropoliran arna'\ 1n :irtrlre s growing lraffic congestion problem . TOM strategies provide for better management of the transportation y tem with empha i on maximizing th number of people carried, rather than vehicular volumes. TDM covers a variety of actions that better managt.: the demand on transportation facilities by acting to shift more commuter into transit and multioccupant vehicles and into less congested travel times. One approach to the development of a TOM pr gram was used in the J-35W corridor in Minneapolis, Minnesota . The process provided a vig rous examination of the effectivcne of xi ting TDM rnea·ures trawl markets, the evo luotion of additional TDM trategies and the d velopmelll of a short-term TDM pr gram. '.fh ba i for the examination of the effectiveness of potential TDM strategies wa the development· and application of a microcomputer spreadsheet model. The process , which was conducted in a r latively short time period with a modest budget, may prove beneficial to other areas facing the same types of problems.
Traffic congestion in growing metropolitan areas is a problem receiving increasing attention. Concerns about urban mobility rate high in surveys around the country and have been the focus of numerous recent news articles and reports. Complicating the situation, most metropolitan areas are facing congestion issues in a time of limited resources, both in terms of funding for highway expansion and of land for new construction.
One approach being taken to address these issues is better management of the transportation system, with emphasis on maximizing the number of people carried, rather than vehicular volume. Travel demand management (TOM) is a technique being actively pursued in many parts of the country. TDM covers a variety of actions that better manage the demand on transportation facilities by acting to shift more commuters into transit and multioccupant vehicles and into less congested periods. TDM actions focus on imlucements to ridesharing, transit use, and peak-period spreading, combined with deterrents to single-occupant automobile use.
TDM plans often need to be developed under relatively short time frames and with limited resources. Problems endemic to this approach include an unclear definition of the problem,
K. F. Turnbull , Texas A&M Univcr ity, ollcgc Stal ion, Tex. 77843. R. 1-1. Prntt , Richard H. Prntt, on ul tant. Inc .. 11112 Rokcby Ave .. P . . Box 158, Garrell Pnrk, Md. 20 96. 1. R. Kuzmyak, om is
orp .. 8737 olesvillc .Kd .. Ste. 1100, Silve r Spring. MI. 209 10. E. chremcr, msi orp .. 2.309 Pacific ()a ·t Highway, Ste. 108,
Hcrmosn Beach. 'ali f. 902.54.
addressing potential solutions in a hit-or-miss fashion, and an oveily a111uiliuus program that tries to address all possible approaches. These problems can result in a plan that is not focused and spreads resources too thin by trying to do too much; such a plan may build unrealistic expectations and ultimately lead to the failure of the program.
One logical approach to the development of a TDM program was used in the I-35W corridor in Minneapolis, Minnesota. The process was conducted in a relatively short time period, with a modest budget. However, the process prnvicl~cl for a rigorous examination of the effectiveness of existing TDM measures, travel markets, the potential effect of additional TDM strategies, and the development of short- and long-term TDM programs for the major travel markets in the corridor. The basis for the examination of the effectiveness of potential TDM strategies was the development and application of a microcomputer spreadsheet model. This model provided a low-cost tool, easily understood and used, for examining the effect of alternative TDM scenarios.
The approach used in the development of the I-35W TDM program, especially the microcomputer spreadsheet model, may prove beneficial to other cities facing the same types of problems . The relative ease of application and the more focused approach this process provides, while being relatively quick and inexpensive, should recommend the use of the process in other situations.
I-35W CORRIDOR
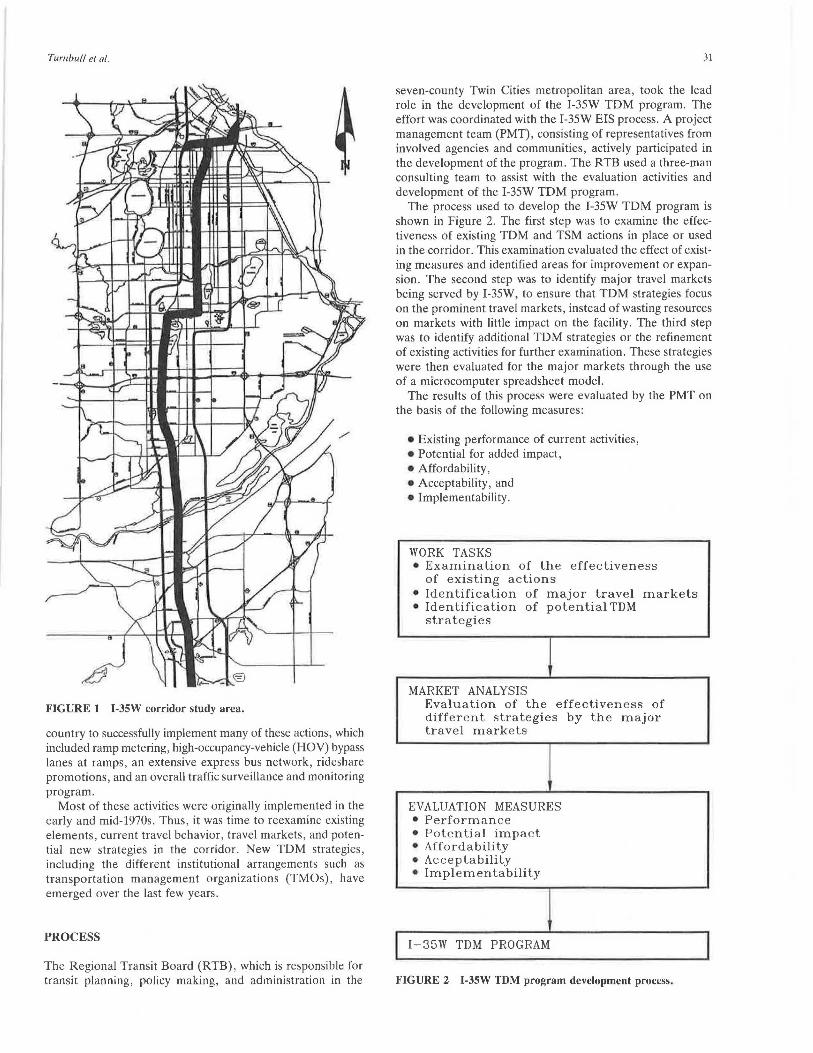
I-35W is an important element of the Twin Cities metropolitan freeway system. The 11-mi segment leading southward from downtown Minneapolis through the cities of Richfield , Bloomington, and Burnsville carries approximately 170,000 vehicles per day . This segment, which is shown in Figure 1, has been identified for improvement by the Minnesota Department of Transportation (MN/DOT) and the Metropolitan Council because of high congestion and accident levels. The initial scoping decision-making process was complete in 1988, and work on the environmental impact statement (EIS) is underway.
One of the issues that emerged during the scoping process was the need to more closely examine the use of TDM activities in the corridor . A variety of transportation system management (TSM) elements, including strategies classified as TDM actions, has been in use in the corridor since the early 1970s. I-35W was one of the first highway corridors in the
Turnbull et al.
FIGURE 1 I-35W corridor study area.
country to successfully implement many of these actions, which included ramp metering, high-occupancy-vehicle (HOV) bypass lanes at ramps, an extensive express bus network, rideshare promotions, and an overall traffic surveillance and monitoring program.
Most of these activities were originally implemented in the early and mid-1970s. Thus , it was time to reexamine existing elements , current travel behavior, travel markets, and potential new strategies in the corridor. New TDM strategies, including the different institutional arrangements such as transportation management organizations (TMOs), have emerged over the last few years .
PROCESS
The Regional Transit Board (RTB) , which is responsible for transit planning, policy making, and administration in the
31
seven-county Twin Cities metropolitan area, took the lead role in the development of the I-35W TDM program. The effort was coordinated with the I-35W EIS process. A project management team (PMT), consisting of representatives from involved agencies and communities, actively participated in the development of the program. The RTB used a three-man consulting team to assist with the evaluation activities and development of the I-35W TDM program.
The process used to develop the I-35W TDM program is shown in Figure 2. The first step was to examine the effectiveness of existing TDM and TSM actions in place or used in the corridor. This examination evaluated the effect of existing measures and identified areas for improvement or expansion. The second step was to identify major travel markets being served by I-35W, to ensure that TDM strategies focus on the prominent travel markets, instead of wasting resources on markets with little impact on the facility. The third step was to identify additional TDM strategies or the refinement of existing activities for further examination . These strategies were then evaluated for the major markets through the use of a microcomputer spreadsheet model.
The results of this process were evaluated by the PMT on the basis of the following measures:
• Existing performance of current activities, •Potential for added impact, • Affordability, • Acceptability, and • Implementability.
WORK TASKS • Examination of the effectiveness
of existing actions • Identification of major travel markets • Identification of potential TDM
strategies
MARKET ANALYSIS Evaluation of the effectiveness of different strategies by the major travel markets
EVALUATION MEASURES • Performance • Potential impact • Affordability • Acceptability • Implementability
I-35W TDM PROGRAM
FIGURE 2 l-35W TDM program development process.

32
The advantages and disadvantages of each strategy were identified and discussed by the PMT, as were potential barriers and problems. The result of this effort was the development of a short-term action plan for the I-35W corridor and the identification of longer-term strategies. The shortterm program focused on overall strategies applicable on a corridor-wide basis and those specifically tailored to the three major markets.
INVENTORY OF EXISTING TDM ACTIVITIES
The first step in the process was an inventory and review of the TDM and traffic management elements that had been in use in the corridor since the early 1970s. Most of these activities were implemented as part of the I-35W Urban Corridor Demonstration Pr ject and the Bu ·- n-Metered r'reeway System (J). The project', which was funded primarily througll a federal demonstration program , included the implementation of a traffic management system and express bus network, along with supporting components.
Three different categories of existing TDM and traffic management activities were reviewed. These categories-I-35W traffic management, transit, and ridesharing-included the following activities:
1. I-35W traffic management • Traffic management center, • Ramp metering, • HOV bypass ramps, •Highway Helper program, •Voluntary truck restrictions, and • Other activities.
2. Transit •Express service on I-35W, •Local service in the corridor, • Park-and-ride lots, •Supporting downtown elements (contraflow bus lanes,
Nicollet Mall, and downtown dime zone), and • Employer pass subsidies.
3. Ridesharing • Areawide marketing, • Corridor-specific matching and outreach programs, • Corridor vanpool programs, • Downtown vanpool staging areas, and • Downtown parking management strategies (preferen
tial parking and free parking for carpoolers and vanpoolers).
The information on each of these activities was examined. Sources of information included transit ridership and bus mileage levels, park-and-ride lot use, traffic volumes and cordon counts, ramp volumes, safety and accident levels, and other data. As is often the case in a review over an 18-year period, some data were either not kept or were not available. The best available information was used for each type of activity.
In general, the existing TDM and traffic management elements had been relatively successful at maintaining the efficiency of I-35W during a time of increasing travel demand. However, most of the improvements and their resulting effects were accomplished during the 1970s. Since the early 1980s,
TRANSPORTATION RESEARCH RECORD 1280
few additional improvements have been made. In some instances, the level of activity has declined. The analysis of one element, the express bus system, provides an example of the type of analysis conducted in this step.
Between 1971 and 1974, the Metropolitan Transit Commission (MTC) implemented 12 I-35W express routes as part of the Bus-on-Metered Freeway demonstration. Three additional T-35W flyer routes, as the express service is called, were added in the late 1970s. The I-35W flyer routes provide peak-period express service from suburban communities to downtown Minneapolis. The service is oriented toward park-and-ride lots, with some neighborhood stops.
Historical mileage, ridership, and level of service information from the MTC was examined for these routes. The mileage and ridership information is shown in Figures 3 and 4. In 1989, approximately 7 ,335 mi of service per day were provided by these express routes. This number represents a decline in service from a high of approximately 7 ,900 mi in 1980. Daily ridership in 1989 was approximately 9,500 passengers. This number represents a decline in ridership from a high of 11,700 passengers in 1980.
This analysis indicates the significant impact that the express transit service has on the I-35W corridor. The service, which represents the best express route network provided in any corridor in the Twin Cities, keeps a significant number of automobiles off I-35W. Without the transit service, the additional automobiles on the system would further congest the facility, creating the need for additional capacity.
However, the analysis also indicates that the express bus service , as reflected both by passenger volumes and by miles of service, has declined. Service miles and passenger levels both peaked in 1980 and have declined during most of the 1980s, until a recent leveling off and slight increase in 1988. The potential has existed for increasing both service and ridership levels on the I-35W express bus service. Service improvements have been identified as a potential strategy to be considered and evaluated with the microcomputer spreadsheet model.
MARKET ANALYSIS
A market analysis identified the origins and destinations of travelers using portions or all ofl-35W. This analysis indicated the location and general size of the different markets, so that specific strategies could be bdter tailored to each. This step was important, because each market had different characteristics and thus needed different strategies and implementation approaches.
Estimated daily home-based work (HBW) trips for the years 1980 and 2010 were examined in this step, using regional forecasts obtained from the Metropolitan Council of the Twin Cities. The select link assignment technique was used by the Metropolitan Council to identify home origins and workplace destinations for I-35W commuter traffic at five critical locations. Inbound and outbound traffic were examined separately. The resulting data were mapped and analyzed. Estimated mode splits for the markets identified were also obtained from the regional forecast, providing base-case shares of transit use, group-ride automobile use, and single-occupant automobile use.

(fJ (1) -~ ~
..-4 ·a; A
8000
7000
1976 1977 1978 1979 1980 1983 1984 1985 1986 1987 1988
Year
FIGURE 3 Daily express miles on I-35W.
1976 1977 1978 1979 1980 1983 1984 1985 1986 1987 1900
Year FIGURE 4 Daily express passengers on I-35W.
34 TRANSPORTATION RESEARCH RECORD 1280
TABLE 1 RELATIVE CONTRIBUTION OF DESTINATION MARKETS TO DAILY HOME-BASED WORK PERSON-TRIPS ON I-35W
Destinatjon
Minneapolis CBD CBD Fringe-South University of Minnesota Minneapolis South 1-494 West 1-494 East Bloomington Burnsville Eden Prairie CBD Fringe-Northwest CBD Fringe-Northeast All Others
Total
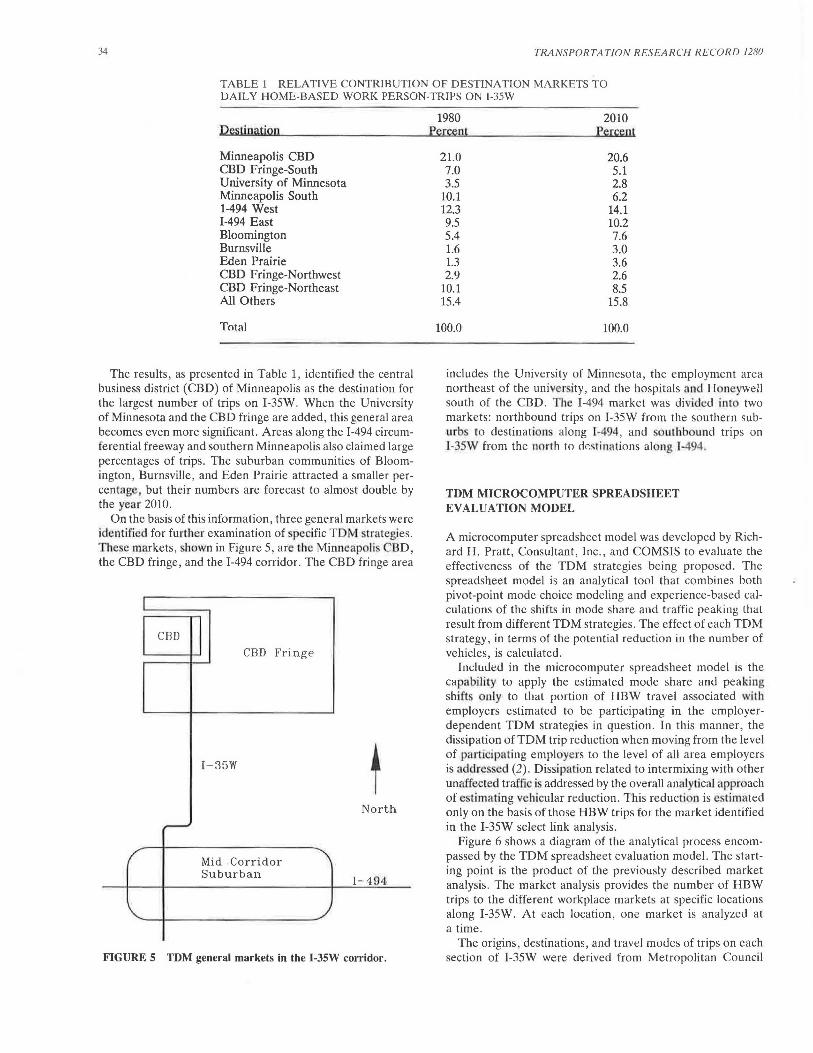
The results, as presented in Table 1, identified the central business district (CBD) of Minneapolis as the destination for the largest number of trips on I-35W. When the University of Minnesota and the CBD fringe are added, this general area becomes even more significant. Areas along the I-494 circumferential freeway and southern Minneapolis also claimed large percentages of trips. The suburban communities of Bloomington, Burnsville, and Eden Prairie attracted a smaller percentage, but their numbers are forecast to almost double by the year 2010.
On the basis of this information, three general markets were identified for further examination of specific TOM strategies. These markets, hown in Figure 5, are the Minneapolis BD, the CBD fringe, and the 1-494 corridor. The CBD fringe area
CED I CED Fringe
I-35W t North --
Mid Corridor Suburban
I-494
FIGURE 5 TDM general markets in the I-35W corridor.
1980 2010 Percent Percent
21.0 20.6 7.0 5.1 3.5 2.8
10.1 6.2 12.3 14.1 9.5 10.2 5.4 7.6 1.6 3.0 1.3 3.6 2.9 2.6
10.1 8.5 15.4 15.8
100.0 100.0
includes the University of Minnesota, the employment area northeast of the univ rsity, and the hospitals and H neywell south of the CBD . The 1-494 market was divided into two markets: northbound trips on I-35W from the southern suburb · co destinations along T-494, and southbound trips on l-35W from the north to cie~tin::1tions along f-494.
TDM MICROCOMPUTER SPREADSHEET EVALUATION MODEL
A microcomputer spreadsheet model was developed by Richard H. Pratt, Consultant, Inc., and COMSIS to evaluate the effectiveness of the TOM strategies being proposed. The spreadsheet model is an analytical tool that combines both pivot-point mode choice modeling and experience-based calculations of the shifts in mode share and traffic peaking lhal result from different TOM strategies. The effect of each TOM strategy, in terms of the potential reduction in the number of vehicles, is calculated.
Induued in the microcomputer spreadsheet model is the capability to apply the estimated mode share and peaking shift only to lhal portion of HBW travel associated with employers estimated to be participating in the employerdependent TDM strategies in question. In this manner, the dissipation ofTDM trip reduction when moving from the level of participating empl yers to the level of all area employers is addre ed (2). Dissipation related to intermixing with other unaffected traffic is addressed by the overall analytical approach of estimating vehicular reduction. This reducti n is estimated only on the basis of those HBW trips for the market identified in the I-35W select link analysis.
Figure 6 shows a diagram of the analytical process encompassed by the TDM spreadsheet evaluation model. The starting point is the product of the previously described market analysis. The market analysis provides the number of HBW trips to the different workplace markets at specific locations along I-35W. At each location, one market is analyzed at a time.
The origins, destinations, and travel modes of trips on each section of I-35W were derived from Metropolitan Council

Turnbull et al.
commitment by employers, developers, and others in the private sector.
The passive approach to ridesharing had a low impact. The more active approach had a higher impact, but not as high as some other strategies. Experience indicates that ridesharing strategies have more impact when the private sector has more active involvement and a stronger commitment. This involvement can occur through the actions of individual employers, but the strategy has been more effective when employers and developers act together through TMOs or some other organization.
Parking Management
Two approaches were examined in the modeling process: preferential parking and an additional parking fee . In the first approach, preferential parking would be provided for carpools and vanpools. Approaches to preferential treatment might include providing spaces close to the front door or inside, heated parking for rideshare vehicles. Two different parking fees, a $1.50 and a $3.50 charge, were examined in the modeling process for single-occupant automobiles. Actual implementation of such an approach could take many forms, including charging for parking now being provided free by employers, reducing rates for rideshare vehicles, or adding a surcharge to single-occupant vehicles.
Overall, the impact of preferential parking is low, whereas the use of an additional parking fee has a medium-to-high impact. Experience with the free downtown carpool parking program in Minneapolis indicates that people view reduced or free parking for carpoolers as a significant benefit.
Variable Work Hours
Increasing the use of variable work hours was examined. A 4 to 37 percent participation rate for office employers was modeled. This range, determined on the basis of previous national studies, added approximately 3 percent to the overall effectiveness of the different strategies. The traffic volume information examined indicated that although the hours on either side of the peak period are close to capacity, a limited capacity for additional vehicles is available.
Trame Management
In addition to these strategies, the expansion and enhancement of traffic management activities were examined. Many activities focus on safety and incident management and could not appropriately be included in an effectiveness evaluation. However, because they can have an important effect on the capacity of the facility, they were addressed in the program. A public information program on the use of ramp metering and proper merging, additional enforcement of HOV bypass ramps, and additional Highway Helper vehicles and expansion of their hours of coverage were among the strategies examined.
37
Evaluation
The potential TDM strategies were evaluated for each of the major markets. The evaluation included a description of the TDM activity , an examination of the cost, the agency or group responsible for implementation, the estimated impact of the strategy, and a discussion of the advantages and disadvantages .
The description provided a discussion of the approach and activities to be conducted. The estimated costs were provided using the low, medium, and high ranges identified previously. The agency, community, or organization most likely to be responsible for implementing the strategy was identified. In addition to existing groups, the potential for forming new organizations, such as TMOs, was raised. The impact of the strategy was determined from the microcomputer spreadsheet model and presented in the low, medium, or high range discussed earlier .
This information was presented to the PMT and discussed extensively over the course of two meetings . The PMT provided valuable insight into the advantages, disadvantages, potential barriers, and political acceptability of the different TDM strategies. The results of these discussions were summarized in the evaluation section.
SHORT-TERM PROGRAM
TDM actions that could be implemented on a short-term basis for the overall corridor and for specific markets were identified and developed into a short-term TDM program. This program focused primarily on strategies that could be implemented within existing agency budgets and did not require substantial lead time before initiation of the activity. Longerterm components of the TDM program were identified for later development into a long-term program. The focus and approach of the TDM strategies were different for the different markets, reflecting the unique characteristics of each. The general approach and the more specific TDM elements identified in the I-35W program for the different markets are summarized in the following paragraphs.
Overall TDM Actions
A series of overall TDM activities focusing on coordination, education, and information measures; promotion of existing services; and enhancement of existing traffic management techniques were recommended for the I-35W corridor as a whole. These activities included appointing a corridor manager to coordinate all aspects of the different activities going on in the corridor, establishing an interagency group to oversee implementation of the TDM program, establishing a public information program, promoting existing transit services, enforcing existing HOV bypass ramps, and expanding the Highway Helper program. The MN/DOT was identified as the lead agency for most of these activities .
Minneapolis CBD
The TDM program recommended for the Minneapolis CBD built on the existing measures and strength of the downtown

38
market, while expanding and enhancing institutional arrangements to ensure successful implementation and private sector participation. Approximately 45 percent of the downtown workers use transit and 25 percent commute by carpool or vanpool. A high level of transit services is provided in the corridor, focusing on the downtown market, and a variety of rideshare activities has been focused downtown.
Specific elements of the TDM program for the CBD market included improving transit services and expanding employerbased transit and rideshare promotions. A major focus of the recommendations was a more active and committed role for major employers and the private sector. The formation of a TMO was recommended to provide the strength and institutional support for the TDM activities.
CBD Fringe
The CBD fringe represented the most diverse of the markets examined. The approach recommended in the program focused on specific strategies for the University of Minnesota and the other large employers in the area . The existing level of transit services and other TDM activities at these locations varies, as does the potential for improvements. Specific recommendations for the CBD fringe market included improving the special express bus network and local service to the University, examining the potential fur selected transit improvements to other major employers , and promoting major employer-based rideshare and transit programs.
1-494 Corridor
The I-494 corridor has the lowest level of existing transit services and the lowest ridesharing activities. However, in terms of institutional arrangements, it provides one of the best for private sector involvement. In 1987, a TMO was formed for lhe I-494 corridor to examine and implement TDM strategies. In addition, five communities along the corridor have formed a Joint Powers Organization to address transportation and land use issues of mutual concern. These two organizations provide an excellent opportunity for a coordinated public and private approach to TDM activities.
The recommendations for the 1-494 corridor focused on these two organizations. Specific strategies included improving reverse commute, crosstown and loc<il circulation transit services, and employer-based transit and rideshare activities .
CONCLUSION
The methodology used in the development of the I-35W TDM program represents one approach to developing a TDM plan
TRANSPORTATION RESEARCH RECORD 1280
for a major urban transportation corridor. The process provides for a rigorous examination of the effectiveness of potential TDM strategies, the identification of the major travel markets, and the identification of the most effective strategies for each market. The microcomputer spreadsheet model developed as part of the process is an excellent tool for examining the impact of possible TDM strategies. The approach provides a relatively quick and low-cost process .
The methodology and the microcomputer spreadsheet model should be considered by other areas facing the same types of issues. The relative ease of application and the focused approach they provide may recommend them for use in other situations. TDM activities will continue to be a major focus in many metropolitan areas as one approach to dealing with increasing traffic congestion problems. TDM is not the answer to congestion problems. Rather , TDM strategies provide an additional set of tools fur addressing traffic congestion. The approach to developing a TDM program outlinP.rl hf.re m<iy help other cities facing these problems.
ACKNOWLEDGMENTS
The work described in this paper was undertaken by the RTB. Katherine F. Turnbull was the planning manager at the RTB at the time of the development of the I-35W TDM program and was responsible for its development. Cmdy Fish and David Jacobson, RTB planners, were responsible for many of the data collection activities. Assistance was also provided by the Metropolitan Council and a team of consultants: Richard H. Pratt, Richard H. Pratt, Consultant, Inc.; Richard Kuzmyak, Comsis, Inc.; and Eric Schreffler, Harold Katz and Associates.
The framework for the TDM microcomputer spreadsheet evaluation model was designed by Richard H. Pratt, who also furnished the experience-based parameters. The pivot point mode choice formulation and coefficient were provided by Gordon Schultz of Comsis, and Mark Raskin of Comsis implemented the spreadsheet model.
REFERENCES
1. Metropolitan Council of the Twin Cities. J-35W Urban Corridor Demonsrralion Pn.>jec:I. Final Rq.>url. UMTA, U.S. Department of Tran portntion, 1975.
2. Richard H. Prati. Planning Solutions-TOM mid Bey nd. In Tra11sportatio11 Rl·Seflrc/1 Cirailtir 359: Traffi.: Cungt' tiu11 11111/ Sub· 11rb1111 Acrivity Centtr . . TRB. Na ti nul Resea rch o uncil. wa~hington, 0 . ·., 1990, pp. 56- 75.
Publication of this paper sponsored by Commitree on Transportation System Management.

Turnbull et al. 35
PEAK HOUR PERSON
TRIPS
NUMBER OF PEAK HOUR VE.HICLES WITHOUT TDM
MODE SHARES
from regional forecast
(Market Analysis)
RIDESHARE PROGRAM
EMPLOYEE DISTRIBUTION
AMONG EMPLOYER CATEGORIES
PARTICIPATION RATES
specification of program to be tested
EMPLOYER BASED STRATEGIES
PARTICIPATION RATES
specillcation of program to be tested
TRANSIT AND HOV ACTIONS INDEPENDENT OF EMPLOYERS
specl!lcatlon or program to be tested
VARIABLE WORK HOURS PROGRAM
PARTICIPATION RATES
specification or program to be tested
PERSON TRIPS WITH MODE SHARES
ALLOCATED BY EMPLOYER CATEGORtES
EXPERIENCE BASED RIDESHARE PROGRAM
IMPACT ESTIMATION MODULE
MODE CHOICE MODEL BASED TIME AND COST CHANGE
IMPACT ESTIMATION MODULE
MODE CHOICE MODEL BASED TIME AND COST CHANGE
IMPACT ESTIMATION MODULE
REVISED NUMBER OF VEHICLES
EXPERIENCE BASED VARIABLE WORK HOURS
IMPACT ESTIMATION MODULE
D E c R E A s E
I N
N u M B E R
0 F
v E H I c L E s
NUMBER OF PEAK HOUR VEHICLES WITH TDM
FIGURE 6 TDM spreadsheet evaluation model.
forecasts . The 2010 forecast was used, because its traffic estimates were closer to existing conditions than those of the 1980 traffic simulation .
The HBW trips were factored to represent a.m. peak-hour travel. The term "person-trips" is used in Figure 6, indicating that drive-alone trips, group-ride trips, and bus trips are all included. An initial step uses the trip data and mode share data to compute the base number of peak-hour vehicles without new TDM strategies.
The other initial step allocates the person-trips to different employer categories. Sixteen categories were used, identified as new development or present development, office or nonoffice, and four categories of employer size. This breakdown was made because employers in different categories exhibit different degrees of TDM participation and different em-
ployee response rates and may be affected differently by any regulations or ordinances that are applied.
The person-trip data were then successively modified by estimating the effect on mode shares of rideshare programs, employer-based strategies, and transit and HOV actions independent of employers. All programs, except the rideshare and variable work hour programs, have to be specified in terms of the time and cost savings offered or penalties imposed .
Employer participation rates are crucial to the analysis of rideshare programs and other employer-based strategies, but they are not relevant in the case of transit service improvements, HOV facilities, or actions independent of employers. The employer participation rates can be voluntary rates based on experience, or can be set to 100 percent for specific employer categories to represent mandatory participation.

36
The modified mode shares are applied to the person-trip data to produce a revised number of vehicles, which is then adjusted to reflect the effect of variable work hour programs on the proportion in Lbe peak hour. The result is an e ·ti mate of the number of peak-hour vehicles that would remain when the TDM action or actions being analyzed are in force. That number is then compared with the base number to calculate the estimated decrease in peak-hour vehicle trips in the commuter market being analyzed.
The TDM spreadsheet model was used to evaluate the potentia l effects of each of the general TDM strategies under consideration for each of the [-35W commuter markets. In addition to examining the results for each TDM trategy, combinations of ·1rategie · were examined and evaluated.
Although the evaluation model provided results in terms of the estimated decrease in the number of peak-hour vehicle trips, a range wa. used when lht: inforrnati n was presented to the PMT and others. Thi. range provided a e~nP. rii l in Iication of the magnitude of the TOM strategy and prevented focusing on one pecific numb r. The effects of the strategies were presented in the following groupings:
• Low impact: 0- to 20-vehicle peak-period reducti n •Medium impact: 21- to 100-vehicle peak-period reducti n, • 1-Iigb impact: 101- to 00-vehicle peak-period reduction ,
and • Very high impact: Over 300-vehicle peak-period reduction.
A general cost estimate was provided for each strategy using th foll ving categories:
• Low: under $500,000 annual cost, • Medium: $500,000 to $1 million annual cost, and • High: over $1 million annual cost.
In addition, three levels of impad were examined on the basis of participation rate and level of in olvemeot by employers . T he major differences between the categorie. relate to the level of private sector participation and whether participalion is voluntary or required through community ordinances or other legi lative acti n. The voluntary level assume that the private;: st:dor i ·participating our of civic upport or because the benefit arc viewed as imp rtanl. The ec nd 'level a umes some requirements placed on the private sector, ;incl the third level assumes a stronger set of requirements. Details on the different levels are as follows:
1. Voluntary • Ridesharing: 4 to 37 percent participation rate, • Transit subsidies: 1 to 7 percent participation rate, and •Variable hours for office only: 4 to 37 percent
participation rate. 2. Partial mandatory: same as voluntary except
• Parking management and pricing strategies: 15 percent participation rate, and
• Ridesharing requirements for new development: 76 to lUU percent participation rate.
TRANSPORTA TJON RESEARCH RECORD 1280
3. Fuller mandatory: same as voluntary except • Ridesharing requirements for old development: 4 to
100 percent participation rate, and • Parking management and pricing strategies for old
development: 30 percent participation rate.
The ranges identified relate to the size of businesses. Where ranges were used, the lower percentage pertains to firms of under 50 employees, whereas the higher percentage pertains to firms of 50 employees or more.
IDENTIFICATION AND EV ALVA TION OF TDM STRATEGIES
On the basis of this examination of existing TDM activities, experience with the use of TDM trategies. in other parts of the Twin Cities, and a revi w of relevant national TDM examples, a set of TDM strategics was idenlifit:u fur t:valuation. The ·e strategies included new TDM activities, not previously u. ed in the Twin Cities or in the I-35W corridor, and the fine tuning or changing of existing TDM elements. The TDM strategie fell into five general categorie · : transit, ridesharing, parking management, variable work hours, and traffic management. The approach used with each of these elements in the modeling process is described briefly along with their effects identified from the model. This description i fo llowed by a more detailed discus ion of the evaluation process.
Transit
Potential transit service improvements were identified in a general way for the overall corridor and for each of the major market . Th types f transit ervic · uggested a viable options included improvement to existing ervicei> and a variety of new ser ices. Two level of transit improvement.· were examined in the modeling proces.: a 15 percent improvement and a 30 percent improvement. The 15 percent tran it impr vement as urned a 1- to 2-min decrea e in the usual walk-andwail time of a trip. Potential ervice improvements included additional trips on existing expre routes and improved fre· quency on local services. The 30 percent tran it improvement a urned a 2- to 4-min decrea e in th u ·ual walk-and-wait time of a trip. Potential service improvements included additional trips on e.xpre sand local services , new express service, and new park-and-riut: facilities. In addition, the effects of 25- and 50-cent employer subsidies were evaluated.
In general, transit improvem nts had a greater impact a a TDM strategy than many of tbe other elements. The impact varied by market reflecting both the currt:nl level of ervice and the viability of potential improvements.
Ridesharing
The ridesharing strategies examined built on the existing program, which focuses on ride matching overall marketing, and corridor-specific promotions. Two approaches were evaluated: a pa sive program and an active program. The major difference between the two wa the role of th private ector. The active program reflected a high le el of inv<>lvem nt and