development of a system for cooling inlet air for gas
TRANSCRIPT

DEVELOPMENT OF A SYSTEM FOR COOLING INLET AIR FOR GAS
TURBINE USING CIDLLED WATER
By
MOHD SAIFUL IZW AN BIN RAZALI
9688
Dissertation submitted in partial fulfillment of the requirements for the
Bachelor of Engineering (Hons)
(Mechanical Engineering)
Universiti Teknologi PETRONAS
Bandar Seri Iskandar
31750 Tronoh
Perak Darul Ridzuan
MAY 201 I
CERTIFICATION OF APPROVAL
DEVELOPMENT OF A SYSTEM FOR COOLING INLET AIR FOR GAS
TURBINE USING CIDLLED WATER
Approved by,
by
Mohd Saiful Izwan bin Razali
A project dissertation submitted to the
Mechanical Engineering Programme
Universiti Teknologi PETRONAS
In partial fulfillment of the requirement for the
BACHELOR OF ENGINEERING (Hons)
(MECHANICAL ENGINEERING)
(Dr Zainal Ambri b. Abdul Karim)
UNIVERSITI TEKNOLOGI PETRONAS
TRONOH, PERAK
MAY2011

CERTIFICATION OF ORIGINALITY
This is to certify that I am responsible for the work submitted in this project, that the
original work is my own except as specified in the references and acknowledgements,
and that the original work contained herein have not been undertaken or done by
unspecified sources or persons.
MOHD SAIFUL IZW AN BIN RAZALI
Mechanical Engineering Department,
Universiti Teknologi PETRONAS.
ii

ACKNOWLEDGEMENT
I would like to take this opportunity to express my utmost gratitude to the individuals
who have taken the time and effort to assist me in completing this project. Without the
cooperation of these individuals, I would undoubtedly have faced complications
throughout the course.
My big gratitude goes to my supervisor, Dr. Zainal Ambri b. Abdul Karim for his
invaluable support, encouragement, supervision and useful suggestions throughout this
research work. His moral support and continuous guidance enabled me to complete my
work successfully.
Not to forget, a special thanks to Dr. Vijay Raj Raghavan and Dr. Azuraien Jaafar for
the exposure of important technical aspect that I need to discover in order to finish this
project.
I would like to thanks to Mr. Rohaizad, Gas District Cooling (GDC) plant manager who
gave me so much important idea and guidance for the project. To parents and friends,
thank you for the moral supports. Last but not least, to all individuals who have helped
me in any way, but whose name is not mentioned here, I would like to thanks to all of
you.
iii

ABSTRACT
The strong influence of climate on gas turbine behavior is well known. The output of
gas turbine falls to a value that is less than the rated output under high temperature
conditions that often occur during the daylight. In Malaysia, during daylight ambient
temperature varies from 23°C to 38°C. This temperature is relatively high. Cooling of
the turbine air intake can increase output power substantially. This is because cooled air
is denser, giving the turbine higher mass flow rate and resulting in decreasing
compressor specific work and specific fuel consumption.
In order to maintain inlet air at constant low temperature, an air cooling system is
required to be developed at the air intake of gas turbine. A lot of researches have been
done proved that by cooling the air at inlet gas turbine will increase the efficiency of gas
turbine. The gas turbine engine at Gas District Cooling Plant (GOC) plant in Universiti
Teknologi PETRONAS (UTP) has an advantage due to availability of a chilled water
system that is produced by cogeneration plant. Heat from gas turbine exhaust is
recovered to produce chilled water by the steam absorption chiller (SAC). The chilled
water is then distributed to the academic building at a temperature of 6°C by pipeline
into the air handling unit (AHU) in every building at UTP for air conditioning purpose
and return back to GDC at a temperature of l3°C.
This study analyzed the power requirement by the cooling system, the material used,
sizing and feasibility of new cooling system. Mathematical equations have been
developed. The air cooling system consist of 83 units of copper tubes 19.05 mm outer
diameter and 77.26 m length for each tube. A 0.35 kW pumping power is required to
circulate 11.72 kgls mass flowrate of chilled water through the system to cool 19 kgls
mass flowrate of air from variable high temperature to 20°C.
iv

TABLE OF CONTENTS
CERTIFICATION OF APPROVAL
CERTIFICATION OF ORIGINALITY
ACKNOWLEDGEMENT
ABSTRACT
LIST OF FIGURES .
LIST OF TABLES/FIGURES
CHAPTER I:
INTRODUCTION
1.1 Background of Study .
1.2 Problem Statement
1.3 Objectives
1.4 Scope of Studies
CHAPTER2:
LITERATURE REVIEW
ii
iii
iv
vii
vii
1
2
3
3
2.1 The effect of low ambient temperature to the gas turbine performance. 5
2.2 The inlet air cooling system . 8
2.3 Chilled water cooling system 9
2.4 Absorption refrigeration system 9
CHAPTER3:
METHODOLOGY
3.1 Project Work flow
3.2 Modeling flow.
3.3 Project Tools .
3.4 Project Planning for FYP 1
3.5 Project planning for FYP 2
v
11
12
13
14
15

CHAPTER4:
MATHEMATICAL MODEL
4.1 Parameters 16
4.2 Assumptions 17
4.3 Current Steam Absorption System capacity 17
4.4 Principle of heat transfer between circulating chilled water and air 17
4.4.1 Mass flowrate of water in tubes 18
4.402 Energy extracted by air cooler 19
4.4.3 Material and overall heat transfer coefficient 0
4.4.4 Log mean temperature difference
4.4.5 Heat exchanger surface area o
4.4o6 Number of tubes in heat exchanger
4.4o7 Length of tubes
4.408 Type of flow in tubes 0
4.409 Pumping power
CHAPTERS:
RESULTS AND DISCUSSION
5.1 Basic design
5o2 Feasibility of system
5.3 Capacity of cooling system
5.3 Development of air cooling system
CHAPTER6:
CONCLUSION AND RECOMMENDATION
5 01 Conclusion and recommendation
REFERENCES
APPENDIX 0
vi
20
21
21
22
22
23
24
25
26
27
27
30
32
35

LIST OF FIGURES
Figure I: PV and TS diagram of a Brayton cycle mapped to actual
of a gas turbine engine
Figure 2: Average daily turbine thermal efficiency
Figure 3: Effect of inlet air temperature to the mechanical power
Figure 4: Generic inlet air cooling system
Figure 5: Flow of work
Figure 6: modeling flow work by Microsoft Excel
Figure 7: Gantt chart for FYP I
Figure 8: Gantt chart for FYP 2
Figure 9: System diagram
Figure I 0: distribution of chilled water mass flowrate
Figure II: inlet and outlet temperature
Figure 12: Basic design of cooling system
Figure 13: Energy versus ambient temperature
Figure 14: Energy capacity versus ambient temperature
Figure 15: Energy versus water mass flowrate
Figure 16: Graph pressure drop versus tube length
LIST OF TABLE
Table I: Parameters .
Table 2: Pressure drop versus tube length
Table 3: Design of air cooling system
vii
PAGE
I
6
7
8
11
12
14
15
18
19
21
25
26
27
28
29
PAGE
16
29
30
l.O INTRODUCTION
J .l Background of study
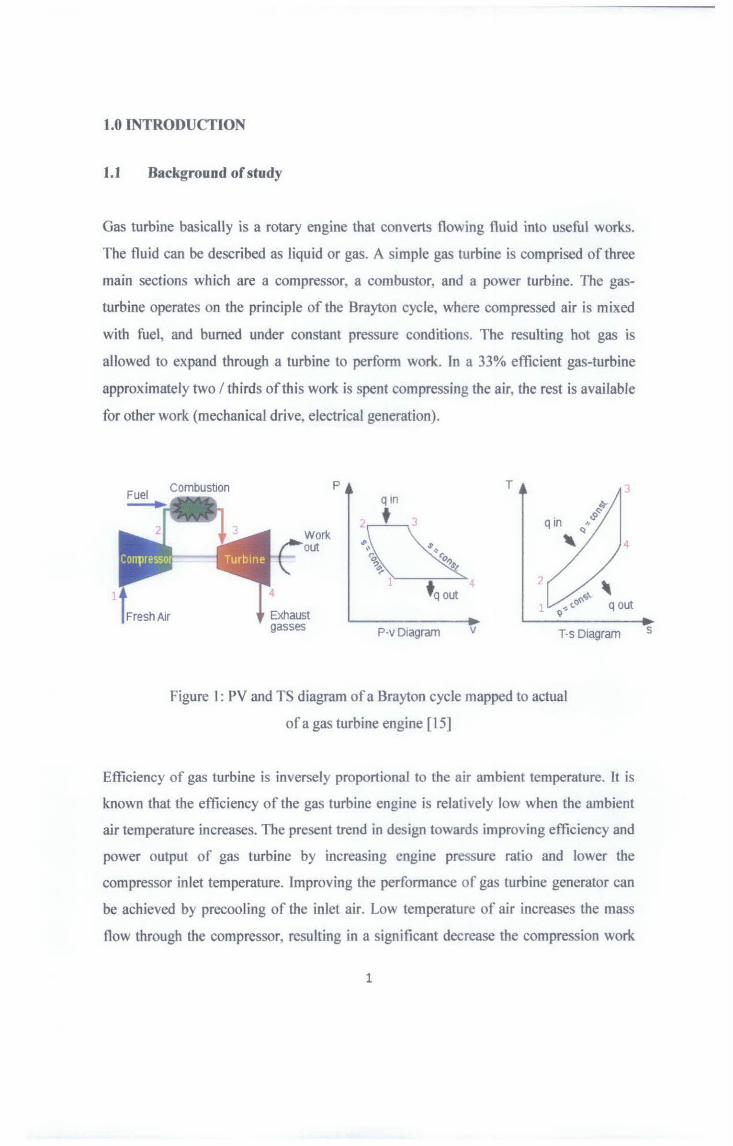
Gas turbine basically is a rotary engine that converts flowing fluid into useful works.
The fluid can be described as liquid or gas. A simple gas turbine is comprised ofthree
main sections which are a compressor, a combustor, and a power turbine. The gas
turbine operates on the principle of the Brayton cycle, where compressed air is mixed
with fuel, and burned under constant pressure conditions. The resulting hot gas is
allowed to expand through a turbine to perform work. In a 33% efficient gas-turbine
approximately two I thirds of this work is spent compressing the air, the rest is available
for other work (mechanical drive, electrical generation).
Combustion
Fresh Air
(
Work out
Exhaust gasses
p T
P-v Diagram v T-s Diagram
Figure I : PV and TS diagram of a Brayton cycle mapped to actual
of a gas turbine engine [ 15]
Efficiency of gas turbine is inversely proportional to the air ambient temperature. It is
known that the efficiency of the gas turbine engine is relatively low when the ambient
air temperature increases. The present trend in design towards improving efficiency and
power output of gas turbine by increasing engine pressure ratio and lower the
compressor inlet temperature. Improving the performance of gas turbine generator can
be achieved by precooling of the inlet air. Low temperature of air increases the mass
flow through the compressor, resulting in a significant decrease the compression work
1
s
and increase in gas turbine power output, with a slight improvement in efficiency. In
GDC plant, the air intake temperature to gas turbine varies from 23°C to 38°C. The
development of air cooling system is required to decrease the temperature at air intake
gas turbine to maintain air at a constant low temperature.
GDC is a power plant that supplies chilled water and electricity to Universiti Teknologi
PETRONAS. It mainly consists of 2 units of 4.2 MW gas turbine. The gas turbine is
used to generate electricity for the whole UTP. The hot exhaust gas is recovered to
produce steam in heat recovery steam generator (HRSG) and further the steam is used
in steam absorption chiller (SAC) to produce the chilled water.
In this project, the development of cooling system of air intake using chilled water is
proposed. The system consists of air cooler at the air intake gas turbine, using chilled
water to cool the hot air. This project will analyze the feasibility of the cooling system
at air intake gas turbine using chilled water and what are the effects to the steam
absorption chiller if the system is developed.
1.2 Problem statement
The current gas turbines in GDC draw air from surrounding at temperature which varies
from 23°C to 38°C. To increase efficiency ofthe gas turbine, the air intake temperature
to the gas turbine need to be reduced. The increasing of temperature of air intake is
inversely proportional to the performance of the gas turbine. One effective method to
reduce the temperature of the air at the intake of gas turbine is by using air cooler. The
cooling liquid can be obtained from the chilled water that the GDC plant produced.
Currently GDC is operated by 2 unit of main gas turbine each produces 4.2 MW at
maximum power. These turbines produce electricity from the generators and distribute
to the whole of UTP. The exhaust heat from gas turbine is recovered to produce steam
for SAC each having a capacity of 1250 tons refrigeration (RT). SAC produces chilled
2

water at 6°C and distributed into the AHU as the main air-conditioning system for UTP
building.
This project will analyze requirement and feasibility of the cooling system at air intake
gas turbine generator using chilled water that produced by GDC and how it will effects
performance of SAC with additional cooling system.
1.3 Objective
The objectives and scope of study for this project are as follows:
• To analyze the cooling requirement of the gas turbine
• To investigate the effect on SAC performance with additional cooling demand
• To develop a system for circulating chilled water for the air cooling system
1.4 Scope of studies
This study will be divided into two parts which are Final Year Project Part I and Final
Year Project Part 2.
1.4.1 Final year project part 1
Final Year Project Part I scope of studies:
• Investigate gas turbine Air Intake Requirement.
• Study the Principle of Heat Transfer between circulating chilled water and air
through coils and tubes.
• Study of Steam Absorption Chiller operation and capacity.
3

1.4.2 Final year project part 2
Final Year Project Part 2 scope of studies:
• Study of Chilled Water Distribution System.
• Design the Cooling System.
• Full Analysis and model development using software
4

2.0 LITERATURE REVIEW
Cooling system for air intake gas turbine is precooling of air using heat transfer
concept. There are 2 type of fluid using in cooling system which are liquid and gas. In
this project, the development of cooling system will use liquid (chilled water). Chilled
water is produced by SAC at lower temperature of 6°C and return at 13°C.
Development of cooling system will add a small slot of chilled water at 13 °C flow into
additional design of heat exchanger that will be place at air intake gas turbine. The hot
air will flow through the heat exchanger and cooled to maintain the air at lower
temperature before entering the compressor.
2.1 The effect oflow ambient temperature to the gas turbine performance
Recently, EI-Hadik [I] carried out a parametric study on the effects of ambient
temperature, pressure, humidity and turbine inlet temperature on power and thermal
efficiency. He concluded that the ambient temperature has the greatest effect on gas
turbine performance, which increases with the turbine inlet temperature and pressure
ratio. Reductions of power and efficiency due to a I K temperature change were found
to be around 0.6 and 0.18% respectively [2, 3].
The most practical method up to date for inlet-air cooling is evaporative cooling, with
its subsequent increase in mass flow through the turbine and the heat recovery boiler,
thus boosting power and steam production [4]. However, evaporative systems are
excellent in regions of high temperature and low humidity [5].
Output of gas-steam combined cycle (GTCC) is a strong function of the inlet air
temperature. When the inlet air temperature drops, GTCC power output increases
considerably and heat rate varies slightly [6]. A simple strategy to improve GTCC
performance under high ambient temperature is to employ GTCC inlet air cooling
(lAC) technologies.
A study regarding enhancement of performance of gas turbine engine by inlet air
cooling and cogeneration system by Y ousef [7] concluded that:
5

• Suction air precooling in a combined system improves power output by about
21%, overall thermal efficiency by about 38% and overall specific fuel
consumption by 28%.
• Performance of the combined system is relatively less sensitive to variations in
operating variables.
• Thermoeconomic evaluation shows that the combined system is viable.
Referring to Farzaneh et al. [8] the gas turbine efficiency will increase when the
temperature is low. Figure 2 show the result of average daily efficiency of gas turbine
using cooling system or without cooling system
· -- ·- Without Cooling T---------------~ ~------------------~ - With Cooling
0.25
0.2
>- 0 .15 u c: .i! jl ~ 0.1 w
0.05
0~----------------------------------------------Jan Feb Mar Apr May Jun Jun Jul Sep Oct Nov Dec
Month
Figure 2: Average daily turbine thermal efficiency [8]
The enhanced efficiency of the gas turbine in case of inlet air cooling has been also
presented. As it can be seen the actual efficiency of the gas turbine is quite low and
ranging for 10% in summer to 23% during winter. Note from the figure, by cooling the
inlet air temperature, the efficiency could be improved for almost 10 months and this
improvement is ranging from 1.5% to 5%.
6

Jean Perre et. AI. [9] made a research on gas turbine performance increase using an air
cooler with a phase change energy storage. According to them the possibility of
improving the electric output is by cooling the gas turbine inlet air. The selected turbine
is a land turbo-alternator used for Combined Heat and Power generation. Figure 3
illustrates the relationship between ambient air temperature and mechanical power for
the studied gas turbine.
1300
1250
1200 -~ 1150 ... tP
~ 1100 Q.
Ill 1050 J,l c Ill
J:: 1000 u
:1 950
900
"' "' "' " " " " 850
~15 -10 -5 0 5 10 15 20 25 30 35 40 Inlet air Temperature (0C)
Figure 3: Effect of inlet air temperature to the mechanical power [9]
The mechanical power is of 1115 kW with an ambient air temperature of 15°C (ISO
conditions, 60 % relative humidity) and power drop is 9 kW when the temperature of
the air increases I °C. So, with 40°C, the power is only 890 kW compared to the
standard conditions (15°C), a fall of 225 kW that is to say 20% of the capacity. The
electric output is equal (taking into account the efficiency of the alternator) to 96% of
the mechanical power.
7
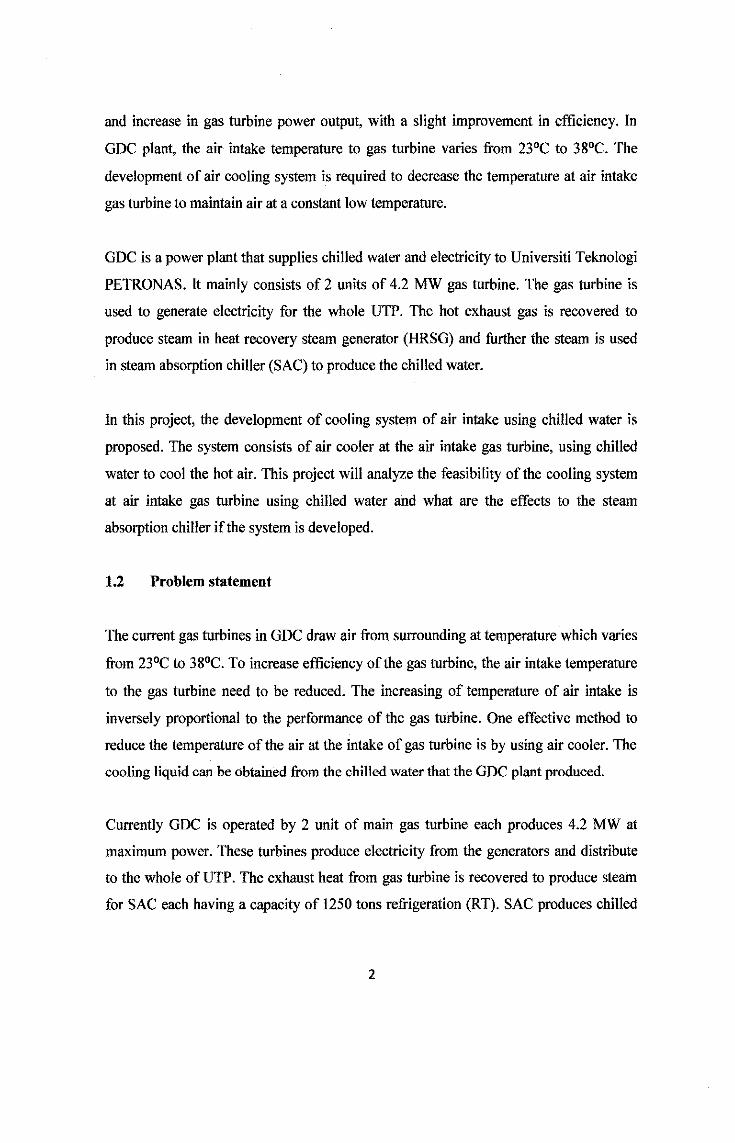
2.2 The inlet air cooling system
Figure 4: Generic inJet air cooling system [I 0]
Figure 4 is the generic inlet air cooling system according to Dawoud et al. [10]. The
basic building blocks are the chiller, its cooling tower, the air heat exchanger, and the
interconnecting piping. The exhaust gases of the gas-turbine may be used directly to
drive the absorption chiller. Some of the available chillers are hot water or steam driven,
while the others are direct fired. For this reason, a steam boiler is incorporated as
optional equipment. Cold fluid from the chiller is pumped through the air heat
exchanger, where the coolant is heated and returned to the chiller, while the inlet air is
cooled prior to entering the compressor. The required cooling water for both the
condenser and absorber of the absorption chiller is provided by using the cooling tower.
Alternatively, evaporative or air-cooled condensers and absorbers might be used with
some types of chillers. Including storage and its associated piping loop increases the
number of system components, but allows the chiller and cooling tower components to
be downsized.
8

A design compressor inlet air temperature of 14C has been assigned to LiBr-water
chilling systems. These technologies have been compared with respect to their
effectiveness in power boosting of small-size gas-turbine power plants used in two oil
fields at Marmul and Fahud in the Sultanate of Oman. The LiBr-H20 cooling reduces
energy up to 11.5%.
2.3 Chilled water cooling system
Jian and Zaheeruddin [II] from Concordia University said that to model a Chilled
Water Cooling System, it is necessary to consider not only the vapor compression
system but also an evaporative cooler, a storage tank and building load. They also said
that if the load is constant, increasing compressor motor speed would generate a higher
quantity of gas refrigerant flow rate, therefore increasing the refrigerant capacity of the
system.
The study on how to Improved Energy Performance of air cooled centrifugal chillers
with variable chilled water flow have been made by Yu and Chan [12]. A
Thermodynamic model for the chillers was developed and validated using a wide range
of operating data and specifications. Based on the validated model, it was found that
optimizing the control of condensing temperature and varying the evaporator's chilled
water flow rate enable the COP to increase by 0.8-191.7%, depending on the load and
ambient conditions. A cooling load profile of an office building in a subtropical climate
was considered to assess the potential electricity savings resulting from the increased
chiller COP and optimum staging of chillers and pumps. There is 16.3-21.0% reduction
in the annual electricity consumption of the building's chiller plant.
2.4 Absorption refrigeration system
According to Yang et al. [13] a further possibility of cooling system for gas turbine air
intake is the utilization of an absorption refrigeration machine that is driven by the heat
9

recovered from the exhaust gases of the engine. The latter heat-recovery method can be
modified to have a waste-heat boiler in the exhaust duct of the steam power-plant. The
tail-end gases coming from the waste-heat boiler can be used to power the generator of
the absorption machine [14].
10

3.0 METHODOLOGY
3.1 Project flow
The overall project work will follow the chart as below
Investigate Gas Turbine air intake requirement at GDC plant
Study of Steam Absorption Chiller (SAC) operation and capacity
Investigate and research the principles of heat transfer between
circulating chilled water and air through tubes
Study of chilled water distribution system
Propose initial design of cooling system
Model development, analysis and validation using software
Figure 5: flow of work
11
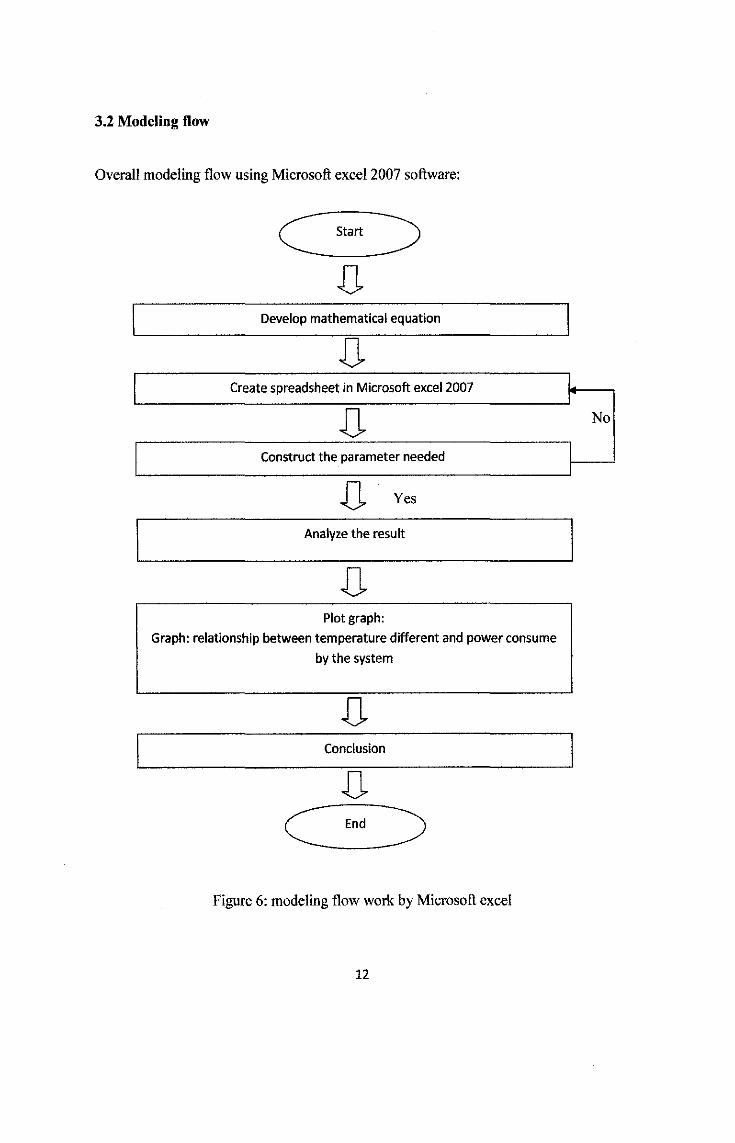
3.2 Modeling flow
Overall modeling flow using Microsoft excel 2007 software:
D Develop mathematical equation
D Create spreadsheet in Microsoft excel 2007
D Construct the parameter needed
D Yes
Analyze the result
D Plot graph:
Graph: relationship between temperature different and power consume
by the system
D Conclusion
Figure 6: modeling flow work by Microsoft excel
12
No

3.3 Project Tools
The tools that have been used are as follows:
• Software for modeling
For this project the author will do the modeling by using Microsoft Excel to
determine the feasibility of the system.
• Information Resource Centre
The library is the source of information that can be used to extract important
information for this project. The main focus of research is at the journal section
and the available book. Information gain from this location is the fundamentals
of thermodynamic and heat transfer studies.
• UTP Gas District Cooling (GDC) plant
GDC plant is the source for the author to get information regarding gas turbine
performance and look at the current condition and situation. Information gain
from this source is the parameters and the actual reading of gas turbine.
• Online journal reviews
Online journals can be found on the internet. The author used sciencedirect.com
website to find the journals. All available journals are helpful and related to the
author project.
13

3.4 Project planning for final year project 1
No
11
13
Planning Due date
Figure 7: Gantt chart for fyp I
14
7 I 8 I 9 I 10
~
~ .c -~ fj e ~
"C
~
15

3.5 Project Planning for final year project 2
Planning
Due date
Figure 8: Gantt chart for fyp 2
15

4.0 MATHEMATICAL MODEL
4.1 Parameters
All known and unknown parameter have been listed below. In some cases, assumptions
need to be done for the sake of simplicity of the analysis.
Table 1: Parameters
Parameters Value Maximum capacity of SAC, 2500 RT
Qs,max Mass flowrate of water in 278 kg/s chilled water main pipe,
mw,main
Chilled water main pipe inlet 750mm diameter, D
Mass flowrate of air at inlet of 19 kg/s GTE,m.
Chilled water inlet 6°C temperature, Tcws
Chilled water outlet 13"C temperature, Tcwr
Velocity of water, V w 0.629 m/s
Surface area, Asurface unknown Number of tube, N unknown
Mass flowrate of water, mwater unknown Tube length, L unknown
Heat transfer coefficient, U unknown Constant specific heat of water 4.188 KJ/kg-°K
at constant pressure,Cp,water Density of water, Pwater 1000 kg/m3 Pipe inlet diameter, Di 16.91 mm
Pipe outlet diameter, Do 19.05 mm Pipe thickness, t 1.07mm
16
4.2 Assumptions
The purpose of assumption is to solve the problem. All assumptions for this project are
as below:
• The cool air at outlet air cooler is 20°C
• The temperature of chilled water supply and return are fix
• The mass flowrate of air is constant
• Ambient temperature varies from 23°C to 38°C
4.3 Current Steam Absorption System capacity
Current capacity of chilled water system produced by SAC is calculated. GDC plant is
able to produce 2500 RT chilled water capacity by 2 units of SAC. Current energy used
can be calculated by
Qactual = mw,main X Cpw X (T cwr" Tcws)
= (278 kg/s) x (4.188KJ!kg-K) x (7K)
= 8149,8 kJ/s x (I RT/3.517 kJ/s)
= 2317.26 RT
By knowing the value, the amount of capacity after new cooling system is applied shall
not be more than the maximum capacity allowed which is 2500RT. Thus GDC has
remaining availability of 183 RT capacity for the new cooling system. Further analysis
will determine feasible amount of power required in generating new cooling system.
4.4 Principle of heat transfer between circulating chilled water and air
The heat equilibrium between circulating chilled water and flowing air is calculating
according to this equation:
Qc= IDa X Cpa X (Tha-Tca) = mw X Cpw X (Tcwr·Tcws)
17

Where,
Q, =total of energy, KW
ma = mass flowrate of air, 19 kg/s
mw = mass flowrate of chilled water, kg/s
Cpa= average specific heat at constant pressure of air, 1.005 KJ/kg-K
Cpw=water respectively, 4.188KJ/kg-K
Tcws =chilled water temperature inlet, 279K
Tcwr = chilled water temperature outlet, 286K
Tha =maximum ambient ambient air temperature, 311K
Tea= cool air temperature, 293K
Chilled water:Tcw,,mw
Cool air: Tea Hotair:Tha,ma
Tcwr
Figure 9: System diagram
4.4.1 Mass Oowrate of water in tubes
The mw can be calculated using this equation
mw= m,x Cpa X (Tha-Tca)/ CpwX (T,wr-Tcws)
= [(19 kg/s)(l.005KJ/Kg-K)(311-293) K]/ [(4.188KJ/kg-K)(286-279)] K
= 11.72 kg/s
18

Where,
ma = mass flowrate of air after cooled and enter air intake, kg/s
mw= mass flowrate of water entering the heat exchanger tube, kg/s
Cpa= constant specific heat of air, kJ/kg-K
Cpw= constant specific heat of water, kJ/kg-K
Tcws =chilled water inlet, K
Tcwr = chilled water outlet, K
Tha = maximum ambient temperature, K
Tea = coo I air temperature, K
Steam
absorption
chiller
l To cooling system
mw= 11.72 kg/s
- --1> =chilled water
~ -I ToUTP
mw::::2 78 kg/s, D = 0.75m
Figure 10: distribution of chilled water mass flowrate
4.4.2 Energy extracted by air cooler
The mass flowrate of water is determined. The Energy used by the system can be
calculated using equation:
Qc= mw X Cpw X (Tcwr-Tcws) = (11.72kg/s) X (4.188kJ/kg-K) X (7K)
=343.58 KW
=97.7RT
19
To cool the air at maximum ambient temperature of 38°C at 19 kg/s needs amount of
11.72 kg/s mass flowrate of chilled water and 97.7 RT of energy.
4.4.3 Material and overall heat transfer coefficient
For the heat exchanger tubes the material used is copper. For composite material in
series, the overall heat transfer coefficient U due to combined conduction and
convection heat transfer is given by
Where,
(11U) = (llhA) + L(x//.,) + (1/hs)
= (1155) + (0.00107/401) + (115250)
= 0.0184 m2KIW
hA= heat transfer coefficient for air, W/m2K
hs= heat transfer coefficient for water, W/m2K
/.,= thermal conductivity of materials, W /mK
x= tube wall thickness in, m
In this study assume hA =55 W/m2K, ha= 5250 W/m2K, /.,=401W/mK for copper [17]
and assume wall thickness is 1.07mm [20] giving the overall heat transfer equation
equal to 54.42 W/m2K.
20

4.4.4 Log mean temperature difference
Tea. out; 20°( Air cooler ·--
I
l Tcw,, out; 13°(
Figure II: inlet and outlet temperature
The log mean temperature difference (LMTD) is used to determine the temperature
driving force for heat transfer in flow systems,
Where,
= (32-7) K/ln(32/7)
= 16.45 K
llTin = Tha,in- Tcws,in
~Tout= Tca,out- TcWT,out
4.4.5 Heat exchanger surface area
After finding U, log mean temperature and power consume by the system, the surface
area of heat exchanger can be determined by using this equation,
= (343580W)/ (54.42 W/m2-K x 16.45K)
=383.80 m2
21

Where,
Qc =energy extracted by chilled water to cool the hot air, kW
U =overall heat transfer coefficient, W/m2 -K
Asurrace =total contact area with hot air, m2
AT1m =log mean temperature, ATin-AToutlln (ATin/ATout), K
4.4.6 Number oftubes in beat exchanger
Assume Inner diameter of copper pipe is 16.91mm [21], and the pipe velocity is 0.629
mls. Thus the number of tubes in heat exchanger can be determined by
N = mwl (Pwater X Atube X v w)
= (11.72 kg/s) I (1000kg/m3 x 2.25xl0-4m2 x 0.629m/s)
= 83 tubes
Where,
Pwater =density of water, kglm3
Atube = cross-sectional area of tube, m2
V w =velocity of water in tube, rnls
N = number of coils in heat exchanger
mw = chilled water mass flowrate, kg/s
4.4. 7 Length of tubes
Assume outer diameter of tube is 19 .05mm [21], the length of single tube is determined
by
L = Asllffacel n X Do X N
= 383.80 m2/ (n x 0.01905m x 83tubes)
=77.26m
22

Where,
Asurrace =surface area of air cooler, m2
Do = outer diameter of tubes, m
L = length of single coil, m
N = number of tube in air cooler
4.4.8 Type of flow in tubes
Type of flow can be determined using Reynolds number given by,
Where,
Re=pxVwxDJJl
= [(1000kg/m3) x (0.629m/s) x (0.0169lm)]/(1.307 x 10"3kg/m.s)
= 813 8 > 4000 (Turbulent)
p =density of fluid, kglm3
Vw= velocity of water, m/s
D; = internal diameter of tube, m
Jl = dynamic viscosity, kg/m.s
The Reynolds number is more than 4000 thus the type of flow is turbulent. To find
pressure drop along the tube for turbulent flow,
Where,
Pdmp = (fx LID;) x (p x Vw2 I 2) x 83 tubes
= [(0.033 X 77.26)/0.01691) X [(1000 X 0.6292)/2) X 83
= 2475565.51 N/m2 or (Pa)
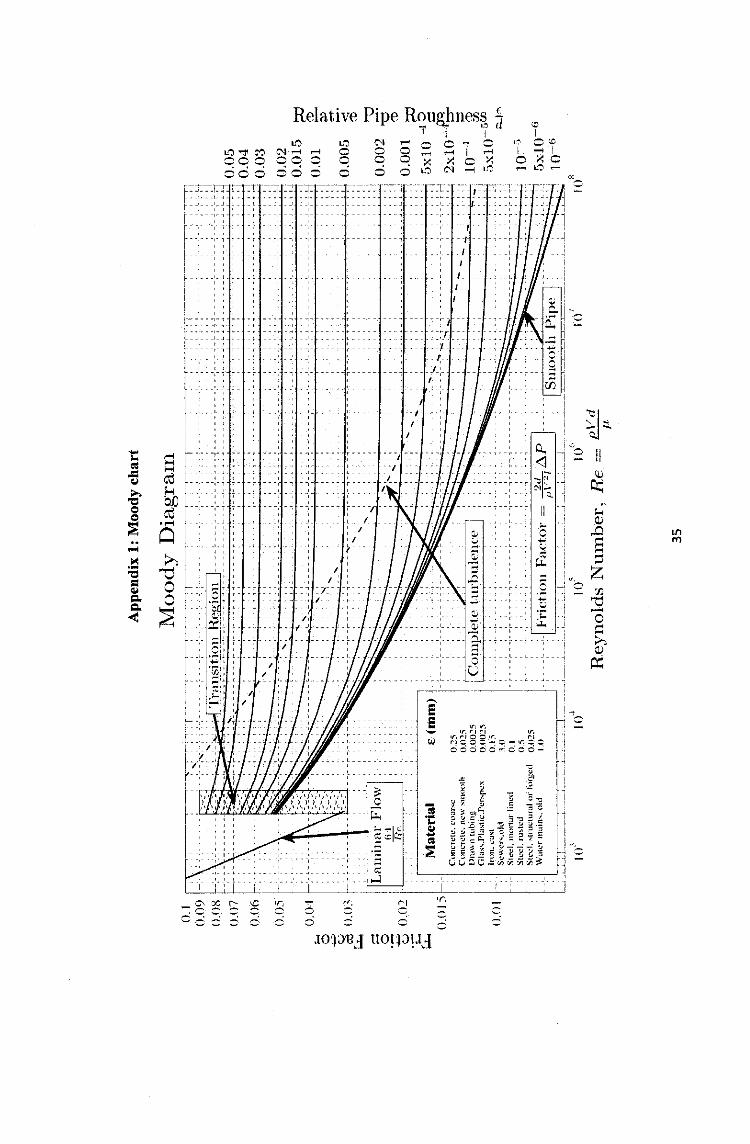
f = friction coefficient determined using moody chart, relative pipe roughness
(EIDi) of8.87x10-5 for copper tube [appendix 1]
23

L =length of tube, m
D; =pipe inner diameter, m
p =density of water, kg/m3
V w = velocity of water, m/s
4.4.9 Pumping power
The pumping work required to circulate chilled water to overcome pressure losses
through the loop is given by,
Where,
Ppump= Pdrop X Atube X Vw
= 2475.565 X [n/4 X (0.0J69JiJ X 0.629
=0.35kW
Atube = cross-sectional area of tube, m2
Pdrop =pressure drop in pipe, kPa
Vw =chilled water velosity, m/s
Ppump =pumping power, kW
24
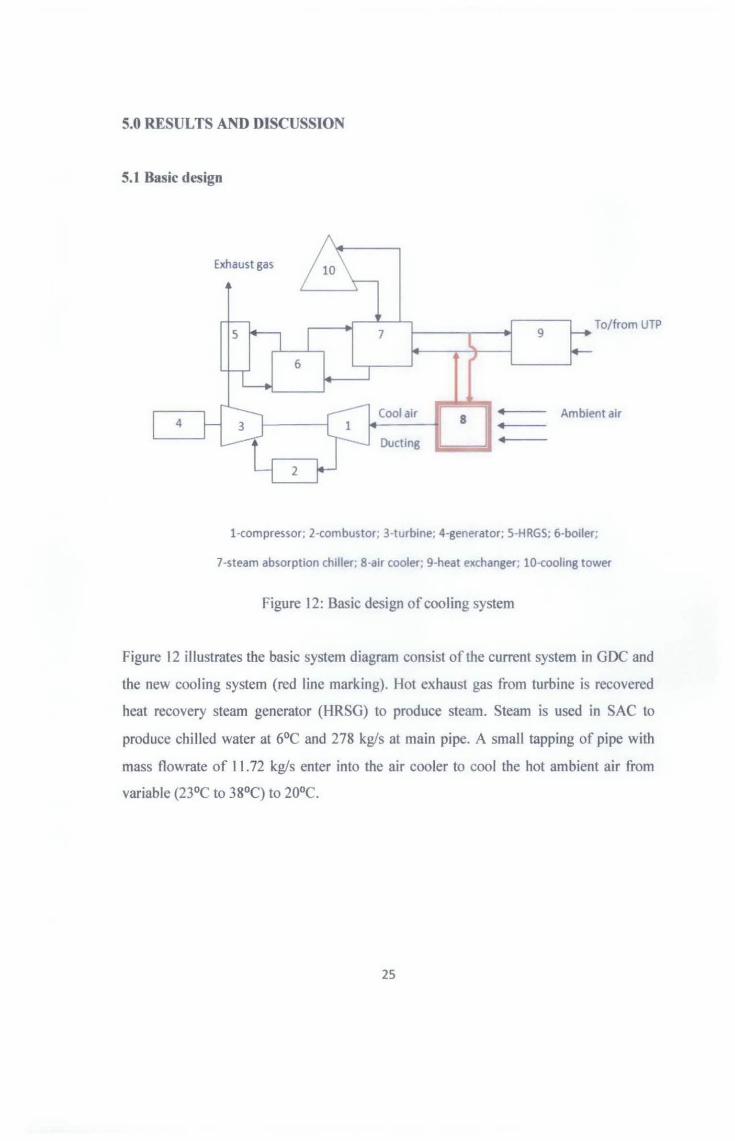
5.0 RESULTS AND DISCUSSION
5.1 Basic design
Exhaust gas
7 9 To/from UTP
Coolair ~ 14--------1! 8
Ducting
Ambient air
1-compressor; 2-combustor; 3-turbine; 4-generator; 5-HRGS; 6-boiler;
7-steam absorption chiller; 8-air cooler; 9-heat exchanger; 10-cooling tower
Figure 12: Basic design of cooling system
Figure 12 illustrates the basic system diagram consist of the current system in GDC and
the new cooling system (red line marking). Hot exhaust gas from turbine is recovered
heat recovery steam generator (HRSG) to produce steam. Steam is used in SAC to
produce chilled water at 6°C and 278 kg/s at main pipe. A small tapping of pipe with
mass flowrate of ll. 72 kg/s enter into the air cooler to cool the hot ambient air from
variable (23°C to 38°C) to 20°C.
25

5.2 Feasibility of system
To examine the feasibility of the new system there must be no interruption with current
system capacity. Thus,
(Qsac.ma'<- Qactual)- Qc= (2500-2317.26) RT- 97.7 RT
= 85.04 RT
Total amount energy usage by UTP is about 2317.26RT. SAC is able to produce
maximum capacity of 2500RT. After the new system is added the total amount is still
below the maximum capacity that SAC can provide. Development of new system is
feasible since capacity of SAC still can sustain about 85.04 RT remaining. Thus
developing this air cooling system will not affect current system in GDC power plant.
Energy Vs ambient temperature 700
600
500
~ 400 ~ -1 Qsys -~ 300 ... Qb CI.J c 200 w
100
0
23 24 25 26 27 28 29 30 31 32 33 34 35 36 37 38
T ambient (C)
Figure 13: Energy versus ambient temperature
Figure 13 shows the capacity of cooling system,Qsys and remaining capacity,Qb. It
shows that when maximum power required by cooling system is achieved at 38°C the
SAC has remaining energy capacity about 299.79 kW. The added of new cooling
26
system will not affect SAC current capacity and other system at GDC. Thus, any
modification to the current system is not required.
5.3 Capacity of the air cooling system
.......-------------------
.~ u ro c.
J
Energy capacity Vs ambient temperature
9000
8800 ••••••••••••••••
8600
8400
• • • • 8200 -· ·-• 11 • * * * * * 8000 ----------------~-- --~--------
7800
23 24 25 26 27 28 29 30 31 32 33 34 35 36 37 38
T ambient (C)
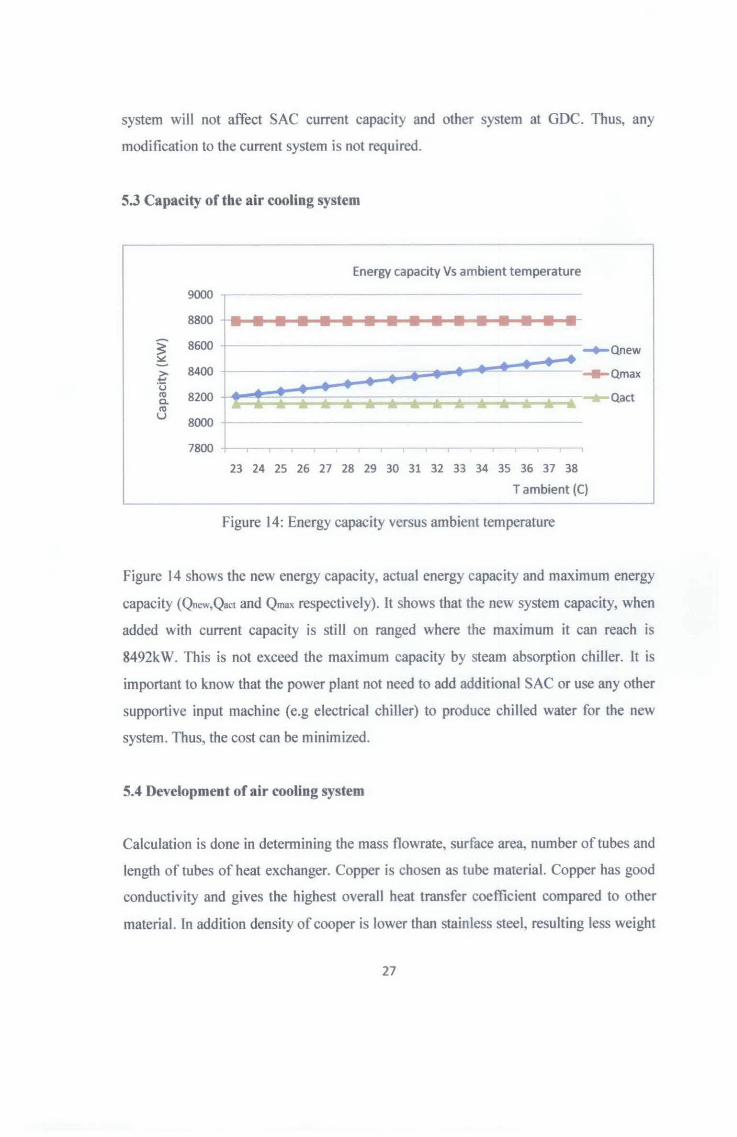
Figure 14: Energy capacity versus ambient temperature
Figure 14 shows the new energy capacity, actual energy capacity and maximum energy
capacity (Qnew,Qact and Qmax respectively). It shows that the new system capacity, when
added with current capacity is still on ranged where the maximum it can reach is
8492kW. This is not exceed the maximum capacity by steam absorption chiller. It is
important to know that the power plant not need to add additional SAC or use any other
supportive input machine (e.g electrical chiller) to produce chilled water for the new
system. Thus, the cost can be minimized.
5.4 Development of air cooling system
Calculation is done in determining the mass flowrate, surface area, number of tubes and
length of tubes of heat exchanger. Copper is chosen as tube material. Copper has good
conductivity and gives the highest overall heat transfer coefficient compared to other
material. In addition density of cooper is lower than stainless steel, resulting less weight
27

of design. Figure 15 shows the minimum and maximum mass flowrate of water with
respect to energy used by the air cooler.
400
~ 350 ~
?;;; 300 ... 250 CIJ
c: w 200
150
100
50
0
0.00 2.00
Energyvs mw
4.00 6.00 8.00 10.00 12.00 14.00
Mass flowrate, kg/s
Figure 15: Energy versus water mass flowrate
To cool the air at temperature of 38°C, the more energy is required resulting mass
flowrate of water to increase. ln this design, the maximum energy used is about 343.58
kW and water mass flowrate of 11.72 kg/s. Air is estimated to cool from maximum
ambient temperature of38°C to 20°C using 83 tubes and length of each tube is 77.26 m.
The total amount of surface area of air cooler is calculated to be 383.80 m2.
It is important to know the type of flow inside the tube whether laminar or turbulent.
For this study, the flow is turbulent. To find the pressure drop inside the pipe for
turbulent flow, the tube friction coefficient of is found using moody chart. The relative
pipe roughness (E/Di) line of 8.87x I 0'5 for copper tube intersect with Reynold's number
in moody chart, give the value of 0.033. The total pressure drop in 83 tubes is 2475.57
kPa. To overcome the pressure loss inside the tubes, pumping power of 0.35 kW is
needed to circulate chilled water through the system.
28

Pdrop (Pa) Tube length (m) 160.21 5 320.42 10 480.63 15
640.84 20 801.05 25 961.26 30
1121.47 35
1281.68 40
1441.89 45 1602.10 50 1762.31 55 1922.52 60 2082.73 65
2242.94 70
2403.15 75
2563.36 80
Table 2: Pressure drop versus tube length
Pressure drop Vs Tube length
3000 -
2500
2000
1500
1000 Pdrop
500
0
5 10 15 20 25 30 35 40 45 50 55 60 65 70 75 80
Tube length , meter
Figure 16: Graph pressure drop versus tube length
29

6.0 CONCLUSION AND RECOMMENDATION
By reducing the temperature of air at intake will increase the performance of gas
turbine. To improve the efficiency of gas turbine by adding a cooling system at it air
intake any interruption of current system must be avoided to make sure the additional
system is reliable. Furthermore, the power need to run the system should be less than
that the power improvement of the gas turbine so that this system can be successfully
developed.
Based on analysis, the design of the cooling system consists of:
Table 3: design of air cooling system
Parameter Value (unit)
Maximum energy required by air cooler 343.58 (kW)
Maximum mass flowrate of water 11.72 (kg/s)
Velocity of water 0.629 (m/s)
Surface area of air cooler 383.80 (m2)
.
Tube inner diameter 16.91 (mm)
Tube outlet diameter 19.05 (mm)
Tube thickness 1.07 (mm)
Number of tubes 83
Length of tubes 77.26 (m)
Pumping power 0.35 (kW)
The development of new air cooling system for air inlet gas turbine in GDC does not
affect the performance of current system and allowable capacity. Thus, the development
of cooling system is feasible to develop.
In recommendation, the author suggested that the air cooler is turn on for 24 hours. The
ambient air temperature at night is still high which is around 23°C to 29°C. The
automatic control valve is suggested to be used in the system since the valve will
30

control the amount of chilled water mass flowrate with respect to the ambient air
temperature. This will save a lot of energy especially when the ambient air temperature
is low (e.g, at 23°C), since the mass flowrate of chilled water is minimum. Furthermore,
the author suggested that to calculate the surface area, it is required to add correction
factor (f) in calculation. The correction factor is important for real condition compared
to the theory. Thus it will give more accurate result and reduce errors. Last but not least,
the author suggested that a small prototype of heat exchanger is created by a student to
study the detail and any factors that make the system fails.
31

REFFERENCE
[1] A. EI-Hadik, The impact of atmospheric conditions on gas turbine performance. J.
Eng Gas Turbines Power, 112, 590-596 (1990).
[2] R. Gareta, LM Romeo, A Gil. Economic optimization of gas turbine inlet air cooling
systems in combined cycle applications. In: Proceedings of ECOS. Berlin: ECOS; p.
409-15 (2002).
[3] R Yokoyama, I. Koichi. Evaluation of operational performance of gas turbine
cogeneration plants using an optimization: OPS-operation. J Eng Gas Turbine Power;
126(10):831-900 (2004).
[4] D. J. Moeller and D A. Kolp. Simpson paper company: first 35 MW IMSOOO in
cogeneration plant, ASME Paper No. 84-GT-55 (1984).
[5] M. Piolenc. LES 'iced' inlet nets utility another 14 MW of peaking at zero fuel cost.
Gas Turbine World, Jan, 20-25 (1992).
[6] H. Wen, RG. Narula, Economics of gas turbine inlet air cooling for combined cycle
plants. In: Proceedings of the American power conference, Chicago, USA; p. 100-105
(2000).
[7] Y ousef. Enhancement of performance of gas turbine engines by inlet air cooling and
cogeneration system. Applied Thermal Engineering Vol. 16, No. 2. pp. 163-173,
(1996).
[8] M. Farzaneh-Gord, M. Deymi-Dashtebayaz, A new Approach for enhancing
performance of a Gas Turbine (Case Study: Kangiran refinery), Applied Energy 86,
2750-2759 (2009).
32

[9] Jean-Pierre Bedecarrats, Fran90ise Strub, Gas turbine performance increase using an
air cooler with a phase change energy storage. Applied Thermal Engineering 29, 1166-
1172 (2009).
[10] B. Dawoud, Y.H. Zurigat, J. Bortmany. Thermodynamic assessment of power
requirements and impact of different gas-turbine inlet air cooling techniques at two
different locations in Oman. Applied Thermal Engineering 25, 1579-1598 (2005).
[11] Wei-Ling Jian and M. Zaheeruddin, Sub-optimal on-off switching control
strategies for chilled water cooling systems with storage, Applied Thermal Engineering
Vol. 18, No 6, pp. 369-386 (1998).
[12] F.W. Yu, K.T. Chan, Improved energy performance of air cooled centrifugal
chillers with variable chilled water flow, Energy Conversion and Management 49,
1595-1611 (2008).
[13] 0. Yang, M. Tsujita and G. T. Sato, Thermodynamic study on the suction cooling
gas turbine cycle combined with absorption-type refrigerating machine using wasted
heat. Bull JSME, 13 (63), llll-1122 (1970).
[14] W. F. MaJewski and G. M. Holldorff, Power increase of gas turbines by inlet air
precooling with absorption refrigeration utilizing exhaust waste heat, ASME Paper No.
86-GT-67. Gas Turbine Con, Duesseldorf, 8-12 (1986).
[15] A. Yunus. Cenge1, A. Michael. Boles, Thermodynamics, An Engineering
Approach Sixth Edition (SI Units).
[16] P.K Nag, Power Plant Engineering 2"d Edition. Condenser, feedwater and
circulating water system, 561-598
[17] http://www.engineeringtoolbox.com/therma1-conductivity-d _ 429.htm1
33

[18] http://www .efunda.com/formulae/heat_ transfer/convection_ forced/
isothermal plate _lamflow .cfm
[ 19] http://www .engineeringtoolbox.com/overall-heat -transfer-coefficient -d _ 4 34 .html
[20] Metric Sizes of copper tubes to BS (British Standard) 2871:1972
[21] http://www.engineeringtoo1box.com/astm-copper-tubes-d _779.html
[22]http://www.engineeringtoolbox.com/water-dynamic-kinematic-viscosity
d 596.html
[23] http://www.engineeringtoolbox.com/thermal-conductivity-d _ 429.html
[24] http://www .efin .leeds.ac.uk/CIVE/CIVE 1400/Section4/laminar _ turbulent.htm
[25]http://www.engineeringtoolbox.com/laminar-transitional-turbulent-flow
d 577.html
34
L.-, "'1 ~ co
00 c
t:-= :.: : ::: ~
_._- -'- ~
-'
. '
_._ 6:{
-- L----
I I
I 1--! -
_-_,_j~l_-~_j_~~
~ ~ !::: :f c: ~
c ~ c c
Relative
"' "''"' 00 00
I
'r, c c
,... c c
'"" 0
J I
I I
"' 0 ~ 0
c·
c
'
c--
'I I
~
c
Pipe R~ug!mes~ ~ i i I
"' 0 0 0
,... 0 c -0 0 I ,... ,.... ~ X X 0 Lel "'
:r - -1-~
____ J
I
I
c ...,
-·I
I
I
,... X
LC)
T ~.-, 0 ~
I ~I oX C ,...., l.., .....,
Q.. <I
~I'' ':'1-"-
-
' : ''· 0
--, c
~' --~ II (l)
ex:: .. lli
...0 "' s m
;::: z en
'1::1 -0 ;::: ;;., lli ~

Roughness for new pipe and ducts is a function of material and manufacturer. Values from Moody L.F, Friction Factors for Pipe Flow (1944).
36

Appendix 2: Thermal conductivity of materiaJs
Thermal Condyctrtiti- 1< - IW(m K)
r~atenai/SutJstance Temperature- °C
25 125 225 Acetone 0 16
A,cetylene (~as} 0 018 A.cryllc 02
AJr athmosphere (~as } 0 024 Alcohol 017
Alum1num 250 255 250 Aluminum Ox1de 30 A.mmonla (~as 1 0 022
A.nbmony 18 5 A.r~on (~as) 0 016
Asbestos-cement board 0744 Asbestos-cement sheets 0 166
Asbestos-cement 207 Asbestos. loosely pacl<'ed 015
Asbestos m111 Mard 014 Asphalt 0 75
Balsawood 0.048 Bitumen 017 Benzene 0 16 Beryl hum 218 Bitumen 0 17
Blast furnace gas (gas ) 002 Brass 109
Bree::.e bloc>:; 0.10 - 020 Bnck dense 1.31
Brickwork, common 0 6-1 0 Bnckworr dense 1 6
Cadmium 92 CalCium SiliCate 0 05
Carbon 1 7 Carbon d1ox1de (gas) 0 0146
Cement, portland 029 Cement. mortar 1 73
Chalk 0 09 Chlonne (gas) 0 0081
Chrome Nickel Steel (1 8% Cr, 8 % 16 3 Nil
Clay, dl) to mo1st 0.15 - 18 Clay, saturated 0 6 - 2 5
cooalt 69 Concrete. llghlwel~ht 0 1 - 0 3 Concrete medium 04 - 07 Concrete. dense 1 0 - 1 8 Concrete. stone 1 7
Constantan 22 Copper 401 400 398
Conan (ceramic filled) 1 06
37

Appendix 3: ASTM B 280 Copper Tube - Air Conditioning and Refrigeration
Seamless copper tube according ASTM B 280 - Standard Specification for Seamless Copper Tube for Air Conditioning and Refrigeration Field Service- is intended for use in the connection, repairs, or alternations of air conditioning or refrigeration units in the field .
ACIR Copper Tubes is used in the Air Conditioning and Refrigeration Field Service Industry and is designated by the tube's actual OD. B 280 tube is produced in straight lengths or coils.
Cross
Nominal S1ze Annealed (A) Outside Inside Wall Sectional
(tt1Ches) or Drawn Diameter D1ameter Th1c~ness Area of Bore Temper {D) (mches) (mches) (mches) (square
Inches)
1/8 .A. 0 125 0 065 0 030 0.0033 3/16 A 0 187 0.128 0 030 0 0129 114 A. 0 250 0 190 0 030 0 0284
5/16 A. 0.312 0.248 0 032 0.0483
3/8 A 0.375 0 311 0 032 0 076 D 0.375 0.315 0.030 0 078
1/2 A. 0.500 0 436 0 032 0 149 D 0.500 0 430 0.035 0 145 :.. 0.625 0 555 0 035 0 242
5/8 D 0.625 0 545 0 040 0 233 A. 0.750 0 680 0 035 0 363
3/4 A. 0 750 0 666 0 042 0 348 D 0.750 0 666 0 042 0 348
718 A. 0 875 0 785 0 045 0 484 D 0.875 0.785 0 045 0 484
1 1/8 A. 1125 1 025 0 050 0 825 D 1.125 1.025 0 050 0 825
1 3/8 A. 1.375 1 265 0 055 1.26 D 1.375 1.265 0 055 1 26
38

Appendix 4: Dynamic and kinematic viscosity in SI unit
Temperature Q:inamiC VISCQSflY ~memat1c ~ISCQSity - t - - JJ - - v-fC) (N slfrl) X 10·3 (rr?ls) x 1(16
0 1.787 1.787
5 1 519 1.519
10 1 307 1 307
20 1 002 1 004
30 0 798 0 801
40 0 653 0 658
50 0 547 0 553
60 0 467 0 475
70 0 404 0 413
80 0.355 0 365
90 0 315 0 326
100 0.282 0.294
39

Appendix 5: Microsoft excel data spreadsheet 1
Ta('Cj Tmwsi'CI Tmwr('Cj Tcool T,m~·Tim c~ c,. ~lkg/m m,)kg/s) mjkg/sj Qsys(KW) U~Piw/m'·kl ATn As(m'j Di(mm D~mmj At(m'j V~m/s) Pdrop(paj Ppump(KW)
23 6 13 20 11.73 1005 4.188 1000 19 1.95 57.29 54.42 1127 93.40 16.91 19.05 0.0002246 0.619 1475565.51 U35
14 6 13 10 12.35 1.005 4.188 1000 19 1.61 76.38 54.42 11.65 120.51 16.91 19.05 0.0001246 0.619 2475565.51 0.35
25 6 13 20 12.98 1.005 4.188 1000 19 3.26 95.48 54.42 12.02 145.99 16.91 19.05 0.0001146 0.619 2475565.51 0.35 16 6 13 10 13.61 1.005 4.188 1000 19 3.91 114.57 54.42 11.38 170.01 16.91 19.05 0.0002146 0.629 1475565.51 0.35
17 6 13 20 14.16 1.005 4.188 1000 19 4.56 133.67 54.41 11.74 191.74 16.91 19.05 0.0001246 0.629 2475565.51 0.35
28 6 13 20 14.90 1.005 4.188 1000 19 5.11 151.76 54.41 13.10 114.30 16.91 19.05 0.0001146 0.629 1475565.51 0.35
19 6 13 20 15.55 1.005 4.188 1000 19 5.86 171.86 54.41 13.45 134.79 16.91 19.05 0.0001146 0.629 1475565.51 0.35
30 6 13 10 16.10 1.005 4.188 1000 19 6.51 190.95 54.41 13.80 154.32 16.91 19.05 0.0001246 0.619 1475565.51 0.35
31 6 13 10 16.86 1.005 4.188 1000 19 7.16 210.05 54.42 14.14 172.96 16.91 19.05 0.0001146 0.619 2475565.51 0.35
31 6 13 20 17.51 1.005 4.188 1000 19 7.81 229.14 54.41 14.48 190.79 16.91 19.05 0.0001146 0.619 2475565.51 0.35 33 6 13 10 18.18 1.005 4.188 1000 19 8.47 148.14 54.41 14.81 307.88 16.91 19.05 0.0001246 0.619 1475565.51 0.35
34 6 13 10 18.85 1005 4.188 1000 19 9.11 167.33 54.41 15.15 324.18 16.91 19.05 U0001146 0.629 2475565.51 Q35
35 6 13 10 19.51 1.005 4.188 1000 19 9.77 286.43 54.42 15.48 340.05 16.91 19.05 0.0002146 0.619 1475565.51 0.35 36 6 13 10 10.10 1.005 4.188 1000 19 10.41 305.52 54.41 15.80 355.22 16.91 19.05 0.0001146 0.619 1475565.51 0.35 37 6 13 10 10.87 1.005 4.188 1000 19 11.07 314.61 54.41 16.13 369.85 16.91 19.05 0.0001146 0.619 1475565.51 0.35 38 6 13 10 11.55 1.005 4.188 1000 . . 19 11.71 343.71 c______}4.42 16.45 383.96 16.91 19.05 0.0001146 0.619 1475565.51 0.35
-- -
40

Appendix 6: Microsoft excel data spreadsheet 2
Tamb Q.y,(KW) Qs,new(KW) Qb(KW) Qs,max Qact
23 57.29 8206.29 586.22 8792.50 8149.80 24 76.38 8225.38 567.12 8792.50 8149.80 25 95.48 8244.48 548.03 8792.50 8149.80 26 114.57 8263.57 528.93 8792.50 8149.80 27 133.67 8282.67 509.83 8792.50 8149.80 28 152.76 8301.76 490.74 8792.50 8149.80 29 171.86 8320.86 471.65 8792.50 8149.80 30 190.95 8339.95 452.55 8792.50 8149.80 31 210.05 8359.05 433.46 8792.50 8149.80
32 229.14 8378.14 414.36 8792.50 8149.80
33 248.24 8397.24 395.26 8792.50 8149.80
34 267.33 8416.33 376.17 8792.50 8149.80 35 286.43 8435.43 357.08 8792.50 8149.80 36 305.52 8454.52 337.98 8792.50 8149.80 37 324.62 8473.62 318.89 8792.50 8149.80 38 343.71 8492.71 299.79 8792.50 8149.80
41