development of an improved, fast throughput, test …€¦ · fernando perez perez de obanos bsc...
TRANSCRIPT

! 1!
DEVELOPMENT OF AN IMPROVED, FAST THROUGHPUT, TEST PROCEDURE, TO IDENTIFY THE METALLURGICAL EXTRACTIVE POTENTIAL OF GOSSANOUS AND SURFICIAL ORE DEPOSITS
CONTAINING REFRACTORY AND!REACTIVE!GOETHITE!
!
Fernando Perez Perez de Obanos
BSc (Biochem); BSc (Kinetics Biology); Diploma of Forensic Science.
!
!
!
!
!
!
!
Centre!for!Forensic!Science!
University!of!Western!Australia!!!
!
This!thesis!is!presented!for!the!degree!of!
Master!of!Forensic!Science!of!the!University!of!Western!Australia!!
!
2013
!

! 2!
ABSTRACT
Nickel (Ni) is one of the main elements used in stainless steels, coinage,
rechargeable batteries and magnets. It is an extremely important export
commodity for the Australian mining sector as the country is the fourth largest
producer of nickel internationally (90% in Western Australia). However due to
the continued use of the reserves of high-grade nickel sulphide ores, laterite
ores have now become an important source from which this element is
extracted.
The use of mineralized surficial material as a source of metals has increased in
recent years due to the diminishing availability of traditional primary
mineralization. Furthermore, because these ores occur at the surface, and
therefore have easy access for mining, they can be far more economic than
primary ores as a source of metals. This is true even though the actual
concentrations of the economic minerals are lower than in more traditional
primary ores. However, there is a significant problem associated with extraction
of metals from surficial deposits in that the relative refractory nature of goethite
(a secondary hydrated iron oxide mineral produced by weathering iron ores)
present can severely limit the extractive efficiency of both chemical and
bacteriological agents. Consequently, even relatively high grade deposits can
be extractively largely sterile. Therefore it would be economically extremely
beneficial to be able to characterise the degree of extractability, and therefore
economic value, of ores prior to establishing costly plant facilities on site and
only then find out that the ores being processed are refractory. At present the
test procedures involved in determining the extraction potential of these ores
includes processes that can last over six months and the expenditure of a

! 3!
significant amount of money with concomitant waste of time if the ores prove to
be largely economically un-extractable. Characterization of nickel laterite ores
suited to heap leach processing is therefore important in order to select those
that are the most reactive and provide the highest recovery of the metal.
Heap leaching, albeit an expensive and time consuming process, is the main
technique used to extract Ni from nickel laterites. Consequently, the research
detailed in this thesis is designed to develop a fast extractive chemical leaching
protocol to assess the reactiveness of nickel laterites to heap leaching regimes
and thereby overcome the significant expenditure and time requirements
associated with the traditional longer term field trials now used to determine
nickel extractability.

! 4!
ACKNOWLEDGEMENTS
First of all I will like to thank my two friends and supervisors Professor John Watling
and Sven Fjastad, without their help and patience I couldn’t have done it. Also I will
like to thank the Centre for Forensic Science, in particular Professors Ian Dadour and
Daniel Franklin for their help and advice. Secondly I will like to thank Dr H R Watling of
CSIRO Division of Process Science and Engineering for providing the ores and for
technical support throughout the project.
Thank you also all the team of TSW Analytical, all the students, Alex Martin, Natasha
Kreitals and Matthew Murphy and all the staff, Allen Thomas, Christopher May,
Cameron and Rachel Scadding, Anna Bradley and Jenna Valentin.
I will also like to thank the staff from Townsend Lodge for helping me since I arrived in
Australia, and helping me in every single thing, especially Raylene Hindle, Maeve
O’Sullivan and Nickolas Kerr.
Finally I will like to thank all my friends and family back home, specially my brother
Alejandro Perez, my mother and father Teresa and Carlos Perez. Thank you for being
always there and for keeping the faith, even in the most difficult circumstances, Thank
you for being such as good model to learn from and for always being there supporting
me.

! 5!
TABLE OF CONTENTS
Abstract 2
Acknowledgements 4
Table of contents 5
List of Figures 8
List of Tables 10
Chapter 1: Introduction 11
1.1 Background of to the project 11
1.2 Nickel market 15
1.3 Source of Nickel 17
1.3.1 Genesis of lateritic ores 19 1.3.2 Genesis of sulphide ores 20
1.4 Techniques for the extraction of nickel 20
1.5 Techniques for refining nickel 23
1.6 Pre-treatment of the ore 24
1.7 Lateritic ores 25 1.7.1 Hydrometallurgy of lateritic ores 25 1.8 Goethite 27 1.9 Summary of the problem 28 1.10 Aim of this research 29
Chapter 2: Experimental 31
2.1 Equipment 31
2.1.1 Inductive coupled plasma Atomic Emission Spectroscopy (ICP-AES) 32
2.1.2 Inductively Couple Plasma Mass Spectrometry (ICP-MS) 33
2.1.3 X-Ray Diffraction (XRD) 34
2.2 Background to the samples 35
2.3 Phase 1: Preliminarily Experiment using sample A and B 36
2.3.1 General 36
2.3.2 Total Dissolution 37
2.3.3 Inorganic Acid Leach-General 38

! 6!
2.3.3.1 Sulphuric Acid (H2SO4) Leach 38
2.3.3.2 Hydrochloric Acid (HCl) Leach 39
2.3.3.3 Aqua Regia Acid Leach 39
2.3.3.4 Nitric Acid (HNO3) Leach 39
2.3.4 Organic Leach 39
2.3.4.1 Oxalic Acid (H2C2O4) Leach 39
2.3.4.2 Citric Acid Leach (C6H8O7) Leach 40
2.3.4.3 Tartaric Acid Leach (H6C4O6 ) Leach 40
2.3.5 Mixed Acids 40
2.3.5.1 10% v/v Sulphuric (H2SO4) and 0.5M oxalic Acid (H2C2O4) Leach 40
2.3.5.2 10% v/v Sulphuric (H2SO4) and 0.5M citric acid (C6H8O7) Acid Leach 40
2.3.5.3 10% v/v Sulphuric (H2SO4) and 0.5M tartaric acid (H6C4O6 ) Acid Leach 41
2.3.7 Oxidation leach 41
2.3.7.1 Sulphuric Acid (H2SO4) Leach 41
2.3.7.2 Hydrochloric Acid (HCl) Leach 41
2.3.7.3 Aqua Regia Acid Leach 42
2.3.7.4 Nitric Acid (HNO3) Leach 42
2.4 XRD 42
2.5 Phase 2: validation samples. 42
2.6 Sample and Data Analysis 43
Chapter 3: Results and Discussion 44
3.1 Phase 1: Preliminarily Experiment using “Ore Sample A” and “Ore Sample B” 44
3.1.1 Total Dissolution 45
3.1.2 Inorganic Acid Leaching 45
3.1.2.1 Sulphuric Acid Leach 45
3.1.2.2 Hydrochloric Acid Leach 47
3.1.2.3 Aqua Regia Acid Leach 49
3.1.2.4 Nitric Acid Leach 50
3.1.2.5 Summary of Inorganic Leach Experiments 51

! 7!
3.1.3 Organic Acid Leaching 52
3.1.3.1. Oxalic Acid Leach 52
3.1.3.2 Citric Acid Leach 54
3.1.3.3 Tartaric Acid Leach 55
3.1.3.4 Summary Organic Acid based Leaching 58
3.1.4 Mixed Organic and Sulfuric Acid Leaching 61
3.1.4.1. Sulfuric Acid and Oxalic Acid Leach 61
3.1.4.2 Sulphuric acid and Citric Acid Leach 62
3.1.4.3 Sulphuric and Tartaric Acid Leach 63
3.1.1.4 Summary for the Mixed Acid Leaches 64
3.1.5 Single inorganic acid Leaching following pre-oxidation of ore materials 66
3.1.5.1 20% Sulfuric Acid Leach of Pre-oxidised Ore Samples 68
3.1.5.2 20% Hydrochloric Leach of Pre-oxidised Ore Samples 69
3.1.5.3 20% Aqua Regia Acid Leach of Pre-oxidised Ore Samples 70
3.1.5.4 20% Aqua Regia Acid Leach of Pre-oxidised Ore Samples 71
3.1.5.5 Comparative Leachability for all Study Analytes from “Ore Sample A”
and “Ore Sample B” Pre-oxidised Ore 72
3.1.6 Estimation of long term leachability of nickel based on short term
calibration against “standard samples” 74
Chapter 4: Conclusion & Future work 83
References 87
Appendix 91
! 8!
LIST OF FIGURES
Figure 1.1 - Use of Nickel (Bradley 2011) 12
Figure 1.2 - Australia nickel production (Hoatson et al 2006) 13
Figure 1.3 - Nickel and Copper prices since 1990-2011 (London Metal Exchange 2012) 16
Figure 1.4 - Nickel production 1950-2010 (Dalvi 2004) 18
Figure 1.5 - World nickel laterite deposits (Dalvi 2004) 19
Figure 1.6 - Genesis of a sulphide nickel deposit 20
Figure 1.7 - A schematic representation of a heap leaching process. (Oxley et al 2006) 23
Figure 1.8 - Laterite profiles from Western Australia and Indonesia (Dalvi et al 2004) 26
Figure 1.9 - Basic distance of Fe-Fe in goethite (Cornell & Schwertmann 2003.) 27
Figure 1.10 - Structure of goethite showing different projections (Cornell & Schwertmann,
2003) 28
Figure 2.1 - General representation of the experimental protocol used in this study 35
Figure 3.1 - Nickel extraction efficiency for “Ore Sample A” (1A) and “Ore Sample B”
(1B) using 20% v/v H2SO4 over a 240h period 46
Figure 3.2 - Nickel extraction efficiency for “Ore Sample A” (2A) and “Ore Sample B”
(2B) using 20% v/v HCl over a 240h period. 49
Figure 3.3 - Nickel extraction efficiency for “Ore Sample A” (3A) and “Ore Sample B”
(3B) using 20% v/v Aqua Regia over a 240h period. 49
Figure 3.4 - Nickel extraction efficiency for “Ore Sample A” (4A) and “Ore Sample B”
(4B) using 20% v/v nitric acid over a 240h period 50
Figure 3.5 - Comparison of the nickel extraction efficiencies for all inorganic acid
based leach solutions 52
Figure 3.6 - Analyte leach curves for “Ore Sample A” and “Ore Sample B” using selected
molarity oxalic acid solutions 53
Figure 3.7 - Analyte leach curves for “Ore Sample A” and “Ore Sample B” using selected
molarity citric acid solutions 56
Figure 3.8 - Analyte leach curves for “Ore Sample A” and “Ore Sample B” using selected
molarity tartaric acid solutions 57
Figure 3.9 - Comparison of Leach Efficiencies of 1M Organic Acid Leach Solutions 60
Figure 3.10 - Extraction efficiency for oxalic acid/sulfuric acid mixed acid leaching of
“Ore Sample A” and “Ore Sample B” 62
Figure 3.11 - Extraction efficiency for sulfuric acid/citric acid mixed acid leaching of
“Ore Sample A” and “Ore Sample B” 63
Figure 3.12 - Extraction efficiency for sulfuric acid/tartaric acid mixed acid leaching of
“Ore Sample A” and “Ore Sample B” 64
Figure 3.13 - Extraction efficiencies for nickel from “Ore Sample A” and “Ore Sample B”
using three different mixed acid leach solutions 65

! 9!
Figure 3.14 - X-ray diffractograms of samples “Ore Sample A” (A and B) and “Ore Sample B”
(C and D) before and after heating at 1000oC for 2 hours. Green lines
correspond to Goethite and purple to Hematite. 67
Figure 3.15 - Variation in 20% v/v sulfuric acid based nickel extractability for ore samples “Ore Sample
A” and “Ore Sample B” following pre-oxidation of the ores at selected temperatures for a two hour
period. 68
Figure 3.16 - Variation in 20% v/v hydrochloric acid based nickel extractability for ore samples “Ore
Sample B” and “Ore Sample A” following pre-oxidation of the ores at selected temperatures for a two
hour 69
Figure 3.17 - Variation in 20% v/v Aqua Regia acid based nickel extractability for ore samples “Ore
Sample A” and “Ore Sample B” following pre-oxidation of the ores at selected temperatures for a two
hour period. 70
Figure 3.18 - Variation in 20% v/v nitric acid based nickel extractability for ore samples
“Ore Sample A” and “Ore Sample B” following pre-oxidation of the ores at selected temperatures for a
two hour period. 71
Figure 3.19 - Calibration leach curves for “Ore Samples C, D, F, G and H” in 20% sulfuric acid for
selected time periods – ICP-AES data. 78
Figure 3.20 - Calibration leach curves for “Ore Samples C, D, F, G and H” in 20% sulfuric acid for
selected time periods – ICP-MS data. 79
Figure 3.21 - Calibration leach curves for “Ore Samples C, D, F, G and H” and unknown “Ore sample
E”, in 20% sulfuric acid for selected time periods – ICP-MS data. 80
Figure 3.22 - Calibration leach curves for “Ore Samples C, D, F, G and H” and unknown “Ore sample
E”, in 20% sulfuric acid for selected time periods – ICP-MS data. 81
Figure 3.23 - Calibration curves produced for the relative relationship between the extractability of
nickel using both ICP-AES and ICP-MS and describing the relationship between long and short term
extractability of this metal from various refractory ores 82

! 10!
LIST OF TABLES
Table 1.1 - Presence of Nickel in different Minerals (Bolt et al 1967) 14
Table 2.1 - Analytical emission lines used in this study 32
Table 2.2 - List of isotopes used in the ICP-MS based analytical procedure 34
Table 2.3 - Description of samples used in this study together with their nickel extraction efficiencies as determined by CSIRO Division of Process Science and Engineering 36
Table 3.1 - Comparison of analytical data for Certified Reference Materials SARM1 and SARM2 obtained for this study. Results expressed as parts per million in the original material. 45
Table 3.2 - Data for Fe, Ni, Co and Mn concentrations in Samples “Ore Sample A” and “Ore Sample B” 45
Table 3.3 - Leach data for extraction efficiencies of all study analytes after a 240h leach period detailing all inorganic acid based leach solutions studied. 51
Table 3.4 - Summary of results for leaching “Ore Sample A” and “Ore Sample B” ores using selected organic acids under pre-determined molarity concentrations. 59
Table 3.5 - Summary of the extraction efficiencies of all study analytes from “Ore Sample A” and “Ore Sample B” using mixed acid leaches. 65
Table 3.6 - Leach data for all study analytes from samples “Ore Sample A” and “Ore Sample B” following pre-oxidation at selected temperatures for two hours. 73
Table 3.7 - Long Term Nickel Extractability of Analytes from the “Standard Samples” 75

! 11!
CHAPTER 1
INTRODUCTION
1.1 BACKGROUND TO THE PROJECT Metals have been a significant part of human culture for many thousands of years with
specific cultural periods being named after the metal predominant in society at the time.
The earliest evidence of the European “Copper Age” appears in Belevode, Serbia
(Radivojević et al 2010). Copper smelting took place in this area some 7000 BP and the
recovery of cast objects here challenges the concept of the origin of extractive metallurgy
as being in the Near East. Blending of metals (copper and tin) technology has been
recognized from the early Bronze Age (3800BP) to the start of the Iron Age (2750BP)
(Gimbutas 1965), However, only recently has the discovery of steel, and the development
of a commercial process for its manufacture, encouraged the use of a wide variety of
chemical elements in the manufacture of ferroalloys and an increase in the extraction and
beneficiation of elements such as nickel, cobalt, vanadium and chromium (Mudd 2010).
The extraction and beneficiation of one such element, nickel, from refractory ores is the
subject of this thesis.
Nickel was discovered in 1751 by Axel Fredrik Cronstedt, a Swedish metallurgist and
chemist, and is one of the main elements used in stainless steel production, coinage,
rechargeable batteries and magnets (Cunat 2004). Nickel is an extremely important export
commodity for the Australian mining sector as the country is the fourth largest producer of
nickel internationally (90% in Western Australia), (Mudd 2009). Nickel plays a very
important role in today’s society with approximately 61% of the nickel extracted used to
produce nickel steel, 9% for alloys such as German lead or Nichrome with the rest,
approximately 30%, being used in electrical components and batteries (Figure. 1.1). Such

! 12!
a widespread use can be explained in part by nickel’s characteristic slow oxidation rate at
ambient temperature, a characteristic that it also imparts to alloying metals where addition
of nickel to these mixtures adds both strength and corrosion resistance (Lee et al 2012).
Figure 1.1. Use of Nickel (Bradley 2011)
Nickel has five isotopes, 58Ni (68.3%), 60Ni (26.1%), 61Ni (1.13%), 62Ni (3.59%) and 64Ni
(0.91%), and is found in combination with elements such as sulfur, arsenic and iron, producing
naturally occurring minerals such as pentlandite (Ni,Fe)9S8, nickeline (NiAs) and millerite
(NiS), the main nickel minerals are detailed in Table 1.1. Nickel is predominantly extracted
from two types of ore deposits, magmatic sulphide deposits where it is extracted from
pentlandite, and secondly from laterites where garnierite (Ni, Mg)3Si2O5(OH)4 and limonite (Fe,
Ni)O(OH) are the main ores (Dalvi et al 2004).
Due to their higher extraction efficiency and the lower cost of extraction, the majority of the
worldwide production of Ni is derived from processing sulphide rich deposits (Figure 1.2).

! 13!
However, this kind of deposit is becoming scarce and therefore alternative nickel deposits,
such as laterites, have to be considered as alternative sources even though they are generally
lower in nickel and processing costs are higher (McDonald et al 2008).
Figure 1.2. Australia nickel production (Hoatson et al 2006)
Nickel is one of the main elements used in stainless steels, coinage, rechargeable batteries
and magnets (Pearce 1987). Is an extremely important export commodity for the Australian
mining sector as the country is the fourth largest producer of nickel internationally (90% in
Western Australia) (Watling et al 2011). However due to the continued use of the reserves of
high-grade nickel sulphide ores, laterite ores have now become an important source from
which this element is extracted (Chander.1982).

! 14!
Table 1.1. Presence of Nickel in different Minerals (Bolt et al 1967)
Formula % of Nickel
Sulfides
Pentlandite (Ni,Fe)9S8 34.2 More common mined
Millerite NiS 64.7 Minor constituents
Heazlewoodite Ni3S2 73.3 Highest nickel content
Linnacite series (Fe,Co,Ni)3S4 Variable Minor constituent
Polydymite Ni3S4 57.9
Violarite Ni2FeS4 38.9
Siegenite (Co,Ni)3S4 28.9
Arsenides Typical from Nickel-bearing
cobalt ores
Niccolite NiAs 43.9
Maucherite Ni11As8 51.9
Rammelsbergite NiAs2 28.1
Gersdorffite NiAsS 35.4
Antimonide
Breithauptite NiSb 32.5
Arsenate
Annabergite Ni3As2O8·8H2O 29.4
Silicate and Oxide
Garnierite (Ni,Mg)6Si4O10(OH)8 Variable (up to
47%)
Most abundant nickel
carrier in silicate ores
Nickeliferous Low concentration of Ni
Laterite deposits
Limonite (Fe,Ni)O(OH)·nH2O Low

! 15!
The use of mineralized surficial material as a source of metals has increased in recent
years due to the diminishing availability of traditional primary mineralization. Furthermore,
because these ores occur at the surface, and therefore have easy access for mining, they
can be far more economic than primary ores as a source of metals (Tang & Valix 2006).
This is true even though the actual concentrations of the economic minerals in these ores
are lower than in more traditional primary ores. However, there is a significant problem
associated with extraction of metals from surficial deposits in that the relative refractory
nature of goethite (a secondary hydrated iron oxide mineral produced by weathering iron
ores) present can severely limit the extractive efficiency of both chemical and
bacteriological agents (Tzeferis 1994). Consequently, even relatively high grade deposits
can be extractively and economically largely sterile.
Because of this aspect it would be economically extremely beneficial to be able to
characterise the degree of extractability, and therefore economic value, of ores prior to
establishing costly plant facilities on site and only then find out that the ore being
processed is refractory. At present the test procedures involved in determining the
extraction potential of these ores include processes that can last over six months and the
expenditure of a significant amount of money. The concomitant waste of time and money if
the ores prove to be largely economically un-extractable (Chander 1982; Norgate &
Jahanshahi 2010), can be considerable. Characterization of nickel laterite ores suited to
heap leach processing is therefore important in order to select those that are the most
reactive and provide the highest recovery of the metal.
1.2 NICKEL MARKET.
Subsequence to its discovery in the eighteenth century, nickel production and use has
increased enormously. However, nickel production and consumption seem to reflect periods
of prosperity and recession and the trends in its production seem to closely mirror those of the
steel industry (Figure. 1.3). Nickel was first extracted in Germany (1823) followed by America

! 16!
(1830) and Sweden (1838). In 1902, Charles Schwab opened “the International Nickel
Company of Canada (INCO), a company which played a major role world-wide in nickel
production over the following 50 years (Bolt et al, 1967. p.26).
Figure 1.3 Nickel and Copper prices since 1990-2011 (London Metal Exchange 2012)
The First World War was a period of high nickel production where most of the nickel was
consumed for military purposes. In 1929, due to the economic crisis in Europe and America,
production decreased and by 1934, 81% of the nickel worldwide was produced in Canada with
the remaining production from New Caledonia (Pacific) where nickel was mainly mined from
silicate ore material.
During the Second World War, nickel was produced and refined in a number of countries
including Germany and especially Russia which expanded both its mining and refining
capability, primarily for military use, until 1945. After the Second World War, between 1945
and 1970, there was a significant research push to establish different uses for nickel and by
1950, Russia was responsible for about 20% of the world’s production. Nickel production over
the next 25 years was influenced primarily by the Korean War (1950-1953). During this period,
new high strength alloys were created primarily for the military and aerospace industries. In

! 17!
addition, new ways of mining were also developed and went hand in hand with modernisation
of smelting and refining processes (Bolt et al 1967. P.74). During the 1960’s Australia and
Indonesia started exploring for nickel deposits and by the end of 1970 several countries such
as Greece, Peru and Venezuela where also producing nickel (Jaques et al 2005). This
expansion in nickel exploration and production generated a total world production in 1970
which was double the production in 1960. This huge increase in nickel production was the
main cause of a significant drop in the price of nickel in 1976 and nickel production essentially
stopped from around this period .
In 1985, twenty three countries were producing nickel with Australia producing approximately
10% of nickel worldwide. From 2001 to 2007 the price of nickel increased twelvefold. This was
due to three main factors: Chinas open market and the in demand for steel, the appearance of
multinational auto industries around the world and the increase of the Indian technology sector
during the latter half of the decade. Nowadays, the price of nickel is stable at approximately
$20,000 AUD/Tonne (London Metal Exchange 2012), mainly due to the fact that new mines
are being opened and new and better metallurgical technology has been developed to
increase the production of this element (Mudd G.M, 2007).
1.3 SOURCE OF NICKEL.
Nickel in nature is associated with two main sources, basic or mafic rocks that usually contain
a high concentration of nickel within iron and magnesium rich minerals, and acid or silicic
rocks where the nickel is largely present as sulfides. The concentration of nickel in these types
of igneous rocks depends on the relationship between iron/magnesium and silicon/aluminium
(Dean 2006.).
Nickel is economically distributed in two types of ores, primary or silicate rich ores where the
nickel has been introduced during petrogenesis as a sulfide mineral, (Reference 14), and
secondary or lateritic ores, where the nickel is present as an oxide or hydrated oxide, nearly
always associated with iron, following weathering of the primary ore minerals. To date,

! 18!
extraction of nickel from the primary sulfides is the main economic route for the production of
nickel (Nickel 2008).
Figure 1.4 Nickel production 1950-2010 (Dalvi 2004)
Pyrrhotite (FeS to Fe7S8) is an extremely important mineral, often associated with sulphide
nickel ores, and is usually more abundant in its own right than any primary nickel. In
pyrrhotite, a small amount of iron can be substituted by nickel. This mineral is important
because it is magnetic and therefore is amenable to geophysical prospecting to determine the
position of a nickel rich ore body (Bolt et al 1967).
It is also is important to realise that nickel rich deposits can also be found on the ocean floor
associated with manganese nodules. The two most important ores, sulphides and laterites
need to be processed in totally different ways from one another in order to recover as much
nickel as possible

! 19!
1.3.1 Genesis of Lateritic Nickel ores
This type of ore is generated by a process called lateritic sub-aerial oxidative weathering. The
basis of this process is that a rock, exposed to the atmosphere, is gradually affected by
different environmental factors such as heat, water and air (oxygen) that generate mechanical
and chemical erosion. The original rock is broken down into oxide based minerals which can,
depending on their solubility, be sequentially taken into solution and either transported away
from the primary deposit, if they are soluble, or remain in situ and are concentrated. The result
of this oxidation and transportation process is the production of lateritic deposits rich in both
nickel and iron oxides (Howard-White 1963).
The iron oxides precipitate as ferric hydroxide and eventually lose water to create hematite
(Fe2O3) and goethite (FeO(OH)). During the course of thousands to millions of years, erosion
continues affecting this iron-nickel rich layer resulting in build up of significantly thick iron oxide
rich layers which are also rich in nickel. Due to the immense size of the deposits and their
worldwide occurrence, this type of ore, is considered as the future source of nickel (Figure.
1.5).
Figure 1.5. World nickel laterite deposits (Dalvi 2004).

! 20!
1.3.2 Genesis of Sulfide Nickel ores.
The genesis of nickel sulfide ores is controlled by the solubility of nickel sulphide in the liquid
produced when mafic and ultramafic rocks melt. These types of ores are hosted in rocks that
are usually high in iron and magnesium and relatively low in silicon (e.g., gabbro, peridotite)
(Bames & Lightfoor 2005). Nickel is a chalcophile element (like sulphur) and consequently,
when a gabbroic or peridotitic magma forms, sulfides of iron, copper and nickel form an
immiscible association which, being heavier than the parent rock-melt, drop to the base of the
melt carrying with them elements such as Co, Pd, Pt, Au, and Rh (mainly group VIII). Here
there elements become more and more concentrated in this sulfide rich oxide liquid, forming
layers which are essentially the ore zones (Melekestseca et al 2013).
Figure 1.6. Genesis of a sulphide nickel deposit.
1.4 Techniques for the extraction of Nickel.
Today, the majority of nickel is extracted from sulfide ores. These ores, while expensive to
extract, are usually high grade. Because of this aspect, extraction costs per tonne of nickel are
less than those associated with the production of nickel from lateritic ores (Kaya & Topkaya,
2011). Usually nickel is extracted from the ore by roasting and different reduction processes

! 21!
that generate a nickel purity of approximately 75%, this purity, for some stainless-steel
producing companies is directly suitable for steel production. The type of process, and
techniques uses for the extraction of nickel, depends on the characteristics of the ore.
Sulphide ores
Sulphides ores are crushed and milled to a fine powder prior to flotation and concentration of
the nickel rich ore minerals. The concentrate is roasted to convert the sulfide minerals into
oxides. Most of these types of ores are pre-concentrated using froth flotation process followed
by a pyrometallurgical extraction. However, hydrometallurgical processes followed by the
Sherritt-Gordon process (Plasket & Romanchuk, 1978) can also be used. Depending on the
purity of the final metal product required, the process can undergo further refining stages to
obtain even pure metal.
Lateritic Ores.
A) Pyrometallurgical process: Lateritic ores that are extracted using this technique
usually require pre-drying, calcining/reduction and electrical furnace smelting, with
nickel being recovered from this process as a ferro-nickel matte. However this type
of extraction is quite difficult because the nickel-bearing minerals (eg: garnierites
and saprolitic deposits) may often be finely disseminated throughout the ore body.
In order to optimize the amount of electric energy used for smelting, it is important
to first reduce the moisture (which can be up to 40%) and which is lattice-bound to
the iron-hydroxide minerals. Another problem that must be taken into consideration
is the chemical and metallurgy diversity of laterite ores, as the SiO2/MgO ratio and
iron content can influence the production of slag (and therefore if not controlled,
adversely affect the production costs). The dehydration and feedstock control
! 22!
processes are both energy and time intensive, however the recovery of nickel can
be increased to nearly 95 % and cobalt to 50% if these processes are controlled
correctly. Nowadays, there is almost twice as much hydrometallurgical processing
as pyrometallurgical treatment. In the pyrometallurgical process, the ore is roasted
in the presence of carbon, sulfur is converted to sulfur dioxide and released as a
gas which is trapped and eventually reacted with water to from sulfuric acid. The
final product is a metal based concentrate.
B) Hydrometallurgical Process: Usually saprolitic laterites have a higher concentration
of nickel in the upper completely weathered zones (Agatzini-Leonardou et all,
2009). However, the presence of magnesium in high concentration, increases the
acid consumption, and therefore, for this technique, limonitic laterites are preferred.
Different hydrometallurgical processes are used depending on the nature of the
ore:
a. Caron process: Mixture of pyro and hydrometallurgy that involve roasting
followed by an ammonia/ammonium carbonate leaching stage which dissolves
the cobalt and nickel as ammine complexes (Lower overall Ni & Co extraction)
(Graaf, 1980).
b. Atmospheric-pressure acid leaching process (AI) (Buyukakinci & Topkaya
2009). This process sometimes involves the use of sulphuric acid leaching but
can involve solely ammoniacal leaching that precipitates the nickel as an
hydroxide.
c. High-pressure acid leaching (HPAL): Used in some Australian projects such as
Cawse or Murrin Murrin. This is one of the best extraction techniques for these
kinds of ore, providing an extraction efficiency for Ni & Co of approximately
90%. (Kaya & Topkaya 2011)

! 23!
d. Heap leaching (HL) (Figure 1.7): This process involves the use of limonitic and
saprolitic ores. This method involves the use of large amounts of acid over a
long period of time, however, if applied correctly can be an economically viable
process. In using this technique the grain size of the ore plays and important
role, therefore crushing the ore into different grain sizes is cruzial in order to
facilitate acid attack and minimize channelling (Ghorbani et al 2011). However,
limonitic ores, containing refractory goethite, sometimes do not leach well,
representing a loss of money to the company undertaking beneficiation
(Dhawan et al 2013).
Figure 1.7 A schematic representation of a heap leaching process. (Oxley et al 2006).
1.5 Techniques for refining of Nickel.
Once the nickel is extracted, depending on the purpose for which it is ultimately destined, the
concentrate can undergo different refining process that will generate a high purity nickel
product. Some of these methods involve:
A) Electrometallurgy: This process involves mainly electrowinning, electro refining and
fused salt electrolysis. Electrowinning recovers materials from aqueous solution, and is usually
one of the last stages of the hydrometallurgical process. The process uses a cathode of the
metal of interest. In fused salt electrolysis, the metal is dissolved into a salt that acts as an

! 24!
electrolyte and the value metal is collected on the cathode of the cell, (usually using high
temperature). Electro-refining is a process involving dissolution of an impure metallic anode
and the producion of a high purity cathode (Evans 2003).
B) Vapometallurgy: At a temperature between 50oC and 100oC, Ni can be combined with
four molecules of CO to create nickel tetracarbonyl (Frank et al. 2011). Nickel tetracarbonyl is
volatile and can be distilled from the ore at approximately 50oC and then either condensed
and collected or dissociated at temperatures between 250-600oC back to metallic nickel with
release of carbon monoxide. The iron and cobalt carbonyls tend to decompose before
evaporating and as such are left behind in the ore to be either processed at another stage or
simply discarded.
Ni+4CO = Ni(Co)4 (50oC)
Ni(Co)4 = Ni + 4CO (250oC)
In choosing a method for beneficiation, several characteristics need to be considered
including the expense of the chemicals, the facility in which the process needs to take place,
transport of the ore and type of ore. Therefore, each case can be similar or totally different
and must be costed on its own merit (Mishra 2001).
1.6 Pre-treatment of the ore The initial stage of ore processing is mechanical breakdown and separation of the ore from
the unmineralized material (gangue). The amount of comminution depends on the grain size
of the mineralized material, with the smaller grain sized ore minerals requiring finer
comminution to facilitate separation from gangue. Firstly, the ore is broken into medium to fine
grained particles, using a jaw or gyratory crusher. This process facilitates liberation of the ore
from large sized gangue material. Following this, the ore is ground using a rod mill and/or ball
mill which is usually attached to a water spray to avoid the problem of dust. The final stage

! 25!
often involves gravity flotation or magnetic separation. These processes take advantage of the
relative ore/gangue friability differences. Concentration for the ore minerals can be achieved
using, for example, magnets or slurry separation using variations in the magnetic potential of
the ore minerals with respect to the gangue and also differences in the density and particle
shape between these materials (Bolt et al, 1967).
Oxide ores are more expensive to process than sulfide ores, not only because they are
essentially low-grade but also because techniques such as flotation or magnetic separation
cannot be used to concentrate them due to the physical and chemical nature of the ore
material. In addition to this, naturally occurring iron oxides usually contain high levels of water
which require removal before processing and therefore increases energy costs.
Compensating factors at the mine site (e.g. easy mining and transport) are factors which,
together with the extremely extensive nature of the deposits, make the processing of this ore
type more attractive by employing economies of scale (Kaya & Topkaya 2011).
1.7 Lateritic Ores
There are two types of oxide ores, one is limonitic, and usually found close to the surface, and
the other is a silicate type found at depth. The limonitic type ore consists of a wide variety of
ferric oxide minerals (Figure. 1.8), particularly limonite, where the nickel has replaced iron in
some lattice sites ((Fe,Ni)O(OH)*nH2O). In the silicate type ore, nickel is associated with
silicate minerals, particularly serpentine (Mg6Si4O10(OH)8) (Basile et al 2010).
1.7.1 Hydrometallurgy of lateritic ores.
Hydrometallurgical extraction for nickel from laterite ores may involve roasting the ore in the
presence of sulphate and chloride ions and subsequently reducing the nickel product directly

! 26!
to a metal, or leaching the ore either at room or elevated temperatures and pressures using
sulphuric, hydrochloric and nitric acids.
Figure 1.8. Laterite profiles from Western Australia and Indonesia (Dalvi et al 2004).
Pyrometallurgical processing of laterite ore is expensive and not usually considered. Instead,
direct leaching (hydrometallurgical extraction) of the concentrate or the ore itself, is the
preferred option. The leaching can be achieved using mineral acids or other suitable solvents
or may involve bacterial leaching (Castro et al 2000).
The main ore containing mineral in nickel laterites is goethite (Chang et al. 2010) and it is the
degree to which this mineral sequesters the nickel into its lattice that is the main problem
when it comes to beneficiation for nickel rich laterites. To understand the problem it is first
necessary to consider the mineralogical and chemical characteristics of goethite.

! 27!
1.8 Goethite
Iron oxides are created by a process of aerobic weathering of the primary iron minerals
contained in magmatic rocks. There are sixteen different hydroxy-oxides of iron common in
nature and their relative abundance in a lateritic nickel ore is dependent on the conditions
under which they were created during the weathering process (Cornell, M. Schwertmann, U.
2003). Goethite (α-FeOOH) (Figure.1.9) is one of the predominant iron oxides found in lateritic
ores. Its structure is based on a hexagonal close packing (hcp) cell (diaspore symmetry) and
as such is very stable at ambient temperature. Goethite is a non-stoichiomentric compound
with a variable crystalline structure (Figure. 1.10) and chemical characteristics (Cornell &
Schwertmann, 2003). Because of the variability of the crystal structure and the fact that
substitution of elements such as manganese, aluminium and nickel can occur for iron in this
lattice, goethite can apparently be passivated to leaching.
.
Figure 1.9 Basic distance of Fe-Fe in goethite (Cornell & Schwertmann 2003.).
Consequently nickel extraction efficiencies can range from a few percent upwards without any
apparent change in the appearance of the ore. Consequently, it is of fundamental importance
to establish a fast test to determine the percentages of refractory and non-refractory goethite
present in an ore to be able to indicate the profitability for final nickel extraction. This
information should ideally be made available to plant metallurgist before a significant expense
is incurred in setting up leaching situations on site for essentially refractory ores.

! 28!
Figure 1.10. Structure of goethite showing different projections (Cornell &
Schwertmann, 2003)
1.9 Summary of the problem
The use of mineralized lateritic surficial material as a source of metals has increased in recent
years due to the diminishing availability of traditional primary sulfide based mineralization.
Furthermore, because these ores occur at the surface and are therefore easily accessible,
they can be far more economic than primary ores as a source of metals. This is true even
though the actual concentrations of the economic minerals in laterites are lower than in the
more traditional primary sulfide ores.
However, there is a significant problem associated with extraction of metals from surficial
oxide deposits in that the relative refractory nature of the primary nickel rich mineral, goethite,
a secondary hydrated iron oxide mineral produced by weathering iron ores, can severely limit

! 29!
the extractive efficiency of both chemical and bacteriological agents. Consequently, even
relatively high grade deposits can be rendered extractively uneconomic depending on the
percentages of refractory goethite present.
With this obviously significant problem in mind, it would be economically extremely beneficial
to be able to characterise the degree of extractability, and therefore economic value, of ores
prior to establishing costly plant facilities on site and only then find out that the ore being
processed is refractory. At present the test procedures involved in determining the extraction
potential of these ores includes processes that can last over six months and the expenditure
of a significant amount of money; with concomitant waste of time if the ores prove to be
largely economically un-extractable. Characterization of nickel laterite ores, suited to heap
leach processing, is therefore important in order to select those that are the most reactive and
provide the highest recovery of the metal.
Consequently, the research detailed in this thesis is designed to try and develop a fast
extractive chemical leaching protocol to assess the reactiveness of nickel laterites for heap
leaching regimes and thereby overcome the significant expenditure and time requirements
associated with the traditional longer-term field trials currently used to determine nickel
extractability.
1.10 Aim of this research
The purpose for the current research is to develop a fast, economic and easy to perform test
to determine the extractability of nickel from nickel laterites which will identify and quantify the
amount of both refractory and non refractory goethite. Initially, different chemical leaching
agents (weak and strong acids, complexation compounds and chelation compounds) were
trialled on selected ores that are known to be refractive and non-refractive with respect to
nickel extraction. These ores were supplied by CSIRO Division of Process Science and
Engineering. Staff from this Division of CSIRO jointly supervised the project. The extraction
chemicals were trialled individually and in combination and at different pH levels where

! 30!
possible. In addition, the crystal structure of the goethite will also be investigated to establish if
crystalline structure affects the reactivity of the goethite. This detail of information will possibly
facilitate:
1 Understanding how nickel is bound in refractory and non-refractory goethite.
2 Determination of the optimum extraction method and leach conditions necessary to
separate the nickel from the goethite.
3 Determining how calcination affects the leachability of goethite.
4 Developing a mathematical model, that can be used on material that has been leached
between 48 and 250 hours, to establish the ultimate extraction efficiencies for nickel from
different ores that contain goethite.
It must be noted that this project is not designed to develop a new leaching technique for ores
that are rich in refractory goethite. It is designed simply to develop a fast predictive technique
that will establish the potential of ores to be leached by existing processes. Consequently, the
chemical mixtures that are used are extremely diverse as far the purpose of this study; they
do not have to be economic. Data from this study will be applied to produce a predictive model
of ore extractability. If successful, any developed technique could be used by mining
companies to quickly establish the extent to which an ore is chemically leachable and thereby
assess the economic potential of these surficial deposits in a far more efficient, cost effective
and timely manner.

! 31!
CHAPTER 2
EXPERIMENTAL
2.1 Equipment
Three main analytical techniques were use during this research, Inductively Couple Plasma
Mass Spectrometry (ICP-MS), Inductive coupled plasma Atomic Emission Spectroscopy (ICP-
AES) and X-Ray Diffraction (XRD).
All chemically related analytical data were compared to standard leach graphs prepared
following field trials undertaken by staff from CSIRO Division of Process Science and
Engineering. Inductively Coupled Plasma Mass Spectrometry (ICP-MS) and Inductively
Coupled Plasma Atomic Emission Spectroscopy (ICP-AES) were used to determine the
elemental concentration of all study analytes in the leach experiments. Both ICP-MS and
ICP-AES have been used in previous mineral characterization studies to determine
elemental composition and are accepted analytical techniques (Kisakurek, B. et al 2004).
These techniques have variable levels of sensitivity, depending on the specific emission
lines and isotopes determined and can therefore be used to produce optimum, high
accuracy, analytical data for the study analytes. A drift solution was used for both ICP-AES
and ICP-MS analyses to ensure inter-run comparability of data and Rh and Ir (2ngmL-1 in
solution) were also used as internal standards for ICP-MS analyses to correct for both drift
and matrix effects in the samples and also to ensure inter-run comparability of data
(Saitoh, K. et al 2002). X-ray diffractometry (PANalytical Empyrean XRD) was used to
determine the mineralogy of the samples and help interpret any relationship that may exist
between hematite and goethite.

! 32!
2.1.1 Inductively Coupled Plasma Atomic Emission Spectroscopy (ICP- AES)
Inductively Coupled Plasma Atomic Emission Spectroscopy (ICP-AES) is an analytical
technique that uses an inductively coupled argon plasma to generate excited atoms and ions
which emit characteristic electromagnetic radiation specific for an individual analyte. The
technique quantifies the emission intensity of both ion and atom lines and relates these values
to a calibration curve for each analyte to quantify the relevant analyte concentration.
ICP-AES was used in this study to quantify the concentrations of Na, K, Al, Mg, Ca, and Fe as
these analytes are present at relatively high concentrations in samples and therefore
quantification does not require the high sensitivity of ICP-MS to ensure accuracy. Analytical
emission lines used in this study are detailed in Table 2.1.
Table 2.1 Analytical emission lines used in this study, wavelengths are given in
nanometres
Na 589.5 Na 818.3 Mg 279.5 Mg 285.2 Al 167.0 Al 396.1 Si 251.6 P 177.4
P 178.2 S 180.7 K 766.4 Ca 422.6 Ti 334.9 Cr 283.5 Cr 359.3 Mn 257.6
Mn 279.4 Fe 239.5 Fe 259.9 Co 230.7 Co 237.8 Ni 221.6 Ni 341.4 Cu 324.7
Zn 206.2 Zn 213.8 Sr 407.7 Ba 455.4 Pb 220.3 !! !!
Although 19 elements were determined only data for Fe are reported in this thesis. Initially, as
it was not possible to be specific as to the analytes that would assist in the interpretation of
data, as many as possible were determined using both ICP-AES and ICP-MS techniques.
Following analysis and preliminary data interpretation, a refined list of analytes was developed
and data for the unreported analytes were used for cross validation of ICP-MS data to confirm
reproducibility and accuracy of the final data sets rather than as interpretive analytes in their
own right.

! 33!
A Thermo Scientific ICAP 6000 series ICP spectrophotometer was used throughout this
thesis. Analytical solutions needed to be diluted in order to contain <2% TDS. Following
dilution, quantization is achieved with reference to data for calibration standards (0-100µgmL-
1). These standards were supplied by AccuTrace (2986 Scott Blvd Santa Clara, CA 95054,
United States) and were diluted to the appropriate range using 18MegΩ deionised water.
Redistilled nitric acid (quartz sub-boiling still made by Walhofstrasse 14, 25474 Ellerbek
Germany) was added to the final solution to give a final acid strength of 5% v/v before sample
dilution to the appropriate final volume. Analytical samples were diluted to an appropriate final
volume in the same manner.
2.1.2 Inductively Coupled Plasma Mass Spectrometry (ICP-MS)
ICP-MS was used to determine the concentration of 46 analytes. The list of isotopes and their
mass to charge ratios used (m/v) is given in Table 2.2. Although ICP-MS is an extremely
sensitive analytical technique, it is apparent that the study analytes are present at relatively
high concentration. Consequently, in this study, the technique was not being used to
determine low concentrations but more specifically to overcome spectral overlap problems,
and resulting data inaccuracy, that could occur when using ICP-AES. Nevertheless, while the
analytes eventually selected for this study were at relatively high concentrations, many of the
analytes determined were at very low levels and did require a technique with extremely high
sensitivity to be used for their accurate quantitation. As with data produced using the ICP-
AES, not all the analytes determined were directly used in data interpretation in this study. In
some cases, as with ICP-AES data, some analytes, not directly reported in the text, were used
for cross calibration and validation between the two techniques but in addition, as at the
beginning of the study the list of relevant analytes could not be established without
experimentation, it was decided to record all analytical data and eliminate data retrospectively,
that were unnecessary to the interpretation of extraction efficiency.

! 34!
The ICP-MS instrument used was an Agilent 7500 Cs Inductively Coupled Plasma Mass
Spectrometer (Agilent Technologies, Inc., Santa Clara, CA, USA). The Standards used for the
calibration were obtained from AccuTrace (2986 Scott Blvd Santa Clara, CA 95054, United
States). The instrument calibration standards (1, 2, 5 and 10 ngmL-1) were prepared by mixing
the relevant standards (taking account of insolubility criteria) and diluting them to the
appropriate concentration using 18MegΩ deionised water. The final solutions were made to
volume to contain 2% v/v quartz redistilled nitric acid. Before analysis, samples were made up
to final volume with a TDS of <500 µgmL-1 by dilution using 2% v/v quartz redistilled nitric acid,
Rh and Ir were then added to these solutions, as internal standards, to give a final
concentration of each of 2ngmL-1.
Table 2.2 List of isotopes and their m/z values used in the ICP-MS based analytical procedure
7Li 23Na 24Mg 25Mg 27Al 39K 42Ca 44Ca 45Sc 48Ti
49Ti 51V 52Cr 53Cr 55Mn 57Fe 59Co 60Ni 63Cu 64Zn
65Cu 66Zn 71Ga 72Ge 85Rb 88Sr 89Y 90Zr 91Zr 93Nb
96Mo 98Mo 118Sn 120Sn 121Sb 133Cs 138Ba 139La 140Ce 141Pr
146Nd 147Sm 153Eu 157Gd 159Tb 163Dy 165Ho 166Er 169Tm 172Yb
175Lu 178Hf 181Ta 206Pb 207Pb 208Pb 232Th 238U
Rhodium and iridium were added as internal standards to facilitate normalization of data in the
event of drift during the analytical run. Samples were diluted to the appropriate concentrations
using 2% v/v quartz redistilled nitric acid in 18MegΩ quartz redistilled water.
2.1.3 XRD
A PANalytical Empyream XRD was used to determine the mineralogical composition of the
study samples. The system operated at 10mA and 40 kV using a copper Kα source.
Sample preparation, run time and angular movement (10o 2θ to 80o 2θ) per min from start

! 35!
and finish were also pre-determined and a typical set of instrumental parameters used
throughout this study is detailed in Appendix Table 1.
2.2 Background to the samples
Laterite samples were provided by the CSIRO Division of Process Science and
Engineering. All information regarding grain size, element composition and nickel
extraction capability were also provided by CSIRO. Due to confidentiality issues sample
location cannot be provided in this thesis and samples are referred to by an alpha numeric
code only in the text. However samples with the same alpha character are from the same
deposit and the numeric character reflects a different geographic location within that
deposit.
A total of eight samples were provide to test and develop a method that could ultimately
facilitate the development of a suitable predictive protocol to determine the relative
refractory and non refractory nature of the goethite present. All the samples contain
refractory and non refractory goethite in different quantities and therefore exhibit different
extraction efficiencies. A list of the different samples with their nickel extraction efficiencies
as provide by CSIRO is given in Table 2.3.
Figure 2.1. General representation of the experimental protocol used in this study

! 36!
Table 2.3. Description of samples used in this study together with their nickel extraction efficiencies
as determined by CSIRO Division of Process Science and Engineering
Sample Description Percentage long term nickel extraction achievable
Sample H Deposit A Area 1 4%
Sample B Deposit A Area 2 8%
Sample C Deposit B Area 1 50%
Sample D Deposit C Area 1 25%
Sample E Deposit D Area 1 40%
Sample F Deposit D Area 2 40%
Sample A Deposit D Area 3 66%
Sample G Deposit E Area 1 70%
2.3 Phase 1 Preliminarily Experiment using Sample A and B.
2.3.1 General
Initial experiments to determine nickel extractability focussed on two ores, sample A and B.
These ores represented the two extremes of extractability in percentage terms, with sample A
having 69% goethite and 66% nickel extraction efficiency and sample B having 50% goethite
and 8% nickel extraction efficiency. It was considered that using ores with such disparate
nickel extraction efficiencies would facilitate the development of a preliminary model to
determine the extraction efficiency of the other ores and develop a model into which all ores
could then be incorporated or referred.
Consequently, for this preliminary stage only samples A and B were used. Initially,
samples were analysed following total digestion, to determine if there would be any
significant difference between CSIRO results and study analyses. Samples were dissolved
using aqua regia and a mixture of perchloric, nitric and hydrofluoric acids. As the samples

! 37!
have been provided already crushed to a fine powder the leach was conducted without the
additional sample modifications that are outlined previously (Li J et al 2009).
Once the total elemental concentration of the samples had been determined, three basic
generic leaching experiments, organic, inorganic and mixed organic/inorganic leaching, were
conducted both samples over a period of 240h.
In addition, these samples were leached in H2SO4 following calcination at pre-determined
temperatures (250ºC, 400ºC, 500ºC, 600ºC, 750ºC and 1000ºC). An added advantage of
using these two samples was that they were provided by CSIRO in a relatively large quantity
(approximately 200g each) making it possible to undertake a series of different leach
experiments without completely running out of sample. It must be stressed that it is extremely
difficult to obtain these ores in even relatively small quantities so a mass of this amount is
usually very difficult to obtain. Consequently they were ideal for the preliminary leach studies
as they represent this extreme range of extractability and differences between results within
the leach regimes used would be easily identifiable. XRD was also undertaken on both
samples before and after calcination at the predetermined temperatures selected.
2.3.2 Total Dissolution
To ensure accuracy of data, a total digestion was also undertaken of two South Africa
Reference Materials, SARM 1 (granite) and SARM 2 (syenite). These Certified Reference
Materials (CRM’s) were dissolved in exactly the same manner as the study samples and
comparison of the data obtained from their analysis was used to check and determine the
accuracy of the instrumental analysis protocols used in the current study. Although
accuracy of leach protocols is not really possible to determine, the determination of
analytical accuracy of the method does give a significant amount of confidence in data
used to construct the final data set. Approximately Two hundred and fifty milligrams of
each sample were accurately weighed to 3 decimal places and dissolved inside 50mL

! 38!
Teflon beakers using 20mL of a 4:1 mixture of redistilled nitric:perchloric acids and 10mL
of hydrofluoric acid. The samples were heated and left to reflux at 150oC overnight by
placing a Teflon watch glass on top of each beaker. After this, the watch glasses were
removed and the samples evaporated to incipient dryness after which 5 mL of 18 MegΩ
water were added to solubilise the residues. Finally the samples were made up to 50mL
final volume using 18MegΩ water and the final mass of solution determined by weighing to
three decimal places. Final dilution to the required TDS content, and to achieve optimum
analytical range for the analytes, was undertaken by performing a 25 fold dilution (ICP-
AES sample) and 50 fold dilution (ICP-MS sample). Data produced were used as a
reference for the potential amount of nickel that could theoretically be leached and were
compared with data from leach tests undertaken separately on each sample.
2.3.3 Inorganic Acid Leach – General
Leach tests were undertaken on samples A and B (particle size less than 75µm), using
specific acid leach solutions. Approximately 0.25g of each sample was placed into 55mL
polypropylene screw topped tubs, to which 50mL of the appropriate leach solution were
added. Duplicate extraction trials were undertaken on each sample. The tubs were sealed and
transferred to a bottle roller for a total period of 240 hours, during which time the tubes were
rolled at a constant 30rpm.
2.3.3.1 Sulphuric Acid (H2SO4) Leach
This procedure was based on the reaction of 20% v/v sulphuric acid with samples over a
period of 240 hours. The samples were rolled at 30rpm and subsamples removed at pre-
specified times throughout the run for analysis. Data for these analyses were used to produce
leach curves based on time of association of the leach solution with the sample.

! 39!
2.3.3.2 Hydrochloric Acid (HCL) Leach
Extraction protocols have already been described in section 2.3.3.1. The only modification
was that in this leach procedure 20% v/v hydrochloric acid (HCl) was used as the leach
solution.
2.3.3.3 Aqua Regia Acid Leach
Extraction protocols have already been described in section 2.3.3.1. The only modification
was that in this leach procedure a solution of Aqua Regia (1:3 HNO3 : HCl) was used as the
leach solution.
2.3.3.4 Nitric Acid (HNO3) Leach
Extraction protocols have already been described in section 2.3.3.1. The only modification
was that in this leach procedure 20% v/v nitric (HNO3) acid was used as leach solution.
2.3.4 Organic Leach-General
Similar to section 2.3.3, an organic leach was undertaken using three different organic acids,
oxalic (H2C2O4), citric (C6H8O7) and tartaric (H6C4O6 ). The concentrations trialled for these
leach experiments were 0.2, 0.5 and 1M as outlined in the literature (McKenzie, D. et al 1987).
Samples and their duplicates were placed on a bottle roller, rotating at 30rpm, and leached for
a total of 240 hours. Representative leach solutions were taken from each of these samples at
24h intervals throughout the experiment.
2.3.4.1 Oxalic Acid (H2C2O4) Leach
Similar to the extraction protocol that has already been described in section 2.3.3.1, This
procedure was based on the reaction of 0.2, 0.5 and 1M oxalic (H2C2O4) acid with samples
over a period of 240 hours. The samples were rolled at 30rpm and subsamples removed at
pre-specified times throughout the run for analysis. Data for these analyses were used to
produce leach curves based on the time of association of the leach solution with the sample.

! 40!
2.3.4.2 Citric Acid (C6H8O7) Leach
Extraction protocols have already been described in section 2.3.4.1. The only modification
was that in this leach procedure citric acid (C6H8O7) was used as the leach solution.
2.3.4.3 Tartaric Acid (H6C4O6 ) Leach
Extraction protocols have already been described in section 2.3.4.1. The only modification
was that in this leach procedure tartaric acid (H6C4O6 ) was used as the leach solution.
2.3.5 Mixed Acids
Similar to the protocol describe in section 2.3.3 and 2.3.4, samples were leached with a
mixture of 10% sulphuric and 0.5M organic acid solutions (oxalic, citric and tartaric). The
leaches were undertaken for a total time of 264h, and samples were taken at time intervals
of 24h throughout the run.
2.3.5.1 10% v/v Sulphuric (H2SO4) and 0.5M oxalic Acid (H2C2O4) Leach .
Similar to the extraction protocol that has already been described in section 2.3.4.1; this
procedure was based on the reaction between samples and 10% v/v sulphuric (H2SO4) mixed
with 0.5M oxalic acid (H2C2O4) over a period of 264 hours. The samples were rolled at 30rpm
and subsamples removed at pre-specified times throughout the run for analysis. Data for
these analyses were used to produce leach curves based on time of association of the leach
solution with the sample.
2.3.5.2 10% v/v Sulphuric (H2SO4) and 0.5M citric acid (C6H8O7) Acid Leach
Extraction protocols have already been described in section 2.3.5.1. The only modification
was that instead of sulfuric and oxalic acids, sulfuric and citric acids were used as the leach
solution.

! 41!
2.3.5.3 10% v/v Sulphuric (H2SO4) and 0.5M tartaric acid (H6C4O6 ) Acid Leach
Extraction protocols have already been described in section 2.3.5.1. The only modification
was that instead of sulfuric and oxalic acids, sulfuric and tartaric acids were used as the leach
solution.
2.3.7 Oxidation leach
To further understand the crystalline structure of the laterite, and aid in the development of
a mathematical model to determine their extraction efficiency, solid samples of the laterites
were also analysed using X-ray powder diffraction (XRD). These data were used as a
baseline for calcination studies to determine the effect of increased temperature on the
nickel extraction efficiency of the samples. To investigate the effect of calcination on nickel
extraction, samples A and B were heated in a furnace at 250 oC, 400 oC, 500 oC, 600 oC,
750 oC and 1000oC for two hours. Each sample was subjected to XRD analyses to identify
the mineralogical changes associated with calcination. These samples were then leached
inside 100mL plastic containers placed on a bottle roller operating at 30rpm, for 240h. The
leach solutions used in this study consisted of 20% v/v H2SO4, 20% v/v HNO3 and 20 % v/v
HCl.
2.3.7.1 Sulphuric Acid (H2SO4) Leach
This procedure was based on the reaction of 20% v/v sulphuric acid with samples over a
period of 240 hours. The samples were rolled at 30rpm and subsamples removed at pre-
specified times throughout the run for analysis. Data for these analyses were used to produce
leach curves based on time of association of the leach solution with the sample.
2.3.7.2 Hydrochloric Acid (HCl) Leach
Extraction protocols have already been described in section 2.3.7.1. The only modification
was that in this leach procedure 20% v/v hydrochloric acid was used as the leach solution.

! 42!
2.3.7.3 Aqua Regia Acid Leach
Extraction protocols have already been described in section 2.3.7.1. The only modification
was that in this leach procedure Aqua Regia was used as the leach solution.
2.3.7.4 Nitric Acid (HNO3) Leach
Extraction protocols have already been described in section 2.3.7.1. The only modification
was that in this leach procedure 20% v/v nitric acid was used as the leach solution.
2.4 XRD
To determine if changes in the mineralogy of the samples were associated with each stage
of the calcination experiment, and thereby understand the effect of temperature on the
samples and any variation in the leach characteristics of these materials, all sub-samples
of A and B, generated throughout the calcination experiment, were subjected to x-ray
diffraction analysis.
2.5 Phase 2: Validation samples.
In addition to the two initial samples on which the majority of research time was expended, the
CSIRO provided an additional six samples from deposits around western Australia that had
different nickel extraction characteristics. The initial concept was that these samples could be
used to validate any novel analytical protocols that were developed during the research
undertaken in this thesis. However, in addition to this potential use it was considered that
these samples could possibly be used to produce a direct calibration of long term nickel
extraction efficiency (data from field trials) with respect to time dependent nickel extraction
efficiency, under lab-based experimental conditions. In this way it was hoped that a
‘calibration graph’ may be able to be produced which would mathematically relate the long
term nickel extraction efficiency of these samples (field trials) to nickel extraction efficiency
over a much shorter time (lab-based experimental procedure). It was envisioned that these, or

! 43!
equivalent samples, could then be used in lab based experiments when new ores were
investigated to quickly give an indication of what would be the long term nickel extraction
efficiency of the new ore being trialled under field conditions. This approach would save a
significant amount of time in determining the refractivity of the goethite present in this ore.
Of the samples provided by the CSIRO, only six samples were suitable for use in developing
the relevant extraction efficiency graphs as only these had sufficient mass of material for the
experiments required (>20g) (Table 3).
For this series of experiments both the total concentration of the study elements and their
extraction efficiency in sulphuric acid had to be undertaken. Total nickel concentrations in
samples C (50%), D (25%), E (40%), F (40%), G (70%), H (4%) were determined by
dissolving 0.25 g of each sample using the same procedure as detailed in section 2.3.3. For
the leach procedure, 0.25 gram of each sample was leached under the same protocol as in
section 2.3.3.1.
2.6 Samples and Data Analysis
Experiments were undertaken in duplicate and as data reproducibility gave results that
different by less than +/-1% relative, average data were used for comparison purposes
throughout this thesis. The main method of data comparison and interpretation was graphical
plotting and visual comparison of the leach curves. This approach, while it may not be
considered as sophisticated, is the industry standard method for this type of data
interpretation, and is entirely adequate when interpreting leach characteristics of ores. This
relatively simple approach also means that data cannot be over-interpreted which can be a
danger especially when considering the variable nature of ores within and between deposits
and trying to develop a generic method associated with their extraction potential.

! 44!
Chapter 3
Results and Discussion
3.1 Phase 1: Preliminarily Experiment using “Ore Sample A” and “Ore Sample B”
3.1.1. Total Dissolution
Analytical data obtained for concentrations of Fe, Mn, Co and Ni in SARM1 and SARM2 were
compared with the Certified Values (Table 3.1) to provide an indication of the accuracy of the
analytical technique and results for the nickel extraction efficiency experiments. The data were
also used to validate the accuracy of total concentrations of analytes in the original samples.
While it is realised that it is not possible to have Certified Reference Materials for partial leach
experiments, and that the data detailed in Table 3.1 represent data produced for total
dissolution, this exercise did serve to validate the methodological accuracy and thus
confirmed the accuracy of the standards used for partial leach data calibration. Data obtained
for nickel in the Reference Materials vary slightly from certified values. However, this is largely
due to the fact that in these samples this analyte is at an extremely low level (near the
detection limit for the technique), a situation that does not occur into the lateritic samples used
in the study and no Reference Materials were available for use to establish the accuracy of
the nickel in iron ore. The reason for the choice of these four analytes is that the relationship
between nickel and iron, and manganese and cobalt has shown a direct correlation between
these two binary sets of metals (Hallberg et al. 2011; Yongue-Fouateu et al. 2006).
Following instrumental calibration, “Ore Sample A” and “Ore Sample B”” were analysed for
the four study elements and results detailed in Table 3.2.

! 45!
Table 3.1 Comparison of analytical data for Certified Reference Materials SARM1 and
SARM2 obtained for this study. Results expressed as parts per million in the original material.
CRM Type Type Mn ppm Fe ppm Co ppm Ni ppm
SARM 1 Certified Value Granite 150 14100 0.3 6.2
SARM 1 Study Value Granite 155 14300 0.4 8
SARM 2 Certified Value Syenite 79.9 10200 3 8.6
SARM 2 Study Value Syenite 77.5 10100 3 7
Table 3.2. data for Fe, Ni, Co and Mn concentrations in Samples “Ore Sample A” and “Ore Sample B”
Ore Sample
Percentage extraction efficiency in field leach long term experiments
Iron concentration %
Nickel concentration %
Cobalt Concentration (ppm)
Manganese concentration (ppm)
A 69% 45.6 2.43 496 3760
B 8% 33.3 0.944 692 2110
It is apparent from data in Table 3.2 that there is no direct correlation between nickel
concentration and the extraction efficiency of the ores, with nickel being only approximately
two and a half times more concentrated in “Ore Sample A” than in “Ore Sample B” while
the nickel extraction efficiency for “Ore Sample A” is over eight times higher than for “Ore
Sample B”.
3.1.2 Inorganic Acid Leaching
Results for all experimental data are detailed in Appendix Table 2.
3.1.2.1 Sulphuric Acid Leach
The 240hour extraction profiles of the four analyte elements, using 20% v/v sulfuric acid, are
detailed in Figure 3.1A and B. It is obvious from these figures that the relative extraction
efficiency of the analytes from the two different samples is completely dissimilar. Sulphuric
acid attacks the sample, and to a certain extent dissolves the iron, which is the major
constituent of goethite, leaching available nickel from the goethite matrix. The amount of
nickel leached is directly dependent of the degree of decomposition of the host matrix, which
! 46!
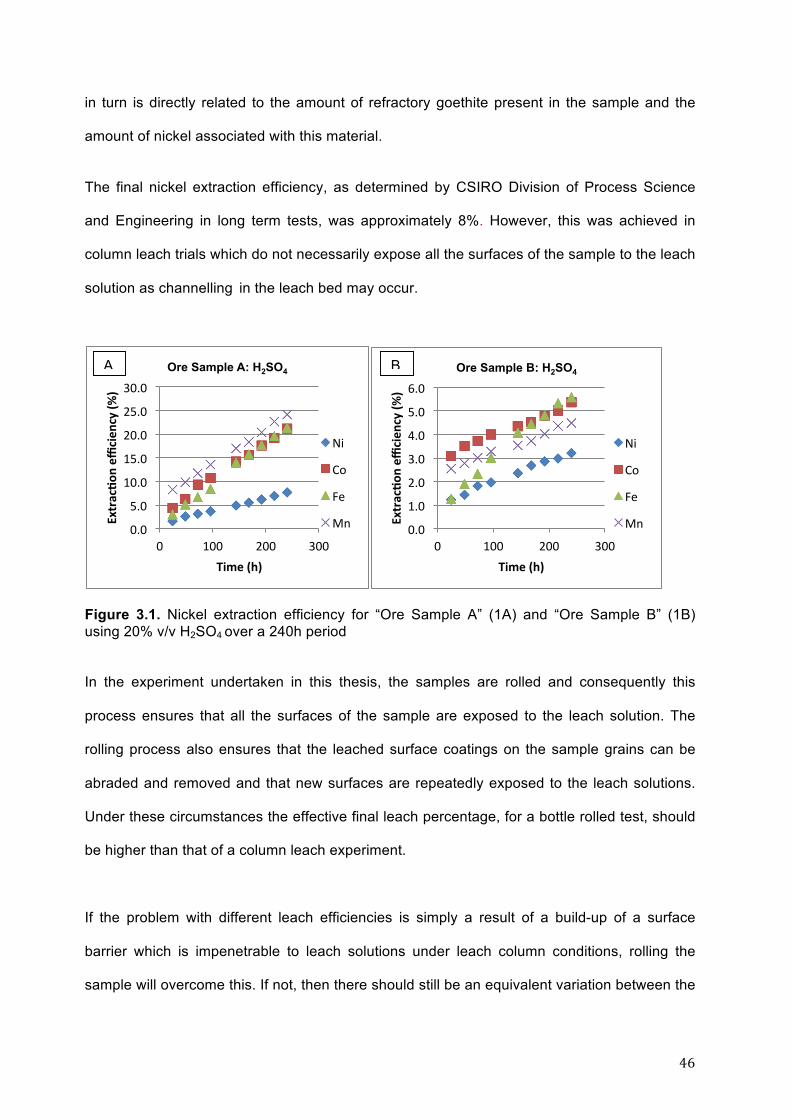
in turn is directly related to the amount of refractory goethite present in the sample and the
amount of nickel associated with this material.
!The final nickel extraction efficiency, as determined by CSIRO Division of Process Science
and Engineering in long term tests, was approximately 8%. However, this was achieved in
column leach trials which do not necessarily expose all the surfaces of the sample to the leach
solution as channelling!!in the leach bed may occur.
!
Figure 3.1. Nickel extraction efficiency for “Ore Sample A” (1A) and “Ore Sample B” (1B) using 20% v/v H2SO4 over a 240h period
In the experiment undertaken in this thesis, the samples are rolled and consequently this
process ensures that all the surfaces of the sample are exposed to the leach solution. The
rolling process also ensures that the leached surface coatings on the sample grains can be
abraded and removed and that new surfaces are repeatedly exposed to the leach solutions.
Under these circumstances the effective final leach percentage, for a bottle rolled test, should
be higher than that of a column leach experiment.
If the problem with different leach efficiencies is simply a result of a build-up of a surface
barrier which is impenetrable to leach solutions under leach column conditions, rolling the
sample will overcome this. If not, then there should still be an equivalent variation between the
0.0!
5.0!
10.0!
15.0!
20.0!
25.0!
30.0!
0! 100! 200! 300!
Extrac'o
n*effi
cien
cy*(%
)*
Time*(h)*
Ore Sample A: H2SO4
Ni!
Co!
Fe!
Mn! 0.0!
1.0!
2.0!
3.0!
4.0!
5.0!
6.0!
0! 100! 200! 300!
Extrac'o
n*effi
cien
cy*(%
)*
Time*(h)*
Ore Sample B: H2SO4
Ni!
Co!
Fe!
Mn!
A B

! 47!
two samples when both sets of test results are compared. The extraction curves for iron,
cobalt and manganese for “Ore Sample A” (Figure. 3.1A) all seem to be parallel to each other
and maintain linearity over the entire extraction period, while the extraction curve for nickel is
considerably suppressed with respect to those of these other elements. The nickel extraction
curve is nevertheless linear. From the results for “Ore Sample B” detailed in Figure 3.1B, it is
apparent that while the slopes for the manganese and cobalt extraction curves parallel each
other, the slope for iron extraction seems to decrease after the first +/-100 hours of leaching
but at all times be greater than the extraction slope for nickel. The nickel extraction curve
seems largely to parallel those for manganese and cobalt. The implication here is that while
there is a greater extraction efficiency of nickel from “Ore Sample A” than from “Ore Sample
B”, there could be a different mechanism holding the nickel in the lattice of the goethite of the
two different samples as proportionately more iron is being extracted from “Ore Sample A”
than from “Ore Sample B”. However, at the end of the 240h extraction period, the relative
extraction efficiencies of nickel from the two samples are approximately 2.7:1 :: “Ore Sample
A”: Ore Sample B”, while their final relative extraction efficiencies based on CSIRO Division of
Process Science and Engineering data are 8.6:1. Consequently, it can be clearly
demonstrated that while differences do occur in the extraction efficiency of nickel from the two
samples, and while simple build-up of an impenetrable surface coating on sample grains is not
the reason for the variation in nickel extraction efficiencies between the two samples, their
relative extraction efficiencies after 240hours do not represent the final extraction efficiencies,
and hence the extractability of the ore, and the shorter term rolling trial using 20% v/v sulfuric
acid, cannot be used to predict results from the longer term test using the same medium.
3.1.2.2 Hydrochloric Acid Leach
One attractive alternative to extract nickel and other elements such as Fe and Co is
hydrochloric acid. Senanayake et al. (2011) reported that it is possible to effectively leach iron,
cobalt and nickel from limonitic ores by using hydrochloric acid (HCl). The reason for this is
that the HCl reacts with the iron to form an extremely soluble FeCl63- complex thus effectively

! 48!
dissolving the iron oxide and releasing co-associated elements into solution. Consequently an
experiment was undertaken where 20% v/v HCl was used as an extractants for “Ore Sample
A” and “Ore Sample B”. Results for the 240h extraction of these two samples are detailed in
Figures 3.2A and B.
It is apparent from these figures that the extraction curve for “Ore Sample B” starts to
asymptote the ordinate (time) axis after approximately 200h leaching (Figure. 3.2B) when
nickel extraction has reached approximately 3% efficiency. However, even after 240h the
nickel leach curve for sample “Ore Sample A” maintains linearity and slope. However, while
the relative extraction efficiency of both the 20% v/v H2SO4 leach and the 20% v/v HCl leach,
when applied to sample “Ore Sample B”, appear to give equivalent results for nickel extraction
efficiency, the equivalent extraction efficiency of nickel from “Ore Sample A” (Figure 3.2A) is
reduced from approximately 8% for the 20% v/v H2SO4 leach to 6% for the 20% v/v HCl leach,
implying that HCl is not quite as effective a medium for nickel extraction as H2SO4. One other
extremely important point is that whilst, for the 20% v/v H2SO4 leach, the relationships
between iron and nickel and between cobalt and manganese were not apparent, for the 20%
v/v HCl leach there appears to be an extremely strong relationship between the leach
efficiency of these two binary pairs. For both samples, the extraction curves for the analytes
differ significantly in slope; however, for both samples the binary relationship between nickel
and iron and between cobalt and manganese is strongly apparent.
However, as with the 20% v/v H2SO4 leach, the 20% v/v HCl leach cannot be used, over the
short term, to predict the relative differences in nickel leach efficiency of the long term, field-
based leach protocol.

! 49!
Figure 3.2. Nickel extraction efficiency for “Ore Sample A” (2A) and “Ore Sample B” (2B) using 20% v/v HCl over a 240h period.
3.1.2.3 Aqua Regia Acid Leach
The third leach solution investigated was Aqua Regia, a mixture of 3:1 parts by volume
concentrated hydrochloric and nitric acid. The choice of this acid mixture is that because of
the production of the OCl- radical, it is extremely efficient for the dissolution both ferrous and
non-ferrous metals and their oxides.
Figure 3.3. Nickel extraction efficiency for “Ore Sample A” (3A) and “Ore Sample B” (3B) using 20% v/v Aqua Regia over a 240h period.
0.0!
5.0!
10.0!
15.0!
20.0!
25.0!
30.0!
0! 100! 200! 300!
Extrac'o
n*effi
cien
cy*(%
)*
Time*(h)*
Ore Sample A: HCl
Ni!
Co!
Fe!
Mn!0.0!
1.0!
2.0!
3.0!
4.0!
5.0!
6.0!
7.0!
0! 100! 200! 300!
Extrac'o
n*effi
cien
cy*(%
)*
Time*(h)*
Ore Sample B: HCl
Ni!
Co!
Fe!
Mn!
0.0!5.0!10.0!15.0!20.0!25.0!30.0!35.0!
0! 100! 200! 300!
Extrac'o
n*effi
cien
cy*(%
)*
Time*(h)*
Ore Sample A: Aqua regia
Ni!
Co!
Fe!
Mn! 0.0!1.0!2.0!3.0!4.0!5.0!6.0!7.0!8.0!9.0!
0! 100! 200! 300!
Extrac'o
n*effi
cien
cy*(%
)*
Time*(h)*
Ore Sample B: aqua regia
Ni!
Co!
Fe!
Mn!
A B
A! B!

! 50!
From the data detailed in Figure 3.3, it is apparent that the extraction efficiency of nickel in a
20% v/v Aqua Regia solution is slightly better than for the equivalent 20% v/v hydrochloric
acid solution, and almost equivalent to using 20% v/v sulfuric acid. Again for this extraction
matrix there is a very lose association of the extraction of the binary pairs nickel and iron and
cobalt and manganese. However, as with all previous leach regimes, the extraction efficiency
of nickel from the two samples cannot be used to predict the extraction efficiency of this
element over the long term or suggest the relative extraction efficiencies of nickel from the two
samples.
3.1.2.4 Nitric Acid Leach
While nitric acid is not recommended for the dissolution of iron oxides, its ability to dissolve
nickel oxide is exceptional. Consequently, it was considered that the leaching potential of this
acid should be investigated. Results detailing the extraction curves for solutions of 20% v/v
nitric acid leach solutions are detailed in Figure. 3.4. The results for the extraction efficiency of
this solvent are considerably different from those of the previous three inorganic acid based
leaches. In the case of nitric acid the level of extraction of all analytes is significantly lower
than for all other extraction procedures tested.
Figure 3.4. Nickel extraction efficiency for “Ore Sample A” (4A) and “Ore Sample B” (4B) using 20% v/v nitric acid over a 240h period.
0.0!1.0!2.0!3.0!4.0!5.0!6.0!7.0!8.0!
0! 100! 200! 300!
Extrac'o
n*effi
cien
cy*(%
)*
Time*(h)*
Ore Sample A: HNO3 Ni!
Co!
Fe!
Mn!
0.0!
0.5!
1.0!
1.5!
2.0!
2.5!
3.0!
3.5!
0! 100! 200! 300!
Extrac'o
n*effi
cien
cy*(%
)*
Time*(h)*
Ore Sample B: HNO3 Ni!
Co!
Fe!
Mn!
A! B!

! 51!
This may be because the dissolution chemistry of nitric acid results in it not being as efficient
for the dissolution of iron oxides as either sulfuric or hydrochloric acid and without the
dissolution of the sample matrix it is not possible to extract the analytes. Consequently, not
only does this extraction medium fail to extract nickel at anywhere near the efficiency of the
other extractants used, it also cannot be used to predict the final extraction efficiency of nickel
in the long term extraction regimes. This is clearly shown in Figures 3.4A and 3.4B where it
can be seen that there is little difference between the extraction efficiency of nickel from both
“Ore Sample A” and “Ore Sample B”, a situation that is not indicated in any of the previous
leach experiments and certainly not indicative of long term leach trial results.
3.1.2.5 Summary of Inorganic Leach Experiments
In general, the leach efficiency for the extraction of nickel from “Ore Sample A” and “Ore
Sample B” was very similar for all acid mixtures used, with the exception of nitric acid (Table
3.3 and Figure 3.5). As can be seen numerically by reference to Table 3.3 and graphically by
reference to Figure. 3.5, there is absolutely no relationship between the extraction efficiencies
of nickel, under any of the leach regimes tested, to the relative relationship of 8.6:1 :: “Ore
Sample A”: Ore Sample B” obtained for the long term leach experiment.
Table 3.3. Leach data for extraction efficiencies of all study analytes after a 240h leach period detailing all inorganic acid based leach solutions studied.
Percent Extraction Efficiencies 240h
Ore Samples A B A B A B A B Leach solution Mn Mn Fe Fe Co Co Ni Ni 20% v/v H2SO4 24.2 4.5 21.4 5.6 21.2 5.4 7.7 3.2 20% v/v HCl 24.6 5.6 11.7 3 20.8 6.5 6.6 2.6 20% v/v HCl:HNO3 31.5 6.6 14.2 3.5 27 7.8 7.9 3.5 20% v/v HNO3 7.1 2.3 3.3 2.1 4.5 3.0 1.9 1.5
While the Aqua regia and sulphuric acid leach solutions have the highest efficiency for
nickel removal, the nearest relative extraction efficiency to 8.6:1::“Ore Sample A”: Ore
Sample B”, is approximately 2.5:1 for the 20% v/v hydrochloric acid leach. Consequently, it
must be concluded that it does not appear to be possible to use a short term leach, even

! 52!
under sample rolling extraction conditions, to predict the final long term leach results for
extractability of nickel from these ores.
Figure 3.5. Comparison of the nickel extraction efficiencies for all inorganic acid based leach solutions
3.1.3 Organic Acid Leaching
Results for all experimental data are detailed in Appendix Table 3.
3.1.3.1. Oxalic Acid Leach
Results obtained for the oxalic acid leach trials are detailed in Figure 3.6.
Oxalic acid is a readily available, cheap, non-volatile (solid) organic acid which, while not
recognised as forming particularly soluble solid salts with the study analytes, certainly does
take them into solution and has found application in the field of mineral heap leaching
(Tarasova et al 2001). As with all the organic acid based leaching experiments detailed in this
thesis, three different acid strengths were used for all experiments, 0.2, 0.5 and 1.0M. Results
obtained for these leach trials are detailed in Figures 3.6A to 6F.
0.0!1.0!2.0!3.0!4.0!5.0!6.0!7.0!8.0!9.0!
0! 100! 200! 300!
Extrac'o
n*Effi
cien
cy*of*n
ickel*(%)*
Time*(h)*
Ore Sample A
Aqua!Regia!
HCL!
H2SO4!
HNO3!
A!
0.0!0.5!1.0!1.5!2.0!2.5!3.0!3.5!4.0!
0! 100! 200! 300!Extrac'o
n*Effi
cien
cy*of*n
ickel*(%)*
Time*(h)*
Ore Sample B
Aqua!Regia!
HCL!
H2SO4!
HNO3!
B!

! 53!
Figure 3.6. Analyte leach curves for “Ore Sample A” and “Ore Sample B” using selected molarity oxalic acid solutions
An extremely interesting aspect of these leach curves is that leaching of manganese appears
to be extremely fast initially with approximately 20% being leached from “Ore Sample B” within
the first 72 hours. This is in contrast to results obtained using inorganic acid leach solutions
0!
5!
10!
15!
20!
0! 100! 200! 300!
Extrac'o
n*effi
cien
cy*(%
)*
Time*(h)*
0.2M Oxalic acid - Ore Sample A
Ni!
Co!
Fe!
Mn!
0!5!
10!15!20!25!30!35!40!45!
0! 100! 200! 300!
Extrac'o
n*effi
cien
cy*(%
)*
Time*(h)*
0.2M Oxalic acid - Ore Sample B
Ni!
Co!
Fe!
Mn!
0!
5!
10!
15!
20!
25!
0! 100! 200! 300!
Extrac'o
n*effi
cien
cy*(%
)*
Time (h)
0.5M Oxalic acid : Ore Sample A
Ni!
Co!
Fe!
Mn!
0!
5!
10!
15!
20!
25!
30!
0! 100! 200! 300!
Extrac'o
n*effi
cien
cy*(%
)*
Time (h)
0.5M Oxalic acid : Ore Sample B
Ni!
Co!
Fe!
Mn!
0!
5!
10!
15!
20!
25!
0! 100! 200! 300!
Extrac'o
n*effi
cien
cy*(%
)*
Time (h)
1M Oxalic acid - Ore Sample A
Ni!
Co!
Fe!
Mn!
0!
5!
10!
15!
20!
25!
30!
35!
0! 100! 200! 300!
Extrac'o
n*effi
cien
cy*(%
)*
Time (h)
1M Oxalic acid - Ore Sample B
Ni!
Co!
Fe!
Mn!
C! D!
E! F!
A! B!

! 54!
where only approximately 2-6% of the available manganese was leached during the entire
240 hour experimental period. The leaching efficiency of this acid for nickel is, however, no
better than for any of the inorganic acid leachate solutions tested, while the leaching efficiency
for cobalt is significantly worse. This is surprising as cobalt is considered to be associated with
manganese in the goethite lattice. Extraction for iron from “Ore Sample A” follows a much
more conventional trend. However, unlike that or any of the inorganic acid leaches
investigated, none of the oxalic acid solutions investigated show any relation to the extraction
efficiency determined for nickel.
When results for leaching sample “Ore Sample A” are considered (Figures 3.6A, C and E), it is
apparent that the leach curves for all analytes are completely different from those for “Ore
Sample B” and follow much more conventional extraction amount vs. time curves. The relative
amount of iron leached is significantly higher for all concentrations of oxalic acid used than
determined for any of the inorganic acid leach solutions tested. Nickel extraction efficiency is
approximately 10% after 240 hours for all strengths of oxalic acid used. These variations may
be related to the relative amounts of refractory goethite present in the two ores, but if so it is
not an easily decipherable or understandable relationship. The comparison between the
relative extraction efficiencies for oxalic acid leaching of the two samples does not
approximate the required 8.6:1 relationship between “Ore Sample A” and “Ore Sample B”
respectively that is required if oxalic acid leaching is to be used to predict the final leach
characteristics of either ore. Consequently, the use of oxalic acid as a predictor for long term
leach efficiency of the ores under sulphuric acid leaching conditions cannot be considered as
appropriate.
3.1.3.2 Citric Acid Leach
This acid forms a slightly soluble citrate with iron and nickel but it can also from more soluble
mixed-metal complexes with these elements making it a potentially useful leaching agent for

! 55!
goethitic rich ores. Different studies have shown that this type of acid is effective for extracting
nickel from some laterite ores (Guang-hui et al. 2010). Leach curves for selected molarity citric
acid solutions are detailed in Figures 3.7A to F. These leach curves exhibit classical leach
percentage vs. time curves for both solids tested with further confirmation of the binary
association and behaviour of iron and nickel and of cobalt and manganese. The concentration
of acid seems to make very little difference to the extraction efficiencies of any of the analytes
over the 240 hour experimental period. Nickel extraction only reaches approximately 1% for
1M citric acid for both solids. An extremely interesting observation to be made from reference
to the extraction curves is that the relative extraction efficiency of the binary metal pairs (Fe/Ni
and Mn/Co) appears to be closely linked with the absolute metal extraction efficiencies of
each pair. This implies very strongly that as the iron is leached so too is the nickel and as the
manganese is leached so too is the cobalt. This extremely tight relationship has not been
seen before in any of the leaching experiments. While confirming the assumption of co-
consociation of these element pairs none of the leaching graphs show any relationship
between the extraction efficiencies for “Ore Sample A” and “Ore Sample B” that approximate
the 8.6:1 relationship for the relative long term sulfuric acid leachability of the ores.
Furthermore, any possibility of using this acid to predict long term nickel leachability of ores
will be further complicated by the fact that only approximately 1% of the available nickel
appears to be leached by any of the concentrations of citric acid used.
3.1.3.3 Tartaric Acid Leach
The extraction vs. time based curves for tartaric acid leach solutions are detailed in Figures
3.8A to 8F. The extraction curves for tartaric acid (Figures.3.8A-F) are similar to those for citric
acid (Figures 3.7A-F). This is not surprising as both acids behave similarly with the study
analytes. However, neither of these acids is as effective at leaching nickel as oxalic acid, with
the maximum nickel extraction being only approximately 1.5 % from either ore.

! 56!
Figure 3.7. Analyte leach curves for “Ore Sample A” and “Ore Sample B” using selected molarity citric acid solutions
0!2!4!6!8!10!12!14!16!18!
0! 100! 200! 300!
Extrac'o
n*effi
cien
cy*(%
)*
Time (h)
Ni!
Co!
Fe!
Mn!
0.0!0.5!1.0!1.5!2.0!2.5!3.0!3.5!
0! 100! 200! 300!
Extrac'o
n*effi
cien
cy*(%
)*
Time (h)
Ni!
Co!
Fe!
Mn!
0!2!4!6!8!10!12!14!16!18!
0! 100! 200! 300!
Extrac'o
n*effi
cien
cy*(%
)*
Time (h)
0.5M Citric acid - Ore Sample A
Ni!
Co!
Fe!
Mn!
0.0!0.5!1.0!1.5!2.0!2.5!3.0!3.5!4.0!
0! 100! 200! 300!
Extrac'o
n*effi
cien
cy*(%
)*
Time (h)
0.5M Citric acid - Ore Sample B
Ni!
Co!
Fe!
Mn!
0!
5!
10!
15!
20!
0! 100! 200! 300!
Extrac'o
n*effi
cien
cy*(%
)*
Time (h)
1M Citric acid - Ore Sample A
Ni!
Co!
Fe!
Mn!
0.0!0.5!1.0!1.5!2.0!2.5!3.0!3.5!4.0!
0! 100! 200! 300!
Extrac'o
n*effi
cien
cy*(%
)*
Time (h)
1M Citric acid - Ore Sample B
Ni!
Co!
Fe!
Mn!
A! B!
C! D!
E! F!
0.2M Citric Acid – Ore Sample A
!
0.2M Citric Acid – Ore Sample B

! 57!
Figure 3.8. Analyte leach curves for “Ore Sample A” and “Ore Sample B” using selected molarity tartaric acid solutions
0!
5!
10!
15!
20!
25!
30!
0! 100! 200! 300!
Extrac'o
n*effi
cien
cy*(%
)*
Time (h)
0.2M Tartaric acid - Ore Sample A
Ni!
Co!
Fe!
Mn!0.0!0.5!1.0!1.5!2.0!2.5!3.0!3.5!4.0!
0! 100! 200! 300!
Extrac'o
n*effi
cien
cy*(%
)*
Time (h)
0.2M Tartaric acid - Ore Sample B
Ni!
Co!
Fe!
Mn!
0!5!10!15!20!25!30!35!
0! 100! 200! 300!
Extrac'o
n*effi
cien
cy*(%
)*
Time (h)
0.5M Tartaric acid - Ore Sample A
Ni!
Co!
Fe!
Mn!
0!1!1!2!2!3!3!4!4!5!
0! 100! 200! 300!
Extrac'o
n*effi
cien
cy*(%
)*
Time (h)
0.5M Tartaric acid - Ore Sample B
Ni!
Co!
Fe!
Mn!
0!5!10!15!20!25!30!35!
0! 100! 200! 300!
Extrac'o
n*effi
cien
cy*(%
)*
Time (h)
1M Tartaric acid - Ore Sample A
Ni!
Co!
Fe!
Mn!0!
1!
2!
3!
4!
5!
0! 100! 200! 300!
Extrac'o
n*effi
cien
cy*(%
)*
Time (h)
1M Tartaric acid - Ore Sample B
Ni!
Co!
Fe!
Mn!
A! B!
C! D!
E! F!

! 58!
This is somewhat surprising as sample “Ore Sample A” is composed of an ore that is
extremely different in terms of its long term extractability to sample “Ore Sample B” and it
would be expected that at least there would be significantly greater nickel extraction from “Ore
Sample A” ore than from “Ore Sample B” ore material. As with the citric acid leach
experiment, the extraction curves for iron and nickel and for manganese and cobalt are
essentially equivalent. However, unlike the curves for these elements obtained using citric
acid, the extraction curves for these binary pairs appear to asymptote the abscissa far more
quickly than in equivalent leaching conditions using citric acid. The selective leaching of
manganese from both these ores using citric and tartaric acids could possibly be used as a
precursor to any long term nickel leaching protocols to remove cobalt at an early stage of
mine site extraction initiatives as approximately 25% of the available cobalt is removed with
only 1% of the iron and nickel and as the relative costs of these two metals is significantly
different this could be a profitable pre-leach action where cobalt concentrations in the ore are
relatively high.
Again the relative extraction efficiencies of the two ores, under tartaric acid leaching
conditions, in no way approximate the long term leach efficiencies of the ores under sulfuric
acid leaching conditions and therefore short term leach experiments using tartaric acid cannot
be used to predict long term leachability or refractiveness of either ore.
3.1.3.4 Summary Organic Acid based Leaching
Iron oxides, such as limonite and goethite are one of the main adsorbents for anions and
cations in soils and sediments. Consequently the secondary formation of these minerals,
following the weathering of metamorphically formed oxide based ores, will continue to have an
equivalent association of these precursor elements. It is not surprising therefore to find that
leaching characteristics of major elements, such as iron and manganese, are associated with
equivalent leaching characteristics for elements that were originally co-deposited with them.

! 59!
The potential use of organic acids is therefore important in that selective leaching of target
analytes may be possible, and relatively non-destructive leaching may be able to provide an
insight into the degree of association of analytes in refractory and non-refractory sites within
the final mineral assemblage of the ore. A summary of the results obtained for organic acid
based leaching of “Ore Sample A” and “Ore Sample B” is given in Table 3.4.
Table 3.4. Summary of results for leaching “Ore Sample A” and “Ore Sample B” ores using selected organic acids under pre-determined molarity concentrations
!! !! !! Percent!! Extraction! Efficiencies! After!240h! !! !!
Ore!Samples! A! B! A! B! A! B! A! B!
Leach!solution!! Mn! Mn! Fe! Fe! Co! Co! Ni! Ni!
Oxalic!0.2M! 12.5! 39.0! 19.0! 34.4! 15.4! 4.25! 9.14! 2.30!
Oxalic!0.5M! 13.4! 28.5! 19.8! 25.3! 17.4! 0.29! 9.69! 2.17!
Oxalic!1M! 15.8! 29.1! 22.4! 32.2! 19.2! 0.21! 11.3! 2.73!
Citric!0.2M! 13.9! 2.90! 0.45! 0.54! 14.9! 3.24! 0.97! 0.75!
Citric!0.5M! 15.4! 3.10! 0.53! 0.66! 16.6! 3.60! 1.10! 0.89!
Citric!1M! 16.6! 3.04! 0.57! 0.75! 17.9! 3.64! 1.23! 1.00!
Tartaric!0.2M! 27.6! 3.13! 1.13! 0.71! 23.2! 3.49! 1.99! 0.85!
Tartaric!0.5M! 27.8! 3.92! 1.42! 0.87! 25.0! 3.89! 1.94! 1.22!
Tartaric!1M! 32.3! 4.26! 1.77! 1.25! 26.2! 4.23! 2.60! 1.50!
From the data detailed in this table it is apparent that oxalic acid is by far the best leaching
agent of all the organic acids tested with up to 11.3% of all the available nickel leached from
the less refractory ore, “Ore Sample A”, and 2.7% leached from the more refractory ore “Ore
Sample B”. These figures equate to a 22.4% and 32.2 % extraction efficiency for iron from the
equivalent ores. Obviously the figures imply that the association of nickel and iron is different
in the two ores, a fact highlighted by the differences in their equivalent extraction efficiencies
for long term trials, but also that there is relatively an approximately 2:1 ratio of the
extractability for Fe:Ni for “Ore Sample A” while there is a 12:1 ratio for Fe:Ni extractability for
“Ore Sample B”. This points to the “Ore Sample B” ore being far more refractory than the “Ore
Sample A” ore, a fact further borne out by long term extraction tests. An inference could
perhaps be made that in using oxalic acid, as a short term Ore Sample B” would be some six

! 60!
times less than from “Ore Sample A”. While this figure is closer to the long term test ratio than
any before it is still some 50% out from the 8.6:1 ratio that has been experimentally confirmed
for the relative long term extractability of nickel from the two ores. There is an additional
interesting aspect of the oxalic acid leach experiments in that some 25% of the cobalt and
only 1.8% of the iron and equivalent nickel can be extracted from the relatively non-refractory
“Ore Sample A” ore using 1M oxalic acid. The consequent suggestion is that it may be useful
to pre-extract cobalt from the ores before undertaking the long term nickel extraction
procedure and thereby produce a relatively much less complicated leachate and one that
would contain a high proportion of the much more expensive cobalt rich fraction for
subsequent processing. In this way there may be a possibility to “value-add” to the more
cobalt rich ores. It is however obvious from these experiments that the use of any of the
organic acids tested in this study is unlikely to provide data that can be used as a predictive
tool for estimating the final leachability of either of the two study ores under long term leaching
conditions. Composite leach curves for nickel for “Ore Sample A” and “Ore Sample B” are
detailed in Figure 3.9.
!
Figure 3.9. Comparison of Leach Efficiencies of 1M Organic Acid Leach Solutions
0.0!
2.0!
4.0!
6.0!
8.0!
10.0!
12.0!
0! 100! 200! 300!NICKE
L*EX
TRAC
TION*EFFICIENCY
*(%)*
TIME*(H)*
Ore Sample A
Citric 1 M GSO1 Oxalic 1 M GSO1 Tartaric 1 M GSO1
0.0!0.5!1.0!1.5!2.0!2.5!3.0!3.5!
0! 200! 400!
NICKE
L*EX
TRAC
TION*
EFFICIEN
CY*(%
)*
TIME*(H)*
Ore Sample B
Citric 1 M K11 Oxalic 1 M K11 Tartaric 1 M K11
! 61!
3.1.4 Mixed Organic and Sulfuric Acid Leaching
Results for all experimental data are detailed in Appendix Table 4.
Following the initial leaching experiments using inorganic acids and organic acids separately,
in was decided to run a simple trial by mixing sulfuric acid (10% v/v), which had been proven
to be the most cost effective and efficient leaching agent in the previous trials, with 0.5M
concentration of each of the three organic acids tested in this work. It was hoped that under
these conditions, the positive aspects of both types of leachate would be combined to provide
improved leachability for both ore types and by so doing the short term tests would give a
better indication of the relative leachability of both ores in long term trials. A leach mixture of
10% sulfuric acid and 0.5M organic acid was used in all experiments.
3.1.4.1. Sulfuric Acid and Oxalic Acid Leach
Details of the data produced for the oxalic acid/sulfuric acid leach trials using “Ore Sample A”
and “Ore Sample B” are detailed in Figure 3.10. When data generated for this mixed acid
extraction procedure are compared with equivalent data for the sulfuric acid leach
experiments, it is apparent that “Ore Sample B” extraction curves for Ni, Co and Fe are
significantly better using the mixed acid leachate, while there is a twofold better extraction for
manganese. The extraction curve for manganese is far more “classical” than it was in the
original 0.5m oxalic acid test but the absolute extraction efficiency of the 0.5m oxalic acid
leach has been reduced from approximately 30% to 5%. This is also true for iron where
extractability in 0.5 oxalic acid has been reduced from 25% to 5%. The extraction efficiency for
nickel from “Ore Sample B” has been increased from approximately 3% in 0.5M oxalic acid to
approximately 8% in the mixed acid leach. Cobalt extraction efficiency has increased from
<1% in 0.5% oxalic acid to over 14% in the mixed acid leach. For “Ore Sample A”, the
extractability of cobalt has increased from 17% in 0.5% oxalic acid to over 40% in the mixed

! 62!
acid leach, while nickel extraction efficiency has remained largely unchanged at approximately
10%.
Considering the mixed oxalic/sulfuric leach in general, there appears to be no advantage in
using mixed acid extraction in terms of increasing nickel extractability and certainly there is no
new relationship for the relative nickel extractability of the two ores that could be used as a
predictive model for determining the relative or actual long term extractability of either ore.
! ! Figure 3.10. Extraction efficiency for oxalic acid/sulfuric acid mixed acid leaching of “Ore Sample A” and “Ore Sample B”. 3.1.4.2 Sulphuric acid and Citric Acid Leach
Details of the data produced for the sulfuric acid/citric acid leach experiments are given in
Figure 3.11. There is a slight enhancement in the extraction efficiency of nickel from sample
“Ore Sample B” from 3% to 4% using a mixture of sulfuric and citric acids over the extraction
of nickel using sulfuric acid alone. With sulphuric acid, approximately 3% of the available
nickel is extracted from the ore while in the mixed acid leach approximately 10% of the nickel
is extracted. Iron extraction increased from approximately 5% to approximately 20% under the
same conditions for this ore. The increase is not due to the presence or absence of sulphuric
acid but could be to the complexing ability of the citric acid which assists in the maintenance
of the solubilized iron and consequently equivalent solubilization of the nickel. There is also a
disproportionate increase in the extractability of manganese and cobalt with an increase from
0!5!10!15!20!25!30!35!40!45!
0! 100! 200! 300!
Extrac'o
n*Effi
cien
cy*(%
)*
Time*(h)**
Oxalic+H2SO4 Leach :Ore Sample A
Nickel!
Cobalt!
Iron!
Manganese!
0!2!4!6!8!
10!12!14!16!
0! 100! 200! 300!
Extrac'o
n*effi
cien
cy*(%
)*
Time*(h)*
Oxalic+H2SO4 Leach :Ore Sample B
Nickel!Cobalt!Iron!

! 63!
approximately 5% for both analytes in sulphuric acid to approximately 40% in the mixed acid
leachate for sample “Ore Sample B”. The increase in leaching percentage is slightly more than
when compared to the equivalent data for citric acid on its own. The results point to a
synergistically positive enhancement in the leachability of the “Ore Sample B” ore over single
acid leaching protocols. When data for the less refractory ore, “Ore Sample A”, are compared,
leach efficiencies for cobalt and manganese are equivalent for all three acid leaches used.
However, there is a significant increase in the percentage leaching of iron in the mixed acid
leach when compared to the citric acid data and a significant reduction from 20% extractability
in the sulfuric acid leach on its own. Nickel extraction is approximately 70% in the sulfuric acid
leach tests and 4% in the mixed acid leach but is enhanced from the approximately 1.5%
extractability in the citric acid leach alone. Again, as with all other leach regimes undertaken in
this thesis, there is no relationship is between the relative leachability of the two ores in the
short term trials and the final long term leach results.
! Figure 3.11. Extraction efficiency for sulfuric acid/citric acid mixed acid leaching of “Ore Sample A” and “Ore Sample B”.
3.1.4.3 Sulphuric and Tartaric Acid Leach
Details of the data produced for the sulfuric acid/citric acid leach experiments are given in
Figure 3.12.
0!
5!
10!
15!
20!
25!
30!
35!
0! 50! 100! 150! 200! 250! 300!
Extrac'o
n*Effi
cien
cy*(%
)*
Time*(h)**
Citric+H2SO4 Leach: Ore Sample A
Nickel!Cobalt!Iron!Manganese!
0!1!2!3!4!5!6!7!8!
0! 100! 200! 300!
Extrac'o
n*effi
cien
cy*(%
)*
Time*(h)*
Citric+H2SO4 Leach: Ore Sample B
Nickel!
Cobalt!
Iron!
Manganese!

! 64!
Using this mixed acid leach combination, the strong binary pair relationship of Mn/Co and
Fe/Ni is easily apparent. This relationship was shown strongly in the original tartaric acid leach
curves (Figure. 3.8) but were less distinct in the sulfuric acid leach curves (Figure. 3.1).
! ! Figure 3.12. Extraction efficiency for sulfuric acid/tartaric acid mixed acid leaching of “Ore Sample A” and “Ore Sample B”. The extraction efficiency of nickel shown in the mixed acid leach curves for sample “Ore
Sample B” reached approximately 3.5% while equivalent extraction efficiency for sulfuric acid
extraction was 3% and for tartaric acid was 1.5%. When data for “Ore Sample A” are
compared the mixed acid leach extracted approximately 9% of the available nickel while the
sulphuric acid leach extracted approximately 8% and the tartaric acid leach 2%. The relative
extraction efficiency of the mixed acid leach for “Ore Sample A” and “Ore Sample B” are
respectively 2.1:1. This is nowhere near the 8.6:1 required of this leach mixture to provide
sensible data for predicting relative long term leach characteristics for the two ores.
3.1.4.4 Summary for the Mixed Acid Leaches
A summary of the data produced during this series of experiments is detailed in Table 3.5 and
Figure 3.13. From this data it is apparent that there is an increase in nickel extraction
efficiency for both “Ore Sample A” and “Ore Sample B” over the 240 hour short term leaching
test for the mixed sulfuric/oxalic acid leaching regime over the single sulfuric acid leaching
0!1!2!3!4!5!6!7!8!
0! 100! 200! 300!
Extrac'o
n*Effi
cien
cy*(%
)*
Time*(h)**
Tartaric+H2SO4 Ore Sample A
Nickel!Cobalt!Iron!Manganese!
0!
10!
20!
30!
40!
50!
0! 100! 200! 300!
Extrac'o
n*Effi
cien
cy*(%
)*
Time*(h)**
Tartaric+H2SO4 Ore Sample B
Nickel!Cobalt!Iron!Manganese!
A! B!

! 65!
protocol. The mixed acid leach procedure, using sulfuric and oxalic acids, is significantly more
efficient
Table 3.5. Summary of the extraction efficiencies of all study analytes from “Ore Sample A” and “Ore Sample B” using mixed acid leaches.
!! Percent Extraction Efficiencies 240h
Ore Samples A B A B A B A B
Leach solution Mn Mn Fe Fe Co Co Ni Ni Oxalic + H2SO4 42! 11! 19.4! 14.2! 42.5! 14.2! 10! 8.0!
Citric + H2SO4 31! 5.1! 10.4! 4.9! 29.9! 6.77! 6.2! 4.0!
Tartaric + H2SO4 42! 5.4! 15.4! 3.27! 41.2! 6.81! 8.8! 3.4!
than any of the other mixed acid leaches studied. Relative increases in extraction efficiency
are also shown for most other analytes in both samples using the sulfuric acid oxalic acid
leach mixture. However, there appears to be no improvement in the extraction efficiency for
nickel in either sample using sulfuric acid / citric acid leach or a sulfuric acid / tartaric acid
leach.
Figure 3.13 Extraction efficiencies for nickel from “Ore Sample A” and “Ore Sample B” using three different mixed acid leach solutions
The synergistic effect of the mixed acid leaching protocols for sulfuric acid / oxalic acid is very
apparent for cobalt with a significant increase in extraction efficiency for this element when
0!
2!
4!
6!
8!
10!
12!
0! 100! 200! 300!
Nickel*Extrac'on
*Efficien
cy*(%
)*
Time*(h)*
Mixed acid Ore Sample A
Tartaric + H2SO4 Citric + H2SO4 Oxalic + H2SO4
0!1!2!3!4!5!6!7!8!9!
0! 100! 200! 300!
Nickel*Extrac'on
*Efficien
cy*(%
)*
Time*(h)*
Mixed acid Ore Sample B
Tartric + H2SO4 Citric + H2S04 Oxalic + H2SO4

! 66!
compared with single acid leaching. However, none of the mixed acid leach protocols provide
data for nickel extraction that gives any indication of the final leach potential of the ores and
consequently none of the mixed acid leaches investigated appear useful as a predictive model
for determining the refractiveness of the ore materials studied to nickel recovery.
3.1.5 Single inorganic acid Leaching following pre-oxidation of ore materials
Experiments associated with leaching the original ore samples failed to provide a set of
conditions that could be used to predict the final nickel leachability potential of the original
ores under long term leaching conditions. The variation in the leaching ability of the ores is
obviously related to the refractivity of the ore which in turn is related to the ability of goethite to
sequester nickel and then subsequently release the available nickel from the ore. This implies
that a variation in the crystal structure and crystallinity of the goethite, which is the primary
“carrier mineral” for the nickel in the ore may be responsible for the refractivity of the ore.
Goethite (!-FeOOH) is an important iron oxide with and exceptional chemical reactivity, in
particular, because of its wide variety of crystal structure it has a variety of lattice sites
available for the incorporation of nickel. Furthermore, under conditions of increased
temperature (Equation A), or by simple dehydration (Equation B) resulting in intermediates,
goethite can be oxidized into Hematite (!-Fe2O3), a process which involves and atomic
rearrangement of Fe+3, and the removal of hydrogen and some of the oxygen from the original
crystal. This process completely changes the mineralogy of the sample.
Equation A 2 α-FeOOH → α-Fe2O3 + H2O
Equation B α-FeOOH (goethite) ! Fe5/3(OH)O2 (protohaematite) !
Fe11/6(oh)1/2O5/2(hydrohaematite) ! !-Fe2O3(hematite)
The effect of heating samples “Ore Sample A” and “Ore Sample B” to 10000C for two hours
can be seen in the diffractograms of the starting and end products (Figure. 3.13). With
reference to Figure 3.14 it is possible to see that the goethite present in the sample has

! 67!
Figure 3.14. X-ray diffractograms of samples “Ore Sample A” (A and B) and “Ore Sample B” (C and D) before and after heating at 1000oC for 2 hours. Green lines correspond to Goethite and purple, to Hematite.
mostly been oxidised to haematite. The effects of various heating temperatures (Appendix A4)
on nickel extractability are presented graphically in Figures 3.15 to 3.18. In general it can be
seen that increasing the temperature to approximately 400–500oC for 2 hours increases the
nickel extraction efficiency of both “Ore Sample A” and “Ore Sample B” (Appendix table 5).
However, once a temperature of approximately 500oC has been reached, the nickel extraction
efficiency rapidly decreases to almost zero at 1000oC. At this point the sample is almost
entirely haematite. The extraction efficiency is first increased because the disordering of the
goethite lattice facilitates leaching. However, once recrystallisation of the disassociated
goethite into haematite starts to occur then the resulting haematite is completely refractory to
acid leach and the nickel becomes unavailable. The experiments reported in this section were
designed to determine the nickel extractability for both ore samples at all the pre-oxidation
temperatures studied and to assess if any one of these conditions provided a sample that,
A! B!
C! D!

! 68!
when leached under a series of per-determined regimes, could be used to predict the actual
long term efficiency of nickel removal.
3.1.5.1 20% Sulfuric Acid Leach of Pre-oxidised Ore Samples
From the data detailed in Figure 3.15, it is apparent that heating sample “Ore Sample B” to a
temperature of 500oC for two hours increases the nickel extraction efficiency from
approximately 3% to 43% over a 240h extraction period.
Figure 3.15. Variation in 20% v/v sulfuric acid based nickel extractability for ore samples “Ore Sample A” and “Ore Sample B” following pre-oxidation of the ores at selected temperatures for a two hour period.
The long term extraction efficiency of this sample is only approximately 8% and consequently
pre-oxidation significantly improves the nickel recovery. Data for “Ore Sample A” indicates that
nickel leachability has also been improved from 7.7% to 58.9% over the same 240 hour
period. However, the long term leachability for nickel from this sample is 68% which has not
been reached over the 240 hour period. The ratio of 8.6:1 for the nickel leachability ratio for
long term leaching of samples “Ore Sample A” and “Ore Sample B” respectively has not been
approximated in any of these experiments. Consequently, pre-oxidation of the samples to
temperatures up to 10000C and subsequent leaching of the ores in 20% v/v sulfuric acid
0
10
20
30
40
50
60
70
0! 100! 200! 300!
Nic
kel E
xtra
ctio
n Ef
ficie
ncy(
%)
Time (h)
Ore Sample A: H2SO4
Normal!
250°C!
400°C!
500°C!
600°C!
750°C!
1000°C!
0 5
10 15 20 25 30 35 40 45 50
0! 100! 200! 300!
Nic
kel E
xtra
ctio
n Ef
ficie
ncy
(%)
Time (h)
Ore Sample B: H2SO4
Normal!
250°C!
400°C!
500°C!
600°C!
750°C!
1000°C!

! 69!
produces no leach scenarios that can be used as a predictive experiment to estimate long
term leachability of any of the ores.
3.1.5.2 20% Hydrochloric Leach of Pre-oxidised Ore Samples
Leaching the pre-oxidised ores using 20% v/v hydrochloric acid produced data (Figure. 3.16)
that are essentially similar to those for the 20% v/v sulfuric acid leach experiments.
Figure 3.16. Variation in 20% v/v hydrochloric acid based nickel extractability for ore samples “Ore Sample B” and “Ore Sample A” following pre-oxidation of the ores at selected temperatures for a two hour
The maximum percentage nickel leachability for “Ore Sample B” in 20% v/v hydrochloric acid
is essentially the same for both the 400oC and 500oC pre-oxidised materials and is recorded
as 35.5% and 37% respectively. This value is slightly lower than the 43% obtained when 20%
v/v sulfuric acid was used. The same generic pattern of leachability is however achieved with
hydrochloric acid in that the maximum nickel leachability from the ore is for material that has
been pre-heated to approximately 400-500oC. There is a very significant reduction in nickel
leachability from ores that have been heated to higher temperatures. The same general trend
can be seen for sample “Ore Sample A” with a maximum nickel leachability of approximately
0!
10!
20!
30!
40!
50!
60!
0! 100! 200! 300!
Nic
kel E
xtra
ctio
n Ef
ficie
ncy
(%)
Time (h)
Ore Sample A: HCl
Normal
250°C
400°C
500°C
600°C
750°C
1000°C
0!5!
10!15!20!25!30!35!40!45!
0! 100! 200! 300!
Nic
kel E
xtra
ctio
n Ef
ficie
ncy
(%)
Time (h)
Ore Sample B: HCl
Normal
250°C
400°C
500°C
600°C
750°C
1000°C

! 70!
50% for a sample that has been pre-heated to a temperature of 500oC. However, no data from
any of the experiments approximates values for the relative long term nickel extraction
efficiency relationship between “Ore Sample A” and “Ore Sample B” of 8.6:1 and
consequently none of the hydrochloric acid leach experiments can provide data that could be
used to predict long term leach efficiencies of the study ores.
3.1.5.3 20% Aqua Regia Acid Leach of Pre-oxidised Ore Samples
The nickel extraction curves for samples “Ore Sample A” and “Ore Sample B”, using Aqua
Regia as a leach agent, are almost idnetivcal to those for the same samples using
hydrochloric and sulfuric acid (Figure. 3.17).
Figure 3.17 Variation in 20% v/v Aqua Regia acid based nickel extractability for ore samples “Ore Sample A” and “Ore Sample B” following pre-oxidation of the ores at selected temperatures for a two hour period.
There is an increase in the nickel extractability when compared to the original single acid
extraction data, by using ores that have been pre-heated. The increase is from 3.5% to 43%
for “Ore Sample B” and 8% to 53% for “Ore Sample A”. However, as with the previous
experiments none of the experiments produce results that give relative nickel extraction ratios
for “Ore Sample A”:” Ore Sample B” that approach the 8.6:1 required. Consequently none of
0!
10!
20!
30!
40!
50!
60!
0! 100! 200! 300!
Nic
kel E
xtra
ctio
n Ef
ficie
ncy
(%)
Time (h)
Aqua Regia Ore:Sample A
Normal
250°C
400°C
500°C
600°C
750°C
1000°C
0!5!
10!15!20!25!30!35!40!45!50!
0! 100! 200! 300!
Nic
kel E
xtra
ctio
n Ef
ficie
ncy
(%)
Time (h)
Aqua Regia: Ore Sample B
Normal
250°C
400°C
500°C
600°C
750°C
1000°C

! 71!
the hydrochloric acid leach experiments appear to be able to provide data that could be used
to predict long term leach efficiencies of the study ores.
3.1.5.4 20% Nitric Acid Leach of Pre-oxidised Ore Samples
While the leach characteristics of “Ore Sample A” are essentially similar for the other three
acid leaches, data for the 20% v/v nitric acid extraction of nickel from pre-oxidised “Ore
Sample B” ore is significantly different from that of these acids Figure 3.18. This is probably
because the ability of nitric acid to leach oxides of iron is extremely poor and even in the initial
experiments with unheated ore, the ability of nitric acid leach solutions to remove nickel from
the ores was extremely poor and worse than any of the other acids used. Nevertheless, the
extraction efficiency for nickel from the pre-heated ores is significantly greater than that from
the unheated ore, increasing from 1.9 to 21.9% for “Ore Sample A”, and 1.5 to 14.5% for “Ore
Sample B”.
!
Figure 3.18 Variation in 20% v/v nitric acid based nickel extractability for ore samples “Ore Sample A” and “Ore Sample B” following pre-oxidation of the ores at selected temperatures for a two hour period.
There is no discernible relationship between the extraction efficiency of nickel from either of
these pre-heated ores, when using nitric acid as a leaching agent. This is somewhat difficult to
0!
5!
10!
15!
20!
25!
0! 100! 200! 300!
Nic
kel E
xtra
ctio
n Ef
ficie
ncy
(%)
Time (h)
Nitric: Ore Sample A
Normal
250°C
400°C
500°C
600°C
750°C
1000°C 0
2
4
6
8
10
12
14
16
0! 200!
Nic
kel E
xtra
ctio
n Ef
ficie
ncy
(%)
Time (h)
Nitric: Ore Sample B
Normal
250°C
400°C
500°C
600°C
750°C
1000°C

! 72!
explain but is probably associated with the inability of nitric acid to dissolve iron oxide based
ores and the variation of crystallinity and mineral composition in which the nickel and iron are
associated in the two different extractability ore samples used in this study. Again, none of the
experimental data appear to be useful in providing a predictive model for long term leachability
estimation in either “Ore Sample A” or “Ore Sample B”.
3.1.5.5 Comparative Leachability for all Study Analytes from “Ore Sample A” and “Ore
Sample B” Pre-oxidised Ore
Data for the leachability of all study analytes under the four study inorganic acid extraction
regimes is given in Table 3.6. The data in this table describe a very wide range of
extractabilities for the study analytes and points to the wide range of mineralogical
transformations that have taken place during the various pre-oxidation stages that the sample
have been subjected to. However, these changes in mineralogy are outside the scope of this
thesis and are therefore not dealt with here.
In general, it can be concluded that up to temperatures of approximately 500oC there is a
steady increase in the percentage of analytes that can be extracted. Above this temperature,
and probably because of recrystallisation of the oxide species of iron, from goethite to
haematite, and their simultaneous incorporation of nickel into an extremely refractory matrix,
extraction efficiencies drop to nearly zero. In spite of being able to leach pre-oxidised ore over
a number of temperatures and using a variety of acid attacks, none of the experiments have
yielded any data that facilitates using short term leach experiments as predictive models for
their determination of the ultimate long term leachability of the ores.
From the data obtained it has been able to be concluded that it would be possible to devise a
better leach solution than the sulfuric acid currently being used as the industry standard.

! 73!
Table 3.6. Leach data for all study analytes from samples “Ore Sample A” and “Ore Sample B” following pre-oxidation at selected temperatures for two hours.
!! !! !! Percent Extraction Efficiencies 240h !! !!Ore Samples A B A B A B A B
Analytes Mn Mn Fe Fe Co Co Ni Ni
H2SO4 Leach solution !! !! !! !! !! !! !! !! Original sample 24.2 4.49 21.4 5.59 21.2 5.36 7.69 3.21
250oC 45 6.12 32.4 5.94 37.6 8.29 15.7 4.51
400oC 45.1 33.5 101 97.2 33.6 40.2 49.1 24.9
500oC 97.8 58.3 102 92.6 76.7 73 58.8 43
600oC 30.4 21.2 84.3 40.2 25.7 30.2 15.9 15.9
750oC 30.7 20.4 11.6 8.52 38.2 42.4 11.2 15.4
1000oC 2.44 1.24 0.6 0.17 2.01 0.88 0.47 0.22
!! !! !! !! !! !! !! !! !!HCl Leach solution !! !! !! !! !! !! !! !!Original sample 24.6 5.56 11.7 3.02 20.8 6.49 6.57 2.56
250oC 33.5 4.73 20.1 4.09 24.7 6.16 9.46 2.99
400oC 56.5 48.7 97.2 85.6 40.3 58.7 42.5 37
500oC 79.2 49.7 96 67.2 66.2 65.6 50.2 35.5
600oC 55.4 24.4 64.5 23.5 49.6 39.5 27.2 20.1
750oC 24.6 18 7.69 6.34 32.9 37.8 9.28 13.5
1000oC 1.74 1.43 0.34 0.17 1.37 0.93 0.27 0.29
!! !! !! !! !! !! !! !! !!Aqua Regia Leach solution !! !! !! !! !! !! !! !!Original sample 31.5 6.65 14.2 3.48 27 7.82 7.93 3.46
250oC 28.4 4.79 16.7 3.72 19.1 6.15 7.89 2.52
400oC 77.5 57.5 98.3 84.8 57.6 68.6 52.7 42.9
500oC 81.7 51.8 96.4 77.5 67.4 73.1 52.8 42.2
600oC 61.5 31.1 66 32.2 54 46.7 31.4 24.9
750oC 35.8 20.3 9.52 6.86 47.1 42.2 9.2 14.7
1000oC 1.88 1.43 0.35 0.15 1.48 0.93 0.28 0.36
!! !! !! !! !! !! !! !! !!HNO3 Leach solution !! !! !! !! !! !! !! !!Original sample 7.13 2.26 3.28 2.07 4.47 3.02 1.9 1.48
250oC 15.1 3.33 6.41 2.3 9.34 4.31 4.71 2.17
400oC 28.6 6.78 48.6 18 19.7 12.3 18.6 8.91
500oC 40.6 13 38.4 15.8 48.7 28.1 21.9 14.5
600oC 19.6 9.95 11.3 9.13 29.1 23 8.81 13
750oC 27 17.5 4.22 4.05 42.7 43.6 8.2 13.8
1000oC 1.51 0.93 0.21 0.1 1.36 0.67 0.24 0.29

! 74!
Consequently, a final set of experiments was devised using study ores that had been held in
reserve to test any other appropriate leaching solutions investigated throughout this study, as
“calibration standards” and on the basis of their short term leachability try to develop a set of
standards that in the short term will possibly mimic the long term leaching behaviour of a
variety of partially leachable ores. This experiment was undertaken using 20% v/v sulfuric
acid.
3.1.6 Estimation of long term leachability of nickel based on short term calibration
against “standard samples”
In addition to “Ore Sample A” and “Ore Sample B”, provided by CSIRO Division of Process
Science and Engineering for the extraction trials detailed in this thesis, a series of other
samples of known long term nickel extractability were also provided (Appendix Table 6).
Unfortunately, only a small mass of material was avalible for these samples, and it was not
possible to undertake repeat trials. Nevertheless, six additional samples, “Ore Samples C
– H”, were provided with sufficient mass (approximately 50-100g) to be used in an
additional extraction experiment (Table 3.7). The concept behind this experiment was that
if the leach characteristics of ores with known nickel extractability could be determined
over a period of up to 240 hours, it may be possible to use these characteristics to plot a
“calibration curve” of extractability over the long term against extractability over the short
term and use this calibration curve to calculate the extraction efficiency of unknown ores
over the long term.
In this way it was envisioned that providing a series of various known long term
extractability standards to companies dealing with refractory ores would allow them to run
these standards and unknown samples together in short term leach experiments and
thereby estimate the long term extractability of the unknown ores by reference to a
calibration curve produced using the provided standards. Both ICP-AES and ICP-MS

! 75!
instrumentation was used to produce data for this study. Results are detailed in Figures
3.19 to 3.22 with the final composite data detailed in Figure 3.23.
Table 3.7. Long Term Nickel Extractability of Analytes from the “Standard Samples”
!! Long!term!field!trials! Analytes! Mn Fe Co Ni
Ore!Sample!Number! Ni!extraction!percent! !! ppm! %! ppm! ppm!C 50! 7650 51 815 10500
D 25! 776 42 140 7180
E 40! 10400 51 834 6600
F 40! 5620 51 757 7400
G 70! 4390 33 1270 8900
H 4! 472 34 163 2880
Data detailed in Figure 3.10 and 3.20 represent the production of a calibration curve based
on samples “Ore Sample C” (50% nickel extractability), “Ore Sample D” (25% nickel
extractability), “Ore Sample F” (40% nickel extractability), “Ore Sample G” (70% nickel
extractability) and “Ore Sample H” (4% nickel extractability). The reason for using both
ICP-AES and ICP-MS is that many laboratories will have either one or the other technique
available but possibly not both and the developed technique should be useable in either
type of laboratory. The concentration of the analytes is significantly above the detection
limits for both techniques so either technique can be used to provide appropriate data for
this experiment. The analytical solutions used in this study were made up to be identical for
both the ICP-AES and ICP-MS analyses. This approach, while not being used throughout
the thesis for the analysis of samples as more solution was available for these studies, was
undertaken here to be certain that reanalysis of solutions was possible with the limited
amount of leach solution available. While this represented a compromise it was the only
appropriate solution for the experimental design used here. The main problem with his type
of analysis is that the iron matrix gives rise to variable bias in both techniques. This is
because the calibration curves produced are derived from the analysis of aqueous (slightly
acidic) standards with low concentrations of all analytes. Consequently, analysis of

! 76!
relatively high matrix salt content samples will produce physical interference and give rise
to a generic difference, of a few percent relative, between data sets for the two different
instruments. While this is a problem with respect to absolute accuracy of the data, it is not
a problem with respect to comparison of the data from a single technique. The
development of an analytical technique to overcome this bias, and produce absolute
accuracy of data from both techniques, can be an extremely long and costly process and is
beyond the scope of the investigation covered by work in this thesis. As can be seen by
reference to data the effects of bias on the results are relative and not absolute and
consequently all data can be accurately compared within the data sets for each analytical
technique to provide valid conclusions.
Data obtained from the 20% v/v sulfuric acid leaching of the six samples of ore that were to
be used as calibration standards is shown in Figures 3.19 and 3.20 for the analysis by ICP-
AES and ICP-MS respectively. From these figures it is obvious that there is a comparability
of the data for short term leachability of these ore with that for the long term leachability
experiments. The close correlation of the two sets of data for both instrumental techniques
becomes more apparent with increased periods of leaching. The fit of data to a regression
line becomes markedly better the longer the ore samples are exposed to the leach
solutions. After a leaching period approaching 144 hours the R2 value for the regression
slope of a line drawn to represent the relationship between the two sets of data (regression
line), is approximately 0.96 or above implying that the regression line represents some
96% of the variation of the data and that consequently there is an excellent relationship
between the two parameters being plotted, the short and long term extraction efficiencies
for nickel from the ores.
When the data for “Ore Sample E” (40% nickel extractability) is added to the graphs as an
additional yellow point (Figures 3.21 and 3.22), it can easily be seen that in both the ICP-
AES and ICP-MS sets of data the closeness of fit of this new data to the calibration curves
produced from the “standard ores’ is excellent for all times above 144 hours leaching. It is

! 77!
certainly probable that the time between 72 hours leaching and 144 hours leaching, which
represented a weekend during which time analysis was not possible due to an instrument
failure, that equivalent comparability could easily have been achieved. However, due to
circumstances, which could not be controlled, this suggestion will have to be confirmed in
a further set of experiments at a late stage. Nevertheless, the use of “standard ores” for the
construction of a “calibration graph” as described here obviously provides a very strong
indication of the potential of this concept to provide long term accurate extractability
figures, for refractory ores, over a very short time span. It will obviously be necessary to
repeat and expand this study using a greater variety of ore types with different mineralogy
and a variety of different nickel extractabilities to ensure that the technique is robust. In
addition, it will be necessary to develop a final analytical technique in which there is no
bias and this will probably ultimately involve the use of the ICP-MS technique where it will
be possible to dilute the sample to such an extent that there is relatively no interference
from iron.
The relative relationship of all the “calibration ores” together with the “test ore” is detailed in
Figure 3.23. Here it can be seen that throughout the experiment there is a close
relationship between the two 40% nickel extractable ores (“Ore Sample F” and “Ore
Sample E”), and that the “calibration slope” is linear.
One obvious problem is that there is a gap in the data between 72 hours and 144 hours,
representing a Saturday and Sunday over which period it was not possible to analyse samples
because of instrumental problems. Nevertheless, there is an extremely close relationship
between data for samples “Ore Sample E” and “Ore Sample F” from approximately 72 hours
of extraction onwards.

! 78!
y!=!0.0221x!+!0.8111!R²!=!0.79226!
0!
0.5!
1!
1.5!
2!
2.5!
3!
0! 20! 40! 60! 80!
Expe
rimen
tal*N
i*Extrac'on
*(%)*
Long*Term*Ni*Extrac'on*(%)*
AES!data!24h!Leach!
y!=!0.0342x!+!0.9262!R²!=!0.80525!
0!
0.5!
1!
1.5!
2!
2.5!
3!
3.5!
0! 20! 40! 60! 80!
Expe
rimen
tal*N
i*Extrac'on
*(%)*
Long*Term*Ni*Extrac'on*(%)*
AES!data!48h!Leach!
y!=!0.0399x!+!1.069!R²!=!0.86768!
0!0.5!1!
1.5!2!
2.5!3!
3.5!4!
4.5!
0! 20! 40! 60! 80!
Expe
rimen
tal*N
i*Extrac'on
*(%)*
Long*Term*Ni*Extrac'on*(%)*
AES!data!72h!Leach!
y!=!0.1545x!+!0.3696!R²!=!0.96027!
0!
2!
4!
6!
8!
10!
12!
14!
0! 20! 40! 60! 80!
Expe
rimen
tal*N
i*Extrac'on
*(%)*
Long*Term*Ni*Extrac'on*(%)*
AES!data!144h!Leach!
y!=!0.1726x!+!0.3566!R²!=!0.96299!
0!
2!
4!
6!
8!
10!
12!
14!
0! 20! 40! 60! 80!
Expe
rimen
tal*N
i*Extrac'on
*(%)*
Long*Term*Ni*Extrac'on*(%)*
AES!data!168h!Leach!
y!=!0.1975x!+!0.2293!R²!=!0.96276!
0!2!4!6!8!
10!12!14!16!
0! 20! 40! 60! 80!
Expe
rimen
tal*N
i*Extrac'on
*(%)*
Long*Term*Ni*Extrac'on*(%)*
AES!data!192h!Leach!
y!=!0.2206x!+!0.1255!R²!=!0.96791!
0!2!4!6!8!10!12!14!16!18!
0! 20! 40! 60! 80!
Expe
rimen
tal*N
i*Extrac'on
*(%)*
Long*Term*Ni*Extrac'on*(%)*
AES!data!216h!Leach!
y!=!0.2502x!+!0.0542!R²!=!0.97177!
0!
5!
10!
15!
20!
0! 20! 40! 60! 80!
Expe
rimen
tal*N
i*Extrac'on
*(%)*
Long*Term*Ni*Extrac'on*(%)*
AES!data!240h!Leach!
Figure 3.19 Calibration leach curves for “Ore Samples C, D, F, G and H” in 20% sulfuric acid for selected time periods – ICP-AES data.

! 79!
y!=!0.0359x!+!1.2314!R²!=!0.72263!0!
0.5!1!
1.5!2!
2.5!3!
3.5!4!
0! 20! 40! 60! 80!
Expe
rimen
tal*N
i*Extrac'on
*(%)*
Long*Term*Ni*Extrac'on*(%)*
MS!data!24h!Leach!
y!=!0.0454x!+!1.2549!R²!=!0.70888!
0!
1!
2!
3!
4!
5!
0! 20! 40! 60! 80!
Expe
rimen
tal*N
i*Extrac'on
*(%)*
Long*Term*Ni*Extrac'on*(%)*
MS!data!48h!Leach!
y!=!0.0568x!+!1.1197!R²!=!0.87226!
0!
1!
2!
3!
4!
5!
6!
0! 20! 40! 60! 80!
Expe
rimen
tal*N
i*Extrac'on
*(%)*
Long*Term*Ni*Extrac'on*(%)*
MS!data!72h!Leach!
y!=!0.2027x!+!0.8109!R²!=!0.95797!
0!2!4!6!8!10!12!14!16!18!
0! 20! 40! 60! 80!
Expe
riman
tal*N
i*Extrac'on
*(%)*
Long*Term*Ni*Extrac'on*(%)*
MS!data!144h!Leach!
y!=!0.2165x!+!1.4866!R²!=!0.93552!0!
5!
10!
15!
20!
0! 20! 40! 60! 80!
Expe
rimen
tal*N
i*Extrac'on
*(%)*
Long*Term*Ni*Extrac'on*(%)*
MS!data!168h!Leach!
y!=!0.263x!+!0.4718!R²!=!0.96597!
0!
5!
10!
15!
20!
25!
0! 20! 40! 60! 80!
Expe
rimen
tal*N
i*Extrac'on
*(%)*
Long*Term*Ni*Extrac'on*(%)*
MS!data!192h!Leach!
y!=!0.2959x!+!0.268!R²!=!0.96662!
0!
5!
10!
15!
20!
25!
0! 20! 40! 60! 80!
Expe
rimen
tal*N
i*Extrac'on
*(%)*
Long*Term*Ni*Extrac'on*(%)*
MS!data!216h!Leach!
y!=!0.3303x!+!0.088!R²!=!0.96631!
0!
5!
10!
15!
20!
25!
30!
0! 20! 40! 60! 80!
Expe
rimen
tal*N
i*Extrac'on
*(%)*
Long*Term*Ni*Extrac'on*(%)*
MS!data!240h!Leach!
Figure 3.20 Calibration leach curves for “Ore Samples C, D, F, G and H” in 20% sulfuric acid for selected time periods – ICP-MS data.
!

! 80!
y!=!0.0228x!+!0.9501!R²!=!0.5298!
0!
0.5!
1!
1.5!
2!
2.5!
3!
0! 20! 40! 60! 80!
Expe
rimen
tal*N
i*Extrac'on
*(%)*
Long*Term*Ni*Extrac'on*(%)*
AES!data!24h!Leach!
y!=!0.0344x!+!0.9774!R²!=!0.78375!
0!0.5!1!
1.5!2!
2.5!3!
3.5!4!
0! 20! 40! 60! 80!
Expe
rimen
tal*N
i*Extrac'on
*(%)*
Long*Term*Ni*Extrac'on*(%)*
AES!data!48h!Leach!
y!=!0.0402x!+!1.1181!R²!=!0.85026!
0!0.5!1!
1.5!2!
2.5!3!
3.5!4!
4.5!
0! 20! 40! 60! 80!
Expe
rimen
tal*N
i*Extrac'on
*(%)*
Long*Term*Ni*Extrac'on*(%)*
AES!data!72h!Leach!
y!=!0.1545x!+!0.3855!R²!=!0.96021!
0!
2!
4!
6!
8!
10!
12!
14!
0! 20! 40! 60! 80!
Expe
rimen
tal*N
i*Extrac'on
*(%)*
Long*Term*Ni*Extrac'on*(%)*
AES!data!144h!Leach!
y!=!0.1726x!+!0.3458!R²!=!0.96296!
0!
2!
4!
6!
8!
10!
12!
14!
0! 20! 40! 60! 80!
Expe
rimen
tal*N
i*Extrac'on
*(%)*
Long*Term*Ni*Extrac'on*(%)*
AES!data!168h!Leach!
y!=!0.1972x!+!0.1734!R²!=!0.96142!
0!2!4!6!8!
10!12!14!16!
0! 20! 40! 60! 80!
Expe
rimetna
l*Ni*Extrac'on
*(%)*
Long*Term*Ni*Extrac'on*(%)*
AES!data!192h!Leach!
y!=!0.2202x!+!0.0576!R²!=!0.96632!
0!2!4!6!8!10!12!14!16!18!
0! 20! 40! 60! 80!
Expe
rimen
tal*N
i*Extrac'on
*(%)*
Long*Term*Ni*Extrac'on*(%)*
AES!data!216h!Leach!
y!=!0.2497x!W!0.0513!R²!=!0.96878!
0!
5!
10!
15!
20!
0! 20! 40! 60! 80!
Expe
rimetna
l*Ni*Extrac'on
*(%)*
Long*Term*Ni*Extrac'on*(%)*
AES!data!240h!Leach!
Figure 3.21 Calibration leach curves for “Ore Samples C, D, F, G and H” and unknown “Ore sample E”, in 20% sulfuric acid for selected time periods – ICP-AES data.
!
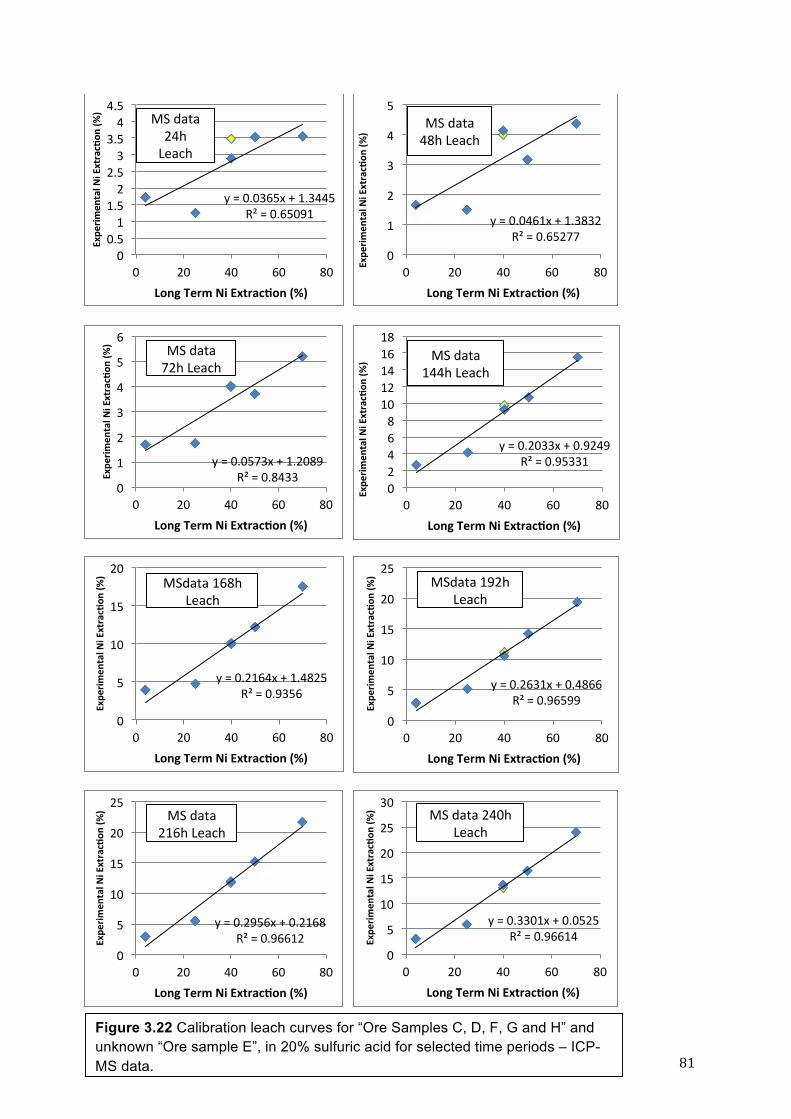
! 81!
y!=!0.0365x!+!1.3445!R²!=!0.65091!
0!0.5!1!
1.5!2!
2.5!3!
3.5!4!
4.5!
0! 20! 40! 60! 80!
Expe
rimen
tal*N
i*Extrac'on
*(%)*
Long*Term*Ni*Extrac'on*(%)*
MS!data!24h!Leach!
y!=!0.0461x!+!1.3832!R²!=!0.65277!
0!
1!
2!
3!
4!
5!
0! 20! 40! 60! 80!
Expe
rimen
tal*N
i*Extrac'on
*(%)*
Long*Term*Ni*Extrac'on*(%)*
MS!data!48h!Leach!
y!=!0.0573x!+!1.2089!R²!=!0.8433!
0!
1!
2!
3!
4!
5!
6!
0! 20! 40! 60! 80!
Expe
rimen
tal*N
i*Extrac'on
*(%)*
Long*Term*Ni*Extrac'on*(%)*
MS!data!72h!Leach!
y!=!0.2033x!+!0.9249!R²!=!0.95331!
0!2!4!6!8!10!12!14!16!18!
0! 20! 40! 60! 80!
Expe
rimen
tal*N
i*Extrac'on
*(%)*
Long*Term*Ni*Extrac'on*(%)*
MS!data!144h!Leach!
y!=!0.2164x!+!1.4825!R²!=!0.9356!
0!
5!
10!
15!
20!
0! 20! 40! 60! 80!
Expe
rimen
tal*N
i*Extrac'on
*(%)*
Long*Term*Ni*Extrac'on*(%)*
MSdata!168h!Leach!
y!=!0.2631x!+!0.4866!R²!=!0.96599!
0!
5!
10!
15!
20!
25!
0! 20! 40! 60! 80!
Expe
rimen
tal*N
i*Extrac'on
*(%)*
Long*Term*Ni*Extrac'on*(%)*
MSdata!192h!Leach!
y!=!0.2956x!+!0.2168!R²!=!0.96612!
0!
5!
10!
15!
20!
25!
0! 20! 40! 60! 80!
Expe
rimen
tal*N
i*Extrac'on
*(%)*
Long*Term*Ni*Extrac'on*(%)*
MS!data!216h!Leach!
y!=!0.3301x!+!0.0525!R²!=!0.96614!
0!
5!
10!
15!
20!
25!
30!
0! 20! 40! 60! 80!
Expe
rimen
tal*N
i*Extrac'on
*(%)*
Long*Term*Ni*Extrac'on*(%)*
MS!data!240h!Leach!
Figure 3.22 Calibration leach curves for “Ore Samples C, D, F, G and H” and unknown “Ore sample E”, in 20% sulfuric acid for selected time periods – ICP-MS data.
!

! 82!
Figure 3.23. Calibration curves produced for the relative relationship between the extractability of nickel using both ICP-AES and ICP-MS and describing the relationship between long and short term extractability of this metal from various refractory ores
Consequently, it is valid to suggest that starting a leach regime on a Monday morning would
provide data by Friday afternoon that could be used to give an accurate estimation of the long
term extractability of refractory ores. This claim obviously needs to be validated by further
study. However, the study would seem worthwhile especially as there is a solid indication that
within a period of five days it would be possible to grade the refractivity of ores for which it has
previously been necessary to take a period of up to six months to provide equivalent data.
0!2!4!6!8!10!12!14!16!18!20!
0! 100! 200! 300!
Nic
kel E
xtra
ctio
n (%
)
Time (h)
ICP-AES data C-50% D-25% E-40% F-40% G-70% H-4%
0!
5!
10!
15!
20!
25!
30!
0! 100! 200! 300!
Nic
kel E
xtra
ctio
n (%
)
Time (h)
ICP-MS data C-50% D-25% E-40% F-40% G-70% H-4%

! 83!
CHAPTER 4
CONCLUSION & FUTURE WORK
The research undertaken in this thesis was designed to try and establish a leaching protocol
that would be able to estimate the long term extractability of nickel from refractory and non-
refractory ores. A range of lateritic (oxide) ores, having nickel extractability ranging between
4% and 70%, were tested under a variety of single and mixed acid leaching conditions over
leaching periods of 240 hours. The relative nickel extractability is largely the result of
variability in the refractiveness of the goethite, an iron hydroxy-oxide mineral in the ore, which
primarily contains the nickel. Research was divided into two parts. In phase one, test samples
A and B (8% and 66% nickel extractability respectively) were tested, while in phase two, six
ores with nickel extractabilities between 4% and 70% were used. The phase one tests involve
exposing the two ore samples to a variety of inorganic and organic acids, and to combinations
of sulphuric acid and organic acids, to try and develop relative leach curves that would give an
approximate 1:8 extraction relationship between the two ores over a leaching period of 240h
or less. The ratio factor has been calculated as that which the final six month long term leach
tests indicate to be the relative nickel leachabilities of the two ores.
Results indicate that 20% v/v Aqua Regia and 20% v/v H2SO4, have the highest nickel
extraction efficiency, followed by 20% v/v HCl and 20% v/v HNO3. Even though there is a
significant difference in all cases between the extraction efficiency of the two samples
(refractory and non-refractory) the relative nickel extraction efficiency of the two ores never
approaches the 1:8 ratio required for these leaching conditions to indicate the long term
relative extraction efficiency of the two ores. Consequently, none of the inorganic based acid
leach regimes investigated appear useful as predictors to the long term extraction behaviour
of the ores.

! 84!
The second part of phase one research involved the use of organic acids (tartaric, citric and
oxalic) which can form complexes with those ions and cations already in solution and
therefore increase the ultimate extractability of the nickel. Again, none of the organic acids
leaching regimes used produced the 1:8 ratio required to indicate long term nickel
extractability of the two ores initially investigated in this study. However, one important aspect
that transpired from these experiments was that the selective leaching of manganese from
both these ores using citric and tartaric acids could possibly be used as a precursor to any
long term nickel leaching protocols to remove cobalt at an early stage of mine site extraction
initiatives as approximately 25% of the available cobalt is removed with only 1% of the iron
and nickel. As the relative costs of these two metals are significantly different this could be a
profitable pre-leach procedure where cobalt concentrations in the ore are relatively high.
In the third stage of phase one, ores were leached using a mixture of 10% H2SO4 and 10% v/v
of the three organic acids (citric, tartaric and oxalic). Again, none of these acid combinations
resulted in comparison ratios of 1:8 required for these mixtures to be used as short term
indicators of the ultimate leaching potential of the two ores.
In order to study the effect of heat on nickel extractability, samples were calcined at various
temperatures up to 1000°C for a period of two hours, and then leached using a 20 % v/v
sulphuric, Aqua Regia, nitric and hydrochloric acid solutions. The changes in mineralogy,
associated with heating the samples at these temperatures, were investigated using XRD.
The nickel extraction efficiency of both ores increased significantly, up to calcining
temperatures of 500oC, after which temperature there is a rapid decline in nickel extraction
efficiency of the ores to almost zero. While the lower calcining temperatures directly affect the
crystal structure of the goethite, causing lattice rearrangement and consequent increase in the
ease with which nickel can be leached, the higher temperatures cause any goethite present to
be changed, by removal of the OH- radical, into haematite which effectively binds the nickel
into a refractory crystal and almost completely eliminates extractability of this metal. In all of
! 85!
these experiments, none of the extraction protocols investigated produced the required
relative ratio of nickel extractability of 1:8.
At this stage of the research it can be concluded that it is not possible to develop a short term
leaching protocol that will give an indication of the relative extraction efficiency of the two ores
and consequently the ability to use this concept for any other ore must also be considered
improbable. However, CSIRO Division of Process Science and Engineering provided six
additional samples that had enough mass to be used in a further investigation, phase 2.
In phase 2, five laterite ore samples were used to generate nickel extraction curves under
20% v/v sulfuric acid leaching conditions over a 240h period. The data for these curves were
plotted against equivalent long term leach test data provided by CSIRO Division of Process
Science and Engineering to give graphs describing short term vs. long term nickel
extractability for the five ores (Comparable Extraction Graphs). These graphs indicate that
there is a linear relationship between the long and short term nickel extraction efficiencies of
the five ores and that after a period of a maximum of 144 hours the R2 values for the
regression lines have a value of approximately 0.96. This means that the regression line
represents at least 98% of the distribution of the points from which it has been constructed
and the resulting plot can therefore can be used as an exceptionally good “calibration” graph
for determining the nickel extractability of refractory and non-refractory nickel ores. When this
theory was tested using the remaining ore (40% nickel extractability) the results completely
confirmed this opinion (using all graphs representing extraction times between 75 and 240h)
giving nickel extraction efficiencies that varied by no more than +/-5% relative from the correct
value. The use of “Comparable Extraction Graphs” has the potential to save companies
significants amounts of money and time by being able to identify not only refractory and non-
refractory lateritic ores but also to quantify the relative long term (6 month) extractability of
these ores. However, before the idea can be adopted it is essential that more ores, with
markedly different mineralogy, be tested to confirm the theory and that, if correct, bulk ores be
provided to enable a relative nickel extraction efficiency series of standards to be prepared

! 86!
that can be circulated throughout the industry, to facilitate the adoption of this approach as
the industry standard.
FUTURE WORK
1) Undertake extraction experiments under different chemical (different acids and
different concentration) and physical (temperature, rolling speed and grain size)
conditions.
2) Use of a greater number of ores, of more diverse mineralogy, to test the ruggedness of
the Comparable Extraction Graph theory.
3) Reduce the extraction time required to produce useable short term extractability
graphs that indicate the long term extractability of ores.
4) Compare results to other experiments that involves different minerals and the
extraction of other analytes to try to find out similarities.
5) Acquire bulk samples of a wide range of refractory ores that can be used to produce a
standard series that can be used on-site to construct Comparable Extraction Graphs
for the determination of long term nickel extractability.
!
!
!
!
!
!
!

! 87!
REFERENCES
Agatzini-Leonardou, S., Tsakiridis, PE., Oustadakis, P., Karidakis, T. and Katsiapi, A. 2009, ‘Hydrometallurgical process for the separation and recovery of nickel from sulphate heap leach liquor of nickeliferrous laterite ores’. Mineral Engineering, Vol. 22, no. 14, pp.1181-1192.
Bames, SJ. and Lightfoot, PC. ‘2005’. Formation of magmatic nickel-sulfide ore deposits and processes affecting their copper and platinum groups elements contents’. Society of Economic Geology 100th Anniversary Volume, pp. 179-213.
Basile, A. Hughes, J. McFarlane, AJ. and Bhargava, SK. 2010, ‘Development of a model for serpentine quantification in nickel laterite minerals by infrared spectroscopy’. Mineral Engineering. Vol. 23, no. 5, pp. 407-412.
Boldt, JR. and Queneau, P. 1997,’The Winning of Nickel: Its Geology, Mining, and Extractive Metallurgy’. Methuen Publishing Ltd, Toronto, pp.25-78.
Bradley, K. 2011, ‘Nickel Applications & Uses’. Nickel Institute. 8th annual China nickel Conference Shanghai. Available from: <http://www.nickelinstitute.org/~/Media/Files/Presentations/NickelApplicationsandUsesShanghai0511.pdf>. [15 November 2011].
Buyukakinci, E. and Topkaya, YA. 2009, ‘Extraction of nickel from lateritic ores at atmospheric pressure with agitation leaching’. Hydrometallurgy, Vol. 97, no. 1-2. pp. 33-38.
Castro, IM. Fietto, JLR. Vieira, MJM. Campos, LMM. Paniago, EB. and Brandao, RL. 2000, ’Bioleaching of zinc and nickel from silicates using Aspergillus niger cultures’. Hydrometallurgy. Vol. 57, no. 1, pp. 39-49.
Chander, S. 1982; ‘Atmospheric pressure leaching of nickeliferous laterites in acidic media’. Transactions of the Indian Institute of metals, Vol. 35.
Chang, Y. Zhai, X. Li, B. Fu, Y. 2010, ‘Removal of iron from acidic leach liquor of lateritic nickel ore by goethite precipitate’. Hydrometallurgy. Vol. 101, no. 1-2, pp. 84-87.
Cornell, M. Schwertmann, U. 2003, ‘The iron Oxides; Structure, Properties, Reactions, Occurrences and Uses’. Second, Completely Revised and Extended Edition, WILEY-VCH. Weinheim, Germany.
Dalvi, AD., Gordon, B. and Osborner, RC. 2004, ‘The past and the future of Nickel laterites’. PDAC International Convention, Trade Show & Investors Exchange. [7 March 2004].
Dhawan, N., Safarzadeh, SM., Miller, JD., Moats, MS. and Rajamani, RK. 2013, ‘Crushed ore agglomeration and its control for heap leach operations’. Minerals Engineering, Vol. 41, pp. 53-70.
Evans, JW. 2003, ‘Metal production: Electrometallurgy’. Science and Technology. Encyclopedia of materials; Science and technology (second edition), University of California, Berkeley, CA, USA, pp. 1-12.

! 88!
Frank, KC., Muchael, SM., Ramachandran, V., Robinson, TG. and Davenport, WG. 2011, ‘Carbonyl Refining impure nickel metal’. Extractive Metallurgy of Nickel, Cobalt and Platinum Group Metals. Elsevier Ltd, pp. 269-280.
Ghorbani, Y., Becker, M., Mainza, A., Franzidis, JP. and Petersen, J. 2011, ‘Large particle effect in chemical/biochemical heap leach processes – A review. Mineral Engineering, Vol. 24, no. 11, pp. 1172-1184.
Gimbutas, M. 1965, ‘Bronze Age Cultures in Central and Eastern Europe’, Mouton and Co, Publishers, The Hague, Netherlands.
Graaf, JE. 1980, ‘The treatment of lateritic nickel ores- A further study of the caron process and other possible improvements, Part II. Leaching studies. Hydrometallurgy, Vol. 5, no. 2-3, pp. 255-271.
Guang-hui, L., Ming-jun, R., Qian, L., Zhi-wei, P. and Jiang, T. 2010, ‘Extraction of cobalt from laterite ores by citric acid in presence of ammonium bifluoride’. Transaction of Nonferrous Metals Society of China. Vol, 20. no. 8, pp. 1517-1520.
Hallberg K., Grail B., Plessis C. and Johnson B. 2010, ‘Reductive dissolution of ferric iron minerals: A new approach for bio-processing nickel laterites’. Mineral Engineering. Vol, 24. no. 7, pp. 620-624.
Hoatson, DM., Jaireth, S. and Jaques, AL. 2006, ’Nickel sulfide deposits in Australia: Characteristics, resources, and potential’. Ore Geology Reviews, Vol. 29, no. 3-4, pp. 177-241.
Howard-White, FB. 1963, ‘Nickel and historical review’, Mehuen, London.
Jaques, AL., Huleatt, MB., Ratajkoski, M. and Towner, RR. 2005, ‘Exploration and discovery of Australia’s copper, nickel, lead and zinc resources 1976-2005’. Resources Policy, Vol. 30, no. 3, pp. 168-185.
Kaya, S. and Topkaya, YA. 2011, ‘High pressure acid leaching of a refractory lateritic nickel ore’. Minerals engineering. Vol. 24, no. 11, pp. 1188-1197.
Landers, M., Gilkes, RJ. and Wells, M. 2009, ‘Dissolution Kinetics of dehydroxylated nickeliferous goethite from limonitic laterite nickel ore’. Applied Clay Science. Vol. 42, no. 3-4, pp. 615-624.
Lee, RT., Liu, CT., Chiou, YC. and Chen, HL. 2012, ‘Effect of nickel coating on the shear strength of FSW lap join between Ni-Cu alloy and steel’. Journal of materials processing technology, Vol. 213, no. 1, pp. 69-74.
Li, J., Bunney, K., Watling, HR. and Robison, DJ. 2013, ‘Thermal pre-treatment of refractory limonite ores to enhance the extraction of nickel and cobalt under heap leaching conditions’. Minerals Engineering. Vol. 41. pp.71-78.
London Metal Exchange, 2012, Market information, Available from; <http://www.lme.com/nickel_graphs.asp>. [8 November 2012].

! 89!
McDonald, RG and Whittington, BI. 2008, ‘Atmospheric acid leaching of nickel laterites review Part I. Sulphuric acid technologies’. Hydrometallurgy, Vol. 91, no. 1-4, pp. 35-55.
Melekestseva, Y., Zaykov, VV., Nimis, P., Tretyakov, GA. and Tessalina, SG. 2013, ‘Cu-(Ni-Co-Au)-bearing massive sulphide deposits associated with mafic-ultramafic rocks of the main Urals Fault, South Urals: Geological structures, ore textural and mineralogical features, comparison with modern analogs’. Ore Geology Reviews, Vol. 52, no. 3, pp. 18-36.
Mishra, B. 2001, ‘Cobalt and Nickel Production’. Encyclopedia of Materials: Science and Technology. Elsevier Ltd. pp. 1288-1294.
Mudd, GM. 2007, ‘An analysis of historical production trends in Australia base metal mining’. Ore Geology Reviews, Vol. 32, no. 1-2, pp. 227-261.
Mudd, GM. 2009, ‘Nickel Sulfide Versus Laterite: The Hard Sustainablity Challenge Remains’. Proc.”48th Annual Conference of Metallurgist”, Canadian Metallurgical Society, Sudbury, Ontario, Canada, August 2009.
Mudd, GM. 2010, ‘Global trends and environmental issues in nickel mining: Sulfides versus laterites’. Ore Geology Reviews, Vol. 38, no. 1-2, pp. 9-26.
Nickel 2008. Minerals report, Available from: British Geological Survey. Available from; <http://www.bgs.ac.uk/mineralsuk/industry/2008/08nov.html>, [14 January 2012].
Norgate, T. and Jahanshahi, S. 2010, ‘Assessing the energy and greenhouse gas footprints of nickel laterite processing’. Minerals Engineering, Vol. 24, no. 7, pp. 698-707.
Oxley, A., Sirvanci, N., Purkiss, S. and Caldag, F. 2006, ‘Nickel laterite atmospheric heap leach kinetics’, XXIII International Mineral Process Congress. Istanbul. Turkey. pp. 1511-1514.
Pearce, OM. 1987, ‘Nickel: an Industry in Transition’. International Journal of Mineral Processing, Vol. 19, pp. 5-14.
Pierre-Jean, C. 2004, ‘Alloying Elements in Stainless Steel and Other Chromium-Containing Alloys’. Chromium Development Association. Available from: <! http://www.euro-inox.org/pdf/map/AlloyingElements_EN.pdf>. [11 February 2012].
Plasket, RP. and Romanchuk, S. 1978, ‘Recovery of nickel and copper from high-grade matte at Impala Platinum by the Sherritt process’. Hydrometallurgy, Vol. 3, no. 2, pp. 135-151.
Radivojević, M., Rehren, T., Pernicka, E., Šljivar, D., Brauns, M. and Borić, D. 2010, ‘On the origins of extractive metallurgy: new evidence from Europe’. Journal of Archaeological Science, Vol. 37, no. 11, pp. 2775-2787.
Senanayake, G., Chids, J., Akerstrom, BD., Pugaev. 2010, ‘Reductive acid leaching of laterite and metal oxides – A review with new data for Fe(Ni,Co)OOH and a limonitic ore’. Hydrometallurgy, Vol. 110, pp.13-12.
Tang, JA. and Valix, M. 2006, ‘Leaching of low grade limonite and nontronite ores by fungi metabolic acids’. Minerals Engineering, Vol. 19, no. 12, pp. 1274-1279.

! 90!
Tarasova, I., Dudeney, W. and Pilurzu, S. 2001, ‘Glass sand processing by oxalic acid leaching and photocatalytic effluent treatment’. Minerals Engineering, Vol.14, no. 6, pp. 639-646.
Tzeferis, PG. 1994, ‘Leaching of a low grade hematitic laterite ore using fungi and biologically produced acid metabolites’. International journal of mineral processing, Vol. 42, no. 3-4, pp. 267-283.
Watling, HR., Elliot, AD., Fletcher, HM., Robinson, DJ. and Sully, DM. 2012, ‘Ore mineralogy of nickel laterites: controls on processing characteristics under simulated heap-leach conditions’. CSIRO process science and engineering.
Yongue-Fouateu, R., Ghogomu, R., Penaye, J., Ekodeck, G., Stendal, H. and Colin, F. 2006,’ Nickel and cobalt distribution in the laterites of the Lomie region, south-east Cameroon’. Journal of African Earth Sciences. Vol. 45, no. 1, pp. 33-47.!
!

! 91!
APPENDIX
Table 1 XRD Instrumentation parameters.
Scan!Axis! Gonio!
Start!Position![°2Th.]! 10.0033!
End!Position![°2Th.]! 79.9893!
Step!Size![°2Th.]! 0.0070!
Scan!Step!Time![s]! 8.6700!
Scan!Type! Continuous!
PSD!Mode! Scanning!
PSD!Length![°2Th.]! 3.35!
Offset![°2Th.]! 0.0000!
Divergence!Slit!Type! Fixed!
Divergence!Slit!Size![°]! 0.1250!
Specimen!Length![mm]! 10.00!
Measurement!Temperature![°C]! 25.00!
Anode!Material! Cu!
KZAlpha1![Å]! 1.54060!
KZAlpha2![Å]! 1.54443!
KZBeta![Å]! 1.39225!
KZA2!/!KZA1!Ratio! 0.50000!
Generator!Settings! 40!mA,!40!kV!
Diffractometer!Type! 0000000011092810!
Diffractometer!Number! 0!
Goniometer!Radius![mm]! 240.00!
Dist.!FocusZDiverg.!Slit![mm]! 100.00!
Incident!Beam!Monochromator! No!
Spinning! No!

! 92!
Table 2 Inorganic Leach.
Type of Acid for Sample A
% of Extraction of Manganese
% of Extraction of Iron
% of Extraction of Cobalt
% of Extraction of Nickel
H2SO4 24.2 21.4 21.2 7.7 HCl 24.6 11.7 20.8 6.6 Aqua Regia 31.5 14.2 27 7.9 HNO3 7.1 3.3 4.5 1.9 Type of Acid for Sample B
% of Extraction of Manganese
% of Extraction of Iron
% of Extraction of Cobalt
% of Extraction of Nickel
H2SO4 4.5 5.6 5.4 3.2 HCl 5.6 3 6.5 2.6 Aqua Regia 6.6 3.5 7.8 3.5 HNO3 2.3 2.1 3 1.5
Table 3. Organic Leach.
Type of Acid for Sample A
% of Extraction of Manganese
% of Extraction of Iron
% of Extraction of Cobalt
% of Extraction of Nickel
Oxalic 0.2M 12.5 19 15.4 9.14 Oxalic 0.5M 13.4 19.8 17.4 9.69 Oxalic 1M 15.8 22.4 19.2 11.33 Citric 0.2M 13.9 0.45 14.9 0.97 Citric 0.5M 15.4 0.53 16.6 1.1 Citric 1M 16.6 0.57 17.9 1.23 Tartaric 0.2M 27.6 1.13 23.2 1.99 Tartaric 0.5M 27.8 1.42 25 1.94 Tartaric 1M 32.3 1.77 26.2 2.6 Type of Acid for Sample B
% of Extraction of Manganese
% of Extraction of Iron
% of Extraction of Cobalt
% of Extraction of Nickel
Oxalic 0.2M 38 34 4.4 2.14 Oxalic 0.5M 27.4 25.8 2.4 3.69 Oxalic 1M 29.8 32.4 2.2 3.33 Citric 0.2M 2.9 0.45 3.3 0.77 Citric 0.5M 3.2 0.56 3.6 0.9 Citric 1M 3.1 0.7 3.6 1.03 Tartaric 0.2M 3.2 0.6 3.5 0.9 Tartaric 0.5M 4.4 1.42 4.4 1.6 Tartaric 1M 4.3 1.2 4.2 1.3

! 93!
Table 4. Mixture Leach.
Type of Acid for SAMPLE A
% of Extraction of Manganese
% of Extraction of Iron
% of Extraction of Cobalt
Oxalic + H2SO4 41.5 19.4 42.5 Citric + H2SO4 31.3 10.4 29.9 Tartaric + H2SO4 42.3 15.4 41.2 Type of Acid for SAMPLE B
% of Extraction of Manganese
% of Extraction of Iron
% of Extraction of Cobalt
Oxalic + H2SO4 10.8 14.2 14.2 Citric + H2SO4 5.12 4.9 6.77 Tartaric + H2SO4 5.35 3.27 6.81
Table 5. Oxidation Leach.
!! % Mn % Fe % Co %Ni !! % Mn % Fe % Co %Ni
Extraction Extraction Extraction Extraction Extraction Extraction Extraction Extraction Aqua Regia
Aqua Regia
Sample A
Sample B
250 ºC 28.4 16.7 19.1 7.89 250 ºC 4.79 3.72 6.15 2.52
400 ºC 77.5 98.3 57.6 52.7 400 ºC 57.5 84.8 68.6 42.9
500 ºC 81.7 96.4 67.4 52.8 500 ºC 51.8 77.5 73.1 42.2
600 ºC 61.5 66 54 31.4 600 ºC 31.1 32.2 46.7 24.9
750 ºC 35.8 9.52 47.1 9.2 750 ºC 20.3 6.86 42.2 14.7
1000 ºC 1.88 0.35 1.48 0.28 1000 ºC 1.43 0.15 0.93 0.36
HCl 24.6 11.7 20.8 6.57 HCl 5.56 3.02 6.49 2.56
Sample A Sample B
250 ºC 33.5 20.1 24.7 9.46 250 ºC 4.73 4.09 6.16 2.99
400 ºC 56.5 97.2 40.3 42.5 400 ºC 48.7 85.6 58.7 37
500 ºC 79.2 96 66.2 50.2 500 ºC 49.7 67.2 65.6 35.5
600 ºC 55.4 64.5 49.6 27.2 600 ºC 24.4 23.5 39.5 20.1
750 ºC 24.6 7.69 32.9 9.28 750 ºC 18 6.34 37.8 13.5
1000 ºC 1.74 0.34 1.37 0.27 1000 ºC 1.24 0.17 0.93 0.29
H2SO4 24.2 21.4 21.2 7.69 H2SO4 4.49 5.59 5.36 3.21
SAMPLE A SAMPLE B
250 ºC 45 32.4 37.6 15.7 250 ºC 6.12 5.94 8.29 4.51
400 ºC 45.1 101 33.6 49.1 400 ºC 33.52 97.15 40.21 24.89
500 ºC 97.8 102 76.7 58.8 500 ºC 58.27 92.62 73.03 43
600 ºC 30.4 84.3 25.7 15.9 600 ºC 21.17 40.24 30.21 15.9
750 ºC 30.7 11.6 38.2 11.2 750 ºC 20.36 8.52 42.44 15.4
1000 ºC 2.44 0.6 2.01 0.47 1000 ºC 1.24 0.17 0.88 0.22
HNO3 7.13 3.28 4.47 1.9 HNO3 2.26 2.07 3.02 1.48
SAMPLE A SAMPLE B
250 ºC 15.1 6.41 9.34 4.71 250 ºC 3.33 2.3 4.31 2.17
400 ºC 28.6 48.6 19.71 18.6 400 ºC 6.78 18 12.3 8.91
500 ºC 40.6 38.4 48.7 21.9 500 ºC 13 15.8 28.1 14.5
600 ºC 19.6 11.3 29.1 8.81 600 ºC 9.95 9.13 23 13
750 ºC 27 4.22 42.7 8.2 750 ºC 17.5 4.05 43.6 13.8
1000 ºC 1.51 0.21 1.36 0.24 1000 ºC 0.93 0.1 0.67 0.29

! 94!
Table!6.!Long Term Nickel Extractability of Analytes from the “Standard Samples
Long term field trials Analytes Mn Fe Co Ni
Ore Sample Number
Ni extraction percent ppm % ppm ppm
C 50 7650 51 815 10500
D 25 776 42 140 7180
E 40 10400 51 834 6600
F 40 5620 51 757 7400
G 70 4390 33 1270 8900
H 4 472 34 163 2880