development of an instrument to evidence knowledge ... · this document outlines the development of...
TRANSCRIPT
Development of an Instrument to Evidence Knowledge Abstractions in Technological/Engineering Design-Based Activities
Fred J. Figliano
Dissertation submitted to the Faculty of the Virginia Polytechnic Institute and State University
in partial fulfillment of the requirements for the degree of
Doctor of Philosophy
In Curriculum and Instruction
John G. Wells, Chair Brett D. Jones
Marie C. Paretti Jesse L. Wilkins
Thomas O. Williams Jr.
May 2, 2011 Blacksburg, Virginia
Keywords: Abstractions, Knowledge Transfer, Technological Design, Instrument Development,
Design Log
© 2011 Fred J. Figliano
Development of an Instrument to Evidence Knowledge Abstractions in Technological/Engineering Design-Based Activities
Fred J. Figliano
ABSTRACT
This document outlines the development of a Design Log Instrument (DLI) intended for use in identifying moments of abstraction as evidence of STEM content knowledge transfer. Many theoretical approaches to explaining knowledge transfer are rooted in a belief that transfer occurs through knowledge abstraction (Reed, Ernst, & Banerji, 1974; Gick & Holyoak, 1980, 1983). The DLI prompts participants to be reflective during technological/engineering design activities. During the development of this instrument, a three-phase multiple case: embedded design was used. Three distinct Phases accommodated the collection and analysis of data necessary for this investigation: Phase 1: Pilot Case Study, Phase 2: Establishing Content Validity, and Phase 3: Establishing Construct Validity. During Phase 3, data from the DLI was collected at each of seven work sessions from two design teams each working through different engineering problems. At the end of Phase 3, a comparison of abstractions found in DLI responses and observation data (Audio/Video transcripts) indicated the extent to which the DLI independently reflected those abstractions revealed in observations (Audio/Video transcripts). Results of this comparison showed that the DLI has the potential to be 68% reliable to reveal abstracted knowledge. Further analysis of these findings showed ancillary correlations between the percent abstractions found per DLI reflective prompt and the percent abstractions found per T/E design phase. Specifically, DLI Reflective Prompts 2 and 3 correlate with T/E Design Phases 3 and 4 (58% and 76% respectively of the total abstractions) which deal with design issues related to investigating the problem and developing alternate solutions. DLI Reflective Prompts 4 and 5 correlate with T/E Design Phases 5 and 6 (22% and 24% respectively of total abstractions) which deal with design issues related to choosing a solution and developing a prototype. Findings also indicate that there are highs and lows of abstraction throughout the T/E design process. The implications of these highs and lows are that specific phases of the T/E design process can be targeted for research and instruction. By targeting specific T/E design phases, a researcher or instructor can increase the likelihood of fostering abstractions as evidence of STEM content knowledge transfer.

iii
Dedication
I would like to dedicate this dissertation to my grandmother, Angelina Sganga. You have
always been an inspiration to me and I hope I have made you proud. You always tried to teach
all of your grandchildren to be better people and strive for the best, that lesson was not lost on
me. You are greatly missed and although you are no longer with us, I know you are always
looking down on me and you are always in my heart.
Dedico questa tesi a mia nonna, Angelina Sganga. Per me, Lei e` stata sempre fonte
d`ispirazione e spero d`averla resa orgogliosa. Ha sempre cercato d`insegnare a tutti i suoi nipoti
d`essere persone migliori e lottare per il meglio, le sue lezione non sono state perse su di me. Mi
manchi moltissimo e anche se non sei più con noi, so che sei sempre a guadare me. Nonna, sei
sempre nel mio cuore.

Acknowledgments
I would like to thank many people whom without I could not have completed this
dissertation. Firstly, I would like to thank my advisor and committee chair, Dr. John G. Wells.
Without your help and constant support, this dissertation would not have been possible. Even
when things were not going to plan you helped to guide me in the right direction. I cannot thank
you enough for the countless hours you have spent with me to get all aspects of this dissertation
just right. The lessons you have taught me will follow me for the rest of my life.
I would also like to thank my committee, Dr. Brett D. Jones, Dr. Marie C. Paretti, Dr.
Jesse L. Wilkins and Dr. Thomas O. Williams Jr. Without your support and advice, this
dissertation would not have been possible. The committee has played an instrumental role in the
success of this study and in a successful research experience.
My family and friends have also played a large role in the completion of this dissertation.
Your constant love and support have carried me through this process. My parents, Joe and
Raffaela Figliano and my brother Anthony Figliano have played an especially large role in the
completion of this study. I cannot thank you enough for seeing me through this and having me
always in your thoughts and prayers as you are in mine.

v
Table of Contents
DEDICATION ...................................................................................................................................................... iii
ACKNOWLEDGMENTS ........................................................................................................................................ iv
TABLE OF CONTENTS ........................................................................................................................................... v
LIST OF TABLES ................................................................................................................................................... ix
LIST OF FIGURES .................................................................................................................................................. x
CHAPTER I: INTRODUCTION ................................................................................................................................ 1
RATIONALE FOR THE STUDY .............................................................................................................................................. 3 PROBLEM STATEMENT .................................................................................................................................................... 4 NULL HYPOTHESIS (HO) ................................................................................................................................................... 5 RESEARCH QUESTIONS .................................................................................................................................................... 5 LIMITATIONS ................................................................................................................................................................. 5 DEFINITIONS ................................................................................................................................................................. 5
CHAPTER II: REVIEW OF LITERATURE AND THEORETICAL FRAMEWORK ............................................................... 9
THEORETICAL FRAMEWORK ............................................................................................................................................. 9 FOUNDATIONS OF STEM EDUCATION .............................................................................................................................. 18
The need for Integrative STEM Education. ......................................................................................................... 19 SCIENCE AND TECHNOLOGY LITERACY DRIVING KNOWLEDGE TRANSFER ................................................................................. 21 TECHNOLOGICAL/ENGINEERING DESIGN‐BASED LEARNING .................................................................................................. 26 USING TECHNOLOGICAL DESIGN IN SCIENCE EDUCATION ..................................................................................................... 28 KNOWLEDGE TRANSFER ................................................................................................................................................ 30
Transferring knowledge. .................................................................................................................................... 31 Near and far transfer. ........................................................................................................................................ 31 Meaningful learning. .......................................................................................................................................... 31 Vertical and lateral transfer. .............................................................................................................................. 32 Spontaneous and directed transfer. ................................................................................................................... 33 Low‐road and high‐road transfer. ...................................................................................................................... 33 Group and individual transfer. ........................................................................................................................... 34 Summary. ........................................................................................................................................................... 34
FOSTERING KNOWLEDGE TRANSFER IN T/E DESIGN‐BASED ACTIVITIES ................................................................................... 35 STUDYING KNOWLEDGE TRANSFER IN T/E DESIGN ............................................................................................................. 36 CASE STUDY METHODOLOGY ......................................................................................................................................... 37
Pilot case study................................................................................................................................................... 38 QUALITY OF RESEARCH ................................................................................................................................................. 39
Construct validity. .............................................................................................................................................. 39 Content validity. ................................................................................................................................................. 40 Reliability. ........................................................................................................................................................... 40
CHAPTER III: METHOD ....................................................................................................................................... 41
RESEARCH DESIGN ....................................................................................................................................................... 41 PARTICIPANTS ............................................................................................................................................................. 44 DATA COLLECTION AND ANALYSIS ................................................................................................................................... 46
Initial instrument development. ......................................................................................................................... 46 PHASE 1: PILOT CASE STUDY .......................................................................................................................................... 49
Data collection. .................................................................................................................................................. 49 Data analysis. ..................................................................................................................................................... 49
PHASE 2: ESTABLISHING CONTENT VALIDITY ..................................................................................................................... 50

vi
Data collection. .................................................................................................................................................. 50 Data analysis. ..................................................................................................................................................... 51
PHASE 3: ESTABLISHING CONSTRUCT VALIDITY .................................................................................................................. 52 Data collection. .................................................................................................................................................. 52 Data analysis. ..................................................................................................................................................... 52
CHAPTER IV: DATA ANALYSIS AND FINDINGS ..................................................................................................... 58
PHASE 1: PILOT CASE STUDY .......................................................................................................................................... 59 Reflective Prompt 1. ........................................................................................................................................... 62 Reflective Prompt 2. ........................................................................................................................................... 62 Reflective Prompt 3. ........................................................................................................................................... 62 Reflective Prompts 4 & 5. ................................................................................................................................... 63
PHASE 2: ESTABLISHING CONTENT VALIDITY ..................................................................................................................... 64 Content Validity Step 1. ...................................................................................................................................... 65 Content Validity Step 2. ...................................................................................................................................... 65 Content Validity Step 3. ...................................................................................................................................... 65
PHASE 2: CONTENT VALIDITY RESULTS ............................................................................................................................. 66 Introduction. ....................................................................................................................................................... 66 T/E Design Phase Descriptions. .......................................................................................................................... 67 DLI Reflective Prompts. ...................................................................................................................................... 69 Reflective Prompt 1. ........................................................................................................................................... 70 Reflective Prompt 2. ........................................................................................................................................... 71 Reflective Prompts 3 & 4. ................................................................................................................................... 71 Reflective Prompt 5. ........................................................................................................................................... 71 Summary. ........................................................................................................................................................... 72
PHASE THREE: ESTABLISHING CONSTRUCT VALIDITY ........................................................................................................... 72 INTERRATER RELIABILITY ................................................................................................................................................ 75
Team 1 Interrater Reliability. ............................................................................................................................. 76 Team 2 Interrater Reliability. ............................................................................................................................. 77
TEAM 1 DATA ANALYSIS ................................................................................................................................................ 79 TEAM 2 DATA ANALYSIS ................................................................................................................................................ 81 COMBINED TEAMS 1 AND 2 DATA ................................................................................................................................... 84
CHAPTER V: CONCLUSIONS AND RECOMMENDATIONS ...................................................................................... 89
DISCUSSION ................................................................................................................................................................ 89 CONCLUSIONS ............................................................................................................................................................. 92
Research question sub‐one (RQ‐S1). .................................................................................................................. 92 Research question sub‐two (RQ‐S2). .................................................................................................................. 93 Overarching research question. ......................................................................................................................... 94
IMPLICATIONS ............................................................................................................................................................. 96 Technology Education. ....................................................................................................................................... 96 T/E design based learning. ................................................................................................................................. 96 Knowledge transfer research. ............................................................................................................................ 97
RECOMMENDATIONS FOR FURTHER RESEARCH .................................................................................................................. 98 The Design Log Instrument................................................................................................................................. 98 Professional development. ................................................................................................................................. 98 Knowledge transfer research. ............................................................................................................................ 99
REFERENCES .................................................................................................................................................... 100
APPENDIX A .................................................................................................................................................... 113
A COMPARISON OF THE TECHNOLOGICAL DESIGN LOOP AND SCIENTIFIC INQUIRY WHEEL ........................................................ 113 Identifying Problems and Opportunities / Observing and Defining the Problem ............................................. 115

vii
Framing a Design Brief / Framing the Question and Articulating the Known .................................................. 116 Investigation and Research / Investigating the Known .................................................................................... 117 Generating Alternative Solutions / Carrying out the Study .............................................................................. 118 Choosing the Best solution / Carrying out the Study ........................................................................................ 119 Developmental Work / Carrying out the Study ................................................................................................ 120 Modeling and Prototyping / Carrying out the Study ........................................................................................ 121 Testing and Evaluation / Reflecting on the Findings ........................................................................................ 122 Redesigning and Improving / Communicating the Findings ............................................................................. 123
APPENDIX B .................................................................................................................................................... 124
PHASE 1: IRB APPROVAL LETTER .................................................................................................................................. 124 PHASE 1: IRB CONTINUATION REQUEST APPROVAL LETTER ............................................................................................... 126 PHASE 3: IRB APPROVAL LETTER .................................................................................................................................. 129
APPENDIX C .................................................................................................................................................... 132
PHASE 1: EMAIL SOLICITATION ..................................................................................................................................... 133
APPENDIX D .................................................................................................................................................... 134
PHASE 1: EMAIL SOLICITATION 2 .................................................................................................................................. 135
APPENDIX E .................................................................................................................................................... 136
PHASE 1: EMAIL SOLICITATION 3 .................................................................................................................................. 137
APPENDIX F..................................................................................................................................................... 138
PHASE 1: INFORMED CONSENT FORM ............................................................................................................................ 138 PHASE 3: INFORMED CONSENT FORM ............................................................................................................................ 140
APPENDIX G .................................................................................................................................................... 144
PHASE 1: INITIAL DESIGN LOG INSTRUMENT.................................................................................................................... 144
APPENDIX H .................................................................................................................................................... 151
INTRODUCTION PROTOCOL .......................................................................................................................................... 152
APPENDIX I ..................................................................................................................................................... 155
FIELD NOTE PROTOCOL ............................................................................................................................................... 155
APPENDIX J ..................................................................................................................................................... 157
END OF WORK SESSION PROTOCOL ............................................................................................................................... 158
APPENDIX K .................................................................................................................................................... 159
EJECTION PROTOCOL .................................................................................................................................................. 160
APPENDIX L ..................................................................................................................................................... 161
CONTENT VALIDITY INSTRUMENT .................................................................................................................................. 161
APPENDIX M ................................................................................................................................................... 163
END OF WORK SESSION PHASE 3 PROTOCOL ................................................................................................................... 164
APPENDIX N .................................................................................................................................................... 165
ANALYSIS RUBRIC ....................................................................................................................................................... 166
APPENDIX O .................................................................................................................................................... 167
RELIABILITY RUBRIC .................................................................................................................................................... 168

viii
APPENDIX P .................................................................................................................................................... 169
PHASE 1: WEEK ONE FIELD NOTE PROTOCOL .................................................................................................................. 169
APPENDIX Q .................................................................................................................................................... 171
PHASE 1: WEEK TWO FIELD NOTE PROTOCOL ................................................................................................................. 171
APPENDIX R .................................................................................................................................................... 173
PHASE 1: WEEK THREE FIELD NOTE PROTOCOL ............................................................................................................... 173
APPENDIX S .................................................................................................................................................... 175
INTERRATER RELIABILITY DATA MATRIX .......................................................................................................................... 176
APPENDIX T .................................................................................................................................................... 178
DATA MATRIX TEAM 1 ............................................................................................................................................... 178
APPENDIX U .................................................................................................................................................... 205
DATA MATRIX TEAM 2 ............................................................................................................................................... 205
APPENDIX V .................................................................................................................................................... 223
FINAL DESIGN LOG INSTRUMENT .................................................................................................................................. 223

ix
List of Tables
TABLE 1: DATA COLLECTION & ANALYSIS PLAN .................................................................................................. 43
TABLE 2: SAMPLE ANALYSIS RUBRIC OF PHASE 3 DATA ...................................................................................... 55
TABLE 3: INTERRATER RELIABILITY DATA MATRIX EXAMPLE .............................................................................. 56
TABLE 4: COMPARISON OF INITIAL AND FINAL DLI PROMPT ITERATIONS ........................................................... 61
TABLE 5: PHASE 2 MODIFICATIONS OF T/E DESIGN PHASE DESCRIPTIONS .......................................................... 67
TABLE 6: CONTENT VALIDITY RESULTS ............................................................................................................... 69
TABLE 7: PHASE 2 REVISIONS OF DLI REFLECTIVE PROMPTS ............................................................................... 70
TABLE 8: EXAMPLE DATA MATRIX ..................................................................................................................... 74
TABLE 9: STEM CONTENT CODING OPERATIONAL DEFINITIONS ......................................................................... 77
TABLE 10: TEAM 1 CODEBOOK .......................................................................................................................... 77
TABLE 11: TEAM 2 CODEBOOK .......................................................................................................................... 78
TABLE 12: TEAM 1 CONSOLIDATED DATA ANALYSIS ........................................................................................... 80
TABLE 13: TEAM 1 RELIABILITY RATIO ................................................................................................................ 81
TABLE 14: TEAM 2 CONSOLIDATED DATA ANALYSIS ........................................................................................... 83
TABLE 15: TEAM 2 RELIABILITY RATIO ................................................................................................................ 84
TABLE 16: COMBINED TEAMS RELIABILITY RATIO .............................................................................................. 84
TABLE 17: PERCENTAGE OF ABSTRACTIONS FOUND PER DLI REFLECTIVE PROMPT ............................................. 85
TABLE 18: PERCENTAGE OF ABSTRACTIONS FOUND PER T/E DESIGN PHASE ...................................................... 86
TABLE 19: FINAL DLI REFLECTIVE PROMPT REVISIONS ........................................................................................ 87
TABLE 20: SUMMARY OF CORRELATION BETWEEN % ABSTRACTION PER DLI REFLECTIVE PROMPT AND T/E DESIGN PHASE .................................................................................................................................................. 89

x
List of Figures
FIGURE 1: COMPARING THE ENGINEERING DESIGN PROCESS AND THE TECHNOLOGICAL DESIGN LOOP ............. 26
FIGURE 2: SCIENTIFIC INQUIRY WHEEL ............................................................................................................... 29
FIGURE 3: INITIAL INSTRUMENT DEVELOPMENT MATRIX ................................................................................. 48
FIGURE 4: CONTENT VALIDITY INDEX ................................................................................................................. 51

1
Chapter I: Introduction
Science, technology, engineering, and mathematics (STEM) literacy is a critical
component of 21st century education (AAAS, 1989, 1993; NCTM, 2000; ITEA, 2000). The need
for a STEM literate population provides the basis for America’s current educational reform
agenda. The central tenet of STEM literacy is the preparation of people who are knowledgeable
of the connections between the content and practices of the STEM fields. This is in contrast to
the silo method of education, which teaches the STEM disciplines independently of each other.
When conceived as an integrative curriculum model designed around teamwork and problem-
solving environments, Integrative STEM education is the ideal pathway for achieving STEM
literacy (Sanders, 2008, 2006b; Wells, 2008).
Each STEM discipline views teaching and learning from a different pedagogical lens.
Mathematics educators use problem solving as a way of thinking that involves building and
applying abstract, logically connected networks of ideas (Rutherford & Ahlgren, 1990). These
networks of abstraction act as a framework for solving novel mathematical problems. Science
education employs the scientific method of inquiry. The inquiry activity is generated from
student experiences and “predominantly [based] on real phenomena, in classrooms, outdoors, or
in laboratory settings, where students are given investigations or guided toward fashioning
investigations that are demanding but within their capabilities” (NRC, 1996, p. 31).
Technology education uses an open-ended technological design-based learning pedagogy
(ITEA, 2000). In open-ended technological design-based learning students are presented with a
real world design problem. Students are encouraged to develop their own knowledge base and
criteria for their final solution, usually under the guidance of the teacher (Barrows, 1986). The
students solve this real world problem using a technological design approach. This approach

2
includes defining the problem, stating a need, collecting information, developing alternative
solutions, choosing an optimal solution, prototyping, and evaluation (Hutchinson & Karsnitz,
1994; Raizen, Sellwood, Todd, & Vickers, 1995; Wells, 2008). As the remaining discipline of
STEM education, engineering education incorporates science, technology, and mathematics as
no other discipline does (EAC, 2004; NAE, 2004). Engineering is essentially a marriage of
science, technology, and mathematics applied to help solve real world problems. Engineering
education utilizes the engineering design process as a method to solve these real world problems
(EAC, 2004; NAE, 2004). Similar to technological design, engineering design is “the systematic
and creative application of science and mathematical principles to practical ends such as the
design, manufacture, and operation of efficient and economical structures, machines, processes,
and systems” (ITEA, 2000, p.238).
The pedagogies of technology education and engineering education utilize a design
process to bring science, technology, engineering, and mathematics together in concert to solve
real-world problems. This technological/engineering (T/E) design process has strong potential
for application in bringing STEM concepts together to solve real-world problems (Sanders, 2006,
2007; Wells, 2010, 2008, 2007a, 2007b, 2006). Throughout the T/E design process, there are
many opportunities for students to use the knowledge learned in one discipline and apply it to the
problems presented in another. For example, if a student is trying to design a bridge he/she needs
to have some understanding of forces, which is knowledge learned in physics. The student would
also need to understand how to apply mathematical calculations to help solve this problem. This
process of activating knowledge gained in one context and used in another is “knowledge
transfer.” A traditional definition of knowledge transfer is “the ability to apply knowledge or use
knowledge from one problem, situation or context to another” (Anderson, 2005). Although

3
Anderson’s definition is a broad understanding of knowledge transfer, other researchers have
taken a more specific approach to its study. Many theoretical approaches to explaining
knowledge transfer are rooted in a belief that knowledge becomes generalizable through its
abstraction. Reed, Ernst, and Banerji (1974) and Gick and Holyoak (1980, 1983) hypothesized
that the construction of abstract rules, schemata, or other mental representations serve as the
primary cognitive support for knowledge transfer. Other theorists in the field also support the
belief that abstractions are mental representations of knowledge transfer (Fuchs, Fuchs, Prentice,
Burch, Hamlett, Owen, Hosp, & Jancek 2003; Gentner, Loewenstein, & Thompson, 2003;
Gentner & Markman, 1997; Gentner & Medina, 1998; Reed, 1993; Singley & Anderson, 1989).
By theorizing there is a connection between abstractions and the transfer of knowledge, it is
possible to develop studies to substantiate this connection. Requisite of any such study would be
operationalizing what constitutes a connection. Therefore, for this study the operationalized
version of Anderson’s definition of knowledge transfer was the abstraction of any knowledge,
information, or experiences by participants and used when trying to understand higher order
concepts. The T/E design process is uniquely suited to foster knowledge transfer because
knowledge from different content areas provides the foundation of solving real-world problems.
Rationale for the Study
Through participation in the ongoing work of Dr. John G. Wells on investigating the use
of Design-Based Biotechnology LiteracyTM (DBBLTM) Problem Scenarios, the researcher of this
study was made aware of the potential for research in this area. The main goal of Wells’ work
was to investigate the transfer of science and technology content/concepts during DBBLTM
Problem Scenarios (Wells, 2010; Wells, White, & Dunham, 2000) developed to intentionally
promote knowledge transfer. In order for Wells to investigate knowledge transfer in DBBLTM

4
ProbScens, an instrument was needed, capable of generating evidence of transfer. The study
presented in this document builds on Wells’ prior work (2010, 2008, 2007a, 2007b, 2006) to
develop a valid knowledge transfer instrument that could be used for any T/E design-based
learning activity.
Technological/engineering (T/E) design has been identified as a core element for literacy
by the Standards for Technological Literacy (ITEA, 2000), the National Science Education
Standards (NRC, 1996), and the Criteria for Accrediting Engineering Programs (Engineering
Accreditation Board [ABET], 2004). As the benefits of a T/E design approach become clearer,
further empirical evidence is needed to show how effective a T/E design approach is to foster the
transfer of STEM content knowledge. T/E design activities that promote teamwork and social
interaction enhance the transfer of knowledge (Fortus, 2005). Current literature reveals that we
do not yet fully understand what effect T/E design has on the transfer of STEM content
knowledge. The research in this case study therefore addresses the need to better understand the
transfer of STEM content knowledge and build a body of empirical evidence by attempting to
identify instances of transfer throughout the T/E design process. Doing so will provide
researchers with an instrument that will allow them to make judgments regarding instances of
transfer in T/E design.
Problem Statement
The problem that this study addresses is the need for ample empirical evidence to support the
belief that the Design Log Instrument (DLI) can facilitate the evidencing of STEM content
knowledge transfer.
5
Null Hypothesis (Ho)
The use of a DLI does not provide data to allow a researcher to make judgments regarding the
transfer of STEM content knowledge.
Research Questions
This study investigates the following research questions:
• In what ways does the use of a Design Log provide evidence of the transfer of STEM
content knowledge while students are engaged in a technological/engineering design-
based learning activity?
RQ-S1 What phrasing of Design Log reflective prompts effectively reveal STEM
content connections?
RQ-S2 To what extent can a Design Log instrument allow a researcher to make
judgments regarding the transfer of STEM content knowledge?
Limitations
1. The results of this instrument development are not generalizable beyond undergraduate
engineering science students at the large southeastern university where this study took
place.
2. Although its intended use was with all students engaged in T/E design, only engineering
students tested the DLI.
Definitions
Integrated Curriculum
An educational sequence organized in such a way that “cuts” across disciplines and
teaches students to transfer knowledge to the real world (Beane, 1997; Drake & Burns,
2004; NCTE, 1935; Pring, 1973; Shoemaker, 1989).

6
Integrative Curriculum
An educational curriculum that intentionally fosters disciplinary connections
through coursework that involves the use of knowledge from several different disciplines
(Drake & Burns, 2004; Sanders, 2008; Wells, 2008).
Integrative STEM Education
Technological/Engineering design-based learning approaches that intentionally integrate
the content and process of science and/or mathematics education with the content and
process of technology and/or engineering education. Integrative STEM Education may be
enhanced through further integration with other school subjects such as language arts,
social studies, art, etc. (Sanders & Wells, 2010).
Knowledge Transfer
The abstraction of any knowledge, information, or experiences by participants and used
when trying to understand higher order concepts (Anderson, 2005; Fuchs, et. al, 2003;
Gagné, Wager, Golas, & Keller, 2005; Gagné & Paradise, 1961; Gentner & Markman,
1997; Gentner & Medina, 1998; Gentner, Loewenstein, & Thompson, 2003; Gick &
Holyoak 1980, 1983, 1987; Lobato, 1997, 2003, 2006; Reed, Ernst, & Banerji 1974;
Reed, 1993; Singley & Anderson, 1989).
Vertical Knowledge Transfer
Vertical transfer represents the relationship between higher order and lower order
cognitive skills (Gagne, 1969).
Lateral Knowledge Transfer
Lateral transfer occurs when skills learned at roughly the same cognitive skill level
transfer to a new context (Gagne, 1969).

7
Abstraction
To abstract a principle is to identify a generic quality or pattern across instances of the
principle. In formulating an abstraction, an individual deletes details across exemplars,
which are irrelevant to the abstract category…These abstractions are represented in
symbolic form and avoid contextual specificity so they can be applied to other instances
or across situations (Fuchs, Fuchs, Prentice, Burch, Hamlett, Owen, 2003,
p. 294)
Open-Ended Problem-Based Learning
An approach to teaching and learning where students work through a real-world problem
designed to foster free inquiry. They can develop their own database and hypothesis -
usually under the guidance of the teacher (Barrows, 1986).
Problem-Based Learning
Problem-based learning is a phrase that describes acquiring knowledge, information, and
learning techniques and processes while working toward the solution to a problem, on an
investigation, or toward the production of a product (Glasgow, 1997).
Technological Design-Based Learning
Technological design-based learning poses real world problems to students. Students then
work through the problem using a design approach. This approach includes defining the
problem, stating a need, collecting information, developing alternative solutions,
choosing an optimal solution, prototyping, and evaluation (Hutchinson & Karsnitz, 1994;
Raizen, Sellwood, Todd, & Vickers, 1995; Wells, 2008).

8
Engineering Design
The systematic and creative application of science and mathematical principles to
practical ends such as the design, manufacture, and operation of efficient and economical
structures, machines, processes, and systems (ITEA, 2000, p.238).
Technology
Broadly speaking, technology is how people modify the natural world to suit their own
purposes. From the Greek word techne, meaning art or craft, technology literally means
the act of making or constructing, but more generally, it refers to the diverse collections
of processes and knowledge that people use to extend human abilities (ITEA, 2000, p.2)

9
Chapter II: Review of Literature and Theoretical Framework
An exploration is presented here of the relevant literature reviewed in an effort to inform
the researcher of the research problem and to broaden understandings of the topics presented
within this study. Organized around five themes, this exploration includes the theoretical
framework, foundations of STEM education, design and inquiry, knowledge transfer, and ways
of studying knowledge transfer. An appropriate understanding of these topics is requisite to the
development and implementation of this studies’ research design.
Knowledge transfer has traditionally been defined as “the ability to apply knowledge or
use knowledge from one problem, situation or context to another” (Anderson, 2005). Those who
study knowledge transfer subscribe to the belief that participants use of abstractions are a
reflection of knowledge transfer. The traditional definition of knowledge transfer does not lend
itself to the study of the connection between abstraction and knowledge transfer. To do so
necessitated operationalizing the definition of knowledge transfer. The operational definition of
knowledge transfer used in this study was the abstraction of any knowledge, information, or
experiences by participants and used when trying to understand higher order concepts. An
operational definition such as this allows for the design of research to address the criteria
embedded within it. These criteria are discussed below.
Theoretical Framework
Many researchers investigating knowledge transfer have expressed fundamental problems
with its study. Those fundamental problems range from whether or not transfer actually exists
(Detterman, 1993) to how a researcher can claim to witness transfer occurring (Carraher &
Schliemann, 2002). Barnett and Ceci (2002) concluded that a century of research on transfer has
made little progress in resolving its fundamental questions, and Schoenfeld (1999) identified it

10
as one of the major challenges of educational theory in the 21st century. Although some
researchers have questioned the very existence of transfer (Detterman, 1993), others have
examined theoretical approaches to solving the fundamental problems and found problems in
having to choose between adopting questionable theories of knowledge and denying that new
learning rests on past learning (Carraher & Schliemann, 2002). Many theoretical approaches to
explaining phenomena often thought of as knowledge transfer are rooted in a belief that the
abstraction of knowledge is the primary source of its generalizability. A renewal of interest in
the study of transfer is dated to the seminal studies of Reed, Ernst, and Banerji (1974) and Gick
and Holyoak (1980, 1983). They hypothesized that the construction of abstract rules, schemata,
or other mental representations serve as the primary cognitive support for knowledge transfer
(Fuchs, Fuchs, Prentice, Burch, Hamlett, Owen, Hosp, & Jancek 2003; Gentner, Loewenstein,
& Thompson, 2003; Gentner & Markman, 1997; Gentner & Medina, 1998; Reed, 1993; Singley
& Anderson, 1989). Several scholars have attempted to link abstraction to situated or context-
sensitive activities. Hershkowitz, Schwarz, and Dreyfus (2001) developed a model for
abstraction in context, which they presented as both an activity and result of “vertically
reorganizing previously constructed mathematics into new mathematical structure” (p. 202).
Pratt and Noss (2002) proposed a model of “the microevolution of mathematical knowledge in
context” (p. 453) using the notion of a situated abstraction (Hoyles & Noss, 1992; Noss &
Hoyles, 1996; Noss et al., 2002; Pratt, 2000). Each of these approaches makes the case that
when situating abstracted concepts in real world activities the likelihood that transfer will occur
increases.

11
Fuchs et al. (2003) recently articulated a common understanding of abstraction:
To abstract a principle is to identify a generic quality or pattern across instances of the principle. In formulating an abstraction, an individual deletes details across exemplars, which are irrelevant to the abstract category…These abstractions are represented in symbolic form and avoid contextual specificity so they can be applied to other instances or across situations. Because abstractions, or schemas, subsume related cases, they promote transfer (p. 294).
Variations of this understanding of abstraction help to explain how it is that two
situations or mathematics problems, for example, are similar (Gentner&Markman, 1997), as well
as how abstract rules, solution procedures, or schemata may be applied across similar problem
situations (Fuchs et al., 2003; Gentner et al., 2003; Gick & Holyoak, 1983; Reed, 1993). Several
disciplines provide real-world examples of abstractions. In mathematics, when an algebra student
is asked to use the first, outside, inside, last (FOIL) method to solve a problem such as (3s-7)
(s+2). An abstracted concept from this problem would be addition, subtraction, or multiplication.
Another example is when building an electrical circuit for a light. An abstracted concept from
this exercise is that electrical current follows the path of least resistance. These abstracted
concepts are not bound to any specific context, as they are general and have utility in several
contexts. For this reason, these abstracted concepts are an important method of transferring
knowledge. Students can use the knowledge learned in math class, abstract it, and apply it to
some other context in their everyday lives. Using the FOIL example, a student could abstract the
concept of addition and then apply that knowledge when trying to figure out how much an item
costs at the grocery store.
Salomon and Perkins (1989) describe a method of broadening schemas and evoking
independent searches for connections without the need for external or directed cueing. They
distinguish between two forms of transfer; low-road and high-road transfer. Low-road transfer

12
involves the quick spontaneous use of knowledge with little thought involved. By contrast, high-
road transfer involves the explicit use of knowledge through a conscious formulation of
abstraction that allows a person to make connections between contexts. As Salomon and Perkins
suggested, the hallmark of high-road transfer is “mindful abstraction.” Formally, mindful
abstractions are known as metacognitive processes. “With metacognition, an individual
withholds an initial response and, instead, deliberately examines the task at hand and generates
alternative solutions by considering ways in which the novel task shares connections with
familiar tasks” (Fuchs et al., 2003). Therefore, with high-road transfer, “abstraction provides the
bridge from one context to the other; metacognition is the conscious recognition and effortful
application of that abstraction across contexts” (Salomon & Perkins, 1989). Salomon and Perkins
(1989) further described two forms of high-road transfer. With forward-reaching, high-road
transfer, the abstraction is generated in the initial learning context; as learners engage in the
initial task, they consider other situations where the abstraction might apply. Both the FOIL and
electrical current examples discussed previously are examples of forward-reaching, high-road
transfer. As students engage in the initial learning, they consider where addition, subtraction,
multiplication, or current flow has utility outside of the initial learning context. By contrast, with
backward-reaching, high-road transfer, abstraction occurs in the transfer situation, where the
learner thinks back to previous tasks to search for relevant connections and abstractions. T/E
design activities provide the transfer context for backward-reaching, high-road transfer. When
confronted with a T/E design problem, students think back and consider previously learned
knowledge and its application to solve the T/E design problem. As discussed by Salomon and
Perkins, both forms of high-road transfer provide a theoretical basis for a transfer-through-
abstraction paradigm.
13
Questions and methods developed by theorists of situated cognition have challenged the
transfer-through-abstraction paradigm. Lave (1988) initiated a damaging critique of prior transfer
research by arguing that classroom mathematics does not appear to transfer readily into everyday
activities as abstract knowledge theories would predict. Mathematical activity in the real world
are profoundly shaped by social, cultural, and contextual factors largely unexamined by
researchers focusing entirely on internal knowledge representations (Carraher & Schliemann,
2002; Greeno, 1997, 2006; Hatano & Greeno, 1999; Hutchins, 1995; Noss, Hoyles, & Pozzi,
2002; Saxe, Dawson, Fall, & Howard, 1996). Furthermore, standard methods of investigating
transfer have tended to depend on success-or-failure measures of participants’ behavior on
transfer tasks designed with very specific performance expectations on the part of the
investigator. These methods have failed to identify the creative knowledge that students often
bring to bear on the tasks given them. They also have not investigated the participants’ own
perceptions of the ways in which transfer tasks were or were not similar to prior learning tasks
(Hatano & Greeno, 1999; Lave, 1988; Lobato, 2003, 2006).
Although these critiques have led some researchers to abandon traditional cognitive
approaches to transfer altogether in favor of redefinitions or reconceptualizations of the entire
problem (Beach, 1999; Dyson, 1999), others have argued for the need to attend to the
relationships between social, cultural, and contextual factors and mentally represented
knowledge. Bransford and Schwartz (1999) acknowledged the validity of traditional perspectives
on transfer while suggesting that researchers “broaden the conception of transfer by including an
emphasis on people’s ‘preparation for future learning’” (p. 68). Greeno, Moore, and Smith
(1993) admitted a significant role for constructs such as mental representations, mental models,
or abstract schemata, but they limited their role in the transfer process by arguing that “it is not
14
meaningful to try to characterize what someone knows apart from situations in which the person
engages in cognitive activity” (p. 100). Lobato’s (1997, 2003, 2006) “actor-oriented” transfer
perspective identified a need for researchers to move beyond simple performance measures of
transfer that observe only the success or failure of individuals in modeling expert performance in
transfer tasks. Lobato (2003, 2006) argued that it is necessary to reconsider “what counts as
transfer” by examining how social and learning environments and activities influence the types
of generalizations or similarities learners themselves construct across situations, creating their
own “personal creation of relations of similarity” (p. 18). These approaches suggest that transfer
researchers must account for participants’ internal knowledge, but that this cannot be done
without concurrent consideration of the relation between that knowledge and the social and
contextual circumstances of the learner.
One method of capturing abstractions in situated environments is through student
reflection of their work. During the second half of the last century and spanning to today,
educational psychology has shifted its focus from rote learning to active learning approaches
(Brown, 1992). This shift in focus began when psychologists moved away from behavioral
theories and shifted to a cognitive approach. This shift made way for a focus on active learning,
which engages students and puts knowledge into a meaningful context. Based on learning and
memory theory, Anne Brown (1992) began her early work regarding [instructional] design
experiments. In terms of information processing, Brown was interested in the “distinction
between voluntary control processes (strategies) and structural features (memory capacity)”
(Brown, 1992). Brown then shifted her thinking to active forms of memory such as meta-
cognitive processes. With this change of focus came the introduction of active terms like
remembering, monitoring, and strategies. During her studies, Brown found that training

15
participants to use meta-cognitive processes is difficult in an “arbitrary context.” Rather, the
contexts need to be real-world and meaningful to the participant. From a research point of view
the type of instrument used is determine by the studies variables. To measure learning, the
researcher can simply give participants a recall test. Measuring understanding, however, is much
more difficult to capture. A strategy to capture understanding as outlined by Brown (1992) is
having students be reflective with their work. Through this reflection, students can exhibit
understanding and identify connections they are making through the transfer of knowledge.
Building on this theoretical basis, Brown (1992) identified four reflective prompt categories:
“questioning, clarifying, summarizing, and predicting,” which were selected to bolster the
discussion because they are excellent comprehension-monitoring devices (Brown, 1992, p.148).
Building on work done by Brown (1992), Puntambekar and Kolodner (1998) began their
own research into developing an instrument known as a Design Diary, which intentionally
fostered student reflection. This initial study contained two phases, both dealing with the
development of the Design Diary instrument during T/E design activities in a middle school
science classroom. Within both phases, the Design Diary instrument received iterative revisions.
They began the first phase by integrating the paper-and-pencil tool, Design Diaries, into the
classroom with the goal of scaffolding students’ design-related activities. The first phase was a
pilot to help understand the classroom dynamic and the complex environment of the classroom.
They concluded that scaffolding with any one tool was not possible. Scaffolding needs to be
“distributed across the various agents that play a role in learning” (Puntambekar & Kolodner,
1998). During the second phase, they implemented distributed scaffolding and found that
students performed better. For the second phase, Puntambekar and Kolodner refined the Design
Diary prompts to elicit more targeted responses. Therefore, they identified three prompting

16
categories: macro, micro, and meta-cognitive. They also included separate pages with prompts
that dealt with specifications and prediction. Both the macro and micro prompting categories
allow students to think about the overall design process and their current design phase or phases.
The macro prompts asked students to identify where in the design process they were. The micro
prompts helped students carry out the activities within the T/E design phase or phases. The meta-
cognitive prompting category helped students actively monitor their learning. The specifications
page asked students to connect their activities to design specifications identified at the beginning
of the design process. The prediction page asked students to predict how design decisions would
affect the final design solution.
Building on her previous work, Kolodner (2002) began to focus on teaching inquiry in
science education that promotes the learning of skills rather than content alone. Many perceive
science education as simply teaching 'facts" and how to apply them (Kolodner, 2002).
But science education that is truly aimed towards scientific literacy focuses as well on learning the practices of scientists-designing and carrying out investigations in a replicable way, accurate observation and measurement, informed use of evidence to make arguments, explanation using scientific principles, working in a team, communicating ideas, and so on. In fact, scientists and designers practice many of the same skills (p. 2).
The focus then is to help middle school students learn science content so that it has utility in new
situations. Students learn the content and skills and apply them through a T/E design activity
(Kolodner, 2002). For example, students learn about forces and material strength when building
a bridge. The T/E design activity provides a real-world context rather than teaching these
concepts in an abstract way. This method of teaching situates the learning and fosters the
abstraction of knowledge. For this reason, the utility and impact of the Design Diary instrument
developed previously increases when used in conjunction with a situated activity such as that
found in T/E design.

17
Continuing to build on previous work, Kolodner, Camp, Crismond, Fasse, Gray,
Holbrook, Puntambekar, and Ryan (2003) developed a project-based inquiry approach to science
learning which was based in case-based reasoning and problem-based learning. This project-
based inquiry approach fosters deep learning of science concepts and skills and their application
in concert with building cognitive, social, and communication skills (Kolodner, et. al., 2003).
The goal of this type of instruction with middle school students was to “make them successful
thinkers, learners, and decision makers throughout their lives and especially to help them begin
to learn the science they need to know to thrive in the modern world” (Kolodner, et. all., 2003).
This “literacy” approach seeks to prepare students for their everyday lives rather than have them
learn facts that are bound to a single context. In conjunction with these T/E design activities,
students made Design Diary entries and reflected on their practice. This allowed them to think
about their decisions and evaluate them.
Following previous work, Puntambekar and Kolodner (2005) continued to make iterative
revisions to the Design Diary instrument. They continued the theme of T/E design activities used
to teach science content to middle school students. A common thread that runs through all of
these studies is literacy. Through T/E design, students learn concepts in situated, real-world
environments. By learning this way, knowledge is not bound to a particular context but rather
has utility in many contexts.
Many studies have used a transfer-through-abstraction approach to evidence the transfer
of knowledge (Fuchs et al., 2003; Gentner, Loewenstein, & Thompson, 2003; Gentner &
Markman, 1997; Gentner & Medina, 1998; Hershkowitz, Schwarz, & Dreyfus, 2001; Hoyles &
Noss, 1992; Noss & Hoyles, 1996; Noss et al., 2002; Pratt, 2000; Pratt & Noss, 2002; Reed,
1993; Singley & Anderson, 1989). These studies have all seen varying degrees of success in

18
accomplishing this task. Using this approach in the context of a T/E design activity may provide
enhanced insight into the transfer of knowledge and ways in which to study it. Puntambekar and
Kolodner (2005, 1998) began to explore the possibilities of using a T/E design approach to foster
the transfer of knowledge through literacy. Further study is needed to identify whether T/E
design activities foster the transfer knowledge using a Design Diary instrument. By continuing
research in this area, we can more purposefully teach students to transfer knowledge and
improve student learning. The specific content transferred during T/E design activities is that of
science, technology, engineering, and mathematics (STEM). By exploring the foundations of the
current STEM movement in the United States, the types of knowledge transferred during T/E
design activities will become clearer. This will allow for clearer connections between the STEM
disciplines.
Foundations of STEM Education
The twentieth century has seen the rise of American influence in the global community.
This influence is both political and economic, affecting our own national security. Increased
global influence allows the United States (US) to be a stakeholder when making decisions that
affect foreign governments. This influence has also increased global competiveness, which has
made the US government rethink many of its own national programs, one of which being
education (NAS, 2006). A new educational philosophy that is beginning to receive national
interest is that of Integrative Science, Technology, Engineering, and Mathematics (STEM)
Education (Drake & Burns, 2004; Sanders, 2008, 2006b; Sanders & Wells, 2010; VT
Technology Education, 2006; Wells, 2008, 2010). Each of the four STEM disciplines has
published reform proposals that speak to their integrative nature (AAAS, 1989, 1993; ABET,
2004; ITEA, 1996, 2000; NCTM, 1989, 2000; NRC, 1996). Based on the philosophies found in

19
these reform proposals a growing body of empirical evidence is emerging to support the use of
integrative STEM instructional practices. One such study was conducted by Hartzler (2000), who
analyzed 30 individual studies to see what effect integrated instructional practices have on
student achievement. Two conclusions where reached from her work. First, students in integrated
programs consistently outperform students in traditional programs on national standardized tests,
state standardized tests, and on program assessments. Traditional programs are those programs
taught in a traditional, silo way without making intentional connections to other disciplines.
Second, integrative programs were successful in teaching science and mathematics across all
grade levels. Furthermore, students with below-average achievement especially benefited from
an integrated approach to learning. Findings such as these, combined with current movements
toward STEM content connections, provide a need to understand the benefits that such programs
can have on student learning.
The need for Integrative STEM Education.
As global competitiveness increases, an improved understanding of pedagogical practices
is needed to put the best educational programs in place to secure America’s position in global
affairs. A change toward an integrative approach to teaching and learning, such as found in
Integrative STEM education could increase the viability of the American worker in both
efficiency and ability to solve the problems of tomorrow (Hartzler, 2000; Sanders, 2008).
Sanders (2008, p.25) stated, “Integrative STEM education would add enormously to American
education, culture, and global competiveness”. By giving students the skills necessary to
integrate the STEM disciplines while solving problems, they are better equipped to come up with
the best possible solution to solve those problems. All three major curriculum reform proposals
describe the integrative nature of science, technology, and mathematics education. In Chapter 1

20
of the Science for All Americans Project (AAAS, 1989) there is a discussion of the “union of
science, mathematics, and technology that forms the scientific endeavor and that makes it so
successful”, noting, “Although each of these human enterprises has a character and history of its
own, each is depended on and reinforces the other.” The Standards for Technological Literacy
also discusses the connected relationship of science and technology education: “Science provides
the knowledge about the natural world that underlies most technological products today. In
return, technology provides science with the tools needed to explore the world” (ITEA, 2000, p.
44). There is a similar relationship between mathematics and technology education.
“Technological innovations, such as the computer, can stimulate programs in mathematics, while
mathematical inventions, such as numerical analysis theories, can lead to improved
technologies” (ITEA, 2000, p. 44). The Criteria for Accrediting Engineering Programs (ABET,
2004) also discusses a relationship between mathematics, science, and engineering in its
standards for accreditation: “(a) an ability to apply knowledge of mathematics, science, and
engineering.”
Many curricular reform proposals (AAAS, 1989, 1993; NCTM, 2000; ITEA, 2000)
outline the integrative nature of the STEM fields in theory. “In practice, the schooling system
continues to support separate programs and promote traditional approaches of teaching this
content in isolation from one another. To this day the challenge remains for substantively
bringing together isolated SMT [STEM] programs within a structure that supports true
collaboration of content and practices” (Wells, 2008). As previously stated the goal of science,
technology, and mathematics education is literacy (AAAS, 1989, 1993; ABET, 2004; ITEA,
1996, 2000; NCTM, 1989, 2000; NRC, 1996). To achieve literacy in a discipline an
understanding of its fundamental core concepts is need. The next section will provide an

21
exploration into the literacy movements of science and technology education. An increased
understanding of science and technology literacy will provide a basis for literacy in engineering
and mathematics education.
Science and Technology Literacy Driving Knowledge Transfer
Broadly speaking, Technology is how people modify the natural world to suit their own purposes. From the Greek word techne, meaning art or craft, technology literally means the act of making or crafting, but more generally it refers to the diverse collections of processes and knowledge that people use to extend human abilities (ITEA, 2000, p.2)
Technology is pervasive. Each human being encounters many technological products each day.
These products meet our everyday needs to survive or simply make our lives easier. As a content
area in public schools, the goal of technology education “is to produce students with a more
conceptual understanding of technology and its place in society, who can thus grasp and evaluate
new bits of technology that they might never have seen before” (ITEA, 2000, p. 4).
Technology education has evolved over the past century through several curriculum
reform movements. These movements represent a change from a content driven discipline to a
general literacy driven discipline. “The transformation in formal technology education can be
described in terms of three different movements: manual arts, industrial arts, and technological
literacy” (Cajas, 2001). During the manual arts movement, instruction focused on teaching skills
and developing an artifact (Volk, 2006). In the middle of the 20th century, the thinking changed
and students were prepared with skills and knowledge to get a job after high school (Warner,
Gary, Gerbracht, Gilbert, Lisack, Kleintjes, Phillips, 1947; Towers, Lux, & Ray, 1966). In 1970,
W. Harley Smith published The Maryland Plan, which outlined a new vision for technology
education that included the study of how technology influences society. This document
represents the beginning of modern Technology Education. Three new courses outlined in the
document reflect new ways of thinking. The first year course is what we would now call

22
“Introduction to Technology.” The second course is what we would now call “Production or
Manufacturing Systems.” In addition, the third course is what we would now call “A Capstone
Experience.” What this did at the time was to lay down the foundation of what would later
become modern Technology Education. Traditionally, students participated in a shop course and
made a product with little thought to industry or the importance of the product. These new
courses and their new content better prepared students for the real world. Technology educators
began rejecting a vocational paradigm and began thinking in a more academic way. Rather than
simply producing a product, students analyzed their ideas to generate the best answer to a
problem. Rather than the teacher giving students plans to build a product, students designed
something to solve a problem.
The Jackson’s Mill Industrial Arts Curriculum Theory (Hales & Snyder, 1982) specified
content areas within technology education as human technological, sociological, and ideological
endeavors. This document continued to illustrate a shift in thinking to include social/culture
impacts of technology on society into the curriculum of Industrial Arts education. A decade later
Savage and Sterry (1990) published A conceptual framework for technology education. Savage
and Sterry began to make an argument to improve technological literacy in students and decrease
a focus on vocational education. The implications of this document were to give teachers a
framework for teaching Technology Education. It called for a focus on a problem-based
approach to teaching and learning rather than directed instruction. Students became problem
solvers and come up with new ideas. This publication represents the first time, in print, that a
cohort of Technology Teachers came together and agreed on a framework that the entire field
should follow. This cohort also outlined a vision for future directions of research in Technology
Education that focused on teaching and learning.

23
In 2000, the International Technology Education Association published the Standards for
Technological Literacy: Content for the Study of Technology. This document outlined the current
literacy focus of technology education. To become technological literate one must study our
designed world. Students are exposed to various types of technological problems found within
the designed world and that may occur in their everyday lives. Based on these technological
problems students learn the skills necessary to solve them.
The impact of the three reform movements in technology education was a change from a
content/skill driven discipline to the study of general technological literacy. The manual arts and
industrial arts movements were career driven, giving students skills needed in the work place for
a specific job. The literacy focus of technology education is a liberal learning approach to the
discipline. Students gain skills that help enhance their lives and do not simply prepare them for a
career. This educational approach is more in line with real-world problem solving because in the
real world, problems arise devoid of discipline or a specific content area. These problems require
using the knowledge from several content areas with the goal being to better one’s life, not to
keep them interested in a certain career path or knowledge area. Students receive a broad
knowledge base from which they can activate specific knowledge to help solve a specific
problem. This educational movement toward technological literacy, which more closely mimics
technological studies in the real world, is similar to what has taken place in science education
(Cajas, 2001; Wells, 2008).
The focus of the current science reform movement is to increase scientific literacy and to
improve students’ understanding of the scientific method of inquiry (NRC, 1996, p. 13). The
National Research Council (1996, p. 22) describes scientific literacy as “the knowledge and
understanding of scientific concepts and processes required for personal decision making,

24
participation in civic and cultural affairs, and economic productivity.” Scientific inquiry is the
signature pedagogy used to foster scientific literacy. Students develop hypotheses and test them
using the scientific inquiry methods (NRC, 1996). Traditionally, the linear process of scientific
inquiry presented to students, does not reflect the actual process used by scientists in the field
using inquiry (Reiff, Harwood, & Phillipson, 2002). The actual process of inquiry is conceptual
in practice allowing students to be more pragmatic when testing their hypotheses (Fortus, 2005;
Reiff, Harwood, & Phillipson, 2002).
Because of the current literacy movements of technology and science education, the need
to enhance general literacy in students has increased.
The goal is to have citizens who understand the nature of technology and its interaction with science and society. It is the idea of literacy – core knowledge and skills that are important for all citizens – that connects science and technology education in a new way (Cajas, 2001, p.718)
General literacy reflects the knowledge of core disciplinary concepts that represent a larger
picture. In technology education, an example of a core concept would be technological design.
Rather than teaching students specific components of design as they relate only to technology or
science, an instructor teaches design in a more general sense that increases the flexibility of the
knowledge for use outside of technology education (Cajas, 2001; Reiff, Harwood, & Phillipson,
2002).
STEM literacy is a critical component of 21st century education (AAAS, 1989, 1993;
ABET, 2004; NCTM, 2000; NRC, 1996; ITEA, 2000). The Science for All Americans project
(AAAS, 1989) describes how, “although each of these human enterprises has a character and
history of its own, each is dependent on and reinforces the other.” Similarly, the Standards for
Technological Literacy (ITEA, 2000) describe the union of Science and Technology: “Science
provides the knowledge about the natural world that underlies most technological products

25
today. In return, technology provides science with the tools needed to explore the world” (ITEA,
2000, p. 44). The Criteria for Accrediting Engineering Programs (ABET, 2004) also describe a
relationship between mathematics, science, and engineering in its standards for accreditation:
“(a) an ability to apply knowledge of mathematics, science, and engineering.”
Literacy has become the focus of both science and technology education. This focus has
developed out of the manual and industrial arts movements in technology education focusing on
developing “practical” knowledge and science education taught as “abstract” knowledge (Cajas,
2001). A focus on literacy through core concepts creates a framework for integrative approaches
to teaching and learning (Wells, 2007). Presenting core concepts, such as design, in a way that
shows their utility in several contexts fosters literacy. This increases the flexibility of the
knowledge and allows for increased transfer to other contexts. When learning core concepts in
science, they have utility in the technology classroom and vice versa. This transfer of core
concepts more closely mirrors how real scientists and technologists solve problems in the field
(Bauer, 1992; McComas, 1996; Lederman, 1998).
The general literacy approach used by science and technology education has application
in mathematics and engineering education. In this way, each STEM discipline intentionally
teaches their core knowledge for use in different contexts. This would increase the utility of the
core concepts and promote their transfer. As a method of fostering the transfer of core STEM
concepts, a design approach is used, specifically Technological/Engineering (T/E) design. A
literacy approach supports the transfer of STEM content knowledge in T/E design because the
abstraction of core concepts increases their utility as it relates to T/E design problems (Wells,
2006; 2008). T/E design is a formal process with many opportunities for the transfer of
knowledge. An exploration of T/E design based learning is necessary to understand how T/E

26
design can intentionally foster the transfer of STEM content knowledge.
Technological/Engineering Design-Based Learning
The human capacity for T/E design is a fundamental human aptitude (Roberts, 1995).
Technological/engineering (T/E) design helps to solve human problems and recreate a world that
fits our needs. In this effort, we use tools and materials to construct artifacts and systems that
meet those needs. Figure 1 depicts the technological design process and the engineering design
process. Both take T/E designers from initial problem identification to testing and implementing
a solution.
Technological Design Loop Engineering Design Process
Figure 1. Comparing the Engineering Design Process (Khandani, 2005), used under fair use guidelines, 2011 and the Technological Design Loop (Hutchinson & Karsnitz, 1994), used under fair use guidelines, 2011
Both the technological and engineering design processes approach design problems in
similar ways. They both begin by defining a problem and conducting research. Based on the
research, development of multiple solutions takes place. Design teams then choose one solution
based on the criteria of the problem. This solution is then modeled/prototyped and finally tested
to see if it meets expectations. These similarities make the technological and engineering design

27
processes interchangeable allowing for their combined use. This is done because both the
technological and engineering design processes involve “the systematic and creative application
of scientific and mathematical principles to practical ends such as the design, manufacture, and
operation of efficient and economical structures, machines, process, and systems” (ITEA, 2000,
p. 238).
Though traditionally presented as a stepwise process, the T/E design process is cyclical
allowing designers to move freely between steps as needed (Hutchinson & Karsnitz, 1994).
Within each part of the T/E design process, there is potential for hierarchical learning (Gagne,
Wager, Golas, & Keller, 2005; Gagné & Paradise, 1961). Based on Skinner’s (1954) idea of
programmed instruction, Gagne (1969) viewed knowledge as a hierarchy of cognitive
capabilities. He believed that in order to understand a particular subtopic within the hierarchy,
one must first learn and master all subtopics that are subordinate to it. In order to construct a
complete understanding of a complex topic, one must ask the following question at each level of
the hierarchy: “What would an individual have to know how to do in order to achieve successful
performance of this class of task, assuming he were given only instruction” (Gagné & Paradise,
1961, p. 4). At various points within the design process, students confront problems they cannot
solve with their current knowledge base. They must then go out and acquire the knowledge
necessary to solve the problem. In doing so, they will begin with lower-level skills and work
their way up the hierarchy until they acquire the higher-level skills. This process of acquiring
new knowledge through a hierarchy is also known as vertical transfer (Gagné & Paradise, 1961).
As students move back and forth in the T/E design process, they are building on the hierarchy
until they acquire the higher-level skill.

28
Edward Thorndike’s Identical Elements theory (1901) states that as the similarities
increase between two concepts, the likelihood of transfer will increase. The T/E design process
shares a common structure, or way of using knowledge to answer a question or solve a problem,
with the scientific inquiry method. The next section explores these common structures.
Using Technological Design in Science Education
In project 2061, the AAAS promotes teaching science education to develop scientifically
literate people or “one who is aware that science, mathematics and technology are interdependent
human enterprises with strengths and limitations; understands key concepts and principles of
science; and uses scientific knowledge…for individual and social purposes” (AAAS, 1990, p.
xvii). The National Research Council also supports teaching using a model closely aligned with
T/E design. T/E design activities require students to identify a problem, form a question, gather
information, generate and test alternate solutions, and describe outcomes using different visual,
mathematical and theoretical models (NRC, 1996).
The signature pedagogy of science education is scientific inquiry. “Teachers focus
inquiry predominantly on real phenomena, in classrooms, outdoors, or in laboratory settings,
where students are given investigations or guided toward fashioning investigations that are
demanding but within their capabilities” (NRC, 1996, p. 31). Solving these investigations
requires using the scientific inquiry method (Figure 2) as described by Krajcik, et al (1998).

29
Figure 2. Scientific Inquiry Wheel (Reiff, Harwood, Phillipson, 2002), used under fair use guidelines, 2011
Students begin by defining a real-world problem. They then investigate the phenomena
and develop an artifact. Throughout this process, students collaborate with other students,
teachers, and people in their community. Students also use various technological tools to aid
them in their inquiry (Krajcik, et al, 1998, p. 315). Using this method of teaching allows students
to apply knowledge learned in the classroom to a real-world problem, giving the knowledge
context and meaning.
As science education reform promotes the use of an inquiry model more closely aligned
with design (NRC, 1996), the commonalities between scientific inquiry and T/E design will
become more apparent. For an in-depth comparison of T/E design and scientific inquiry refer to
Appendix A. An important aspect of the T/E design approach is that students understand how to
document their thoughts and recognize how to reflect on these thoughts (Sanders, 2000; Barak,

30
Waks, & Doppelt, 2000). Analyzing these reflections may provide data of abstractions as a
measure of knowledge transfer.
T/E design and scientific inquiry are similar processes that share many of the same
phases. This similarity makes them ideal for the transfer of knowledge while solving real-world
problems. To solve these real-world problems, scientists and technologists/engineers transfer
core knowledge from several disciplines to develop a solution to the problem at hand. There are
many different ways to transfer knowledge and each method is appropriate in different situations.
Identifying and exploring each method of transfer will aid in developing a successful study of
knowledge transfer in the context of T/E design. From this exploration a more purposeful
research design can be created that specifically targets methods of transfer that are appropriate in
T/E design-based environments.
Knowledge Transfer
Explored in this section is knowledge transfer in two parts. The exploration begins with a
look at general transfer types found in the educational psychology literature and ends with
transfer in the context of T/E design. This exploration allows specific knowledge transfer types
to align with the T/E design process. Knowledge transfer is “the abstraction of any knowledge,
information, or experiences by participants and used when trying to understand higher order
concepts” (Anderson, 2005; Fuchs, et. al, 2003; Gagné, Wager, Golas, & Keller, 2005; Gagné &
Paradise, 1961; Gentner & Markman, 1997; Gentner & Medina, 1998; Gentner, Loewenstein, &
Thompson, 2003; Gick & Holyoak 1980, 1983, 1987; Lobato, 1997, 2003, 2006; Reed, Ernst, &
Banerji 1974; Reed, 1993; Singley & Anderson, 1989). Edward Thorndike began the formal
study of knowledge transfer in the early 20th century. In 1901, Thorndike developed a theory of
knowledge transfer called the “Identical Elements” theory that states that the amount of

31
knowledge transfer between familiar and unfamiliar situations is determined by the number of
elements the situations have in common. This implies that as situations become increasingly
similar to students, the likelihood that they will transfer knowledge to the new situation
increases.
Transferring knowledge.
Transfer can occur in three different ways: positive, negative, and zero transfer (Gick &
Holyoak, 1987). Positive transfer occurs when knowledge learned in a context benefits learning
in a new context. Negative transfer occurs when knowledge learned in one context interferes or
hinders learning in another context. Lastly, zero transfer occurs when learning in one context has
no effect on learning in another context.
Near and far transfer.
Near transfer consists of transferring knowledge from one discipline to a similar
discipline (Gick & Holyoak, 1987). Far transfer refers to both transferring knowledge from one
discipline to another as well as the ability to solve problems that share a common structure with
the knowledge initially acquired (Gick & Holyoak, 1987). Both forms of transfer are required in
different instances. For example, a student measures an object after a lesson on fractions, which
is near transfer. Conversely, far transfer would be identifying if knowledge transferred between
two contexts that share similar or common structures. For far transfer to occur knowledge must
remain flexible and not bound to any one discipline or context.
Meaningful learning.
Although Thorndike’s Identical Elements theory describes a specific way that knowledge
transfer occurs, psychologists have criticized his studies because they state that knowledge
transfer can occur in the absence of any initial learning taking place (Woodrow, 1927). The basis
32
of this criticism is that transfer cannot occur in the absence of initial learning. Many other studies
have not shown any initial learning took place and were therefore criticized (Bassok & Holyoak,
1993; Bransford & Schwartz, 1999; Klahr & Carver, 1988). These studies began with a treatment
and then typically a post assessment. There was no initial assessment to determine that
participants had knowledge to transfer. This initial learning assessment is an important step in
studying the transfer of knowledge because it allows for the validation of initial knowledge.
In Judd’s 1908 classic study of knowledge transfer, he demonstrated the importance of
combining meaningful instruction and student experience. Using two groups, the first received a
lesson on refraction and the other group did not. Each group had to throw a dart at a target in 12
inches of water. In 12 inches of water, the lesson on refraction seemed to have no effect on
students’ ability to hit the target. Then the target moved to only 4 inches of water. In this
scenario, the treatment was very important. The group without the treatment made the same
mistakes they made in 12 inches of water because they did not understand how refraction worked
and therefore could not adjust their technique. The treatment group, however, quickly readjusted
to the 4 inch depth. Experience over the two trials, coupled with the lesson on refraction, helped
students to more accurately hit the target. Studies such as this one help to make the argument that
transfer is dependent upon the instruction given, the experiences of students, the representations
they developed, and the nature of the transfer task.
Vertical and lateral transfer.
Gagne (1969) believed that vertical transfer represented the relationship between higher
and lower order cognitive skills. For knowledge transfer to occur, students must learn and master
lower order cognitive skills along the hierarchy. Students build knowledge along this hierarchy
until they reach the desired higher order cognitive skill. Conversely, skills learned at roughly the

33
same cognitive skill level foster lateral transfer, such as transfer in mathematics of similar word
problems.
Spontaneous and directed transfer.
Spontaneous and directed transfers are two other forms of knowledge transfer.
Spontaneous transfer occurs free of any hint or teacher driven instruction (Gick & Holyoak,
1980). Directed transfer occurs when an instructor calls students’ attention to specific knowledge
that would be helpful in solving a particular problem (Gick & Holyoak, 1980; Brown & Kane,
1988).
Low-road and high-road transfer.
Salomon and Perkins (1989) distinguish between two types of transfer: low-road and
high-road transfer. Low-road transfer involves the quick spontaneous use of knowledge with
little thinking involved. High-road transfer involves the explicit use of knowledge through a
conscious formulation of abstraction that allows a person to make connections between contexts.
They also discuss two sub-components of high-road transfer: forward-reaching and backwards-
reaching high-road transfer. In forward-reaching high-road transfer, “a principle is so well
learned in the first place as a general principle that it simply suggests itself appropriately on later
occasions” (Salomon, Perkins, 1989, pp. 118-119). Conversely, in backward-reaching high-road
transfer, “the deliberate formation of an abstraction occurs not during original learning, but as the
target activity is addressed and the individual formulates an abstraction guiding his or her
reaching back to past experience for relevant connections” (Salomon, Perkins, 1989, p. 119).
High-road transfer is primarily concerned with mindful abstraction. Mindful abstractions
are meta-cognitively guided generalizations of a construct. Studies have shown that an emphasis
on meta-cognition can increase transfer (Palincsar & Brown, 1984; Schoenfeld, 1985).

34
Group and individual transfer.
We as humans do not learn in isolation of external information, rather we socially
construct knowledge through interaction (Berger & Luckman, 1967; Brooks & Brooks, 1993;
Burr, 2003; Charon, 2007). Many studies have found compelling transfer by either allowing
participants to interact during the transfer task (Brown & Kane, 1988) or implying that social
interaction was possible (Judd, 1908). In these studies, students were typically asked to solve
some problem and in doing so interact with a group. Group interactions were an important factor
in the positive transfer of knowledge. Many other studies have used individual transfer tasks
(Cheng, Holyoak, Nisbett, & Oliver, 1986; Gick & Holyoak, 1980, 1983; Reed et al., 1974;
Thorndike & Woodworth, 1901; Wason & Johnson- Laird, 1972). These studies typically had a
pre-test, treatment and a post-test assessment. The treatment gave students some new knowledge
that then transferred to a task designed for transfer. These tasks were independently completed
and devoid of any external knowledge such as an Internet search.
Summary.
All of these transfer types have utility in a T/E design-based context. Several studies have
found that learning new material in the context of a problem rather than rote learning of facts
enhances transfer (Adams et al., 1988; Lockhart et al., 1988; Michael et al., 1993). In these
studies, the focus was on the pragmatic aspects of the problem through the abstraction of
knowledge. By being pragmatic, students can transfer only the core knowledge necessary to
solve a problem. In this way, knowledge is being abstracted and then connected to the transfer
task through the need to solve a problem. Throughout the T/E design process there are many
opportunities for students to use the knowledge learned in one discipline and apply it to the
problem they are trying to solve. Presented in the next section is an alignment of the general

35
knowledge transfer types with the T/E design process. This will allow for the identification of
only the transfer types that are appropriate for use in a T/E design context.
Fostering Knowledge Transfer in T/E Design-Based Activities
Based on the exploration of general knowledge transfer there are several ways to support
transfer and increase student learning. Though critical to knowledge transfer, often overlooked is
initial learning (p. 30). Based on what is already known, understood, and believed new
knowledge is constructed (Cobb, 1994; Driver, Guesne, & Tiberghien, 1985; Vygotsky, 1978).
Meaningful learning (p. 30) is based on an understanding of underlying structures if high-
road (p. 31) and vertical transfer (p. 31) are to occur (Bransford, Brown, Cocking, Donovan, &
Pellegrino, 2000). The T/E design process supports high-road, vertical transfer through design
problems. To solve design problems, students must construct new knowledge based on
hierarchies. Knowledge construction begins with low-level skills and ends when the student
comes to understand the high-level skill. Hierarchies such as these help students to build on
previously learned knowledge and vertically transfer the knowledge of each lower-level skill to a
higher skill.
As knowledge becomes bound to a specific context, the chances of transfer decrease
(Bjork & Richardson-Klavhen, 1989; Gick & Holyoak, 1983). The T/E design process broadens
the context in which knowledge is learned (Wells, 2007, 2006). To solve T/E design problems,
student’s abstract knowledge from each STEM disciplines (Wells, 2007).
In the context of T/E design, teachers design instruction to allow students to be pragmatic
when choosing which knowledge is necessary to solve the problem (Bassok & Holyoak, 1993;
James, 1890; Katona, 1940). Students learn in the context of needing knowledge to solve the

36
design problem. Students are learning to use only the knowledge necessary to solve the design
problem rather than using a breath of knowledge that may not be relevant.
Studying Knowledge Transfer in T/E Design
There are two main ways to study the transfer of knowledge: Sequestered Problem
Solving (SPS) and Preparation for Future Learning (PFL) (Bransford & Schwartz, 1999). Studies
utilizing the SPS model are interested in a more independent analysis of transfer. This method is
devoid of external knowledge generation or social interaction. Conversely, the PFL model is
interested in a social context in which the transfer of knowledge occurs. PFL studies deal
primarily with environments that promote new knowledge acquisition through research and
social interactions such as in T/E design.
Within the larger framework of using either the SPS or the PFL method there are several
sub-methods. The first are observations with the goal of identifying the mental processes used by
students during design activities (Hill, 1997; Kelly, 2008). An example of this is the Hill (1997)
study in which he developed an observational instrument using mental processes first identified
by Halfin (1973). This observational instrument measured the duration and frequency of the
mental processes necessary for effective problem solving.
Interview data can also identify points of transfer. Both the students and the teachers can
be interviewed (Barlax & Trebell, 2008). When interviewing a student, the goal is to identify
points of transfer where students are actually using knowledge from different content areas.
When interviewing a teacher, the goal is to identify how instruction is fostering transfer.
The third way to study transfer within a T/E design context is through Design Diaries
(Puntambekar & Kolodner, 2005). After each work session, students record in a diary their
thoughts and reflect on their work. These diary entries include reflective prompts designed to

37
target certain questions that the investigator wants answered. These questions can deal with the
cognitive processes the student is going through or target questions dealing with transfer.
Case Study Methodology
When choosing a research methodology, a researcher must first understand the questions
of the study. A case study focuses on “how” or “why” questions. The “how” question for
example, asks, “how does this specific group identified operate in the environment?” This
environment is in some real-life context that the researcher has little control over. A case study is
not a research method but rather a strategy for research that addresses the whole phenomenon
(Yin, 2003). The goal of this strategy is to contribute to the body of knowledge. Case study has
the unique ability to deal with a variety of data sources including documents, artifacts,
interviews, and observations. This variety of data lends itself to triangulation, which helps to
build the merit of findings in case study research. Validity increases through the corroboration of
findings across data sources. For example, do lesson plans correlate with what the interviewees
say the lesson plan should address and does that show up in classroom practice and finally in
students’ work? Past studies have used a case study methodology, such as the one conducted by
Puntambekar & Kolodner (2005), to develop a design diary instrument.
Historically, prejudice toward case study research has been associated with its lack of
rigor. The rigor of case study research depends on how well the researcher designs the study. The
results generalize to some broader theory rather than a particular population. Case study research
also has a much longer time commitment than other forms of research. It takes time to compile
and transcribe all the data. Researchers have traditionally considered case study methods to be
“soft” research and not adhering to systematic procedures. To counter this criticism, a case study
researcher must document all research decisions and create protocols for data collection (Yin,

38
2003). Case study methodologies are not only for qualitative research but also for quantitative
research allowing the researcher to be more flexible in the types of data that are collected.
There are three types of case study designs; exploratory, explanatory, and descriptive.
When a researcher needs a greater understanding of a phenomenon, an exploratory design is
used. An explanatory design allows the researcher to delve deeper into why a phenomenon
occurs. A descriptive design describes how a phenomenon works. These various research designs
are a blueprint for conducting a study. Within each of these broader designs, there are two
designs that are more specific; single case and multiple case designs. In both, there is a holistic
design, which looks at a single unit of analysis, and an embedded design, which looks at multiple
units of analysis. Included in the research design is the unit of analysis. The unit of analysis can
be an individual, a group, or an organization, each of which will have a slightly different
collection and analysis strategy. The research questions determine the unit of analysis.
The study described in this document utilized an exploratory case study design. Although
some researchers have studied the theoretical premise that abstractions are a representation of
knowledge transfer few if any have studied this connection in the context of a T/E design
problem. For this reason, in order to gain greater understanding regarding this phenomenon a
multiple case: embedded design was chosen to facilitate the collection of data from individual
participants in multiple design teams over three phases.
Pilot case study.
There are three general reasons to choose to do a pilot case study: convenience, access,
and geographic proximity (Yin, 2003). Therefore, an investigator may choose a case due to its
ease of access and proximity to the research institution. The investigator must also make many
decisions when designing a case study. These decisions are case study protocols, which include

39
all aspects of data collection and analysis (Yin, 2003). To make better protocol decisions, the
investigator may initiate a pilot case study. “The pilot case is more formative, assisting you to
develop relevant lines of questions—possibly even providing some conceptual clarification for
the research design as well” (Yin, 2003). In this way, the investigator chooses the tools and
methods of analysis to be sure to collect appropriate data to answer the research questions. “The
inquiry of the pilot case can be much broader and less focused than the ultimate data collection
plan” (Yin, 2003). This allows for the exploration of data at a higher level to help refine the
inquiry and ultimately allow insight into a more focused study.
The goal of a pilot case study is analytic generalization. As Yin (2003) describes, “the
case study, like the experiment, does not represent a “sample,” and in doing a case study, your
goal will be to expand and generalize theories (analytic generalization) and not to enumerate
frequencies (statistical generalization)”.
Quality of Research
To establish the quality of any empirical social research several tests are used (Yin,
2003). These tests include Construct Validity, Content Validity, and Reliability. Because case
studies are one form of such research, these tests are equally relevant to case study research (Yin,
2003; Cezarino, 2004; Waltz & Bausell, 1983; Yaghmaie, 2003).
Construct validity.
Construct validity is defined as, “the quality obtained when an instrument’s creator
demonstrates the instrument as representing a supportable theory” (Hittleman & Simon, 2006, p.
304). Data triangulation helps to address the potential problem of construct validly because the
multiple sources of evidence essentially provide multiple measures of a theory (Yin, 2003).

40
Content validity.
Content validity is, “the quality obtained when an instrument’s creator demonstrates that
the specific items [criteria] or questions used in the instrument represent an accurate sampling of
specific bodies of knowledge” (Hittleman & Simon, 2006, p. 304). Content validity is
demonstrated when experts of the content being studied agree that the questions being asked of
participants elicit the response that the researcher believes they will (Cezarino, 2004; Waltz &
Bausell, 1983; Yaghmaie, 2003).
Reliability.
As Yin (2003) explains, “the goal in establishing [reliability] was to allow the data to be
the subject of separate, secondary analysis, independent of any reports by the original
investigator.” A method of establishing reliability is through the presentation of case study
protocols. Case study protocols make all steps as operational as possible. Conducting interrater
reliability establishes consistent and reliable coding throughout data analysis. Interrater
reliability is “reliability determined by comparing the results of two or more scorers, raters, or
judges, sometimes presented as a percentage of agreement or as a coefficient” (Hittleman &
Simon, 2006, p. 310).
Indicators of quality research as discussed above help to minimize bias in research
studies. By addressing these indicators of quality research, the investigator improves on the
accepted validity of the study.

41
Chapter III: Method
This chapter presents the method used to investigate the research questions of this study,
as described in the following sections: research design, participants, data collection and analysis.
Research Design
The purpose of this study was the development of an instrument to provide data of STEM
content knowledge transfer. Guided by the following research questions this study utilized a case
study methodology:
• In what ways does the use of a Design Log provide evidence of the transfer of STEM
content knowledge while students are engaged in a technological/engineering design-
based learning activity?
RQ-S1 What phrasing of Design Log reflective prompts effectively reveal STEM
content connections?
RQ-S2 To what extent can a Design Log instrument allow a researcher to make
judgments regarding the transfer of STEM content knowledge?
The conduct of this research follows a case study design, specifically a multiple case:
embedded design. Technological/engineering design teams comprise the cases in this study and
individual students in each team comprise the embedded unit of analysis (Yin, 2009, p. 29). For
example, if two teams were being studied then they would each be one case. Individual students
in each case would be the embedded unit of analysis. A case is embedded when collecting and
analyzing data from each participant (unit of analysis) in each case (Yin, 2003). The criteria for a
case study as outlined by Yin (2003) allows for the collection and analysis of multiple types of
data in order to create an accurate picture of a phenomenon. The goal of each type of data source
42
is to highlight a different aspect of the phenomenon. Points of convergence are identified through
data triangulation. This study used a multiple case: embedded design to accommodate the
process of instrument development by allowing the instrument to be developed and modified
over three phases with multiple technological/engineering design teams. Triangulation of data
collected from technological/engineering (T/E) design teams and interview data collected both as
a team and from individual participants (units of analysis) was conducted to identify points of
convergence regarding the transfer of STEM content knowledge across all data sources.
Previous studies of knowledge transfer (Barlax & Trebell, 2008; Hill, 1997; Kelly, 2008;
Kolodner, 2003, 2002; Puntambekar & Kolodner, 2005, 1998) acted as a guide in identifying
adequate data sources to answer each research question across three phases of data collection and
analysis. Data necessary for investigating the research questions as show in Table 1 were
generated, collected, and analyzed across three distinct Phases: Phase 1: Pilot Case Study, Phase
2: Establishing Content Validity, and Phase 3: Establishing Construct Validity.

43
Table 1 Data Collection & Analysis Plan Phase Research
Question Goal Participants Data Collection Data
Analysis Phase 1 What phrasing of
Design Log reflective prompts effectively reveal STEM content connections?
The initial development of the DLI through a pilot case study
Senior Engineering Science Capstone Design Teams
Interviews DLI Entries Field Notes Audio/Video
Triangulation
Phase 2 What phrasing of Design Log reflective prompts effectively reveal STEM content connections?
Establishing Content Validity
STEM Content Area Experts
Content Validity Instrument
Content Validity Index (CVI)
Phase 3 To what extent can a Design Log instrument allow a researcher to make judgments regarding the transfer of STEM content knowledge?
Establishing Construct Validity
Sophomore Engineering Science Design Teams
Interviews DLI Entries Field Notes Audio/Video
Triangulation
Data collection included interviews, field notes, Design Logs, and Audio/Video
recordings of participant work sessions. While students worked on their T/E design activities, all
data were collected concurrently providing a mechanism for the convergence of data through
triangulation. The following provides an overview of each data collection phase.
Phase 1: Pilot Case Study
Phase 1 was a pilot case study conducted as a means of developing the initial Design Log
Instrument (DLI). The review of literature guided the researcher in the development of initial

44
reflective prompts and a Design Log format. Assessment of the initial DLI occurred over a
period of five weeks during a T/E design activity. The DLI underwent iterative revisions based
on analysis of data collected after each weekly session for use the following week. The outcome
of Phase 1 was a refined instrument, a set of field note protocols, and establishment of initial
construct validity.
Phase 2: Establishing Content Validity
The purpose of Phase 2 was to establish the content validity of the DLI. The researcher
met with STEM content area experts who evaluated the relevance, clarity, simplicity, and
ambiguity of each prompt found in the Design Log. The goal of Phase 2 was to reach consensus
as a group that the DLI adequately prompted participants to be reflective and would provide data
of STEM content knowledge transfer.
Phase 3: Establishing Construct Validity
Phase 3 established the construct validity of the DLI during a T/E design activity.
Participants made a Design Log entry at the end of each work session. At the mid-point and end
of this phase, the researcher conducted individual interviews. At the conclusion of this phase,
data collected allowed the researcher to judge the Design Logs ability to capture the transfer of
STEM content knowledge.
Participants
The nature of this instrument development requires the participation of individuals
involved in T/E design-based activities. Such individuals are readily found in departments of
engineering where design is a central focus of the curriculum. Within the engineering department
at a large southeastern university, the researcher sought undergraduate engineering students,
specifically targeting those in Engineering Science (ES). The ES department is uniquely suited to
45
accommodate research investigating the transfer of STEM content knowledge in T/E design
activities because of their focus on intentionally necessitating the transfer of STEM content
knowledge to solve T/E design problems. ES programs “focus on imparting and using
fundamental interdisciplinary skills that address engineering problems” (Puri, 2008). These
interdisciplinary skills necessitate the use of knowledge gained both in a hierarchy of cognitive
skill and at roughly the same cognitive skill level as the engineering problem. Students of ES
programs approach problems from a theoretical level allowing them to use the interdisciplinary
skills they have gained as described by Puri (2008) and make STEM content connections.
Particularly immersed in T/E design are senior engineering students in ES during their required
fourth year, capstone design course, which intentionally attempts to foster the use of knowledge
that they have learned in their previous college courses. During this capstone course, seniors
work in teams to solve a T/E design problem. Senior capstone design teams were selected to
participate in Phase 1, which was the pilot study. The fourth year capstone course made seniors
ideal for Phase 1 because they were involved in complex T/E design problems. At this particular
southeastern university, sophomore ES students are also engaged in T/E design activities in
teams as a way to expose them to design at an early stage in their collegiate engineering
preparation. The researcher selected sophomore teams to participate in Phase 3, which
established the construct validity of the DLI. Sophomores in Phase 3 had little or no experience
in T/E design and were engaged in less complex T/E design problems compared to those in
which seniors were involved. Phase 1 was the development of the basic components for the
Design Log (instructions, design loop, questions) and observation protocols with the seniors and
phase 3 tested the intact DLI with the sophomores. Prior to any collection of data IRB approval
(Appendix A) was granted.

46
The intent of the Design Log is to be an instrument used for research in identifying
abstractions as a measure of STEM content knowledge transfer. Though used in this study only
with undergraduate engineering students, its intended use is with students working on T/E design
problems at the secondary through college level. T/E design is ubiquitous and though the grade
level may change, how a student approaches a T/E design problem is universal. Undergraduate
engineering students are involved in more complex design problems than secondary school
students. The DLI was therefore developed with these students to better understand how STEM
content knowledge transfer can be identified using a DLI. Participants provided the researcher
with data to make iterative revision to the Design Log throughout this study. Data collected from
secondary school students would have been less robust and thus would have afforded less insight
into STEM content knowledge transfer during T/E design activities.
Data Collection and Analysis
Initial instrument development.
As described in the review of literature (p.36), several researchers’ have developed
design-based learning instruments. This study builds on the instrument developed by
Puntambekar and Kolodner (2005, 1998), which built on the work of Anne Brown (1992).
Puntambekar and Kolodner (2005, 1998) developed a Design Diary instrument, which had
students reflect on their work during a design activity. The Design Diary attempted to capture
understandings as outlined by Brown (1992) and Puntambekar and Kolodner (2005). Through
this reflection, students can exhibit understandings and identify connections they are making.
Puntambekar and Kolodner (2005) developed reflective prompts based on Brown’s (1992) work.
They identified five prompting categories: macro, micro, meta-cognitive, specifications, and
prediction (Puntambekar & Kolodner, 2005, p. 202; Puntambekar & Kolodner, 1998, p. 27-28).

47
Based on the reflective prompt suggestions made by Puntambekar and Kolodner (2005), the
researcher of this study created prompting questions that purposefully align with select phases of
the T/E design process. The five prompting categories and an explanation of each are included in
Figure 3 under the heading “Prompting Categories.” Using these prompting categories, the
researcher developed an accompanying “Design Log Prompt.”

48
Prompting Categories (Puntambekar & Kolodner, 2005)
Design Log Prompts T/E Design Process
Macro Identify where in the design process participants are.
Which phase(s) of the design process are you currently in? Please circle the phase(s). What tasks have you completed in this phase? Of all the tasks you have worked through during this work session, which have you started to work on but have not completed?
1. Identify a problem either by observation or a human need
2. Frame expectation for the final solution
Micro Help participants carry out the activities within the phase or phases they are in.
What information did you need to search for that you did not already know and what knowledge did you already have that you used during this work session?
3. Investigate what is known about the problem
4. Begin to carry out the study by developing alternate solutions to the problem
5. Choose an appropriate solution from the alternate solutions that where developed previously
Meta-cognitive Help participants actively monitor their learning
How did you solve any problems that arose during this work session?
6. Develop out the chosen solution including all sub-components
7. Model the chosen solution either by producing a product or by carrying out a procedure
Specifications Participants connect their activities to design specification identified at the beginning of the design process.
Based on the expectations for your final solution that were framed in phase 2, how does the work you completed during this work session align with those expectations?
8. Check to see if your chosen solution meets the expectations that were identified earlier
Prediction Students predict how design decisions will affect the final design solution.
How would you predict your final solution to work based on the decisions which you have made during this work session?
9. If the chosen solution does not meet expectations make any improvements necessary and present your findings
Figure 3. Initial Instrument Development Matrix

49
Phase 1: Pilot Case Study
Data collection.
Phase 1 was the establishment of the initial content and construct validity of the DLI and
the field note protocols. As a means of establishing initial content validity of the DLI, content
area experts reviewed the Design Log in its initial state. Content area experts commented on the
clarity of each prompting question with feedback used to make the first iterative revision to the
DLI before its use with participants. Participants received this revised initial instrument
(Appendix G) at the first senior design team meeting.
Solicited for participation were senior design teams in ES through three email requests
(Appendix C, D, and E). Following the Introduction Protocol (Appendix H) the researcher
introduced himself and went over the informed consent form (Appendix F) and the DLI
(Appendix G). Work group sessions were Audio/Video recorded and field notes (Appendix I)
were taken. An end of work session protocol (Appendix J) provided time to make a log entry and
facilitated group interviews. The group interviews elicited feedback from participants regarding
the DLI format, prompts, and instructions. Data collection in Phase 1 occurred over a five-week
period consisting of one meeting per week with each senior design team.
Data analysis.
Analysis of Phase 1 data involved transcribing Video/Audio recordings and coding of the
field notes/Design Log entries. Content analysis was used to code for STEM content
connections. The researcher analyzed the data by identifying and coding common themes
throughout, as suggested by Yin (2003). Yin (2003) suggests coding be done by referring to the
research questions and knowing what types of data are needed to answer them. The end goal of
this study is to develop the DLI to elicit abstractions as a measure of STEM content knowledge

50
transfer. This purpose has allowed the researcher to look for emerging themes that align with
each STEM discipline. Following this approach, the researcher looked for themes associated
with concepts in each of the STEM disciplines. Color coding, used for identifying themes was
completed in two steps. The first step required an initial reading of the transcripts, from which
the researcher coded for broad themes. A second read of the transcripts produced a list of
emergent themes, which combined into code categories. Triangulation of these code categories
with the Design Log entries and observation data (Audio/Video transcripts and field notes)
identified instances of knowledge transfer through convergence as a method of corroborating the
findings. The Design Log format, prompts, and instructions were iteratively revised based on
analyses of weekly group data. Data collection of Video/Audio recordings, field notes,
interviews, and log entries lasted for five weeks providing the researcher with four data points.
At each final team meeting the researcher thanked participants using the ejection protocol
(Appendix K). At the conclusion of Phase 1, the researcher made a fifth and final revision to the
DLI and the accompanying field note protocols.
Phase 2: Establishing Content Validity
Data collection.
The goal of Phase 2 was to establish the content validity of the instrument developed in
Phase 1. Three STEM content area experts were identified “to review the instrument and agree
that ‘Yes, these are the appropriate items [criteria] to get at what is desired’” (Cox, 2008). Based
on work done by Yaghmaie (2003), a content validity tool (Appendix L) was developed for use
by experts in evaluating each Design Log reflective prompt. Experts evaluated each Design Log
reflective prompt based on its relevance, clarity, simplicity, and ambiguity (Yaghmaie, 2003).
The following definitions where used for consistency in expert review: Relevancy: having
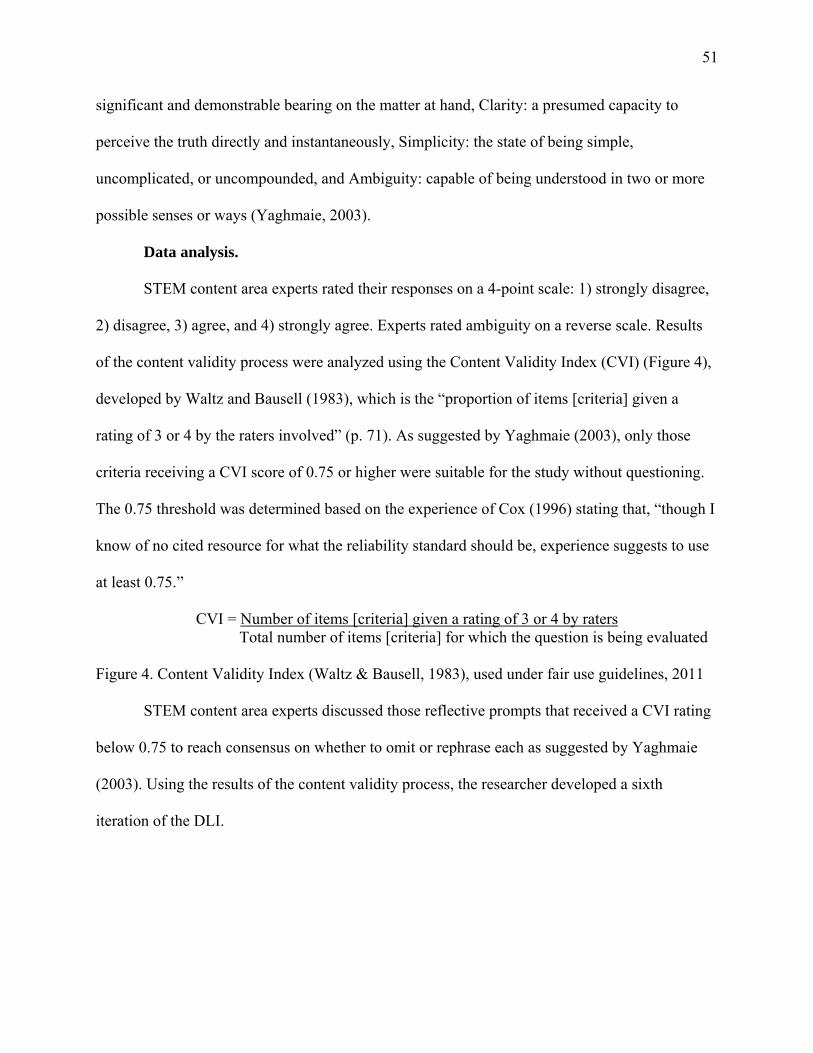
51
significant and demonstrable bearing on the matter at hand, Clarity: a presumed capacity to
perceive the truth directly and instantaneously, Simplicity: the state of being simple,
uncomplicated, or uncompounded, and Ambiguity: capable of being understood in two or more
possible senses or ways (Yaghmaie, 2003).
Data analysis.
STEM content area experts rated their responses on a 4-point scale: 1) strongly disagree,
2) disagree, 3) agree, and 4) strongly agree. Experts rated ambiguity on a reverse scale. Results
of the content validity process were analyzed using the Content Validity Index (CVI) (Figure 4),
developed by Waltz and Bausell (1983), which is the “proportion of items [criteria] given a
rating of 3 or 4 by the raters involved” (p. 71). As suggested by Yaghmaie (2003), only those
criteria receiving a CVI score of 0.75 or higher were suitable for the study without questioning.
The 0.75 threshold was determined based on the experience of Cox (1996) stating that, “though I
know of no cited resource for what the reliability standard should be, experience suggests to use
at least 0.75.”
CVI = Number of items [criteria] given a rating of 3 or 4 by raters Total number of items [criteria] for which the question is being evaluated
Figure 4. Content Validity Index (Waltz & Bausell, 1983), used under fair use guidelines, 2011
STEM content area experts discussed those reflective prompts that received a CVI rating
below 0.75 to reach consensus on whether to omit or rephrase each as suggested by Yaghmaie
(2003). Using the results of the content validity process, the researcher developed a sixth
iteration of the DLI.

52
Phase 3: Establishing Construct Validity
Data collection.
The goal of this phase was to establish the construct validity of the instrument. Data
collection occurred in Phase 3 at each work session, which entailed Audio/Video recording while
the researcher took field notes. At the end of each work session, a protocol (Appendix M)
provided time for participants to make a Design Log entry. Participants had five to ten minutes to
respond to the Design Log reflective prompts. Participants also took part in mid-phase and end-
of phase interviews, which allowed them to elaborate on their Design Log entries and explain
their use of knowledge over several weeks.
Data analysis.
After each work session data were analyzed and coded for potential instances of transfer.
An operational definition would provide consistent coding of potential instances of knowledge
transfer. For this study knowledge transfer was defined as the abstraction of any knowledge,
information, or experiences by participants and used when trying to understand higher order
concepts. Based on the review of literature, this definition operationalized data analysis (Fuchs,
2003; Gagné, Wager, Golas, & Keller, 2005; Gagné & Paradise, 1961; Gentner & Markman,
1997; Gentner & Medina, 1998; Gentner, Loewenstein, & Thompson, 2003; Gick & Holyoak
1980, 1983, 1987; Lobato, 1997, 2003, 2006; Reed, Ernst, & Banerji 1974; Reed, 1993; Singley
& Anderson, 1989). To provide a consistent interpretation of terms, the researcher will explain
each component of the knowledge transfer definition. Knowledge is what participants understand
about a topic learned in a formal educational environment. Information is knowledge that
participants do not yet possess, and which is gained through research or talking to content
experts of the desired information. Experiences are those real-world, informal learning instances

53
where participants apply knowledge learned while working through some task. Participants pull
from these three areas when trying to understand higher order concepts. Participants understand
higher order concepts by first understanding the lower level cognitive knowledge associated
with that larger concept (Gagne, Wager, Golas, & Keller, 2005). This way of building cognitive
knowledge allows participants to come to understand higher-level cognitive concepts.
As previously discussed (p. 9), abstractions are representations of knowledge transfer.
Abstractions serve as the primary cognitive support for knowledge transfer (Fuchs et al., 2003;
Gentner, Loewenstein, & Thompson, 2003; Gentner & Markman, 1997; Gentner & Medina,
1998; Reed, 1993; Singley & Anderson, 1989). The DLI allows researchers to make judgments
of potential instances of knowledge transfer during T/E design activities. The researcher
identified abstractions from the data as the primary mechanism of identifying potential instances
of transfer. The sample analysis rubric, shown in Table 2 displays instances of abstraction as a
representation of knowledge transfer, by analyzing participant Design Log entries. The
researcher used the operational definition for knowledge transfer to analyze Design Log entries
for points of abstraction.
Data analysis began with the review of DLI entries. The purpose of this review was to
identify abstractions. As shown in Table 2, when an abstraction was identified, the verbatim DLI
entry provided by participants was entered into the analysis rubric along with the reflective
prompt that it occurred in and the individual participant reporting the abstraction. As the example
in Table 2 shows, participant “G” responded to DLI Reflective Prompt 2 with “what designs are
out there.” The entry provided by participant “I” stated “I knew some possible designs.” This
was also in response to DLI Reflective Prompt 2. Also entered from the DLI entries were the
reported T/E Design Phases from participants. Using the field note data the researcher entered

54
the observed T/E Design Phase, which represents where the researcher believed participants
were in the T/E Design Process. Audio/Video transcripts and interviews acted as corroborating
evidence and were essential in fully understanding how participants throughout their T/E design
problems used each abstraction. Audio/Video transcripts were coded for abstractions as shown in
Table 2 with efficiency, energy, design, advantages, disadvantages, etc. Interview data were also
coded for abstractions. During both mid-phase (week3) and end-of-phase (week7) interviews
participants were asked to directly elaborate on their DLI responses. As shown in the example in
Table 2, the abstractions that were identified in the interview data were brainstorming, research,
basic understanding of windmills, size, construction, and technologies. Using the data from the
DLI responses, Audio/Video transcripts, and interviews, an abstraction was identified. In the
example shown in Table 2 the abstraction was design. Data also allowed the researcher to make
an inference regarding how participants used the abstraction. A portion of the inference shown in
the example was, “general knowledge to understand wind power and how it works.” Using this
inference each abstraction was assigned a STEM content code. In the example, the design
abstraction was coded as S-T-E-M. The purpose of using the analysis rubric was to display data
in preparation to make judgments regarding whether or not each abstraction was an instance of
STEM content knowledge transfer.

55
Table 2 Sample Analysis Rubric of Phase 3 Data
Log Question Participant Log Entry Design Phase Triangulation Data Abstraction Inference Content Code (S-T-E-M) Reported Observed Audio/Video Interviews
Considering the main topics you listed in question one, describe what Science, Technology, Engineering, and Mathematics (STEM) content you knew and what STEM content you did not know about each topic?
G I
What designs are out there / I knew some possible designs
NA 3 Efficiency, Energy, Design, Advantages, Disadvantages, Look into both projects, Actually doing at each, Who’s turbines there planning on using, Offshore types of windmills, Gigawatts Lines 25-32, 119-134 (Bright Green)
Brainstorming, research, Basic understanding of windmills, Size, Construction, Technology
Design General knowledge to understand wind power and how it works. This general knowledge about energy is derived from science, technology, and engineering content. Design is a technology and engineering concept. Possible constraints that were identified to help frame the argument to make a more accurate recommendation. Participants had to consider what type of turbine would work best at each location which included considering assembly, efficiency, and durability. These concepts are derived from technology and engineering content. Mathematics content was also used to calculate various design issues.
S – T – E – M

56
Though the researcher had already established codes, their reliability was still in question.
“Interrater reliability is a measure used to examine the agreement between two people (raters) on
the assignment of categories of a categorical variable. Interrater reliability is an important
measure in determining how well a coding or measurement system works (Cox, 1996). Raters
generated initial codes by analyzing one Video/Audio recording transcript (10% of the total data)
and filling out the Interrater Reliability Data Matrix (Cox, 1996; Fink, 1995; Fink & Kosecoff,
1985). The researcher calculated the percent agreement as a measure of interrater reliability. This
measure is the ratio of the number of criteria on which the raters agreed divided by the total
number of criteria: (Total number of agreements / Total number of observations) X 100. An
overall percentage agreement equal to or higher than 80% was desired (Cox, 1996; Fink, 1995;
Fink & Kosecoff, 1985).
Five raters coding 10% of the total Audio/Video transcripts established interrater
reliability. Raters used the Interrater Reliability Data Matrix (Appendix S) as a template while
coding. Using this process, raters reached consensus when the percent agreement was 80% or
higher (Cox, 1996; Fink, 1995; Fink & Kosecoff, 1985). Each rater began by coding the
Audio/Video transcript and recording each potential abstraction as shown in Table 3.
Table 3 Interrater Reliability Data Matrix Example # Group Lines Abstraction S-T-E-M
1 2-21 Efficiency S-T-E-M 2 22-34, 37-40 Environmental impact S-T-E Note: S=Science, T=Technology, E=Engineering, and M=Mathematics
Raters recorded the line number range where each abstraction was discussed, which in
the first example were lines 2 through 21. They then identified the actual abstraction and entered
it into the abstraction column. In example one, the identified abstraction was efficiency. Lastly,

57
raters assigned a STEM content code to each abstraction. In example one, the abstraction of
efficiency was coded as S-T-E-M. When each rater had completed coding, all raters met to
discuss the findings and reach consensus regarding the analysis strategy. If the overall percent
agreement was below 80%, rater discussed codes until consensus reached above the 80%
threshold. Following the consensus, raters coded a final response and compared it to confirm that
the coding scheme was correct.
Following the coding of all data, the researcher used the Reliability Rubric (Appendix O)
to answer RQ-S2. In order to answer RQ-S2, “to what extent can a Design Log instrument allow
a researcher to make judgments regarding the transfer of STEM content knowledge?” a ratio was
needed to identify to what extent participants record abstractions in their Design Log entries.
This ratio was calculated as (Total number of reported abstractions / Total number of observed
abstractions) X 100. An overall ratio equal to or higher than 70% was desired (Cox, 2008; Fink,
1995; Fink & Kosecoff, 1985). This ratio represents the difference in the abstractions observed
by the researcher and the reported abstractions by participants in their Design Logs. This ratio
allowed the researcher to assess the reliability of the instrument.
The final stage of data analysis in Phase 3 led to the last iteration of the DLI. The purpose
of this study was to develop a DLI that could be the sole means of data collection to evidence the
transfer of STEM content knowledge during T/E design activities. During the implementation of
this study, the researcher used concurrent methods of data collection. Final analyses of data
occurred at the conclusion of Phase 3 using the reliability ratio to determine the strength of the
Design Log as an independent measure of STEM content knowledge transfer. The following
chapter addresses the finding of this study.

58
Chapter IV: Data Analysis and Findings
The purpose of this study was the development of an instrument to provide data on STEM
content knowledge transfer. Guided by the following research questions, this study utilized a
case study methodology:
• In what ways does the use of a Design Log provide evidence of the transfer of STEM
content knowledge while students are engaged in a technological/engineering design-
based learning activity?
RQ-S1 What phrasing of Design Log reflective prompts effectively reveal STEM
content connections?
RQ-S2 To what extent can a Design Log instrument allow a researcher to make
judgments regarding the transfer of STEM content knowledge?
The nature of this instrument development required the participation of individuals
involved in technological/engineering (T/E) design-based activities. The engineering department
at a large southeastern university provided such individuals. Phase 1 of this study utilized senior,
Engineering Science (ES) capstone design teams for a pilot study. The fourth year capstone
course made seniors ideal for Phase 1 because they were involved in complex T/E design
problems. At this particular southeastern university, sophomore ES students were also engaged
in T/E design activities in teams as a way to expose them to design at an early stage in their
collegiate engineering preparation. Sophomore teams participated in establishing the construct
validity of the DLI, which occurred during Phase 3. Sophomores in Phase 3 had little or no
experience in T/E design and developed a proposal at the end of their design challenge. This is in
contrast to senior teams who developed a physical prototype. As novice designers, sophomores

59
were ideal to test the DLI reflective prompts with participants who did not have a prior
understanding of the T/E design process.
The research method for this study followed a case study design, specifically a multiple
case: embedded design. The multiple case: embedded design was chosen to accommodate the
process of instrument development by allowing it to be developed and modified over three
phases with multiple T/E design teams. The data sources included Audio/Video recording
transcripts, field notes, interviews (group and individual), and DLI responses collected from each
member of the T/E design teams. Triangulation of these data provided points of convergence
regarding the transfer of STEM content knowledge across all data sources.
This investigation began with Phase 1 intentionally designed as a pilot study to inform
and familiarize the researcher with the process of collecting data on transfer. By conducting the
pilot study first, the researcher was able to develop clear DLI reflective prompts, and to refine
the method of collecting and analyzing data. The purpose of Phase 2 was to establish content
validity of the reflective prompts. The intent of Phase 3 was to establish the construct validity of
the reflective prompts. The following sections present the analysis and findings of Phase 1: Pilot
Case Study, Phase 2: Establishing Content Validity, and Phase 3: Establishing Construct
Validity, in chronological order.
Phase 1: Pilot Case Study
Phase 1 was a pilot case study conducted as a means of developing the initial DLI.
Assessment of the initial DLI occurred over a period of five weeks during a T/E design activity.
Two design teams were utilized, each meeting once a week for the duration of the five weeks.
Concurrent collection of Audio/Video recordings and field note data occurred during each work
session. At the end of each work session, the researcher conducted a team interview and

60
collected the DLI from each team member. Triangulation of these four data points provided the
basis for iterative revisions across the five weeks. The primary means for making these revisions
were the end of work session interviews. An interview protocol (Appendix J) guided these
interviews. The researcher used interviews to collect participant feedback to evaluate the clarity
of the reflective prompts. Coding of these data provided participant perceptions of the DLI and
its ease of use. Based on the collective responses of all participants, modifications to the DLI
improved the use of the prompts as well as increased their ability to report instances of transfer.
Audio/Video recordings, field notes, and DLI responses acted as corroborating evidence
in justifying the weekly revisions. Analysis of these data began with the transcription of each
Audio/Video recording and coding them in conjunction with the field notes (Appendix I). Field
notes acted as a guide in the coding of Audio/Video transcripts. Each field note entry identified
locations in the transcripts of observed transfer.
The researcher then coded the participant DLI entries for instances of transfer.
Triangulation of the resultant codes from the Audio/Video transcripts, field notes, and DLI
entries provided points of convergence where STEM content knowledge transfer occurred. The
purpose of this triangulation was to judge the degree to which participant responses to the DLI
corresponded with the field notes and Audio/Video recording transcripts as an attempt to
establish the reliability of the DLI as an independent measure of transfer. The triangulation
process described above was the method used to make iterative revisions to the DLI after each
weekly session with both design teams. Presented in Table 4 is a comparison of the initial and
final iteration of the DLI reflective prompts.

61
Table 4 Comparison of Initial and Final DLI Prompt Iterations Prompt # Initial Reflective Prompts Final Iteration of Reflective Prompts
1 Of all the tasks you have worked through during this work session, which have you started to work on but have not completed?
Look at your notes on the previous page and identify the main topics that were discussed during this work session.
2 What information did you need to search for that you did not already know and what knowledge did you already have that you used during this work session?
Considering the phase(s) you indicated on the previous page and the main topics you listed in question one, what Science, Technology, Engineering, and Mathematics (STEM) content did you know and what STEM content did you not know about each topic?
3 How did you solve any problems that arose during this work session?
List any design constraints, design trade-offs, or design failures that you were confronted with during this work session. Then explain how what you were confronted with allowed you to improve your proposal (design solution).
4 Based on the expectations for your final solution that were framed in phase 2, how does the work you completed during this work session align with those expectations?
Looking at the design constraints, design trade-offs, or design failures you listed in question three, how do those modifications affect your original proposal (design) scenario criteria?
5 How would you predict your final solution to work based on the decisions which you have made during this work session?
From the affects stated in question four, how do you predict they will influence your final proposal (design solution)? Explain your answer.
Phase 1 began by using the DLI previously developed prior to beginning the collection of
data (p.45). Both design teams used this version of the DLI during the first weekly work session.
Following the use of this instrument containing the initial reflective prompts, weekly iterative
revisions resulted in an instrument containing the final reflective prompts as indicated in Table 3.
Iterative revisions to the DLI reflect the data analysis and participant responses to the interview
questions. The researcher and a STEM content expert reviewed the data and reached consensus
on revisions to DLI reflective prompts.

62
Reflective Prompt 1.
Data analysis of interview responses in week one revealed that 66.67% of participants
from both teams (6 of 9) reported that including a notes section in the DLI would be beneficial
and provide them with something to refer to when responding to the reflective prompts. This
notes section, if included, would allow participants to use the DLI throughout the meeting rather
than simply at the end. By adding this notes section, Reflective Prompt 1 was modified to link
back to the notes section and asked participants to list the main topics that were discussed during
the work session.
Reflective Prompt 2.
In the initial version of Reflective Prompt 2, participants were asked to describe any
information they needed to search for and any knowledge they already had, for use during a
particular work session. Analysis of data indicated that 100% (9 of 9) of participants reported
that this prompt was very confusing and therefore it was changed to ask what they knew and did
not know about each of the main topics discussed during the present work session. At the
conclusion of week three, although interview data indicated that 100% (9 of 9) of participants
spoke positively of the prompt revision, participant DLI responses indicated that 77.78% (7 of 9)
of participants were not describing the STEM content used to solve problems and develop their
ideas. Therefore, the addition of Science, Technology, Engineering, and Mathematics (STEM) to
Reflective Prompt 2 was necessary so that participants knew the types of knowledge that they
should report.
Reflective Prompt 3.
At the conclusion of week one data analysis, Reflective Prompt 3 was modified to ask
participants to discuss any constraints, trade-offs, or failures that arose during the current work
63
session. DLI responses suggested that 100% (9 of 9) of participants were not adequately
responding to this question and by adding more specific language, they would provide better
responses. Data from week two revealed that 55.56% (5 of 9) of participants reported that
Reflective Prompt 3 was too broad and therefore responding was difficult. For example, a
participant reported a problem with a presentation during the meeting as a failure. To maintain
focus on the T/E design process the word “design” was added before constraints, trade-offs, and
failures in Reflective Prompts 3 and 4. By adding “design”, participants would only report what
was relevant to the design process and not ancillary issues. Analysis of DLI responses in week
four suggested that 77.78% (7 of 9) of participants were not describing how the events of each
work session affected their design solution. Modification of Reflective Prompt 3 asked
participants to describe how each design constraint, design trade-off, and design failure allowed
them to improve their design solution.
Reflective Prompts 4 & 5.
At the completion of week one, Reflective Prompt 4 was combined with Reflective
Prompt 5 because 66.67% (6 of 9) of participants reported during the interviews that both
prompts were confusing. As in Reflective Prompt 3, constraints, trade-offs, or failures were
added and participants were asked to describe how each would affect their original design
expectations and then to predict how each would affect their final solution. Analysis of week
four data suggested that participants were only responding to one part of the prompt and not the
other. Data to support this showed that 100% (9 of 9) of participants either were only referring
back to their original design proposal or were only making a prediction. Therefore, this prompt
was divided into two parts. By dividing Reflective Prompt 4 into two separate prompts,
participants would need to respond to both rather than have the option of giving only a partial
64
response. The revised Reflective Prompt 4 asked participants to reflect on how their current work
affected their original design criteria. This refers to the original design criteria that participants
agreed upon at the beginning of the project, including what the final design should be able to do.
Reflective Prompt 5 asked participants to describe how what they discussed in Reflective Prompt
4 also affected their final design solution.
After the first week of data collection in Phase 1, 88.89% (8 of 9) of participants reported
confusion and misunderstanding with the DLI. At the end of Phase 1, 100% (9 of 9) of
participants reported that the DLI was clear and simple to follow. They also stated that the DLI
had improved over time and flowed better. Phase 2 of this study utilized the final iteration of the
DLI reflective prompts to establish content validity.
Phase 2: Establishing Content Validity
According to Hittleman and Simon (2002) in order to establish the content validity of a
questionnaire, the instrument creator must “demonstrate that the specific items [criteria] or
questions represent an accurate sampling of specific bodies of knowledge. Creators of
instruments establish content validity by submitting the instruments’ items [criteria] to a group of
authorities in the content area and it is their expert opinions that determine whether the
instruments have content validity” (p. 112). In this study the term criteria replaces the term item
throughout. A group of three STEM content experts using the content validity process described
by Yaghmaie (2003) reviewed the introduction, T/E design model, and DLI reflective prompts to
determine their accuracy to elicit participant demonstration of STEM content knowledge
transfer. The researcher used the following criteria as outline by Cox (2008) and Cezarino (2004)
in selecting the panel of experts: (a) exposure to educational research, (b) knowledge of the
research context, in this case, T/E design, and (c) a theoretical understanding of the construct, in

65
this case knowledge transfer. Establishment of content validity utilized the 3-step process
suggested by Yaghmaie (2003) and described in the following paragraphs.
Content Validity Step 1.
Content Validity Step 1 involved the researcher meeting individually with experts to
discuss the DLI and describe the content validity process. Following this meeting, experts
received electronic copies of the DLI developed in Phase 1 and the content validity instrument
(Appendix L) which guided experts through rating each criterion.
Content Validity Step 2.
Content Validity Step 2 was the consensus meeting. Experts brought the reviewed DLI
for discussion with the group. As described in Chapter III (p.49-50), experts rated each DLI
reflective prompt based on its relevance, clarity, simplicity, and ambiguity (Yaghmaie, 2003).
The following definitions where used for consistency in expert review: Relevancy: having
significant and demonstrable bearing on the matter at hand, Clarity: a presumed capacity to
perceive the truth directly and instantaneously, Simplicity: the state of being simple,
uncomplicated, or uncompounded, and Ambiguity: capable of being understood in two or more
possible senses or ways (Yaghmaie, 2003). Experts rated each DLI reflective prompt on a four-
point scale: 1) strongly disagree, 2) disagree, 3) agree, and 4) strongly agree. Ambiguity was
rated using a reverse scale, 1) strongly agree, 2) agree, 3) disagree, and 4) strongly disagree.
Experts could also make suggestions for improving the introduction, T/E design model, and the
DLI reflective prompts.
Content Validity Step 3.
Content Validity Step 3 involved the researcher incorporating the agreed upon changes
into a revised version of the DLI. Experts received one week to review the introduction, T/E

66
design model, and rate the DLI reflective prompts. Analysis of expert ratings utilized the Content
Validity Index (CVI) developed by Waltz & Bausell (1983), which is the “proportion of criteria
given a rating of 3 or 4 by the raters involved” if using a four point likert scale (p. 71). As
suggested by Yaghmaie (2003) only those criteria receiving a CVI of 0.75 or higher were
suitable for the study as written.
Phase 2: Content Validity Results
During the consensus meeting, experts met to present their ratings and discuss the
introduction, T/E design model, and the DLI reflective prompts. Experts took turns discussing
their ratings and possible ways to improve each part of the instrument. This continued until all
experts agreed on the revisions. Consensus was used for clarification of the introduction and the
T/E design model. A rating process was not needed as explained below. Reflective prompts
however used a rating process and modification occurred if they received a CVI below 0.75.
Those receiving a rating of 0.75 or higher were still reviewed during the consensus meeting as a
means of further refinement.
Introduction.
Input from panel members was used in modifying the introduction (background and
directions) of the DLI, which improved clarity. In the background portion of the DLI
introduction, the first sentence changed from “Design and Inquiry are fundamental human
aptitudes that we use each day” to “Design and Inquiry are processes that we use every day.”
This change improved clarity because some may not understand what is meant by “fundamental
human aptitudes;” whereas, “process that we use every day” is much easier to understand. In the
directions portion of the DLI introduction, the word “react” became “respond” because this term

67
more clearly represents what participants are doing. Minimal modifications were required to
reach consensus on the wording used for the introduction.
T/E Design Phase Descriptions.
Modification of the nine T/E design phases depicted in the DLI was part of the content
validity consensus meeting. Experts did not rate these nine phases as with the reflective prompts.
Instead, during the consensus meeting, experts were asked to review each T/E design phase
description for clarity and ambiguity. Experts discussed proposed modifications until they
reached consensus. Those modifications are shown in Table 5.
Table 5 Phase 2 Modifications of T/E Design Phase Descriptions Design Phase # Initial Design Phase Descriptions Modified Design Phase Descriptions
1 Identify a problem either by observation or a human need
Identify a problem either by observation or a human need
2 Frame criteria for the final solution Frame criteria for the final solution 3 Investigate what is known about the
problem Investigate what is known about the problem
4 Begin to carry out the study by developing alternate solutions to the problem
Develop alternate solutions to the problem
5 Choose an appropriate solution from the alternate solutions that where developed previously
Choose an appropriate solution from the alternate solutions
6 Develop out the chosen solution including all sub-components
Develop detailed plans for constructing your chosen solution
7 Model the chosen solution either by producing a product or by carrying out a procedure
Simulate or prototype your chosen solution
8 Check to see if your chosen solution meets the expectations that were identified earlier
Check to see if your chosen solution meets the criteria that were identified earlier
9 If the chosen solution does not meet expectations make any improvements necessary and present your findings
If the chosen solution does not meet the criteria make any improvements necessary and present your findings
During the consensus meeting 100% (3 of 3) of experts agreed that several T/E Design
phase descriptions needed modification to improve their clarity and decrease ambiguity. Experts

68
modified the description of Design Phase 4 to ask participants to “Develop alternate solutions to
the problem.” Modification to the description of Design Phase 5 asked participants to “Choose
an appropriate solution from the alternate solutions.” Experts agreed that Design Phase 6 was
confusing when asking about sub-components. Therefore, that portion of the description was
omitted and participants were only asked to “Develop detailed plans for constructing your
chosen solution.” Design Phase 7 was modified in a similar way to say only “Simulate or
prototype your chosen solution.” This modification made the design phase description less
confusing by omitting the portion that asks about carrying out a procedure. Modification of
descriptions for Design Phases 8 and 9 changed the word “expectations” to “criteria” because
this term more clearly described what participants were using to judge their final design solution.
In addition, this term more closely aligned with Design Phase 2, which asked participants to
“Frame criteria for the final solution.” Consistency of terms is critical for clarity, which is why
the terms were changed (Cox, 1996; Fink, 1995; Fink & Kosecoff, 1985).
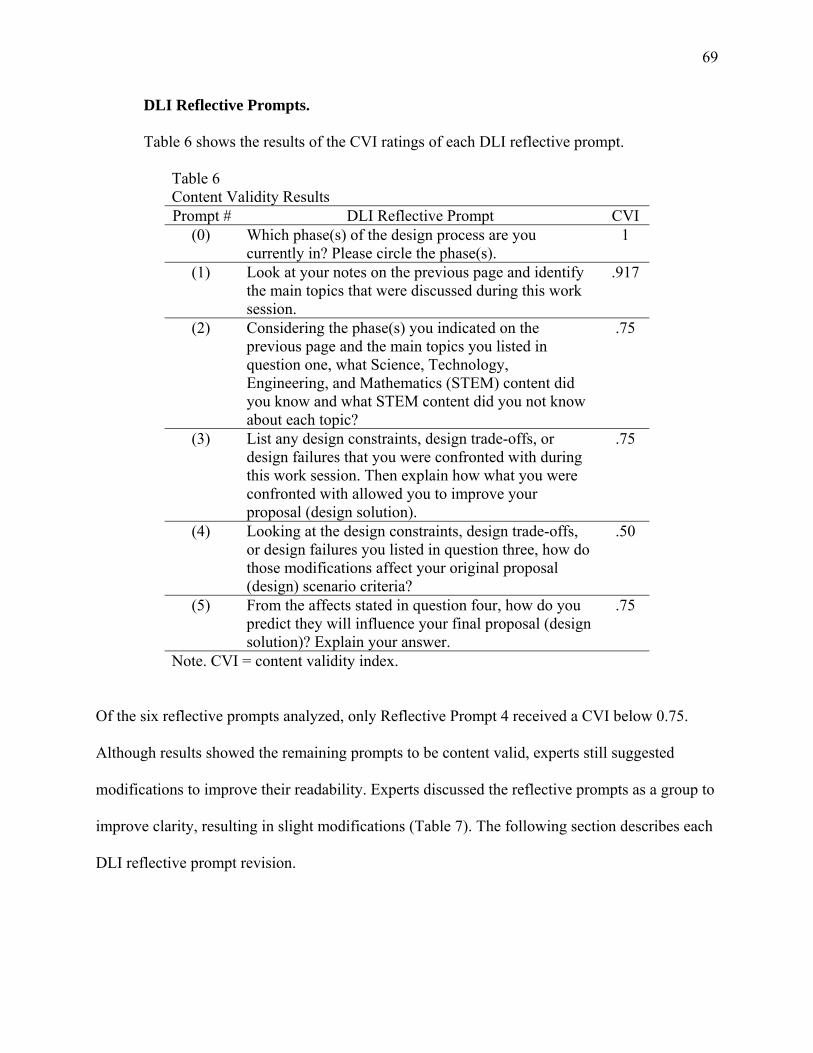
69
DLI Reflective Prompts.
Table 6 shows the results of the CVI ratings of each DLI reflective prompt.
Table 6 Content Validity Results Prompt # DLI Reflective Prompt CVI
(0) Which phase(s) of the design process are you currently in? Please circle the phase(s).
1
(1) Look at your notes on the previous page and identify the main topics that were discussed during this work session.
.917
(2) Considering the phase(s) you indicated on the previous page and the main topics you listed in question one, what Science, Technology, Engineering, and Mathematics (STEM) content did you know and what STEM content did you not know about each topic?
.75
(3) List any design constraints, design trade-offs, or design failures that you were confronted with during this work session. Then explain how what you were confronted with allowed you to improve your proposal (design solution).
.75
(4) Looking at the design constraints, design trade-offs, or design failures you listed in question three, how do those modifications affect your original proposal (design) scenario criteria?
.50
(5) From the affects stated in question four, how do you predict they will influence your final proposal (design solution)? Explain your answer.
.75
Note. CVI = content validity index.
Of the six reflective prompts analyzed, only Reflective Prompt 4 received a CVI below 0.75.
Although results showed the remaining prompts to be content valid, experts still suggested
modifications to improve their readability. Experts discussed the reflective prompts as a group to
improve clarity, resulting in slight modifications (Table 7). The following section describes each
DLI reflective prompt revision.

70
Table 7 Phase 2 Revisions of DLI Reflective Prompts Prompt # Initial Reflective Prompts Revised Reflective Prompts
1 Look at your notes on the previous page and identify the main topics that were discussed during this work session.
Look at your notes on the previous page, then identify and list the main topics that were discussed during this work session.
2 Considering the phase(s) you indicated on the previous page and the main topics you listed in question one, what Science, Technology, Engineering, and Mathematics (STEM) content did you know and what STEM content did you not know about each topic?
Considering the main topics you listed in question one, describe what Science, Technology, Engineering, and Mathematics (STEM) content you knew and what STEM content you did not know about each topic?
3 List any design constraints, design trade-offs, or design failures that you were confronted with during this work session. Then explain how what you were confronted with allowed you to improve your proposal (design solution).
List any design constraints, design trade-offs, or design failures that you were confronted with during this work session.
4
Looking at the design constraints, design trade-offs, or design failures you listed in question three, how do those modifications affect your original proposal (design) scenario criteria?
Explain how these design constraints, design trade-offs, or design failures led you to change your proposal.
5 From the affects stated in question four, how do you predict they will influence your final proposal (design solution)? Explain your answer.
Given your response to question three, what is your prediction of how each design constraint, design trade-off, or design failure will affect your final proposal? Explain your answer.
Based on the consensus meeting discussion and the expert ratings, it was determined that
DLI reflective prompts needed to build off each other, making prompts more cohesive. Prompts
also became more specific to guide participants regarding how to respond.
Reflective Prompt 1.
Experts modified Reflective Prompt 1 to include “identify and list” which encourages
participants to report a list of main topics discussed during that work session. Previous wording

71
only asked participants to identify the main topics, which in some cases elicited an explanation.
For this question, the researcher was primarily interested in a simple list of topics.
Reflective Prompt 2.
To improve the cohesiveness between Reflective Prompt 1 and 2, Reflective Prompt 2
now built off Reflective Prompt 1. Participants described what they knew and did not know
specifically about the topics discussed during the work session. The idea was to encourage
participants to respond to each main topic instead of just some of them.
Reflective Prompts 3 & 4.
Reflective Prompts 3 and 4 followed a similar logic of building off the pervious prompt.
Reflective Prompt 3 asked participants to list any design constraints, design trade-offs, or design
failures. Reflective Prompt 4 then followed and asked participants to explain how their responses
to Reflective Prompt 3 caused them to change their proposal. Reflective Prompt 4 received a
CVI below 0.75 and therefore further discussion was needed to reach consensus. The original
sequence of Reflective Prompts 3 and 4 seemed confusing because experts agreed that
participants might not understand the difference between their proposal and their original
proposal. To resolve this issue, the experts agreed that participants should simply list the design
constraints, design trade-offs, or design failures in Reflective Prompt 3. In this way, Reflective
Prompt 4 now asked participants to explain how each led them to change their proposal.
Reflective Prompt 5.
Originally, Reflective Prompt 5 built off Reflective Prompt 4 and asked participants to
make a prediction regarding how what was described in Reflective Prompt 4 would affect their
final solution. However, this was unclear because Reflective Prompt 4 asked participants about
their original proposal. To clarify, the prompt was changed to ask participants to use the list of
72
design constraints, design trade-offs, or design failures from Reflective Prompt 3 and make a
prediction regarding how each would affect their final proposal.
Summary.
All of the experts agreed that by making these modifications to the reflective prompts,
participants would be more likely to give complete and clear responses related to the transfer of
STEM content knowledge. All of the modifications to the introduction, T/E design model, and
DLI reflective prompts resulted in a content valid, sixth iteration of the DLI for use in Phase 3 of
this study.
Phase Three: Establishing Construct Validity
Construct validity of the DLI, developed through the first two phases of this study,
occurred in Phase 3. In Phase 3, the content validated DLI was used during a T/E design problem
spanning the first 6 phases of the T/E design process. The establishment of construct validity in
this study was critical to determine the degree to which DLI reflective prompts elicited responses
that align with the theoretical construct of knowledge transfer.
Phase 3 utilized two design teams working through two different design problems. Data
collection occurred in Phase 3 at each team work session, which entailed Audio/Video
recordings while the researcher took field notes for later analysis and triangulation. At the end of
each work session, time was provided for participants to make a DLI entry. Participants had five
to ten minutes to respond to the DLI reflective prompts. Mid-phase (week three) and end-of-
phase (week seven) interviews occurred individually with each participant to gather detailed
explanations of DLI entries and clarify how participants used knowledge. Participants received
their DLI at the beginning of the T/E design activity and used the same DLI throughout the
project.

73
As previously discussed (p. 9), abstractions are representations of knowledge transfer.
Abstractions serve as the primary cognitive support for knowledge transfer (Fuchs et al., 2003;
Gentner, Loewenstein, & Thompson, 2003; Gentner & Markman, 1997; Gentner & Medina,
1998; Reed, 1993; Singley & Anderson, 1989). The researcher therefore identified abstractions
from the data as the primary mechanism for identifying potential instances of transfer. The
researcher used the operational definition for knowledge transfer (p. 51) to analyze DLI entries
for points of abstraction. A Data Matrix was used to display data in preparation to make
judgments regarding whether or not each abstraction was an instance of STEM content
knowledge transfer. An example of the Data Matrix appears in Table 8.

74
Table 8 Example Data Matrix
Log Question Participant DLI Entry Design Phase Triangulation Data Abstraction Inference Content Code (S-T-E-M) Reported Observed Audio/Video Interviews
Look at your notes on the previous page, then identify and list the main topics that were discussed during this work session.
F Wind VAR 6 3
Designs, New Model, Metric, Maintenance, Wind VAR, Stabilization of power grid, Power electronics, Voltage, Power factor, Installation, Modular construction, Transportation of parts Lines 2-18, 104-157 (Yellow)
Wind power in general, Feasibility, Wind VAR, Power electronics package, Reactive power, How the grid actually works, How the grid responds to wind power, Adjustable turbine blades to reduce damage, Size of turbines, Technology, Money math
Design Discussing a new model of wind turbine and converting its stated height to metric. Wind VAR was also discussed which, is a method of stabilizing a power grid through wind energy. Lastly, the construction and transportation of wind turbines was discovered to be a modular process. Science, technology, and engineering content were used to understand the benefits of different wind turbine configurations. Mathematics content was used to calculate the energy production of the wind turbine.
S – T – E – M
Considering the main topics you listed in question one, describe what Science, Technology, Engineering, and Mathematics (STEM) content you knew and what STEM content you did not know about each topic?
F VAR and Grid dynamics
6

75
Using the Data Matrix as a means of displaying the data, the researcher coded the weekly
field notes and Audio/Video recording transcripts. After the identification of all the abstractions
in the Audio/Video recording transcripts, the researcher compared them to the participant DLI
responses. The researcher began by entering the codes from the Audio/Video recording
transcripts into the Data Matrix. Then the researcher recorded the DLI responses along with the
corresponding participant and the corresponding DLI reflective prompt. The researcher also
recorded which T/E design phase participants reported they were in as well as the observed
phase. Next, content analysis of the interview transcripts provided corroborating evidence. With
these data analyzed, it was possible to easily review them, and identify abstractions. An
inference was also made with each abstraction regarding its use. Lastly, the researcher coded
each abstraction for the STEM content areas that transferred.
Interrater Reliability
Establishing a reliable coding scheme requires that the scheme be tested with multiple
raters through an interrater reliability process. By doing interrater reliability the researcher of this
study increased the reliability of the findings by showing that others agree with the coding
scheme. An initial coding scheme was developed by the researcher and tested using five raters.
Data from each participating team of sophomores were analyzed independently using an
established method for achieving interrater reliability. Utilizing the initial coding scheme, raters
coded 10% of the data from each team, which amounted to one Audio/Video recording transcript
per team (Cox, 1996; Fink, 1995; Fink & Kosecoff, 1985). Raters used an Interrater Reliability
Data Matrix (Appendix S) to keep track of their coding. Based on the results of coding by raters,
a percent agreement was calculated. This measure is the ratio of the number of criteria on which
the raters agreed divided by the total number of criteria: (Total number of agreements / Total

76
number of observations) X 100. An overall percent agreement equal to or higher than 80% was
desired (Cox, 1996; Fink, 1995; Fink & Kosecoff, 1985).
Establishment of interrater reliability in this study utilized five independent raters. Each
rater attended an initial meeting where they received a demonstration worksheet, an Audio/Video
recording transcript, and the Interrater Reliability Data Matrix. During this meeting an overview
of the study was presented and its purpose discussed. Also discussed was the interrater reliability
process and a coding example was reviewed. Raters completed a trial run of coding followed by
explanation and discussion afterword. When all raters were comfortable with the coding scheme
and process, they were given a week to review and code the Audio/Video recording transcript
using the Interrater Reliability Data Matrix. At the end of the review week, raters met for a
follow up consensus meeting.
Prior to the follow up consensus meeting, each rater sent the researcher an electronic
copy of their coding. The researcher calculated an initial percent agreement prior to meeting. At
the consensus meeting, each rater was provided an opportunity to explain their coding strategy.
Differences in coding were then addressed allowing consensus to be reached and a final coding
scheme established. After this consensus, the final coding scheme was tested during the meeting
on a separate Audio/Video transcript. The results confirmed the reliability of the coding scheme.
In the following sections, the results of the interrater reliability process will be discussed relative
to each participating team.
Team 1 Interrater Reliability.
As described earlier, the interrater reliability process occurred prior to coding the
remaining data collected from Team 1, which included field notes, Audio/Video recording
transcripts, interviews, and DLI responses. Based on the interrater reliability process a percent

77
agreement of 90% (18 of 20) was calculated. However, raters did not agree regarding how to
code abstractions for STEM content. For that reason, the majority of the consensus meeting dealt
with agreeing on what should classify as science, technology, engineering, and mathematics
content. The resulting agreement appears in Table 9.
Table 9 STEM Content Coding Operational Definitions Content Area Coding Definition
Science Interacting, studying, and observing the natural work (But not modifying it) Technology Modifying the natural world to meet a human need or want Engineering The process of conceptualizing the solution of a design problem Mathematics Using numbers and formulas to understand a phenomenon
By defining what each STEM content area represents, it was possible to code each agreed upon
abstraction for STEM content area(s). The resulting codebook is shown in Table 10.
Table 10 Team 1 Codebook
Abstraction S T E M Weather X X X Efficiency X X X X Location X X X Cost X X X Environmental Effects / Impacts X X Design X X X X Feasibility X X X X Note: S=Science, T=Technology, E=Engineering, and M=Mathematics
Using the codebook, the researcher coded the remainder of the data using the Data Matrix.
Team 2 Interrater Reliability.
While coding, the researcher found that data from Team 2 did not have clearly defined
code categories. The primary reason for this was due to the conceptual nature of the design
challenge assigned to Team 2. They seemed to have a more difficult time identifying what to
research in order to make a proper recommendation. As a result, much of their work sessions

78
were simply figuring out what goes into an exercise regimen. Team 1 on the other hand quickly
began discussing topics such as design, weather, environmental impact, and feasibility.
Therefore, this required a second interrater reliability test with Team 2 data to ensure that the
data were properly coded. This second interrater reliability process was identical to the process
used with Team 1. An initial percent agreement of 75% was calculated which was below what is
acceptable. Raters agreed on the codes and code categories of three abstractions; exercise rigor,
exercise constraints, and supplements. Raters initially did not agree on a fourth abstraction,
which was “design process.” After each rater presented their coding arguments, an agreement of
100% was reached. Each of these abstractions were then coded for the related STEM content
area(s) as shown in Table 11. Using the agreed upon coding strategy the remainder of the data
from Team 2 were coded.
Table 11 Team 2 Codebook
Abstraction S T E M Design Process X X X X Exercise Rigor X X Supplements X Exercise Constraints X X X X Exercise Plans X X X Age Range For Elderly Adults X X Logistics X X Note: S=Science, T=Technology, E=Engineering, and M=Mathematics
The following sections present the data analysis for each team utilizing the coding
scheme agreed upon at the end of the interrater reliability process.
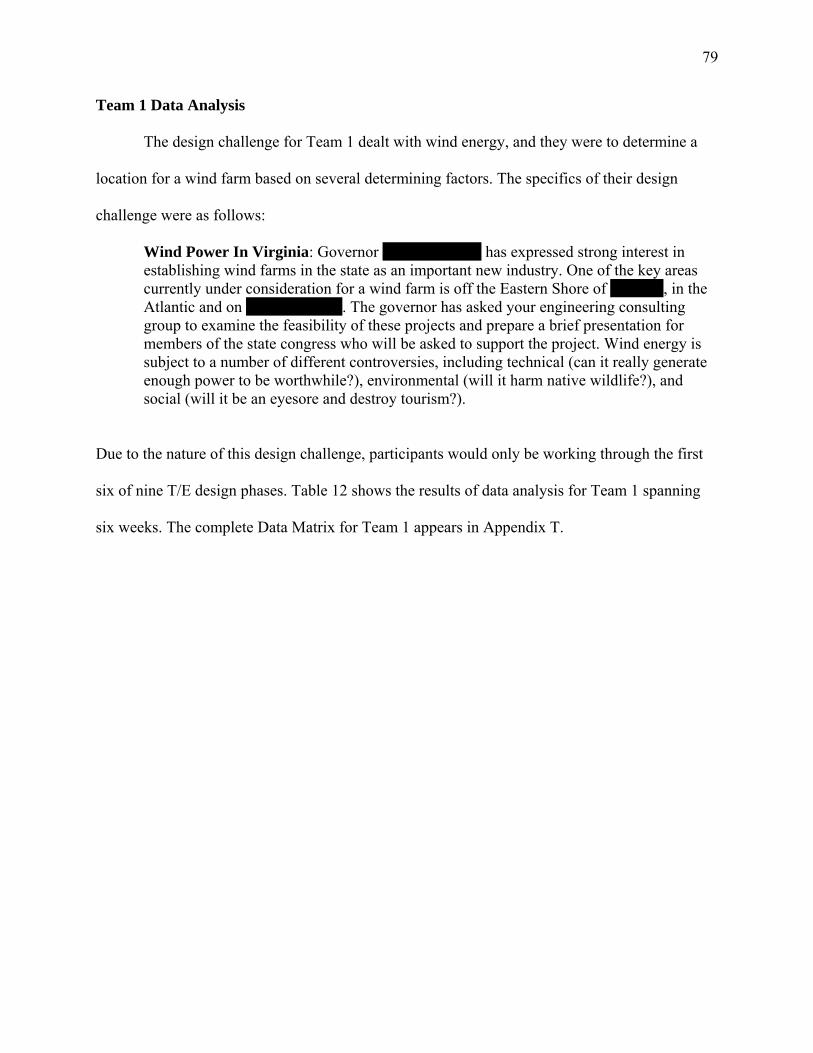
79
Team 1 Data Analysis
The design challenge for Team 1 dealt with wind energy, and they were to determine a
location for a wind farm based on several determining factors. The specifics of their design
challenge were as follows:
Wind Power In Virginia: Governor Bob McDonald has expressed strong interest in establishing wind farms in the state as an important new industry. One of the key areas currently under consideration for a wind farm is off the Eastern Shore of Virginia, in the Atlantic and on Poor Mountain. The governor has asked your engineering consulting group to examine the feasibility of these projects and prepare a brief presentation for members of the state congress who will be asked to support the project. Wind energy is subject to a number of different controversies, including technical (can it really generate enough power to be worthwhile?), environmental (will it harm native wildlife?), and social (will it be an eyesore and destroy tourism?).
Due to the nature of this design challenge, participants would only be working through the first
six of nine T/E design phases. Table 12 shows the results of data analysis for Team 1 spanning
six weeks. The complete Data Matrix for Team 1 appears in Appendix T.

80
Table 12 Team 1 Consolidated Data Analysis Week Design Phase
(Observed) DLI Entry Audio/Video
Observation Data 1
3
Weather Weather, Environmental, Install issues Efficiency figures Highly efficient, Size vs. efficiency Location Amount of area, Finite, Maximum theoretical energy, Traffic (boats) Cost Cost, money, life cycle cost, cost to build, cost to stick it in, payback Environmental Effects Environmental, Effects on animals, Eye sore, Tourism Design Efficiency, Energy, Design, Advantages, Disadvantages Feasibility Tie into the power grid, atmospheric thermal warming, convenience
2
3
Weather Weather Patterns, Potential Wind, Average Wind Speed, Effect on TV Antennas Cost Life cycle costs, Material, Recyclability, Maintenance, Break-even point Environmental Impacts Environmental Impacts, Noise, Eye Sore, CO2 Production, Greenhouse Gasses, Nitrogen Feasibility Designs Efficiency Location Available Land, Spacing, Land Analysis
3 3 Efficiency Environmental Impacts Environmental Impacts, Killing birds, Construction, Erosion, Cleaner then coal, Endangered
birds Location
Locations, Wind maps, Scale, Acers, Weather, Reactive Power, Transmission lines, Homes, International waters, Navy
Design Designs, Alternate designs, Versatility, Efficiency, Weather, Scalability Cost Cost, Competitive, Becoming cheaper, Technology, Budgetary constraints, Available money Weather Weather, Wind speed, Potential wind energy
4
3
Design Designs, New Model, Metric, Maintenance, Wind VAR, Stabilization of power grid, Cost Cost, Government support, Overhead cost, Comparison, Instillation over time Location
5
6
Environmental Impacts Cost Design
6
6
Cost Cost, Cost vs. output, Cost vs. distance, Total output, Amount of turbines, Capacity Feasibility Feasibility, Advantages, Stabilizing the power grid, Producing reactive power with no wind Efficiency Environmental Impacts
Note: Words in bold/italics indicate abstractions that were observed but not reported by participants.

81
Findings from the analysis of Team 1 data indicated that the DLI was 67% reliable with
Team 1 over six weeks. As shown in Table 9 the data that is in bold/italics depicts abstractions
observed, but not reported. The DLI reliability per week is shown in Table 13.
Table 13 Team 1 Reliability Ratio
Work Sessions
Observed Abstractions
Reported Abstractions
(DLI)
Reliability Ratio (Reported / Observed)
Average Reliability (∑ Reported / ∑ Observed)
1 7 7 100% 2 7 4 57% 3 6 5 83% 4 3 2 67% 5 3 0 0% 6 - - - 7 4 2 50%
Total 30 20 67%
Note: Missing data (-) represents sessions where the team did not meet.
Team 2 Data Analysis
The design challenge for Team 2 did not have a tangible product as an outcome making it
different than the challenge for Team 1. The design challenge for Team 1 dealt with a wind farm,
which participants easily recognized. Team 2 however had a design challenge that was
conceptually different and dealt with an exercise regimen. This caused participants in Team 2 to
struggle a bit in the beginning. The specifics of their design challenge were as follows:
Exercise for Bone Health: A recent report in the New York Times raised questions about the types of exercise individuals should engage in to maintain healthy bones. Confused by the conflicting findings reported in the magazine, a group of family physicians has asked your biomechanics research group to come give a talk at their next monthly meeting. They’d like your group to give them guidelines that they can use for recommending exercise programs for their older patients in particular. Note that these doctors are general practitioners, not orthopedists or gerontologists or related specialists. They are concerned both about what kinds of exercise will help their patients and about what exercises they can reasonably expect their patients to engage in.

82
Due to the nature of this design challenge, participants in Team 2 also only completed the first
six of nine T/E design phases. The results of data analysis for Team 2 appear in Table 14. The
complete Data Matrix for Team 2 can be found in Appendix U.

83
Table 14 Team 2 Consolidated Data Analysis Week Design Phase
(Observed) DLI Entry Audio/Video
Observation Data 1 3
Design Process Exercise Rigor Running, joints, knees, hips, energy, brisk walking, swimming, resistance, water aerobics
2 3
Supplements Supplements, Calcium, Exercising, Genetic Exercise Rigor Exercise Rigor, High Impact, Low Impacts, Older People, Power Walking, Dancing, Tennis Design Process Problem statement, Steps 1/2/3, Frame the problem, Presentation, Marketing, technical, friendly
version Exercise Constraints Exercise Constraints, Length of time, Frequency of exercises, Physical Limitations, How
strenuous, Amount of Impact 3 3
Design Process Framed out, Criteria, Solution, Negotiation, Sources, Recommendations Exercise Constraints Exercise Constraints, Access to local gyms, Implementation, aerobics classes, Swimming Pool
4 3, 4, 5
Design Process Poster slide, Final solution, Presentation, Journals, References, Audience, Terminology, Background knowledge, Solution, Organization, Consensus
Exercise Rigor
Exercise Rigor, Length of exercise, Frequency, Rigor, Impact level, Jumping, Pre-existing conditions, Impact, Balance
Exercise Constraints Exercise Constraints, Accessibility, Do at home, Running, Jumping, Frequency, Aerobic muscle strength
Exercise Plans Exercise Plans, Work out plan, Customizable, Categories, Jumping, Climbing stairs, Walking, Jogging, Gardening
Age Range For Elderly Adults 5 5, 6
Design Process Poster, Introduction, Abstract, Conclusions, Frame the problem, Objective, Method, Tables and
graphs, Limitations, Requirements Exercise Plans Logistics Exercise Rigor
Note: Words in bold/italics indicate abstractions that were observed but not reported by participants.

84
Findings from the analysis of Team 2 data indicated that the DLI was 70% reliable over
five weeks. The DLI reliability per week is presented in Table 15.
Table 15 Team 2 Reliability Ratio
Work Sessions
Observed Abstractions
Reported Abstractions
(DLI)
Reliability Ratio (Reported / Observed)
Average Reliability (∑ Reported / ∑ Observed)
1 2 1 50% 2 4 4 100% 3 - - - 4 - - - 5 2 2 100% 6 5 4 80% 7 4 1 25%
Total 17 12 70%
Note: Missing data (-) represents sessions where the team did not meet. Combined Teams 1 and 2 Data
With the data from Teams 1 and 2 independently analyzed, an average reliability of the
DLI over the entirety of Phase 3 was calculated. The average reliability of the combined Team 1
and 2 data was 68%. Reported in Table 16 are data collected across all DLI reflective prompts
and all observation data (Audio/Video transcripts, field notes, interviews) per work session.
Table 16 Combined Teams Reliability Ratio
Work Sessions
Observed Abstractions
Reported Abstractions
(DLI)
Reliability Ratio (Reported / Observed)
Average Reliability (∑ Reported / ∑ Observed)
1 9 8 88% 2 11 8 72% 3 6 5 83% 4 3 2 67% 5 5 2 40% 6 5 4 80% 7 8 3 37.5%
Total 47 32 68%
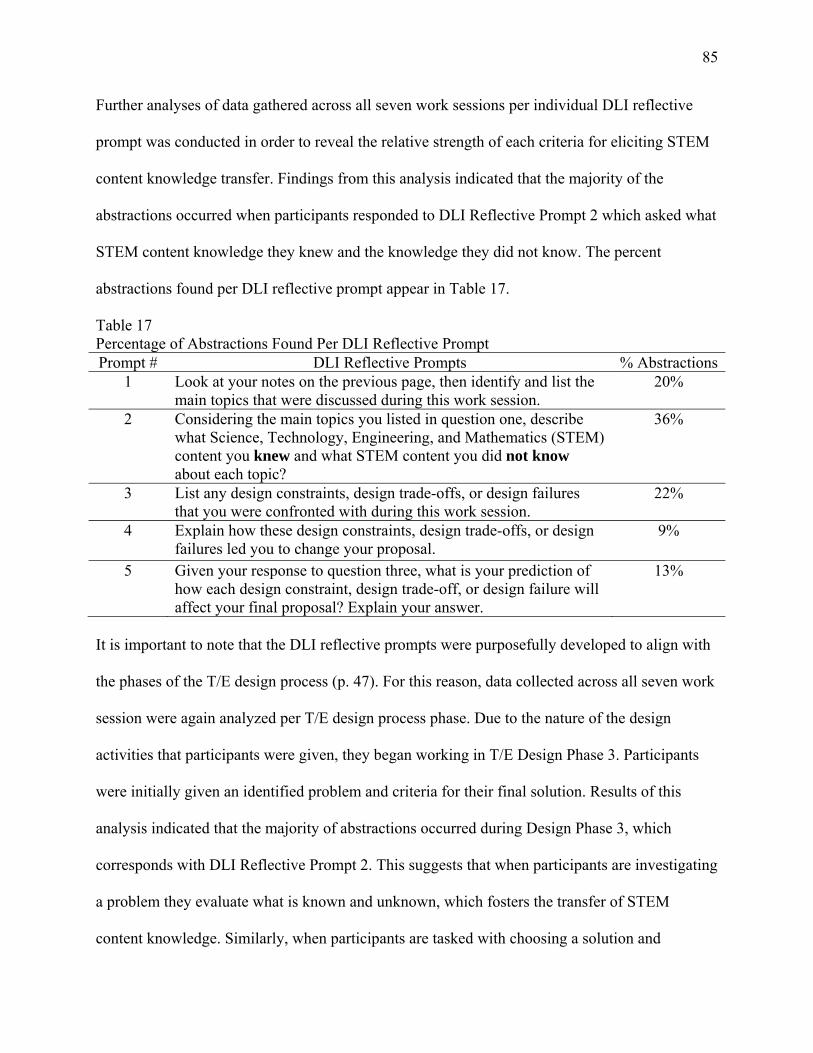
85
Further analyses of data gathered across all seven work sessions per individual DLI reflective
prompt was conducted in order to reveal the relative strength of each criteria for eliciting STEM
content knowledge transfer. Findings from this analysis indicated that the majority of the
abstractions occurred when participants responded to DLI Reflective Prompt 2 which asked what
STEM content knowledge they knew and the knowledge they did not know. The percent
abstractions found per DLI reflective prompt appear in Table 17.
Table 17 Percentage of Abstractions Found Per DLI Reflective Prompt Prompt # DLI Reflective Prompts % Abstractions
1 Look at your notes on the previous page, then identify and list the main topics that were discussed during this work session.
20%
2 Considering the main topics you listed in question one, describe what Science, Technology, Engineering, and Mathematics (STEM) content you knew and what STEM content you did not know about each topic?
36%
3 List any design constraints, design trade-offs, or design failures that you were confronted with during this work session.
22%
4
Explain how these design constraints, design trade-offs, or design failures led you to change your proposal.
9%
5 Given your response to question three, what is your prediction of how each design constraint, design trade-off, or design failure will affect your final proposal? Explain your answer.
13%
It is important to note that the DLI reflective prompts were purposefully developed to align with
the phases of the T/E design process (p. 47). For this reason, data collected across all seven work
session were again analyzed per T/E design process phase. Due to the nature of the design
activities that participants were given, they began working in T/E Design Phase 3. Participants
were initially given an identified problem and criteria for their final solution. Results of this
analysis indicated that the majority of abstractions occurred during Design Phase 3, which
corresponds with DLI Reflective Prompt 2. This suggests that when participants are investigating
a problem they evaluate what is known and unknown, which fosters the transfer of STEM
content knowledge. Similarly, when participants are tasked with choosing a solution and

86
developing that solution, they are confronted with design constraints, design trade-offs, and
design failures. To solve issues that arise in these categories participants draw on their STEM
content knowledge. The percent of abstractions associated with each T/E design phase are
presented in Table 18.
Table 18 Percentage of Abstractions Found Per T/E Design Phase Design Phase # T/E Design Process Phase Descriptions % Abstractions
1 Identify a problem either by observation or a human need 0% 2 Frame criteria for the final solution 0% 3 Investigate what is known about the problem 71% 4 Develop alternate solutions to the problem 5% 5 Choose an appropriate solution from the alternate solutions 10% 6 Develop detailed plans for constructing your chosen solution 14% 7 Simulate or prototype your chosen solution 0% 8 Check to see if your chosen solution meets the criteria that
were identified earlier 0%
9 If the chosen solution does not meet the criteria make any improvements necessary and present your findings
0%
Findings from Phase 3 data analysis led to one final revision of DLI Reflective Prompt 4. That
revision is shown in Table 19.

87
Table 19 Final DLI Reflective Prompt Revisions # Initial Reflective Prompts Final Reflective Prompts 1 Look at your notes on the previous page,
then identify and list the main topics that were discussed during this work session.
Look at your notes on the previous page, then identify and list the main topics that were discussed during this work session.
2 Considering the main topics you listed in question one, describe what Science, Technology, Engineering, and Mathematics (STEM) content you knew and what STEM content you did not know about each topic?
Considering the main topics you listed in question one, describe what Science, Technology, Engineering, and Mathematics (STEM) content you knew and what STEM content you did not know about each topic?
3 List any design constraints, design trade-offs, or design failures that you were confronted with during this work session.
List any design constraints, design trade-offs, or design failures that you were confronted with during this work session.
4
Explain how these design constraints, design trade-offs, or design failures led you to change your proposal.
Explain how these design constraints, design trade-offs, or design failures led you to change your thinking of the project.
5 Given your response to question three, what is your prediction of how each design constraint, design trade-off, or design failure will affect your final proposal? Explain your answer.
Given your response to question three, what is your prediction of how each design constraint, design trade-off, or design failure will affect your final proposal? Explain your answer.
After both design teams met for work session three, it became apparent that Reflective Prompt 4
needed to be changed. DLI responses suggested that 100% (9 of 9) of participants were not
responding to Reflective Prompt 4. When asked why, during the mid-phase interviews (week
three), participants reported that they did not feel as though they had a proposal to change until
later in the T/E design process. When instead asked verbally during the mid-phase interviews
(week three) how their thinking changed, 100% (9 of 9) of participants were able to respond to
this prompt. This prompt was also the weakest DLI reflective prompt, only accounting for 9% of
the total abstractions identified during Phase 3 (Table 17). At the end of Phase 3 DLI Reflective
Prompt 4 changed from asking how design constraints, design trade-offs, or design failures led
participants to change their proposal to how they led participants to change their thinking on the

88
project. This change was incorporated into the final iteration of DLI Reflective Prompt 4. The
final version of the DLI is shown in Appendix V.
The following chapter contains further discussion regarding the correlation between the
percent abstractions found in the DLI reflective prompts and the T/E design phases. This
correlation has implications regarding how knowledge transfer is studied and where it most often
occurs during the T/E design process through highs and lows. Results of the correlation and the
combined teams reliability ratio provide the basis for answering the research questions and for
formulating the implications of this study.

89
Chapter V: Conclusions and Recommendations
Discussion
Implementation of the Design Log Instrument (DLI) in Phase 3 demonstrated that 68% of
the time the DLI showed potential to evidence the transfer of STEM content knowledge
independently of other data. Throughout this implementation phase however, DLI data revealed
reliability highs and lows. These highs and lows are evident in sessions 1-3 (high), 4-5 (low), 6
(high), and 7 (low) (Table 20). It is significant to note that these highs and lows correspond with
specific phases of the T/E design process.
Table 20 Summary of Correlation Between % Abstraction per DLI Reflective Prompt and T/E Design Phase
DLI Reflective Prompt % Abstractions
T/E Design Process Phase % Abstractions
Work Sessions
Combined Team Reliability Ratio
Highs (H) & Lows (L)
0% Phase 1 1 88% H 0% Phase 2 2 72% H DLI Reflective Prompt 1 20% 3 83% H DLI Reflective Prompt 2 36% 71% Phase 3 4 67% L DLI Reflective Prompt 3 22% 5% Phase 4 5 40% L DLI Reflective Prompt 4 9% 10% Phase 5 6 80% H DLI Reflective Prompt 5 13% 14% Phase 6 7 37.5% L 0% Phase 7
0% Phase 8 0% Phase 9
Note: DLI Reflective Prompt % Abstractions correlate with T/E Design Process Phase % Abstractions. Work Sessions, Combined Team Reliability Ratio, and Highs/Lows do not align with DLI/Design Process data.
During the first three work sessions for both design teams, reliability was satisfactory,
reaching above the accepted 70% threshold. During these first three work sessions, participants
were primarily engaged in T/E Design Phases 3 and 4, investigating what is known and
developing alternate solutions. These design phases accounted for 76% of the total abstractions
across the seven work sessions and represent a high in abstraction (Table 20). During work

90
sessions 4, 5, and 7 for both design teams, combined DLI reliability was below the accepted 70%
threshold (Table 20). Participants were engaged in Phases 5 and 6 of the T/E Design process
during these work sessions, which accounted for 24% of the total abstractions across the seven
work sessions (Table 20) and represent a low in abstraction. Although not part of this study, T/E
Design Phases 8 and 9 deal with testing and evaluating a chosen solution. In these design phases,
participants are investigating ways of improving their design solution and re-evaluating design
criteria. Based on abstraction trends observed between T/E Design Phases 1 through 6, it is
anticipated that another high in abstraction would occur during T/E Design Phases 8 and 9.
Results of the end-of-phase interview conducted in week seven give a plausible reason for the
highs and lows found during Phase 3. During the last three work sessions, 100% of participants
reported that they moved from trying to solve the problem to planning and developing their final
project presentation. For this reason, they felt that no new content was discussed and DLI
reflective prompts were irrelevant.
Data collected during Phase 3 of this study were analyzed to identify which DLI
reflective prompts elicited the most STEM content knowledge transfer. Analysis of abstraction
frequencies identified DLI Reflective Prompt 2 as providing the most evidence of STEM content
knowledge transfer with 36% of the total abstractions across the seven work sessions (Table 20).
Reflective Prompt 3 had the next highest abstraction percentage with 22% of the total
abstractions (Table 20). These findings indicate that when asked what they know and do not
know about a particular topic, participants transfer knowledge. The primary cause for this may
be that when trying to understand a higher order concept there is a hierarchy of knowledge (p.
32). Reflective Prompt 2 of the DLI was developed to purposefully foster vertical transfer by
having participants recognize what they do not know, and then consider what knowledge is

91
needed to understand a particular concept. By presenting the prompt in this way, participants
recognize which lower order concepts are needed to understand the higher order concept (Gagne,
1969, 2005).
Data analysis on the abstractions identified in the DLI responses were found to correlate
with the percent abstractions identified in the T/E design process (Table 20). DLI Reflective
Prompts 2 and 3 (combined 58% of total abstractions) correlate with T/E Design Phases 3 and 4
(combined 76% of total abstractions), which dealt with issues related to investigating the
problem and developing alternate solutions. These findings strongly suggest that STEM content
knowledge transfer is more likely to occur during T/E Design Phases 3 and 4. When participants
investigate a problem they must identify what is already known and recognize what they still do
not understand as asked in DLI Reflective Prompt 2. Participants must also be able to recognize
when they are confronted with a design constraint, design trade-off, or design failure while
developing alternate solutions as asked in DLI Reflective Prompt 3.
DLI Reflective Prompts 4 and 5 (combined 22% of total abstractions) correlate with T/E
Design Phases 5 and 6 (combined 24% of total abstractions) dealing with issues related to
choosing a solution and developing that solution into a prototype. These findings suggest that
STEM content knowledge transfer occurs less frequently during T/E Design Phases 5 and 6.
When participants choose a solution, they must evaluate how each design constraint, design
trade-off, or design failure will change the project as asked in DLI Reflective Prompt 4.
Similarly, when participants are developing their prototype they must predict how each design
constraint, design trade-off, or design failure will affect their final solution.

92
Conclusions
The purpose of this study was to address the need for empirical evidence to support the
belief that the DLI could facilitate the evidencing of STEM content knowledge transfer. To guide
this investigation the following research questions were developed:
• In what ways does the use of a Design Log provide evidence of the transfer of STEM
content knowledge while students are engaged in a technological/engineering design-
based learning activity?
RQ-S1 What phrasing of Design Log reflective prompts effectively reveal STEM
content connections?
RQ-S2 To what extent can a Design Log instrument allow a researcher to make
judgments regarding the transfer of STEM content knowledge?
Each of these questions related to a specific aspect of the instrument and its development.
Research question sub-one (RQ-S1).
RQ-S1 dealt with development of the phrasing for the DLI reflective prompts. It asked,
“What phrasing of Design Log reflective prompts effectively reveal STEM content
connections?” To answer this question the DLI was tested, evaluated, and refined throughout
three phases. At the conclusion of Phase 2 the DLI contained reflective prompts that were
content valid and poised to test their ability for providing evidence of STEM content knowledge
transfer. Testing of the DLI took place in Phase 3 where data were collected from two teams
each working independently through different engineering design problems. Analysis of this data
resulted in the final reflective prompt iteration (Table 19) at the end of the phase.
Based on data analysis in this study, when asking participants to reflect on their work,
reflective prompts must be very specific and cohesive. Throughout this study, each reflective

93
prompt revision became more specific to encourage participants to respond in a specific way.
Data analysis of both DLI responses and interview responses allowed the researcher to
understand where disconnects were occurring. This process proved to be ideal because through
direct feedback from participants, reflective prompts more closely represented language and
content that they were familiar with while preserving the types of data that were necessary for
this study. At the end of Phase 3 effective phrasing of DLI reflective prompts were identified to
reveal STEM content connections.
Research question sub-two (RQ-S2).
RQ-S2 asks to what extent the DLI can allow a researcher to make judgments regarding
the transfer of STEM content knowledge. Data collection in this study consisted of Audio/Video
recordings, field notes, interviews, and DLI responses. Through iterative revisions of the DLI,
the goal was to develop the reflective prompts so that they could aid in the independent
collection of data on knowledge transfer without the need for Audio/Video recordings, field
notes, and interviews.
Findings in Phase 3 of this research indicate that the DLI shows potential to be 68%
reliable (Table 16) as an independent measure of knowledge transfer. This meant that 68% of the
time the DLI provides similar data as the triangulation of the Audio/Video recordings, field
notes, and interviews but is just below the desired 70% threshold (Cox, 2008, p. 40; Fink, 1995;
Fink & Kosecoff, 1985) required for use as an independent method of data collection. Although
the reliability of the DLI is nearly desirable, reflective prompts must be further developed to
foster greater discussion of topics. The triangulation data provides a deep level of insight into
how knowledge is used to solve problems that the DLI by itself currently does not. In order for
the DLI to truly be used as an independent measure of STEM content knowledge transfer, this

94
insight must be present in DLI responses. Further refinement and development may improve the
reliability of the DLI and the ability of the reflective prompts to elicit responses that not only
provide evidence of STEM content knowledge transfer but also explain those instances.
Overarching research question.
The overarching question of this study was, “In what ways does the use of a
Design Log provide evidence of the transfer of STEM content knowledge while students are
engaged in a technological/engineering design-based learning activity?” Data analyzed to answer
each individual sub question provided direction in answering the overarching question. As this
study progressed the DLI required fewer substantial changes. This indicated that as time went on
the DLI was more accurately providing evidence of knowledge transfer. At the end of Phase 3
the DLI showed the potential to be 68% reliable as an independent measure of STEM content
knowledge transfer. Though this shows a degree of success with the instrument, it is still not
reliable enough for use as an independent source of data. Participants were providing evidence of
STEM content knowledge transfer in their DLI responses, but they were not providing as many
instances as were identified in the observation data (Audio/Video recordings and Field Notes).
Participants also gave a simple explanation of topics discussed during their team work sessions
which was not as robust as what the observation data provided. There are several plausible
reasons for the gap between the observed and reported abstractions. Knowledge abstraction is
more likely to occur in some T/E design phases than in others. It is plausible that participants did
not recognize that they were abstracting knowledge but rather thought they were applying
knowledge from a previous design phase. For example, 71% of the total abstractions occurred
during T/E Design Phase 3, which dealt with investigating the problem. Participants used the
abstracted knowledge gained during this phase and applied it to develop alternate solutions

95
during T/E Design Phase 4. Although participants did not report abstractions during this design
phase, observation data shows that participants were abstracting knowledge, causing the gap
between observed and reported abstractions. It is also possible that motivation affected
participant’s willingness to respond to DLI reflective prompts. The DLI required participants to
do additional work at the conclusion of each work session. This may have invoked a level of
fatigue in participants, which caused them to respond to reflective prompts without the necessary
effort required to provide meaningful data. For these reasons, assigning STEM content codes to
abstractions found in the DLI responses was difficult without the accompanying observation
data.
Participants in both Phase 1 (pilot study) and Phase 3 (implementation) reported that the
DLI provided a valuable record of design decisions throughout the T/E design process. During
both mid-phase (week three) and end-of-phase (week seven) interviews conducted during
implementation, 100% of participants reported that the DLI allowed them to keep track of past
decisions and reflect on them while making new decisions. This level of reflection improved the
ability of participants to make informed decisions and to consider the positives and negatives of
each. Specifically in Phase 3, as an unintended outcome, the DLI allowed participants to monitor
their own learning and acted as a guide through the T/E design process. In this way, there is
potential to use the DLI as an instructional tool as well as a method for collecting data.
While the DLI is not yet ready to be used as an independent measure of STEM content
knowledge transfer at this time, it does show promise for providing such data independently.
With future iterations, the reliability of the DLI can increase as an independent instrument. The
current target audience of this instrument is students in undergraduate programs engaged in T/E

96
design activities. The reliability of this instrument is also bound to the studied context and
therefore needs further development in other contexts to verify the reliability.
Implications
The findings of this study have implications for the profession of Technology Education,
T/E design based learning, and on knowledge transfer research.
Technology Education.
Studies such as this show that T/E design is a valuable pedagogical approach to teaching
and learning that fosters deep understanding in students. If Technology Education hopes to
compete with the other STEM disciplines in the research arena these types of cognitive inquires
will need to be a large part of our field moving forward. As Technology Education struggles to
find its footing during the current push to incorporate more engineering content into K-12
education, it is the belief of the researcher that this study and future studies need to demonstrate
that Technology Education offers a general literacy based approach (p. 21) to learning T/E
design (Cajas, 2001; ITEA, 2000; Wells, 2006; 2008). Technology Education seeks to take a
broader look at T/E design and develop students as literate members of society that can solve
problems in their everyday lives. By conducting research into the cognitive aspects of how
students approach and work through T/E design problems, we as a profession can expand what
we know and how we present design to foster such literacy.
T/E design based learning.
The combined T/E design process depicted and refined in this study was prompted by the
Integrative STEM Education Pedagogy Model developed by Wells (2009). This Integrative
STEM Education Pedagogy Model blends elements of scientific inquiry, technological design,
and engineering design to foster the transfer of knowledge. Abstraction of each process allowed
97
them to be blended into a single approach, with application in each independent discipline. By
blending inquiry and T/E design, students are presented with a process that can be used in either
a science, technology, or engineering classroom. By intentionally blending the identical elements
of each process, the transfer of STEM content knowledge increases in likelihood. Thorndike
(1901) described this phenomenon with his identical elements theory, which states, as the
elements of a process become identical, the greater the likelihood that knowledge will transfer
between them.
Knowledge transfer research.
The illustration of the transfer paradigm (abstraction + situated environments = transfer)
depicted in this study builds on previous transfer research and goes a step further to specifically
look at transfer in a combined T/E design process. Studies, such as the one discussed here, help
to validate this perspective. T/E design provided a unique lens as the context for this study and
allowed the researcher to take previous work and utilize it in a novel situation. From this
investigation, the researcher finds the T/E design process to be an ideal context for studying the
transfer of knowledge because T/E design inherently requires students to use knowledge learned
from many disciplines to solve design problems. As described earlier in the discussion section,
the transfer of STEM content knowledge occurred in highs and lows over the course of the first
six design phases of the T/E design process. Further study is needed to understand the nature of
these highs and lows and to see if they consistently occur. A future study with senior ES design
teams during their yearlong senior design projects would provide such understanding as they go
through the T/E design process repeatedly instead of only using a single, partial iteration of T/E
design process as described in this study.

98
Recommendations for Further Research
The findings of this study provide a good foundation for further research using the DLI in
T/E design based environments.
The Design Log Instrument.
Based on the reliability ratio, the DLI still needs further development. A larger scale
study would help to achieve a higher level of reliability and development. With more
participants, a broader sample would be possible with differing backgrounds, which would allow
for increased reliability of the instrument. In addition, continuing to develop the DLI in a context
outside of engineering, specifically in a Science or Technology Education classroom, would
increase its reliability. Also, using the DLI with students at different grade levels such as with
high school Technology Education students would provide opportunity for further development.
During Phase 3 of this study, the DLI was used with sophomore engineering science students
who were creating engineering proposals. Future studies, should involve students actually
designing some product rather than simply making a recommendation.
Professional development.
Investigation into the DLI as a teaching tool would provide a foundation for professional
development regarding the transfer of knowledge during a T/E design activity. Teachers would
learn how the DLI could increase student learning and foster the transfer of knowledge. Teachers
would see the degree of utility that the DLI offers. This includes the importance of using an
instrument such as the DLI to assess student learning. The DLI provides students with a means
of being reflective and recording their thought process while working on T/E design activities.
These reflections can act as a record of student learning over time.

99
Knowledge transfer research.
Many researchers investigating knowledge transfer have expressed fundamental problems
with its study. Those fundamental problems range from whether or not transfer actually exists
(Detterman, 1993) to how a researcher can claim to witness transfer occurring (Carraher &
Schliemann, 2002). Barnett and Ceci (2002) concluded that a century of research on transfer has
made little progress in resolving its fundamental questions, and Schoenfeld (1999) identified it as
one of the major challenges of educational theory in the 21st century. Through the findings of
this study, the researcher tried to substantiate the potential for research in this area. A potential
way of witnessing transfer occurring is through the research design presented in this study. By
using a Design Log Instrument in concert with Audio/Video recordings, field notes, and
interviews it is possible to witness transfer. With further refinement, it may be possible to
increase this potential.
Although, the DLI was only 68% reliable, it still received many meaningful changes that
improved its reliability over time. This means with further research the DLI can improve and
increase its reliability. This also shows potential for studying transfer in a T/E design based
context. T/E design provides an ideal context for studying the transfer of knowledge because
students must inherently use knowledge from many disciplines to solve problems. In addition, as
suggested by the correlation of abstractions between the DLI and the T/E design process, specific
T/E design phases can be targeted when doing research in this context.

100
References
ABET Engineering Accreditation Commission. (2004). ABET criteria for accrediting engineering programs. Baltimore, MD: ABET, Inc. Author.
Adams, L., Kasserman, J., Yearwood, A., Perfetto, G., Bransford, J. D., & Franks, J. (1988). The
effects of facts versus problem-oriented acquisition. Memory & Cognition, 16, 167-175. American Association for the Advancement of Science (1989). Science for All Americans. New
York: Oxford University Press. American Association for the Advancement of Science (1990). Project 2061. New York: Oxford
University Press. American Association for the Advancement of Science (1993). Benchmarks for science literacy.
New York: Oxford University Press. Anderson, J.R. (2005). Cognitive psychology and its implications. New York: Worth. Barak, M., Waks, S., & Doppelt, Y. (2000, January 1). Majoring in Technology Studies at High
School and Fostering Learning. Learning Environments Research, 3(2), 135-58. Barlex, D. (2006). Pedagogy to Promote Reflection and Understanding in School
Technology-Courses. In J. R. Dakers (Ed.), Defining Technological Literacy: Towards an Epistemological Framework (pp. 179-193). New York: Macmillan.
Barlex, D. & Trebell, D. (2008). Design-without-make: challenging the conventional approach to
teaching and learning in a design and technology classroom. International journal of technology and Design Education. Springer
Barnett, S. M., & Ceci, S. J. (2002). When and where do we apply what we learn? A taxonomy
for far transfer. Psychological Bulletin, 128(4), 612–637. Barrows, H.S. (1986). A taxonomy of problem-based learning methods. Medical Education,
20, 481-486. Bassok, M., & Holyoak, K. J. (1993). Pragmatic knowledge and conceptual structure:
Determinants of transfer between quantitative domains. In D. K. Detterman & R. J. Sternberg (Eds.), Transfer on trial: Intelligence, cognition, and instruction (pp. 68-98). Norwood, NJ: Ablex.
Bauer, H. (1992). Scientific literacy and the myth of the scientific method. University of Illinois:
Urban, IL.

101
Beach, K. (1999). Consequential transitions: A sociocultural expedition beyond transfer in education. In A. Iran-Nejad & P. D. Pearson (Eds.), Review of research in education, (24, pp. 101–139). Washington, DC: American Educational Research Association.
Beane, J. (1997). Curriculum integration: Designing the core of democratic education. New
York: Teachers College Press. Berger, P., & Luckman, T. (1967). The social construction of reality. New York: Anchor. Berube, M. & Berube, C. (2007). The end of school reform. Rowman and Littlefield. Landham,
MD. Bjork, R. A., & Richardson-Klavhen, A. (1989). On the puzzling relationship between
environment context and human memory. In C. Izawa (Ed.), Current issues in cognitive processes: The Tulane Flowerree Symposium on Cognition. Hillsdale, NJ: Erlbaum.
Bransford, J. D., Brown, A. L., & Cocking, R. R. (Eds.) (July 2004). How people learn.
Washington, D.C.: National Academy Press. Bransford, J. D., Brown, A. L., Cocking, R. R., Donovan, M. S., & Pellegrino, J. W. (2000).
How people learn: Brain, mind, experience, and school. Washington, D.C.: National Academy Press.
Bransford, J. D., & Schwartz, D. L. (1999). Rethinking transfer: A simple proposal with multiple
implications. Review of Research in Education, 24, 61-100. Bransford, J. D., & Stein, B. S. (1984). The ideal problem solver: A guider for improving
thinking, learning, and creativity. New York: Freeman.
Brooks, J., & Brooks, M. (1993). The case for constructivist classrooms. Alexandria, VA: ASCD
Brown, A.L. (1992). Design experiments: Theoretical and methodological challenges in creating complex interventions in classroom settings. Journal of the Learning Sciences, 2, 141–178.
Brown, A. L., & Kane, M. J. (1988). Preschool children can learn to transfer: Learning to learn
and learning from example. Cognitive Psychology, 20, 493-523.
Burr, V. (2003). Social constructionism (2nd ed.). London, UK: Routledge. Cajas, F. (2001). The science/technology interaction: Implications for science literacy. Journal of
Research in Science Teaching, 38(7), 715-729. Carraher, D.,& Schliemann, A. D. (2002). The transfer dilemma. Journal of the Learning
Sciences, 11(1), 1–24.

102
Cezarino, K. R. (2004). Strategies for sustainable professional development programs to
promote effective pedagogical use of instructional technology in teaching. Dissertation. Charon, J. (2007). Symbolic interactionism (9th ed.). Upper Saddle River, NJ: Pearson. Cheng, P. W., Holyoak, K. J., Nisbett, R. E., & Oliver, L. M. (1986). Pragmatic versus syntactic
approaches to training deductive reasoning. Cognitive Psychology, 18, 293-328. Cobb, P. (1994). Where is the mind? Constructivist and sociocultural perspectives on
mathematical development. Educational Researcher, 23(7), 13-20.
Cox, J. (2008). Your opinion, please: How to build the best questionnaires in the field of education. Thousands Oaks, CA: Corwin Press, Inc.
Cox, J. (1996). Your opinion, please: How to build the best questionnaires in the field of
education. Thousands Oaks, CA: Corwin Press, Inc. Crismond, D. (2001). Learning and using science ideas when doing investigate-and-redesign
tasks: A study of naïve, novice, and expert designers doing constrained and scaffolded design work. Journal of Research in Science Teaching, 38(7), 791-820.
Detterman, D. K. (1993). The case for the prosecution: Transfer as an epiphenomenon. In D. K.
Detterman & R. J. Sternberg (Eds.), Transfer on trial: Intelligence, cognition, and instruction (pp. 1–24). Norwood, NJ: Ablex.
De Vries, M. J. (1996). Technology education: Beyond the “technology is applied science”
paradigm. Journal of Technology Education, 8(1), 7-15. Drake, S., & Burns, R. (2004). Meeting standards through integrated curriculum. Alexandria,
VA: ASCD. Driver, R., Guesne, E., & Tiberghien, A. (1985). Children's ideas in science. Philadelphia, PA:
Open University Press. Dunham, T., Wells, J., & White, K. (2002). Biotechnology education: A multiple instructional
strategies approach. Journal of Technology Education, 14(1), 17. Dyson, A. H. (1999). Transforming transfer: Unruly children, contrary texts, and the persistence
of the pedagogical order. In A. Iran-Nejad&P. D. Pearson (Eds.), Review of research in education (24, pp. 141–171). Washington, DC: American Educational Research Association.
Engineering Accreditation Commission. (2004). Criteria for Accrediting Engineering
Programs. Baltimore, MD.

103
Evans, J. S. B. T. (1989). Bias in human reasoning. Hillsdale, NJ: Erlbaum. Fink, A, & Kosecoff, J. B. (1985). How to conduct surveys: A step-by-step guide. London,
England: SAGE Publications, Ltd. Fink, A. (1995). The survey handbook. Thousand Oaks, CA: Sage Publications, Inc. Fong, G.T., & Nisbett, R. E. (1991). Immediate and delayed transfer of training effects in
statistical reasoning. Journal of Experimental Psychology: General, 120(1), 34-45. Fortus, D. (2005). Design-based science and the transfer of science knowledge and real-world
problem-solving skills. Dissertation. Fortus, D., Krajcik, J., Dershimer, R. C., Marx, R. W., & Naaman, R. M. (2005, June). Design-
based science and real-world problem-solving. International Journal of Science Education, 27(7), 855-879.
Freidman (2005). The world is flat. A brief history of the twenty-first century. New York: Farrar,
Straus and Giroux. Fuchs, L. S., Fuchs, D., Prentice, K., Burch, M., Hamlett, C. L., Owen, R., et al. (2003).
Explicitly teaching for transfer: Effects on third-grade students’ mathematical problem solving. Journal of Educational Psychology, 95(2), 293–305.
Gagne, R. M., Wager, W. W., Golas, K. C., and Keller, J. M. (2005). Principles of instructional
design. Wadsworth, Cengage Learning. Gagne, R. M. (1969). Learning hierarchies. Educational Psychologist, 6, 1-9 Gagne, R. M. & Paradise, N. E. (1961). Abilities and learning sets in knowledge acquisition.
Psychological Monographs: General and Applied, 75(518). Gentner, D., Loewenstein, J.,&Thompson, L. (2003). Learning and transfer: A general role for
analogical encoding. Journal of Educational Psychology, 95(2), 393–408. Gentner, D., & Markman, A. B. (1997). Structure mapping in analogy and similarity. American
Psychologist, 52, 45–56. Gentner, D., & Medina, J. (1998). Similarity and the development of rules. Cognition, 65, 263–
297.

104
Gick, M. L., & Holyoak, K. J. (1980). Analogical problem solving. Cognitive Psychology, 12, 306-355.
Gick, M. L., & Holyoak, K. J. (1983). Schema induction and analogical transfer. Cognitive Psychology, 15, 1-38.
Gick, M. L. & Holyoak, K. J. (1987). The cognitive basis of knowledge transfer. In S. M.
Cormier & J. D. Hagman (Eds.). Transfer of Learning: Contemporary research and application. San Diego, CA: Academic Press.
Glasgow, Neal A. (1997). New curriculum for new times: A guide to student-centered,
problem-based learning. Thousand Oaks, CA: Corwin Press, Inc. Glass, A. L., & Holyoak, K. J. (1986). Cognition. New York: Random House.
Greeno, J. G. (2006). Authoritative, accountable positioning and connected, general knowing:
Progressive themes in understanding transfer. The Journal of the Learning Sciences, 15(4), 537–547.
Greeno, J. G. (1997). On claims that answer the wrong questions. Educational Researcher,
26(1), 5–17. Greeno, J. G., Moore, J. L., & Smith, D. R. (1993). Transfer of situated learning. In D. K.
Detterman & R. J. Sternberg (Eds.), Transfer on trial: Intelligence, cognition, and instruction (pp. 99–167). Norwood, NJ: Ablex.
Hales, J., & Snyder, J. (1982, February 1). Jackson's Mill Industrial Arts Curriculum Theory: A
Base for Curriculum Derivation. Part 1 of a Two-Part Series. Man/Society/Technology, 41(5), 6-10.
Hales, J., & Snyder, J. (1982, March 1). Jackson's Mill Industrial Arts Curriculum Theory: A
Base for Curriculum Conceptualization. Part 2 of a Two-Part Series. Man/Society/Technology, 41(6), 6-8.
Halfin, H. H. (1973). Technology: A process approach. (Doctoral dissertation, West Virgina University, 1973) Dissertation Abstracts International, (1) 1111A.
Hartzler, D. S. (2000). A meta-analysis of studies conducted on integrated curriculum programs
and their effects on student achievement. Doctoral dissertation. Indiana University. Hatano, G., & Greeno, J. G. (1999). Commentary: Alternative perspectives on transfer and
transfer studies. International Journal of Educational Research, 31, 645–654. Hayes, J. R. (1981). The complete problem solver. Philadelphia, PA: Franklin Institute Press.

105
Hershkowitz, R., Schwarz, B. B., & Dreyfus, T. (2001). Abstraction in context: Epistemic actions. Journal for Research in Mathematics Education, 32(2), 195–222.
Hill, R. B. (1997). The design of an instrument to assess problem solving activities in technology
education. Journal of Technology Education, 9(1), 31-46. Hittleman, D. R, & Simon, A. J. (2006). Interpreting educational research (4th ed.). Upper
Saddle River, NJ: Merrill Prentice Hall. Holyoak, K. J., & Koh, K. (1987). Surface and structural similarity in analogical transfer.
Memory and Cognition, 15, 332-340. Howell, D. C. (2002). Statistical Methods for Psychology (6th ed.). Belmont, CA: Thomson
Higher Education. Hoyles, C., & Noss, R. (1992). Looking back and looking forward. In C. Hoyles & R. Noss
(Eds.), Learning mathematics and logo (pp. 431–468). Cambridge, MA: MIT Press. Hutchins, E. (1995). Cognition in the wild. Cambridge, MA: MIT Press. Hutchinson, J. & Karsnitz, J. R. (1994). Design and problem solving in technology. New York,
NY: Glencoe McGraw-Hill. International Technology Education Association. (1996). Technology for all Americans: A
rationale and structure for the study of technology. Reston, VA: Author. International Technology Education Association (2000). Standards for technological literacy:
Content for the study of technology. Reston, VA: ITEA. James, W. (1890). The principles of psychology (vol. 2). New York, NY: Dover. Judd, C. H. (1908). The relation of special training to general intelligence. Educational Review,
36, 28-42.
Katona, G. (1940). Organizing and memorizing. New York: Columbia University Press. Kelly, T. R. (2008). Cognitive processes of students participating in engineering-focused design
instruction. Journal of Technology Education, 19(2). Khandani, S. (2005). Engineering design process. Industry Initiatives for Science and Math
Education. Klahr, D., & Carver, S. M. (1988). Cognitive objectives in a LOGO debugging curriculum:
Instruction, learning, and transfer. Cognitive Psychology, 20, 362- 404.

106
Kolodner, J.L., Camp, Crismond, D., Fasse, B., Gray, J., Holbrook, J., Puntambekar, S., Ryan. (2003). Putting a student-centered Learning by DesignTM curriculum into practice: Lessons learned. Journal of the Learning Sciences, 12, 485–547.
Kolodner, J. L. (2002). Facilitating the learning of design practices: Lessons learned from an
inquiry into science education. Journal of Industrial Teacher Education, 39(3). Krajcik, J. S., Blumenfeld, P. C., Marx, R. W., Bass, K. M., Fredricks, J., & Soloway, E. (1998).
Inquiry in project-based science classrooms: Initial attempts by middle school students. The Journal of the Learning Sciences, 7(3&4), 313-350.
Lobato, J. (2006). Alternative perspectives on the transfer of learning: History, issues, and challenges for future research. The Journal of the Learning Sciences, 15(4), 431–449.
Lobato, J. (2003). How design experiments can inform a rethinking of transfer and vice versa.
Educational Researcher, 32(1), 17–20. Lobato, J. (1997). Transfer reconceived: How “sameness” is produced in mathematical activity.
Unpublished doctoral dissertation, University of California, Berkeley. Lave, J. (1988). Cognition in practice. New York: Cambridge University Press. Lederman, N. (1998). The state of science education: Subject matter without context. Electronic
Journal of Science Education, 3(2), 1-11. Lockhart, R. S., Lamon, M., & Gick, M. L. (1988). Conceptual transfer in simple insight
problems. Memory & Cognition, 16, 36-44. McComas, W. F. (1996). Ten myths of science: Reexamining what we think we know about the
nature of science. School Science and Mathematics, 96(1), 10-15. McGrath, A. (2002). The model of situated cognition: Lessons for technology education.
Center for Technology Education Research, Griffith University. McGrath, D. (2005, Septmeber). Technology-supported PBL: Developing 21st century
skills for all students. Retrived September 19, 2006, from http://coe.ksu.edu/McGrath/Edunova/Edunova_paper.htm
Michael, A. L., Klee, T., & Bransford, J. D. (1993). The transition from theory to therapy: Test
of two instructional models. Applied Cognitive Psychology, 7, 139-154. Miles, M. B., & Huberman, A. M. (1994). An expanded sourcebook: Qualitative data analysis
(2nd ed.). Thousand Oaks, London: Sage Publications. National Academy of Engineering. (2004) The Engineer of 2020: Visions of Engineering
in the New Century. Washington, DC: National Academic Press.

107
National Academy of Sciences (February 2006). Rising above the gathering storm:
Energizing and employing America for a brighter economic future. Retrieved September 14, 2006, from http://www.nap.edu/catalog/11463.html
National Commission of Excellence in Education (1983). A nation at risk: The imperative for
educational reform. Washington, DC: Author. National Council of Teachers of English. (1935). An experience curriculum in English. New
York: D. Appleton-Century. National Council of Teachers of Mathematics. (1989). Curriculum and evaluation standards for
school mathematics. Reston, VA: Author. National Council of Teachers of Mathematics (2000). Principles and standards for school
mathematics. VA: NCTM. National Research Council. (1996). National science education standards. Washington, DC:
National Academy Press. Nickerson, R. S. (1994). The teaching of thinking and problem solving. In R. J. Sternberg (Ed.),
Thinking and problem solving. San Diego, CA: Academic Press. Noss, R.,&Hoyles, C. (1996).Windows on mathematical meanings: Learning cultures and
computers. Dordrecht, The Netherlands: Kluwer. Noss, R., Hoyles, C., & Pozzi, S. (2002). Abstraction in expertise: A study of nurses’
conceptions of concentration. Journal for Research in Mathematics Education, 33(3), 204–229.
Palincsar, A. S., & Brown, A. L. (1984). Reciprocal teaching of comprehension- fostering and
comprehension- monitoring activities. Coginition and Instruction, 1(117-175). Pintrich, P. R., Marx, R. W., & Boyle, R. (1993). Beyond cold conceptual change: The role of
motivational beliefs and classroom contextual factors in the process of conceptual change. Review of Educational Research, 6, 167-199.
Polya, G. (1957). How to solve it: A new aspect of mathematical method. Garden City, NY:
Doubleday. Pratt, D. (2000). Making sense of the total of two dice. Journal for Research in Mathematics
Education, 31(5), 602–625. Pratt, D. & Noss, R. (2002). The microevolution of mathematical knowledge: The case of
randomness. The Journal of the Learning Sciences, 11(4), 453–488.

108
Pring, R. A. (1973). Curriculum integration. In R. S. Peters (Ed.), The philosophy of education (pp. 123-149). London: Oxford University Press.
Puntambekar, S. & Kolodner, J. L. (2005). Toward implementing distributed scaffolding:
Helping students learn science from design. Journal of Research in Science Teaching. 42(2), 185-217.
Puntambekar, S. & Kolodner, J.L. (1998). Distributed scaffolding: Helping students learn in a
learning by design environment. In A.S. Bruckman, M. Guzdial, J.L. Kolodner, & A. Ram (Eds.), ICLS 1998, Proceedings of the international conference of the learning sciences (pp. 35–41). Charlottesville, VA: AACE.
Puri, I. K. (2008). Welcome from the department head. Engineering sciences and mechanics
website. Retrieved May 14, 2010. Raizen, S. A., Sellwood, P., Todd, R. D., and Vickers, M. (1995). Technology education in the
Classroom. San Francisco: Jossey-Bass Publishers. Reed, S. K. (1993). A schema-based theory of transfer. In D. K. Detterman & R. J. Sternberg
(Eds.), Transfer on trial: Intelligence, cognition, and instruction (pp. 39–67). Norwood, NJ: Ablex.
Reed, S. K., Ernst, G. W., & Banerji, R. (1974). The role of analogy in transfer between similar
problem states. Cognitive Psychology, 6, 436-450.
Reiff, R., Harwood, W. S., & Phillipson, T. (2002). A scientific method based upon research scientists’ conceptions of scientific inquiry. Paper presented at the International Conference of the Association for the education of Teachers in Science, Charlotte, NC.
Roberts, P. (1995). The place of design in technology education. In D. Layton (Ed.), Innovations
in science and technology education, vol. V: UNESCO Publishing.
Ross, B. H. (1984). Remindings and their effects in learning a cognitive skill. Cognitive Psychology, 16, 371-416.
Ross, B. H. (1987). This is like that: The use of earlier problems and the separation of similarity
effects. Journal of Experimental Psychology: Learning, Memory, and Cognition, 13, 629-639.
Ross, B. H. (1989). Distinguishing types of superficial similarities: Different effects on the
access and use of earlier problems. Journal of Experimental Psychology: Learning, Memory, and Cognition, 15, 456-468.
Roth, W. M. (2001). Learning science through technological design. Journal of Research in Science Teaching, 38(7), 768-790.

109
Royal College of Art. (1976). Design in general education. Part one: Summary of findings and recommendations. London: Royal College of Art.
Rutherford, J. F. & Ahlgren, A. (1990). The mathematical world. In Science for All Americans. New York: Oxford University Press
Salomon, G., & Perkins, D. (1989). Rocky roads to transfer: Rethinking mechanisms of a neglected phenomenon. Educational Psychologist, 24(2), 113-142.
Sanders, M. E. (2007). EDCI 5774 STEM education trends and issues. Virginia Tech, Blacksburg, VA.
Sanders, M. E. (2006a). EDCI 5774 STEM education foundations. Virginia Tech, Blacksburg,
VA. Sanders, M. E. (2000). Web-based portfolios for technology education: A personal case study.
Journal of Technology Studies, 26(1), 11-18.
Sanders, M. & Wells, J. (2005). STEM Graduate Education/Research Collaboratory. Paper presented to the Virginia Tech School of Education faculty, Virginia Tech.
Sanders, M & Wells, J. (2010). Presentation on Design Based Biotechnology Literacy. Virginia
Tech Sanders, M. (2006b, November). A rationale for new approaches to STEM education and
STEM education graduate programs. Paper presented at the 93rd Mississippi Valley Technology Teacher Education Conference, Nashville, TN.
Sanders, M. (2008, December). STEM, STEM education, STEMmania. The Technology
Teacher, December, 2008. Savage, E. & Sterry, L. (Eds.). (1990). A conceptual framework for technology education.
Reston, VA: International Technology Education Association. Saxe, G. B., Dawson, V., Fall, R., & Howard, S. (1996). Culture and children’s mathematical
thinking. In R. J. Sternberg & T. Ben-Zeev (Eds.), The nature of mathematical thinking (pp. 119–144). Mahwah, NJ: Lawrence Erlbaum Associates, Inc.
Schoenfeld, A. H. (1999). Looking toward the 21st century: Challenges of educational theory
and practice. Educational Researcher, 28(7), 4–14. Schoenfeld, A. H. (1985). Mathematical problem solving. Orlando, FL: Academic Press.
Serafino, K., & Cicchelli, T. (2003, January 1). Cognitive theories, prior knowledge, and
anchored instruction on mathematical problem solving and transfer. Education and Urban Society, 36(1), 79.

110
Sharan, Y., & Sharan, S. (1989). Group investigation expands cooperative learning. Educational Leadership, 47(4), 17-21.
Shoemaker, B. J. E. (1989). Integrative education: A curriculum for the twenty-first century (No.
33). OR. Shulman, L. S. (Feb., 1986). Those who understand: Knowledge growth in teaching.
Educational Researcher, 15, 4-14. Shulman, Lee. S. (2004). Problem Based Learning: The pedagogies of Uncertainty. In
Teaching as Community Property: Essays on higher education San Francisco: Jossey-Bass.
Shulman, L. S. (2005, Spring). Pedagogies of Uncertainty. Liberal Education. Shulman, L. S. (2005, Summer). Signature pedagogies in the professions. Sidawi, M. M. (2007). Teaching science through designing technology. International Journal of
Technology and Design Education. The Math Forum @ Drexel, Philadelphia, PA. Singley, M. K.,&Anderson, J. R. (1989). The transfer of cognitive skill. Cambridge, MA:
Harvard University Press. Skinner, B. F. (1954). The science of learning and the art of teaching. Harvard Educational
Review, 24, 86-97.
Smith, W. H. (1970). The Maryland Plan. College Park, MD: University of Maryland. [A brief summary of The Maryland Plan, later described in much greater detail in: Maley, D. (1973). The Maryland Plan. New York: Bruce Publishing.]
SPSS Tutorials. (2010). Interrater reliability (kappa) using spss. Retrieved July 23, 2010 from
http://www.stattutorials.com/SPSS/TUTORIAL-SPSS-Interrater-Reliability-Kappa.htm. Strike, K., & Posner, G. (1992). A revisionist theory of conceptual change. In R. Dischl & R.
Hamilton (Eds.), Philosophy of science, cognitive science and educational theory and practice. Albany, NY: SUNY Press.
Thorndike, E. L. (1906). Principles of teaching. New York: A. G. Seiler. Thorndike, E. L., & Woodworth, R. S. (1901). The influence of improvement in one mental
function upon the efficiency of other functions. Psychological Review, 8, 247-261. Towers, E., Lux, D. G., & Ray, W. E. (1966). A rationale and structure for industrial arts
subject matter. Columbus: The Ohio State University Research Foundation.

111
U.S. Department of Education. (2006). Answering the challenge of a changing world strengthening education for the 21st century. Retrieved September 14, 2006, from http://www.ed.gov/about/inits/ed/competitiveness/strengthening/strengthening.pdf
Volk, K. (2006). The gary plan and technology education: What might have been? Journal of
Technology Studies, 31(1), 39. VT Technology Education. (2006). STEM education graduate degree options (STEM ed
options). Retrieved June 10, 2007, from http://teched.vt.edu/TE/STEM.html Vygotsky, L. S. (1978). Mind in Society: The development of higher psychological processes.
Cambridge, MA: Harvard University Press. Waltz, C. F., & Bausell, R. B. (1983). Nursing research: Design, statistics and computer
analysis (2nd ed.). Philadelphia, PA: Davis Company. Warner, W. E. Gary, J. E., Gerbracht, C. J., Gilbert, H. G., Lisack, J. P, Kleintjes, P. L., Phillips,
K. (1947, 1965). A Curriculum to reflect technology. Reprint of a paper presented at the annual conference of the American Industrial Arts Association (1947). Epsilon Pi Tau.
Wason, P. C., & Johnson-Laird, P. N. (1972). Psychology of reasoning: Structure and Content.
Cambridge, MA: Harvard University Press. Wells, J. (2010). Research on teaching and learning in science education: Potentials for
technology education. In P. Reed & J. LaPorte (Eds.), Research in Technology Education (pp. 182-202). Council on Technology Teacher Education. Reston, VA: ITEA.
Wells, J. (2009). Integrative STEM education pedagogy model. EDCI 5814 STEM Education
Pedagogy. Virginia Tech, Blacksburg, VA. Wells, J. (2008, November). STEM Education: The potential of technology education. Paper
presented at the 95th Mississippi Valley Technology Teacher Education Conference, St. Louis, MI.
Wells, J. (2007a). EDCI 5774 Biotechnology literacy: PBL activities. Virginia Tech, Blacksburg,
VA. Wells, J. (2007b). EDCI 5774 STEM education research. Virginia Tech, Blacksburg, VA. Wells, J. (2006). EDCI 5774 STEM education pedagogy. Virginia Tech, Blacksburg, VA.
112
Wells, J., White, K., & Dunham, T. (2000). Technology education biotechnology curriculum. Morgantown, WV: Biosens.
Wells, J. (1998-2011). Biotechnology literacy: Teaching guide. Technology Education Biotech
Curriculum (TEBC). Blacksburg, VA: Biosens.
Wineburg, S. S., & Fournier, J. E. (1994). Contextualized thinking in history. In M. Carretero & J. F. Voss (Eds.), Cognitive and instructional processes in history and the social sciences (pp. 285-308). Hillsdale, NJ: Erlbaum.
Woodrow, H. (1927). The effect of the type of training upon transference. Journal of Educational Psychology, 18, 159-172.
Writing@CSU (2010). Interrater reliability. Retrieved July 23, 2010 from
http://writing.colostate.edu/guides/research/relval/com2a5.cfm. Yaghmaie, F. (2003). Content validity and its estimation. Journal of Medical Education. Yi, J. (2005, January 1). Effective Ways to Foster Learning. Performance Improvement,
44(1), 34. Yin, R. K. (2009) Case study research: Design and methods fourth edition. Thousand Oaks, CA:
SAGE Publications. Yin, R. K. (2003) Case study research: Design and methods third edition. Thousand Oaks, CA:
SAGE Publications.

113
Appendix A
A Comparison of the Technological Design Loop and Scientific Inquiry Wheel

114
The technological design process and scientific inquiry method are similar in structure
and process. By looking at both processes side by side their similarities become increasingly
apparent. Edward Thorndike’s Identical Elements theory (1901), states that as the similarities
increase between two concepts the likelihood of transfer will increase. The technological design
process shares a common structure, or way in which knowledge is used to answer a question or
solve a problem, with the scientific inquiry method. These common structures represent
“identical elements” that increase the likelihood of knowledge transfer. Examining these
“identical elements” is requisite in this study to creating a combined T/E design and Inquiry
process for use in the Design Log instrument.

115
Identifying Problems and Opportunities / Observing and Defining the Problem
Technological Design Loop Scientific Inquiry Wheel
Comparing The Technological Design Loop and Scientific Inquiry Wheel (Hutchinson & Karsnitz, 1994; Reiff, Harwood, Phillipson, 2002). Used under fair use guidelines, 2011.
Technological design begins with “Identifying problems and opportunities.” Similarly,
scientific inquiry begins by “Observing and Defining a problem.” In both cases the problem is
typically placed in the context of some real world application. Learning can improve when
seemingly abstract topics are placed within a context meaningful to the student (Wason &
Johnson-Laird, 1972). It is important in this case that the instructor knows what interests the
students and then tailors the problem around that interest.

116
Framing a Design Brief / Framing the Question and Articulating the Known
Technological Design Loop Scientific Inquiry Wheel
Comparing The Technological Design Loop and Scientific Inquiry Wheel (Hutchinson & Karsnitz, 1994; Reiff, Harwood, Phillipson, 2002). Used under fair use guidelines, 2011.
“Framing a design brief” (technological design) and “Forming a question/Articulating
expectations” (scientific inquiry) involves outlining exactly what will be done and what
specifications the final product must meet (Hutchinson & Karsnitz, 1994). Framing the design
brief/expectations may prove to be difficult without sufficient knowledge and understanding of
the content. There may need to be some investigation at this step in the process.

117
Investigation and Research / Investigating the Known
Technological Design Loop Scientific Inquiry Wheel
Comparing The Technological Design Loop and Scientific Inquiry Wheel (Hutchinson & Karsnitz, 1994; Reiff, Harwood, Phillipson, 2002). Used under fair use guidelines, 2011.
“Investigation and research” (technological design) and “Investigating the known”
(scientific inquiry) can take many different forms. The teacher can give students’ assignments
regarding important knowledge the student should have. The teacher can also give students
selected readings, lessons, group discussion, teacher-led demonstration, and online research
conducted using worksheets. Students may need some guidance during online research so a
handout could be helpful to be sure they are looking for the right information. This investigation
and research should not be simple fact-finding but rather should involve students building new
knowledge and understandings.
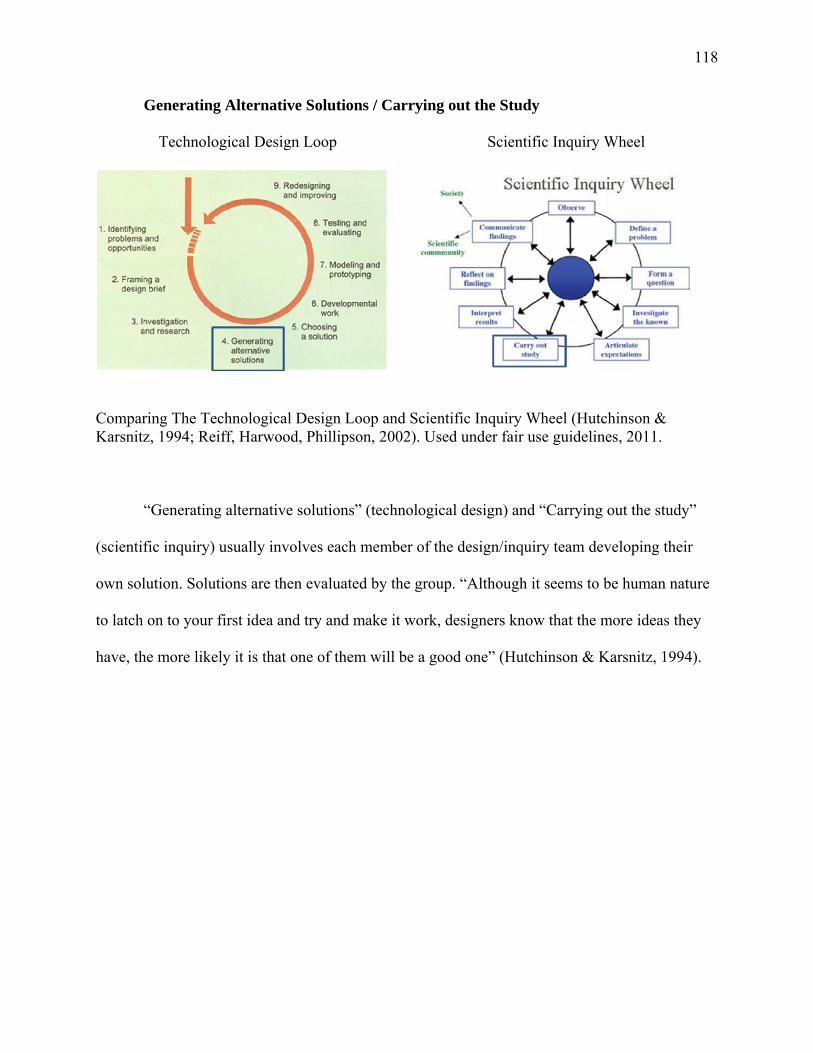
118
Generating Alternative Solutions / Carrying out the Study
Technological Design Loop Scientific Inquiry Wheel
Comparing The Technological Design Loop and Scientific Inquiry Wheel (Hutchinson & Karsnitz, 1994; Reiff, Harwood, Phillipson, 2002). Used under fair use guidelines, 2011.
“Generating alternative solutions” (technological design) and “Carrying out the study”
(scientific inquiry) usually involves each member of the design/inquiry team developing their
own solution. Solutions are then evaluated by the group. “Although it seems to be human nature
to latch on to your first idea and try and make it work, designers know that the more ideas they
have, the more likely it is that one of them will be a good one” (Hutchinson & Karsnitz, 1994).

119
Choosing the Best solution / Carrying out the Study
Technological Design Loop Scientific Inquiry Wheel
Comparing The Technological Design Loop and Scientific Inquiry Wheel (Hutchinson & Karsnitz, 1994; Reiff, Harwood, Phillipson, 2002). Used under fair use guidelines, 2011.
In “choosing a solution” (technological design) and “carrying out the study” (scientific
inquiry), the students evaluate each alternative solution and choose the one that solves the
problem best. This may involve the development of a matrix with scoring categories. In this way,
the choice is made systematically.

120
Developmental Work / Carrying out the Study
Technological Design Loop Scientific Inquiry Wheel
Comparing The Technological Design Loop and Scientific Inquiry Wheel (Hutchinson & Karsnitz, 1994; Reiff, Harwood, Phillipson, 2002). Used under fair use guidelines, 2011.
In “developmental work” (technological design) and “carrying out the study” (scientific
inquiry) materials begin to be tested and sub components of the design may be assembled. This
is also the step “at which technical planning—engineering drawings, exploded-view drawings,
cutaways, and blueprints—may be employed (Hutchinson & Karsnitz, 1994). In scientific
inquiry this is where experiments are conducted.

121
Modeling and Prototyping / Carrying out the Study
Technological Design Loop Scientific Inquiry Wheel
Comparing The Technological Design Loop and Scientific Inquiry Wheel (Hutchinson & Karsnitz, 1994; Reiff, Harwood, Phillipson, 2002). Used under fair use guidelines, 2011.
“Modeling and prototyping” (technological design) and “carrying out the study”
(scientific inquiry) may occur through several different ways: two dimensional and three
dimensional models, computer models, and mathematical models are commonly used
(Hutchinson & Karsntiz, 1994). Modeling is a critical aspect of the design process because it
allows students to see a physical representation of their design.

122
Testing and Evaluation / Reflecting on the Findings
Technological Design Loop Scientific Inquiry Wheel
Comparing The Technological Design Loop and Scientific Inquiry Wheel (Hutchinson & Karsnitz, 1994; Reiff, Harwood, Phillipson, 2002). Used under fair use guidelines, 2011.
“Testing and evaluating” (technological design) and “Reflecting on findings/Interpreting
results” (scientific inquiry) occurs once the model or prototype is complete. This allows students
to evaluate whether their design/model is still viable or will modifications need to be made
before full scale production can take place. At this step students refer back to their original
design brief/expectation criteria to evaluate if they have met them or not.

123
Redesigning and Improving / Communicating the Findings
Technological Design Loop Scientific Inquiry Wheel
Comparing The Technological Design Loop and Scientific Inquiry Wheel (Hutchinson & Karsnitz, 1994; Reiff, Harwood, Phillipson, 2002). Used under fair use guidelines, 2011.
“Redesigning and improving” (technological design) and “communicate finds” (scientific
inquiry) occurs after testing/reflecting on the model or prototype. The students try to identify
why the design failed in order to make improvements to the prototype. This method of improving
on a design allows students to reflect on why the design failed and learn what could be done to
prevent a similar future failure. It also engages students in higher order thinking though synthesis
and evaluation. In scientific inquiry, student would communicate their findings regarding if the
hypothesis was proven true or false. If it was proven false modifications can be made for future
study.

124
Appendix B
Phase 1: IRB Approval Letter

125

126
Phase 1: IRB Continuation Request Approval Letter

127

128

129
Phase 3: IRB Approval Letter
130

131

132
Appendix C
Phase 1: Email Solicitation

133
Phase 1: Email Solicitation
Dear Potential Study Participant, You are being contacted because you are a student in Dr. Paretti’s ESM-4015 Creative Design I, II course. My name is Fred Figliano and I am a graduate student in the Integrative STEM Education program at Virginia Tech. I am working on a new research study regarding design-based learning and the transfer of knowledge within the science, technology, engineering, and mathematics (STEM) fields. I am beginning this research study with Dr. John G. Wells who is a faculty member of the Integrative STEM Education program. We are seeking undergraduate engineering students to be part of this new study. The purpose of this study is to identify key elements of a design-based learning instrument that will aid in the collection of data evidencing ways in which design-based activities foster the transfer of knowledge. We would like to interact with your ESM-4015 Creative Design I, II project Team during group meetings. Our interaction with you and your Team members will be only to observe work sessions, to gain insight into your design decisions, and ask for your reactions to our initial design-based learning instrument. For those who choose to participate in this study, all identifying information will be kept confidential. If you are interested in participating in this study please email me, Fred Figliano at [email protected]. Following receipt of your willingness to participate I will contact you regarding times when your Project Team meets. I hope you will give us the opportunity to work with you and your design team. Thank you in advance for your consideration, Fred J. Figliano Graduate Student

134
Appendix D
Phase 1: Email Solicitation 2
135
Phase 1: Email Solicitation 2
Dear Nick, This is Fred Figliano, the person that spoke with your Creative Design course yesterday about my dissertation research. I would like to request your participation in my study. This participation would involve a minor time commitment of five to ten minutes at the end of each work session and allowing your work sessions to be observed. This commitment would last from the beginning of the spring semester until the end of February. Your work with me will also benefit your design projects by giving you a chance to reflect on design decisions. This will not only benefit your final designs but also the design logs you are currently keeping as part of your course work. If you are interested, you can read the remainder of this message and send me an email letting me know you are interested in participating. I need the willingness of your entire group to work with me. So please talk with your group to be sure everyone is interested. You are being contacted because you are a student in Dr. Paretti’s ESM-4015 Creative Design I, II course. My name is Fred Figliano and I am a graduate student in the Integrative STEM Education program at Virginia Tech. I am working on a new research study regarding design-based learning and the transfer of knowledge within the science, technology, engineering, and mathematics (STEM) fields. I am beginning this research study with Dr. John G. Wells who is a faculty member of the Integrative STEM Education program. We are seeking undergraduate engineering students to be part of this new study. The purpose of this study is to identify key elements of a design-based learning instrument that will aid in the collection of data evidencing ways in which design-based activities foster the transfer of knowledge. We would like to interact with your ESM-4015 Creative Design I, II project Team during group meetings. Our interaction with you and your Team members will be only to observe work sessions, to gain insight into your design decisions, and ask for your reactions to our initial design-based learning instrument. For those who choose to participate in this study, all identifying information will be kept confidential. If you are interested in participating in this study please email me, Fred Figliano at [email protected]. Following receipt of your willingness to participate I will contact you regarding times when your Project Team meets. I hope you will give us the opportunity to work with you and your design team. Thank you in advance for your consideration, Fred J. Figliano Graduate Student

136
Appendix E
Phase 1: Email Solicitation 3

137
Phase 1: Email Solicitation 3
Dear John, You are currently entering the final semester of your engineering program at Virginia Tech. At the end of this semester, with help from faculty who will assist you in successfully completing your senior capstone design project, you will graduate with your engineering degree. Like you, I am entering the final semester of my graduate program and I need your help with my capstone project. In order to finish my doctorate I must complete a capstone project similar in many ways to your senior design project. This project is my dissertation and in order to successfully complete it and graduate I need your help. I very much need your participation in my research and am asking once more for just a few minutes of your time at the end of your project work sessions to answer a few short questions. I would also like to observe your design team while you work on your project. And because I would be observing your entire team, I will need everyone in your group to agree to work with me. So please be sure that all team members are interested if you decide to help me. As an added incentive, I will give each member of any team that decides to help me a $20 Amazon gift card and also enter them into a raffle to win an additional $50 Amazon gift card when my project is finished. As you think about my request keep in mind that I am not asking for much of your time and you would be helping me a great deal with my final project. If you and your team agree to participate, I will contact you to make arrangements to sit in on your next work session. I sincerely hope you will carefully consider helping me and agree to participate. I look forward to a positive response to my request and meeting with you and your team in the near future. Thank you in advance for your consideration, Fred J. Figliano Graduate Student Integrative STEM Education

138
Appendix F
Phase 1: Informed Consent Form
139

140

141
Phase 3: Informed Consent Form

142

143

144
Appendix G
Phase 1: Initial Design Log Instrument
145

146

147

148

149

150

151
Appendix H
Introduction Protocol

152
Introduction Protocol
The following will be read to participants at the beginning of the first meeting. Good morning (afternoon, evening). Thank you for allowing me to come speak to you. Let’s begin with who I am. I am originally from New Jersey and attended college at the college of NJ. There I received my BS in Technology Education. Technology Education is the study of our designed world. The focus is similar to engineering which is looking at solving human needs. After completing my BS I came to Virginia Tech to pursue a graduate degree in Integrative STEM education. STEM meaning Science, Technology, Engineering, and Mathematics. I received my MAED from Tech and am working to complete my Dissertation with this study and receive my doctorate. Let’s go around the room now and just introduce yourself and tell me your major. Students introduce themselves Now I would like to tell you a little bit about what I am doing. The goal of my study is to investigate a concept known as knowledge transfer. I told you before that the program I am in is Integrative STEM education. Well our central focus is about making connections between STEM disciplines. My study is interested in evidencing these connections in design-based environments. To do this I would like your permission to have access to the Design Logs which you will already be doing as part of this course. I would also like to ask your permission to video and audio record your class work. Your identities will be kept totally confidential and your names will never be used in any study related documents for public use. Also, all data that I collect will only be seen by the research team; my committee and I. I would now like to pass out the informed consent form so we can review it and you can ask any questions. Pass out informed consent form Read through the informed consent form exactly as written. Pause for questions at the end. If there are no further questions I would ask that you each sign and date the consent form and then pass them to the person next to you as a witness. Remember that your participation is purely optional so if you are uncomfortable, that is fine, but you will be making Design Log entries anyway so there would be no additional work on your part. When you’re done signing the form please pass them up. Collect informed consent form Now what I would like to pass out to you is the Design Log itself. Pass out Design Log Instrument
153
Now I would like to go over each section of the Design Log. On the cover there is a place for your name and your design project title. If you turn to the first page you will see there are some instructions and some background information regarding the design process which is the image you see. I would like to read both sections to you. Read the Background and Directions sections of log to the class Are there any questions about the background or the directions? Pause for questions If there are no further questions, I would like to go over each question in the Design Log so that you know what I am expecting. Question 1 asks you to identify where you are in the design process by circling the phase or phases you are in. What I would like you to do here is simply circle the phase or phases you are in. Pause for questions Question 2 asks you to describe what tasks you have completed during this phase of the design process as it relates to the previous question. For this question I want to know what tasks you have actually completed during this phase, not ongoing tasks. Pause for questions Question 3 asks, “Of all the tasks you have worked through during this work session, which have you started to work on but have not completed?” This question asks you to describe those tasks which are ongoing and have not been completed yet. Pause for questions Question 4 asks, “What information did you need to search for that you did not already know and what knowledge did you already have that you used during this work session?” To answer this question I am interested in information that you did not know that needed to be looked up online or found out some other way. I am also interested in the knowledge that you already know about a topic and were able to use to solve design problems. Pause for questions The 5th question ask, “How did you solve any problems that arose during this work session?” In this question I am looking for design problems based on constraints, trade-offs, and failures of your design. What problems came up that needed to be solved. Pause for questions

154
The 6th question asks, “Based on the expectations for your final solution that were framed in phase 2, how does the work you completed during this work session align with those expectations?” For this question I am most interested in how the design decisions you make align with your constraints framed in phase 2 of the design process. In other words do your decisions allow you to meet those constraints and expectations? Pause for questions The 7th and final question asks, “How would you predict your final solution to work based on the decisions which you have made during this work session?” I am asking you to make a prediction of how well your designs will work in your final solution. Will they work well or not so well? Pause for questions If there are no further questions we can move on. You are to make a Design Log entry at the end of each in-class work session. At the end of class you will make your entry and I will come around and take a picture of your entry so that I have copies. Pause for questions If there are no further questions I will turn the class back over to your TA. Thank you for agreeing to participate in this study!

155
Appendix I
Field Note Protocol

156

157
Appendix J
End of Work Session Protocol

158
End of Work Session Protocol
The following will be read to participants at the end of each work session. Now that you are done working I would like you to please take 5 to 10 minutes to make a Design Log entry. If you have questions please refer back to the beginning of the log where you will find the directions. If you have any further questions feel free to raise your hand and I will come to you. Allow participants are to make a Design Log entry. Rove around the room as they work. As you finish please site quietly until everyone is done. Pause for the class to finish making their Design Log entry. Now I would like to ask you some question specifically about the Design Log.
1. Were the directions helpful? 2. Were you able to understand where you were in the design process? 3. Did you feel that the question prompts made sense to you and that you were able to
answer them to the best of your ability? 4. Do you feel making Design Log entries helps you to be reflective in your design efforts? 5. Do you have any general comments about the Design Log?
Thank you for your responses. Please pass me your Design Log. Have a great week!

159
Appendix K
Ejection Protocol
160
Ejection Protocol
The following will be read at the end of the final day of data collection. I would just like to thank you all for participating in my study and allowing it to move forward. The contributions you have made will help to build an understanding of how design activities can foster the transfer of knowledge. I appreciate the hard work you have done and will continue to be in touch if you would like to read the results of my study. You may email me if you like if you have any ongoing questions about my study or what I found. I wish you all luck in your future endeavors and can’t thank you enough for working with me. Does anyone have any final questions for me? Pause for questions If there are no further questions please pass in your Design Logs to me. Thank you and have a great rest of your day. Thank you again for your participation!

161
Appendix L
Content Validity Instrument

162

163
Appendix M
End of Work Session Phase 3 Protocol

164
End of Work Session Phase 3 Protocol
The following will be read to participants at the end of each work session. Now that you are done working I would like you to please take 5 to 10 minutes to make a Design Log entry. If you have questions please refer back to the beginning of the log where you will find the directions. If you have any further questions feel free to raise your hand and I will come to you. Allow participants are to make a Design Log entry. Rove around the room as they work. As you finish please site quietly until everyone is done. Pause for the class to finish making their Design Log entries. I would like everyone to open their Design Log instrument and I will come around and take a picture of your entry. After I take the picture you may leave. Please remember not to lose your Design Log and to bring them back to class next week. Have a great week everyone and thank you for your continued participation in my study! Walk around to each participant and take a photo of their Design Log entries for that day.

165
Appendix N
Analysis Rubric

166
Analysis Rubric
Directions: Using the data provided please review each instance of knowledge transfer and identify which STEM content areas, if any, are being transferred. Definitions:
Knowledge Transfer: Any knowledge, information, or past experiences that are abstracted by participants and used when trying to understand higher order concepts Abstraction: To abstract a principle is to identify a generic quality or pattern across instances of the principle. In formulating an abstraction, an individual deletes details across exemplars, which are irrelevant to the abstract category…These abstractions are represented in symbolic form and avoid contextual specificity so they can be applied to other instances or across situations. Because abstractions, or schemas, subsume related cases, they promote transfer Example Abstraction: Topic: Design an electrical circuit Abstraction: Current follows the path of least resistance
Analysis Rubric of Phase 3 Data
Log Question Participant Log Entry Design Phase Triangulation Data Abstraction Inference Content Code (S-T-E-M) Reported Observed Audio/Video Interviews

167
Appendix O
Reliability Rubric

168
Reliability Rubric
Directions: Using the data from the Analysis Rubric enter each abstraction that was identified for each participant in the Design Log. Enter this data into the “Reported” Column for the appropriate week. Then, enter all abstractions into the “Observed” column that were found in the Audio/Video transcripts but not found in the Design Log.
Reliability Rubric Participant Week 1 Week 2 Week 3 Week 4 Week 5 Week 6 Week 7
Reported Observed Reported Observed Reported Observed Reported Observed Reported Observed Reported Observed Reported Observed A
B
C
D
E
F
G
H
I

169
Appendix P
Phase 1: Week One Field Note Protocol

170

171
Appendix Q
Phase 1: Week Two Field Note Protocol

172
Observation (Date/Time): __________________________ Group: ___________________ Area: S=Science T=Technology E=Engineering M=Mathematics Identify a problem either by observation or a human need
Area____ , Time ____ Area____ , Time ____ Area____ , Time ____
Frame expectation for the final solution
Area____ , Time ____ Area____ , Time ____
Investigate what is known about the problem
Area____ , Time ____ Area____ , Time ____ Area____ , Time ____
Begin to carry out the study by developing alternate solutions to the problem
Area____ , Time ____ Area____ , Time ____ Area____ , Time ____ Area____ , Time ____
Choose an appropriate solution from the alternate solutions that where developed previously
Area____ , Time ____ Area____ , Time ____ Area____ , Time ____ Area____ , Time ____ Area____ , Time ____
Develop out the chosen solution including all sub-components
Area____ , Time ____ Area____ , Time ____ Area____ , Time ____ Area____ , Time ____
Model the chosen solution either by producing a product or by carrying out a procedure
Area____ , Time ____ Area____ , Time ____ Area____ , Time ____ Area____ , Time ____ Area____ , Time ____
Check to see if your chosen solution meets the expectations that were identified earlier
Area____ , Time ____ Area____ , Time ____ Area____ , Time ____ Area____ , Time ____ Area____ , Time ____ Area____ , Time ____
If the chosen solution does not meet expectations make any improvements necessary and present your findings
Area____ , Time ____ Area____ , Time ____ Area____ , Time ____ Area____ , Time ____ Area____ , Time ____ Area____ , Time ____

173
Appendix R
Phase 1: Week Three Field Note Protocol

174
Observation (Date/Time): ___________________________ Group: __________________ Area: S=Science T=Technology E=Engineering M=Mathematics (1) Identify a problem either by observation or a human need
Design Phase ____, Area____ , Time ____ Topic:
Known:
Unknown:
(2) Frame expectation for the final solution
Design Phase ____, Area____ , Time ____ Topic:
Known: Unknown:
(3) Investigate what is known about the problem
Design Phase ____, Area____ , Time ____ Topic:
Known: Unknown:
(4) Begin to carry out the study by developing alternate solutions to the problem
Design Phase ____, Area____ , Time ____ Topic:
Known: Unknown:
( 5) Choose an appropriate solution from the alternate solutions that where developed previously
Design Phase ____, Area____ , Time ____ Topic:
Known:
Unknown:
(6) Develop out the chosen solution including all sub-components
Design Phase ____, Area____ , Time ____ Topic:
Known: Unknown:
(7) Model the chosen solution either by producing a product or by carrying out a procedure
Design Phase ____, Area____ , Time ____ Topic:
Known:
Unknown:
(8) Check to see if your chosen solution meets the expectations that were identified earlier
Design Phase ____, Area____ , Time ____ Topic:
Known:
Unknown:
(9) If the chosen solution does not meet expectations make any improvements necessary and present your findings
Design Phase ____, Area____ , Time ____ Topic:
Known:
Unknown:

175
Appendix S
Interrater Reliability Data Matrix
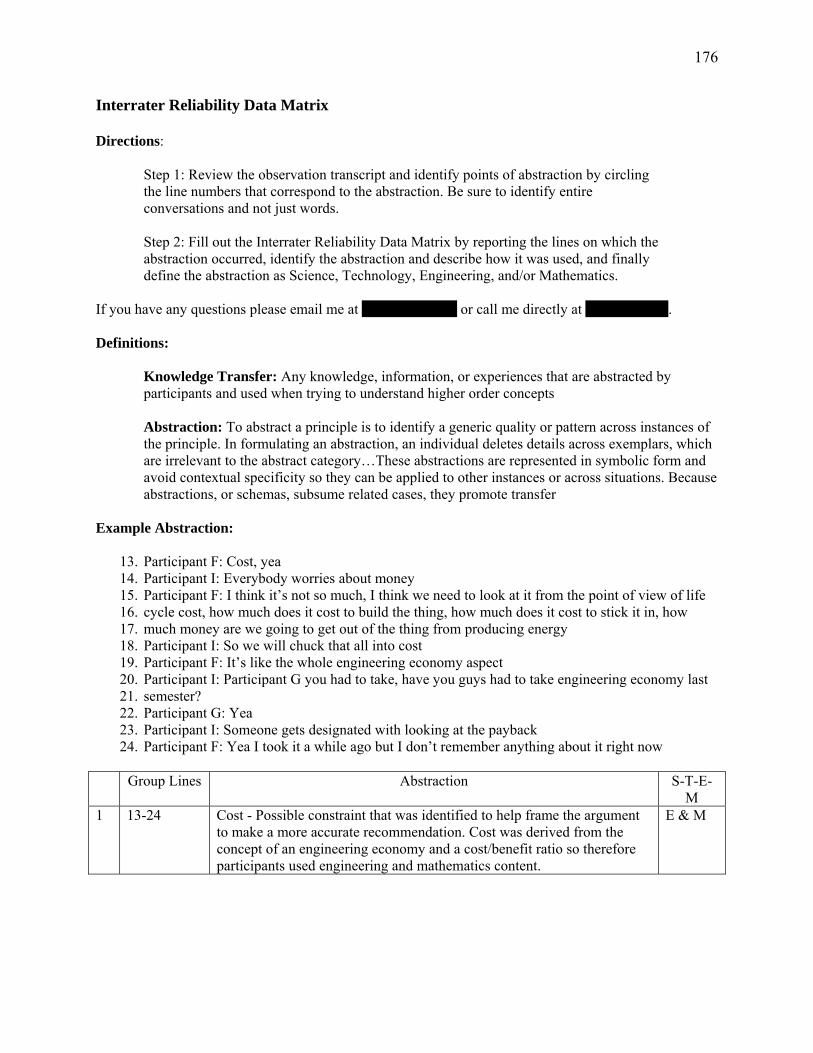
176
Interrater Reliability Data Matrix
Directions: Step 1: Review the observation transcript and identify points of abstraction by circling the line numbers that correspond to the abstraction. Be sure to identify entire conversations and not just words. Step 2: Fill out the Interrater Reliability Data Matrix by reporting the lines on which the abstraction occurred, identify the abstraction and describe how it was used, and finally define the abstraction as Science, Technology, Engineering, and/or Mathematics. If you have any questions please email me at [email protected] or call me directly at 908-642-3133. Definitions:
Knowledge Transfer: Any knowledge, information, or experiences that are abstracted by participants and used when trying to understand higher order concepts Abstraction: To abstract a principle is to identify a generic quality or pattern across instances of the principle. In formulating an abstraction, an individual deletes details across exemplars, which are irrelevant to the abstract category…These abstractions are represented in symbolic form and avoid contextual specificity so they can be applied to other instances or across situations. Because abstractions, or schemas, subsume related cases, they promote transfer
Example Abstraction:
13. Participant F: Cost, yea 14. Participant I: Everybody worries about money 15. Participant F: I think it’s not so much, I think we need to look at it from the point of view of life 16. cycle cost, how much does it cost to build the thing, how much does it cost to stick it in, how 17. much money are we going to get out of the thing from producing energy 18. Participant I: So we will chuck that all into cost 19. Participant F: It’s like the whole engineering economy aspect 20. Participant I: Participant G you had to take, have you guys had to take engineering economy last 21. semester? 22. Participant G: Yea 23. Participant I: Someone gets designated with looking at the payback 24. Participant F: Yea I took it a while ago but I don’t remember anything about it right now
Group Lines Abstraction S-T-E-
M 1 13-24 Cost - Possible constraint that was identified to help frame the argument
to make a more accurate recommendation. Cost was derived from the concept of an engineering economy and a cost/benefit ratio so therefore participants used engineering and mathematics content.
E & M

177
Interrater Reliability Data Matrix Group Lines Abstraction S-T-E-M
1 2 3 4 5 6 7 8 9 10 11 12 13 14 15 16 17 18 19 20 21 22

178
Appendix T
Data Matrix Team 1

179
Wind Power In Virginia: Governor Bob McDonald has expressed strong interest in establishing wind farms in the state as an important new industry. One of the key areas currently under consideration for a wind farm is off the Eastern Shore of Virginia, in the Atlantic and on Poor Mountain. The governor has asked your engineering consulting group to examine the feasibility of these projects and prepare a brief presentations for members of the state congress who will be asked to support the project. Wind energy is subject to a number of different controversies, including technical (can it really generate enough power to be worthwhile?), environmental (will it harm native wildlife?), and social (will it be an eyesore and destroy tourism?).

180
Team 1: Week 1
Log Question Participant Log Entry Design Phase Triangulation Data Abstraction Inference Content Code (S-T-E-M) Reported Observed Audio/Video Interviews
Considering the main topics you listed in question one, describe what Science, Technology, Engineering, and Mathematics (STEM) content you knew and what STEM content you did not know about each topic?
C Weather 1,2,3 3 Weather, Environmental, Install issues Lines 11-12 (Green) 72-73 (Teal)
Weather Weather What needed to be researched to help frame the argument to make a more accurate recommendation. Participants considered weather patterns in harnessing the maximum amount of wind energy. Weather patterns derive from science content. Technology and mathematics content were also used to determine to greatest wind potential energy.
S – T – M
G Weather NA
I Weather NA
Considering the main topics you listed in question one, describe what Science, Technology, Engineering, and Mathematics (STEM) content you knew and what STEM content you did not know about each topic?
F Efficiency figures
NA 3 Highly efficient, Size vs. efficiency Lines 66-68 (Red)
Statistical weather data from the ocean and compute watts per square meter
Efficiency What needed to be researched to help frame the argument to make a more accurate recommendation. Participants needed to understand how much energy could be produced from wind. This efficiency ratio (input vs. output) is a technology and engineering concept. Science and mathematics content was also used to calculate the ratio.
S –T – E – M

181
List any design constraints, design trade-offs, or design failures that you were confronted with during this work session.
C Location 1,2,3 3 Amount of area, Finite, Maximum theoretical energy, Traffic (boats), Instillation costs, Assembly, International waters, Continental shelf, Environmental impacts Lines 55-65, 102-113, 119-134 (Blue)
Land, Area, How much area, Location, Available area, More available area in the ocean then on poor mountain so it’s a constraint, Comparison, Scale of project, Amount of land
Location Possible constraints that were identified to help frame the argument to make a more accurate recommendation. Participants had to weight their options to recommend either a land or sea based wind farm. This constraint involved considering construction, amount of land at each location, and environmental impacts. Participants used science, technology, and engineering concepts to understand this problem.
S – T – E G Constraints were
location NA
I Available area NA F Locations NA
Considering the main topics you listed in question one, describe what Science, Technology, Engineering, and Mathematics (STEM) content you knew and what STEM content you did not know about each topic?
C Cost 1,2,3 3 Cost, money, life cycle cost, cost to build, cost to stick it in, payback, engineering economy, Design, Size, type, Weather, Economic life cycle, Environmental and install issues, Land,
Cost, Maintenance, Money, Construction costs, How much will it cost, Money is a constraint, Scale of project, How much one turbine costs, Government subsidies,
Cost
What needed to be researched to help frame the argument to make a more accurate recommendation. Also, possible constraints that were identified to help frame the argument to make a more accurate recommendation. Participants needed to consider the cost vs. benefit of the project. Cost was derived from the concept of an
T – E – M G Cost NA
I Cost NA
List any design constraints, design trade-offs, or design
C Cost 1,2,3 3 G Constraints were
cost NA

182
failures that you were confronted with during this work session.
I Cost NA Government, Transmission lines, Life cycle energy production, Nuclear power plant Lines 13-24, 69-98 (Yellow)
Available money, Cost to ship everything and people, Government involvement, Profitability, Install cost
engineering economy and a cost/benefit ratio so therefore participants used engineering, technology, and mathematics content.
F Cost NA
Given your response to question three, what is your prediction of how each design constraint, design trade-off, or design failure will affect your final proposal? Explain your answer.
C The project will have to be cost-worthy
1,2,3 3
Considering the main topics you listed in question one, describe what Science, Technology, Engineering, and Mathematics (STEM) content you knew and what STEM content you did not know about each topic?
C Environmental Effects
1,2,3 3 Environmental, Affects on animals, Eye sore, Tourism Lines 33-44 (Turquoise)
Winds change by season, Environmental impact, Environment, Environmental affects
Environmental impacts
What needed to be researched to help frame the argument to make a more accurate recommendation. Environmental effects deal with everything from the impact on ecosystems to the eventual recycling of materials. Therefore participants used science and technology content
S – T
G Environmental Effects
NA
I Environmental Effects
NA
List any design constraints, design trade-offs, or design failures that you were confronted with during this work session.
C Environmental Effects
1,2,3 3
Considering the main topics you listed in question one, describe what
C Wind is a source of energy
1,2,3 3 Efficiency, Energy, Design, Advantages,
Brainstorming, research, Basic understandin
Design General knowledge to understand wind power and how it works. This general
S – T – E – M
G/ What designs are out there /
NA 3

183
Science, Technology, Engineering, and Mathematics (STEM) content you knew and what STEM content you did not know about each topic?
I I knew some possible designs
NA Disadvantages, Look into both projects, Actually doing at each, Who’s turbines there planning on using, Offshore types of windmills, Gigawatts Lines 25-32, 119-134 (Bright Green)
g of windmills, Size, Construction, Technology
knowledge about energy is derived from science, technology, and engineering content. Design is a technology and engineering concept. Possible constraints that were identified to help frame the argument to make a more accurate recommendation. Participants had to consider what type of turbine would work best at each location which included considering assembly, efficiency, and durability. These concepts are derived from technology and engineering content. Mathematics content was also used to calculate various design issues.
List any design constraints, design trade-offs, or design failures that you were confronted with during this work session.
C Type of Turbine 1,2,3 3
Given your response to question three, what is your prediction of how each design constraint, design trade-off, or design failure will affect your final proposal? Explain your answer.
C The project will have to be feasible
1,2,3 3 Tie into the power grid, atmospheric thermal warming, convenience Lines 45-54 (Pink)
Feasibility, Potential energy, Could produce 20% of states power, Wind potential energy, Worthwhile
Feasibility Criteria necessary for making a predication about the final solution. Participants needed to consider the feasibility of the project by looking at the cost vs. benefit. The feasibility of connecting the wind turbines to the power grid was also
S – T – E – M
184
considered. This is content derived from an engineering economy and other STEM courses, therefore STEM content was used.
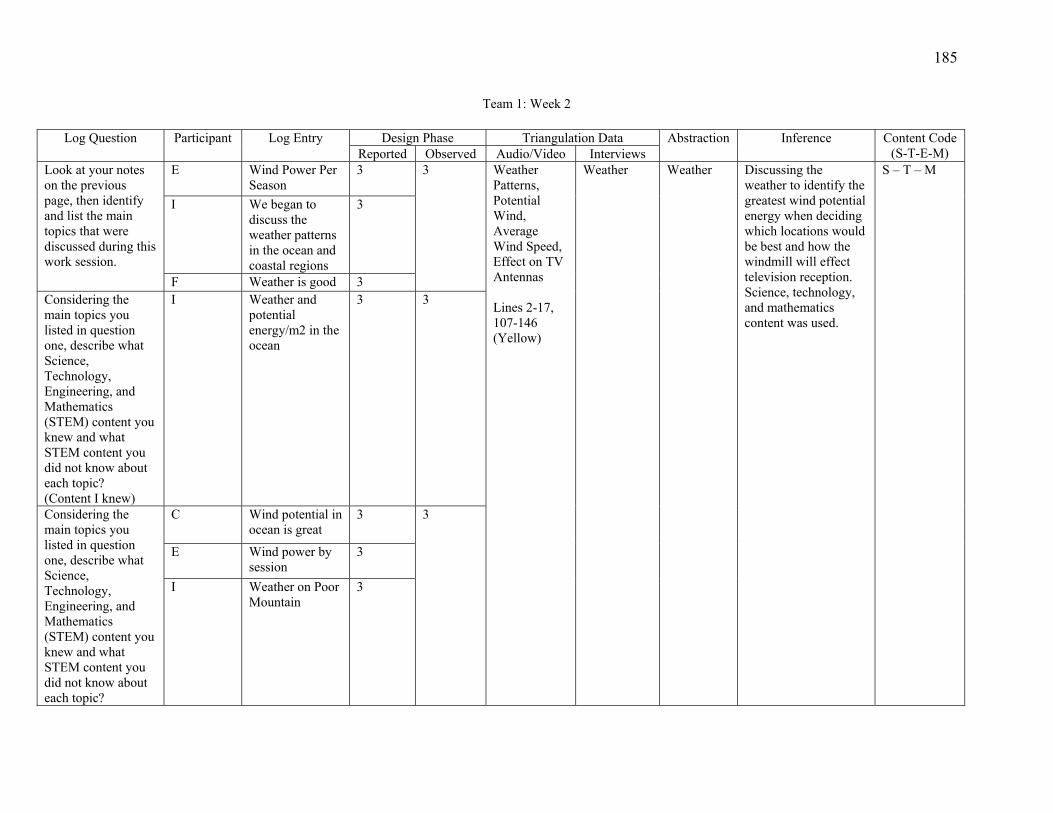
185
Team 1: Week 2
Log Question Participant Log Entry Design Phase Triangulation Data Abstraction Inference Content Code (S-T-E-M) Reported Observed Audio/Video Interviews
Look at your notes on the previous page, then identify and list the main topics that were discussed during this work session.
E Wind Power Per Season
3 3 Weather Patterns, Potential Wind, Average Wind Speed, Effect on TV Antennas Lines 2-17, 107-146 (Yellow)
Weather Weather Discussing the weather to identify the greatest wind potential energy when deciding which locations would be best and how the windmill will effect television reception. Science, technology, and mathematics content was used.
S – T – M
I We began to discuss the weather patterns in the ocean and coastal regions
3
F Weather is good 3 Considering the main topics you listed in question one, describe what Science, Technology, Engineering, and Mathematics (STEM) content you knew and what STEM content you did not know about each topic? (Content I knew)
I Weather and potential energy/m2 in the ocean
3 3
Considering the main topics you listed in question one, describe what Science, Technology, Engineering, and Mathematics (STEM) content you knew and what STEM content you did not know about each topic?
C Wind potential in ocean is great
3 3
E Wind power by session
3
I Weather on Poor Mountain
3

186
(Content I did not Know)
List any design constraints, design trade-offs, or design failures that you were confronted with during this work session.
F Is 200 w/m2 enough for a wind turbine
3 3
Considering the main topics you listed in question one, describe what Science, Technology, Engineering, and Mathematics (STEM) content you knew and what STEM content you did not know about each topic? (Content I knew)
C It could cost more to build in ocean
3 3 Life cycle costs, Material, Recyclability, Maintenance, Break-even point Lines 18-20, 34-53 (Bright Green)
Cost, Maintenance, Money, Construction costs, How much will it cost, Money is a constraint, Scale of project, How much one turbine costs, Government subsidies, Available money, Cost to ship everything and people, Government involvement, Profitability, Install cost
Cost Discussing the life cycle cost of the windmills at different locations. Technology content was used to determine the cost of materials and engineering content was used with mathematics content to generate the lifecycle costs of a wind turbine.
T – E – M
Considering the main topics you listed in question one, describe what Science, Technology, Engineering, and Mathematics (STEM) content you knew and what STEM content you did not know about each topic? (Content I did not know)
I Cost 3 3

187
List any design constraints, design trade-offs, or design failures that you were confronted with during this work session.
C Cost Constraints 3 3
Look at your notes on the previous page, then identify and list the main topics that were discussed during this work session.
E Environmental Impacts
3 3 Environmental Impacts, Noise, Eye Sore, CO2 Production, Greenhouse Gasses, Nitrogen Lines 53-57, 91-101 (Pink)
Winds change by season, Environmental impact, Environment, Environmental affects
Environmental Impacts
Discussing how the windmills will affect the environment. Science and technology content were used to understand weather patterns and emissions.
S – T
Considering the main topics you listed in question one, describe what Science, Technology, Engineering, and Mathematics (STEM) content you knew and what STEM content you did not know about each topic? (Content I did not know)
E Environmental Impacts
3 3
I Environmental Impacts
3
3 Feasibility Lines 67-70 (Red)
Feasibility, Potential energy, Could produce 20% of states power, Wind potential
Feasibility Discussing if the coastal project is even feasible. This included looking at all aspects of the coastal projects implementation. Therefore content was used from each STEM area.
S – T – E – M

188
energy, Worthwhile
3 Designs, Rating, Size of unit, Alternate Designs, Power Production, Nuclear Power, Reliability Lines 72-76, 149-188 (Teal)
Brainstorming, research, Basic understanding of windmills, Size, Construction, Technology
Designs Discussing which design of windmill might work best, comparing windmills to other forms of energy, and discussing how much potential energy could be generated from wind power. Content from each STEM area was used to look at a broad range of turbine designs and how each works.
S – T – E – M
3 Efficiency Lines 86 (Dark Yellow)
Statistical weather data from the ocean to compute watts per square meter
Efficiency Discussing the efficiency of the windmill. Science and technology content were used to generate statistical weather data. Then engineering and mathematics content was used to calculate the potential efficiency based on the computed watts per square meter of ocean water.
S – T – E – M
Considering the main topics you listed in question one, describe what Science, Technology, Engineering, and Mathematics (STEM) content you
I Area 3 3 Available Land, Spacing, Land Analysis Lines 87-90 (Blue)
Land, Area, How much area, Location, Available area, More available area in the ocean then
Location Discussing how much land is available at both locations. Science, technology and engineering content knowledge was used to review the available area to choose a location
S – T – E

189
Team 1 Week 3
knew and what STEM content you did not know about each topic? (Content I did not know)
on poor mountain so it’s a constraint, Comparison, Scale of project, Amount of land
which makes the most sense.
List any design constraints, design trade-offs, or design failures that you were confronted with during this work session.
E Land available 3 3
Log Question Participant Log Entry Design Phase Triangulation Data Abstraction Inference Content Code (S-T-E-M) Reported Observed Audio/Video Interviews
3 Efficiency, Plant designs, Steam plant, Thermo dynamics, CO2 production, Coal, Gas, Nuclear, Types of turbines, Turbine size, Transients, Reactive power, Offset of CO2 output Lines 2-21,
Which size turbine equates to the most efficiency
Efficiency
Discussing the efficiency of wind power as compared to coal, gas, and nuclear power. The conversation then changed to the scalability of wind turbines and the proportionate increase in power production based on size. A wind turbine also offsets it’s CO2 production in a half year. Content was used in science to understand the emissions of the energy sources,
S – T – E – M

190
122-139, 358-364 (Yellow)
Technology was used to review various plant designs and how the plants function. Finally, engineering and mathematics were used to understand transients and reactive power.
Look at your notes on the previous page, then identify and list the main topics that were discussed during this work session.
E Environmental Factors
5 3 Environmental Impacts, Killing birds, Construction, Erosion, Cleaner then coal, Endangered birds, Rain water funneling down, Landscaping, Broadcast antennas, Noise, Homes, Active vibration dampening, Fiberglass, Wave disruption Lines 22-46, 88-113, 197-215, 258-263 (Bright Green)
Myths, Birds got killed, Environment was bad, Negative environmental impact, Erosion, Possibly effect the environment in ways we hadn’t thought of, Bird deaths, Erosion could potentially be a limiting factor if it isn’t controlled, Active erosion controls, Bird deaths is a myth
Environmental Impacts
Discussing the environmental impacts of wind farms. Wind turbines have been shown to kill a small number of birds flying and can cause erosion if not installed correctly. Certain engineering techniques can be used to negate the erosion problem. Landscaping can also be done around the turbine to decrease erosion. The area around the wind turbines was discussed to review its impact. People living in that area may complain about noise and broadcast equipment may be affected as well. Science content was used to understand the geological impacts of wind turbines on the
S – T
I Environmental Impacts
3
F Bird Deaths are a Myth, Quiet, Drastically Cleaner then Coal
6
Considering the main topics you listed in question one, describe what Science, Technology, Engineering, and Mathematics (STEM) content you knew and what STEM content you did not know about each topic?
E Environmental Factors
5 3
F Erosion Issues 6
List any design constraints, design trade-offs, or design failures that you were confronted with during this work session.
I Some birds will get killed by blades
3 3
F Possible erosion issues
6

191
Explain how these design constraints, design trade-offs, or design failures led you to change your proposal.
F Active erosion control
6 3 land and the biological impacts on birds. Technology content was used to understand the impact of wind turbines on electrical systems in the area.
Given your response to question three, what is your prediction of how each design constraint, design trade-off, or design failure will affect your final proposal? Explain your answer.
I I think that birds are not a huge problem so our proposal won’t change
3 3
F Recommend erosion monitoring
6
Look at your notes on the previous page, then identify and list the main topics that were discussed during this work session.
I Available Area 3 3 Locations, Wind maps, Scale, Acers, Weather, Reactive Power, Transmission lines, Homes, International waters, Navy Lines 47-70, 167-188, 228-240, 438-455 (Turquoise)
Area, Expand the project, Didn’t know how many wind turbines to put at each location, Build as many wherever we can
Location
Reviewing where would be the best place to put the wind farm based on wind map estimates of annual wind production. The scale of the project and the acreage used also affects the final location. Weather and the turbines proximity to transmission lines is also a determining factor in choosing a location. The number of homes at each site was also reviews as well as the legal ramifications of putting turbines in international waters. Science content
S – T – E

192
knowledge was used to review wind maps to choose a location with maximum wind potential energy. Technology and engineering content knowledge was used to identify the most appropriate location for the project based on its impact to the local environment and its ability to tie into current systems.
Look at your notes on the previous page, then identify and list the main topics that were discussed during this work session.
E Turbine Design 5 3 Designs, Alternate designs, Versatility, Efficiency, Weather, Scalability Lines 71-85, 223-227 (Pink)
Wind power in general, Feasibility, Wind VAR, Power electronics package, Reactive power, How the grid actually works, How the grid responds to wind power, Adjustable turbine blades to reduce damage, Size of turbines, Technology, Money math
Design Discussing various wind turbine designs that are efficient and most resistant to bad weather such as tornadoes. This will help determine the scalability of various designs. Science content was used to understand weather patterns at various locations to determine the types of turbines that would work best. Technology, engineering, and mathematics content was used to review alternate designs which would hypothetically produce the maximum amount of power.
S – T – E – M
Considering the main topics you listed in question one, describe what Science, Technology, Engineering, and Mathematics (STEM) content you knew and what STEM content you did not know about each topic?
C Wind turbines can be designed with movable blades to reduce high-wind damage
3,4,5 3
E Design 5
List any design constraints, design trade-offs, or design failures that you were confronted
F Turbine size vs. Efficiency
6 3

193
with during this work session.
Explain how these design constraints, design trade-offs, or design failures led you to change your proposal.
F Recommend large turbines
6 3
Given your response to question three, what is your prediction of how each design constraint, design trade-off, or design failure will affect your final proposal? Explain your answer.
F Large turbines 6 3
Look at your notes on the previous page, then identify and list the main topics that were discussed during this work session.
G Cost, feasibility, political support
4,5 3 Cost, Competitive, Becoming cheaper, Technology, Budgetary constraints, Available money, Cost for 1 windmill, Bulk discount, Government subsidies, Overhead
Cost, Money, Profit, Overhead cost, Government support, Subsidies, Scaling and production can lower costs, Affordability, Cost of the project, Money is a
Cost
Discussing how wind energy has dropped in cost by 80% over the past 20 years and it is now competitive with other form of energy such as coal. As technology improves so will the cost of each wind turbine. Participants also discussed what one windmill would cost so that they could figure out what an entire wind farm
T – E – M
E Cost 5
I Cost of Windmills
3
F Wind Turbine Cost are Dropping
6
Considering the main topics you listed in question one, describe what Science, Technology, Engineering, and
G Knew some basics on cost, More specific cost figures and whether it could be funded
4,5 3
E Cost 5

194
Mathematics (STEM) content you knew and what STEM content you did not know about each topic?
F Scaling and production can lower costs, Actual Cost
6 cost, Break-even point, Cost projection, Engineering economy, Maintenance, Cost analysis, Lifecycle cost, Profitability, Lines 115-121, 159-166, 241-256, 265-275, 279-357, 365-437 (Red)
controlling factor, Government grants and money, 30% of like 300 or like 500 million is a lot of money, Financially viable, The more you build the more money you can make, The project will pay itself off pretty quickly, Cost is not a barrier, Relationship between cost and size, Convincing the government that the project would be profitable, Time value of money
would potentially cost. They found that the government would subsidies a percentage of the project so they began to consider how they would ask for the money and decided to do a lifecycle cost projection. Participants also looked at the profitability by reducing cost for the power company by using wind energy. Content in engineering was used by looking at the engineering economy and producing lifecycle cost projections. Mathematics content was used to develop the lifecycle projections and technology content was used to look at the cost vs. benefit of alternative designs.
I If we can get gold substitutes, The Potential Profits, Maintenance Costs, Overhead Costs
3
List any design constraints, design trade-offs, or design failures that you were confronted with during this work session.
C Budget 3,4,5 3 G Constraints –
Money, where to build it
4,5
I Cost 3
Explain how these design constraints, design trade-offs, or design failures led you to change your proposal.
C We are looking more into the costs and pay backs
3,4,5 3
E Budget Constraints
5
Given your response to question three, what is your prediction of how each design constraint, design trade-off, or design failure will affect your final proposal? Explain your answer.
E Budget constraints will affect the scale of the project, less money = fewer turbines
5 3

195
Look at your notes on the previous page, then identify and list the main topics that were discussed during this work session.
I Weather 3 3 Weather, Wind speed, Potential wind energy Lines 140-157 (Green)
Storms Weather
Discussing the weather at various locations and the potential wind energy. The range of average wind speed was also calculated. Science content was used to understand the weather patterns at various locations. Technology and mathematics content was used to generate a better understanding of wind potential energy.
S – T – M
Considering the main topics you listed in question one, describe what Science, Technology, Engineering, and Mathematics (STEM) content you knew and what STEM content you did not know about each topic?
F Few storms off VA
6 3

196
Team 1 Week 4
Log Question Participant Log Entry Design Phase Triangulation Data Abstraction Inference Content Code (S-T-E-M) Reported Observed Audio/Video Interviews
Look at your notes on the previous page, then identify and list the main topics that were discussed during this work session.
F Wind VAR 6 3
Designs, New Model, Metric, Maintenance, Wind VAR, Stabilization of power grid, Power electronics, Voltage, Power factor, Installation, Modular construction, Transportation of parts Lines 2-18, 104-157 (Yellow)
Wind power in general, Feasibility, Wind VAR, Power electronics package, Reactive power, How the grid actually works, How the grid responds to wind power, Adjustable turbine blades to reduce damage, Size of turbines, Technology, Money math
Design Discussing a new model of wind turbine and converting its stated height to metric. Wind VAR was also discussed which, is a method of stabilizing a power grid through wind energy. Lastly, the construction and transportation of wind turbines was discovered to be a modular process. Science, technology, and engineering content were used to understand the benefits of different wind turbine configurations. Mathematics content was used to calculate the energy production of the wind turbine.
S – T – E – M
Considering the main topics you listed in question one, describe what Science, Technology, Engineering, and Mathematics (STEM) content you knew and what STEM content you did not know about each topic?
F VAR and Grid dynamics
6
Look at your notes on the previous page, then identify and list the main topics that were discussed during this work session.
C Finish up cost discussion
6 3 Cost, Government support, Overhead cost, Comparison, Instillation
Cost, Money, Profit, Overhead cost, Government support,
Cost
Discussing the cost of the wind farm project compared to other countries that already have similar projects in place. Participants also discussed the
T – E – M
G Cost, Maintenance, Government Support
5, 6
E Cost, Profit 6

197
I Cost of Windmill, Overhead costs, Average profits, government support
6 over time, Average cost of power, Instillation cost, Average cost per kilowatt hour, Reactive power, Profits Lines 19-70, 95-102. 159-340 (Bright Green)
Subsidies, Scaling and production can lower costs, Affordability, Cost of the project, Money is a controlling factor, Government grants and money, 30% of like 300 or like 500 million is a lot of money, Financially viable, The more you build the more money you can make, The project will pay itself off pretty quickly, Cost is not a barrier, Relationship between cost and size, Convincing the government
average cost of energy and tried to calculate it for a year. Mathematics content was used to calculate the average cost of energy for one year. Technology and engineering content was used to determine the overhead cost and lifecycle needs of wind turbines.
F Economic viability
6
Considering the main topics you listed in question one, describe what Science, Technology, Engineering, and Mathematics (STEM) content you knew and what STEM content you did not know about each topic?
C Had a good idea of the overall cost and profit of a single windmill, The government will provide around 30% of cost
6 3
G Government Support; Some Cost, Some specifics on cost
5, 6
I We knew the overhead costs – We figured out the average yearly profits and government support was 30% of costs
6
F Economic Data 6
List any design constraints, design trade-offs, or design failures that you were confronted with during this work session.
G Government Grants
5, 6 3
E Gov constraints 30%
6
I Profits of 1 million per year, government funds 30%
6

198
F Cost, Government will subsidize
6 that the project would be profitable, Time value of money
Explain how these design constraints, design trade-offs, or design failures led you to change your proposal.
G Gave more money available to spend
5, 6 3
E Increases scale, allows us to extend beyond the budget
6
F Build more turbines
6
Given your response to question three, what is your prediction of how each design constraint, design trade-off, or design failure will affect your final proposal? Explain your answer.
E More windmills 6 3 I It will allow us
to build more windmills at a cheaper cost. It will be easier to convince the senate to support us if we will make money
6
F Build more turbines
6
3 Location, Distance off shore, Cable resistance, Depth, Continental shelf, Anchor Lines 71-93 (Turquoise)
Area, Expand the project, Didn’t know how many wind turbines to put at each location, Build as many wherever we can
Location
Discussing the off shore project. Science, technology, and engineering content were used to determine the logistics of putting wind turbines off shore.
S – T – E
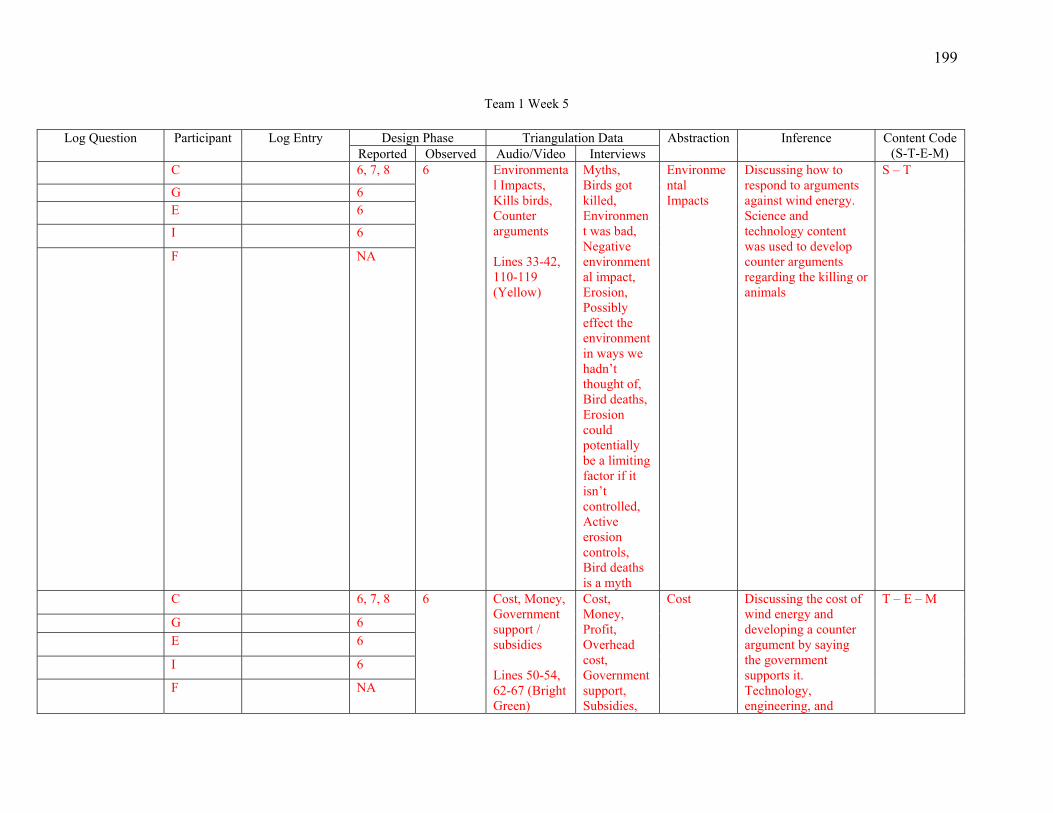
199
Team 1 Week 5
Log Question Participant Log Entry Design Phase Triangulation Data Abstraction Inference Content Code (S-T-E-M) Reported Observed Audio/Video Interviews
C 6, 7, 8 6 Environmental Impacts, Kills birds, Counter arguments Lines 33-42, 110-119 (Yellow)
Myths, Birds got killed, Environment was bad, Negative environmental impact, Erosion, Possibly effect the environment in ways we hadn’t thought of, Bird deaths, Erosion could potentially be a limiting factor if it isn’t controlled, Active erosion controls, Bird deaths is a myth
Environmental Impacts
Discussing how to respond to arguments against wind energy. Science and technology content was used to develop counter arguments regarding the killing or animals
S – T
G 6 E 6
I 6
F NA
C 6, 7, 8 6 Cost, Money, Government support / subsidies Lines 50-54, 62-67 (Bright Green)
Cost, Money, Profit, Overhead cost, Government support, Subsidies,
Cost
Discussing the cost of wind energy and developing a counter argument by saying the government supports it. Technology, engineering, and
T – E – M
G 6 E 6
I 6
F NA

200
Scaling and production can lower costs, Affordability, Cost of the project, Money is a controlling factor, Government grants and money, 30% of like 300 or like 500 million is a lot of money, Financially viable, The more you build the more money you can make, The project will pay itself off pretty quickly, Cost is not a barrier, Relationship between cost and size, Convincing the government that the project would be
mathematics content were used to create a cost/benefit comparison.

201
profitable, Time value of money
C 6, 7, 8 6 Designs, Lifecycle, Types, Prototypes, How wind energy works, Transient power Lines 57-58, 79-94 (Turquoise)
Wind power in general, Feasibility, Wind VAR, Power electronics package, Reactive power, How the grid actually works, How the grid responds to wind power, Adjustable turbine blades to reduce damage, Size of turbines, Technology, Money math
Design Discussing the need to include a portion in their presentation about how wind energy works and various designs. STEM content was used to describe how wind energy works and its advantages.
S – T – E – M
G 6
E 6
I 6
F NA

202
Team 1 Week 6
Log Question Participant Log Entry Design Phase Triangulation Data Abstraction Inference Content Code (S-T-E-M) Reported Observed Audio/Video Interviews
Considering the main topics you listed in question one, describe what Science, Technology, Engineering, and Mathematics (STEM) content you knew and what STEM content you did not know about each topic?
F Time value of money
9 6 Cost, Cost vs. output, Cost vs. distance, Total output, Amount of turbines, Capacity, Material limitations, Fewer more powerful turbines, Other countries trials, Growth of wind energy profits, Overhead, Energy produced Lines 86-97, 255-277, 426-456, 531-552, 571-593 (Yellow)
Cost, Money, Profit, Overhead cost, Government support, Subsidies, Scaling and production can lower costs, Affordability, Cost of the project, Money is a controlling factor, Government grants and money, 30% of like 300 or like 500 million is a lot of money, Financially viable, The more you build the more money you can make, The project will pay itself off pretty
Cost
Discussing the total output of wind energy factoring in the amount of turbines and the capacity for each. They went on to look at whether fewer more powerful turbines or more less powerful turbines was most cost effective. They finally looked at the comparison of what other countries have found with regards to the profitability of wind power. Technology content was used to review the materials strength of different wind turbine designs. Engineering and mathematics content was used to develop engineering economy figures with regard to lifecycle cost.
T – E – M
List any design constraints, design trade-offs, or design failures that you were confronted with during this work session.
F Correlation between unit size/output + cost
9 6
Given your response to question three, what is your prediction of how each design constraint, design trade-off, or design failure will affect your final proposal? Explain your answer.
F Appears to have a time value of money component – not sure
9 6

203
quickly, Cost is not a barrier, Relationship between cost and size, Convincing the government that the project would be profitable, Time value of money
Considering the main topics you listed in question one, describe what Science, Technology, Engineering, and Mathematics (STEM) content you knew and what STEM content you did not know about each topic?
F Advantages of wind power
9 6 Feasibility, Advantages, Stabilizing the power grid, Producing reactive power with no wind, Extremely low greenhouse gas production Lines 460-476 (Bright Green)
Feasibility, Advantages, Reactive power, Wind VAR
Feasibility
Discussing the advantages of wind power for the final project presentation. STEM content knowledge was used to develop a list of advantages based on environmental impacts, technological impacts, and economic impacts.
S – T – E – M
6 Efficiency, Advantages, Greenhouse production, Lifecycle, Power generation,
Which size turbine equates to the most efficiency
Efficiency
Discussing the efficiency of wind power over the lifecycle compared to other forms of energy. Efficiency was calculated using
S – T – E – M

204
Planetary entropy Lines 477-501 (Turquoise)
mathematics content and based on several energy sources. Science, technology, and engineering content were used to develop a list of advantages based on efficiency.
6 Environmental Impacts, Life cycle greenhouse gas production, CO2 offset, Recyclable material, Erosion, Killing birds, Noise, Eye sore, Misconceptions, Counter arguments Lines 502-526, 594-610, 634-642 (Pink)
Myths, Birds got killed, Environment was bad, Negative environmental impact, Erosion, Possibly effect the environment in ways we hadn’t thought of, Bird deaths, Erosion could potentially be a limiting factor if it isn’t controlled, Active erosion controls, Bird deaths is a myth
Environmental Impacts
Discussing the environmental advantages of wind power including low greenhouse gas emissions and that wind turbines are made of recyclable materials. They went on to discuss counter arguments and misconceptions that people have about wind energy. Science content was used to understand the greenhouse gas emissions, erosion, and impacts on animals. Technology content was used to understand the material advantages of wind energy.
S – T

205
Appendix U
Data Matrix Team 2

206
Exercise for Bone Health: A recent report in the New York Times raised questions about the types of exercise individuals should engage in to maintain healthy bones. Confused by the conflicting findings reported in the magazine, a group of family physicians has asked your biomechanics research group to come give a talk at their next monthly meeting. They’d like your group to give them guidelines that they can use for recommending exercise programs for their older patients in particular. Note that these doctors are general practitioners, not orthopedists or gerontologists or related specialists. They are concerned both about what kinds of exercise will help their patients and about what exercises they can reasonably expect their patients to engage in.

207
Team 2: Week 1
Log Question Participant Log Entry Design Phase Triangulation Data Abstraction Inference Content Code (S-T-E-M) Reported Observed Audio/Video Interviews
3 Requirements, Research, Figure out what we are doing, Individual research, The problem, Meeting, Background Lines 2-12, 40-79
Design Process
Participants discussed how they should begin reviewing the problem and how to ultimately find a solution. Science and mathematics content were used to help participants understand the technical aspects of the problem of bone density. Technology and engineering were used to describe the design process being used.
S – T – E – M
Look at your notes on the previous page, then identify and list the main topics that were discussed during this work session.
A NY Times article (What causes bones to be stronger/weaker), bone fluids
1, 3 3 Running, joints, knees, hips, energy, brisk walking, swimming, resistance, water aerobics, mechanisms, fluid in bones, designing exercise
Preliminary ideas, What information there is, Basic ideas, Frame the criteria, Find articles, information, Audience, Research, Bone strength exercises,
Exercise Rigor
What needed to be researched to help frame a bone health exercises routine. Bone strength and exercise derive from anatomy and physiology as well as biology content. Participants therefore pulled knowledge from science. Participants also used engineering content to
E - S
D Bone strength, what exercises affect it
3
H NY Times article (Article about designing exercises to increase bone health)
3

208
Considering the main topics you listed in question one, describe what Science, Technology, Engineering, and Mathematics (STEM) content you knew and what STEM content you did not know about each topic?
A More explosive activities seem to be better for bones, Swimming and cycling is bad possible
1, 3 / 3 / 3
3 Lines 15-39 (Yellow)
Physical aspect of the workout, Elderly could do, Intense, Accessibility, Constraints,
conceptualize the problem and aid in its development
D Bone strength exercises
H Bone strength exercises

209
Team 2: Week 2
Log Question Participant Log Entry Design Phase Triangulation Data Abstraction Inference Content Code (S-T-E-M) Reported Observed Audio/Video Interviews
List any design constraints, design trade-offs, or design failures that you were confronted with during this work session.
A Nutrition 2 3
Supplements, Calcium, Exercising, Genetics Lines 6-10, 23-29, 126-131 (Yellow)
Supplements, Affective
Supplements
Discussing how supplements could be used in conjunction with traditional exercises to increase bone health. Knowledge was used primarily from anatomy and physiology therefore the primary content area used was science.
S
Explain how these design constraints, design trade-offs, or design failures led you to change your proposal.
A Maybe include something on supplements
2
Considering the main topics you listed in question one, describe what Science, Technology, Engineering, and Mathematics (STEM) content you knew and what STEM content you did not know about each topic?
B Exercises, Best exercises
2 3
Exercise Rigor, High Impact, Low Impacts, Older People, Power Walking, Dancing, Tennis, Walking up stairs, Exercise impact, Swimming, Front leg muscles, Bone structure deformation to increase
Journal sources, Technology, Biology, Anatomy, Bone density exercises, Strength exercises, Best exercises
Exercise Rigor
Discussing the level of difficulty (impact) that a person should be exposed to when trying to increase bone density. Participants reviewed different types of exercises and their ability to increase bone density. Participants used engineering content to conceptualize the problem and aid in its development. They also used science content to understand which exercises would be most beneficial for bone health.
E - S
List any design constraints, design trade-offs, or design failures that you were confronted with during this work session.
A Intensity 2

210
Given your response to question three, what is your prediction of how each design constraint, design trade-off, or design failure will affect your final proposal? Explain your answer.
A Direct us away from certain exercises and towards a possible workout routine
2 bone density, Normal force, Bone bending Lines 13-22, 97-115 (Bright Green)
Look at your notes on the previous page, then identify and list the main topics that were discussed during this work session.
A Framing solution 2 3 Problem statement, Steps 1/2/3, Frame the problem, Presentation, Marketing, technical, friendly version Lines 31-44, 116-125
Preliminary ideas, Research, things that it had to be, it didn’t have to be, Interchangeable, Figure out what must be present for it to work, Frame the criteria, Technology
Design Process
Participants discussed where they were in the overall design process and how to proceed. They also discussed how they would eventually present the results and the need to market the information correctly and in a friendly way. Science and mathematics content were used to help participants understand the technical aspects of the problem of bone density. Technology and engineering were used to describe the design process being used.
S – T – E – M
B frame criteria for the final solution
2
H Framing solution 2
Considering the main topics you listed in question
A What constraints should be (values)
2 3 Exercise Constraints, Length of
Research, Constraints, Audience,
Exercise Constraints
Participants reviewed constraints that would influence their
S – T – E – M

211
one, describe what Science, Technology, Engineering, and Mathematics (STEM) content you knew and what STEM content you did not know about each topic?
B Osteoporosis is when people have weak bones, How to prevent osteoporosis
2 time, Frequency of exercises, Physical Limitations, How strenuous, Amount of Impact, Rigor, Accessibility to equipment, Instruction, Programs, Community Center, Osteoporosis, Women, Small bone density, Post-Menopausal women Lines 45-68, 79-96, 134-148 (Turquoise)
Osteoporosis, Problems with bones, Limited mobility, Journal Entries, Elderly, Bone density in elderly women was generally worse than men, Location, Restrict our solution, Accessibility, Amount of exercise, Bone Health, Frequency, Workout programs, Equipment, Varying bone density, Different exercises for different people based on individual bone density, Multiple regiments
exercise recommendations. These constraints included the accessibility to facilities, frequency and rigor of exercises, and pre-existing conditions. Participants used content in science to understand the affect pre-existing conditions can have on exercising. They also used Engineering content to conceptualize the problem and aid in its development. Technology and Mathematics content was also used to help with the logistics and frequency of the exercise regimens.
H War Memorial accessibility for Blacksburg residence
2
List any design constraints, design trade-offs, or design failures that you were confronted with during this work session.
A Frequency, Accessibility
2
B One was accessibility of whatever solution we implement; people need to be able to do this in the Blacksburg community
2
H Frequency of exercising, accessibility to equipment, programs
2
Given your response to question three, what is your prediction of how each design constraint, design trade-off, or design failure will affect your final proposal? Explain your answer.
H The constraints will direct us toward a less vague and general solution
2
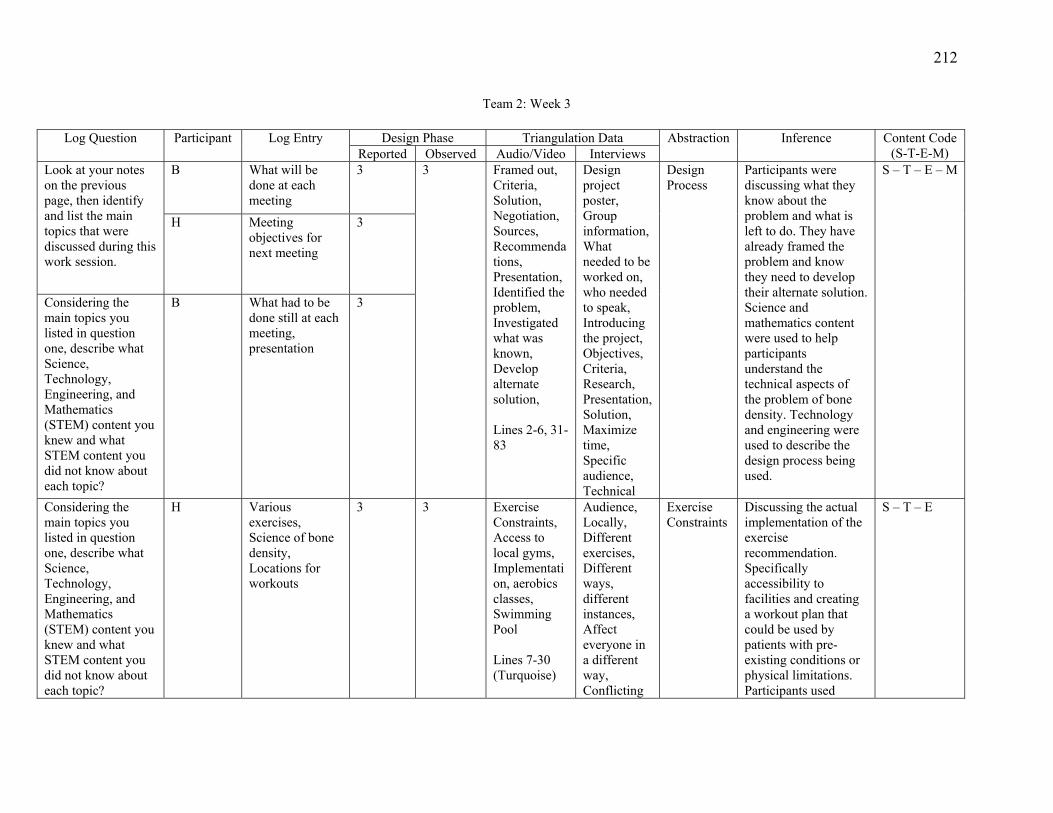
212
Team 2: Week 3
Log Question Participant Log Entry Design Phase Triangulation Data Abstraction Inference Content Code (S-T-E-M) Reported Observed Audio/Video Interviews
Look at your notes on the previous page, then identify and list the main topics that were discussed during this work session.
B What will be done at each meeting
3 3 Framed out, Criteria, Solution, Negotiation, Sources, Recommendations, Presentation, Identified the problem, Investigated what was known, Develop alternate solution, Lines 2-6, 31-83
Design project poster, Group information, What needed to be worked on, who needed to speak, Introducing the project, Objectives, Criteria, Research, Presentation, Solution, Maximize time, Specific audience, Technical
Design Process
Participants were discussing what they know about the problem and what is left to do. They have already framed the problem and know they need to develop their alternate solution. Science and mathematics content were used to help participants understand the technical aspects of the problem of bone density. Technology and engineering were used to describe the design process being used.
S – T – E – M
H Meeting objectives for next meeting
3
Considering the main topics you listed in question one, describe what Science, Technology, Engineering, and Mathematics (STEM) content you knew and what STEM content you did not know about each topic?
B What had to be done still at each meeting, presentation
3
Considering the main topics you listed in question one, describe what Science, Technology, Engineering, and Mathematics (STEM) content you knew and what STEM content you did not know about each topic?
H Various exercises, Science of bone density, Locations for workouts
3 3 Exercise Constraints, Access to local gyms, Implementation, aerobics classes, Swimming Pool Lines 7-30 (Turquoise)
Audience, Locally, Different exercises, Different ways, different instances, Affect everyone in a different way, Conflicting
Exercise Constraints
Discussing the actual implementation of the exercise recommendation. Specifically accessibility to facilities and creating a workout plan that could be used by patients with pre-existing conditions or physical limitations. Participants used
S – T – E

213
List any design constraints, design trade-offs, or design failures that you were confronted with during this work session.
B The physical capabilities of patients. Maybe being able to do one exercise very well, but maybe not participate in another
3 solutions, locations, Pre-existing conditions, Solution tailored to each case, Every person is different, One workout plan may not be suitable for everyone, Physical capabilities, Access
content in science to understand the affect pre-existing conditions can have on exercising. They also used Engineering content to conceptualize the problem and aid in its development. Technology content was used to help with the logistics of implementing the exercise regimens.
H The physical capabilities of the audience
3
Explain how these design constraints, design trade-offs, or design failures led you to change your proposal.
B It changed our thinking of the proposal because instead of having one set solution we could have multiple options
3
H Need more exercise regimes to deal with varying bone health in individuals
3
Given your response to question three, what is your prediction of how each design constraint, design trade-off, or design failure will affect your final proposal? Explain your answer.
H This will lead to a better solution to serve a larger range of people
3
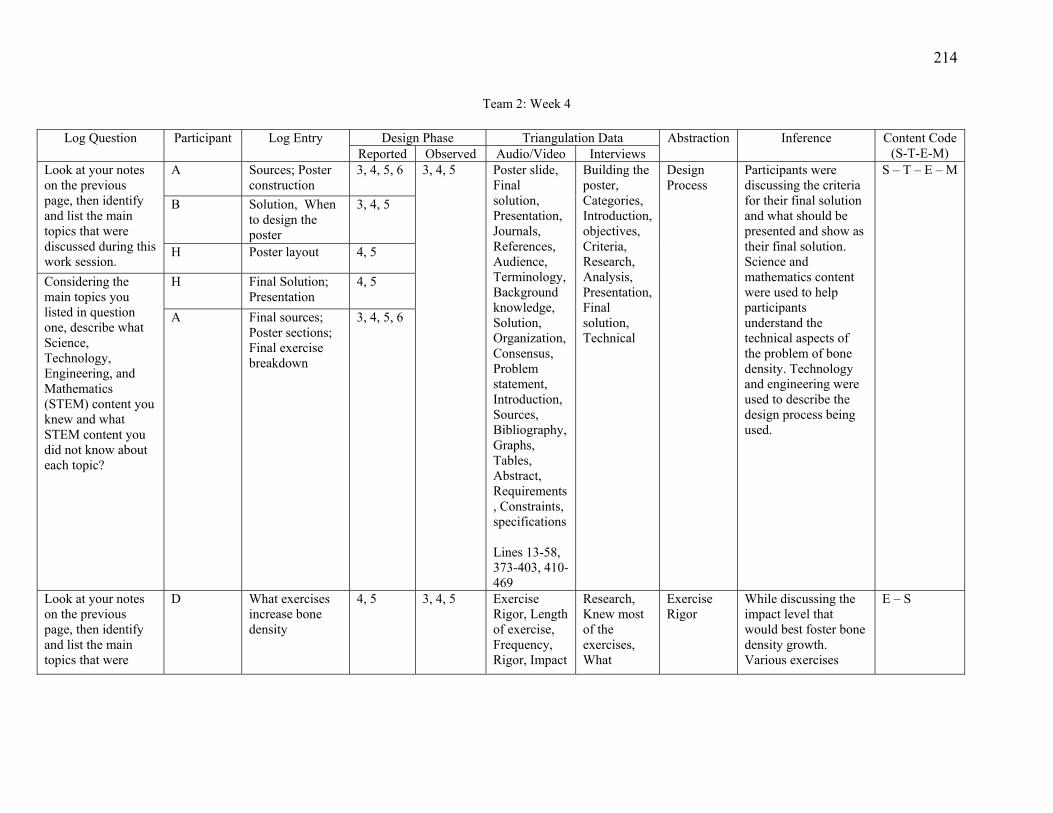
214
Team 2: Week 4
Log Question Participant Log Entry Design Phase Triangulation Data Abstraction Inference Content Code (S-T-E-M) Reported Observed Audio/Video Interviews
Look at your notes on the previous page, then identify and list the main topics that were discussed during this work session.
A Sources; Poster construction
3, 4, 5, 6 3, 4, 5 Poster slide, Final solution, Presentation, Journals, References, Audience, Terminology, Background knowledge, Solution, Organization, Consensus, Problem statement, Introduction, Sources, Bibliography, Graphs, Tables, Abstract, Requirements, Constraints, specifications Lines 13-58, 373-403, 410-469
Building the poster, Categories, Introduction, objectives, Criteria, Research, Analysis, Presentation, Final solution, Technical
Design Process
Participants were discussing the criteria for their final solution and what should be presented and show as their final solution. Science and mathematics content were used to help participants understand the technical aspects of the problem of bone density. Technology and engineering were used to describe the design process being used.
S – T – E – M
B Solution, When to design the poster
3, 4, 5
H Poster layout 4, 5
Considering the main topics you listed in question one, describe what Science, Technology, Engineering, and Mathematics (STEM) content you knew and what STEM content you did not know about each topic?
H Final Solution; Presentation
4, 5
A Final sources; Poster sections; Final exercise breakdown
3, 4, 5, 6
Look at your notes on the previous page, then identify and list the main topics that were
D What exercises increase bone density
4, 5 3, 4, 5 Exercise Rigor, Length of exercise, Frequency, Rigor, Impact
Research, Knew most of the exercises, What
Exercise Rigor
While discussing the impact level that would best foster bone density growth. Various exercises
E – S

215
discussed during this work session.
H Exercises effective for increasing bone density
4, 5 level, Jumping, Pre-existing conditions, Impact, Balance, Weight baring exercises, Water aerobics, Gardening, Stair climbing, High impact, Muscles, Jogging, Jumping rope, Work, Dancing, Osteoblast, Bone cells, Stress, Rotate exercise program, Coordination, Prevent falls, non-impact activities, Posture, Cycling, Core joints, Joint intensive, Aerobics, Lines 61-63, 71-178, 198-272 (Bright Green)
exercise you have, How much, How long
were discussed and debated for their usefulness in achieving this goal. Participants used engineering content to conceptualize the problem and aid in its development. They also used science content to understand which exercises would be most beneficial for bone health.
Considering the main topics you listed in question one, describe what Science, Technology, Engineering, and Mathematics (STEM) content you knew and what STEM content you did not know about each topic?
D High impact exercises are good
4, 5
B Conflicting solutions (Water exercise)
3, 4, 5
List any design constraints, design trade-offs, or design failures that you were confronted with during this work session.
B Doing these exercises might make another ailment they have worse
3, 4, 5
H Some people have better bone health than others
4, 5

216
Considering the main topics you listed in question one, describe what Science, Technology, Engineering, and Mathematics (STEM) content you knew and what STEM content you did not know about each topic?
B Basic background on osteoporosis exercises, People’s other ailments can get in the way of solutions
3, 4, 5 3, 4, 5 Exercise Constraints, Accessibility, Do at home, Running, Jumping, Frequency, Aerobic muscle strength Lines 64-70. 179-191 (Turquoise)
Location, Audience, Different exercises, Different ways, Different intensities, Affect everyone in a different way, Conflicting solutions, Availability, Peoples aliments could be a big factor, Solution tailored to individual cases, Physical capabilities, Access
Exercise Constraints
While discussing patients’ accessibility to facilities to conduct their exercise programs. The length and frequency of exercises was also discussed to achieve the best possible results. Participants used content in science to understand the affect pre-existing conditions can have on exercising. They also used Engineering content to conceptualize the problem and aid in its development. Technology and Mathematics content was used to help with the logistics of implementing the exercise regimens.
S – T – E – M
H Exercises, Frequency of exercises; Locations
4, 5
D Specific exercises, Frequency-Duration of exercises
4, 5
Look at your notes on the previous page, then identify and list the main topics that were discussed during this work session.
B How we should group suggestions
3, 4, 5 3, 4, 5 Exercise Plans, Work out plan, Customizable, Categories, Jumping, Climbing stairs, Walking, Jogging, Gardening,
Information that would help bone density, Kinds of exercises, Specific exercises, Exercise plan, Other exercises
Exercise Plans
While discussing the groups’ final solution. After considering several exercises and those with pre-existing conditions, the group decided to make a three-tiered plan which doctors can use to make exercise recommendations on a
S – T – E
D How we can organize our recommendation, Solution – “Guidelines” so that doctor can make a tailored solution
4, 5

217
Considering the main topics you listed in question one, describe what Science, Technology, Engineering, and Mathematics (STEM) content you knew and what STEM content you did not know about each topic?
A High impact exercises for bones, low impact for those who can’t do them
3, 4, 5, 6 Classes, Water aerobics, Step aerobics, Dance class, Intensity, Guidelines, Specific programs, Low intensity option, High intensity option, Patient specific, Strength training, Things you can do on your own, Things you can do in a group or class, Don’t directly affect bone density but help prevent injury, Lines 273-330, 404-409 (Gray)
might actually help in the long term but might not directly affect bone health, One workout is not going to be suitable for everyone, Gym exercises, Non-gym exercises, Group into levels, intensity, and access to equipment, Suggestions or guidelines, General instead of specific, Broad range of exercise, Increase ability to exercise, More intensive exercises,
case by case basis. Participants used content in science to make a three tiered exercise recommendation based on bone density needs and accessibility to equipment. Technology and engineering content was used to help conceptualize the problem and to help with the logistics of implementing the exercise regimen.
B How to group our findings
3, 4, 5
List any design constraints, design trade-offs, or design failures that you were confronted with during this work session.
A Some exercises may not help bone density, but may help in leading to be able to do other exercises
3, 4, 5, 6
B Each patients specific case
3, 4, 5
D Cannot make one exercise plan to work for everyone
4, 5
Explain how these design constraints, design trade-offs, or design failures led you to change your proposal.
A Exercises should be able to be done without access to a gym
3, 4, 5, 6
B Instead of having one definitive solution, we decided to make them more like the suggestions
3, 4, 5

218
D We decided to make guidelines instead of a workout plan so the doctor can make the specific exercise plan
4, 5 People who can’t use the gym, People who wouldn’t be able to do the exercises, Not one single solution, Safety, Doctors could tailor exercises to specific patients
H Need multiple exercises to cater to people with various bone health
4, 5
Given your response to question three, what is your prediction of how each design constraint, design trade-off, or design failure will affect your final proposal? Explain your answer.
A The final proposal will have several categories of exercises and many options. There should be several exercises that can be done without access to equipment
3, 4, 5, 6
B It will make our proposal a little more vague, but at least we can have researched solutions that doctors can pick from for their patients
3, 4, 5
D Our proposal will be more general and less specific then we originally knew
4, 5

219
H Makes final solution need to be flexible to deal with people with varying bone densities
4, 5
3, 4, 5 Age groups, Children, Teens, Adults, Young adults late 20’s to early 30’s, Middle aged or older adults after 40, Elderly Lines 332-351 (Teal)
Age Range For Elderly Adults
While discussing various exercises the group decided to look into what defines an elderly person. To this end an age range was identified and elderly people were defined as those above the age of 40. Science and mathematics content was used to review what makes a person elderly from a physiological standpoint.
S – M

220
Team 2: Week 5
Log Question Participant Log Entry Design Phase Triangulation Data Abstraction Inference Content Code (S-T-E-M) Reported Observed Audio/Video Interviews
Look at your notes on the previous page, then identify and list the main topics that were discussed during this work session.
A Poster development
5, 6 5, 6 Poster, Introduction, Abstract, Conclusions, Frame the problem, Objective, Method, Tables and graphs, Limitations, Requirements, Criteria, Solution, Research, Identify the problem, Investigate what is known, Develop alternate solutions, Choose appropriate solution, Presentation, Problem statement, Bullet points, Layout, Limitations, Constraints, Groups, Logistics, Sources,
Poster, Categories, Information, Presentation, Introduction, Objectives, Criteria, Structure, Research, Solutions, Maximize time, Technical
Design Process
Participants discussed their final poster presentation and all the elements that needed to be discussed and presented. Science and mathematics content were used to help participants understand the technical aspects of the problem of bone density. Technology and engineering were used to describe the design process being used.
S – T – E – M
B Design project poster; Objectives/Abstract/Criteria; Research; Solution/Suggestion/Logistics
7
D How to make the poster slide
5
H Final Presentation
5
Considering the main topics you listed in question one, describe what Science, Technology, Engineering, and Mathematics (STEM) content you knew and what STEM content you did not know about each topic?
B Content to put on poster; How to group content; Titles of groupings
7

221
Summarize sources, Lines 2-198, 214-282, 307-331, 352-436
A 5, 6 5, 6 Exercise Plans, Organization, General, Time modifier, Genetics, Lines 199-213 (Gray)
Exercise Plans
Discussing making the final solution as a set of general recommendations that doctors can use with patients on a case by case basis to foster increased bone density. Pre-existing conditions and genetics also play a factor in each case. Participants used content in science to make a three tiered exercise recommendation based on bone density needs and accessibility to equipment. Technology and engineering content was used to help conceptualize the problem and to help with the logistics of implementing the
S – T – E – M
B 7 D 5 H 5

222
exercise regimen. Mathematics content was used to develop a time modifier based on age.
A 5, 6 5, 6 Logistics, Suggestions, Local implementation, Things that can be done at home, Things you go to the gym for, Tennis court Lines 283-306 (Dark Yellow)
Logistics Discussing how the exercise plan will actually be implemented once doctors give it to patients. This includes access to local gyms and things that patients can do on their own. Technology and engineering content was used to help conceptualize the problem and to help with the logistics of implementing the exercise regimen.
T – E B 7 D 5 H 5
A 5, 6 5, 6 Exercise Rigor, High impact exercises, Strength training, Promote regular health, Yoga, Preventative exercise, Bending, Running, Jumping Lines 332-351 (Bright Green)
Exercise Rigor
Discussing the impact of exercises relative to an increase in bone density. The group was making a final validation of the chosen solution and its tiered rigor system. Participants used engineering content to conceptualize the problem and aid in its development. They also used science content to understand which exercises would be most beneficial for bone health.
E – S
B 7 D 5 H 5

223
Appendix V
Final Design Log Instrument

224
Design Log
Design Project: ___________________ Name: __________________________

225
1
9
8
7
6 5
4
3
2

226
Background: Design and Inquiry are processes that we use every day to either solve a human need or better understand the world around us. Design helps to solve human problems and recreate a world that fits our needs. In this effort, we use tools and materials to purposefully construct artifacts and systems that meet those needs. Inquiry helps to better understand the natural world and make sense of it. To make sense of the natural world experiments are conducted that are meant to answer some hypothesis about how a natural phenomena occurs. Design and Inquiry have a unique relationship in that Inquiry is an inherent process within design. The image found on the previous page and on all subsequent pages is a combined process incorporating both elements of design and inquiry. As you go through the formal process of design mini-inquiry experiments occur to better understand how certain design considerations will work in the system. An example could be generating a hypothesis regarding the tensile strength of a material and then testing that hypothesis before incorporating that material into the design. Directions: At the beginning of each work session, open to a new Design Log page. Here you will find a space to take notes while you work. These notes are meant to help you answer the prompting questions at the end of your work session. At the conclusion of your work session take five to ten minutes to respond to the prompting questions. Begin by identifying which phase(s) of the design process you are currently engaged in. Do this by circling the phase(s) on the Technological Design/Inquiry Loop found on the same page as the notes, then respond to the questions. Respond to the questions to the best of your ability and as completely as possible. When you are done please sit quietly until everyone has finished.

227
Notes:
Which phase(s) of the design process are you currently engaged in? Please circle the phase(s).
1
8
7
6 5
4
3
2 9

228
1. Look at your notes on the previous page, then identify and list the main topics that were discussed during this work session.
2. Considering the main topics you listed in question one, describe what Science, Technology, Engineering, and Mathematics (STEM) content you knew and what STEM content you did not know about each topic?
Content I Knew Content I Did Not Know
3. List any design constraints, design trade-offs, or design failures that you were
confronted with during this work session.
4. Explain how these design constraints, design trade-offs, or design failures led you to change your thinking of the project.
5. Given your response to question three, what is your prediction of how each design constraint, design trade-off, or design failure will affect your final proposal? Explain your answer.

229
Design Log Instrument Developed by Fred J. Figliano and John G. Wells © 2010