development of biological treatment ... hub documents/research reports...development of biological...
TRANSCRIPT
DEVELOPMENT OF BIOLOGICAL TREATMENT TECHNOLOGY
FOR THE REMEDIATION OF EDIBLE OIL EFFLUENT
Final Report to the Water Research Commission
by
S. Surujlal, G. Tivchev, H.C. Kasan and F. Bux
Centre for Water and Wastewater Technology Durban Institute of Technology
P.O. Box 953 Durban 4000
WRC Report No : 1084/1/04 ISBN No : 1-77005-198-8
JULY 2004

Disclaimer This report emanates from a project financed by the Water Research Commission (WRC) and is approved for publication. Approval does not signify that the contents necessarily reflect the views and policies of the WRC or the members of the project steering committee, nor does mention of trade names or commercial products constitute endorsement or recommendation for use.
i
EXECUTIVE SUMMARY
1. BACKGROUND AND MOTIVATION
Eutrophication is a natural process that is greatly aggravated by the action of man in the
natural environment. Deterioration of South Africa’s natural water resources results
directly or indirectly from the discharge of industrial effluent rich in nutrient nitrogen and
phosphorus. The South African edible oil refineries generally discharge poor quality
effluent, which causes threat to the water resources and wastewater treatment
installations.
The edible oil industry has been identified to be amongst the 75 industrial groupings in
South Africa. In all, there are about 16 edible oil-processing plants, run by 10 separate
groups. These industries refine and process approximately 300 000 tons of crude
vegetable oil per year, which increases annually by about 3%.
Edible oil effluent entering the sewer system consists mainly of fats, oils, greases (FOG),
sulphate and phosphates resulting in both high inorganic and organic loadings at the
respective wastewater works. Often effluents from edible oil industries entering
wastewater systems have been pretreated to remove most FOG, however due to their
natural triglycerides structure not all FOG is removed. In this regard it is noted that
previous studies have shown that fatty material within waste streams from food industries
are readily biodegradable and it, therefore, follows that these effluents are amenable to
biological treatment.
2. STATEMENT OF OBJECTIVES
The research proposal submitted, and accepted, by the Water Research Commission
detailed the objectives of the research which are as follows:
• To investigate the source of effluent production during the different stages of refining
• To chemically characterise the effluent

ii
• To assess the efficiency of aerobic biological treatment for the removal of chemical
oxygen demand (COD) and phosphate in the final effluent.
• To apply techniques for anaerobic digestion with retention of biomass for the
treatment of vegetable oil effluent;
• To study the dynamics of anaerobic biodegradation of the lipid and non-lipid
fractions of vegetable oil effluents;
• To develop a treatment protocol for on-site combined aerobic-anaerobic biological
treatment of vegetable oil effluent.
Revised objectives:
- Due to time constraint, all research will be conducted at a laboratory scale and not
pilot scale onsite.
From the, abovementioned, objectives it can be seen that the major aim of the project was
to investigate the relationship between microbial activity and the three primary functions of
a biological wastewater treatment facility viz., carbon (both aerobically and anaerobically),
nitrogen and, phosphorous removal. Although, initially the main thrust of the research
focused on biological phosphorous removal, the emphasis changed to mainly COD and
FOG removal. This change was necessitated by alterations made on an operational level.
The chief industrial partner in this research switched from a phosphoric acid based
refining method to using caustic soda as an alternative method for oil refining. Therefore,
the effluent phosphorous concentrations decreased dramatically and the need for
biological phosphorous removal, prior to discharge, was made unnecessary, although, the
need for COD and FOG removal remained a priority. For example, following this change,
and decreases in phosphorous concentrations, resulted in all experiments requiring
dosing with di-potassium hydrogen phosphate (K2HPO4) to enhance biological activity.
3. SUMMARY OF RESULTS AND MEETING OF OBJECTIVES
The main aim of this study was to assess the capacity of a laboratory scale effluent
treatment process that will produce final effluent having a regulatory acceptable organic
load and phosphate concentration prior to its discharge into the municipal sewer system.
The study was conducted in various stages including: wastewater characterization,

iii
treatability studies, and laboratory scale organic and nutrient removal treatment
investigations.
With regards to the phosphorous removal objectives, following analysis for various effluent
parameters, treatability studies were conducted using an aerobic-anaerobic sequencing
batch reactor with a total hydraulic retention time of 24 hr. The results showed an average
of 75% reduction of COD and more than 90% removal of FOG. Based on the results of
effluent characterisation and treatability studies, a laboratory scale activated sludge
effluent treatment process was designed and operated with two bioreactors (aerobic and
anaerobic) in series. The system was operated for a period of 1 month resulting in 70%
removal of COD and 4% phosphate reduction. After some structural and operational
changes from the original design configuration, the system was the operated continuously
for the duration of the study period. An optimum COD removal of 75% and 107 mg/L
phosphate reduction was achieved during the last operational phase of the system. More
than 95% reduction in FOG has been achieved in both semi-continuously and
continuously operated systems.
In order to evaluate the effect sludge age has on biological phosphorus removal in oil
effluent and to determine the optimum sludge age, a sequencing batch reactor was set up
for the experimentation. The effluent was exposed to alternating anaerobic and aerobic
conditions. The reactor had a hydraulic retention time of 12 hr. Sludge ages of 5, 10, 15
and 20 days were used. The COD, phosphorus levels, mixed liquor suspended solids,
nitrates and ammonium levels were determined. The 10-day sludge age proved to be
most effective in phosphorus removal and a removal efficiency of 84% was obtained.
These experiments also indicated the complex interactions between design criteria and
physiological requirements of the microorganisms. For example, initial anaerobic reactor
volumes and hydraulic retention times showed a significant effect on subsequent microbial
activity.
Additional experiments were made to optimise conditions for prefermentation in order to
obtain the highest concentration of Volatile Fatty Acids (VFA’s) to improve biological
phosphorus removal from edible oil effluent. The conditions that were optimised were the
hydraulic retention time, the effect of adjusted and natural pH and effect of mixing and

iv
non-mixing. A single stage laboratory scale 10 L Primary Acid Fermenter Sequence Batch
Reactor was set up for determination of hydraulic retention time. 4 x 1 L conical flasks
were used as batch reactors for determination of total solids, pH and mixing effects. The
laboratory scale results showed that an 8 day time period, 12 hr hydraulic retention time, a
total solids concentration of 3 000 mg/L and adjusted pH to 7.0 with mixing showed
optimum VFA production. When the optimised system was combined with a Biological
Phosphorus Removal Sequence Batch Reactor, a 76% COD reduction and 78%
phosphate reduction was achieved therefore it can be concluded that a prefermentation
stage improves biological phosphorus removal from edible oil effluent.
The vegetable oil industry produces effluent containing quantities of fat, oil, sodium,
phosphates as well as other pollutants. Physico-chemical treatment methods, such as
Dissolved Air Floatation (DAF), gravity separation and the use of coagulants have been
attempted providing a considerable reduction in organic loading; however, discharge
standards are still not met. Thus, biological treatment methods are being sought after.
Aerobic treatment has been attempted however, shock loads cause problems while
running such a process. The objective of this phase of the study was to assess the
efficiency of anaerobic digestion technology to degrade vegetable oil effluent as well as
the efficiency of the Anaerobic Baffled Reactor. Anaerobic digestion involves the
breakdown of organic matter by the action of microorganisms in the absence of oxygen,
producing methane-rich biogas. The oil effluent was characterized, providing significant
information on its chemical composition. It was found that the effluent had high sulphate
content as well as a high COD. The high sulphate content of wastewaters has known to
promote growth of Sulphate Reducing Bacteria, which utilize the same energy source as
Methane Producing Bacteria and therefore compete for the same energy source.
Sulphate and lipid reduction pretreatment experiments were carried out, using barium
chloride and gravitational separation respectively. The results obtained, showed that the
use of barium chloride to reduce sulphate content in oil effluents was successful, with
significant sulphate reduction. The lipid reduction experiments however, did not show any
significant lipid reduction. Batch tests were conducted in serum bottles to assess the
extent of biodegradation of the oil effluent in its raw state as well as with reduced sulphate
content. Methanogenic toxicity tests on the raw and pretreated oil effluents provided a
range of toxicity results. These assays are relatively simple and inexpensive. Gas
v
production was monitored to determine the rate and extent of biodegradation. The
efficiency of digestion was assessed by COD reduction. Results indicated potential
inhibition of the methanogenic bacteria responsible for methane production by the
presence of a toxic substance or substances (at elevated concentrations) in the oil
effluents. Results showed raw effluent to be more susceptible to anaerobic degradation.
A laboratory scale Anaerobic Baffled Reactor was assessed to treat oil effluents
anaerobically and compared to Fed-batch digestion. Both reactors were fed a
combination of oil effluents (COD 2000 mg/L) and artificial effluent. Results indicated that
anaerobic fed-batch digestion is a promising method of treatment for oil effluents and that
the anaerobic baffled reactor is not suitable for treatment of this type of effluent.
For the pretreatment of the effluent, all the results, viewed collectively, seem to indicate
that the techniques of ozonation, peroxone and ultrasonics are ineffective methods for the
pretreatment of an edible oil effluent.
It has been shown that ozonation performs optimally in the presence of unsaturated bonds
(Kloos, 2000). Therefore, with these present in low concentrations, optimum ozonation
proved unsuccessful. From all of the pretreatment results obtained it can be concluded
that the alternative pretreatment methods were not as effective as the current pretreatment
method. Thus, the method of chemical coagulation and flocculation with C40 appears to
be the most effective pretreatment from the range of coagulants investigated for the edible
oil effluent.
An activated sludge process was designed and the operation was based on a Modified
Ludzak- Ettinger (MLE) configuration which was preceded with optimization of appropriate
pretreatment technology. The commercial coagulant C40 showed comparatively superior
performance and was selected as the pretreatment technology to prepare effluent for
activated sludge treatment. The lab scale process was conducted in phases
encompassing common operational parameters. Early stages of the lab scale process
were unsuccessful since the wastewater was not pretreated. Subsequent to pretreatment,
overall performance of the process was good recording maximum COD removal
efficiencies of > 90% during steady state conditions. The process responded positively to

vi
increase in the influent COD concentration (organic strength) with the maximum
concentration of COD removed being > 1500 mg/L.
Apart from phosphorous removal total organic concentration removal became a critical
focus point and in addition various cultures (yeast, molds and bacteria) were isolated from
oil- contaminated soil to determine their relative oil degrading capacity.
Bacterial, yeast and fungal monocultures were used individually to determine their ability
to grow on an agar medium containing commercial fatty acids (i.e. oleic and stearic acid
respectively) as a carbon source and to determine their capabilities in degrading the fatty
acid component in edible oil effluent samples which were monitored by COD and FOG
analysis. Tests at discrete pH’s of 5, 7, and 8 and at temperatures of 21oC and 31oC,
respectively.
Results have shown that the isolates belonging to the Mucor spp. were capable of growing
excellently on the agar plates, while the Alternaria spp. grew poorly on both oleic and
stearic fatty acid agar plates. For the purpose in this study, FOG collectively represents
the triglyceride or long chain fatty acid component present in the edible oil effluent. Using
the raw effluent samples, the parameters of pH 5 and temperatures of 31oC, showed that
the best FOG removal rates of 90% by the Alternaria spp., 89% by both Mucor spp. when
compared to the other experimental parameters used.
For the bacteria and yeast, isolate F showed a 90% FOG removal at pH 5 at 21C and
Rhodosporidium sp showed a 91% FOG removal at 31C respectively.
4. RECOMMENDATIONS FOR FUTURE RESEARCH
As a result of these studies various areas have been identified for future research. For
example, the oil effluent was found to contain amounts of phytosterols, which could
possibly be extracted, purified and sold as an animal feed supplement. In order to achieve
this, it will be necessary to analyze edible oil effluents from all of the oil refineries over an
extended time frame to determine the concentrations of the phytosterols in the different
effluent streams, as well, as the extraction potential.
vii
An additional area identified is the need for a comprehensive analysis of the effluent. This
is necessary as operational and refinery procedure changes result in significant chemical
characteristic changes in the effluents. This, in turn, effects the microbial associations
required for further biological treatment of the effluents.
Settling problems as well as changes in microbial interspecies interactions have been
noted in the pilot-scale activated sludge system. Further research will be required to
determine the complex interactions between the pollutant and microbial associations and
their interactions, which are required for effective activated sludge treatment of organic
effluents.
5. COSTING ANALYSIS
The costs involved in biologically treating the raw edible oil effluent will include a
substantial initial capital expenditure including the design and construction of the BNR
process to the specifications required, as well as specialized equipment such as pumps,
aerators and mixers. All of these start-up expenses are dependant on the wastewater
characteristics of the effluent and will therefore differ according to the industry.
Other costs involved in biological treatment include:
a) Flocculation using C40, since this is a pre-requisite for biological treatment.
b) Chemical Consumables, such as H2SO4 to reduce the alkalinity of the effluent
before flocculation, as well as NH4Cl and KH2PO4 which are used to supplement the
flocculated effluent to the ratio C:N:P = 100:10:1 in order for BNR to take place.
c) Running expenses, especially electricity as it is required for mechanical mixing and
aeration of the mixed liquor.
d) Manpower, the BNR process will require at least one skilled process-controller to
operate and maintain the process and 2 or 3 factory workers for maintenance,
sampling and cleaning of the reactors in the BNR process.
viii
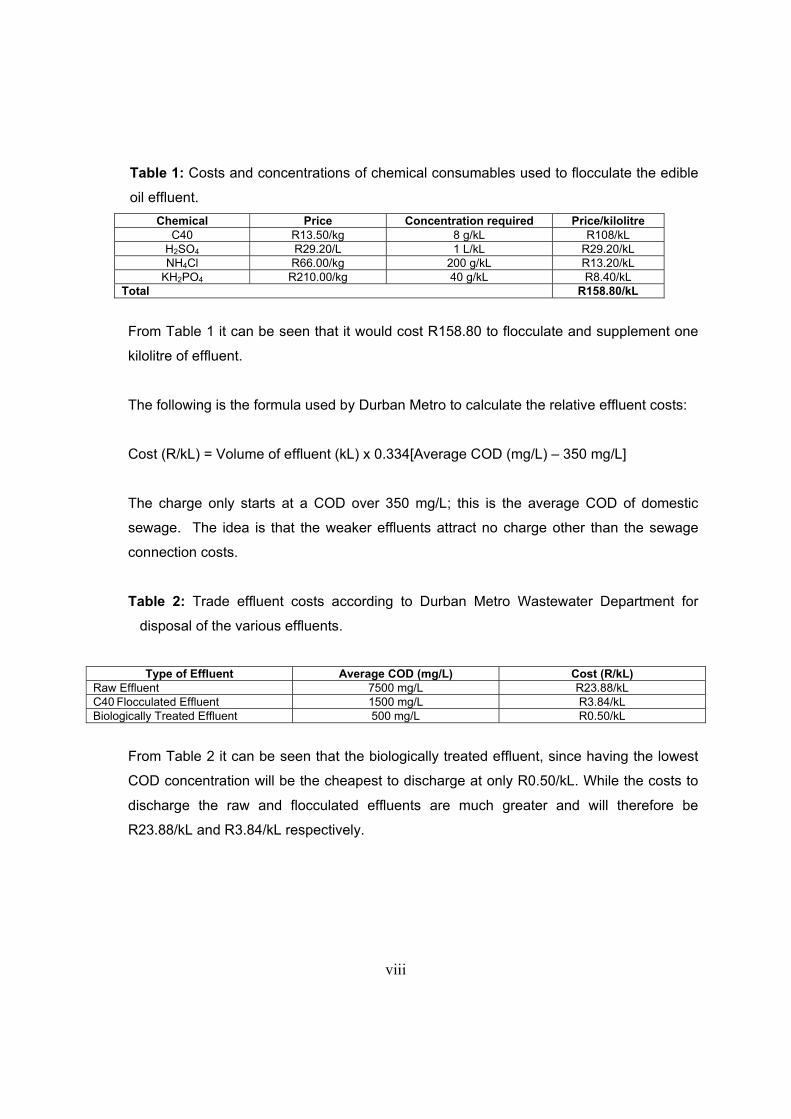
Table 1: Costs and concentrations of chemical consumables used to flocculate the edible
oil effluent.
Chemical Price Concentration required Price/kilolitre C40 R13.50/kg 8 g/kL R108/kL
H2SO4 R29.20/L 1 L/kL R29.20/kL NH4Cl R66.00/kg 200 g/kL R13.20/kL
KH2PO4 R210.00/kg 40 g/kL R8.40/kL Total R158.80/kL
From Table 1 it can be seen that it would cost R158.80 to flocculate and supplement one
kilolitre of effluent.
The following is the formula used by Durban Metro to calculate the relative effluent costs:
Cost (R/kL) = Volume of effluent (kL) x 0.334[Average COD (mg/L) – 350 mg/L]
The charge only starts at a COD over 350 mg/L; this is the average COD of domestic
sewage. The idea is that the weaker effluents attract no charge other than the sewage
connection costs.
Table 2: Trade effluent costs according to Durban Metro Wastewater Department for
disposal of the various effluents.
Type of Effluent Average COD (mg/L) Cost (R/kL) Raw Effluent 7500 mg/L R23.88/kL C40 Flocculated Effluent 1500 mg/L R3.84/kL Biologically Treated Effluent 500 mg/L R0.50/kL
From Table 2 it can be seen that the biologically treated effluent, since having the lowest
COD concentration will be the cheapest to discharge at only R0.50/kL. While the costs to
discharge the raw and flocculated effluents are much greater and will therefore be
R23.88/kL and R3.84/kL respectively.
ix
6. TECHNOLOGY TRANSFER
(i) Capacity Building
The following students received relevant qualifications as a result of this project:
D. Tech (Biotechnology) - F. Bux
M. Tech (Biotechnology) - S Mkhize
- A Manganyi
L A Frost
S Surujlal
B. Tech (Biotechnology) - N Sithole
- S Surujlal
- P Mathibela
- Y Devnath
- K Reddy
Experiential Trainee - S Surujlal
- K Reddy
- S L Thomson
- T Lalbahadur
(ii) Industrial Liaison
Project findings were discussed with industrial partner on a regular basis. The
research findings served as a basis for further investigation and up-scaling to pilot
plant subject to a feasibility study.
(iii) Publications and conferences
Publications:
Mkhize, S. P., Atkinson, B.W. and Bux, F. (2000) Assessment of activated sludge
process as a treatment alternative for remediation of edible oil effluent. Water SA.
Vol 26(4) pp 555 – 558.
Mkhize, S. P. and Bux, F. (2001) Assessment of activated sludge to remediate
edible oil effluent. South African Journal of Science. Vol 97. pp 380 – 382.

x
Reddy, K., Drysdale, G. D. and Bux, F. (2003) Evaluation of activated sludge
treatment and settleability in remediation of edible oil effluent. Water SA. Vol 20(3)
pp 245 – 250.
Presentations:
Mkhize, S. P., Bux, F. and Kasan, H.C. (1999) Assessment of a Biological Nutrient
Removal Process for the Remediation of Edible Oil Effluent African International
Environmental Protection Symposium (AIEPS ‘99), Fourth Southern Africa
Anaerobic Digestion Symposium at Imperial Hotel, Pietermaritzburg, South Africa,
on 4-8 July 1999.
Mkhize, S. P., Atkinson, B.W., Bux, F. and Kasan, H. C. (1999) Assessment of a
biological nutrient removal process for the remediation of edible oil effluents IAWQ
International Specialty Conference of the chemical industry group, waste
minimization and end of pipe treatment in chemical and petrochemical industries.
Merida, Yucatan, Mexico. November 4 - 18, 1999.
Mkhize, S. P., Atkinson, B. W. and Bux, F. (2000) Assessment of activated sludge
process as a treatment alternative for remediation of edible oil effluent BIOY2K
Combined Millennium Meeting, 2000-SASM, 23- 28 January 2000, Rhodes
University, Cape Town oral presentations
Mkhize, S. P. and Bux, F. (2000) Assessment of biological treatment process for the
remediation of edible oil effluent The Water Institute of Southern Africa, Biennial
Conference and Exhibition, Sun City, 28 May - 1 June 2000, Oral Presentation
Manganyi, A., Surujlal, S. and Bux, F. (2001) Biological phosphorus removal from
edible oil effluents. South African Society for Microbiology (KZN) 13th Annual
Symposium, 19 October, Senate Chamber, University of Durban- Westville Poster
presentation

xi
Surujlal S. and Bux, F. (2002) Optimisation of Edible Oil Effluent Degradation by
Microorganisms. International Symposium For Environmental Biotechnology (ISEB),
9 – 12 June 2002 Veracruz, Mexico. Oral Presentation

xii
ACKNOWLEDGMENTS
The research in this report emanated from a project funded by the Water Research Commission
and entitled “Development of Biological Treatment Technology for the Remediation of Edible Oil
Effluent”
The Steering Committee responsible for this project consisted of the following persons:
Mr. G Steenveld Water Research Commission (Chairman)
Dr N Mjoli Water Research Commission
Mrs. CM Smit Water Research Commission (Committee Services
Ms S Chetty Water Research Commission (Committee Secretary)
Dr PMM Jonas Umgeni Water
Dr. H Kasan Rand Water
Prof CA Buckley University of Natal (Durban)
Ms J Bell University of Natal (PRG)
Mr. K Beath Department of Water Affairs & Forestry
Mr. P Viljoen Department of Water Affairs & Forestry
The financing of the project by the Water Research Commission and the contribution of the
members of the Steering Committee is gratefully acknowledged. The National Research
Foundation is also acknowledged for providing students the financial means to complete their
individual projects and the research project in its entirety.
This project was only possible with the co-operation of many individuals and institutions. The
authors therefore wish to record their sincere thanks to the following:
Mr. J Chetty Chemistry Department, ML Sultan Campus, Durban Institute of
Technology
Mr. Mandelia Sealake Oil Industries, Pietermaritzburg
Staff Darvill Wastewater Works, Pietermaritzburg
Staff Centre for Water and Wastewater Technology, Durban

xiii
TABLE OF CONTENTS
EXECUTIVE SUMMARY ................................................................................................................. i
ACKNOWLEDGMENTS ............................................................................................................... xii
TABLE OF CONTENTS .............................................................................................................. xiii
LIST OF TABLES ....................................................................................................................... xxii
LIST OF FIGURES ..................................................................................................................... xxv
LIST OF ABREVIATIONS ....................................................................................................... xxviii
CHAPTER 1
INTRODUCTION AND SCOPE OF RESEARCH ......................................................................... 1
1.1 THE ORIGINS OF EFFLUENT/WASTEWATER ............................................................. 1
1.2 WASTEWATER CHARACTERISTICS OF THE EDIBLE OIL EFFLUENT ..................... 4
1.2.1 Introduction ....................................................................................................................... 4
1.3 THE NEED FOR PRETREATMENT ................................................................................ 6
1.4 RESEARCH OBJECTIVES .............................................................................................. 7
1.5 REPORT STRUCTURE .................................................................................................... 7
CHAPTER 2
LITERATURE REVIEW ................................................................................................................ 8
2.1 THE SOUTH AFRICAN EDIBLE OIL INDUSTRY ........................................................... 8
2.1.1 The Refinery Process and its Effluents ............................................................................ 9
2.1.1.1 Degumming ....................................................................................................................... 9
2.1.1.2 Chemical Refining ........................................................................................................... 10
2.1.1.3 Physical Refining ............................................................................................................ 12
2.1.2 The Acid Oil Plant and its Effluents ................................................................................ 13
2.1.3 The Soap Plant and its Effluents .................................................................................... 13
2.1.4 Wash Down and Miscellaneous Effluents ...................................................................... 14
2.2 ON-SITE EFFLUENT TREATMENT METHODS EMPLOYED AT THE
INDUSTRY IN PIETERMARITZBURG ........................................................................... 14
2.2.1 pH Correction .................................................................................................................. 15
2.2.2 Dissolved Air Flotation (DAF) ......................................................................................... 16
2.3 THE EFFLUENT PROBLEM AND LEGISLATION ........................................................ 16

xiv
2.4 THE EUTROPHICATION PROBLEM ............................................................................ 17
2.4.1 Source of Nutrients (Phosphorus) .................................................................................. 18
2.4.1.1 Diffused Sources ............................................................................................................. 18
2.4.1.2 Point Sources .................................................................................................................. 19
2.5 TREATABILITY OF EDIBLE OIL EFFLUENT ................................................................ 19
2.5.1 Physical Treatment ......................................................................................................... 20
2.5.1.1 Gravity Settling or Fat Traps ........................................................................................... 20
2.5.1.2 Dissolve Air Floatation (DAF) ......................................................................................... 21
2.5.2 Ozonation ........................................................................................................................ 23
2.5.2.1 Theory of Operation ........................................................................................................ 23
2.5.2.2 The Advantages and Disadvantages of Ozone shown in table 2.1 ............................... 24
2.5.3 Peroxone ......................................................................................................................... 24
2.5.3.1 Theory of Operation ........................................................................................................ 24
2.5.3.2 Advantages of Peroxone ................................................................................................ 25
2.5.4 Ultrasonication ................................................................................................................ 25
2.5.4.1 Theory and Operation ..................................................................................................... 25
2.5.5 Chemical Treatment ....................................................................................................... 25
2.5.5.1 Advantages of Chemical Treatment ............................................................................... 26
2.5.5.2 Disadvantages of Chemical Treatment .......................................................................... 26
2.5.6 Biological Treatment ....................................................................................................... 27
2.5.6.1 Anaerobic Treatment Process ........................................................................................ 27
2.5.6.2 The Activated Sludge Treatment Process ...................................................................... 27
2.6 BIOLOGICAL NUTRIENT REMOVAL TREATMENT PROCESS ................................. 29
2.6.1 Carbonaceous Energy (COD) Removal ......................................................................... 30
2.6.2 Biological Phosphorus Removal ..................................................................................... 31
2.6.3 Mechanisms of excess Biological Phosphorus removal (BEPR) ................................... 34
2.6.3.1 The Anaerobic Zone ....................................................................................................... 34
2.6.3.2 The Aerobic Zone (Reactor) ........................................................................................... 35
2.6.4 Historical Development of Prefermentation .................................................................... 36
2.6.4.1 Prefermentation Technology .......................................................................................... 36
2.6.4.2 Pre-fermenter Technology .............................................................................................. 37
2.6.4.3 Pre-fermenter Configuration ........................................................................................... 37
2.7 CONCLUSIONS FROM THE LITERATURE REVIEW .................................................. 38

xv
CHAPTER 3
(A)PRE-FERMENTATION .......................................................................................................... 39
3.1 INTRODUCTION ............................................................................................................ 39
3.2 AIMS AND OBJECTIVES ............................................................................................... 40
3.3 MATERIALS AND METHODS ........................................................................................ 40
3.3.1 Optimisation of Total Solids (TS) Concentration ............................................................ 40
3.4 RESULTS AND DISCUSSION ....................................................................................... 41
3.5 CONCLUSION ................................................................................................................ 43
(B) ASSESSMENT PF BENCH SCALE NUTRIENT REMOVAL PROCESS ..................... 44
3.6 AIMS AND OBJECTIVES ............................................................................................... 44
3.7 WASTEWATER CHARACTERIZATION ........................................................................ 44
3.7.1 Materials and Methods ................................................................................................... 44
3.7.1.1 Characterisation of effluent ............................................................................................. 44
3.7.2 Discussion ....................................................................................................................... 45
3.8 ABORATORY SCALE BIOREACTOR DESIGN AND OPERATION ............................. 47
3.8.1 Introduction ..................................................................................................................... 47
3.8.2 Materials and Methods ................................................................................................... 47
3.8.2.1 Phase 1 ........................................................................................................................... 47
3.8.2.2 Phase 2 ........................................................................................................................... 49
3.8.2.3 Phase 3 ........................................................................................................................... 50
3.8.3 Discussion ....................................................................................................................... 51
3.9 TREATMENT PROCESS OPTIMISATION (PHASE 4) ................................................. 55
3.9.1 Introduction ..................................................................................................................... 55
3.9.2 Materials and Methods ................................................................................................... 55
3.9.2.1 Bioreactor Layout and Operation .................................................................................... 55
3.9.3 Results ............................................................................................................................. 57
3.9.4 Discussion ....................................................................................................................... 59
3.10 CONCLUSION ................................................................................................................ 61
CHAPTER 4
ANAEROBIC DIGESTION ......................................................................................................... 62
4.1 INTRODUCTION ............................................................................................................ 62
4.1.1 Anaerobic Digestion Process ......................................................................................... 62

xvi
4.1.1.1 Hydrolytic and Fermentative Bacteria ............................................................................ 63
4.1.1.2 Acetogenic Bacteria ........................................................................................................ 63
4.1.1.3 Methanogenic Bacteria ................................................................................................... 63
4.1.1.4 Sulphate Reducing Bacteria (SRB) ................................................................................ 64
4.1.2 Anaerobic Baffled Reactor and Fed-Batch Digestion .................................................... 65
4.2 AIMS AND OBJECTIVES ............................................................................................... 67
4.3 MATERIALS AND METHODS ........................................................................................ 67
4.3.1 Characterisation of edible oil effluent ............................................................................. 67
4.3.2 Lipid Reduction by Gravitational Separation .................................................................. 67
4.3.3 Sulphate Reduction using Barium Chloride ................................................................... 68
4.3.4 Biochemical Methane Potential and Toxicity Assays ..................................................... 68
4.3.4.1 Anaerobic Sludge ............................................................................................................ 68
4.3.4.2 Preparation of Assay Bottles .......................................................................................... 68
4.3.4.3 Defined Medium .............................................................................................................. 69
4.3.4.4 Procedure ........................................................................................................................ 69
4.3.4.5 Gas Measurement .......................................................................................................... 70
4.3.5 Fed-Batch Digestion ....................................................................................................... 70
4.3.5.1 Reactor ............................................................................................................................ 70
4.3.5.2 Artificial Effluent .............................................................................................................. 71
4.3.5.3 Digester Start-up ............................................................................................................. 71
4.3.5.4 Fed-Batch Digestion ....................................................................................................... 71
4.3.6 Anaerobic Digestion using the Anaerobic Baffled Reactor ............................................ 72
4.3.6.1 Anaerobic Baffled Reactor .............................................................................................. 72
4.3.6.2 Digester Start-up ............................................................................................................. 72
4.3.7 Analysis ........................................................................................................................... 72
4.4 RESULTS AND DISCUSSION ....................................................................................... 73
4.4.1 Chemical Characteristics of Edible Oil Effluent .............................................................. 73
4.4.2 Lipid Reduction by Gravitational Separation .................................................................. 74
4.4.3 Sulphate Reduction using Barium Chloride ................................................................... 75
4.4.4 Biodegradability Assay ................................................................................................... 75
4.4.4.1. Results of the Biodegradability Assay using Raw Edible Oil Effluent .......................... 76
4.4.4.2 Results of the Biodegradability Assay using Pre-treated Edible Oil Effluent ................. 87
4.4.5 Results of the Fed-Batch Digestion ................................................................................ 92

xvii
4.4.6 Results of Anaerobic Baffled Reactor ............................................................................ 95
4.5 CONCLUSIONS .............................................................................................................. 96
CHAPTER 5
PRETREATMENT METHODS TO ENHANCE SECONDARY BIOLOGICAL
TREATMENT OF INDUSTRIAL EDIBLE OIL EFFLUENT ....................................................... 97
5.1 INTRODUCTION ............................................................................................................ 97
5.1.1 Alternate Pre-Treatment Methods .................................................................................. 97
5.2 AIMS AND OBJECTIVES ............................................................................................... 98
5.3 MATERIALS AND METHODS ........................................................................................ 98
5.3.1 Coagulation and Flocculation using the Standard Jar Test (Coagulation Test)
(Pryor and Freese, 1998) ................................................................................................ 98
5.3.2 Dissolved Air Flotation Subsequent to Coagulation and Flocculation ........................... 98
5.3.3 Comparison of the Alternative Pretreatment Method to the Current Method ................ 99
5.3.4 Ozonation ...................................................................................................................... 100
5.3.4.1 Preparation of a Calibration Curve ............................................................................... 100
5.3.4.2 Ozonation Procedure .................................................................................................... 100
5.3.5 Peroxone Procedure ..................................................................................................... 101
5.3.6 The Effectiveness of Ultrasonics as a Pretreatment Method of an Edible Oil
Effluent .......................................................................................................................... 101
5.3.7 Evaluation of the Effectiveness of the Pretreatment Methods ..................................... 101
5.3.7.1 TLC ................................................................................................................................ 101
5.4 RESULTS AND DISCUSSION ..................................................................................... 102
5.4.1 Optimum Conditions for Enhanced Coagulation and Flocculation .............................. 102
5.4.2 The most Effective Pretreatment Method for the Industrial Edible Oil Effluent ........... 103
5.4.3 Subjecting the Effluent to Specific Treatments at pH 7 ............................................... 104
5.4.4 Effluent Pretreatment by Sonnication ........................................................................... 106
5.4.4.1 The results achieved by sonnicating using a sonnicator bath ..................................... 107
5.5 DISCUSSION ................................................................................................................ 107
5.6 CONCLUSION .............................................................................................................. 108
xviii
CHAPTER 6
LABORATORY SCALE AEROBIC BIOLOGICAL TREATMENT PROCESS ....................... 109
6.1 INTRODUCTION .......................................................................................................... 109
6.2 AIMS AND OBJECTIVES ............................................................................................. 109
6.3 MATERIALS AND METHODS ...................................................................................... 110
6.3.1 Laboratory Scale Pretreatment Process ...................................................................... 110
6.3.1.1 Collection of effluent ..................................................................................................... 110
6.3.1.2 Wastewater characteristics ........................................................................................... 110
6.3.1.3 Large scale pretreatment procedure ............................................................................ 111
6.3.2 Laboratory scale unit description .................................................................................. 112
6.3.2.1 Unit set-up and configuration ........................................................................................ 112
6.3.3 Pilot plant operation ...................................................................................................... 114
6.3.3.1 Acquisition of seed inoculum ........................................................................................ 114
6.3.3.2 Basic approach to treatment process ........................................................................... 114
6.4 RESULTS ...................................................................................................................... 115
6.4.1 Pilot plant process ......................................................................................................... 115
6.4.1.1 Wastewater characterization ........................................................................................ 115
6.4.1.2 Phase 4E ....................................................................................................................... 116
6.4.1.3 Phase 5C ...................................................................................................................... 116
6.4.2 Process Performance ................................................................................................... 117
6.4.2.1 Performance with increase in COD concentration ....................................................... 117
6.4.3 Associated problems .................................................................................................... 118
6.5 DISCUSSION ................................................................................................................ 119
6.6 CONCLUSION .............................................................................................................. 122
CHAPTER 7
ALTERNATE TREATMENT TECHNOLOGY USING YEAST, BACTERIA AND
UNGI FOR TREATMENT OF EDIBLE OIL EFFLUENT ......................................................... 124
7.1 INTRODUCTION .......................................................................................................... 124
7.1.1 The Fungal Degradation of Lipids ................................................................................ 124
7.1.2 Yeast ............................................................................................................................. 125
7.1.3 Bacteria ......................................................................................................................... 125

xix
7.1.4 Physical Factors Affecting Oil Degradation by Yeast and Bacteria ............................. 125
7.2 YEAST AND BACTERIA DEGRADATION OF EDIBLE OIL EFFLUENT ................... 126
7.2.1 AIMS AND OBJECTIVES ............................................................................................. 126
7.2.2 MATERIALS AND METHODS ...................................................................................... 126
7.2.2.1 Isolation ......................................................................................................................... 126
7.2.2.2 Preliminary Screening Tests ......................................................................................... 126
7.2.2.3 Identification of Isolates ................................................................................................ 127
7.2.2.4 Edible Oil Effluent Batch Tests ..................................................................................... 127
7.2.2.5 Analysis ......................................................................................................................... 128
7.2.3 Results .......................................................................................................................... 128
7.2.3.1 Isolation of Bacteria and Yeast ..................................................................................... 128
7.2.3.2 Preliminary Screening ................................................................................................... 128
7.2.3.3 Identification .................................................................................................................. 131
7.2.3.4 FOG Degradation .......................................................................................................... 131
7.2.3.5 COD Remediation ......................................................................................................... 131
7.2.4 Discussion ..................................................................................................................... 132
7.2.4.1 Preliminary Screening ................................................................................................... 132
7.2.4.2 Fats, Oils and Greases ................................................................................................. 134
7.2.4.3 FOG Removal in Association with COD ....................................................................... 137
7.2.5 Conclusion .................................................................................................................... 137
7.3 FUNGAL (MOLDS) DEGRADATION OF EDIBLE OIL EFFLUENTS .......................... 138
7.3.1 Aims and Objectives ..................................................................................................... 138
7.3.2 Materials and Methods ................................................................................................. 139
7.3.2.1 Collection of Soil Samples ............................................................................................ 139
7.3.2.2 Isolation and Identification of fungi from soil samples .................................................. 139
7.3.2.3 Growth Potential of Isolated fungi on fatty acids .......................................................... 139
7.3.3 Results and Discussion ................................................................................................ 140
7.3.4 Conclusions ................................................................................................................... 148
CHAPTER 8
GENERAL CONCLUSIONS AND RECOMMENDATIONS .................................................... 149
8.1 CONCLUSIONS ............................................................................................................ 149
8.2 RECOMMENDATIONS ................................................................................................ 150
xx
REFERENCES ......................................................................................................................... 152
APPENDICES ............................................................................................................................ 161
APPENDIX 1 VOLATILE FATTY ACIDS DETERMINATION ........................................ 161
APPENDIX 2 ALKALINITY DETERMINATION ............................................................. 162
APPENDIX 3 a) COD DETERMINATION USING A
SPECTROPHOTOMETER ...................................................................... 163
b) COD DETERMINATION USING OPEN REFLUX METHOD ............. 164
APPENDIX 4 ORTHO PHOSPHATE (PO4-P) DETERMINATION ................................ 166
APPENDIX 5 TOTAL NITROGEN (TKN) DETERMINATION ....................................... 167
APPENDIX 6 FREE AND SALINE AMMONIA (NH4+N) DETERMINATION ................. 168
APPENDIX 7 NITRATES (NO3-)DETERMINATION ..................................................... 169
APPENDIX 8 SULPHATES (SO42-) DETERMINATION ................................................ 170
APPENDIX 9 TOTAL SUSPENDED SOLIDS (TSS) DETERMINATION ..................... 171
APPENDIX 10 FATS, OILS AND GREASES (FOG) DETERMINATION ....................... 173
APPENDIX 11 pH DETERMINATION ............................................................................. 175
APPENDIX 12 PREPARATION OF THE NUTRIENT MEDIUM ACCORDING TO
OWEN et al., (1979) ................................................................................ 176
APPENDIX 13 MIXED LIQUOR SUSPENDED SOLIDS (MLSS) AND VOLATILE
SUSPENDED SOLIDS (VSS) DETERMINATION .................................. 177
APPENDIX 14 PREPARATION OF COAGULANTS ....................................................... 179
APPENDIX 15 IODOMETRIC METHOD I ....................................................................... 180
APPENDIX 16 INDIGO COLORIMETRIC METHOD ...................................................... 184
APPENDIX 17 THIN LAYER CHROMATOGRAPHY ...................................................... 187
APPENDIX 18 ULTRASONICS ....................................................................................... 188
APPENIDX 19 PHASES CONDUCTED DURING LABORATORY SCALE
TREATMENT ........................................................................................... 189
APPENDIX 20 MALT EXTRACT AGAR .......................................................................... 190
APPENDIX 21 NUTRIENT AGAR .................................................................................... 191
APPENDIX 22 PURITY CHECK ...................................................................................... 192
APPENDIX 23 NUTRIENT SOLUTION ........................................................................... 193
APPENDIX 24 OLEIC ACID PLATES .............................................................................. 194
xxi
APPENDIX 25 STEARIC ACID PLATES ......................................................................... 195
APPENDIX 26 FOG DEGRADATION GRAPHS FOR BACTERIA AND YEAST
ISOLATES ................................................................................................ 196
APPENDIX 27 COD DEGRADATION GRAPHS FOR BACTERIA AND YEAST
ISOLATES ................................................................................................ 200
APPENDIX 28 SABORAUD DEXTROSE AGAR ............................................................ 204
APPENDIX 29 LACTOPHENOL COTTON BLUE SOLUTION ....................................... 205
APPENDIX 30 COD AND FOG GRAPH FOR THE FUNGAL ISOLATES ...................... 206

xxii
LIST OF TABLES
Table 1.1 Typical effluent volumes produced by each plant per week (19 April 1999
to 23 April 1999) (Surujlal, 1999) ............................................................................. 3
Table 1.2 Wastewater characteristics of the final effluent (Period A) ..................................... 5
Table 1.3 Chemical characteristics of final effluent used in Anaerobic treatment
(Period B) ................................................................................................................. 5
Table 1.4 Chemical Characteristics of raw effluent after deodorisation and prepared effluent
Period C) .................................................................................................................. 6
Table 1.5 Scope of Structure of Report ................................................................................... 7
Table 2.1 The Advantages and Disadvantages of Ozone .................................................... 24
Table 3.1 Wastewater Characterisation ................................................................................ 41
Table 3.2 Summary of the process operating parameters during phase 1 ........................... 47
Table 3.3 Summary of the process operating parameters during phase 2 ........................... 49
Table 3.4 Summary of the process operating parameters during phase 3 ........................... 50
Table 3.5 Summary of the process operating parameters during phase 4 ........................... 55
Table 4.1 Properties of Anaerobic Sludge ............................................................................. 68
Table 4.2 Sample Composition for BMP and Toxicity Assays .............................................. 69
Table 4.3 Composition of Artificial Effluent ............................................................................ 71
Table 4.4 Results of lipid reduction by gravitational separation ............................................ 74
Table 4.5 Results of the Controls in the BMP assay using raw edible oil effluent (first
Run) ........................................................................................................................ 76
Table 4.6 Results of the BMP assay with 10% wastewater concentration using raw edible
oil effluent (First Run) ............................................................................................ 77
Table 4.7 Results of the BMP assay with 25% wastewater concentration using raw edible
oil effluent (First Run) ............................................................................................ 78
Table 4.8 Results of the BMP assay with 75% wastewater concentration using raw edible oil
effluent (First Run) ................................................................................................. 79
Table 4.9 Results of the BMP Assay with 100% wastewater concentration using raw edible
oil effluent (First Run) ............................................................................................ 80
Table 4.10 Results of the Biodegradability Assay using Raw edible oil effluent (First Run) .. 81
Table 4.11 Results of the Controls in the BMP Assay using raw edible oil effluent
(second Run) ......................................................................................................... 83

xxiii
Table 4.12 Results of the BMP Assay with 10% wastewater concentration using raw edible
oil effluent (Second Run) ....................................................................................... 84
Table 4.13 Results of the BMP assay with 50% wastewater concentration using raw edible
oil effluent (Second Run) ....................................................................................... 85
Table 4.14 Results of the BMP Assay with 100% wastewater concentration using raw edible
oil effluent (Second Run) ....................................................................................... 86
Table 4.15 Results of the Biodegradability Assay using Raw edible oil effluent (Secon
Run) ........................................................................................................................ 86
Table 4.16 Results of Controls in the BMP assay using pre-treated edible oil effluent .......... 87
Table 4.17 Results of the BMP assay with 10% wastewater concentration using pre-treated
edible oil effluent .................................................................................................... 88
Table 4.18 Results of the BMP assay with 50% wastewater concentration using pre-treated
edible oil effluent .................................................................................................... 89
Table 4.19 Results of the BMP assay with 100% wastewater concentration using pre-treated
edible oil effluent .................................................................................................... 90
Table 4.20 Results of the Biodegradability Assay using Pre-treated edible oil effluent ......... 90
Table 5.1 Results for COD ................................................................................................... 103
Table 5.2 FOG Concentrations ............................................................................................ 104
Table 5.3 The TLC Data of the Effluent Sample Treated at pH 7 ....................................... 104
Table 5.4 The TLC Data of the Samples Treated by Ozonation and Coagulation ............. 106
Table 5.5 The TLC Data of the Effluent Sample Sonnicated Using an Output of
10 Watts ............................................................................................................... 107
Table 5.6 The TLC Data of the Effluent Sample Sonnicated Using a Sonnicator Bath ..... 107
Table 6.1 Increase in COD concentration across phases and F/M ratios .......................... 118
Table 7.1 Oleic acid utilization by bacteria and yeast isolates using batch tests ............... 129
Table 7.2 Growth of bacteria and yeast on oleic acid plates at pH values of 5, 7 and 8
and at 21oC and 31oC .......................................................................................... 129
Table 7.3 Growth of bacteria and yeast on stearic acid on plates at pH values of 5, 7
and 8 and 21oC and 31oC .................................................................................... 130
Table 7.4 Final FOG removal percentage of F, Bacillus sp, Candida sp and
Rhodosporidium sp in batch tests ....................................................................... 123
Table 7.5 Fungal growth on oleic acid agar plates at 21oC and pH’s of 5, 7 and 8
respectively .......................................................................................................... 140

xxiv
Table 7.6 Fungal growth on oleic acid agar plates at 31oC and varying pH’s of 5, 7, and 8
respectively .......................................................................................................... 141
Table 7.7 Fungal growth on the stearic acid agar plates at 21oC and pH’s 5, 7 and 8
respectively .......................................................................................................... 141
Table 7.8 Fungal growth on stearic acid agar plates at 31oC and at pH’s 5, 7, and 8
respectively .......................................................................................................... 141

xxv
LIST OF FIGURES
Figure 1.1 Schematic diagram of refinery process ................................................................... 2
Figure 1.2 Schematic representation of the layout of the five plants at Company X and the
effluent they produce ............................................................................................... 2
Figure 1.3 Flow diagram showing the different types of treatment conducted for edible oil
effluent ..................................................................................................................... 4
Figure 2.1 Schematic representation of the effluent treatment plant at the edible oil industry in
Pietermaritzburg ..................................................................................................... 15
Figure 2.2 A diagrammatic representation of a conventional completely mixed
activated sludge system with hydraulic control of sludge age and recycle .......... 28
Figure 2.3a The Phoredox process for biological nitrogen and phosphorus removal ............. 33
Figure 2.3b The 3 stage Phoredox process for biological nitrogen and phosphorus removal 33
Figure 2.3c The UCT process for biological nitrogen and phosphorus removal ...................... 33
Figure 3.1 VFA concentration vs. time .................................................................................... 41
Figure 3.2 VFA production vs. time ......................................................................................... 42
Figure 3.3 Effect of natural pH on VFA production vs. time ................................................... 42
Figure 3.4 Effect of adjusted pH on VFA production vs. time ................................................ 43
Figure 3.5 Total influent and effluent COD profiles for continuously operated biological
treatment process at 0.5 F/M ratio (Phase 4) ........................................................ 57
Figure 3.6 Soluble influent and effluent orthophosphate profiles for a continuously operated
biological treatment process at 0.5 F/M ratio (Phase 4) ....................................... 58
Figure 3.7 Influent and effluent FOG profiles during phase 4 ................................................ 58
Figure 4.1 Diagram illustrating the four trophic groups involved in anaerobic digestion ....... 62
Figure 4.2 Schematic Representation of the Anaerobic Baffled Reactor .............................. 65
Figure 4.3 Lipids content (mg/L) of vegetable oil effluent after lipid reduction
pre-treatment ......................................................................................................... 74
Figure 4.4 COD content (mg/L) of vegetable oil effluent after lipid reduction
pre-treatment ......................................................................................................... 74
Figure 4.5 Sulphate content (mg/L) of vegetable oil effluent before and after sulphate
reduction pre-treatment ......................................................................................... 75

xxvi
Figure 4.6 Average gas production of the controls in the BMP assay using
raw edible oil effluent (First Run) ........................................................................... 76
Figure 4.7 Cumulative gas production of the controls in the BMP assay using raw edible
oil effluent (First Run) ............................................................................................ 76
Figure 4.8 Corrected average gas production of 10% wastewater in the BMP assay
using raw edible oil effluent (First Run) ................................................................. 77
Figure 4.9 Cumulative gas production of 10% wastewater in the BMP assay using
raw edible oil effluent (First Run) ........................................................................... 77
Figure 4.10 Corrected average gas production of 25% wastewater in the BMP assay
using raw edible oil effluent (First Run) ................................................................. 78
Figure 4.11 Cumulative gas production of 25% wastewater in the BMP assay using
raw edible oil effluent (First Run) ........................................................................... 78
Figure 4.12 Corrected average gas production of 75% wastewater in the BMP assay
using raw edible oil effluent (First Run) ................................................................. 79
Figure 4.13 Cumulative gas production of 75% wastewater in the BMP assay using
raw edible oil effluent (First Run) ........................................................................... 79
Figure 4.14 Corrected average gas production of 100% wastewater in the BMP assay
using raw edible oil effluent (First Run) ................................................................. 80
Figure 4.15 Cumulative gas production of 100% wastewater in the BMP assay using
raw edible oil effluent (First Run) ........................................................................... 80
Figure 4.16 Average gas production for controls in the BMP assay using raw edible oil
effluent (Second Run) ........................................................................................... 83
Figure 4.17 Cumulative gas production for controls in the BMP assay using raw edible oil
effluent (Second Run) ............................................................................................ 83
Figure 4.18 Corrected average gas production of 10% wastewater in the BMP assay using raw
edible oil effluent (Second Run) ............................................................................ 84
Figure 4.19 Cumulative gas production for 10% wastewater in the BMP assay using raw
edible oil effluent (Second Run) ............................................................................ 84
Figure 4.20 Corrected average gas production for 50% wastewater in the BMP assay using
raw edible oil effluent (Second Run) ..................................................................... 85
Figure 4.21 Cumulative gas production for 50% wastewater in the BMP assay using raw
edible oil effluent (Second Run) ............................................................................ 85

xxvii
Figure 4.22 Corrected average gas production of 100% wastewater in the BMP assay
using raw edible oil effluent (Second Run) ............................................................ 86
Figure 4.23 Cumulative gas production of 100% wastewater in the BMP assay using raw
edible oil effluent (Second Run) ............................................................................ 86
Figure 4.24 Average gas production of the controls in the BMP assay using pre-treated
edible oil effluent .................................................................................................... 87
Figure 4.25 Cumulative gas production of the controls in the BMP assay using pre-treated
edible oil effluent .................................................................................................... 87
Figure 4.26 Corrected average gas production of 10% wastewater concentration in the
P assay using pre-treated edible oil effluent ......................................................... 88
Figure 4.27 Cumulative gas production of 10% wastewater concentration in the BMP assay
using pre-treated edible oil effluent ....................................................................... 88
Figure 4.28 Corrected average gas production of 50% wastewater concentration in the
BMP assay using pre-treated edible oil effluent .................................................... 89
Figure 4.29 Cumulative gas production of 50% wastewater concentration in the BMP
assay using pre-treated edible oil effluent ............................................................. 89
Figure 4.30 Corrected average gas production of 100% wastewater concentration in the
BMP assay using pre-treated edible oil effluent .................................................... 90
Figure 4.31 Cumulative gas production of 100% wastewater concentration in the BMP
assay using pre-treated edible oil effluent ............................................................. 90
Figure 4.32 Comparison of gas produced and pH during fed-batch digestion ........................ 92
Figure 4.33 Graph illustrating COD (mg/L) during fed-batch digestion .................................... 93
Figure 4.34 pH profile of the Anaerobic Reactor ...................................................................... 95
Figure 6.1 Schematic representation of the laboratory scale unit modeled upon the modified
Ludzak-Ettinger process ...................................................................................... 113
Figure 6.2 Percentage COD removal during Phase 4E ....................................................... 116
Figure 6.3 Percentage COD removal during Phase 5C ....................................................... 117
Figure 6.4 Increase in COD removed in influent COD concentration .................................. 117
Figure 7.1 Total change in FOG concentration over time at a temperature of 31C and
pH 5 ...................................................................................................................... 142

xxviii
LIST OF ABBREVIATIONS
ABR - Anaerobic Baffled Reactor Al - Aluminum Al3+ - Aluminium ion Alum - Aluminium sulphate ATA - Anaerobic Toxicity Assay AE1 - 1st Aerobic zone AE2 - 2nd Aerobic zone AX - Anoxic zone BEPR - Biological Excess Phosphorus Removal BMP - Biochemical Methane Potential BNR - Biological Nutrient Removal BOD - Biological Oxygen Demand BOD5 - 5-day Biological Oxygen Demand Bx - Organic loading rate Ca - Calcium CaCO3 - Calcium Carbonate CH4 - Methane CO2 - Carbon Dioxide COD - Chemical Oxygen Demand DAF - Dissolved Air Flotation DO - Dissolved Oxygen DSVI - Dissolved Sludge Volume Index DWW - Darvill Wastewater Works EDTA - Ethylene Diamine Tetra-acetic Acid FAS - Ferrous Ammonium Sulphate Fe3+ - Ferric ion FeCl3 - Ferric chloride FFA’s - Free Fatty Acids F/M ratio - Food to Microorganism ratio FOG - Fats, Oils and Greases Fxa - Anaerobic Mass Fraction H2O - Water H2O2 - Hydrogen peroxide H2S - Hydrogen Sulphide HCl - Hydrochloric Acid HRT - Hydraulic Retention Time IR - Infa red kL - Kilolitre KHP - Potassium Hydrogen Phthalate LCFA - Long Chain Fatty Acids M2+ - Divalent inorganic salt M3+ - Trivalent inorganic salt Mg - Magnesium MLE - Modified Ludzacl-Ettinger process MLSS - Mixed Liquor Suspended Solids MLVSS - Mixed Liquor Volatile Suspended Solids MPB - Methane Producing Bacteria

xxix
N - Nitrogen NH4
+ - Ammonium nitrogen NO2 - Nitrites NO3 - Nitrates NWA - National Water Act O2 - Oxygen O3 - Ozone OFN - Oxygen Free Nitrogen Os - Sludge age OUR - Oxygen Utilization Rate P - Phosphorus PAF - Primary Aerobic Fermenter PAO’s - Polyphosphate Accumulating Organisms PHA - Polyhydroxyacetate PHB - Polyhydroxybutyrate PO4 - P - Orthophosphate PO4
3- - Phosphate ppm - Parts per million Qi - Influent flow rate RBCOD - Readily Biodegradable Chemical Oxygen Demand Rpm - Revolutions per minute Rs - Sludge age SBCOD - Soluble Biodegradable Chemical Oxygen Demand SCFA - Short Chain Fatty Acids SDA - Saboraud Dextrose Agar SO4
2- - Sulphates SRB - Sulphate Reducing Bacteria S-recycle - Sludge recycle SRP - Soluble Reactive Phosphates SWI - Specific Water Intake SVI - Settling Velocity Index TDS - Total Dissolved Solids TKN - Total Kjeldahl Nitrogen TN - Total Nitrogen TLC - Thin Layer Chromatography TP - Total Phosphate TS - Total Solids TSS - Total Suspended Solids UASB - Upflow Anaerobic Sludge Blanket VFA’s - Volatile Fatty Acids VS - Volatile Solids

- 1 -
CHAPTER 1
INTRODUCTION AND SCOPE OF RESEARCH
1.1 THE ORIGINS OF EFFLUENT/WASTEWATER
Due to difficulties encountered in obtaining effluent samples from the edible oil industries
nationally, the current investigation was limited to selecting a company within the industry
to serve as a case study. The process used to refine oil is common in the edible oil
industry and therefore the wastewater generated could be regarded as similar in its
chemical characteristics in the industry and a reflection of the broader industry in general.
The only oil industry that collaborated was situated in Pietermaritzburg, in the KwaZulu-
Natal midlands region. The name of the industry would not be revealed and would be
referred to as Company X throughout the report. This company buys locally produced
crude oil, and imports some from elsewhere to be refined on-site. Hence, the plant is
mainly a refining factory; however, at the beginning of September 1999, milling was also
introduced into the factory. Figure 1.1 illustrates the refinery process carried out at
Company X. The principal products that are produced by Company X are refined
sunflower oil, soaps and candles. The factory also produces and sells acid oil, which is a
one of the by-products of soap production.
The factory is subdivided into four main plants, which are all located on the same
premises. Three plants are mainly for production and the fourth plant is an effluent
treatment plant. The three main production plants are: the refinery plant, which produces
the refined oil; the acid oil plant, which produces soap stock and acid oil from fatty acids
and sulfuric acid; and soap plant which produces soap from soap stock and candles.
All the three production plants are responsible for the production of different kinds of
effluents at variable quantities and strength as shown in Figure 1.2. The volumes of
effluents produced per plant vary on weekly basis depending on the refinery process
employed as shown in Table 1.1. To understand the overall quality and quantity of effluent
produced by the factory, it is better to consider individually the unit operations of each
plant, its main product and effluents.

- 2 -
R E F I N E D O IL
C R U D E O I L
H E A T E X C H A N G E
P R E C I P IT A T IO N T A N K
H E A T E X C H A N G E
C E N T R IF U G E
C E N T R IF U G E S O A P T A N K
D R I E R
S L U R R Y T A N K
B L E A C H E R
B L E A C H E D O I L T A N K
T O W IN T E R IZ E R(C O O L E D T O 1 0 0C )
D E W A X E D O I L T OD E O D E O D O R IS E R
(8 0 0C )
H E A T E X C H A N G E
D E O D O R IS E R
P L A T E C O O L E R (5 0 0C )
V A C U U M
C O N D E N S O R
T A N K
E F F L U E N T M I X E DW IT H F A T T Y A C ID S
F I L T E R
B L E A C H I N G E A R T H
L I V E S T E A M ( 2 4 0 0C )
N 2 G A S
S O A P
A C I D O I L P L A N T
H 3P O 4N a O H
Figure 1.1: Schematic diagram of refinery process
Figure 1.2: Schematic representation of the five plants at Company X and the effluents produced
TO SEWER
SOAP PLANT
REFINERY PLANT
PIT 1
PIT 2
PIT 3
PIT 4
EFFLUENT PLANT
DEODORISER EFFLUENT
ACID OIL PLANT
LYE
SOAP WATER
ACID WATER

- 3 -
Table 1.1: Typical effluent volumes produced by each plant per week
DAY
(24 HOURS)
REFINERY EFFLUENT(tons/day)
LYE
(tons)
ACID WATER
(tons) MONDAY 96 15 15 TUESDAY 96 10 15 WEDNESDAY 96 20 15 THURSDAY 96 7 15 FRIDAY NIL NIL 15
The processing of vegetable oil, both milling and refining, depends on water availability.
During edible oil processing, the industry consumes approximately 2 million cubic meters
of water annually. A typical oil plant discharges about 40% of the incoming water to the
sewer system and the remaining 60% is either vaporised in many cooling circuits, or else
leaves the site in one of the secondary products or by-products. Hence, the Specific Water
Intake (SWI) for the edible oil industry is very high compared to other industries in South
Africa. In a study that was conducted by Steffen, Robertson and Kirsten (WRC, 1989),
they found that the SWI ranged between 2.1 and 3.1 m3/ton for milling and between 3.2
and 4.6 m3/ton for refining. Based on the results of their study, a target SWI of 2.0 m3/ton
for milling and 3.0 m3/ton for refining was proposed. In addition to the proposed figure for
each process, a further 5.0 m3/ton SWI for a plant milling and refining all products on site
was proposed. It was then concluded that improved SWI could be achieved only by
improving water management by the edible oil industry. (WRC, 1989).
There were three different biological treatment methods used in this study for the
treatment of edible oil effluent, i.e., Anaerobic Biological Treatment, Bench-scale Aerobic
Biological Nutrient Removal and larger Laboratory-scale Aerobic Biological Nutrient
Removal. Figure 1.3 illustrates the flow diagram of the different methods followed.

- 4 -
Figure 1.3: Flow diagram showing the research approach for treatment of edible oil effluent
1.2 WASTEWATER CHARACTERISATION OF THE EDIBLE OIL EFFLUENT
1.2.1 Introduction
Before a wastewater treatment plant can be designed for biological phosphorus removal,
it is necessary to characterise the effluent quality and quantity. For this purpose,
extensive monitoring of the effluent production is required, which includes the use of
proper sampling techniques. Flow rates and water quality parameters often change
sporadically, and these changes may affect the ability of a wastewater treatment plant to
achieve consistent biological phosphorus removal.
Given the variable nature of the edible oil effluent, which results from the varying nature
of edible oil refining process, and the necessity of attaining consistent phosphorus
removal, it is necessary to collect samples that will represent “average” characteristics
and approximate characteristics under more extreme conditions (WRC, 1989).
According to Novotny (1998), a desirable sampling method is to collect 3 - 4 hour
composite samples. This would provide data that may be considered representative of
average effluent characteristics throughout the day. Usually a careful review of flow
monitoring records and reports generated by the effluent plant over the past couple of
years, if present, tend to be helpful in assessing the periodic and seasonal
ANAEROBIC DIGESTION
(PERIOD B)
PRE-FERMENTATION
BIOLOGICAL NUTRIENT REMOVAL
(PERIOD A)
PRETREATMENT
AEROBIC BIOLOGICAL
TREATMENT USING ACTIVATED SLUDGE
(PERIOD C)
ALTERNATIVE TREATMENT TECHNOLOGY USING FUNGI,
BACTERIA AND YEAST
EDIBLE OIL EFFLUENT

- 5 -
characteristics of wastewater throughout the year (Novotny, 1998). Due to the variability
of the effluent characteristics over the period of investigation, three tables have been
presented to show the variable effluent characteristics over the respective periods, i.e.,
tables 1.2 to 1.4. Table 1.2 illustrates the chemical characteristics of 4 samples obtained
per month, of the final effluent used for the bench scale biological phosphorus removal
process.
Table 1.2: Wastewater characteristics of the final effluent (Period A)
Parameter (mg/L except
pH)
June July August September OctoberRange Mean Range Mean Range Mean Range Mean Range Mean
pH 4.6 5.9
5.6 8.8 10.6
6.5 5.7 7.0
6.5 7.1 8.1
7.7 7.6 9.9
8.6
COD 7 590 7 380
7 630 7 550 8 710
8 160 1 025 1 270
1 115 7 240 7 590
7 400 11 700 11 810
11 763
PO43- (-P) 500
590 550 910
1 140 1 020 1 640
1 680 1 660 4 320
4 510 4 400 2 110
2 180 2 140
TKN (-N) 6.08 7.96
6.93 3.21 6.26
4.78 6.54 7.19
6.82 6.98 8.67
7.65 4.36 5.81
4.98
NH4+ (-N) 0.98
1.51 1.25 0.41
0.76 0.6 1.39
2.62 2.0 1.09
1.21 1.15 2.09
3.6 2.69
SO42- 4 980
5 910 5 550 5 280
5 830 5 600 3 410
3 530 3 470 5 690
5 980 5 800 1 170
1 400 1 260
Lipids (FOG) 249 266
256 103 121
111 325 352
340 581 631
628 297 319
308
TSS 239 281
265 379 388
383 98 134
112 256 274
265 309 340
322
Alkalinity 487 542
520 465 492
480 1 670 1 760
1 720 616 649
630 742 778
766
Table 1.3 illustrates the characteristics of the final effluent used for the anaerobic
biological treatment process. Two batches of effluent were collected.
Table 1.3: Chemical Characteristics of Final Effluent used in Anaerobic treatment (Period B)
PARAMETER SAMPLE A SAMPLE BpH 6.7 6.0 COD 6848 mg/L 7254 mg/L Lipids (FOG) 2492 mg/L 456 mg/L SO4
2- 2590 mg/L 2140 mg/L TSS 1830 mg/L - TDS 24820 mg/L - TS - 11840 mg/L VS - 10670 mg/L

- 6 -
The Company X produced approximately 195 m3 of effluent per day from the refinery
process, during a 24 hr operational period. The effluent from the deodorisation process
was flocculated and used for the laboratory scale aerobic biological treatment process.
The characteristics of the raw wastewater, flocculated and corrected influent is shown in
Table 1.4. Due to the large number of analysis conducted per parameter, the results are
presented indicating the range i.e. highest and lowest values and the mean of all the
analyses.
Table 1.4: Chemical characteristics of raw effluent after deodorisation and prepared effluent
(Period C)
PARAMETERS RAW EFFLUENT POST-PRETREATMENT PREPARED INFLUENT
Ph
RANGE MEAN RANGE MEAN RANGE MEAN 3.0 - 4.9 3.8
9.4 - 8.5 9.2
6.8 - 7.3 7.1
COD (mg /L)
6190 - 8470 7250
1800 - 1950 1890
310 - 1928
N/A
FOG (mg /L)
4990 - 6840 5950
250 - 1350 440
156 - 395
N/A
TP (mg /L) 4.72 3.95
N/A
TKN (mg/L)
7.42
6.72
N/A
* Range - Parameters indicating the minimum and maximum values measured during the course of the entire investigation.
* Raw effluent � effluent obtained from industry without any correction.
* Post - pretreatment � effluent that is pre-treated with flocculent
* Prepared Influent � effluent that is corrected after flocculation (pH adjusted /diluted/ supplemented)
1.3 THE NEED FOR PRETREATMENT
Pretreatment methods are used to treat wastewater in order to improve various conditions
before subjecting to biological treatment. The effluent produced from the deodorisation
process contained high levels of organics in the form of COD and FOG’s. Preliminary
findings showed that these concentrations caused shock loading in the aerobic biological
treatment process and prevented it from functioning optimally, with regards to COD and
FOG removal. Hence, from comparative analysis of various coagulants available, the
commercial coagulant C40 was used to flocculate the raw effluent prior to aerobic
biological treatment, to increase COD and FOG removal.

- 7 -
1.4 RESEARCH OBJECTIVES
The research project was therefore designed to:
• To investigate the source of effluent production during the different stages of refining
• To chemically characterise the effluent
• To assess the efficiency of aerobic biological treatment for the removal of COD and
phosphate in the effluent
• To apply techniques for anaerobic digestion with retention of biomass for the
treatment of vegetable oil effluent;
• To study the dynamics of anaerobic biodegradation of the lipid and non-lipid
fractions of vegetable oil effluents;
1.5 REPORT STRUCTURE
The report is structured and will be presented as such:
Table 1.5 : Scope and structure of report
CHAPTER SCOPE 1 General introduction and scope of research 2 Literature review 3 (A) Prefermentation (B) Assessment of bench scale biological nutrient removal processes 4 Anaerobic Digestion 5 Pretreatment methods to enhance secondary biological treatment of edible oil effluent 6 Laboratory scale aerobic biological treatment process 7 Alternate treatment technology using yeasts, bacteria and fungi for edible oil effluent
degradation. 8 General conclusions and recommendations
- 8 -
CHAPTER 2
LITERATURE REVIEW
2.1 THE SOUTH AFRICAN EDIBLE OIL INDUSTRY
The edible oil industry has been identified to be amongst the 75 industrial groupings in
South Africa. In all, there are about 16 edible oil-processing plants, run by 10 separate
groups. These industries refine and process approximately 300 000 tons of crude
vegetable oil per year, which increases annually by about 3%. The amount of oil that is
produced locally depends very much on the climatic conditions. Good rains lead to large
maize, groundnuts and sunflower crops, which results in good oil seed production.
However, drought has negative impact in the industry, resulting in decline raw material
production. To make up for the short fall in local oil production, the balance of oil is
imported, in crude form, to be refined in the South African refineries (WRC, 1989).
Vegetable oil production can be divided into two distinct stages: crude oil production in an
oil mill; and crude oil processing conducted in a refinery. Thus the vegetable oil industry
can be divided into two main groups based on the main production process being used.
The milling industry produces crude oil from raw materials such as seed, and the refining
industry purchases and refines crude oil into final products. In South Africa, the two stages
of processing are usually conducted on the same site, although marine oils and animal
fats, where used, are purchased as such. (WRC, 1989).
The principal product of edible oil refinery is liquid oil, which may be sold as cooking or
salad oil, or may be further processed to increase the market value of the final product, for
example, margarine, peanut butter and mayonnaise. Vegetable oil may be obtained from
large variety of monocotyledonous and dicotyledonous seeds. The most commonly grown
oil bearing crops in South Africa are the sunflower, groundnuts, and maize although other
seeds such as cotton and soya are also processed. (WRC, 1989)
- 9 -
2.1.1 The Refinery process and its effluents
The refinery is associated with the removal of phospholipids, colour bodies and other
soluble and insoluble impurities from crude oil. The production of refined vegetable oil can
be divided into two variable processes or stages viz., chemical refining and physical
refining. Although the two stages are different from each other and produce different
effluents, the products in both stages are similar in quality i.e. refined vegetable oil ready
for commercialization.
2.1.1.1 Degumming
Degumming may be considered the first step in the refining process and is designed to
remove the phosphatides that interfere with subsequent processing. Oils high in
phosphorus such as soybean, corn and sunflower, may require degumming prior to the
refining process. The primary reason for degumming is to either provide crude-degummed
oil suitable for storage or long transit, to prepare oil for physical refining, or to produce
lecithins. There are three main problems that are associated with the presence of gums in
the crude oil, which are:
(a) Phospholipids have excellent emulsifying abilities. Thus when discharged as soap
stock, they introduce problems for oil-water separation in the acidulation process,
thus, resulting in increased product loses during chemical refining.
(b) Gums have the tendency to impart deep brown colouring to finished oils during the
deodorising stages as a result of the high temperature that are employed.
(c) They tend to form complex compounds with certain trace metals that adversely
affect product stability.
Water degumming is effective only for water-hydratable phosphatides i.e. those having a
greater affinity for water phase rather than remaining in the oil phase. The addition of hot
water and, subsequent, separation of the swollen insoluble gums, by centrifuge, easily
removes them. For non-hydratable gums, pretreatment of the oil with phosphoric acid or
citric acid is required to render them hydratable. The then hydratable gums are
subsequently removed through addition of small amounts of water followed by
centrifugation. Many variations on this two-stage process exist. (Horan, 1990).

- 10 -
The effluent produced during the degumming stage tends to contain quantities of
phospholipids, inorganic phosphates (from phosphoric acid) and FOG.
2.1.1.2 Chemical Refining
Chemical refining, also known as caustic refining, generally refers to the process designed
to neutralise free fatty acids present in the oil by introduction of an alkali, followed by
centrifugal separation of the, heavy phase, insoluble material. Caustic neutralization is the
traditional first step for edible oil processing if degumming is not included as a
pretreatment step. Caustic refining is made up of five inter-related processes and each
process produces its own unique effluent. The five processes are neutralization,
bleaching, hydrogenation, winterizing and deodorizing. The advantage of caustic refining
over the alternative method is its reduced sensitivity to the type of feedstock used.
A. Neutralization:
Crude oil contains a percentage of free fatty acids (FFA). The FFA’s or carboxylic acids
are a product of natural degradation of triglycerides. Dilute caustic soda solution of up to
4N strength is usually used for neutralisation. The oil-alkali solution is thoroughly agitated
to ensure intimate contact, normally using an inline high-shear mixer. Both the oil and
caustic soda should be cooled to less then 38C. Careful control of the operating
conditions is required at this stage as the strong caustic soda used tends to saponify the
neutral triglyceride with the consequent loss of neutral oil (Hui, 1996a).
The neutralisation process also helps with the removal of metals, particularly magnesium
(Mg) and calcium (Ca). Apart from saponification of free fatty acids in the crude oil, caustic
addition tends to be more effective in hydration of gums than simple addition of hot water
only. Thus, it is possible for crude oil containing low gum contents to be processed
chemically without the need for an additional degumming pretreatment step (Hui, 1996a).
The immiscible soap or soapstock, produced during neutralisation, is separated from the
neutralised oil using centrifuges or gravitational settling, depending on whether the
operation is continuous, semi-continuous or a batch process. Phosphoric acid may be
added in the wash water to reduce the residual soap in the refined oil, and to provide a

- 11 -
better split between the oil and aqueous phase. The soapstock is further treated in the
acid oil plant (on-site) to produce acid oil (WRC, 1989; Hui, 1996a).
Chemical refining with caustic soda gives rise to the most potent effluent generated at an
oil processing plant. The resultant effluent stream is known as soapy water and contains
quantities of FFA’s, free oils, gums or phospholipids, sodium ions and phosphates (Eroglu
et al., 1990).
B. Bleaching
Bleaching is the adsorptive process that is associated with edible oil refining process.
While the degumming operation is designed to remove phosphatides and caustic refining
converts water soluble FFA’s into soluble soaps, adsorptive bleaching provides the last
practical opportunity to remove the remaining impurities, especially colour and
phospholipids, to acceptable levels. The major colour pigments found in edible oil are
chlorophyll (green) and caretenoids (orange) (Hui, 1996a).
C. Dewaxing
Dewaxing which is sometimes called winterising, refers to the removal of high melting
point waxes extracted from certain oil seeds such as corn, sunflower and canola. The
refined oil is cooled to approximately 5C thus causing the high melting point esters and
waxes to crystallize. These fat crystals are subsequently removed through filtering usually
with the assistance of diatomaceous earth as a filter media (Hui, 1996a). The winterising
process is only necessary for oil products that are going to be marketed as such without
any further processing. It is usually not necessary to winterize the oil that is to be, further,
hydrogenated. This stage of edible oil refining contributes little, if any, effluent to the final
effluent stream both qualitatively and quantitatively (WRC, 1989).
D. Deodorising
This is typically the last step in the edible refining process. This step is included in almost
all-refining operations regardless of other unit operations used. The deodorisation process
is intended to remove the relatively volatile odoriferous compounds from the refined oil.
This process involves steam distillation, under vacuum, which results in the removal of
residual FFA’s, aldehydes and ketones that are responsible for the unacceptable odours

- 12 -
and flavors in the final refined oil. Removal of pigments is through thermal decomposition.
These decomposition products, from the pigments, are subsequently distilled off from the
final oil product. After the deodorisation process has been completed, the refined oil is
cooled in the lower tanks before being pumped for storage. Small quantities of citric acid
may be added during the cooling stage as an anti-oxidant to prevent oxidation of the
cooled oil (Hui, 1996a).
Deodorisation is the second greatest effluent generating stage following the neutralisation
process. Most of the effluent that is produced during this stage consists of the distillate
from the oil and contains volatile compounds responsible for the oil’s characteristic odour,
as well as, any remaining FFA’s. A large quantity of water is also used during this stage
for cooling purposes, which increases the SWI of the plant. Some of the stripping stream
and the remaining FFA water vapors are mixed with the cooling water. After this has been
recirculated over cooling towers, it is then discharged down the drain to join the main
effluent stream (WRC, 1989).
2.1.1.3 Physical Refining
Physical refining refers to the process whereby the FFA’s in the crude or degummed oils
are removed by evaporation rather than by being neutralised and, subsequently, removed
as soap stock similar to the alkali refining process. The physical refining technique has two
main advantages compared with the conventional caustic refining route; reduction in oil
losses and the elimination of soapstock and its associated treatment problems.
The physical refining process, however, requires that the feedstock or crude oil be
rigorously pretreated to ensure it is free from phosphatides, impurities, trace metals and
earth-removable pigments. If these impurities were allowed to remain in the oil, the high
temperatures used during the processes would darken the oil and result in a poor quality
product. The extent of pretreatment necessary depends on the particular oil type and its
quality. Pretreatment of high fatty acid containing oils such as maize and sunflower, prior
to physical refining, may comprise the addition of phosphoric acid or citric acid at
temperatures of approximately 70C followed by high-speed centrifugation to remove the
hydrated gums. The centrifuged oil is then dried, bleached and winterized before being
sent for physical refining. Both continuous and semi-continuous units may be used for

- 13 -
physical refining process. The effluent streams resulting from physical refining are similar
in quality to those produced during the degumming and deodorizing stages of caustic
refining.
2.1.2 The Acid Oil Plant and its Effluents
The main product of the acid oil plant is the acid oil, which is produced from a feedstock
commonly known as soapstock. Soapstock is the byproduct of crude oil neutralisation with
caustic soda during the chemical refining process. The resulting oil and water phase have
very high concentrations of FOG’s, Total Suspended Solids (TSS), Biological Oxygen
Demand (BOD), COD loads, as well as, glycerin and FFA’s. Due to these high
concentrations, most processors include acidulation as part of the integrated facility.
Acidulation is one of the least desirable processes in the integrated facility. The process is
rather difficult to perform effectively and it is generally the most cost ineffective process
since it has no significant financial returns. The acidulation system is based on gravity
separation that can be performed in either a continuous or a batch operation. The process
involves collecting soapstock into an equalisation or holding tank. The mixture is heated
and then treated with sulfuric acid at a controlled pH of about 2 to 2.2 units. After the
reaction with the acid, the mixture enters a series of holding and settling tanks where the
oil and the aqueous phases separate. Acid oil is skimmed off the top surface, and then
dried. The acid oil may be sold, as is, or may be passed through an evaporative heat
exchanger to remove excess water. The product is then sold as a feed supplement or may
be used as a feedstock for soap and other industrial applications (Hui, 1996a).
The acid water effluent, produced during acidulation, may be neutralized with lime or other
alkaline material prior to its discharge to the main effluent stream. This stream is heavily
polluted with high concentrations of COD, BOD, TSS and sulfates. Most of the
contaminants in this stream by far exceed the municipal discharge standards.
2.1.3 The Soap Plant and its Effluents
At the industry, the main product of the soap plant is bar soap. No powdered soap is
produced or manufactured on site. The soap manufacturing process may be performed as
either a batch or continuous operation. The acid oil, which contains fatty acids from the

- 14 -
acidulation phase, is neutralised using strong caustic hydroxide solution. The free fatty
acids, which result from the acid oil, react with excess sodium hydroxide to form sodium
salts which precipitates out of solution. After centrifugation and further treatment, the soap
is then molded into desired shapes before being sold (Hui, 1996a).
The effluent stream produced in this plant is generally known as lye water and usually
contains quantities of oils, FFA’s, sulfates, and some sodium salts of FFA’s. This stream is
usually combined with acid oil water prior to its discharge to the final effluent stream.
2.1.4 Wash Down and Miscellaneous Effluents
Wash-down effluents are those effluents that emanate from regular cleaning of the edible
oil factory. This cleaning is generally performed after a week’s production or between
changes of feedstock. Batch equipment may be cleaned after each batch has been
processed. The cleaning of vessels is usually performed using live steam and hot water,
to ensure maximum use of steam and the reduction in effluent volumes. Floor cleaning is
conducted using hot water as necessary, which improves hygiene and reduces manual
labor. The fats and oil bearing effluent stream resulting from cleaning is discharged to the
main effluent stream via fat traps. The oil rich scum from the fat traps is recovered and
recycled for reworking (Hui, 1996a).
2.2 IN-SITE EFFLUENT TREAMENT METHODS EMPLOYED AT COMPANY X IN
PIETERMARITZBURG
The three main effluent streams that are generated from the four main plants (see Figure
2.1) are channeled to the on-site effluent treatment plant. This plant is dedicated for
treatment or pretreatment of incoming effluent prior to its discharge to the municipal sewer
system. The three main effluents are the refinery effluent from the refinery and packaging
plants; the acidic effluent from the acid oil plant; and lye from the soap plant. The effluent
plant comprises of two big holding tanks, pH correction tank, DAF unit and two settling
tanks that are operated in series Fig. 2.1. Acidic effluents i.e. lye and acid water, are
pumped and mixed together in the first holding tank. This effluent has a low pH of about 1
- 2 and is highly corrosive to concrete because of its sulfate content. On the other hand
the refinery effluent has a high pH content ranging between 12 and 13. This effluent is

- 15 -
pumped to the second holding tank. There are two methods for effluent treatment that are
currently being used at the plant. The two effluent treatment methods are pH correction
and physical separation of oil and grease using DAF. After DAF treatment, lime and/or
ferric chloride is added to the effluent, which is followed by settling in the two settling tanks
in order to remove precipitated particles. The resultant effluent is discharged to the sewer
system to be treated by Darvill Wastewater Works.
Figure 2.1: Schematic representation of the effluent treatment plant at Company X in
Pietermaritzburg (Adapted from Surujlal, 1999).
2.2.1 pH Correction
The effluents from the two holding tanks are mixed together into a single effluent stream.
Because of the pH differences between the two effluent streams, the two streams are
mixed at different volume ratios by controlling the flow rates from the two tanks such that
the desired final pH of between 5.5 and 8.5 is achieved in the final combined effluent
stream. This effluent is finally directed to the acid equalisation tank for final pH adjustment.
The effluent at this stage may be dosed with a polyelectrolyte such as lime or ferric
chloride to coagulate fats and to precipitate phosphates. This effluent is now ready for
DAF treatment.
DAF PUMP
FINAL SETTLING TANKS
Capsule Tank
LYE & SOAP WATER TANK
REFINERY EFFLUENT
TANK
pH BALANCING
NEUTRALISATION POINT
PUMP
FINAL EFFLUENT
DAF
TANK

- 16 -
2.2.2 Dissolved Air Flotation (DAF)
Dissolved air floatation process is a separation technique that employs the production of
micro size (10-100 m diameter) air bubbles to separate solids from liquids. A DAF
system consists of three main unit processes, which are the pressurization system in the
capsule, the floatation tank and the recycle system.
2.3 THE EFFLUENT PROBLEM AND LEGISLATION
Out of an estimated total of 16 edible oil factories in South Africa, only one factory was
reported to be treating its effluent completely using biochemical methods. The rest of the
edible oil plants generally use DAF for physical removal of FOG and pH correction (WRC,
1989). Even after application of these treatment methods, the remaining emulsified grease
tends to clog the sewer pipes and pumps. The high organic (BOD and COD) and
phosphorus loads create shock-loading problems for the receiving wastewater treatment
installations (Eroglu et al., 1990).
At present the Department of Water Affairs and Forestry monitors water resources
pollution from point sources by legislating that the effluents from industries must comply
with the uniform discharge standards that are set at technologically attainable levels.
These controls or regulations limit the rate of deterioration of the receiving water bodies.
The National Water Act, 1998 (Act 36 of 1998) is the controlling legislation for the control,
development, utilisation and protection of water resources in South Africa. The National
Water Act, 1998 replaces the old Water Act, 1956 (Act 54 of 1956), which was motivated
by the need for new legislation that would reflect democratic principles and equitable
access to water resources by all symbolised by the slogan “Some for all, Forever”
(Department of Water Affairs and Forestry, 1997). The Act provides for the compulsory
purification of effluents by the user to specified standards and its subsequent disposal in a
manner that will make it available for reuse.
The local authorities (the Pietermaritzburg-Msunduzi Transitional Local Council) and the
municipal sewage treatment plants (Darvill Wastewater Works) have increased pressure
on industries to increase the efficiency of in-house effluent handling and treatment

- 17 -
methods. Therefore industries are becoming more pro-active with regard to viable
biological treatment methods which may be implemented on-site to supplement the
existing physico-chemical effluent treatment methods.
2.4 THE EUTROPHICATION PROBLEM
Eutrophication is a natural aging process that occurs regularly in lakes over hundred of
years and is usually limited to quiescent bodies of water such as lakes and impoundments
(Lilley et al 1997). The natural eutrophication process results from continuous enrichment
of impoundments with nutrients, notably phosphorus and nitrogen. This natural process is
however greatly accelerated by human activities in the catchment areas of lakes and
impoundments, through the increased input of nutrients (Bolitho, 1976).
Gross eutrophication is marked by massive increase in algal and/or mycrophytic growth in
the catchment area. This condition is reached when the inorganic soluble nitrogen and
phosphorus load to impoundments attains concentrations in excess of 0.3 mg/L nitrogen
and 0.05 mg /L phosphorus, respectively (Lilley et al., 1997). Algal species that are usually
associated with eutrophication can be divided into four main groups: the blue green algae
(Cyanobacteria), the green algae (Chlorophyta), the Diatoms, and the Flagellate. These
organisms are used as effective indicators of eutrophication as they form the majority of
species present under eutrophic conditions (Rudd, 1979).
Although algae form an essential part of the aquatic environment, their excessive growth
is detrimental to the aquatic ecosystem. When algal blooms die in large numbers and
decay a large pool of nutrients is released into the water body, which, results in
accelerated growth of other organisms. Consequently, the oxygen content of the water
body is depleted and the lower water (hypolimnion) becomes anaerobic due to thermal
stratification. This eventually results in eutrophication significantly inhibiting other
vertebrate animals in the water column.
Studies on causes and control of eutrophication (Chutter, 1990; Dillon and Molot, 1996)
have shown that eutrophication can be effectively controlled if the nutrient load to the
receiving waters is strictly regulated. Because of the ability of some blue-green algae to fix

- 18 -
atmospheric nitrogen gas to support primary production, it is therefore virtually impossible
to control eutrophication by limiting nitrogen. Thus, in most cases phosphorus has been
shown to be the limiting nutrient (Chutter, 1990; Dillon and Molot, 1996; Orhon and Artan,
1994).
In South Africa, eutrophication is enhanced by the long storage times of dams and
reservoirs, with resultant accumulation of phosphate and nitrate, and the high summer
temperatures, which promote algal growth (Bolitho, 1976). This eutrophication potential is
still further enhanced by a rapid increasing population, irregular rainfall often leading to
drought conditions; irrigation demands by the agricultural industry; industrial requirements;
and loss of source supply due to degradation of rivers (Joska and Bolton, 1994).
In 1980, a special standard was promulgated in South Africa limiting the soluble ortho-
phosphate concentration from point source discharges to less than 1 mg/L for certain
sensitive catchment areas. A five years grace period was allowed before enforcement, to
allow for the phosphorus removal technology to be developed and implemented. This
stimulated considerable research in South Africa towards the understanding of the
mechanisms that are involved in the biological phosphorus removal process and towards
further development and refining the technology for practical implementation (Government
Gazette, 1984).
2.4.1 Source of Nutrients (Phosphorus)
Nutrients that cause rapid eutrophication are introduced to the water environment by
human activity from both diffused and point sources. In this study more attention was
focused on the nutrient phosphorus.
2.4.1.1 Diffused Sources
Phosphorus is introduced to the environment in relatively small concentrations over large
areas due to run-offs from rural and urban areas. The widespread use of agricultural
fertilizers has a major contribution to this source of phosphorus pollution. In most
instances, control and treatment to remove phosphorus from this source is not
economically feasible, especially phosphorus originating from rural run-offs. For urban run-
offs, natural and artificial reed beds are used as systems for phosphorus removal from

- 19 -
contaminated water. In these systems the soluble phosphorus in waste streams is
converted to phosphorus trapped in the reeds that grows in the beds. The entrapped
phosphorus in reeds is removed when the reeds are harvested. Some soluble phosphorus
is not removed from the reed beds but remains trapped in the sediments lying at the
bottom of the reed bed. This soluble phosphorus accumulates continually in the sediments
(Lilley et al., 1997)
2.4.1.2 Point Sources
This phosphorus pollution is mainly due to industrial and domestic effluent discharges. In
South Africa 80% to 90% of nutrients in water originates from point sources. This type of
phosphorus pollution is easy to control because pollutants from the residential and
industrial areas are concentrated to a point by means of sewers and treatment methods
are readily available (Wentzel, 1992). The edible oil industry in South Africa is both a
major water consumer and polluter (WRC, 1989). In anticipation of water shortages in
South Africa the then Water Act, (Act 54 of 1956), which was later replaced by the
National Water Act, 1998 (Act 36 of 1998), made provision for the compulsory purification
of effluents by industries (including municipal wastewater treatment works) to specified
standards and its subsequent disposal in a manner that would make it available for reuse
(Department of Water Affairs, 1986). To comply with the effluent discharge standard of 1
mg/L phosphorus, Darvill Wastewater Works is increasing pressure on the industries
around the Pietermaritzburg area to implement cleaner production technologies and some
form of an in-house effluent treatment system prior to discharge to the sewer system. As a
result, the current study was initiated in conjunction with the edible oil industry to find a
biological solution to reduce the phosphorus load in the effluent, prior to its discharge to
Darvill Wastewater Treatment Works for final purification.
2.5 TREATABILITY OF EDIBLE OIL EFFLUENT
Food processing effluent including effluent from the edible oil processing industry is a
complex mixture of floating, settleable, suspended and dissolved materials. Complete
treatment of these effluents requires a combination of physical, chemical and biological
treatment processes (Dalzel, 1994). The physical nature of fatty material is of great
concern when considering any purification method. The fatty contaminants in the edible oil
- 20 -
effluent can be characterized in three ways viz.: by polarity, biodegradability and physical
characteristics. Polar contaminants are usually derived from animal and vegetable
sources such as food industry operations including edible oil processing industry. Where
as, the non-polar contaminants are derived from petroleum and mineral sources and are
generally non-readily biodegradable (Grant, 1980; Mcdermott, 1982; Sutton et al., 1994)
It used to be a common practice to group effluents from the edible oil processing industry,
which has polar and readily biodegradable fatty components, with effluents arising from
the petrochemical industry, which is non-polar and non-readily biodegradable. As a result
of this joint grouping of petrochemical effluents and the effluents from the food industry,
the vegetable oil processing industry has been widely targeted as problematic (Grant,
1980).
2.5.1 Physical Treatment
The effluent from edible oil processing industry carries an appreciable amount of fatty
material or FOG. Prior to any form of treatment, it is desirable to install an oil/water
separation system as the first phase. This will reduce the pollution load being discharged
and, also, facilitate the recovery of re-usable fat. The separation of the water and oily
phases from the edible oil effluent can be archived using two simple methods, which are
gravity settling and DAF process.
2.5.1.1 Gravity Settling or Fat Traps
The removal of fatty matter or FOG has for many years been achieved through fat traps.
The gravity fat trap is usually installed as standard equipment on all process effluent
streams and is the simplest form of physical treatment (Eroglu et al., 1990). Fat traps are
designed to produce a slow and gentle uniform flow through a tank, which allows density
differences to bring the fatty material to the surface without disturbing any accumulated
scum and sludge. Fat removal can then be done by using surface scraping mechanisms
(Dalzel, 1994; Grant, 1980).
Fat traps are designed according to general settlement principle. According to Dalzel
(1994) a typical fat trap has a length to width ratio of 2:1, a retention time of 10 - 40
minutes and the loading of 0.4m3/m2/h to 3 m3/m2/h at maximum flow rate. The problem
- 21 -
with fat traps is that they are expensive and occupy a large surface area, which makes
them unsuitable for many industrial applications, especially for small industrial
establishments (Dalzel, 1994; Grant, 1980). The disadvantage of using gravity fat traps is
that they are unable to reduce the emulsified fatty material content of wastewater to under
500 mg/L, the maximum concentration permitted to be discharged to municipal sewer
systems (Eroglu et al., 1990).
2.5.1.2 Dissolve Air Floatation (DAF)
A common problem with fat containing effluents is precipitation and emulsification due to
pH, temperature, pumping and detergents. Under these conditions, gravity separation with
a simple fat trap rarely gives satisfactory results and an alternative that is often used is
assisted floatation, in this case, DAF.
- Theory of Operation
Sedimentation is the separation of solids from liquids under gravity. Floatation is the
separation of solids from liquids by means of buoyancy. DAF systems are, therefore,
suitable for the removal of substances such as oils that do not settle by gravity due to their
low settling velocity (Kiely, 1997).
There are three types of DAF systems: vacuum floatation, micro-floatation and pressure
floatation. Pressure floatation is the most widely used (Letterman et al., 1999).
In pressure floatation, air is dissolved in water under a pressure of several atmospheres.
The pressurised water then enters the floatation tank, containing the effluent or
wastewater sample, by means of a pressure-release device. Different pressure-release
devices may be used, such as: nozzles, needle valves or gate valves. In the pressure-
release device, the pressure of the water is reduced to atmospheric pressure (Letterman
et al., 1999). The sudden reduction in pressure results in the dissolved air leaving the
water as fine air bubbles (Qasim, 1994). The bubble size is approximately 10 – 100 um in
diameter (Letterman et al, 1999).
High pressures produce small bubbles but at pressures higher than 500 kPa (5 Bar), there
is no decrease in bubble size (Heinanen et al., 1992; De Rijk et al., 1994 as cited in

- 22 -
Edzwald, 1995). A pressure of between 400 and 600 kPa (4 and 6 Bar) is recommended
for the production of small bubbles (Edzwald, 1995).
Following pressurization and release of the water, fine air bubbles enter the floatation tank
containing the wastewater. The floatation tank is divided into two zones: the contact zone
and the separation zone. In the contact zone, there is opportunity for the contact between
the fine air bubbles and the solid particles. This leads to the formation of "bubble-solid
agglomerates” which are less dense than water. In the separation zone, the bubble-solid
agglomerates, due to their lower density, rise to the surface of the floatation tank allowing
for the separation of the solid particles from the wastewater (Letterman et al., 1999).
The agglomerates that collect on the surface of the floatation tank are called float and may
be removed either by flooding or by mechanical scraping. With flooding, the water level in
the floatation tank is raised in order that the float and water overflow into a float collection
trough. Mechanical scraping involves the movement of a scraper, with rubber blades,
over the surface of the floatation tank, which pushes the float into a collection channel.
The clarified wastewater can then be removed from the bottom of the floatation tank
(Letterman et al., 1999).
- Enhancement of DAF using coagulation and Flocculation
A. Coagulation
The objective of coagulation is to promote the settling of solids that are suspended in the
wastewater. Coagulation achieves this settling by utilising chemical coagulants that
promote agglomeration of the solids (Kiely, 1997).
Coagulation may be described as a destabilisation process. This is because the chemical
coagulant used alters the electrostatic charge of the particles so that they cease to repel
each other, but rather, agglomerate or attach to one another. This increases their size
and density resulting in an increase in their settling velocity. The particle suspension is no
longer said to be stable since the particles agglomerate and destabilisation is said to have
taken place (Kiely, 1997).

- 23 -
After having pretreated the wastewater by the addition of a coagulant, the wastewater still
requires further treatment before being subjected to DAF. Flocculation is required, to
facilitate the formation of large agglomerates or flocs (Letterman et al., 1999).
B. Flocculation
Flocculation is the agitation, or mixing, of the wastewater either mechanically or by
diffused aeration (Parker, 1975). The purpose of flocculation is to promote, by slow
mixing of the wastewater, the interaction and agglomeration of particles destabilised by
the addition of a coagulant, resulting in the formation of large flocs (McGhee, 1991).
Following the pretreatment of the wastewater - in the floatation tank – by means of
coagulation and flocculation, fine air bubbles are introduced into the floatation tank. The
bubbles make contact with the coagulation-agglomerates which have settled to the bottom
of the tank. These results in bubble-solid agglomerates which rise to the surface of the
tank due to their lower density compared with water.
Coagulation and flocculation may therefore be used to increase the amount of suspended
particle removal by the DAF system.
Other types of pretreatment used in this study include:
2.5.2 Ozonation
2.5.2.1 Theory of Operation
Ozone reacts readily with substances comprised of unsaturated bonds, readily oxidising
them. However, it does not as react readily with saturated substances, as there are no
easy chemical pathways to follow (Kloos, 2000). Ozone reacts in three ways when
introduced to organic materials.
A. Direct oxidation of ozone. This occurs at low pH and is slow and very selective.
B. Indirect oxidation of ozone whereby free radicals are formed. These are highly
reactive and may lead to auto oxidation of organic matter. This occurs at high pH
values and is fast and non-selective.

- 24 -
C. Ozonolysis where all three oxygen atoms are added at the site of a double or triple
bond resulting in the production of ozonides. Decomposition of these ozonides at
the position of the unsaturated bond forms aldehydes, ketones and acids (Hesby,
1998).
2.5.2.2 The Advantages and Disadvantages of Ozone shown in Table 2.1.
Table 2.1 The Advantages and Disadvantages of Ozone
ADVANTAGES DISADVANTAGES Generated on site. Relatively costly. Rapidly decomposes to oxygen leaving no traces
Produces biodegradable material that must be controlled
Reactions in potable water do not produce toxic compounds
Produces bromate in bromide rich waters
Sources: White, 1999, Singer and Reckhow, 1999 & Spellman, 1999.
2.5.3 Peroxone
When ozone is used as the solitary oxidant, the process is slow and very selective.
However, the supplementation of hydrogen peroxide to the ozonation process results in
the autocatalytic decomposition of ozone. This process is less selective, faster and more
powerful than ozonation (Wentworth, 2001).
2.5.3.1 Theory of Operation
Peroxone is based on the use of ozone with hydrogen peroxide to produce hydroxyl
radicals that oxidise most organic contaminants in solution (Arce Systems, 2000).
Oxidation by peroxone is due to two reactions, namely:
1. Direct oxidation of compounds by ozone.
2. Oxidation of compounds by hydroxyl radicals produced by the decomposition of
ozone (Wentworth, 2001).
Peroxone oxidises saturated organics to produce aldehydes, ketones, peroxides, bromate
ions and biodegradable organics (Arce Systems, 2000).

- 25 -
The difference between the ozonation and peroxone procedure is that ozonation relies
heavily on direct oxidation of aqueous ozone while peroxone relies on direct oxidation with
the hydroxyl radical. In the peroxone process the ozone molecule is short lived. However,
the increase in hydroxyl molecule concentration is greater than the decrease in ozone;
therefore, peroxone oxidation is faster and more reactive than ozonation (Wentworth,
2001).
2.5.3.2 Advantages of Peroxone
Peroxone can be applied both in and ex-situ and removes taste, colour and pesticide
residuals (Wentworth, 2001).
2.5.4 Ultrasonication
2.5.4.1 Theory of Operation
High-energy ultrasonics are stress waves which means that they create a stress or
deformation of the medium through which they are passing (Encyclopaedia Britannica,
1983). The effects of these waves are irreversible and arise from a phenomenon referred
to as cavitation (Blitz, 1963). When added to an aqueous medium, the sound produced
acts as a source of vibration, causing the molecules to vibrate, which alternately compress
and stretch the molecular structure (Dirkgroup, 2000). The compression and stretching
causes pressure changes. Cavitation occurs when, in a liquid, the ultrasonic pressure
exceeds the normal average pressure causing the pressure in the liquid to fall below zero.
This results in ruptures in the liquid, facilitating the formation of small cavities, which, as
the pressure increases, expand to form bubbles. As the pressure decreases, the bubble
becomes unstable and collapses. At the end of the collapse, gas within the cavity will be
extremely compressed. To relieve the pressure, shock waves will be released (Blitz,
1963). These waves have the ability to promote chemical reactions in certain liquids e.g.
the depolymerisation of a high polymer substance (Encyclopaedia Britannica, 1983).
2.5.5 Chemical Treatment
Chemical treatment and/or pretreatment can, in many instances, improve the performance
of physical and biological processes used in effluent treatment. The most commonly used
chemical methods for effluent treatment are pH correction and coagulation to improve
- 26 -
settlement rates by increasing particle size density (Dalzel 1994; Lilley et al., 1997; Eroglu
et al., 1990).
In South Africa, all but one edible oil manufacture uses chemical treatment as the sole
effluent treatment method to reduce the pollution load prior to discharge to the municipal
sewer system or receiving river body (WRC, 1989). Chemical treatment is used mainly for
carbonaceous and phosphorus removal from wastewater. Lime is the most widely used
chemical coagulant for both COD and phosphorus reduction (Lilley et al., 1997). Chemical
phosphorus removal through phosphate precipitation can also be achieved using iron
(Fe3+) and aluminum (Al3+) salts such as ferrous sulphate; ferric sulphate; ferric chloride;
aluminum chloride; and aluminum sulphate (Dalzel, 1994; Loots et al., 1994; Lilley et al.,
1997; Grant, 1980).
At the edible oil industry, lime and ferric chlorides are added to the neutralized effluent up-
stream of the DAF unit. Eroglu et al., (1990) reported that ferric chloride was the most
effective coagulant during physicochemical treatability studies, and that it resulted in a
BOD5 reduction of 36%.
2.5.5.1 Advantages of Chemical Treatment
Chemical phosphorus removal in wastewater is reliable, and with strict control, a
consistently low effluent phosphorus concentration can be achieved (Lilley et al., 1997).
Chemically bound phosphorus is not easily dissociated in water, which prevents the
release of the bound phosphorus back into the water body (Loots et al., 1994). When alum
is used as a coagulant, it is possible to recover both aluminum and fatty material from
fat/alum flocks through acid splitting (Pope et al., 1975 as cited from Grant, 1980).
2.5.5.2 Disadvantages of Chemical Treatment
The chemicals that are used during chemical treatment are corrosive in nature (strong
oxidizing agents) and hence great care is required when handling them, which, in turn,
necessitates the use of expensive equipment that is resistant to corrosion (Lilley et al.,
1997) Chemical treatment of effluent, is expensive due to the high price of chemicals.
Pitman, (1991) estimated (10 years ago) that chemicals would cost the Johannesburg City
council approximately 10 million rand per year if they were to continue using chemical

- 27 -
treatment alone. An additional problem associated with chemical usage, is the increased
mineralization of water through the release of ions. Chemical coagulants usually contain
chlorides or sulphates, which remain in solution, thus increasing the conductivity or the
salinity of the receiving water body.
2.5.6 Biological Treatment
Biological treatment technology offers an efficient and cost-effective means for treating
edible oil industrial wastewater. Biological treatment of edible oil effluent may be carried
out either aerobically, anaerobically or using the combination of both (Hui, 1996b; Eroglu
et al., 1990, Grant, 1980, Seng, 1980).
2.5.6.1 Anaerobic Treatment Process
Anaerobic digestion has long been practiced as a stabilization process for waste sewage
treatment sludges, but the process has not been widely adopted for effluent treatment,
with only very high strength industrial effluent being seriously considered (Grant, 1980).
The effluent from the vegetable oil refining industry is loaded with sulphates, fats and
organic matter, which makes anaerobic treatment an attractive alternative prior to any
aerobic treatment process. Studies by Eroglu et al., (1990) have shown that lime addition
and activated sludge treatment does not bring about appreciable decrease in the sulphate
concentration from the acidic effluent.
In the anaerobic digestion of high strength industrial waste containing high level of
sulphate, the two process of concern are sulphate reduction and methane production, the
latter being inhibited by the former (Eroglu et al., 1990). In their study, Eroglu et al., (1990)
reported a 60% sulphate reduction in an anaerobic filter reactor with a concurrent
reduction of 60% for COD. From this study the conclusion was that anaerobic treatment of
acidic effluent from the edible oil refining industry might be used to replace chemical
treatment as a pretreatment step.
2.5.6.2 The Activated Sludge Treatment Process
The activated sludge treatment is generally considered to have its origin in the aeration
experiments which were carried out by Ardern and Lockett at Manchester in 1914 (Droste,

- 28 -
1997) Activated sludge is a suspended growth system which could be defined as a
suspension of microorganisms, both dead and living, in wastewater.
Figure 2.2: A diagrammatic representation of a conventional completely mixed activated sludge system with hydraulic control of sludge age and recycle.
Since its inception, the activated sludge process has become one of the main methods
used world-wide for the purification of wastewaters that contain biodegradable organic
compounds, for example, domestic sewage (Horan, 1990; Droste, 1997). The
conventional activated sludge treatment process involves two distinct operations usually
performed in two separate basins; aeration in the aeration chamber and settling in a
secondary settling tank (Fig. 2.3)
The principal unit in the activated sludge process is the aeration tank or the biochemical
reaction vessel. The content of the aeration tank comprises of an aerated mass of
microorganism conglomerates, termed flocs, surrounded by the influent wastewater; this
combined mixture of flocs and raw wastewater is termed the mixed liquor. The activated
sludge flocs are aggregates of microorganisms, inorganic and organic colloidal material
and larger particulate matter, all held together in a compact organic matrix. A large number
of protozoa, free-swimming ciliates and flagellates are found both in the mixed liquor and
in the flock matrix (Horan, 1990). The flocs are mixed with incoming sewage in the
presence of oxygen, which is supplied through aeration. In the aeration basin, some of the
substrate is completely oxidized into harmless end products of carbon dioxide, water, and
other inorganic substances that are required to provide energy for the growth of
microorganisms (Horan, 1990; Bitton, 1994; Droste, 1997).
WASTE SLUDGE
AEROBIC REACTOR
SECONDARY SETTLING
TANK
SLUDGE RECYCLE
EFFLUENT
WASTE SLUDGE
INFLUENT

- 29 -
The second phase in the activated sludge treatment process is the separation of the
biomass and other suspended solids from the treated wastewater. This is accomplished in
a secondary settling tank. Under the quiescent conditions of the secondary settling tank
the activated sludge flocs settle rapidly to yield sludge with high concentrations of solids. A
certain amount of the settled sludge is recycled back to the aeration tank while the
remainder is removed from the system through wastage on a continuous or intermittent
basis. Consistent wastage of sludge ensures that the concentration of biomass in the
aeration chamber remains constant within the desired range (Droste, 1997; Qasim, 1994,
Horan, 1990). The clarified effluent at this stage is relatively devoid of any suspended
particles and may be discharged into a watercourse after tertiary treatment, which includes
chlorination or irradiation.
Optimal operation of a conventional activated sludge process depends on the
manipulation of the three basic design parameters, which are: organic loading rate (Bx) or
the sludge age (Rs); maintaining the correct mixed liquor volatile suspended solids
(MLVSS) value and dissolved oxygen (DO) concentration in the mixed liquor (Horan,
1990). Bx is frequently used as a key design parameter, since its use allows the
determination of the required biomass without the need to make reference to the process
kinetics coefficients. The choice of limiting values that may be assigned to the main design
parameter to achieve a particular level of performance in the purification of a particular
wastewater is most reliably made through pilot plant operation. The final quality of the
treated effluent is always a key consideration in the design and operation of any activated
sludge process although other operation factors or parameters also influence the choice of
Rs and Bx. The more important factors are the degree of stabilization of the sludge
biomass to be archived and the requirement to produce a sludge biomass with good
settling properties (Horan, 1990, Qasim, 1994)
2.6 BIOLOGICAL NUTRIENT REMOVAL TREATMENT PROCESS
Biological nutrient removal (BNR) refers to the removal of primary nutrients (carbon,
nitrogen and phosphorus) from wastewater that could, subsequently, cause eutrophication
(Ekama and Wentzel, 1997; Lilley et al., 1997). Nutrient removal is accomplished by
manipulating the activated sludge process configuration to create environmental

- 30 -
conditions that are conducive to the optimal growth and activity of the microorganisms
responsible for the removal of nutrients from wastewater (Wentzel and Ekama, 1997).
BNR is mediated by a highly diverse mixed culture that develops in the modified activated
sludge process. These mixed cultures work in sequence to remove different components
at different stages of the process, that is, some lie dormant while others are actively
metabolising (Wentzel and Ekama, 1997).
2.6.1 Carbonaceous Energy (COD) Removal
Carbon in wastewater streams occurs in organic and inorganic forms. Heterotrophic
organisms use organic compounds for their metabolism while the inorganic compounds
are metabolized by a group of organisms collectively termed autotrophs. Both forms of
carbon are removed from wastewater through a series of oxidation and reduction (redox)
reactions, oxidizing the carbon source to carbon dioxide and water. The carbon dioxide
then escapes to the atmosphere, thus removing carbon from wastewater.
The energy content of wastewater can be expressed using common substrate
parameters, which are 5-day biological oxygen demand (BOD5) and/or COD (Orhon et al.,
1999; Lilley et al., 1997). The COD test is the mostly used as a monitoring parameter at
treatment works since it is quicker and gives a more accurate reflection of the energy
content of the system than the BOD5 test (Ekama et al., 1984; Orhon et al., 1999; Lilley et
al., 1997)
In a BNR process, the carbonaceous material or the COD content of the system is divided
into three main forms viz. non-biodegradable; biodegradable; and heterotrophic active
biomass (Wentzel et al., 1995; Orhon et al., 1999; Dold et al., 1991). The non-
biodegradable COD has two sub-fractions, the non-biodegradable particulate and the non-
biodegradable soluble. The biodegradable COD, also, has two sub-fractions, the slowly
biodegradable (SBCOD), and the readily biodegradable (RBCOD) fractions. Both the
RBCOD and SBCOD fractions are based wholly on the dynamic response observed in an
activated sludge system (Dold et al., 1980, as sited from Wentzel et al., 1995),

- 31 -
2.6.2 Biological Phosphorus Removal
Biological phosphorus removal is a well-documented phenomenon that is used to reduce
phosphorus in wastewater. Soluble ortho-phosphate in wastewater is converted into
stored phosphorus (trapped) in the biological sludge mass of the activated sludge system.
The stored phosphorus is then removed from the system with the sludge that is wasted
daily (Ekama et al., 1984; Bdjanovic et al., 1997). Excess biological phosphorus removal
(BEPR) refers to the biological uptake and subsequent removal of phosphate by the
activated sludge in excess of the amount that is removed by “normal” completely aerobic
(or conventional) activated sludge systems. This process results from the cooperation of
different groups of bacteria, primarily fermentative bacteria, phosphorus- accumulating
bacteria (poly-P bacteria), other heterotrophs, and autotrophs (Danesh and Oleszkiewcz,
1997). Traditionally, bacteria of the genus Acinetobacter spp. were considered to be
mostly responsible for the BEPR process (Fuhs and Chen, 1975; Buchan, 1981; and
1983). Other studies (Lötter and Murphy, 1985; Sidat et al., 1999; Atkinson, 1999) have
shown that, in addition to Acinetobacter spp., other bacterial species including Gram-
positive, Pseudomonas spp., have the propensity to accumulate phosphorus in excess of
their metabolic needs.
To stimulate the growth and dominance of the poly-P organisms in an activated sludge
system to facilitate excess biological phosphorus removal, two conditions are required,
which are:
(a) An anaerobic/aerobic sequence of reactors
(b) Presence of VFA’s or short chain fatty acids (SCFA) (e.g. acetic acid) in the
anaerobic reactor (Comeau et al., 1986; Wentzel et al., 1986; Bdjanovic et al., 1997;
Lilley et al., 1997).
These organisms will be referred to here as poly-P organisms compared with non-poly-P
organisms which cannot accumulate phosphorus beyond their metabolic requirements.
A number of mainstream processes have been developed for both nitrogen and
phosphorus removal. These processes have evolved from the activated sludge process
through the incorporation of the anaerobic sludge mass fraction (anaerobic and/or anoxic
zones) at the upstream end of the aerobic zone. In South Africa, the 5 stage Bardenpho

- 32 -
process, 3 stage Phoredox process, the Johannesburg process, UCT process, and the
Modified UCT processes are the wastewater treatment process that are commonly used
for domestic wastewater treatment (Figures 2.3a, 2.3b and 2.4c) (Lilley et al., 1997). The
general mechanism of the BEPR process is discussed in detail in the following section.
The biological phosphorus removal processes are based on the circulation of the activated
sludge biomass through a sequence of anaerobic and aerobic conditions or reactors
(Kuba et al., 1993). The exposure of the activated sludge to the alternating conditions,
stresses the poly-P organisms such that their release and uptake of phosphorus is above
the normal levels required for metabolism. The phosphorus present in wastewater is not
only used for cell maintenance, synthesis, and energy transport, but is also stored for
subsequent use by the poly-P organisms (Metcalf and Eddy, 1991).

- 33 -
MIXED LIQUOR RECYCLE
ANAEROBIC REACTOR
EFFLUENT
PRIMARY ANOXIC REACTOR
SECONDARY ANOXIC
REACTOR
REAERATION REACTOR
WASTE FLOW SETTLER
A
INFLUENT
SLUDGE RECYCLE S
Figure 2.3a: The Phoredox process for biological nitrogen and phosphorus removal
ANAEROBIC REACTOR
ANOXIC REACTOR
RECYCLEA
AEROBIC REACTR
WASTE FLOW
SETTLER
EFFLUENT
SLUDGE RECYCLE S
INFLUENT
Figure 2.3b: The 3 stage Phoredox process for biological nitrogen and phosphorus removal
ANOXIC REACTOR
RECYCLE
A
AEROBIC REACTOR
WASTE FLOW
SETTLER
EFFLUENT
SLUDGE RECYCLE S
INFLUENT
Figure 2.3c: The UCT process for biological nitrogen and phosphorus removal
AEROBIC REACTOR
ANAEROBIC REACTOR

- 34 -
2.6.3 Mechanisms of excess Biological Phosphorus removal
2.6.3.1 The Anaerobic Zone
The anaerobic zone (or reactor), in the non-conventional activated sludge system, is
characterised by a lack of nitrates (NO3), nitrites (NO2) and dissolved oxygen (DO), and
has two primary functions (Ekama and Marais, 1984):
(i) To stimulate the conversion of RBCOD into VFA’s through fermentation by the non-
poly-P organisms (heterotrophs).
(ii) Enables the poly-P organisms to take up and store VFA’s as polyhydroxyalkanoate
(PHA), a process termed sequestration.
The prerequisite for the BEPR process to take place is the presence of VFA’s in the
anaerobic reactor, up stream of the aerobic zone (Wentzel et al., 1988). Upon entering
the anaerobic reactor, the RBCOD fraction of the total influent COD is rapidly absorbed by
the non-poly-P bacteria. Because of the absence of the terminal electron acceptor (O2 and
NO3) in the anaerobic zone, these organisms are unable to metabolize the absorbed
RBCOD to energy and for new cell synthesis. The RBCOD is then converted to VFA’s
through fermentative processes, which provide the non-poly-P organisms with very low
energy yields.
The released VFA’s are then taken up by the poly-P organisms and stored internally
through the polymerization of VFA’s into long chain carbon molecules called PHA,
specifically, polyhydroxybutyrate (PHB). Once stored internally, this substrate is no longer
available to other heterotrophic organisms, and is reserved by the poly-P organisms for
their exclusive use in the subsequent aerobic reactor. The energy for substrate transfer
and storage is derived from the hydrolysis of the energy rich polyphosphate (poly-P)
bonds within the poly-P bacteria (stored-P). The hydrolysis of the poly-P molecules, in the
anaerobic zone, leads to the release of phosphorus into the environment. This
phenomenon is known as Phosphate-release (P-release). The uptake and storage of
VFA’s with the subsequent P-release by the poly-P bacteria is called sequestration. The
phosphorus release associated with the transfer and storage of VFA’s is referred to as

- 35 -
primary release, whereas, P-release that is not associated with VFA uptake is called the
secondary release (Danesh and Oleszkiewicz, 1997). According to Wentzel et al., (1990),
1 mole of P is released per mole of VFA sequestrated, that is, 0.5 mg P is released per
mg VFA (as COD) sequestrated. Thus in the anaerobic reactor, ordinary heterotrophic
bacteria convert the RBCOD to VFA’s, which are then taken up by the poly-P bacteria and
store as PHB (Wentzel et al., 1990; Ekama and Wentzel, 1997, Banister and Pretorius,
1998).
2.6.3.2 The Aerobic Zone (Reactor)
In the subsequent aerobic reactor down stream of the anaerobic zone, the poly-P
organisms are unable to compete with non- poly-P organisms for substrate (food source)
such as glucose or other saccharides. The inability of the non-poly-P organisms to
compete for food source in the aerobic zone/reactor is due to the presence of the terminal
electron acceptor (O2) (Lilley et al., 1997). The poly-P organisms then use the stored PHB
as a carbon and energy source for cell function and for the generation of new cells. The
poly-P organisms also utilize the stored PHB as an energy source for taking up phosphate
from the bulk of the solution. The uptake of phosphate helps to remanufacture the poly-P
that was broken down in the anaerobic zone and store poly-P in the new cells that are
generated. This gives rise to the phenomenon known as excess phosphate uptake, which
occurs in the aerobic environment. The uptake of phosphate to manufacture cellular
polyphosphate in the daughter cells results in phosphate being taken up in the aerobic
reactor in excess of the phosphate that was released in the anaerobic reactor, thus
resulting in the net phosphate removal from the liquid phase to the activated sludge
biomass (Wentzel et al., 1988; Mino et al., 1998). Thus in the aerobic reactor, PHB is
metabolised by the poly-P organisms and phosphate is accumulated above concentrations
required for their metabolic needs (net phosphorus removal).
The uptake and storage of phosphate by the poly-P bacteria, at this stage, does not
amount to phosphate removal from the system, but a mere displacement of phosphate
from the wastewater to the biomass. Phosphorus is finally removed from the system
through daily sludge wasting from the aerobic reactor or from the return sludge line.
Wentzel et al., (1990) reported that, at steady state, the biomass of poly-P wasted per day
equals the mass of new poly-P organisms generated per day. Thus, the mass of poly-P

- 36 -
organisms in the biological system remains constant, which implies that, in the activated
sludge process at steady state, there is neither a build up nor loss of poly-P organisms
(Wentzel et al., 1990).
There are two factors that must be borne in mind when designing and operating a BEPR
system and are based on the abovementioned mechanisms viz:
1 RBCOD - the magnitude of phosphorus removal that can be achieved is directly
related to the amount of RBCOD present in the influent.
2 Recycling of oxygen and nitrite to the anaerobic zone.
The introduction of oxygen and/or nitrates/nitrites to the anaerobic reactor through the
sludge recycle (S-recycle) should be avoided since the non-poly-P organisms tend to
rapidly metabolise the RBCOD in the presence of a suitable terminal electron acceptor
such as oxygen. For example, for every 1 mg O2 recycled to the anaerobic reactor, 3 mg
COD as RBCOD will be consumed. The same applies for nitrogen, for every 1mg N as
NO3- recycled, 8.6 mg COD as RBCOD is consumed by the non-poly-P organisms for
energy generation and new cell synthesis. This results in the RBCOD that is consumed by
heterotrophs being unavailable for conversion to VFA’s during the fermentation process.
Hence the amount of VFA’s generated and released to the solution will be reduced by the
same amount of RBCOD that was consumed by the heterotrophic bacteria.
2.6.4 Historical Development of Prefermentation
2.6.4.1 Prefermentation Technology
The production of VFA’s (mainly acetic and propionic acids) from domestic or industrial
wastewater by subjecting the wastewater to anaerobic conditions for a period of time is
known as fermentation. Wastewater fermentation has been occurring (unintentionally)
ever since wastewater was transported in sewers with long residence times, or wherever
wastewater was held under anaerobic conditions.

- 37 -
The biological processes involved in prefermentation are the same as those in anaerobic
digestion, especially the first phase of the anaerobic degradation process, the acid-
production phase.
During this phase in prefermenters VFA’s are produced by bacteria and this phase
consists of two processes, hydrolysis and acidogenesis. Hydrolysis is a process whereby
particulate or high molecular weight soluble substrates are broken down to smaller
molecules by the incorporation of water molecules. Hydrolysis is catalyzed by hydrolytic
enzymes secreted by bacteria. Both the substrate and operational factors affect VFA
product distribution and speciation. However, for prefermenters that are fed with raw
wastewater or primary sludge, acetic acid is usually the most prevalent VFA produced,
followed by propionic acid (Munch, 2000).
The second phase consists of two main processes; acetogenesis and methanogenesis.
Acetogenesis, or anaerobic oxidation of SCFA’s, results mainly in the formation of acetate
and hydrogen gas. Acetogenesis cannot be encouraged without also encouraging
methanogenesis. This is unfortunate, as acetogenesis by itself would lead to “higher-
quality” VFA’s for the BNR process such as acetic acid.
Methanogenesis is the final step of anaerobic digestion, and results in the formation of
methane from the decarboxylation of acetate and the reduction of carbon dioxide and
hydrogen. Acetate is the prime precursor for methane production, which contributes to
about 70% of the total methane produced (Munch, 2000).
2.6.4.2 Pre-fermenter Technology
Full-scale prefermenters that are fed with primary sludge are referred to as “side-stream
prefermenters”. Primary sludge is sometimes also called raw sludge and is the
concentrated underflow of the primary clarifier.
2.6.4.3 Pre-fermenter Configurations
The prefermenter that is considered to be ‘optimal’ is one that consistently produces the
desired amount of VFA’s, is cheap to build and operate; and poses few operational

- 38 -
problems. To obtain these objectives, a number of different prefermenter configurations
have been proposed, each of which represents a compromise between reliability of VFA
production and associated costs. The prefermenter configurations can be classified
according to the number of tanks needed for their realization. The most commonly used
configurations are:
A. Activated Primary Tanks (APT)
B. Single-stage Prefermenters
C. Two-stage Prefermenters
2.7 CONCLUSIONS FROM THE LITERATURE REVIEW
Wastewater treatment methods were developed in response to the concern for public
health and the adverse conditions caused by the discharge of these waters to the
environment. Edible oil industries generate large volumes of effluent during the refinery
process. Conventional effluent treatment technology has its limitation with regards to
providing good quality final effluent. It is for this reason that various investigations using
different types of biological treatment methods for degradation of edible oil effluent was
warranted.

- 39 -
CHAPTER 3
(A) PRE-FERMENTATION
3.1 INTRODUCTION
Conventional processes for the removal of nitrogen and phosphorus from wastewater
rarely attain the levels now required by environmental protection authorities unless
supplemented with chemicals. Prefermentation technology enables conventional nutrient
removal plants to achieve high nitrogen and phosphorus removal to levels well below
international environmental standards without the costs involved in chemical addition for
effluent filtration (Treatment of Wastewater, 2000). Fundamental data and full-scale plant
evaluations indicate that fermentation of primary solids provide a VFA stream of sufficient
strength to enhance biological phosphorus removal. Effluent total phosphorus
concentrations in the range of 0.2 - 0.5 mg/L are possible with this technology compared
to effluent total phosphorus concentrations in the range of 1 - 3 mg/L for systems without
primary solids fermentation or chemical addition (Sedlak, 1991).
Prefermentation is a new unit of operation in Biological Nutrient Removal (BNR)
wastewater treatment systems with the role of producing VFA’s which can assist in the
BNR process. Normally, the carbon source in the process is obtained from the raw
wastewater feed (Munch, 2000). Therefore; prefermentation can increase phosphorus
removal rates by facilitating the production of soluble organic products that are required as
energy and carbon sources by the biomass responsible for nutrient removal. During the
anaerobic degradation phase, in prefermenters, VFA’s are produced by fermenting
bacteria by two main processes; hydrolysis and acidogenesis. Therefore increasing the
mass of substrate available to the phosphorus removing bacteria is achieved by
conversion of primary sludge solids to VFA’s which are subsequently made available to
the anaerobic zone microorganisms of a biological phosphorus removal process. The
amount of phosphorus that can be removed per unit of VFA or acetate generated (or
added) in the anaerobic zone is a function of the cell yield and net amount of phosphorus
stored in the wasted biological mass (Sedlak, 1991).

- 40 -
However, previous research done using prefermentation technology focused on the
treatment of domestic or municipal wastewater. This technology has not yet been applied
to treat edible oil wastewaters, so this project was aimed at determining the optimum time
for VFA production, total solid concentration, adjusted and natural pH effect, and mixing/
non-mixing effect to increase the VFA production rate in order to enhance biological
phosphorus removal from edible oil effluent.
3.2 AIMS AND OBJECTIVES
The aim of this study was to achieve optimised conditions for prefermentation in order to
obtain the highest concentration of VFA’s to improve biological phosphorus removal from
edible oil effluent. The objectives were as follows:
1. To determine the optimum time for maximum VFA production;
2. To determine the optimum total solids concentration;
3. To evaluate the effect of adjusted and natural pH; and
4. To evaluate the effect of mixing as opposed to non-mixing.
3.3 MATERIALS AND METHODS
3.3.1 Optimisation of Total Solids (TS) Concentration
Experimental work was carried out in 4 x 1 L conical flasks as batch reactors on a shaker.
The purpose of these batch experiments was to determine the TS concentration at which
there was maximum VFA production. Primary sludge from Durban Northern Waterworks
was diluted and inoculated in to three of the flasks at different solids concentrations i.e., 1
500, 3 000 and 5 000 mg/L respectively. The fourth flask was used as a control with only
800 mL of refinery effluent. Refinery effluent was then added to the experimental flasks to
obtain a final working volume of 800 mL. The experiment was carried out over 15 days.
Samples of 25 mL aliquots were taken daily and analysed for VFA production. pH and
temperature were monitored periodically. For one test trial the refinery effluent was left at
its natural pH of approximately 10 - 11 and another was conducted by adjusting the pH to
approximately 7. (See Appendix 1 for VFA determination)
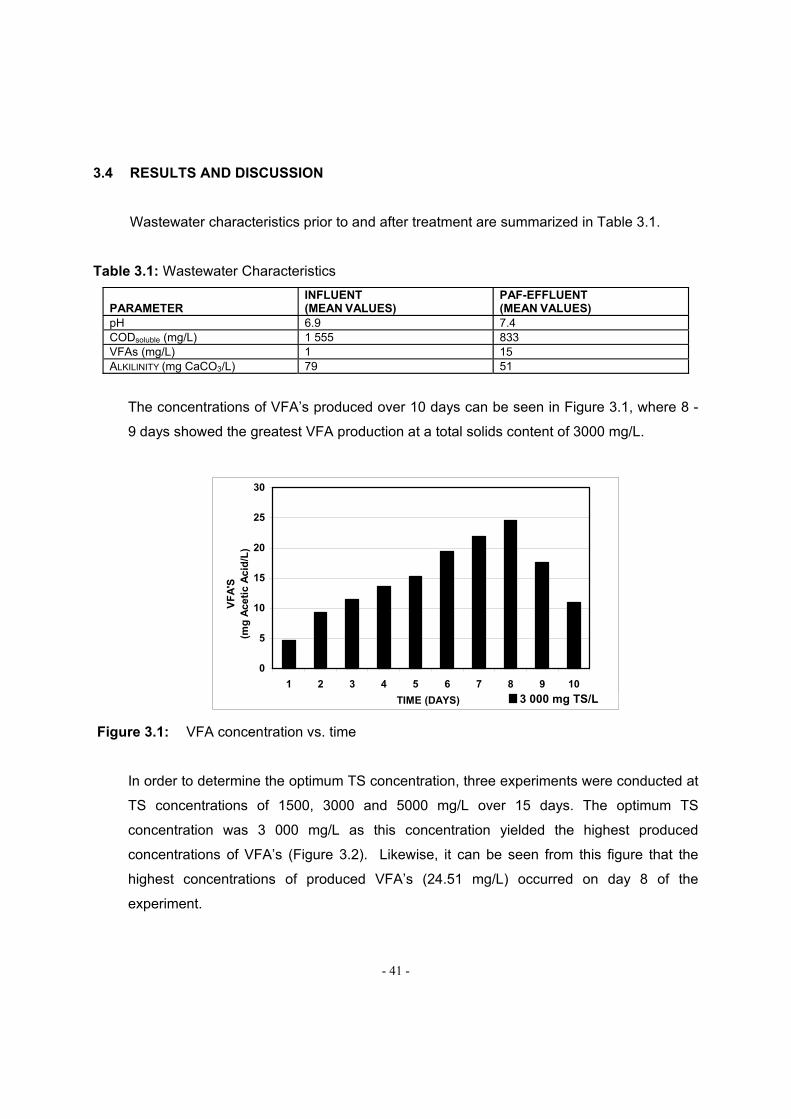
- 41 -
3.4 RESULTS AND DISCUSSION
Wastewater characteristics prior to and after treatment are summarized in Table 3.1.
Table 3.1: Wastewater Characteristics
PARAMETER
INFLUENT (MEAN VALUES)
PAF-EFFLUENT (MEAN VALUES)
pH 6.9 7.4 CODsoluble (mg/L) 1 555 833 VFAs (mg/L) 1 15 ALKILINITY (mg CaCO3/L) 79 51
The concentrations of VFA’s produced over 10 days can be seen in Figure 3.1, where 8 -
9 days showed the greatest VFA production at a total solids content of 3000 mg/L.
0
5
10
15
20
25
30
1 2 3 4 5 6 7 8 9 10
TIME (DAYS)
VF
A'S
(mg
Ace
tic
Aci
d/L
)
3 000 mg TS/L
Figure 3.1: VFA concentration vs. time
In order to determine the optimum TS concentration, three experiments were conducted at
TS concentrations of 1500, 3000 and 5000 mg/L over 15 days. The optimum TS
concentration was 3 000 mg/L as this concentration yielded the highest produced
concentrations of VFA’s (Figure 3.2). Likewise, it can be seen from this figure that the
highest concentrations of produced VFA’s (24.51 mg/L) occurred on day 8 of the
experiment.

- 42 -
Figure 3.2: VFA production vs. time
The effects of the naturally developing pH and adjusted pH values on VFA production can
be seen in Figures 3.3 and 3.4. From Figure 3.3 it can be seen that although VFA’s are
being produced the concentrations are very low, with the highest being 4.86 mg acetic
acid/L. The adjusted pH (Figure 4.4) recorded higher concentrations of produced VFA’s,
with the highest being 24.51 mg acetic acid/L. These results seem to indicate that the
microorganisms responsible for production of VFA’s and soluble reactor phosphate (SRP)
release prefer near neutral pH conditions.
Figure 3.3: Effect of natural pH on VFA production vs. time
0
5
10
15
20
25
30
1 2 3 4 5 6 7 8 9 10 11 12 13 14 15
TIME (DAYS)
VF
A's
(mg
Ace
tic
Aci
d/L
)
CONTROL 1 500 mg TS/L 3 000 mg/TS/L 5 000 mg TS/L
0
5
10
1 2 3 4 5 6 7 8 9 101112131415
TIME (DAYS)
pH
051015202530
VF
A 's
(m
g A
ceti
c A
cid
/L)
NATURAL pH VFA's

- 43 -
1
3
5
7
9
11
1 2 3 4 5 6 7 8 9 1011 1213 14 15
TIME (DAYS)
pH
0
5
10
15
20
25
30
CO
NC
EN
TR
AT
ION
(m
g
Ac
eti
c A
cid
/L)
pH VFA'S
Figure 3.4: Effect of adjusted pH on VFA production vs. time
Although the temperature of the system was not optimised during this experiment, it was
noticed that at lower temperatures the production of VFA’s was greater than at higher
temperatures. Circumstantial evidence of this was observed by the different rates of VFA
production during different runs of the experiment. For example, experimental work
conducted in the laboratory and at temperatures up to approximately 28oC, resulted in
exceedingly low VFA production rates, while experimental trials conducted in the cold
room which has a temperature of approximately 17oC the production of VFA’s was much
greater.
3.5 CONCLUSION
It can be concluded that the optimised conditions for prefermentation for treating edible oil
effluent to enhance biological phosphorus removal are as follows:
< Time for maximum VFA production : 8 to 9 days
< Total Solids Concentration : 3 000 mg/L
< Adjusted pH : 7.0
< Mixing of the effluent during anaerobic phase

- 44 -
(B) ASSESMENT OF BENCH SCALE NUTRIENT REMOVAL PROCESS
3.6 AIMS AND OBJECTIVES
The aim of this study was to design and operate a laboratory scale activated sludge
treatment process that would produce the final effluent having a regulatory acceptable
COD and phosphate loads prior to its discharge to the municipal sewer system. The study
was guided by the following objectives:
1. To conduct a preliminary effluent treatment investigation
2. To design and operate a bench scale activated sludge treatment process
3. To optimise the system operation for COD and phosphorous removal.
The investigation was partitioned into 3 aspects viz:
1. Wastewater Characterization
2. Laboratory Scale Bioreactor Design and Operation
3. Treatment Process Optimisation (Phase 4)
3.7 WASTEWATER CHARACTERIZATION
3.7.1 Materials and Methods
3.7.1.1 Characterisation of effluent
For the initial sampling survey composite wastewater samples were collected monthly over
a period of five months (June, 1998 to October, 1998) from Company X in
Pietermaritzburg. After sampling (25 L) the polluting parameters were determined directly
and the effluent samples stored at 4oC, until needed for additional tests and experiments.
Colorimetric methods, using a spectrophotometer SQ 118 from Merck, was used for
measuring COD (Appendix 3), phosphate (PO4) (Appendix 4), total nitrogen (TN)
(Appendix 5), ammonium nitrogen (NH4) (Appendix 6), nitrates (NO3) (Appendix 7) and
sulphates (SO4) (Appendix 8). All the samples were analysed in triplicate except for
phosphate that was done in duplicates. The total suspended solids (TSS) (Appendix 9),

- 45 -
FOG’s (Appendix 10), alkalinity as CaCO3 (Appendix 2), were all analysed using standard
methods (Standard Methods, 1989) and pH (Appendix 11).
3.7.2 Discussion
No previous effluent monitoring data was available at the start of this study, as the effluent
plant at the Company X had carried out no on-site effluent monitoring. Wastewater
characterisation studies of composite monthly effluent samples revealed that effluent
characteristics fluctuated greatly and depended on the refining method employed at the
plant at different times; i.e. whether chemical or physical refining was being used. In both
cases the effluent would usually contain high organic (BOD & COD) and inorganic loads,
as well as high quantities of free fats.
The organic load was mainly due to the presence of large quantities of FOG’s in the final
effluent, and also due to the chemical nature of the vegetable oil itself. The hydrolysis
products of edible oils, long chain fatty acids; glycerol and glycerides; and proteins, all
added to the organic load of the edible oil effluent (Eroglu et al., 1990). Ozturk et al.,
(1990) have estimated the organic load of the edible oil wastewater to vary between 0.85
to1.42 Kg BOD5 /ton edible oil. They, also, showed that there was a direct relationship
between BOD5 and TSS, BOD5 - COD, COD – FOG values. Its relationship between FOG
and COD was also shown by Dart (1974) and later by Grant (1980) who both reported that
60% to 64% of BOD5 was removed from edible oil wastewater after the removal of 88% to
91% of FOG during their physico-chemical studies.
The inorganic constituents of major concern in edible oil wastewaters are phosphates and
sulphates. Phosphate in the effluent originates mainly from the use of phosphoric acid
during the degumming stage and to a minor extent from the hydrolysis of phospholipids.
Hui, (1996b) reported that crude oil, particularly soybean oil, contains significant quantities
of organic phosphorus in the form of phosphatides, which are subsequently transferred
from the oil phase to the water phase during the crude edible oil refining process. After
acidification of the refinery wastewater, phosphatides get hydrolysed and the resulting
phosphates are then released into the water phase.

- 46 -
Sulphates constitute a significant part of the inorganic constituents of edible oil
wastewaters. Sulphate results from the use of concentrated sulphuric acid during acid
splitting of the soap stock that, in turn, results in the FFA’s being separated from the oil
medium. Eroglu et al., (1990) and Hui, (1996b) reported, from separate studies, that the
resulting effluent from acid splitting has an average pH of 1.7 and that it contains sulphate
concentrations of 4000 mg/L. During this study, the sulphate concentration of the edible oil
effluent was found to range between 1260 mg/L and 5800 mg/L SO42- with a mean
average of 4340 mg/L SO42- during the five-month characterisation period.
Another complicating factor in the treatment of these effluents is the often-high
concentration of salts, which results in high levels of conductivity being recorded.
Salinization of wastewater results from the use of divalent (M2+) and trivalent (M3+)
inorganic salts during physico-chemical treatment of wastewater to reduce waste loads of
the final effluent. Salinity is indicated by the increase in conductivity of the wastewater.
The edible oil industry reported that conductivity was one of their major effluent concerns
and that the municipality was demanding that the conductivity levels in the final effluent be
reduced. These conductivity concerns can often be solved through the optimisation of
chemical effluent treatment methods after the effluent has been subjected to biological
pre-treatment procedures, the optimisation of dosing techniques, careful pH and
flocculation control
The nitrogen content of the effluents, both as total Kjeldahl nitrogen (TKN) and ammonium
nitrogen (NH4) were found to be below 10 mg/L. This seems to indicate that nitrogen could
be limited for effective biological treatment. In an edible oil study by Ozturk et al., (1990) it
was reported that the edible oil effluent BOD5: N: P ratios were about 100: 4.4: 23, which
indicated that nitrogen was present in low concentrations and could have been a growth
limiting nutrient. During the present study, the N/COD ratio was found to be even lower
and that this effluent, in its present form and due to its low nitrogen ratio, is not suitable for
treatment using traditional three stage or five-stage BEPR processes. The effluent would,
therefore, require nitrogen supplementation. Boyer (1996) reported that vegetable oil
effluent could be effectively treated in a full-scale wastewater treatment installation if it
was partially diluted with nitrogen rich domestic wastewater.
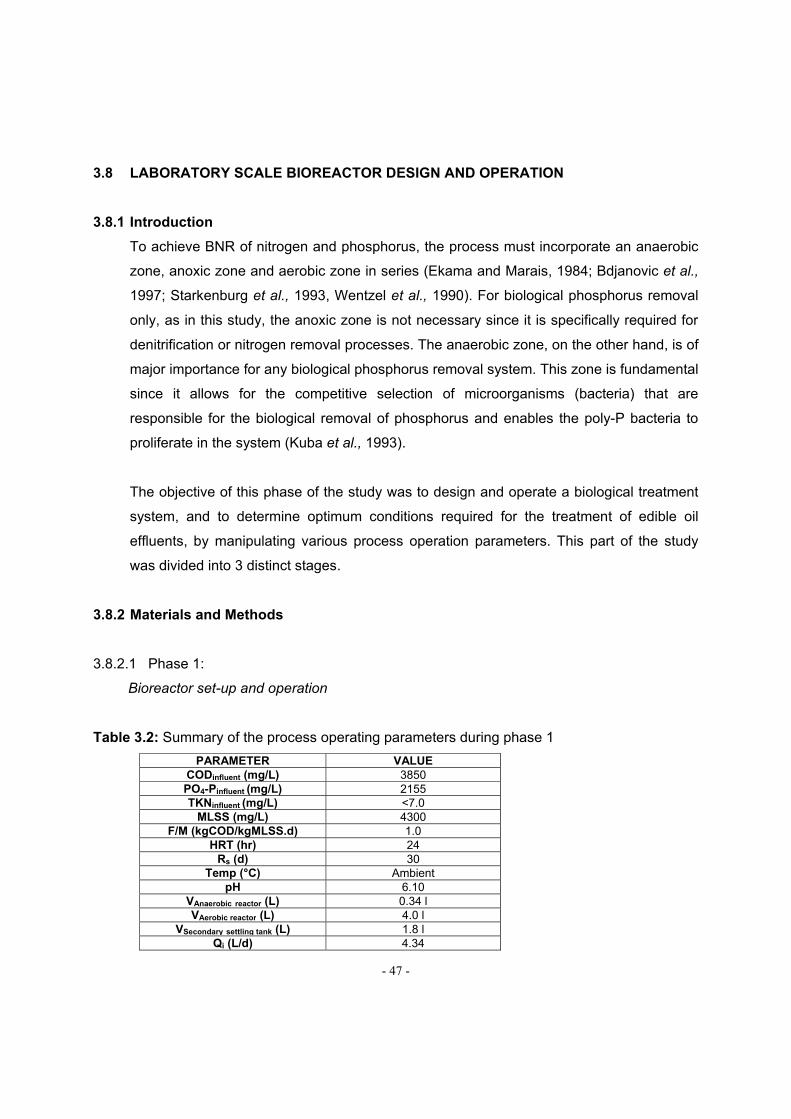
- 47 -
3.8 LABORATORY SCALE BIOREACTOR DESIGN AND OPERATION
3.8.1 Introduction
To achieve BNR of nitrogen and phosphorus, the process must incorporate an anaerobic
zone, anoxic zone and aerobic zone in series (Ekama and Marais, 1984; Bdjanovic et al.,
1997; Starkenburg et al., 1993, Wentzel et al., 1990). For biological phosphorus removal
only, as in this study, the anoxic zone is not necessary since it is specifically required for
denitrification or nitrogen removal processes. The anaerobic zone, on the other hand, is of
major importance for any biological phosphorus removal system. This zone is fundamental
since it allows for the competitive selection of microorganisms (bacteria) that are
responsible for the biological removal of phosphorus and enables the poly-P bacteria to
proliferate in the system (Kuba et al., 1993).
The objective of this phase of the study was to design and operate a biological treatment
system, and to determine optimum conditions required for the treatment of edible oil
effluents, by manipulating various process operation parameters. This part of the study
was divided into 3 distinct stages.
3.8.2 Materials and Methods
3.8.2.1 Phase 1:
Bioreactor set-up and operation
Table 3.2: Summary of the process operating parameters during phase 1
PARAMETER VALUE CODinfluent (mg/L) 3850 PO4-Pinfluent (mg/L) 2155 TKNinfluent (mg/L) <7.0
MLSS (mg/L) 4300 F/M (kgCOD/kgMLSS.d) 1.0
HRT (hr) 24 Rs (d) 30
Temp (°C) Ambient pH 6.10
VAnaerobic reactor (L) 0.34 l VAerobic reactor (L) 4.0 l
VSecondary settling tank (L) 1.8 l Qi (L/d) 4.34

- 48 -
A two-stage activated sludge process was selected for the edible oil effluent treatment.
The two-stage laboratory-scale bioreactor chosen was modified from the 3-stage
Phoredox process for biological phosphorus removal by omitting the anoxic zone and the
A-recycle from the original design. This system consisted of an aerobic reactor (total
volume = 5 L) connected to an anaerobic reactor (total volume = 1 L) which had two inlets,
one on top through the lid for influent inflow, and one underneath for return sludge (S-
recycle) flow. The mixed liquor from the anaerobic reactor was fed directly to the aerobic
reactor through an outlet that could be either raised or lowered to vary the volume of the
anaerobic reactor.
The overflow of the aerobic reactor flowed into the secondary settling tank (total volume =
2 L), which was constructed from a suitably shaped plastic bottle. The mixed liquor inlet for
the aerobic reactor from the secondary settling tank was located at the bottom of the
reactor, 0.5 L above the S-recycle sludge outlet point. A variable speed peristaltic pump
pumped settled sludge from the secondary settling tank to the anaerobic reactor. Two
peristaltic pumps maintained the flow through the system; one pumping the influent to the
system and the other one pumping the settled sludge back to the anaerobic reactor. The
internal flow rate was maintained by adjusting the S-recycle line peristaltic pump, whereas,
the effluent overflow rate depended on the influent flow rate.
During this phase of the study, the reactor was operated on a semi-continuous basis for 30
days. Refer to table 3.2 for operating parameters. The reactor was inoculated with mixed
liquor sludge from the aerobic zone of Darvill Wastewater Works, Pietermaritzburg. The
mixed liquor suspended solids (MLSS) was maintained throughout the experiment by
wasting 0.133 L of mixed liquor daily from the aerobic reactor. Activated sludge from
Darvill Wastewater Works was chosen as the plant was designed for BNR.
As a result of the high strength of the edible oil final effluent, the influent was diluted to a
desired COD concentration before being allowed into the system. Mixing or agitation of the
mixed liquor was stopped during the influent pumping period to prevent dilution of the
treated effluent and the untreated influent. The influent was prepared daily in a 5 L influent
tank.

- 49 -
Aerobic conditions were maintained in the aerobic reactor by pumping in diffused air using
an aquarium air pump. This sparging of air into the aerobic zone was sufficient to keep
the mixed liquor well mixed and hence no additional mixing device was used. The
anaerobic reactor mixed liquor was agitated using a magnetic stirrer at 100 rpm. The
mixed liquor was rotated through the system for 24 hr by the peristaltic pump, connected
to the S-recycle line. After 24 hr of treatment effluent samples were collected and analysed
for COD (daily), soluble PO4 (daily), and FOG (3 day interval).
3.8.2.2 Phase 2
Bioreactor Set-up and Operation
Table 3.3: Summary of the process operating parameters during phase 2
PARAMETER VALUECODinfluent (mg/L) 5500 PO4-Pinfluent (mg/L) 430 - 450 TKNinfluent (mg/L) <7
MLSS (mg/L) 3500 - 4000 F/M (kgCOD/kgMLSS.d) 1.5
HRT (hr) 24 Rs (d) 15
Temp (°C) Ambient pH 6.1
VAnaerobic reactor (L) 1.0 l VAerobic reactor (L) 4.0 l
VSecondary settling tank (L) 0.45 Qi (L/d) 5.0
The results obtained from the first phase of this study showed that the design of the
reactor was faulty, therefore, a second phase was initiated and the design parameters
changed (Table 3.3). The new settling tank resulted in a 75% reduction of the settling
volume, which resulted in an overall performance improvement. The mixed liquor inlet
from the aerobic reactor into the secondary settling tank was moved to the S-recycle
outlet. The new arrangement resulted in a more rapid settling rate of the sludge in the
secondary settling tank.
The volume of the anaerobic reactor was also increased (Refer to Table 3.3). Mixing of the
sludge was maintained using the magnetic stirrer at 200 rpm. The volume and operation of
the aerobic reactor remained unchanged at 4.0 L. Aeration and agitation of the mixed

- 50 -
liquor was maintained by using diffused air into the system while the DO was monitored
with a DO probe and maintained between 2 - 5 mg DO/L. The inoculum and substrate
used was identical to that described in phase 1.
During phase 2 of the study the operation mode was changed from semi-continuous to a
continuous mode. (Refer to table 4.3 for operating parameters)
3.8.2.3 Phase 3
Bioreactor set-up and operation
Table 3.4: Summary of the process operating parameters during phase 3
PARAMETER VALUE CODinfluent (mg/L) 2270 PO4-Pinfluent (mg/L) 190 TKNinfluent (mg/L) <7
MLSS (mg/L) 4100 - 4200 F/M (kgCOD/kgMLSS.d) 0.5
HRT (hr) 24 Rs (d) 15
Temp (°C) Ambient pH 6.5 – 7.5
VAnaerobic reactor (L) 1.0 l VAerobic reactor (L) 4.0 l
VSecondary settling tank (L) 0.45 Qi (L/d) 5.0
The reactor design and set-up remained un-altered and only the operating parameters
were changed during this phase of the study (Table 3.4). Feed supplementation with
sodium acetate was initiated in order to determine the effects of artificially increasing the
VFA load on biological phosphorus removal in the edible oil effluent. Sodium acetate
trihydrate (NaCH3C00.3H20) was added to give the influent at final concentration of 0.01M.
After addition of Sodium acetate, and after being filtered through 0.45µm filter, the influent
had a soluble COD concentration of 2000 mg/L.
- COD determination - Appendix 3a
- FOG determination - Appendix 10

- 51 -
3.8.3 Discussion
Phase 1
During Phase 1, the system had showed, compared with the preliminary investigation
phase, an improved COD and phosphorus removal capability. No signs of overloading,
according to the parameters analysed, were observed from the treatment process, despite
the influent organic load being higher (0.2 - 0.3 kgCOD/kgMLSS.d) than the organic loads
generally applied in domestic/industrial wastewater treatment processes (1.0
kgCOD/kgMLSS.d) (Ekama et al., 1984).
The system recorded an average COD removal of 70% with a low phosphorus removal
efficiency of 4.4%. During the first 6 days of system operation, following the acclimatisation
period of 15 days, an average phosphorus removal of approximately 330 mg/L, with the
highest removal of 580 mg/L and the lowest of 43 mg/L, being recorded. The phosphorus
removal rates fluctuated widely and after day 6, a sudden change in the phosphorus
removal pattern was observed. Phosphorus release instead of the expected phosphorus
uptake and removal was observed. This phenomenon started from day 7 to day 18 after
which the process was stopped and this phase abandoned. During the 12 days of the
observed phosphorus release, the rates of phosphorus release fluctuated widely with the
highest phosphorus release of 270 mg/L and the lowest of 10 mg/L, being recorded. On
average the process showed a phosphorus release of about 93 mg/L as compared to
phosphorus removal of 331 mg/L.
Although, on the surface the percentage of phosphate may appear minimal (ca 4.4
percent), in real terms, the system was, during the first few days, actually removing
approximately 238 mg/L. The reduction of phosphorus uptake and removal capabilities of
the system was partly attributed to an insufficient anaerobic sludge mass fraction of 0.08
or 8% of the total system volume. It is, therefore, likely that synthesis of SCFA’s or VFA’s
from the fermentation of the influent RBCOD was incomplete and the full acetate
complement was not realised (Ekama et al., 1984).
The volume of the secondary settling tank could also have attributed to the reduced
phosphorus removal ability of the system. The phosphorus release recorded from day 6
coincided with visually recorded blackening of the sludge in the anaerobic reactor and later

- 52 -
a black sulphur deposit on the sides of the secondary settling tank, due to the prevailing
anaerobic conditions. The anaerobic conditions, in the secondary settling tank, resulted in
the reduction of sulphate to sulphide ions which were confirmed by the strong smell of
hydrogen sulphide (H2S) eminating from the secondary settling tank. These anaerobic
conditions in the secondary settling tank have been reported to trigger secondary
phosphorus release in BNR systems. Although the anaerobic conditions were observed in
the secondary settling tank, no attempt was made to verify that these conditions were
directly responsible for the observed phosphorus release in the process after day 6.
Phase 2
Changing operation parameters such as, sludge age, anaerobic sludge mass fraction and
the secondary settling tank volume, resulted in improved phosphorus removal. The
average phosphorus removal increased to 8% of the total influent phosphorus, which is
equivalent to 430 - 450 mg/L.
This improvement in phosphorus removal, during Phase 2, was thought to be due to the
increased anaerobic sludge mass fraction and the reduced sludge age. Increasing the size
of the anaerobic sludge mass fraction to 20% of the total reactor volume has been
reported to increase the fermentation of RBCOD to VFA’s in the anaerobic zone of the
domestic wastewater treatment plants (Rustrain et al., 1999; Ekama et al., 1984). The
decrease in sludge age is, also, known to have a beneficial effect on phosphorus removal
efficiencies in BNR of domestic wastewater treatment systems (Wentzel et al., 1990). This
is due to the increased removal frequency of the biomass, including the phosphate
accumulating organisms (PAO’s), from the system. This increased removal frequency of
the PAO’s, together with waste activated sludge, is thought to result in more cells,
containing accumulated phosphorus, being removed from the system and, thus,
stimulating the rapid reproduction of new biomass (PAO) that, also, has enhanced
phosphate uptake capabilities.
However a gradual decline in the COD removal efficiencies was observed during Phase 2.
This decline in COD removal started after day 16 when the COD removal efficiency
suddenly dropped from an average of 69% - 68% COD removal to an average of 50%,
which remained for the duration of the experimental phase. The observed decline in COD

- 53 -
removal efficiency coincided with similar decreases in phosphorus removal efficiencies of
the treatment process. At, more or less, the same time when the COD removal efficiency
dropped, the phosphorus release in the system was observed instead of the expected
phosphorus uptake and removal. This decline in COD removal efficiencies was partly
attributed to the increased operational F:M ratio (food to microorganism ratio) that was
maintained at 1.5 kgCOD/kgMLSS.d. Increasing the F:M ratio of similar systems has been
reported to have an overloading effect on the biomass, which, results in poor system
substrate metabolism performance (Wentzel and Ekama, 1997; Casey et al., 1995).
The overall decline in the process removal efficiencies could also be attributed to the high
sulphate concentrations of the original edible oil effluent. Although sulphates were not
monitored in this study, their contribution to the process failure was evident from the
observed sludge darkening in the anaerobic reactor and in the secondary settling tank.
Increased production of H2S gas was observed after day 16, which was accompanied by
the increased oxygen demand of the activated sludge in the aeration reactor. This effect
was similar to the process failure that was observed during phase 1 of the treatment
process operation.
The relatively high sulphate concentrations in the influent may be responsible for the
decrease in phosphorus removal efficiency of the system. As a result of the oxidation state
of the sulphur in the sulphate ion (S6+ in SO42-), other heterotrophic microorganisms such
as sulphur reducing bacteria may have utilized the sulphate ions in the influent as a
terminal electron acceptor. These sulphate reducing bacteria could have utilised a major
part of the RBCOD, and thus out-compete the PAO for available substrates in a manner
similar to that when oxygen and/or nitrates are present in the anaerobic reactor of the BNR
system.
Phase 3
During this phase of the study the only process treatment parameter that was changed
was the organic loading rate, which was reduced from 1.5 kg COD/kg MLSS/d to 0.5 kg
COD/kg MLSS/d. The RBCOD of the diluted influent was increased by sodium acetate
supplementation. The P/COD ratio remained constant between Phases 2 and 3, thus
resulting in no change in P/COD ratio after effluent dilution with tap water.
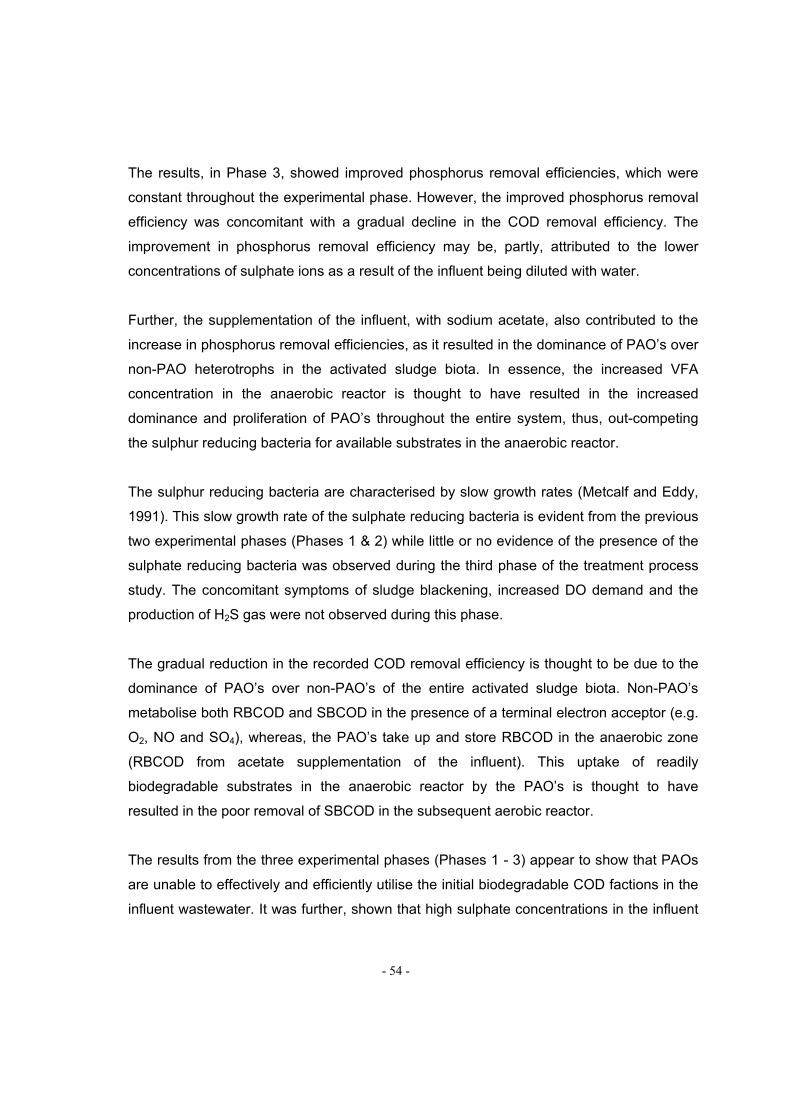
- 54 -
The results, in Phase 3, showed improved phosphorus removal efficiencies, which were
constant throughout the experimental phase. However, the improved phosphorus removal
efficiency was concomitant with a gradual decline in the COD removal efficiency. The
improvement in phosphorus removal efficiency may be, partly, attributed to the lower
concentrations of sulphate ions as a result of the influent being diluted with water.
Further, the supplementation of the influent, with sodium acetate, also contributed to the
increase in phosphorus removal efficiencies, as it resulted in the dominance of PAO’s over
non-PAO heterotrophs in the activated sludge biota. In essence, the increased VFA
concentration in the anaerobic reactor is thought to have resulted in the increased
dominance and proliferation of PAO’s throughout the entire system, thus, out-competing
the sulphur reducing bacteria for available substrates in the anaerobic reactor.
The sulphur reducing bacteria are characterised by slow growth rates (Metcalf and Eddy,
1991). This slow growth rate of the sulphate reducing bacteria is evident from the previous
two experimental phases (Phases 1 & 2) while little or no evidence of the presence of the
sulphate reducing bacteria was observed during the third phase of the treatment process
study. The concomitant symptoms of sludge blackening, increased DO demand and the
production of H2S gas were not observed during this phase.
The gradual reduction in the recorded COD removal efficiency is thought to be due to the
dominance of PAO’s over non-PAO’s of the entire activated sludge biota. Non-PAO’s
metabolise both RBCOD and SBCOD in the presence of a terminal electron acceptor (e.g.
O2, NO and SO4), whereas, the PAO’s take up and store RBCOD in the anaerobic zone
(RBCOD from acetate supplementation of the influent). This uptake of readily
biodegradable substrates in the anaerobic reactor by the PAO’s is thought to have
resulted in the poor removal of SBCOD in the subsequent aerobic reactor.
The results from the three experimental phases (Phases 1 - 3) appear to show that PAOs
are unable to effectively and efficiently utilise the initial biodegradable COD factions in the
influent wastewater. It was further, shown that high sulphate concentrations in the influent

- 55 -
have a negative impact on the wastewater treatment process efficiency in general and
specifically for COD and phosphorus removal.
The removal of FOG, on the other hand, was consistent throughout the treatment
experimental phases and was always above 95% FOG removal. The removal of fats from
the influent wastewater by the treatment system may be due, in part, too adsorption of fats
onto the activated sludge biomass, rather then through biochemical metabolism of fats into
simpler organic molecules.
3.9 TREATMENT PROCESS OPTIMISATION (PHASE 4)
3.9.1 Introduction
As shown in the previous experiments there are a number of operational parameters that
have a profound influence on the efficiency of BEPR. Therefore, manipulation of these
design and process operations could result in performance optimisation of the BEPR
process. In determining the effect of different operation parameters on the efficiency of
BEPR, Wentzel et al. (1990) used a steady state model to predict phosphorus removal
due to various parameters changes, such as sludge age (Rs), influent COD concentration,
hydraulic retention time (HRT), the size of the anaerobic zone/reactor; number of
anaerobic reactors; and influent characteristics (C: N: P ratio and RBCOD concentration).
3.9.2 Materials and Methods
3.9.2.1 Bioreactor Lay-Out and Operation
Table 3.5: Summary of the process operating parameters during phase 4
PARAMETER VALUE CODinfluent (mg/L) 2650 PO4-Pinfluent (mg/L) 600 TKNinfluent (mg/L) < 7.0
MLSS (mg/L) 4100 – 4200 F/M (kgCOD/kgMLSS.d) 0.5
HRT (hr) 24 Rs (d) 15
Temp (°C) Room pH 6.5 – 7.5
Vr (L) 7 Qi (L/d) 7

- 56 -
The general reactor configuration of a two-stage modified Phoredox process was
maintained throughout the experimentation period. Only the anaerobic configuration was
altered to allow for more increase in the anaerobic mass fraction (fxa). The anaerobic
sludge mass fraction was calculated as follows:
Anaerobic sludge mass fraction (fxa) (%) = Vanaerobic X 100
Vanaerobic + Vaerobic
Where: Vanaerobic = Volume of sludge in the anaerobic reactor (l)
Vaerobic = Volume of sludge in the aerobic reactor (l)
Vanaeroboic + Vaerobic = Vtotal = Total volume of sludge in the aerobic and anaerobic
reactor
The 1-litre conical flask shaped anaerobic reactor was removed and replaced by a 5-litre
rectangular polyethylene anaerobic reactor. The influent and mixed liquor flow pattern
remained unchanged, i.e. the influent flow entered through the top of the reactor whilst the
S-recycle and outgoing mixed liquor flowed through the bottom inlet and outlet,
respectively.
The reactor was seeded with 50% mixed liquor from the aerobic zone and 50% from the
anaerobic zone of Darvill Wastewater Works. The anaerobic sludge mass fraction (fxa) was
increased from 1 litre (during phase 3) to 3 litres (total volume of the system increased
from 5 litres to 7 litres), which represented the increase in the anaerobic sludge mass
fraction of 23%, from 20% to 43% of the total sludge in the process (3 L Van/7 L Vtotal).
A new batch of effluent was collected in 25 L containers from the edible oil industry prior to
commencement of this fourth phase of the study. The effluent samples were stored in the
cold room at between 0C and 4C after the necessary analyses was completed to
prevent deterioration due microbial and chemical activity.
The influent was prepared in a large influent container (25 L) once every 4 days through
dilution of the industrial effluent to give the desired final COD concentration. The influent
supplementation was maintained at 1.75 g/l through the addition of sodium acetate
trihydrate (CH3COONa.3H2O). An aquarium air pump pumping air through two diffusing

- 57 -
nozzles achieved aeration and agitation of mixed liquor in the aerobic reactor. A portable
laboratory scale DO meter was used to measure the DO in the aerobic reactor. The DO
concentration in the aerobic reactor was maintained between 2.0 – 5.0 mgO2/L through on
and off switching of the aquarium pump when necessary.
The anaerobic reactor contents were maintained in a well-mixed condition through the
operation of the magnetic stirrer unit at lowest speed (ca. 50 rpm) so as to simulate a plug
flow pattern. The treatment process was operated for 15 days without any analyses being
done to allow for acclimatisation of the biomass to the influent substrate (i.e. achieve
steady state). After the acclimatisation period was completed the system was then
operated continuously for 82 days with sampling and analyses conducted daily during
phase 3 of the study. Table 3.5 shows the summary of the operation parameters of the
treatment process during phase 4 of the study.
3.9.3 Results
0
500
1000
1500
2000
2500
3000
1 4 7 10 13 16 19 22 25 28 31 34 37 40 43 46 49 52 55 58 61 64 67 70 73 76 79
Time (d)
To
tal C
OD
c
on
cen
tra
tio
n (
mg
/l)
CODi CODe
Figure 3.5: Total influent and effluent COD profiles for continuously operated biological treatment process at 0.5 F/M ratio (Phase 4)
CODi = COD concentration (mg/l) of filtered (0.45 μm) influent samples.
CODe = COD concentration (mg/l) of filtered (0.45 μm) effluent samples after biological treatment.
Influent COD strength varied between 2800 mg/L and 2400 mg/L. The COD removal
efficiency remained stable despite the fluctuating influent COD strength. On average the
COD removal efficiency remained 76% throughout the process operation (See Figure 3.5).
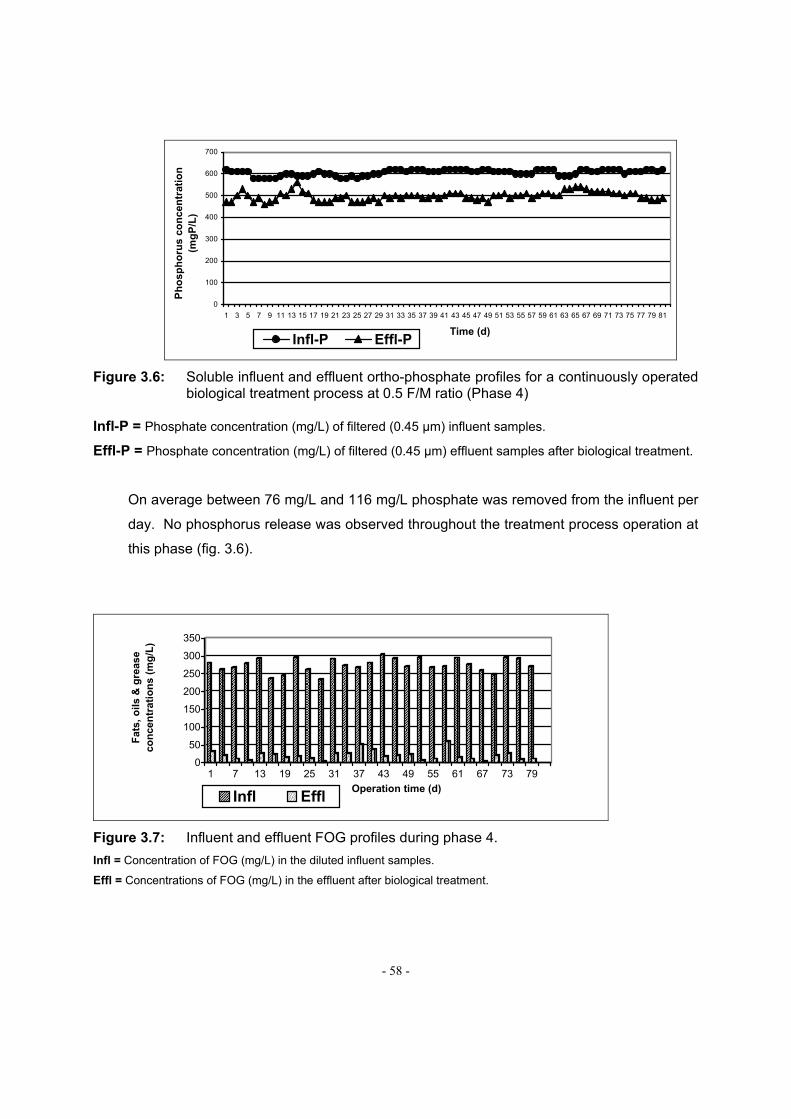
- 58 -
0
100
200
300
400
500
600
700
1 3 5 7 9 11 13 15 17 19 21 23 25 27 29 31 33 35 37 39 41 43 45 47 49 51 53 55 57 59 61 63 65 67 69 71 73 75 77 79 81
Time (d)
Ph
osp
ho
rus
con
cen
trat
ion
(m
gP
/L)
Infl-P Effl-P
Figure 3.6: Soluble influent and effluent ortho-phosphate profiles for a continuously operated biological treatment process at 0.5 F/M ratio (Phase 4)
Infl-P = Phosphate concentration (mg/L) of filtered (0.45 μm) influent samples.
Effl-P = Phosphate concentration (mg/L) of filtered (0.45 μm) effluent samples after biological treatment.
On average between 76 mg/L and 116 mg/L phosphate was removed from the influent per
day. No phosphorus release was observed throughout the treatment process operation at
this phase (fig. 3.6).
0
50
100
150
200
250
300
350
Fat
s, o
ils
& g
reas
e co
nce
ntr
atio
ns
(mg
/L)
1 7 13 19 25 31 37 43 49 55 61 67 73 79
Operation time (d)Infl Effl
Figure 3.7: Influent and effluent FOG profiles during phase 4.
Infl = Concentration of FOG (mg/L) in the diluted influent samples.
Effl = Concentrations of FOG (mg/L) in the effluent after biological treatment.
- 59 -
On average FOG removal efficiency remained stable despite the fluctuating influent FOG
concentrations throughout the process operation during this phase (Fig. 3.7). Effluent FOG
concentrations were observed to be between 3 mg/L and 60 mg/L, from an average
influent FOG of 275 mg/L.
3.9.4 Discussion
Increasing the anaerobic sludge mass fraction from 20% to 43% while maintaining a 0.5
kg COD/kg MLSS/d organic loading rate in the treatment process resulted in a general
improvement in both COD and phosphorus removal. The system showed a consistent
phosphorus removal efficiency of 17%, which is equivalent to a phosphorus uptake of 104
mg/L. This increased phosphorus removal efficiency, compared with the previous studies,
was attributed to the greater anaerobic sludge mass fraction, which, in turn, resulted in an
increased anaerobic contact time between the influent substrate and the anaerobic
biomass. This increased contact time allowed for a higher amount of fermentation of
RBCOD to VFA’s, which were subsequently sequestrated by PAO’s. This increased
contact time in the anaerobic reactor also, allowed more time for anaerobic, non-
fermentative bacteria to metabolise the SBCOD content of the influent substrate into
RBCOD. Clearly, the increased production of RBCOD will make more substrate available
to the anaerobic-fermentative bacteria for conversion into VFA’s. Further, influent
supplementation with 0.01 M sodium acetate could have ensured the dominance of PAO’s
in the anaerobic reactor over the non-PAO heterotrophic bacteria, as was postulated
during phase 3 of this study.
The improved phosphorus removal was also mirrored by the improvement in the total
soluble COD removal efficiency. The COD removal improved from 64% to an average of
76%. During this period of enhanced removal there was also, no inhibition observed in the
biomass over time, as was the case during the preceding experimental phases (Phases 2
and 3).
Another factor responsible for the enhanced removal rates was the low concentration of
sulphate during this phase of the study. The mixed liquor of the treatment system
remained dark brown (chocolate brown) throughout this experiment, unlike previous
experiments, where the liquor turned a black colour due to sulphate reduction.

- 60 -
The improved reduction of COD, together with the increased anaerobic sludge mass
fraction, recorded during this phase, as opposed to the decreased COD removal efficiency
during phase 3, is thought to be due to the increased activity of the anaerobic non-
fermentative organisms and the fermentative micro-organisms in the increased anaerobic
reactor volume. This increased activity, of the fermentative bacteria in the anaerobic
reactor, could have increased the rate of metabolism of the SBCOD to RBCOD, which
would otherwise have escaped from the anaerobic reactor and into the final effluent.
The effective COD removal recorded during this phase coincided with a reduced organic
load rate of 0.5 kgCOD/kgMLSS/d. Similar results were observed for other treatment
systems. For example, Eroglu et al., (1990) and Ozturk et al., (1990) reported a consistent
BOD removal of 85% from the activated sludge system treating vegetable oil effluent at
an organic loading rate of 0.45 kgBOD/kgMLSS/d.
A shorter sludge age from 30 days to 15 days, on the other hand, had a minimal effect on
the COD removal rates. As regards phosphorus removal a shortened sludge age from 30
days to 15 days resulted in significant increases in removal rates. This improvement in
phosphorus removal efficiency with a decreasing in sludge age is consistent with the
findings of Wentzel et al., (1990) who reported an increase in phosphorus removal
efficiency with lower sludge ages, although this beneficial effect of a shorter sludge age
became less significant below a sludge age of 3 days.
Despite the variations in COD and phosphorus removal the concomitant removal of FOG
was always consistently better than 95%. One possible reason for these consistently high
overall rates could be that the fatty material adsorbed to the biomass rather than simple
metabolism of the FOG compounds.
The operating conditions in this forth phase appear to approach optimal and ideal
biological conditions required for successful treatment of edible oil effluents as regards
both COD and phosphorus reduction while, at the same time, reducing the FOG
concentrations.

- 61 -
3.10 CONCLUSIONS
From the above experiments, and other experiments reported from literature, it is clear
that edible oil effluents can be successfully treated using biological methods as a form of
pre-treatment. Although, the total effluent COD (Sti) values were considerably reduced
during the present study, the effluent would require further polishing treatment to ensure
that the regulatory discharge standards or municipal by-laws are successfully adhered to.
It is important to point out that effluent parameters are strongly dependent on the quality of
crude oil and the refining method (physical or chemical/caustic refining) currently being
employed and that these parameters change from batch to batch. Also, additional
phosphorus removal from the final effluent, following biological treatment, using chemical
precipitation methods, may be required before discharging to the municipal sewer system.
Future recommendations include dilution of the edible oil effluent with domestic
wastewater prior to its subjection to activated sludge treatment, as this will ensure that the
final effluent characteristics are favourable for biological remediation techniques by
adjusting the TKN/COD; P/COD; and RBCOD/Sti ratios, as well as identifying possible
limiting factors in the phosphorus removal process like, RBCOD and biomass
concentrations.

- 62 -
CHAPTER 4
ANAEROBIC DIGESTION
4.1 INTRODUCTION
4.1.1 Anaerobic Digestion Process
Anaerobic digestion involves the breakdown of organic matter by the action of
microorganisms in the absence of oxygen producing biogas, which contains methane and
carbon dioxide as well as quantities of ammonia, nitrogen, hydrogen and hydrogen
sulphide (Callander and Barford, 1983).
Although some fungi and protozoa can be found in anaerobic digesters, bacteria are the
dominant microorganisms. The consortium of microorganisms involved consists of
several trophic groups that possess different carbon catabolic functions (Stafford, et al.,
1980). The four different groups include hydrolytic bacteria, hydrogen-producing
acetogenic bacteria, homoacetogenic bacteria and methanogenic bacteria as shown in
Figure 4.1 (Stafford, et al., 1980; Bulock and Kristiansen, 1987).
Figure 4.1: Diagram illustrating the four trophic groups involved in anaerobic digestion
COMPLEX ORGANIC MATERIAL
HYDROLYTIC AND FERMENTATIVE BACTERIA
GROUP I
Propionate, butyrate, long-chain fatty acids
HYDROGEN-PRODUCING BACTERIA GROUP II
Formate, Acetate
Acetate
Methanogenic Bacteria Group IV
H2 + CO2
Homoacetogenic Bacteria GroupIII
H2
CH4 + CO2 CH4
- 63 -
4.1.1.1 Hydrolytic and Fermentative Bacteria
The group consists of both obligate and facultative anaerobes (e.g. Bacteriodes,
Bifidobacterium, Clostridium, Lactobacillus and Streptococcus), which hydrolyse complex
organic molecules (e.g. Proteins, cellulose, lignin and lipids) into monomers such as amino
acids, glucose and fatty acids (Bitton, 1994).
4.1.1.2 Acetogenic Bacteria
Acetogenic bacteria, such as Syntrobacter wolinii and Syntrophomonas wolfei, consist of
hydrogen-producing and homoacetogenic bacteria (Bitton, 1994). Hydrogen-producing
acetogenic bacteria catabolize certain fatty acids (eg.propionic acid, butyric acid (Stafford,
et al., 1980).
4.1.1.3 Methanogenic Bacteria
The Methanogenic bacteria consist of gram-positive and gram-negative bacteria (Bitton,
1994). From a taxonomic viewpoint methanogenic bacteria, belong to a separate kingdom
(Archaebacteria). Methanogens differ from other bacteria in that methanogens lack
muramic acid in their cell walls; they have a specific coenzyme, F420, which acts as an
electron carrier in metabolism and they possess ribosomal RNA sequences that differ from
those of other prokaryotes (Bitton, 1994). Methanogens are grouped into 3 orders,
namely, Methanobacteriales (e.g. Methanogenobacterium, Methanobrevibacter,
Methanothermus), Methanomicrobiales (e.g. Methanomicrobium, Methanogenium,
Methanospirillum, Methanosarcina and Methanococcoides), and Methanococcales (e.g.
Methanococcus) (Bitton, 1994).
Methanogenic bacteria are often considered the key class of microorganisms in anaerobic
digestion as well as the most fastidious of all the microorganisms responsible for
anaerobic conversion of organics to methane. They are also known for their low synthesis
rate (Speece, 1983). Methanogenic bacteria can be subdivided into two categories,
namely, hydrogenotrophic and acetotrophic methanogens (Bitton, 1994). The
hydrogenotrophic methanogens, hydrogen-utilizing chemolithotrophs, convert hydrogen
and carbon dioxide to methane (Eq.1). The acetotrophic methanogens, also know as

- 64 -
acetoclastic or acetate splitting bacteria, convert acetate to methane (Eq.2) and are
comprised of two main genera, namely, Merthanosarcina and Methanothrix (Bitton, 1994).
CO2 + 4H2 CH4 + 2H2O Eq. 1
CH3COOH CH4 + CO2 Eq.2
An obligate, syntrophic relationship exists between the hydrogen-producing acetogenic
bacteria and the hydrogenotrophic methanogens (Speece, 1983). The hydrogen partial
pressure must be maintained at an extremely low level to ensure favorable thermodynamic
conditions for the conversion of volatile acids and alcohols to acetate (Stafford, et al.,
1980; Bitton, 1994; Bulock and Kristiansen, 1987; Speece, 1983).
4.1.1.4 Sulphate Reducing Bacteria (SRB)
Sulphate is present in many wastewaters as a result of the use of sulphuric acid in
chemical processing. Sulphate is utilized by SRB as an electron acceptor, with hydrogen
sulphide as the main product of the reaction. SRB may also utilize sulphite, which is an
intermediate step in sulphate reduction. Methane producing bacteria (MPB) and SRB
utilize the same energy sources, namely, acetate and hydrogen. Therefore the SRB
compete with the MPB for the same energy sources (Sarner et al., 1988).
Methane Production
4H2 + HCO3- + H+ CH4 + 3H2O Eq.3
CH3COO- + H2O CH4 + HCO3 Eq. 4
Sulphate Reduction
4H2 + S + H+ HS- + 4H2O Eq.5
CH3COO- + SO4- HS- + 2HCO3
- Eq.6
These two groups of bacteria have many similarities, namely, most are strictly anaerobic,
chemoheterotrophic and have similar temperature and pH requirements. Therefore they
are found co-existing in many anaerobic ecosystems (Zhou and Fang, 1998) although,
SRB are less sensitive to pH and temperature variations (Sarner et al., 1988). Growth
kinetics studies of SRB and MPB have shown that sulphate-reducing bacteria have a

- 65 -
higher affinity for acetate (ks = 9.5 mg/L) than MPB (ks = 32.8 mg/L), therefore SRB will
outcompete MPB under low acetate concentrations (Schonheit et al., 1982). This
competitive inhibition results in shunting of electrons from methane production to sulphate
reduction (Schonheit et al., 1982). This competitive inhibition results in shunting of
electrons from methane production to sulphate reduction (Schonheit et al., 1982; Speece,
1996).
4.1.2 The Anaerobic Baffled Reactor and Fed- Batch Digestion
The Anaerobic Baffled Reactor (ABR) was devised by Bachmann, et al., (1985), who
initially named it the Modified Sludge Blanket Reactor. The ABR has been described as a
series of Upflow Anaerobic Sludge Blanket (UASB) reactors, which do not require
granulation (Bachmann et al., 1985). The ABR, as illustrated in Figure 4.2, contains
alternately hanging and standing baffles, dividing it into a number of compartments, which
segregate both biomass and gas phases (Nachaiyasit and Stuckey, 1995).
Figure 4.2: Schematic representation of the anaerobic baffled reactor
The slanted lower edges of the hanging baffles route flow of the liquid through the middle
of the sludge bed, therefore reducing channeling. The liquid flow is alternately upward and
downward between partitions. The biomass within the reactor tends to rise and settle with
gas production and move horizontally down the reactor at a relatively slow rate
(Nachaiyasit and Stuckey, 1995). The wastewater can therefore come into contact with a
large active biomass as it passes through the ABR. The microorganisms in each
compartment differ depending on the specific environmental conditions prevailing within
INFLUENT EFFLUENT
GAS OUTLET

- 66 -
each compartment. Also, the remaining compounds or intermediates to be degraded
influence the sludge characteristics (Nachaiyasit and Stuckey, 1997b).
The ABR is well suited to intermittent high organic or hydraulic loads. With biomass, which
has been acclimatized to all possible components in the effluent, the ABR will withstand
toxic shocks (Sacks, et al., 1998). These attributes are largely due to the
compartmentalization of different microbial associations, which have been acclimatized to
the range of constituents of wastewater (Sacks et al., 1998). The various microbial
associations allow specialized bacteria to degrade the effluent stepwise, producing,
degradation products, which may be toxic or inhibitory to a mixed culture (Sacks, et al.,
1998). The compartmentalized structure of the ABR prevents much of the biomass being
exposed to low pH during organic shock loads and maintains the biomass being exposed
to low pH during organic shock loads and maintains the biomass within the reactor for long
solids retention times (Nachaiyasit and Stuckey, 1997b). One of the most significant
advantages of the ABR is its ability to separate acidogenesis and methanogenesis
longitudinally, allowing the reactor to behave as a two-phase system without the
associated control problems and high costs. The reactor design is simple, with no moving
parts or mechanical mixing, making it relatively inexpensive to construct. High solids
retention time is achieved without the need for biomass to be fixed to media particles or a
solid-settling chamber. Increased volumes of wastewater can be treated since the
hydraulic retention time and solids retention time are separate, relative to CSTR where
hydraulic retention time is equal to solids retention time. The ABR has been found to be
stable to hydraulic and shock loads and the reactor configuration provides protection of the
biomass to toxic compounds in the effluent.
Digester start-up is one of the major problems associated with anaerobic treatment
systems. Investigations have shown that with a long initial hydraulic retention time (80 hr),
by gradually reducing it whilst keeping the substrate concentration constant, superior
performance was observed in comparison to a reactor started up with a constant and a
low hydraulic retention time coupled with a step-wise decrease in substrate concentration
(Barber and Stuckey, 1998). Investigations involving operation of the ABR at low
temperatures showed that biochemical reactions double in relative activity for every 10C
increase in temperature (Nachaiyasit and Stuckey, 1997a). However, no significant
- 67 -
reduction in overall COD removal efficiency was observed when the temperature was
decreased from 35C to 25C. A further reduction to 15C resulted in 20% decrease in
COD removal (Nachaiyasit and Stuckey, 1997a). Changes in performance were gradual,
which is an advantage, as this would provide improved protection to shocks, in
comparison to other reactors.
4.2 AIMS AND OBJECTIVES
This research project investigates the potential usage of anaerobic digestion for treatment
of vegetable oil effluent. The following objectives were followed:
1. To chemically characterize the effluent
2. To evaluate the use of gravity separators for lipid reduction
3. To evaluate the use of Barium Chloride for sulphate reduction
4. To investigate the anaerobic biodegradability of the edible oil effluent.
5. Using Biochemical Methane Potential (BMP) and Anaerobic Toxicity Assay (ATA) to
measure the biodegradability of edible oil effluent in anaerobic treatment.
4.3 MATERIALS AND METHODS
4.3.1 Characterisation of the edible oil effluent
Final effluent was collected and stored at 4C until required. Characterisation of the
effluent was similar to the previous chapters where the organic load and FOG loads were
determined.
4.3.2 Lipid Reduction by Gravitational Separation
A well mixed sample of edible oil effluent (100 mL) was placed into a 100 mL separating
funnel and allowed to stand for 20 min. Thereafter, 50 mL was removed and referred to as
the settled layer. The remaining 50 mL was removed and referred to as the top layer. Both
samples were then analysed. The experiment was repeated with the following settling time
periods ( 1 hr, 2 hr, 4 hr, 24 hr).

- 68 -
4.3.3 Sulphate Reduction using Barium Chloride (BaCl2)
A BaCl2 solution was prepared 5 times in excess of the sulphate content present in the
wastewater sample. 2.125 g BaCl2 was weighed and then dissolved in 20 mL distilled
water. The BaCl2 solution was added slowly to the wastewater sample, with continuous
mixing. The sample was allowed to stand for 1 hr, producing a white precipitate. The
supernatant was decanted and analysed.
4.3.4 Biochemical Methane Potential and Toxicity Assays
The BMP and anaerobic toxicity assays were carried out according to the method
described by Owen et al., (1979).
4.3.4.1 Anaerobic Sludge
The experiment was carried out with anaerobic sludge collected from a mesophilic
digester at a wastewater treatment works. Properties of the anaerobic sludge used are
outlined in Table 4.1.
Table 4.1 Properties of Anaerobic Sludge
PARAMETER mg/LpH 7.16 COD 14 520 Alkalinity 12 845 Lipids 16 400 Sulphates 60 VSS 4 385 TSS 8 690 TDS 800
The sludge was stored at 4C until required. Sludge storage has been found to have no
significant effect on the extent of degradation (Shelton and Tiedjie, 1984).
4.3.4.2 Preparation of Assay Bottles
The experiment was carried out in 125 mL bottles with butyl rubber septa and metal caps
as well as 225 mL bottles with butyl rubber septa and screw caps. The bottles were
gassed with OFN (oxygen free nitrogen), and then closed prior to the introduction of
samples, defined medium and inoculum.
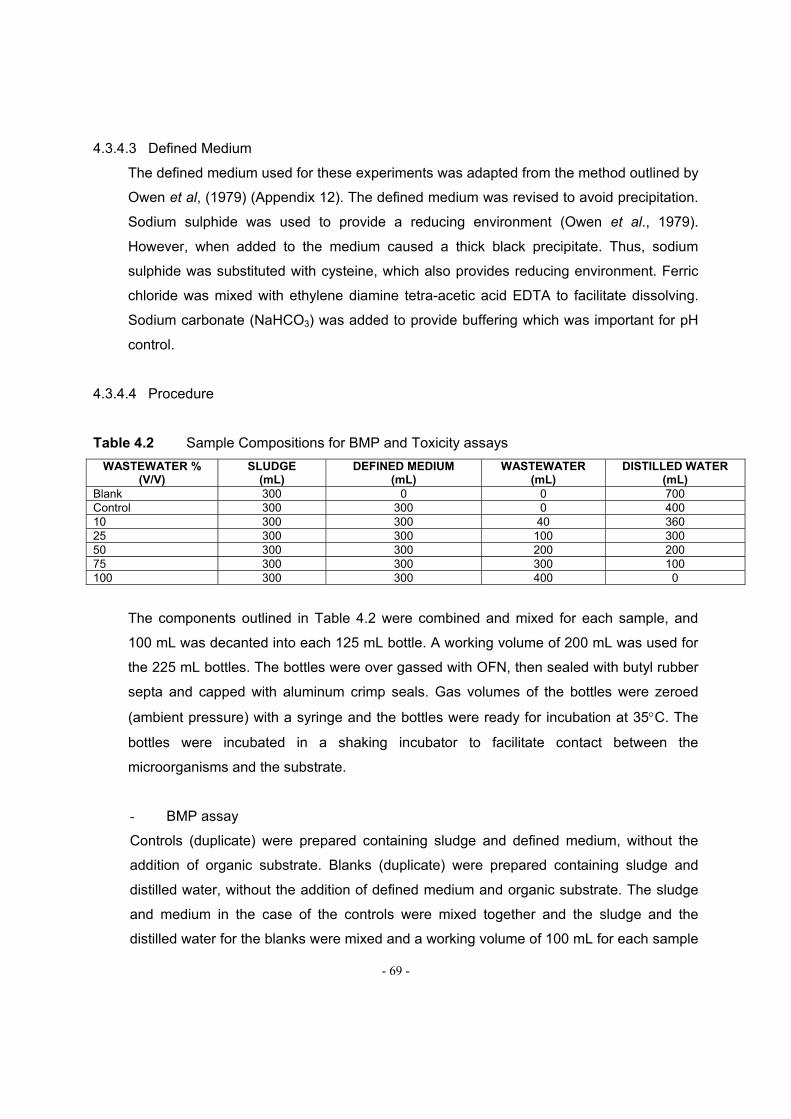
- 69 -
4.3.4.3 Defined Medium
The defined medium used for these experiments was adapted from the method outlined by
Owen et al, (1979) (Appendix 12). The defined medium was revised to avoid precipitation.
Sodium sulphide was used to provide a reducing environment (Owen et al., 1979).
However, when added to the medium caused a thick black precipitate. Thus, sodium
sulphide was substituted with cysteine, which also provides reducing environment. Ferric
chloride was mixed with ethylene diamine tetra-acetic acid EDTA to facilitate dissolving.
Sodium carbonate (NaHCO3) was added to provide buffering which was important for pH
control.
4.3.4.4 Procedure
Table 4.2 Sample Compositions for BMP and Toxicity assays
WASTEWATER % (V/V)
SLUDGE (mL)
DEFINED MEDIUM(mL)
WASTEWATER (mL)
DISTILLED WATER(mL)
Blank 300 0 0 700 Control 300 300 0 400 10 300 300 40 360 25 300 300 100 300 50 300 300 200 200 75 300 300 300 100 100 300 300 400 0
The components outlined in Table 4.2 were combined and mixed for each sample, and
100 mL was decanted into each 125 mL bottle. A working volume of 200 mL was used for
the 225 mL bottles. The bottles were over gassed with OFN, then sealed with butyl rubber
septa and capped with aluminum crimp seals. Gas volumes of the bottles were zeroed
(ambient pressure) with a syringe and the bottles were ready for incubation at 35C. The
bottles were incubated in a shaking incubator to facilitate contact between the
microorganisms and the substrate.
- BMP assay
Controls (duplicate) were prepared containing sludge and defined medium, without the
addition of organic substrate. Blanks (duplicate) were prepared containing sludge and
distilled water, without the addition of defined medium and organic substrate. The sludge
and medium in the case of the controls were mixed together and the sludge and the
distilled water for the blanks were mixed and a working volume of 100 mL for each sample

- 70 -
was decanted into each bottle, leaving a headspace of 25 mL. Duplicates of each sample
were prepared incorporating a range of wastewater concentrations (Table 4.2). For the
second BMP run as well as the run involving pretreated samples, 10%, 50% and 100%
wastewater concentrations were used.
- Anaerobic Toxicity Assay (ATA)
Assay bottles were prepared as in the BMP assay, with defined medium, inoculum and
wastewater samples. Two runs were carried out including the use of raw effluent as well
as pretreated effluent. The wastewater concentrations investigated included 10%, 50%
and 100% to provide a range from non-inhibitory to severely toxic. An additional 2 mL
spike, containing acetate and propionate, was added to each bottle via syringe injection to
give a final concentration of 75 mg acetate and 26.5 mg propionate in each sample. Two
sets of controls were prepared (in duplicate). Control A contained only sludge, medium
and 100% v/v wastewater. Control B contained sludge, medium as well as the acetate-
propionate spike. A blank was also prepared containing only sludge and the spike.
4.3.4.5 Gas Measurement
Gas volume sampling and removal during incubation was performed with a graduated
syringe (20 mL), fitted with a 22-gauge needle. Readings were taken at incubation
temperature and the syringe was held vertical for measurement. During the second run
using raw effluent as well as during pretreatment experiments, the syringe was filled to the
2 mL mark with 500 g/L KOH, which absorbs carbon dioxide present in the biogas. The
gas is allowed to bubble through the KOH, thus gas volumes taken represented methane
content of the biogas.
Gas production was measured daily for the first 5 days and periodically thereafter each
measurement. Incubation was continued until gas production was complete.
4.3.5 Fed-Batch Digestion
4.3.5.1 Reactor
A reactor of 2.5 L with a working volume of 2 L was used. The reactor was equipped with a
temperature control system mechanical mixer. The gas port was attached to a saline

- 71 -
displacement system to aid in monitoring gas production. The saline solution consisted of
20% (v/v) NaCl2, which was acidified to pH 3 - 4. A glass syringe (50mL) was used to feed
substrate to the digester. A peristaltic pump was used to feed samples with volumes larger
than 50 mL.
4.3.5.2 Artificial Effluent
The artificial effluent used in this experiment is illustrated in Table 4.3.
Table 4.3: Composition of Artificial Effluent
COMPONENT CONCENTRATION (mg/L)MgCl2.6H2O 468 CaCl2.2H2O 117 FeSO4.7H2O 5.25 ZnSO4.7H2O 1.5 MnSO4 1.5 CuSO4.5H2O 0.3 CoCl2.6H2O 0.3 Na2MoO4.2H2O 0.15 H3BO3 0.3 KI 0.075 Yeast Extract 10
4.3.5.3 Digester Start-up
Prior to inoculation, the reactor was filled with water. The reactor was examined for gas
leaks and the temperature control system and the mixer were switched on. This was
carried out to ensure proper working order of the system. The digester was then
inoculated with 2 L anaerobic sludge, which had a COD of 14 500 mg/L and pH 7.39.
Digestion was carried out at 35C, with continuous mixing.
4.3.5.4 Fed-Batch Digestion
Initially the digester was fed with 50 mL artificial effluent, which had a COD of
approximately 400 mg/L. With regular pH and COD monitoring the feed volume was then
increased to 100 mL/day except on Saturdays and Sundays. After 20 days, the maximum
working volume was reached and the reactor contents were drained, leaving 950 mL of
active sludge. Anaerobic conditions were maintained by pumping OFN in to the reactor
after drainage. Effluent with a COD of 2000 mg/L was then fed to the digester and gas
production, as well as pH and COD monitored.

- 72 -
4.3.6 Anaerobic digestion using the ABR
4.3.6.1 Anaerobic Baffled Reactor
The working volume of the ABR used in this experiment was 6 L. The reactor was
operated at a temperature of 35C, using a temperature controlled water bath. The
reactor was equipped with an inlet for feeding and an outlet for effluent overflow and
sampling. Gas ports enabled monitoring of gas production.
4.3.6.2 Digester Start-up
The ABR was inoculated with anaerobic sludge and allowed to stand for 15 days for
sludge settlement and acclimatization of the microorganisms. A decline in pH was
observed with no gas production. The drop in pH indicated that the methanogenic bacteria
were not capable of utilizing volatile acids produced by Acetogenic bacteria, and as result,
did not produce any biogas.
The second start-up involved of the reactor with 2 L anaerobic sludge, with a COD of 11
060 mg/L and pH 7.10. The remaining working volume of 4 L was composed of artificial
effluent. The artificial effluent used is illustrated in Table 5.4. The reactor was allowed to
stand for 7 days for sludge settlement. Feeding was initiated with artificial effluent,
monitoring gas production and pH. The reactor was fed volume of 200 mL, composed of
90% edible oil effluent and 10% artificial effluent. Initially, a glass syringe was used to feed
the reactor; thereafter a peristaltic pump was used.
4.3.7 Analyses
COD - The measurement for the first run of the BMP assay was carried out using the
spectrophotometer as described in Appendix 3a. The measurement for the
second run of the BMP assay as well as for the ATA, edible oil effluent
characterization and pretreatment experiments were based on the open reflux,
colorimetric method described in Appendix 1b.
Sulphates - Sulphates were measured colorimetrically using the Merck SQ118
Spectrophotometer as described in Appendix 8 to characterise the edible oil
effluent as well as the BMP, ATA and pretreatment experiments.

- 73 -
TSS - Total suspended solids (TSS) and total dissolved solids (TDS) were measured
gravimetrically according to Standard Methods as described in Appendix 9
FOG - The measurement of lipids was carried out gravimetrically according to
Standard Methods as described in Appendix 10 for the BMP, ATA, Pretreatment
experiments and characterisation of the edible oil effluent.
pH - pH was one of the parameters measured to characterise the edible oil effluent
as well as the BMP, ATA and pretreatment experiments. pH was measured using
a calibrated pH meter (Beckman); the process is described in Appendix 11.
MLSS & VSS - Total solids (TS) and volatile solids (VS) were measured gravimetrically
according to Standard Methods as described in Appendix 13 for the second run
of the BMP assay, ATA, pretreatment experiments and characterisation of the
edible oil effluent.
4.4 RESULTS AND DISCUSSION
4.4.1 Chemical Characteristics of Edible Oil Effluent
Two batches of edible oil effluent were collected and analysed. The first was used for the
first run of the BMP assay. The second batch was used for the second run of the BMP
assay, ATA and pretreatment studies.
Both batches were final edible oil effluent, with the treatment process differing for each. A
filtration system was implemented following the DAF unit, after sample A was collected
and analysed. A significant change in lipid content of the effluent was seen, which
suggests that the filtration system removed some of the lipids present in the effluent. No
drastic changes were seen in the COD and sulphate content as well as the pH. The high
sulphate concentration in both samples could be attributed to the use of sulphuric acid in
the production process.

- 74 -
4.4.2 Lipid Reduction by Gravitational Separation
0
200
400
600
800
1000
20 min 60 min 2hrs 4hrs 24hrs
Lip
ids
(mg
/L)
Top Layer Settled Layer
0
2000
4000
6000
8000
10000
20 min 60 min 2hrs 4hrs 24hrs
CO
D (
mg
/L)
Top Layer Settled Layer
Table 4.4: Results of lipid reduction by gravitational separation
SETTLING TIME PARAMETER TOP LAYER SETTLED LAYER 20 min pH 5.07 5.06 TS 6030 mg/L 8320 mg/L VS 5553 mg/L 8042 mg/L 60 min pH 5.08 5.07 TS 11700 mg/L 11090 mg/L VS 10200 mg/L 9550 mg/L 2 hr pH 5.07 5.06 TS 13030 mg/L 13110 mg/L VS 2260 mg/L 2710 mg/L 4 hr pH 5.09 5.07 TS 11160 13070 mg/L VS 880 mg/L 2610 mg/L 24 hr pH 5.06 5.07 TS 14420 mg/L 14290 mg/L VS 3490 mg/L 3970 mg/L
The objective of this experiment was to observe the settling properties of lipids contained
in the effluent. It was expected that the lipids would float to the surface of the solution if
allowed to stand, with a decrease in lipid concentration in the settled layer of effluent.
Figure 4.3 illustrates the lipid concentration of the top and settled layers for various time
intervals. For the times intervals 20 min, 60 min, 2 hr and 4 hr there was no significant
difference in lipid concentration for the top and settled layers. However, for the time
interval of 24 hr a noticeable difference was seen, with the lipid concentration of the top
layer at 184 mg/L and the settled layer at 870 mg/L. This suggests that the lipids settled in
solution. It is possible that the fatty compounds adhered to suspended solids and settled
out of solution, thus the higher lipid concentration in the settled layer. No significant
difference was observed for pH (Table 4.4). The COD concentrations (Figure 4.4) for the
Figure 4.3: Lipids content (mg/L) of vegetable oil effluent after lipid reduction pre-treatment
Figure 4.4: COD content (mg/L) of vegetable oil effluent after lipid reduction pre-treatment

- 75 -
settled layers were slightly higher than the top layers since the TS and VS (Table 4.4) was
higher in the settled layers.
4.4.3 Sulphate Reduction using Barium Chloride
0
500
1000
1500
2000
2500
Before Treatment After Treatment
Su
lph
ates
(m
g/L
)
Figure 4.5: Sulphate content (mg/L) of vegetable oil effluent before and after sulphate reduction pre-treatment
Figure 4.5 illustrates the sulphate results obtained before and after treatment. A sharp
decrease in sulphate content was observed as a result of the pretreatment process. No
changes were observed for pH.
4.4.4 Biodegradability Assay
BMP is a measure of sample biodegradability. The objective of this experiment was to
evaluate whether anaerobic microbial populations were able to utilize the edible oil
effluent with resultant methane production. The BMP assay was run using raw as well as
pretreated effluent. Measurement of gas production provided an indication of the
metabolic activity and the degradability of the substrate. Experimental controls were run
for each sample as well as a range of wastewater concentrations. The results of the two
runs using raw effluent are illustrated in Table 4.6 to 4.16. Tables 4.17 to 4.21 illustrate
the results of the BMP assay using pretreated effluent.
Table 4.5 and 4.11 show results of the experimental controls, for the first and second runs,
respectively. Tables 4.6 to 4.9 and Tables 4.12 to 4.14 illustrate the results of the
bioassay for the different substrate concentrations of the first and second runs
respectively. Results of the experimental controls of the BMP assay using pretreated
effluent are shown in Tables 4.16 and the results of the various wastewater concentrations

- 76 -
are shown in Tables 4.17 to 4.19. Average gas production samples (mean value of each
sample) were corrected by subtracting the gas production from that of the control in order
to show the gas production resulting from degradation of the substrate. The graphs of
cumulative gas production are useful as they illustrate gas production rate (gradient of the
slope) and time at which gas production stabilized.
4.4.4.1 Results of the Biodegradability Assay using Raw Edible Oil Effluent
A. Results of the BMP Assay (First Run)
Table 4.5: Results of the controls in the BMP assay using edible oil effluent (first
Run)
0
2
4
6
8
10
1 6 11 16 21 26 31 36 41 46 51 56Time (days)
Co
rrec
ted
Gas
P
rod
uct
ion
(m
L)
0
10
20
30
40
50
60
70
80
1 6 11 16 21 26 31 36 41 46 51 56Time (days)
Cu
mu
lati
ve G
as
Pro
du
ctio
n (
mL
)
Total gas production (350C): 68.33 mL
%COD Reduction: 33.32%
Mineralized COD: -
% Lipid Reduction: 92.8%
Parameter Before Incubation After Incubation
pH: 7.27 7.42
Alkalinity 1844 mg/L 2128 mg/L
TSS: 8890 mg/L 5830 mg/L
TDS: 1790 mg/L 1315 mg/L
Figure 4.6: Average gas production of the controls in the BMP assay using raw edible oil effluent (First Run)
Figure 4.7: Cumulative gas production of the controls in the BMP assay using raw edible oil effluent (First Run)

- 77 -
Table 4.6: Results of the BMP assay with 10% wastewater concentration using raw
edible oil effluent (First Run)
-3
-2
-1
0
1
2
3
1 6 11 16 21 26 31 36 41 46 51 56
Time (days)
Co
rrec
ted
Gas
P
rod
uct
ion
(m
L)
0
20
40
60
80
100
1 6 11 16 21 26 31 36 41 46 51 56
Time (days)C
um
ula
tive
Gas
P
rod
uct
ion
(m
L)
Total gas production (350C): 77.46 mL
%COD Reduction: 16.77%
Mineralized COD: 4.14 mg
Lipid Reduction: 25.34%
Parameter Before Incubation After Incubation
pH: 7.34 7.53
Alkalinity: 1711 mg/L 2226 mg/L
TSS: 9360 mg/L 6070 mg/L
TDS: 2510 mg/L 1320 mg/L
Figure 4.8: Corrected average gas production of 10% wastewater in the BMP assay using raw edible oil effluent (First Run)
Figure 4.9: Cumulative gas production of 10% wastewater in the BMP assay using raw edible oil effluent (First Run)

- 78 -
Table 4.7: Results of the BMP assay with 25% wastewater concentration using raw
edible oil effluent (First Run)
-8
-6
-4
-2
0
2
4
6
1 6 11 16 21 26 31 36 41 46 51 56
Time (days)
Co
rrec
ted
Ave
rag
e G
as
Pro
du
ctio
n (
mL
)
0102030405060708090
1 6 11 16 21 26 31 36 41 46 51 56
Time (days)C
um
ula
tive
Gas
P
rod
uct
ion
(m
L)
Total gas production: 77.58 mL
%COD Reduction: 15.19%
Mineralized COD: 9.50 mg
Lipid Reduction: 24.37%
Parameter Before Incubation After Incubation
pH: 7.35 7.43
Alkalinity: 1716 mg/L 2472 mg/L
TSS: 9480 mg/L 6890 mg/L
TDS: 1790 mg/L 1650 mg/L
Figure 4.10: Corrected average gas production of 25% wastewater in the BMP assay using raw edible oil effluent (First Run)
Figure 4.11: Cumulative gas production of 25% wastewater in the BMP assay using raw edible oil effluent (First Run)

- 79 -
Table 4.8: Results of the BMP assay with 75% wastewater concentration using raw
edible oil effluent (First Run)
-5
0
5
10
15
1 7 13 19 25 31 37 43 49 55
Time (days)
Co
rrec
ted
Gas
P
rod
uct
ion
(m
L)
0
20
40
60
80
100
1 6 11 16 21 26 31 36 41 46 51 56Time (days)
Cu
mu
lati
ve g
as
pro
du
ctio
n (
mL
)
Total gas production (350C): 82.32 mL
% COD Reduction: 8.01%
Mineralized COD: 15.16 mg
Lipid Reduction: 45.79%
PARAMETER BEFORE INCUBATION AFTER INCUBATION
pH: 7.32 7.59
Alkalinity: 1863 mg/L 2766 mg/L
TSS: 991 mg/L 6365 mg/L
TDS: 3060 mg/L 2625 mg/L
Figure 4.12: Corrected average gas production of 75% wastewater in the BMP assay using raw edible oil effluent (First Run)
Figure 4.13: Cumulative gas production of 75% wastewater in the BMP assay using raw edible oil effluent (First Run)
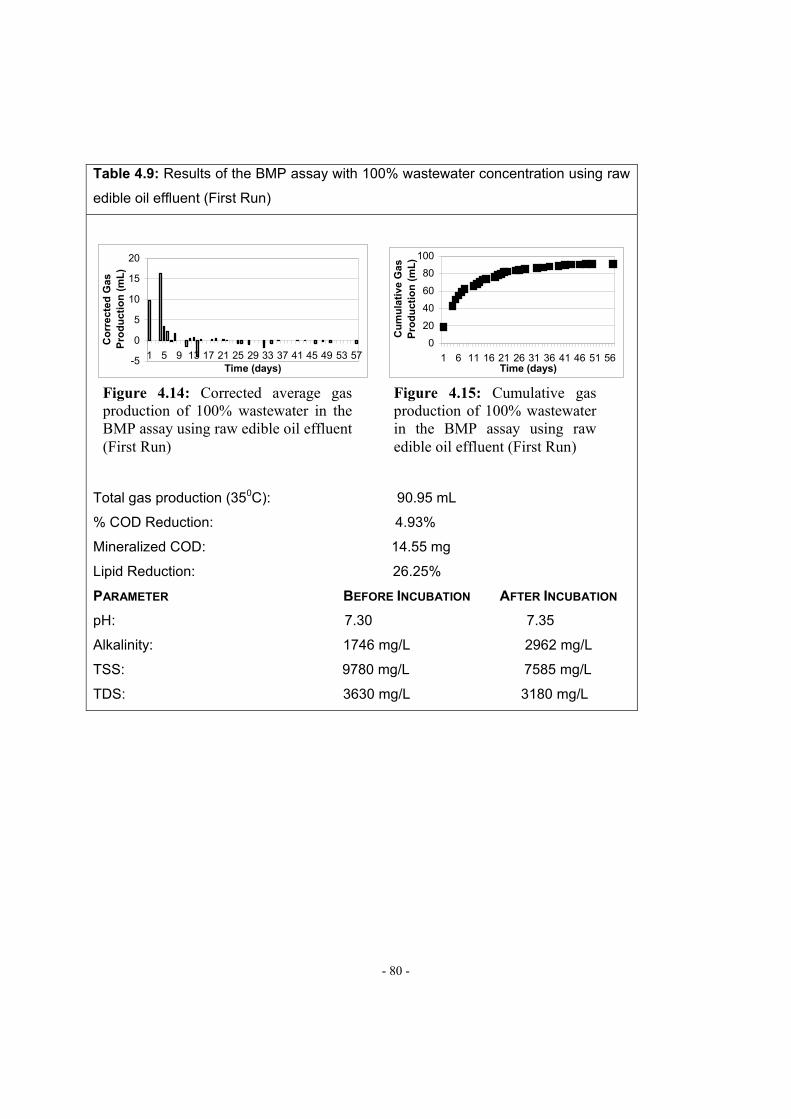
- 80 -
Table 4.9: Results of the BMP assay with 100% wastewater concentration using raw
edible oil effluent (First Run)
-5
0
5
10
15
20
1 5 9 13 17 21 25 29 33 37 41 45 49 53 57Time (days)
Co
rrec
ted
Gas
P
rod
uct
ion
(m
L)
0
20
40
60
80
100
1 6 11 16 21 26 31 36 41 46 51 56Time (days)
Cu
mu
lati
ve G
as
Pro
du
ctio
n (
mL
)
Total gas production (350C): 90.95 mL
% COD Reduction: 4.93%
Mineralized COD: 14.55 mg
Lipid Reduction: 26.25%
PARAMETER BEFORE INCUBATION AFTER INCUBATION
pH: 7.30 7.35
Alkalinity: 1746 mg/L 2962 mg/L
TSS: 9780 mg/L 7585 mg/L
TDS: 3630 mg/L 3180 mg/L
Figure 4.14: Corrected average gas production of 100% wastewater in the BMP assay using raw edible oil effluent (First Run)
Figure 4.15: Cumulative gas production of 100% wastewater in the BMP assay using raw edible oil effluent (First Run)

- 81 -
Table 4.10: Results of the biodegradability assay using raw edible oil effluent (First Run)
Wastewater Concentration
Wastewater COD
(mg/bottle)
Mineralized COD (mg)
Gas Produced (mL/bottle)
Corrected Gas
(mL/bottle)
Estimated CH4 (mL)
% CH4 % COD Reduction
Control - - 44.8 - - - - 10 24.68 4.14 49.3 4.5 1.64 36.4 16.77 25 62.58 9.5 50.43 5.63 3.75 66.6 15.16 50 136.50 14.65 50.13 5.79 3.33 68.6 10.73 75 185.24 15.16 66.75 21.95 5.99 27.29 8.01 100 295.20 14.55 73.37 28.52 5.75 20.16 4.93
Looking at the graphs illustrating corrected gas production for the first and second runs
using raw effluent, it can be seen that the highest gas production was recorded for
samples containing 100% substrate solution. This suggests that the organics in the raw
effluent were readily degraded by the microorganisms, with greater volumes of the effluent
resulting in greater volumes of gas produced. Corrected gas production graphs (Figures
4.7, 4.9, 4.11, 4.13 and 4.15) for the first run using raw effluent illustrates gas volumes of
between 0.5 mL and 12.5 mL for the first 9 days for the various wastewater samples.
Thereafter gas production began decreasing, which suggested that the degradable
organic materials were also decreasing.
The cumulative gas production graphs illustrate the total gas produced (i.e. not corrected
using the control). Figures 4.7, 4.9, 4.11, 4.13 and 4.15 represent the cumulative gas
produced for the various wastewater samples of the bioassay using raw effluent. After 30
d, the graphs indicate almost zero gas production suggesting that all degradable
compounds present in the substrate had been utilised.
Table 4.5 to 4.9 illustrating the results of the BMP assay using raw effluent for the first run,
includes results for pH, alkalinity, TSS and TDS before and after incubation as well as
COD reduction and lipid reduction. Alkalinity indicates the buffering capacity of a digester
or the ability of the digester to neutralize the effect of volatile acid formation. The results
show an increase in alkalinity for all samples. The pH readings before and after incubation
of both runs of the bioassay using raw effluent as well as the run using pre-treated effluent
remained within optimal working range. The optimal pH range for methanogenic bacteria
is between 6.5 and 8.2 (Ross et al., 1992). This suggests that the methanogenic bacteria
were able to utilize the volatile acids produced by acetogenic bacteria at an optimum rate.
- 82 -
An accumulation of volatile acids exceeding the buffering capacity of the digester will lead
to a drop in pH (McCarthy and McKinney, 1961; Switzenbaum et al., 1990).
The COD of a sample is an indication of the amount of the organic matter present.
Degraded organic matter is converted to methane in the biogas, thus recalcitrant organic
matter contributes to the final solution. From the results obtained, it was found that the
%COD reduction for the various substrate concentrations of the first BMP run decreased
with increasing wastewater concentration although all samples showed some degree of
COD reduction. The average COD reduction for the first run of the 10% wastewater
sample was 16.7% and 4.9% for the 100% wastewater sample. This suggests that the
methanogenic bacteria responsible for methane production were inhibited by the presence
of a toxic substance or substances (at elevated concentrations) present in the effluent.
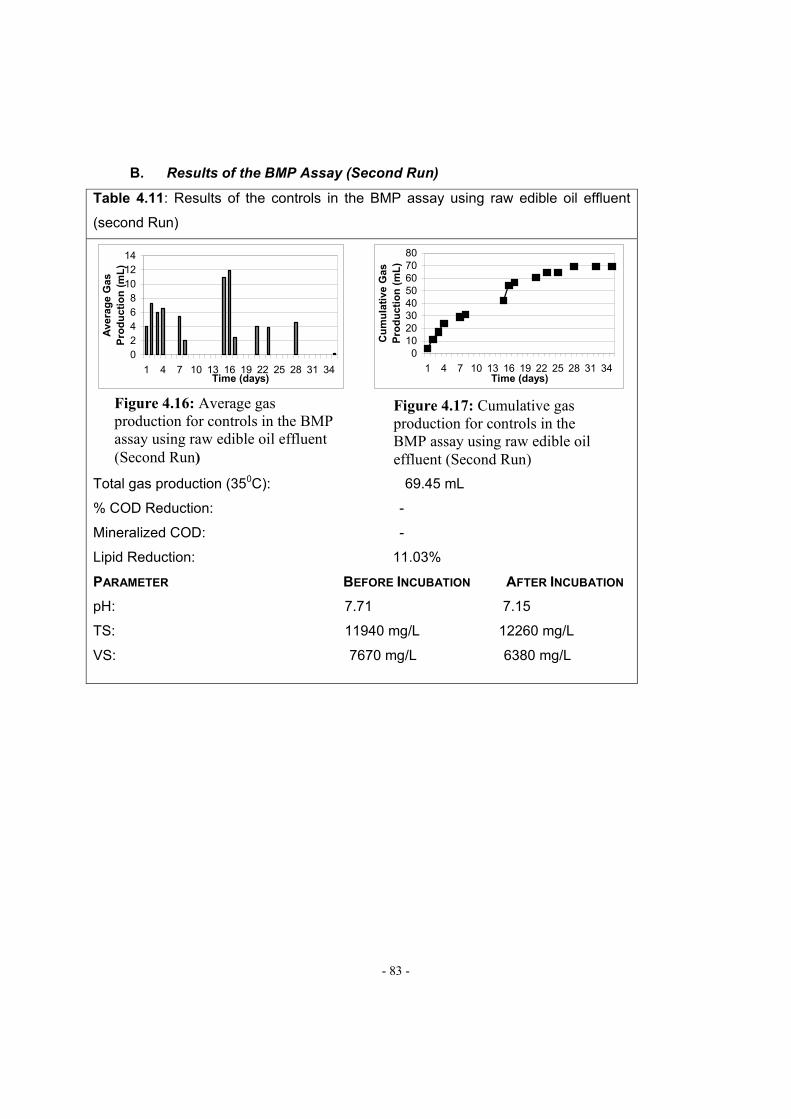
- 83 -
B. Results of the BMP Assay (Second Run)
Table 4.11: Results of the controls in the BMP assay using raw edible oil effluent
(second Run)
02468
101214
1 4 7 10 13 16 19 22 25 28 31 34Time (days)
Ave
rag
e G
as
Pro
du
ctio
n (
mL
)
01020304050607080
1 4 7 10 13 16 19 22 25 28 31 34Time (days)
Cu
mu
lati
ve G
as
Pro
du
ctio
n (
mL
)
Total gas production (350C): 69.45 mL
% COD Reduction: -
Mineralized COD: -
Lipid Reduction: 11.03%
PARAMETER BEFORE INCUBATION AFTER INCUBATION
pH: 7.71 7.15
TS: 11940 mg/L 12260 mg/L
VS: 7670 mg/L 6380 mg/L
Figure 4.16: Average gas production for controls in the BMP assay using raw edible oil effluent (Second Run)
Figure 4.17: Cumulative gas production for controls in the BMP assay using raw edible oil effluent (Second Run)

- 84 -
Table 4.12: Results of the BMP assay with 10% wastewater concentration using raw
edible oil effluent (Second Run)
-6
-4
-2
0
2
4
6
1 4 7 10 13 16 19 22 25 28 31 34
Time (days)
Co
rrec
ted
Gas
P
rod
uct
ion
(m
L)
0
20
40
60
80
1 4 7 10 13 16 19 22 25 28 31 34Time (days)
Cu
mu
lati
ve G
as
Pro
du
ctio
n (
mL
)
Total gas production (35oC): 68.7mL
% COD Reduction: 13.46%
Mineralized COD: 11.1mg
Lipid Reduction: 3.87%
PARAMETER BEFORE INCUBATION AFTER INCUBATION
pH: 7.83 7.11
TS: 12910 mg/L 10920 mg/L
VS: 7370 mg/L 6350 mg/L
Figure 4.18: Corrected average gas production of 10% wastewater in the BMP assay using raw edible oil effluent (Second Run)
Figure 4.19: Cumulative gas production for 10% wastewater in the BMP assay using raw edible oil effluent (Second Run)

- 85 -
Table 4.13: Results of the BMP assay with 50% wastewater concentration using raw
edible oil effluent (Second Run)
-10
-5
0
5
10
1 4 7 10 13 16 19 22 25 28 31 34
Time (days)
Co
rrec
ted
Gas
P
rod
uct
ion
(m
L)
0
20
40
60
80
100
1 4 7 10 13 16 19 22 25 28 31 34Time (days)
Cu
mu
lati
ve G
as
Pro
du
ctio
n (
mL
)
Total gas production (350C): 78.15 mL
%COD Reduction: 17.67%
Mineralized COD: 72.1mg
Lipid Reduction: 11.59%
PARAMETER BEFORE INCUBATION AFTER INCUBATION
pH: 7.76 7.14
TS: 13020 mg/L 9200 mg/L
VS: 8090 mg/L 4970 mg/L
Figure 4.20: Corrected average gas production for 50% wastewater in the BMP assay using raw edible oil effluent (Second Run)
Figure 4.21: Cumulative gas production for 505 wastewater in the BMP assay using raw edible oil effluent (Second Run)
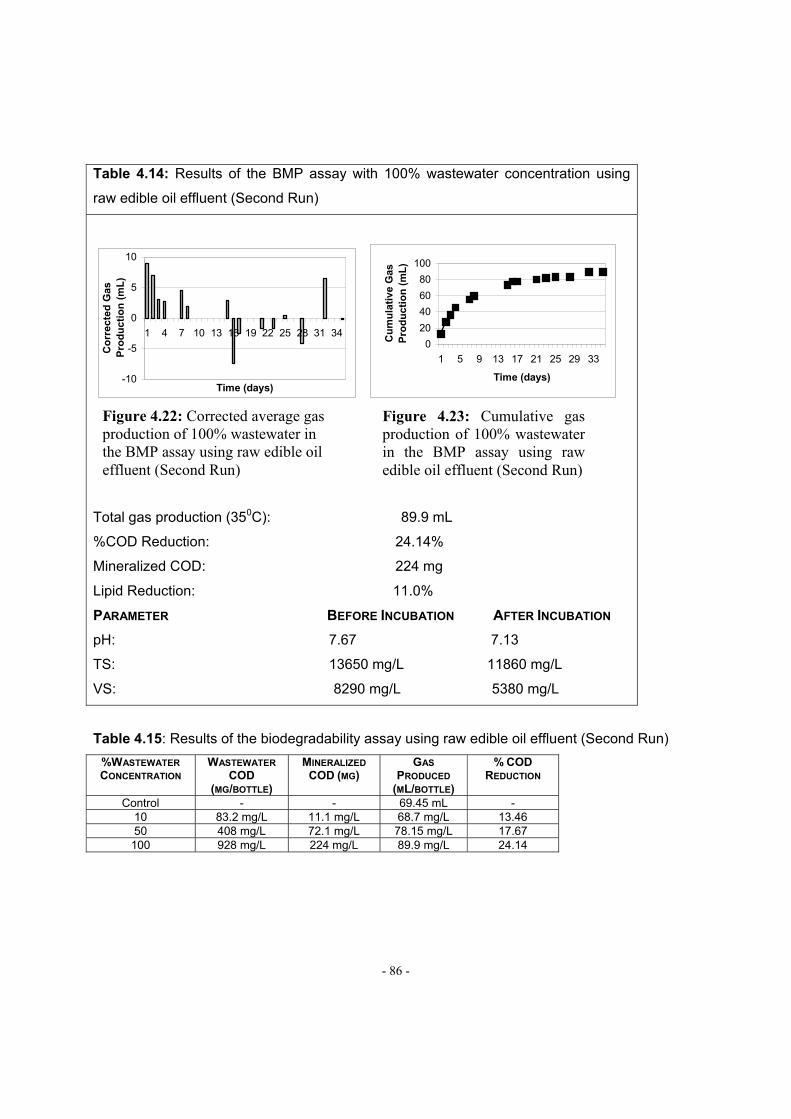
- 86 -
Table 4.14: Results of the BMP assay with 100% wastewater concentration using
raw edible oil effluent (Second Run)
-10
-5
0
5
10
1 4 7 10 13 16 19 22 25 28 31 34
Time (days)
Co
rrec
ted
Gas
P
rod
uct
ion
(m
L)
0
20
40
60
80
100
1 5 9 13 17 21 25 29 33
Time (days)C
um
ula
tive
Gas
P
rod
uct
ion
(m
L)
Total gas production (350C): 89.9 mL
%COD Reduction: 24.14%
Mineralized COD: 224 mg
Lipid Reduction: 11.0%
PARAMETER BEFORE INCUBATION AFTER INCUBATION
pH: 7.67 7.13
TS: 13650 mg/L 11860 mg/L
VS: 8290 mg/L 5380 mg/L
Table 4.15: Results of the biodegradability assay using raw edible oil effluent (Second Run)
%WASTEWATER
CONCENTRATION WASTEWATER
COD
(MG/BOTTLE)
MINERALIZED
COD (MG) GAS
PRODUCED
(ML/BOTTLE)
% COD
REDUCTION
Control - - 69.45 mL - 10 83.2 mg/L 11.1 mg/L 68.7 mg/L 13.46 50 408 mg/L 72.1 mg/L 78.15 mg/L 17.67 100 928 mg/L 224 mg/L 89.9 mg/L 24.14
Figure 4.22: Corrected average gas production of 100% wastewater in the BMP assay using raw edible oil effluent (Second Run)
Figure 4.23: Cumulative gas production of 100% wastewater in the BMP assay using raw edible oil effluent (Second Run)
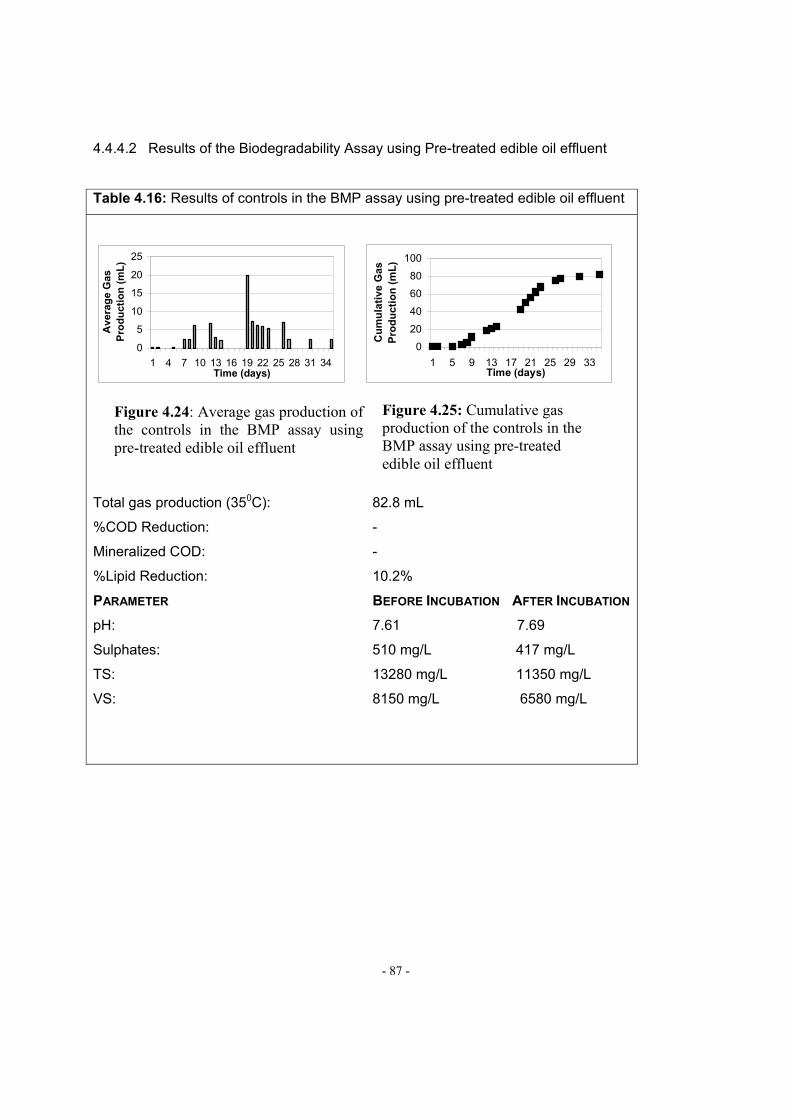
- 87 -
4.4.4.2 Results of the Biodegradability Assay using Pre-treated edible oil effluent
Table 4.16: Results of controls in the BMP assay using pre-treated edible oil effluent
0
5
10
15
20
25
1 4 7 10 13 16 19 22 25 28 31 34Time (days)
Ave
rag
e G
as
Pro
du
ctio
n (
mL
)
0
20
40
60
80
100
1 5 9 13 17 21 25 29 33Time (days)
Cu
mu
lati
ve
Ga
s
Pro
du
ctio
n (
mL
)
Total gas production (350C): 82.8 mL
%COD Reduction: -
Mineralized COD: -
%Lipid Reduction: 10.2%
PARAMETER BEFORE INCUBATION AFTER INCUBATION
pH: 7.61 7.69
Sulphates: 510 mg/L 417 mg/L
TS: 13280 mg/L 11350 mg/L
VS: 8150 mg/L 6580 mg/L
Figure 4.24: Average gas production of the controls in the BMP assay using pre-treated edible oil effluent
Figure 4.25: Cumulative gas production of the controls in the BMP assay using pre-treated edible oil effluent

- 88 -
Table 4.17: Results of the BMP assay with 10% wastewater concentration using pre-
treated edible oil effluent
-3-2-1012345
1 4 7 10 13 16 19 22 25 28 31 34
Time (days)
Co
rre
cte
d A
ve
rag
e
Gas
Pro
du
ctio
n (
mL
)
0
20
40
60
80
100
1 4 7 10 13 16 19 22 25 28 31 34Time (days)
Cu
mu
lati
ve G
as
Pro
du
ctio
n (
mL
)
Total gas production (350C): 84 mL
%COD Reduction: 12.5%
Mineralized COD: 10.2 mg
Lipid Reduction: 26.5%
PARAMETER BEFORE INCUBATION AFTER INCUBATION
pH: 7.66 7.56
Sulphates: 430 mg/L 170 mg/L
TS: 13650 mg/L 10750 mg/L
VS: 8650 mg/L 5980 mg/L
Figure 4.26: Corrected average gas production of 10% wastewater concentration in the BMP assay using pre-treated edible oil effluent
Figure 4.27: Cumulative gas production of 10% wastewater concentration in the BMP assay using pre-treated edible oil effluent

- 89 -
Table 4.18: Results of the BMP assay with 50% wastewater concentration using pre-
treated edible oil effluent
-10
0
10
20
30
40
1 4 7 10 13 16 19 22 25 28 31 34
Time (days)
Co
rrec
ted
Gas
P
rod
uct
ion
(m
L)
0
20
40
60
80
100
120
1 4 7 10 13 16 19 22 25 28 31 34Time (days)
Cu
mu
lati
ve G
as
Pro
du
ctio
n (
mL
)
Total gas production (350C): 106.1 mL
%COD Reduction: 14.9%
Mineralized COD: 66.8 mg
Lipid Reduction: 37.4%
PARAMETER BEFORE INCUBATION AFTER INCUBATION
pH: 7.73 7.59
Sulphates: 353 mg/L 652 mg/L
TS: 12890 mg/L 10260 mg/L
VS: 7170 mg/L 5850 mg/L
Figure 4.28: Corrected average gas production of 50% wastewater concentration in the BMP assay using pre-treated edible oil effluent
Figure 4.29: Cumulative gas production of 50% wastewater concentration in the BMP assay using pre-treated edible oil effluent

- 90 -
Table 4.19: Results of the BMP assay with 100% wastewater concentration using pre-
treated edible oil effluent
-4-202468
1012
1 4 7 10 13 16 19 22 25 28 31 34
Time (days)
Co
rrec
ted
Gas
P
rod
uc
tio
n (
mL
)
020
406080
100
120140
1 4 7 10 13 16 19 22 25 28 31 34Time (days)
Cu
mu
lati
ve G
as
Pro
du
ctio
n (
mL
)
Total gas production (350C): 121.25 mL
% COD Reduction: 5.2%
Mineralized COD: 47 mg
% Lipid Reduction: 49.4%
PARAMETER BEFORE INCUBATION AFTER INCUBATION
pH: 7.71 8.28
Sulphates: 333 mg/L 588 mg/L
TS: 14250 mg/L 11140 mg/L
VS: 7870 mg/L 5890 mg/L
Table 4.20: Results of the Biodegradability Assay using Pre-treated edible oil effluent
% WASTEWATER
CONCENTRATION WASTEWATER COD (MG/BOTTLE)
MINERALIZED
COD (MG) GAS PRODUCED
(ML/BOTTLE) %COD
REDUCTION
Control - - 82.8 5.2 10 81.6 10.2 84 512.5 50 448 66.8 106.1 14.9 100 904 47 121.25 5.2
Figure 4.30: Corrected average gas production of 100% wastewater concentration in the BMP assay using pre-treated edible oil effluent
Figure 4.31: Cumulative gas production of 100% wastewater concentration in the BMP assay using pre-treated edible oil
- 91 -
Figures 4.24, 4.26, 4.28 and 4.30 (in Tables 4.16 to 4.19) illustrate corrected gas
production for pre-treated effluent samples. The graphs indicate the highest gas
production for samples containing 100% wastewater concentration, which shows (as in the
case with raw effluent) that the organics present in the pre-treated effluent were degraded
by the microorganisms
Figures 4.23, 4.25, 4.27 and 4.29 (in Tables 4.14 to 4.18) illustrate cumulative gas
production for the BMP assay using pre-treated effluent. It ca be seen that for the first 7
days gas production was low in comparison to the runs using raw effluent. Thereafter a
sharp increase was seen between days 9 and 27, after which gas production seemed to
stabilize. The low gas production in the first few days suggests an acclimatization period
for the microorganisms thereafter the sharp increase in gas production suggests that the
degradable organic material present in the edible oil effluent was utilized by the
microorganisms.
The results of both runs of the bioassay using raw as well as pre-treated effluent indicate
lipid reduction, which suggests that the microorganisms were capable of degrading lipids.
The first run using raw effluent showed a general decrease in lipid reduction with
increasing substrate concentration, whereas an increase in lipid reduction was seen in the
second run with increasing wastewater concentration. Also, the percentages of lipids
reduced in the first run are higher than the second run. The effluent sample used for the
first run had a lipid content of 2492 mg/L, whereas the sample used for the second run had
a lipid content of 456 mg/L. The higher lipid content of the effluent used in the first run
could explain the decrease in reduction with increasing wastewater concentration, as
methanogenic bacteria are inhibited by lipids (Hamdi, 1991). The results of the bioassay
using pre-treated effluent indicate an increase in lipid reduction with an increase in
wastewater concentration. This suggests that the microorganisms were capable of
utilizing lipids with increasing lipid concentration in the pre-treated effluent.
BMP is referred either to sample volume (m3CH4/m3 sample), sample mass (m3CH4/kg
sample), or sample organic content (m3CH4/kg COD). The latter permits direct transfer of
results into percent organic matter converted to methane (CH4) by the theoretical 0.350m3
CH4 produced per kilogram COD catabolized (at STP) (McCarthy, 1964). Tables 4.10,

- 92 -
4.15 and 4.20 show results of the BMP assay for the first and second runs using raw
effluent as well as pre-treated effluent. Looking at the estimated CH4 and mineralized
COD columns, the amount of CH4 gas produced as a result of the mineralization of 1mg
COD can be determined. It was found that the amount of gas produced per mg COD
mineralized, did not correlate with the findings of McCarthy, (1964) for the first run using
raw effluent, with 4.05 mL/mg and 0.34 mL/mg for 10% and 100% wastewater
concentrations respectively. This may have been due to experimental error, since the
results obtained for the second run using raw effluent as well as the run using pre-treated
effluent, showed that for every milligram COD reduced, 0.395 mL methane was produced.
4.4.5 Results of Fed-Batch Digestion
Figure 4.32: Comparison of gas produced and pH during fed-batch digestion
6.4
6.6
6.8
7
7.2
7.4
7.6
7.8
8
1 11 21 31 41 51 61 71 Time (days)
pH
0
50
100
150
200
250
300
Gas
pro
du
ced
(mL
)
pHGas Produced
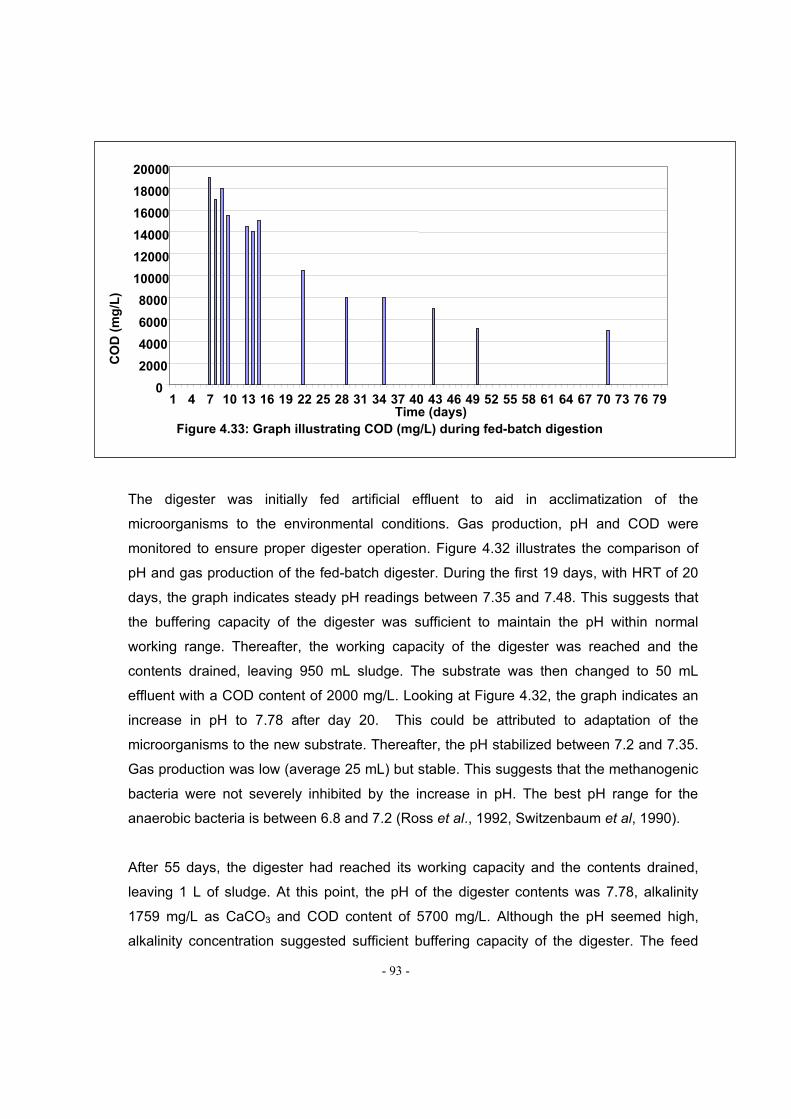
- 93 -
The digester was initially fed artificial effluent to aid in acclimatization of the
microorganisms to the environmental conditions. Gas production, pH and COD were
monitored to ensure proper digester operation. Figure 4.32 illustrates the comparison of
pH and gas production of the fed-batch digester. During the first 19 days, with HRT of 20
days, the graph indicates steady pH readings between 7.35 and 7.48. This suggests that
the buffering capacity of the digester was sufficient to maintain the pH within normal
working range. Thereafter, the working capacity of the digester was reached and the
contents drained, leaving 950 mL sludge. The substrate was then changed to 50 mL
effluent with a COD content of 2000 mg/L. Looking at Figure 4.32, the graph indicates an
increase in pH to 7.78 after day 20. This could be attributed to adaptation of the
microorganisms to the new substrate. Thereafter, the pH stabilized between 7.2 and 7.35.
Gas production was low (average 25 mL) but stable. This suggests that the methanogenic
bacteria were not severely inhibited by the increase in pH. The best pH range for the
anaerobic bacteria is between 6.8 and 7.2 (Ross et al., 1992, Switzenbaum et al, 1990).
After 55 days, the digester had reached its working capacity and the contents drained,
leaving 1 L of sludge. At this point, the pH of the digester contents was 7.78, alkalinity
1759 mg/L as CaCO3 and COD content of 5700 mg/L. Although the pH seemed high,
alkalinity concentration suggested sufficient buffering capacity of the digester. The feed
Figure 4.33: Graph illustrating COD (mg/L) during fed-batch digestion
0
2000
4000
6000
8000
10000
12000
14000
16000
18000
20000
1 4 7 10 13 16 19 22 25 28 31 34 37 40 43 46 49 52 55 58 61 64 67 70 73 76 79Time (days)
CO
D (
mg
/L)

- 94 -
rate was then increased to 100 mL/d, consisting 90% effluent and 10% artificial effluent.
An increase in pH was observed, initially, but stabilized between 7.3 and 7.4. Gas
production averaged at about 45 mL per day. The increase in gas production with feed
rate of 100 mL per day in comparison with a feed rate of 50mL per day suggests that the
increased feed volume increased the readily degradable organics which resulted in an
increase in gas production.
After day 88, the digester contents were drained, again leaving 1 L of anaerobic sludge.
The feed rate was continued at 100 mL per day. The pH remained stable, between 7.25
and 7.30. Gas production increased to an average of 62 mL per day (not shown on graph).
This indicates that the microorganisms had acclimatized to the effluent at a feed rate of
100 mL per day. After day 98 days, the reactor was drained, leaving 1 L of anaerobic
sludge. The feed rate was increased to 150 mL per day. The pH was stable, between 7.25
and 7.3 and gas production increased to an average of 95 mL per day (not shown on
graph).
It is clear that with an increase in feed volume, there is an increase in gas production.
Therefore, the increasing feed volumes did not cause an organic overload. An organic
overload causes increased acid production, with a decrease in pH and little or no gas
production.
Figure 4.33 illustrates the COD profile of the digester, which indicates a gradual decrease
in total COD of the digester contents. This suggests that the microorganisms were capable
of degrading the available organic material present in the wastewater.
Results show that anaerobic fed-batch digestion is a promising method of treatment of
edible oil effluent.
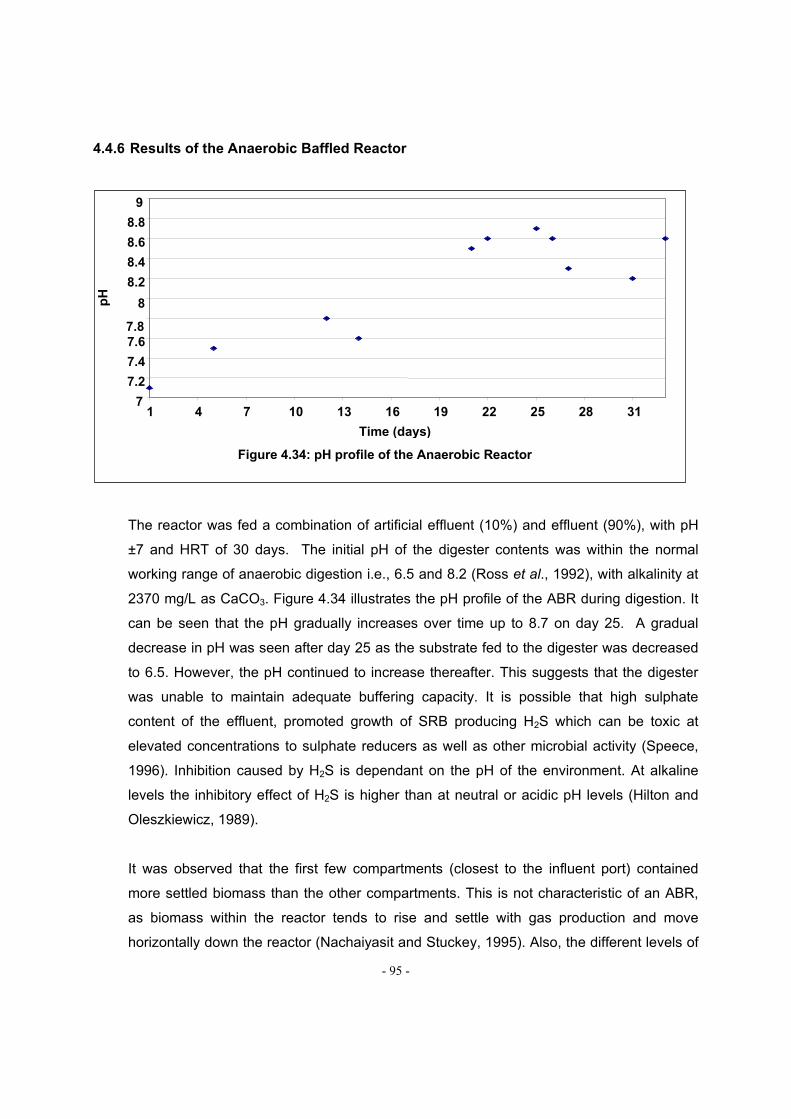
- 95 -
4.4.6 Results of the Anaerobic Baffled Reactor
The reactor was fed a combination of artificial effluent (10%) and effluent (90%), with pH
±7 and HRT of 30 days. The initial pH of the digester contents was within the normal
working range of anaerobic digestion i.e., 6.5 and 8.2 (Ross et al., 1992), with alkalinity at
2370 mg/L as CaCO3. Figure 4.34 illustrates the pH profile of the ABR during digestion. It
can be seen that the pH gradually increases over time up to 8.7 on day 25. A gradual
decrease in pH was seen after day 25 as the substrate fed to the digester was decreased
to 6.5. However, the pH continued to increase thereafter. This suggests that the digester
was unable to maintain adequate buffering capacity. It is possible that high sulphate
content of the effluent, promoted growth of SRB producing H2S which can be toxic at
elevated concentrations to sulphate reducers as well as other microbial activity (Speece,
1996). Inhibition caused by H2S is dependant on the pH of the environment. At alkaline
levels the inhibitory effect of H2S is higher than at neutral or acidic pH levels (Hilton and
Oleszkiewicz, 1989).
It was observed that the first few compartments (closest to the influent port) contained
more settled biomass than the other compartments. This is not characteristic of an ABR,
as biomass within the reactor tends to rise and settle with gas production and move
horizontally down the reactor (Nachaiyasit and Stuckey, 1995). Also, the different levels of
Figure 4.34: pH profile of the Anaerobic Reactor
7
7.2
7.4
7.6 7.8
8
8.2
8.4
8.6
8.8
9
1 4 7 10 13 16 19 22 25 28 31
Time (days)
pH

- 96 -
liquid were observed in various compartments. It is possible that the fats and oils
contained in the substrate formed a lipid barrier, disrupting normal circulation of the liquid.
After day 33, a decline was observed in pH of the digester (not shown in graph), with no
gas production. The experiment was terminated, since no gas production indicated that
the methanogenic bacteria were no longer active. It was therefore concluded that the ABR
is not suitable for treatment of this type effluent.
4.5 CONCLUSIONS
From this investigation of anaerobic digestion of vegetable oil effluent, the following can
be concluded,
- Gravitational separation of lipids is not a recommended method for reducing the lipid
content of effluent due to the long settling time required. Settling times below 24 hr
showed no significant difference in lipid content.
- The use of barium chloride is an effective method to reduce content in the effluent
- Effluent contains approximately 30% biodegradable fraction that under anaerobic
conditions has the potential to produce 0.395 mL of CH4 mg COD mineralized.
- Anaerobic toxicity of edible oil effluent indicates that the effluent is not harmful to the
existing anaerobic process if added at a COD concentration of 2000 mg/L.
- Anaerobic digestion using fed-batch digestion configuration can achieve only 30%
biodegradation of COD present in edible oil effluent.
- Experiments show that the ABR configuration is unsuitable for anaerobic digestion
of edible oil effluent.

- 97 -
CHAPTER 5
PRETREATMENT METHODS TO ENHANCE SECONDARY BIOLOGICAL
TREATMENT OF THE EDIBLE OIL EFFLUENT
5.1 INTRODUCTION
The effluent, when collected from Company X, was milky white in colour with a red-orange
layer on the surface – indicating the presence of oil. The pH of the effluent was either
very acidic, resulting in a strong odour that was an irritant to the nasal passages and the
eyes, or the effluent was alkaline. The alkaline nature of the effluent was due to the
presence of caustic soda, which results in extensive foaming.
Raw effluent cannot be directly added into the system, as the high COD and FOG
concentrations would result in shock loadings and the death of the bacteria. To avoid this,
the effluent was often pretreated, to lower both the COD and FOG concentrations, prior to
biological treatment, by coagulation and flocculation. In the case of the effluent from
Company X, the addition of a chemical coagulant, called C40 (Chemserve Trio, SA),
together with mechanical stirring causes the FOG’s, present in the effluent, to
agglomerate or flocculate. These oil particles then settle and it was the clear supernatant
above the settled flocs that was more suitable for introduction into an activated sludge
unit.
Pretreatment may be defined as, the process or processes that prepares wastewater to a
condition where it can be further treated in a conventional secondary biological process
(Kiely, 1997). The present method of pretreatment involves the coagulation and
flocculation of the edible oil effluent with chemical flocculent Compound C40.
5.1.1 Alternate Pre-Treatment Methods Used in This Study
Alternate pretreatment methods used in this study included the use of various coagulants
with DAF, Ozonation, Peroxone and Ultrasonication.

- 98 -
5.2 AIMS AND OBJECTIVES
The aim of this study was to evaluate different pretreatment technologies to produce an
effluent with optimum environmental discharge requirements. The objectives are as
follows:
1. Evaluation of the most efficient coagulant at optimum concentration
2. To determine the efficiency of coagulation followed by DAF
3. To evaluate the efficiency of ozonation, peroxone and ultrasonication
5.3 MATERIALS AND METHODS
5.3.1 Coagulation & Flocculation Using the Standard Jar Test (Coagulation Test) (Pryor &
Freese, 1998)
An 800 mL sample of the C40-coagulated effluent was taken and poised at the discrete
pH values of 5.5, 7.5 or 9.5 by the addition of either sulphuric acid or sodium hydroxide.
Following this the sample was placed on a magnetic stirrer and stirred at 300 rpm while
the different coagulants were added at concentrations of 5, 10, 15, 20, 25 and 30 ppm
(parts per million). The following coagulants were used: Aluminum sulphate (alum), ferric
chloride and various commercially available, polymeric coagulants: DMDAAC/PAC -
Z553D, DMDAAC/PAC - LP526, PA/PAC – 735 and PA – U5000. Preparation of
coagulants can be seen in Appendix 14.
Following the addition of the coagulant the stirring speed was reduced to 40 rpm for 15
min, after which, the sample was transferred to the DAF unit where it was allowed to settle
for an additional 15 min. After settling, a sample was taken from the supernatant above
the settled flocs, for COD analysis (see Appendix 3a).
5.3.2 Dissolved Air Floatation Subsequent To Coagulation & Flocculation
The pressure cylinder was filled with water up to the halfway mark and the inlet valve on
the pressure cylinder opened to allow compressed synthetic air to enter to a final pressure
of 400 kPa (4 Bar). The pressure cylinder was then shaken vigorously to allow an even
distribution of air throughout the water. Following this, the outlet valve on the pressure
cylinder was opened, allowing tiny air bubbles to enter the DAF unit containing the settled,

- 99 -
800 mL coagulated and flocculated effluent sample. The outlet valve was closed when the
level of liquid in the DAF unit reached 1000 mL.
The sample in the DAF unit was allowed to stand for approximately 5 min to allow the
bubble-floc agglomerates to rise to the surface of the sample and, thus, to form the float. A
sample for subsequent COD and FOG analyses was taken from the liquid below the float.
Each of the six coagulants prepared were used to treat the C40-coagulated effluent by
additional coagulation and flocculation followed by DAF at each of the concentrations from
5 ppm to 30 ppm at the poised pH values of 5.5, 7.5 and 9.5, respectively.
In order to determine the total amount of organics removed (total COD reduction) after
coagulation and flocculation and DAF, the following calculations were done using the
COD values
The average COD values for coagulation & flocculation were subtracted from the original
COD values of the C40-coagulated effluent. The values obtained give an indication of the
amount of organics removed after coagulation & flocculation.
1. The average COD values for DAF were subtracted from the average COD values for
coagulation and flocculation. The values obtained give an indication of the amount
of organics removed after DAF.
2. The values obtained in 1 and 2 were then added to obtain the total COD reduction
after coagulation & flocculation and DAF.
5.3.3 Comparison of the Alternative Pretreatment Method to the Current Method
Pretreatment of the Raw Effluent Using Both Pretreatment Methods
From a batch of raw effluent, 800 mL was decanted into a 1000 mL conical flask. This
sample was pretreated using the coagulation and flocculation and DAF combination,
which showed the greatest COD removal under optimum operating conditions.
- 100 -
From the same batch of raw effluent, 800 mL was decanted into a 1000 mL beaker. This
sample was pretreated using the current pretreatment method of coagulation &
flocculation with C40 only.
5.3.4 Ozonation
The ozone generator (Ozonox) was attached to a pump to ensure a steady supply of air,
which in turn, allowed for a steady supply of generated ozone to be introduced into the
sample. Gas exiting the sample was allowed to bubble through two potassium iodide (20
g of KI crystals in 5 L) traps, connected in series.
5.3.4.1 Preparation of a Calibration Curve
A standard sodium thiosulphate solution (Na2S2O3.5H2O) was prepared according to the
Iodometric Method I (See Appendix 15). This standard solution, 25 g of sodium
thiosulphate was added to 1 L of freshly boiled distilled water, was used to determine the
amount of ozone produced by the ozone generator over a specific time period. The
sample bottles and traps were filled with 400 ml and 800 ml of KI solution respectively.
Following this the sample was ozonated for 1 min, inducing a colour change form clear to
yellow. The ozonated sample was titrated against the Na2S2O3.5H2O until the end point
was reached where the sample turned from a yellow colour to clear. The amount of
Na2S2O3.5H2O used to induce the end point was recorded. Similar experiments were done
at increased time intervals from 2 - 10 min. The concentrations of ozone produced were
calculated and plotted on a calibration curve (See Appendix 15).
5.3.4.2 Ozonation Procedure (Pryor & Freese, 1998)
The pH of 800 ml of flocculated sample was adjusted using either sodium hydroxide or
sulphuric acid. Following this the sample bottle was connected to the KI filled bottles
acting as gas traps. The sample was ozonated for 3 min, thereafter; residual ozone was
calculated using the Indigo Colorimetric Method (See Appendix 16). From this the total
amount of ozone produced as well as concentrations used by the sample can be
calculated. Similar sets of experiments were made at discrete pH values of 7, 9 and 11.
- 101 -
5.3.5 Peroxone Procedure
The pH of 660 ml of flocculated samples was poised at pH 7, 9 and 11 by using either
NaOH or H2SO4. To these samples 140 ml of 50% hydrogen peroxide (H2O2) was added
to produce a final sample concentration of 10%. The samples were, subsequently,
ozonated for 3 min and the residual ozone and total ozone consumed were calculated.
The results were evaluated using TLC with the original effluent sample serving as a
control. See Appendix 17 for TLC determination.
5.3.6 The Effectiveness Of Ultrasonics As A Pretreatment Method Of An Edible Oil
Effluent
40 ml of the C40 flocculated sample was placed in a plastic centrifuge tube which was
then placed in a beaker of ice and sonnicated by the use of a Virtis Virsonic 100 (50 Hz).
The procedure was carried out for 10 min on different samples using output wattages of
either10, 15, 20 and 25 W, respectively (See Appendix 18)
For the experiments using a sonnicator bath, UMC5 (220 V, 50 Hz) the samples (100 ml)
were sonnicated for 15 min. As in the previous experiments, TLC was used to evaluate the
results while the original sample was used as a control.
5.3.7 Evaluation of the Effectiveness of the Pretreatment Methods
5.3.7.1 TLC
Procedure
The water insoluble fractions from the experimental samples (40 ml) were extracted using
hexane (10 ml) in a separation funnel and spotted, using Micro haematocrit tubes, on silica
gel that was coated on aluminium plate (Merck, 60E254). The sample was run using a
mobile phase of 20% ethyl acetate in hexane. The mobile phase was allowed to run until it
was approximately 1 cm away from the top edge of the plate and then the process was
then stopped and the solvent front marked. After completion, the plate was viewed under a
CAMAG Universal UV lamp (wavelength of 252 nm) and the Rf and HRf values were
calculated and intensities were recorded.

- 102 -
In all experiments the relative effectiveness of the treatment method was determined by
comparing the results of a control sample to the treated sample using analytical methods
such as, TLC (Appendix 17), FOG (Appendix 10) and COD analysis (Appendix 3a).
5.4 RESULTS AND DISCUSSION
5.4.1 Optimum Conditions for Enhanced Coagulation and Flocculation
Alum, FeCl3 and four polymeric coagulants were used to further treat the C40-coagulated
effluent by additional coagulation, flocculation and DAF, at discrete concentrations from 5
to 30 ppm and at different pH values of 5.5, 7.5 and 9.5. The effectiveness of the
additional treatment procedure was tested by comparing the COD for the original C40-
coagulated effluent samples with the samples following additional coagulation and
flocculation. Likewise, the effectiveness of the DAF procedure was tested by determining
COD and FOG concentrations of the samples following coagulation, flocculation and DAF
At the concentrations of 5, 10, 20 and 30 ppm, and at a pH of 5.5, FeCl3 had the highest
total COD reduction in comparison with the other coagulants. Therefore, at these
concentrations and pH values, FeCl3 functions the best in removing organics from the
effluent. Further, the highest overall total COD reduction was found to be at a FeCl3
concentration of 10 ppm. The initial COD concentration was 1455 mg/L at 10 ppm and
after coagulation and DAF the effluent COD was 1030 mg/L. (Graph not shown)
Similar results were recorded at the concentrations of 5, 10, 15 and 20 ppm, and at a pH
of 7.5, FeCl3 again performed the best in removing organics from the effluent compared
with the other coagulants. At this pH value FeCl3 had the highest overall total COD
reduction at a concentration of 20 ppm. The initial COD concentration was 1445 mg/L and
following coagulation and DAF the effluent was 970 mg/L. (Graph not shown)
At pH values of 9.5 and at concentrations of 5 and 25 ppm, coagulant C performed
optimally while at concentrations of 10 and 15 ppm, coagulant A performed the best. At
concentrations of 20 and 30 ppm, on the other hand, FeCl3 showed the greatest COD
removal. The initial concentration at 20 ppm was 1150 mg/L and following pretreatment
the effluent was 870 mg/L. At 30 ppm the initial COD was 1065 mg/L and following

- 103 -
pretreatment the effluent was 662 mg/L. The best coagulant to use, at pH 9.5, cannot
clearly be identified. However, it must be noted that the overall effectiveness of ferric
chloride, in the removal of organics from the effluent, has decreased at pH 9.5 as
compared with the pH levels of 5.5 and 7.5 (Graph not shown).
At both pH 5.5 and pH 7.5, FeCl3 recorded the highest COD removal rates although the
overall greatest removal was recorded at the more acidic pH of 5.5 with decreased
effectiveness noted as the pH increased. A possible reason for the decreasing
effectiveness of FeCl3 as pH increases may be due to the inorganic structure of FeCl3 that
is altered with pH increase. Alteration of the structure of FeCl3 results in the prevention of
this coagulant from binding to organics in the industrial edible oil effluent. Subsequently,
few or no flocs are formed and the organics are not removed from the effluent by settling.
The total efficiency and effectiveness of the DAF process is, likewise affected. Pryor and
Freese (1998) observed a similar effect, in that inorganic coagulants such as FeCl3 and
alum were generally more effective during coagulation and flocculation than polymeric
coagulants at lower pH values. It can, therefore, be concluded that as an alternative
pretreatment method, FeCl3 at a concentration of 10 ppm and at a poised pH of 5.5 should
remove the greatest amount of organic compounds from the effluent.
5.4.2 The most Effective Pretreatment Method for the Industrial Edible Oil Effluent
Two samples of the raw industrial effluent were pretreated. The one sample was
pretreated using the currently used method of coagulation & flocculation using C40 while
the other sample was pretreated using FeCl3 at optimum operating conditions. The raw
effluent acted as the control, and the results obtained are detailed below (Table 5.1).
Table 5.1 Results for COD
Sample COD Values (mg/L) Average COD Values (mg/L) Raw effluent sample 3940 3850 3895 Sample pretreated using C40 1040 1100 1070 Sample pretreated using FeCl3 2880 2880 2880
From the three samples, the raw effluent clearly had the highest COD value of 3895 mg/L
while the two pretreated samples showed reduced COD values. However, of the two, the
C40 pretreated sample recorded the lowest (1070 mg/L) COD value and, thus, the
greatest organics removal capabilities. Similarly, the amount of FOG’s, in the raw effluent

- 104 -
sample and samples pretreated with C40 and FeCl3 were determined. Like the COD
removal rates the greatest FOG removal efficiencies were recorded with the C40
pretreated sample, again, indicating the effectiveness of this pretreatment method (Table
5.2)
Table 5.2 FOG Concentrations
Sample Total Amount of FOG’s (mg/L) Raw effluent sample 2432 Sample pretreated using C40 164 Sample pretreated using FeCl3 570
This, overall, greater removal of organic compounds from the effluent using C40 was also
recorded in the TLC plates run with these samples. The TLC plates indicated that C40 was
able to remove some of the organic compounds that were not removed by any of the other
coagulants tried during this study. This was indicated by fewer spots when compared with
the other samples, as well as lower colour intensity.
5.4.3 Subjecting the Effluent to Specific Treatments at pH 7
During this phase of the study the pretreatment methods of ozonation and ultrasonication
were investigated. The samples, and a raw effluent sample as control, were subjected to
the respective treatments, at specific pH values, and the organic removal efficiency
determined by TLC. The results following the respective pretreatments at a pH of 7 are
detailed below (Table 5.3)
Table 5.3 The TLC Data of the Effluent Sample Treated at pH7.
SAMPLE COMPOUND
A B C D
ORIGINAL Rf VALUE 0.39 0.45 0.64 0.68 HRf VALUE 39% 45% 64% 68% INTENSITY 6 5 10 2
pH 7 Rf VALUE 0.39 0.45 0.62 0.66
HRf VALUE 39% 45% 62% 66% INTENSITY 3 2 8 2
OZONATION Rf VALUE 0.45 0.58 0.7 0.75 HRf VALUE 45% 58% 70% 75% INTENSITY 4 3 5 1
PEROXONE Rf VALUE 0.42 0.51 0.66 0.72
HRf VALUE 42% 51% 66% 72% INTENSITY 4 2 7 1
Ozonation: Residual Ozone: 9.570 x 10⁻³ mgO3/L Total Ozone consumed: 2.4384 mgO3/L
Peroxone: Residual Ozone: 9.159 x 10⁻³ mgO3/L Total Ozone consumed: 2.3564 mgO3/L

- 105 -
By comparing the results for any of the pH values, it can be seen that there was no
significant change between the Rf values of the compounds in the sample when it was
subjected to the ozonation and the peroxone procedures. Intensities showed very little
reduction, indicating that some of the substance had been removed, although, the
reduction appears to be insignificant.
A similar set of experiments were made at a pH of 9, which indicated that (results not
shown) the ozonation procedure resulted in no change in the Rf values and intensities
when compared to the original sample. The sample, subjected to the peroxone process,
showed a decrease in the intensities indicating that, although insignificant, a small amount
of compound had been converted to other compounds.
At a pH of 11 (results not shown) there was no significant differences between the different
samples. However, there were changes in the colour of the sample subsequent to
treatment. The effluent turned more yellow after ozonation and following peroxone, the
sample lost its yellow haze and became colourless.
Additional tests were made to determine the relative effectiveness of the ozone
pretreatment method compared with currently used coagulation with C40. Following the
tests the samples were analysed by TLC and the results are given below (Table 5.4).
From these results it can be seen that the Rf values and intensities of the compounds did
not show any significant change. Also, from the results shown it can be seen that the
chemical coagulant, C40, removes compound C that is present in the raw effluent while
ozonation does not. This shows that coagulation with C40 is a more effective
pretreatment method of the oil effluent than ozonation

- 106 -
Table 5.4: The TLC Data of the Samples Treated by Ozonation and Coagulation.
SAMPLE COMPOUND
A B C E ORIGINAL Rf VALUE 0.49 0.58 0.64 0.73 0.8
HRf VALUE 49% 58% 64% 73% 80% INTENSITY 4 6.5 6.5 10 5
COAGULATION C40 Rf VALUE 0.49 0.6 - 0.76 0.82 HRf VALUE 49% 60% - 76% 82% INTENSITY 4 4 - 7 2
OZONATION Rf VALUE 0.49 0.6 0.67 0.76 0.82 HRf VALUE 49% 60% 67% 76% 82% INTENSITY 4 6 6 9 1
Following the treatment of the samples the results were, also, evaluated using infra red
(IR) techniques although the results are not shown From the IR spectra achieved it was
seen that the sample contains low concentrations of alkanes and alkenes. This can be
seen by the absorbance of these compounds at a specific wavelength. Alkenes absorb
infra red at 2000 – 1500 cm-1 (Faust, 1995). There was little absorbance at this
wavelength. Alcohol functional groups and aromatics also appeared to be in small
quantities. No carbonyl groups could be detected. Further, there appeared to be no
significant difference between the spectra achieved from the treated and untreated
effluent. This showed that what complex molecules present in the effluent is not broken
down into simpler and more biodegradable ones. This indicated that ozonation is an
unsuitable method of pretreatment of the oil effluent.
The test indicated that there is very little FOG present in the original flocculated sample, as
C40 removes most of these substances. Coagulation is therefore is the best method of
pretreatment as compared to the FeCl3 coagulant.
5.4.4 Effluent Pretreatment by Sonnication
Although the complete experiment included running samples at various watts (10, 15, 20
and 25 W) only the results of the 10 W experiments is shown (Table 5.5) due to the
conclusions reached being very similar despite the increased output. After subjecting the
effluent sample to ultrasonic treatment, it can be seen that the Rf values were relatively
similar and that there was no decrease in intensities for each compound. It therefore
appears as if ultrasonics was not effective in pretreating the edible oil effluent.

- 107 -
Table 5.5 The TLC Data of the Effluent Sample Sonnicated Using an Output of 10 W.
SAMPLE COMPOUND A B C D
ORIGINAL Rf VALUE 0.42 0.53 0.67 0.73 HRf VALUE 42% 53% 67% 73%
INTENSITY 9 7 10 4 SAMPLE (10W) Rf VALUE 0.42 0.52 0.67 0.73
HRf VALUE 42% 52% 67% 73%
INTENSITY 9 6 10 4
5.4.4.1 The results achieved by sonnicating using a sonnicator bath
After subjecting the effluent sample to ultrasonic treatment, it can be seen that the Rf
values were relatively similar and that there was no decrease in intensities for each
compound. It, therefore appears as if ultrasonics, using the more powerful sonication
bath, was not effective in pretreating the edible oil effluent (Table 5.6)
Table 5.6 The TLC Data of the Effluent Sample Sonnicated Using a Sonnicator Bath.
SAMPLE
COMPOUND
A C D E ORIGINAL Rf VALUE 0.39 0.48 0.52 0.63 0.69
HRf VALUE 39% 48% 52% 63% 69% INTENSITY 9 8 3 1 0 7
SONNICATION Rf VALUE 0.39 0.48 0.56 0.67 0.72
HRf VALUE 39% 48% 56% 67% 72% INTENSITY 9 8 3 10 7
5.5 DISCUSSION
All the results, viewed collectively, seem to indicate that the techniques of ozonation,
peroxone and ultrasonics are ineffective methods for the pretreatment of an edible oil
effluent.
The lack of effectiveness of ozonation can be due to the low presence of alkenes in the
effluent, which was shown by the IR scan (Graph not shown). It has been shown that
ozonation performs optimally in the presence of unsaturated bonds (Kloos, 2000).
Therefore, with these present in low concentrations, optimum ozonation proved
unsuccessful.

- 108 -
Hydrogen peroxide also proved incapable of accelerating the ozonation procedure. Part of
this relative inefficiency of peroxone could be due to the time of peroxide addition. During
the present investigation peroxide was added prior to ozonation, which occurs in two
stages. If peroxide is added prior to the first stage, as was the case, the hydroxyl radical
competes with the ozone-reactive molecule for the ozone (Arce Systems, 2000). This
could slow the process and, subsequently, hinder the peroxone process. However, the
colour change of the sample at pH 11 shows that peroxone is efficient in removing colour.
Peroxone may prove effective if the peroxide is added after the first stage although this
can only be done using specialised pumps.
As recorded for the other methods, ultrasonics, likewise, proved non-effective. The
ultrasonics did not appear able to break the strong bonds of the complex molecules found
in the edible oil effluent. One reason for this could be due to the low frequency of the
instrument used. Ultrasonics may prove effective if attempted at a higher frequency.
5.6 CONCLUSION
The effectiveness of the FeCl3, alum and the polymeric coagulants proved to be poor as
compared to the commercial coagulant C40. The pretreatment methods of ozonation,
peroxone and ultrasonics are ineffective methods of pretreatment of an edible oil effluent.
Hence from all of the results obtained it can therefore be concluded that the alternative
pretreatment methods were not as effective as the current pretreatment method. Thus,
the method of chemical coagulation and flocculation with C40 appears to be the most
effective pretreatment for the edible oil effluent investigated in this case study.
- 109 -
CHAPTER 6
LABORATORY SCALE AEROBIC BIOLOGICAL TREATMENT PROCESS
6.1 INTRODUCTION
Current method of effluent treatment in the in this case study was restricted to either
physical separation of oil and grease via a gravity fat trap or dissolved air floatation and
subsequently pH correction before discharge. Even after application of these physico-
chemical techniques, the remaining emulsified grease tends to clog sewer pipes and
pumps and often does not subscribe to municipal discharge standards (Eroglu et al.,
1990; Mkhize et al., 2000; Mkhize and Bux, 2001).
Globally, trends are currently focusing on applying biological processes for treatment and
final polishing of the effluent. Eroglu et al. (1990) conducted research on the comparative
evaluation of treatment alternatives for wastewater’s from an edible oil refining industry.
Results showed that activated sludge proved successful in removing most of the fats, oils
and greases.
6.2 AIMS AND OBJECTIVES
Therefore, the emphasis of this aspect of the research focused on developing and
optimizing biological treatment process i.e. activated sludge in order to successfully treat
sunflower oil effluent. The objectives included:
- Wastewater characterization and large-scale pretreatment of the oil effluent
- Development of laboratory scale activated sludge process
- Operation of the activated sludge process
- Optimization of the process for maximum COD removal
The investigation subscribed to using effluent from a single factory (Company X), since
previous research (Orhon et al., 1999) has shown that developing remediation technology
in the edible oil waste sector has to be subjected to a case by case approach. In addition,
the effluent used was from the refinery process, since it comprised of a major portion of
the final effluent.

- 110 -
6.3 MATERIALS AND METHODS
6.3.1 Laboratory scale pretreatment process
6.3.1.1 Collection of effluent
Composite effluent samples were collected from the drain at the end of the refinery
process. The volume collected comprised of 22 x 25 L containers, giving a total volume of
550 L. The company was situated approximately 90 km north west of Durban. The
samples were transported immediately to the laboratory for processing which included a
battery of chemical test to characterize the influent. The balance of the samples was
stored in the cold room at 4oC to prevent further biological activity. It should be noted that
collection of sample was ultimately dependent on the regular operation of the refinery
process. However, during the course of this investigation, the problems that hampered
regular supply of effluent were as follows:
• Regular interruptions in the refinery process due to problems in obtaining crude oil
• Alternating between refining soya, cotton seed and sunflower oil without prior
notification which was problematic since the investigation was limited to effluent of
the sunflower oil refinery process.
• An explosion at the company had disrupted the refinery process for 3 months.
The above hurdles are quite common when investigating industrial problems as the
industries rarely place priority on research needs of the project, and therefore progress is
subjected to conditions at the industry. The effluent collection period spanned during the
entire period of the laboratory trials i.e. May 2000 until October 2001.
6.3.1.2 Wastewater characteristics determined
On receipt of the effluent, samples were immediately obtained and the following chemical
analysis was conducted:
COD: The COD of the effluent after pretreatment was still high and therefore was diluted
with distilled water in order to satisfy the objectives of the research i.e. subjecting the
treatment process to incremental increase in COD from 500 mg/L to 1800 mg/L (at full

- 111 -
strength after pretreatment i.e. undiluted). A colorimetric method was used using the
Merck SQ 118 Photometer (Method No. 14690) (Appendix 3a)
FOG: Since the effluent was comprised primarily of fats and oils, it was essential to
determine the FOG and manipulate it i.e. pre-treat and reduce content in order to prevent
organic shock load of the system. The procedure involved applying Standard Methods
(1989) (Appendix 10).
Nutrients: Due to changes in the refinery process, nitrogen and phosphorus became
limiting in the effluent during the early stages of the treatment process. Therefore, the
TKN and TP of the effluent were determined. In order to maintain the integrity of the
biological system, nitrogen and phosphorus was added to the effluent at a C: N: P ratio of
100: 10: 1. These salts, ammonium chloride (NH4Cl) for N and Potassium dihydrogen
phosphate (KH2PO4) for phosphorus was added directly to the feed tank after the
flocculation procedure.
• Total phosphate (TP): The method involved using the Merck SQ 118 photometer
(Method No. 14842) (Appendix 4).
• Total Kjeldahl nitrogen (TKN): The TKN is indicative of the total nitrogen content of
the wastewater. The Spectroquant analysis method 14537 was employed using the
Merck photometer (SQ 118) (Appendix 5).
pH: The pH of the effluent was corrected to pH + 7 prior to biological treatment by the
addition of acid in the feed tank. The volume of acid added to neutrality was ultimately
dependent on the pH of the batch of effluent collected.
6.3.1.3 Large scale pretreatment procedure
The effluent was processed immediately on receipt. The batch was separated into 2x 275
L batches. One batch was stored at 4oC for future use. A volume of 275 L was dispensed
into a 300 L vessel in order to facilitate the flocculation and coagulation process at room
temperature (20oC). The initial pH of the effluent was acidic but on addition of the
flocculent, the pH became basic (approximately pH 9). The pH was further adjusted to pH
7 by the addition of sulphuric acid. The flocculent (C40) was added to the reactor with
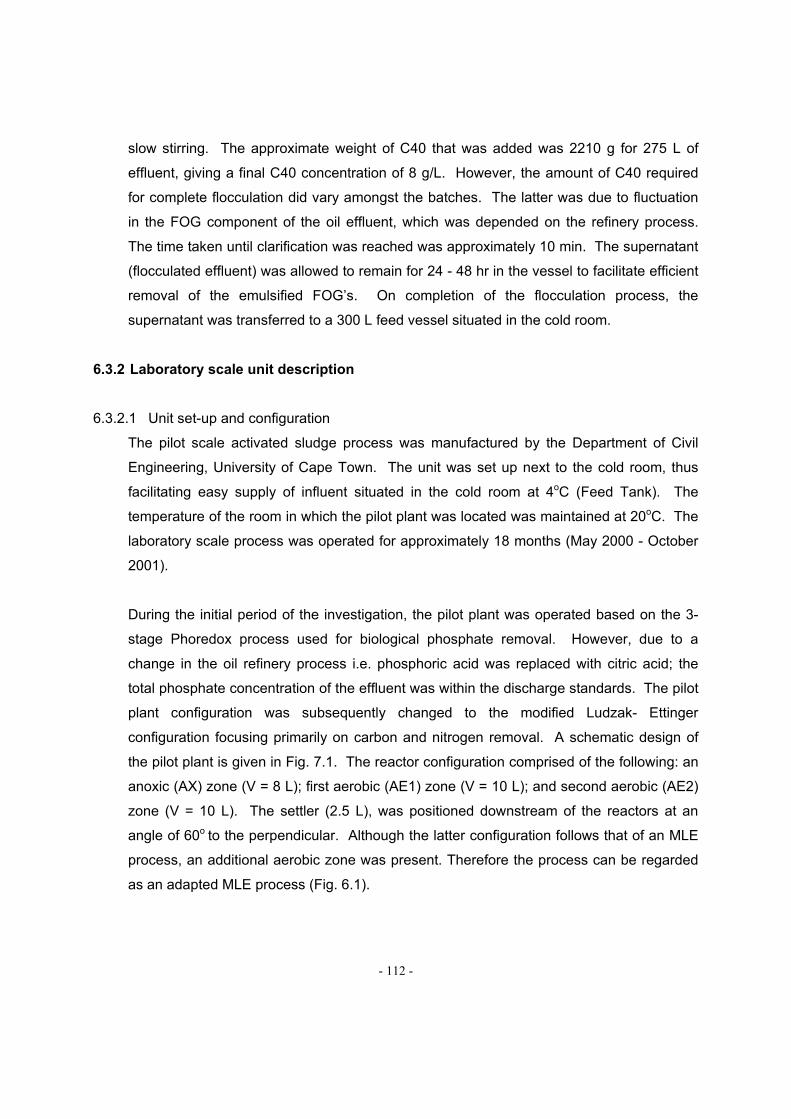
- 112 -
slow stirring. The approximate weight of C40 that was added was 2210 g for 275 L of
effluent, giving a final C40 concentration of 8 g/L. However, the amount of C40 required
for complete flocculation did vary amongst the batches. The latter was due to fluctuation
in the FOG component of the oil effluent, which was depended on the refinery process.
The time taken until clarification was reached was approximately 10 min. The supernatant
(flocculated effluent) was allowed to remain for 24 - 48 hr in the vessel to facilitate efficient
removal of the emulsified FOG’s. On completion of the flocculation process, the
supernatant was transferred to a 300 L feed vessel situated in the cold room.
6.3.2 Laboratory scale unit description
6.3.2.1 Unit set-up and configuration
The pilot scale activated sludge process was manufactured by the Department of Civil
Engineering, University of Cape Town. The unit was set up next to the cold room, thus
facilitating easy supply of influent situated in the cold room at 4oC (Feed Tank). The
temperature of the room in which the pilot plant was located was maintained at 20oC. The
laboratory scale process was operated for approximately 18 months (May 2000 - October
2001).
During the initial period of the investigation, the pilot plant was operated based on the 3-
stage Phoredox process used for biological phosphate removal. However, due to a
change in the oil refinery process i.e. phosphoric acid was replaced with citric acid; the
total phosphate concentration of the effluent was within the discharge standards. The pilot
plant configuration was subsequently changed to the modified Ludzak- Ettinger
configuration focusing primarily on carbon and nitrogen removal. A schematic design of
the pilot plant is given in Fig. 7.1. The reactor configuration comprised of the following: an
anoxic (AX) zone (V = 8 L); first aerobic (AE1) zone (V = 10 L); and second aerobic (AE2)
zone (V = 10 L). The settler (2.5 L), was positioned downstream of the reactors at an
angle of 60o to the perpendicular. Although the latter configuration follows that of an MLE
process, an additional aerobic zone was present. Therefore the process can be regarded
as an adapted MLE process (Fig. 6.1).

- 113 -
3 0 0 L
4 Q
8 L
4 Q
1 0 L
4 Q
1 0 L
F E E D T A N KA N O X I C
R E A C T O R A E R O B I C 1 A E R O B I C 2 S E T T L I N GT A N K
E ff lu e n t1 Q 1 Q2 Q
A R E C Y C L E 3 4 m l /m in
S R E C Y C L E 1 7 m l /m in
2 Q
1 Q
Figure 6.1 Schematic representation of the laboratory scale unit modeled upon the modified
After the flocculation and coagulation process, the influent was transferred to the Perspex
feed tank (V = 300 L) which was located in the cold room (4oC) in order to limit any
biological activity prior to treatment. Target influent flow rate (Qi) was set at 17 mL/min
(24.48 L/d). The S-recycle is the flow that is pumped from the clarifier (settling tank) to the
AX reactor, with a set ratio of 1:1 with respect to Qi. The A-recycle, was pumped from
AE2 to the AX reactor at a set ratio of 2:1, with respect to Qi.
The system sludge age (Rs) was maintained at 16 days i.e., the unit volume capacity = 28
L; sludge wasted = 1. 75 L. However, the Rs did vary during the course of the
investigation. The calculation of sludge age is as follows:
Rs = V/Qi
where, V = total volume in the reactor and Qi = flow rate.
The oxygen utilization rate (OUR) was measured in AE2 using a dissolved oxygen (DO)
probe and meter. Air supply to the aerobic reactors (AE1 and AE2) was facilitated using
the OUR meter that controlled the aquarium pump, which was switched on at a DO
concentration of 2 mg/L and switched off when the DO concentration of the reactors
reached 5 mg/L. The meter was operated in OUR mode, which recorded the OUR over a
24 hr period.

- 114 -
6.3.3 Pilot plant operation
6.3.3.1 Acquisition of seed inoculum
Mixed liquor was obtained from the aeration tank of Darvill wastewater works situated in
the Pietermaritzburg region of KwaZulu- Natal. The reason for selecting the latter
wastewater works was that most of edible oil industries were localized in this region, and
their final effluents were discharged into Darvill. Therefore the sludge would have already
been exposed and acclimatized to edible oil effluents. The MLSS of the Darvill seed
sludge was approximately 3500 mg/L. The desired MLSS concentration of the system
was 2000 mg/L. Therefore, 16 L of Darvill mixed liquor was decanted into the pilot plant
and 12 L of water was added giving a total volume of 28 L. This rendered a final
suspended so concentration of 2 000 mg/L. The inoculum was fed diluted edible oil
effluent (COD + 300 mg/L) for a period of 2 weeks in order to further acclimatize the
microorganisms in the sludge to the edible oil effluent.
6.3.3.2 Basic approach to treatment process
The design, operation and optimization of a laboratory scale process to treat the edible oil
effluent was dependent on nature and regular supply of effluent and manipulating the
process to achieve maximum organic removal. This approach necessitated the
compartmentalization of the laboratory scale process into phases that had common
operating conditions during the course of the investigation. Other factors that supported
this approach included inherent problems with the laboratory scale process resulting in
system failure, varying nature and strength amongst effluent batches and disruption in
effluent supply. The laboratory scale treatment process was initiated on the 18 May 2000
and continued until October 2001. The period under investigation was divided into five
phases as explained in Table 6.1. (See Appendix 19).

- 115 -
6.4 RESULTS
6.4.1 Pilot plant process
6.4.1.1 Wastewater characterization
Some of the notable features of the characteristics measured are as follows:
1. The pH of the raw effluent is acidic on collection and upon flocculation it becomes
basic. The pH is corrected to neutral prior to being used as feed influent.
2. The raw wastewater has a high organic pollution load. However, approximately
74% is removed upon flocculation. The prepared influent was diluted in accordance
with the concentrations required for incremental COD increase during the course of
the investigation.
3. Large portion of the organic pollution load (COD) comprised of FOG. A large amount
of FOG’s was removed during flocculation (± 92%).
4. The wide ranges of the total phosphate results were due to high phosphate
concentration of the raw wastewater during Phase 1 and 2 and limiting phosphorus
conditions for the rest of the investigation. The above explanation also applies to
the TKN. Both nitrogen and phosphorus were limiting nutrients in the raw
wastewater and had to be supplemented in the prepared influent during Phase 3 - 5.
For the sake of creating a clearer understanding of the results, the duration of operation
the laboratory scale process and the results were divided into phases that encompassed
common operating conditions. For Phases 1, 2, and 3 the plant was operated as
Phoredox system. The first two phases experienced operational problems as new
procedures were tried out. By Phase 3, the nature of the effluent from the industrial plant
had changed; citric acid was now used in place of phosphoric acid in the refinery process.
This obviated the need for phosphorus removal, which had been poor up to that time. The
process was then changed (Phase 4) to an adapted Modified Ludzak Ettinger process,
with an added aerobic reactor, the focus now being on COD removal. Only the details of
the optimum fourth and fifth phases are in this report.
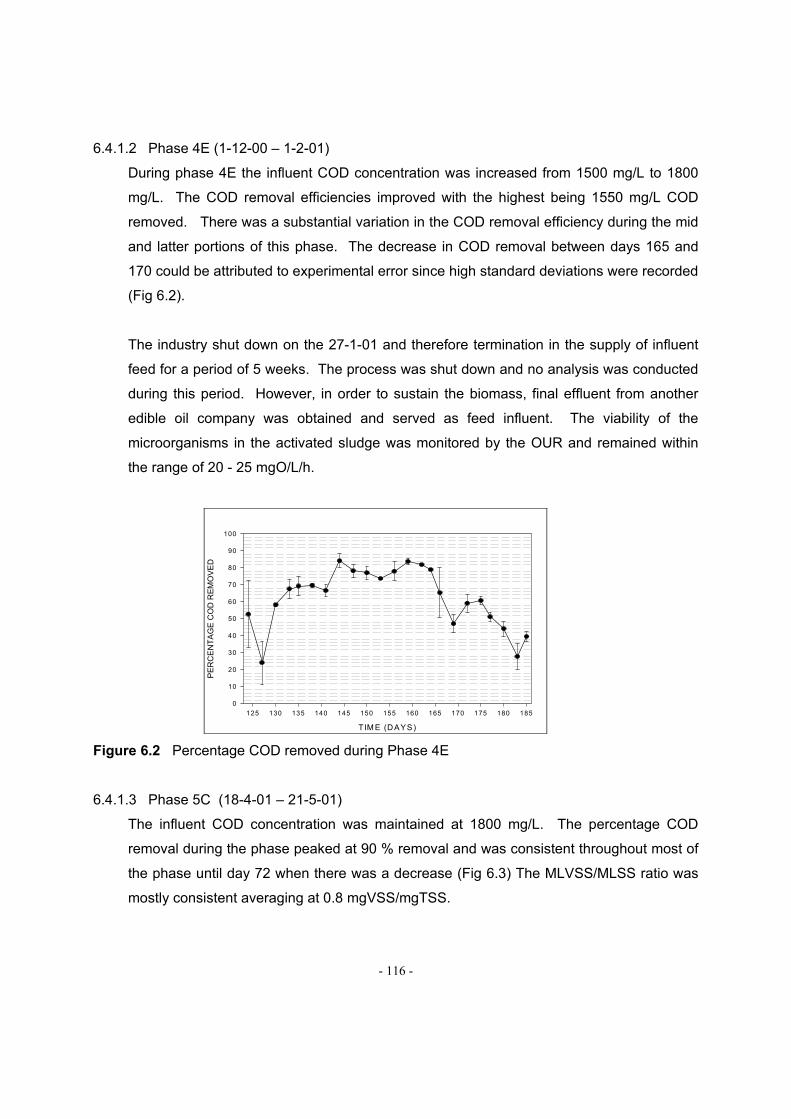
- 116 -
6.4.1.2 Phase 4E (1-12-00 – 1-2-01)
During phase 4E the influent COD concentration was increased from 1500 mg/L to 1800
mg/L. The COD removal efficiencies improved with the highest being 1550 mg/L COD
removed. There was a substantial variation in the COD removal efficiency during the mid
and latter portions of this phase. The decrease in COD removal between days 165 and
170 could be attributed to experimental error since high standard deviations were recorded
(Fig 6.2).
The industry shut down on the 27-1-01 and therefore termination in the supply of influent
feed for a period of 5 weeks. The process was shut down and no analysis was conducted
during this period. However, in order to sustain the biomass, final effluent from another
edible oil company was obtained and served as feed influent. The viability of the
microorganisms in the activated sludge was monitored by the OUR and remained within
the range of 20 - 25 mgO/L/h.
TIM E (DAYS)
125 130 135 140 145 150 155 160 165 170 175 180 185
PE
RC
EN
TA
GE
CO
D R
EM
OV
ED
0
10
20
30
40
50
60
70
80
90
100
Figure 6.2 Percentage COD removed during Phase 4E
6.4.1.3 Phase 5C (18-4-01 – 21-5-01)
The influent COD concentration was maintained at 1800 mg/L. The percentage COD
removal during the phase peaked at 90 % removal and was consistent throughout most of
the phase until day 72 when there was a decrease (Fig 6.3) The MLVSS/MLSS ratio was
mostly consistent averaging at 0.8 mgVSS/mgTSS.
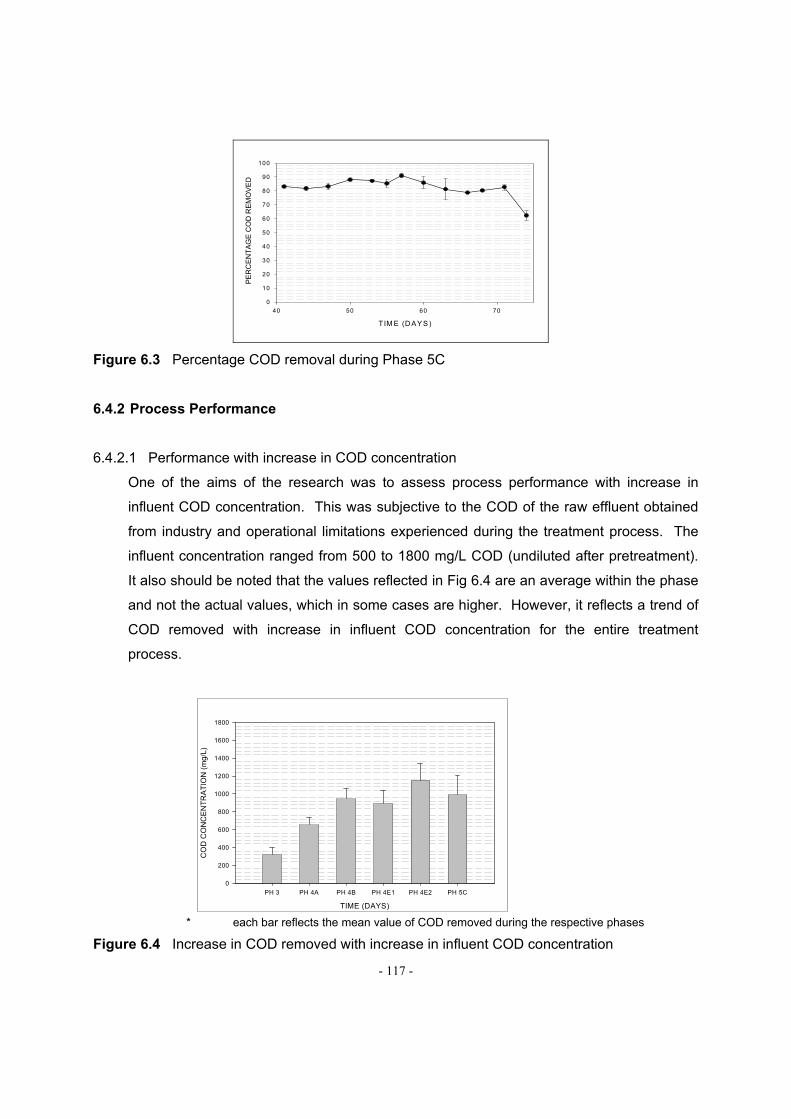
- 117 -
TIM E (D AY S)
40 50 60 70
PE
RC
EN
TA
GE
CO
D R
EM
OV
ED
0
10
20
30
40
50
60
70
80
90
100
Figure 6.3 Percentage COD removal during Phase 5C
6.4.2 Process Performance
6.4.2.1 Performance with increase in COD concentration
One of the aims of the research was to assess process performance with increase in
influent COD concentration. This was subjective to the COD of the raw effluent obtained
from industry and operational limitations experienced during the treatment process. The
influent concentration ranged from 500 to 1800 mg/L COD (undiluted after pretreatment).
It also should be noted that the values reflected in Fig 6.4 are an average within the phase
and not the actual values, which in some cases are higher. However, it reflects a trend of
COD removed with increase in influent COD concentration for the entire treatment
process.
* each bar reflects the mean value of COD removed during the respective phases
Figure 6.4 Increase in COD removed with increase in influent COD concentration
TIME (DAYS)
PH 3 PH 4A PH 4B PH 4E1 PH 4E2 PH 5C
CO
D C
ON
CE
NT
RA
TIO
N (
mg/
L)
0
200
400
600
800
1000
1200
1400
1600
1800

- 118 -
Table 6.1 Increase in COD concentration across phases and F/M ratios
PHASE PERIOD INFLUENT COD CONCENTRATION
(mg/L) MEAN
F/M RATIOS 3 (PH 3) 06/06/00 - 21/07/00 500 0.5476 (0.19) 4 A (PH 4A) 28/07/00 - 16/09/00 800 0.2740 (0.13) 4 B (PH 4B) 17/09/00 - 19/10/00 1200 0.4838 (0.14) 4 E1 (PH 4E1) 01/12/00 - 11/12/00 1500 1.3363 (0.31) 4 E2 (PH 4E2) 12/12/00 - 01/02/01 1800 0.9302 (0.42) 5C (PH 5C) 18/04/01 - 21/05/01 1800 0.6133 (0.14)
(The F/M ratios are expressed as mean values with samples standard deviations in parenthesis)
With reference to Fig 6.4, the results show that as the influent COD concentration (Sti) is
increased, the amount of COD removed by the process also increases. However, there
was a slight decrease in concentration of COD removed during phase 4E. A similar trend
was noticed during phase 5C when compared to phase 4E. Maximum COD removal was
achieved during phase 4E and although the mean influent concentrations during phase 5C
were the same, the concentrations removed were slightly lower. It should be noted that
1800 mg/L COD was the maximum strength of the influent i.e. effluent from industry which
is undiluted after pretreatment. The steady state performance of the process is presented
in the graphs of the individual phases where the operating conditions were similar.
6.4.3 Associated problems
During the period of operation of the laboratory scale treatment process, some of the
major problems encountered were as follows:
• Disruption in the supply of effluent from industry which resulted in having to recycle
the process final effluent to sustain the system.
• Blockages in the tubes due to high FOG (Phase 3) resulting in loss of MLSS and
subsequent diminished process efficiency.
• Associated bulking problem also resulting in poor settling during phase 3 which
recorded a DSVI of 244 mL/g.
• Inconsistency in the industrial effluent strength (COD) amongst batches thus
prevented achieving the desired process influent concentrations i.e. after
pretreatment the Sti was sometimes lower than desired for the phase.
• Occasional mechanical problems associated with peristaltic pumps thus effecting
daily flow rates and infrequent disruption of electricity thus temporarily shutting down
the process.

- 119 -
• Fractionation of the Sti was not possible due to the variable nature and chemistry
amongst the different batches.
6.5 DISCUSSION
The laboratory scale process, when used to treat edible oil effluent, clearly showed up the
problems involved with disposing of these effluents. In the first phase of the process
operation the FOG inhibited the organisms to such an extent that the process failed. This
indicated a need for pretreatment of the effluent in order to reduce the fat and grease
load. This was achieved by flocculation. On a full-scale process this sort of pre-treatment
may also be required, if the effluent is to be successfully treated. The importance of the
nature of the effluent is also illustrated by the problems encountered during Phase 2,
when high phosphorus loads proved to be a problem.
Once a consistent effluent had been obtained and adjusted to a suitable standard, the
process showed reasonably high rates of COD removal overall, apart from perturbations
caused by slight changes in the nature of the feed. Changes in concentration of the feed
resulted in reductions in efficiency, as the system microbial population would have to
adjust and the system would take a while to reach steady state again. This can be seen by
the results obtained in Phase 4 and 5 of the investigation, where COD removal fluctuated
when the organic load decreased or increased.
Subsequent to large-scale pretreatment of the wastewater to reduce the high FOG content
and remove COD, the effluent was characterised. The pH of the refinery wastewater on
collections was acidic i.e. pH 3.8 and basic i.e. pH 9.2 after pretreatment and adjusted to
neutral prior to serving as influent feed. The current findings substantiated previous
research by Saw et al., (1987) that showed raw effluent pH measurements of pH 2 and
COD range of 1010 to 8200 mg/L, which compared favorably with the COD of the effluent
collected that ranged between 6190 and 8470 mg/L. It should be noted that the wide
range was ultimately due to varying strengths of the effluent collected from industry and
was therefore dependent on the refinery process. The pretreatment process using
flocculent removed approximately 74% and 92% of the COD and FOG’s respectively
(Table 6.1). Previous research by Sengul, (1990) using coagulants such as poly-

- 120 -
electrolytes when treating sunflower oil effluent showed COD and FOG removal rates of
76 and 77%, respectively. Therefore, pretreatment has proven to be necessary and highly
effective when adopting a two-stage treatment approach. Biological treatment serves to
remove the resident COD and satisfy municipal discharge standards.
Phase 4E
Phase 4E was initiated with the influent COD concentration increased to 1500 mg/L.
however, the system responded with a sharp decrease in COD removal efficiency (Fig
8.2). The reason for the above behavior could be associated with one of various factors.
Analyzing this trend which showed recovery in COD removal capacity within few days of
the episode, the most likely cause could have been the presence of inhibitory compounds
in the influent which when dissipated within a few days allowed the system to return to
normal performance. On recovery of the process, the influent COD concentration was
increased to 1800 mg/L, which was basically the pre-treated effluent from industry without
any dilution, i.e. full strength. There were odd occasions after pretreatment, that the
concentrations were lower or much higher depending of the effluent batch, but these were
more exceptions than the rule and the influent COD concentrations were adjusted
accordingly. As the influent COD concentration increased, the concentration removed also
increased, with the highest being 1550 mg/L. The concentrations removed during the mid
to latter portions of this phase were high averaging greater than 1000 mg/L COD.
However, towards the end of the phase the COD removal efficiency decreased indicating
that they system was experiencing a certain degree of stress.
Phase 5C
This batch of effluent after pretreatment had an influent feed COD concentration >1400
mg/L. the process efficiency was high recording 90% removal rates (Fig 6.3) and COD
concentrations removed at 1324 mg/L. The performance of the system during the phase
was typical of steady state behavior with consistent removal rates, except towards the end
(day 72). An observation that required mentioning was that with change in effluent batch
and increase in influent COD concentration, the process reacted with immediate higher
COD concentration removed e.g. In phase 5B (701 mg/L) and 5C (1465 mg/L) with 88%
and 90% removed, respectively. This trend was also evident during phase 4. Possible
justification for the above behavior could be that the capacity of the activated sludge

- 121 -
system to remove oil effluent COD exceeded the pretreated influent COD concentrations
during the current research. Ozturk et al., (1990) showed higher maximum removal rates
of 1800 mg/L.
Having achieved the desired objectives and reproducibility of the system results to
changing parameters, the process was terminated.
One of the primary objectives of the research was to ascertain the response of the system
to an increase in the influent COD (organic loading). The treatment process was
partitioned into phases based on varying operational conditions, one of which was the
increase in Sti during each phase. The overall trend was clearly evident that with the
phasic increase in the Sti, the concentration of COD removed by the treatment process
also increased (Fig 6.4). It should be noted that these observations were made across
phases where the operational parameters were not always the same. Therefore Fig 6.4
was useful for observing the overall trend. However, minor deviations did occur e.g. there
was a slight decrease in the COD concentration removed during Phase 4E. A similar
pattern was observed during Phase 5C. Although graphically it appears that the system
had reached a plateau phase from phase 4E onwards, it was not exposed to higher
concentrations than 1800 mg/L (Fig 6.4). Analyzing the response of the system to
increase in COD, it was highly likely that if Sti of greater than 1800 mg/L was used, the
system would have removed higher concentrations of COD. Current findings substantiate
research by other workers in the field with Ozturk et al., (1990) achieving removal capacity
of 1800 mg/L using an Sti of 2500 mg/L. Mkhize, (2002) showed average COD removal
capacity of 1976 mg/L when exposed to oil effluent with an Sti of 2600 mg/L. The
concentrations reflected in fig 6.4 are not the actual concentrations removed during the
phases, since the means were used to construct the graph.
The F/M ratio is an important parameter for the operation of activated sludge processes
and describes the degree of starvation and potential food availability to the microbial
population (Droste, 1997). The F/M ratio, sludge age and settling velocity index (SVI) are
all interrelated and impact on the process performance and the ratios reflected in the
current investigation varied from 0.27 to 1.33 mgCOD/mgMLSS.d. Theoretically, an
increase in the Sti should result in an increase in the F/M ratio from 0.54 to 0.27 (Table

- 122 -
6.2). This was attributed primarily to an increase in the MLSS during Phase 4. A similar
trend was noticed when the F/M ratio decreased from 1.33 to 0.93 COD/mg MLSS.d.
Mkhize, (2002) showed a reduction in the COD removal efficiency and attributed it to the
increased operational F/M ratio that was maintained at 1.5 kgCOD/kgMLSS/d. However,
increasing the F/M ratio of the system is reported to have an overloading effect to the
biomass, which results in the overall poor system substrate metabolism performance
(Casey et al., 1995).
6.6 CONCLUSIONS
The conclusions that were derived from the laboratory scale treatment studies were as
follows:
- The treatment process was conducted in phases that encompassed common
operational parameters and therefore allowed accurate critical analysis of the data.
- Large scale pretreatment achieved the desired objectives and removed sufficient
COD including inhibitory compounds such as high concentration FOG’s to facilitate
biological treatment.
- The COD parameter was used as measurement of the organic removal capacity of
the system, as has been common practice by other researchers in the field.
- The influent COD concentration was gradually increased from 500 to 1800 mg/L
(undiluted) and the system responded accordingly with improved COD removal and
maximum COD removed at 1550 mg/L during steady state conditions.
- The F/M ratio varied and ranged from 0.27 to 1.33 mg COD/mg MLSS.d during the
phases and the system responded accordingly.
- More than 90% of the influent COD was biodegradable.
In conclusion, this method of treatment would be practical as a polishing step in the
treatment of edible oil effluents. A pre-treatment stage would probably be necessary,
however, in order to remove excessive troublesome components present in the effluent,
such as FOG’s. It might be necessary to supplement the effluent feed to the plant with
nutrients and adjust the pH of the stream. In practice this may be achieved by blending the
effluent with a domestic waste stream. The COD removal and reduction of compounds in

- 123 -
the product effluent indicate that this sort of treatment might be suitable for pre-treatment
of edible oil effluents, prior to their release to a wastewater works for further treatment. It is
important to note that theses types of effluents differ considerably from one another for a
variety of reasons, and any process would have to be adapted to these differences.

- 124 -
CHAPTER 7
ALTERNATE TREATMENT TECHNOLOGY USING FUNGI, YEASTS AND
BACTERIA FOR DEGRADATION OF EDIBLE OIL EFFLUENT
7.1 INTRODUCTION
Most trade effluents containing FOG would have received some form of preliminary
physico-chemical treatment before passing to the biological stage. In its simplest form, this
would consist of a fat trap or an oil interceptor. Although these processes can provide
effective protection (through FOG removal) to subsequent biological stages, they are often
not effective due to overloading and poor maintenance. In situations where the FOG is not
removed the wastewater can have serious impacts on receiving wastewater plants. One
such impact is the reported association between FOG, usually in municipal sewage, and
the formation of stable foams on the aeration tanks of activated sludge plants. This foam
becomes a problem when it accumulates in the final settlements tank and is then
discharged with the treated effluent (Forster, 1992).
7.1.1 The Fungal Degradation of Lipids
The degradation of lipids by fungi is predominantly an enzymatic process. Fungal lipases
are considered to play a vital role in lipid degradation and are present in a variety of fungi.
Those belonging to the genera Mucor, Rhizopus and Geotrichum are considered to be
extremely effective in the hydrolysis of triglycerides. Lipases belong to a group of enzymes
known as hydrolases which catalyse the degradation of triglycerides by hydrolysing the
ester bond between the glycerol and acyl moiety. Lipase activity is affected by pH,
temperature and the availability of essential growth nutrients but it has been reported that
highest lipase activity occurs at the oil-water interface in the presence of hydrophobic
substrates (Lazar and Shröder, 1992).
Studies suggest that the utilisation of fatty acids by various microorganisms is determined
not only by fatty acid toxicity and species of the microorganism but also the composition
and pH of the growth medium, and the chain length of the fatty acid.

- 125 -
7.1.2 Yeasts
Yeast are fungi that grow as single cells, producing daughter cells either by budding or by
binary fission and they, therefore, differ from most other fungi which grow as thread - like
hyphae. This distinction is however, not a fundamental one as some fungi can alternate
between a yeast phase, and a hyphal phase depending on environmental conditions. The
classification of yeasts is a specialized field using cell, ascospores, colony characteristics
for distinguishing genera, and physiological characteristics, particularly the ability to
ferment individual sugars, to identify species. Yeasts are heterotrophic, lack chlorophyll
and are characterized by a wide dispersion of natural habitats (SGD, 2001). To a
considerable extent the morphology exhibited by a particular yeast is directly associated
with the mechanism it employs for asexual reproduction. Yeasts are able to grow at pH
values of between pH 3 - 8 and at temperatures ranging from 20C – 30C. (Walker,
1998).
7.1.3 Bacteria
Bacteria are the most numerous and diverse of the microorganisms. They are unicellular
and considerably smaller than protozoa, algae, or fungi. Most, but not all bacterial cells
are enclosed by a cell wall. Bacteria are a heterogenous group anatomically,
physiologically and biochemically. Primarily differentiated on the basis of their morphology
(shape and structure) their growth, physiological and biochemically characteristics.
Bacteria occur in one of 3 shapes - spherical, rods, or spirals. Groups of bacteria that
exhibit other morphologies include filamentous, ensheathed, and appendaged stalked
bacteria. Most bacteria reproduce by binary fission which is an asexual process giving rise
to two equal daughter cells, others by budding, or fragmentation. Some are motile, have
helical hair like appendages called flagella, others by gliding type motion (Atlas and
Bartha, 1993).
7.1.4 Physical Factors Affecting Oil Degradation by Yeast and Bacteria
Rates of oil degradation depend greatly on the composition, state and concentration of the
oil, environmental temperature, pH, oxygen availability and concentrations of mineral
nutrients (for this study purposes only pH and temperature were tested) (Atlas and Bartha,
1993). Degradation of oil is accomplished primarily by bacteria and fungi and some yeasts
(Leahy and Colwell, 1990).
- 126 -
7.2 YEAST AND BACTERIAL DEGRADATION OF EDIBLE OIL EFFLUENT
7.2.1 Aims and Objectives
The aim of this study was to evaluate the degradative capabilities of the yeast and
bacterial cultures for edible oil effluent treatment by optimising growth parameters. The
objectives are as follows:
1. Determining the optimum pH at a temperature of 21oC and 31C
2. Determining the growth capabilities on solid media containing fatty acids as sole
carbon sources.
7.2.2 Materials and Methods
7.2.2.1 Isolation
A soil sample was obtained from the area around the deodorizer effluent pipeline at the
edible oil industry (Pietermaritzburg). One gram of soil was suspended in 9 mL of saline
solution for 24 hr. A serial dilutions series, ranging from 10-1 - 10-8 was performed, after
which a loopful of each dilution was streaked on malt extract agar (Appendix 20) and
nutrient agar (Appendix 21) for yeast and bacteria isolation, respectively. An activated
sludge sample from the pilots scale bioreactor at the Center for Water and Wastewater
Technology was also obtained and likewise inoculated on to malt extract agar and nutrient
agar. Nutrient agar plates were incubated for 24 hr and malt extract plates for 48 hr (longer
depending on the growth) at 25EC. Colonies were restreaked until monocultures of
bacteria and yeast were achieved. A purity check (Appendix 22) was done to differentiate
yeast from fungus and those that morphologically resemble bacteria.
7.2.2.2 Preliminary Screening Tests
The screening procedure was divided into two parts:
Oleic acid batch test
Oleic and stearic acid plate test
These tests were done to reduce the number of isolates to be tests.

- 127 -
A. Oleic Batch Tests
This experiment was done to determine which of these isolates are able to utilize oleic
acid. Conical flasks (250 mL) were used and contained 100 mL of nutrient solution
(Appendix 23) and oleic acid. Oleic acid (10 mL) was added after the nutrient solution had
been autoclaved, as the high temperature would have changed the structure of the fatty
acid. Cupric chloride added as an indicator was dissolved into the oleic acid turning it blue.
This facilitated visual observation of the oleic acid degradation as of the blue stained acid
could be followed. Following inoculation of the flasks with the respective isolates (15) they
were agitated on a Labcon shaker at room temperature of 22EC. The flasks were
monitored visually every day for 10 days and isolates that were found to degrade the acid
were that chosen for the next step.
B. Oleic and Stearic Acid Plate Test
This experiment was done to determine at which pH values and temperatures the isolates
were able to grow. Oleic acid (Appendix 24) and stearic acid (Appendix 25) plates were
poised at pH values of 5, 7 and 8. The isolates were streaked on duplicate plates of each
of the fatty acids at the pH values mentioned. One set of plates was incubated at 21EC
and the other at 31EC for 10 - 14 days. from these plates two bacteria and two yeast
cultures were chosen for further experimentation.
7.2.2.3 Identification of Isolates
Bacteria were identified using the API 50I utilizing APILAB software. Yeast cells were
identified using microscopic analysis, sugar tests (glucose, sucrose, inositol, arabinose,
mannitol and lactose) and morphological observations, in conjunction with Barnett et al,
(1990).
7.2.2.4 Edible Oil Effluent Batch Test
Edible oil effluent was taken from the deodorizer effluent pipe at Sealake Oil Industries.
Conical flasks (1 L) were used containing 250 mL of edible oil effluent, together with 250
mL of double strength nutrient solution (Appendix 23) and poised at pH values of 5, 7 and
8 using either 1M HCl or NaOH. Following this the flasks were inoculated with the isolates
obtained from the agar plates (see section 3.2.2) and incubated at either 21EC or 31EC

- 128 -
for 7 days. An identical set of flasks was made but not inoculated which acted as the
control.
7.2.2.5 Analysis
The pH was monitored using the Beckman -50 pH meter. Initial FOG concentrations
(Appendix 10) and COD (Appendix 3a) was measured prior to inoculation. Thereafter,
FOG and COD was measured every 2 days for 7 days.
7.2.3 Results
7.2.3.1 Isolation of Bacteria and Yeast
From the soil sample eight bacteria and six yeast cultures were obtained while only one
bacterial culture was obtained from the activated sludge. All of the bacteria isolated were
gram positive rods.
7.2.3.2 Preliminary Screening
A. Oleic Batch Tests
From Table 7.1 it can be seen that the bacterial cultures 3,4, 5 and isolate F removed a
large amount of the added oleic acid after 24 hr (day 2) while culture no. 1 showed similar
removal after 48 hr. The remaining bacteria cultures did not show any oleic acid removal
even after 10 days. Therefore only bacteria 3, 4, 5 and F were retained for additional
screening and experiments. Likewise, yeast cultures 3, 4 and 5 showed a rapid utilization
of the oleic acid during the first 24 hr and after 3 days the remaining cultures, also
recorded good oleic acid removal. Bacterial cultures 3, 4, 5 and F and yeast cultures 3, 4
and 5 were chosen for further experimentation.

- 129 -
Table 7.1 Oleic acid utilization by bacteria and yeast isolates using batch tests
Isolate No. Day 2 Day 3 Day 4 Day 5 After 10 days B A C T E R I A
1 * * * * * * * * * n 2 * * * * * * * * * * * * n 3 * * * * * 0 n 4 * * * * n 5 * * 0 0 n 6 * * * * * * * * * * * * n 7 * * * * * * * * * n 8 * * * * * * * * * * * * n F * * * * * * n
Y E A S T
1 * * * * * * n 2 * * * * * * * * * n 3 * * * * n 4 * * * * n 5 * * * * n 6 * * * * * * n
Key:
0 - no oil remaining * * - moderate oil remaining * - little oil remaining * * * - almost all initial oil remaining n - no change from day 10
B. Oleic Acid Plates
Table 7.2 Growth of bacteria and yeast on oleic acid plates at pH values of 5, 7 and 8 and
at 21C and 31C
pH B A C T E R I A (B) Y E A S T (Y) TEMP
3 4 5 F
3 4 5
5
0 * * * * * * * * * * * * * * * * 21EC
* * * * * * * * * * * * * 31EC
7
* 0
* * * * * * * * 21EC
0 0 0 0 0 * * * * 31EC
8
0 0 0 0 * * * * * 21EC
0 0 0 0 0 0 * 31EC
Key:
0 - no growth * * - moderate growth * - little growth * * * - excellent growth
At a pH of 5 it can be seen that at a temperature of 21C cultures B3 and B4 showed poor
growth while the remaining organisms showed extremely rapid growth. On the other hand,
B3 and B4 showed poor growth at 31C. For the yeast cultures only Y5 showed good
growth while the remaining organisms grew moderately well.
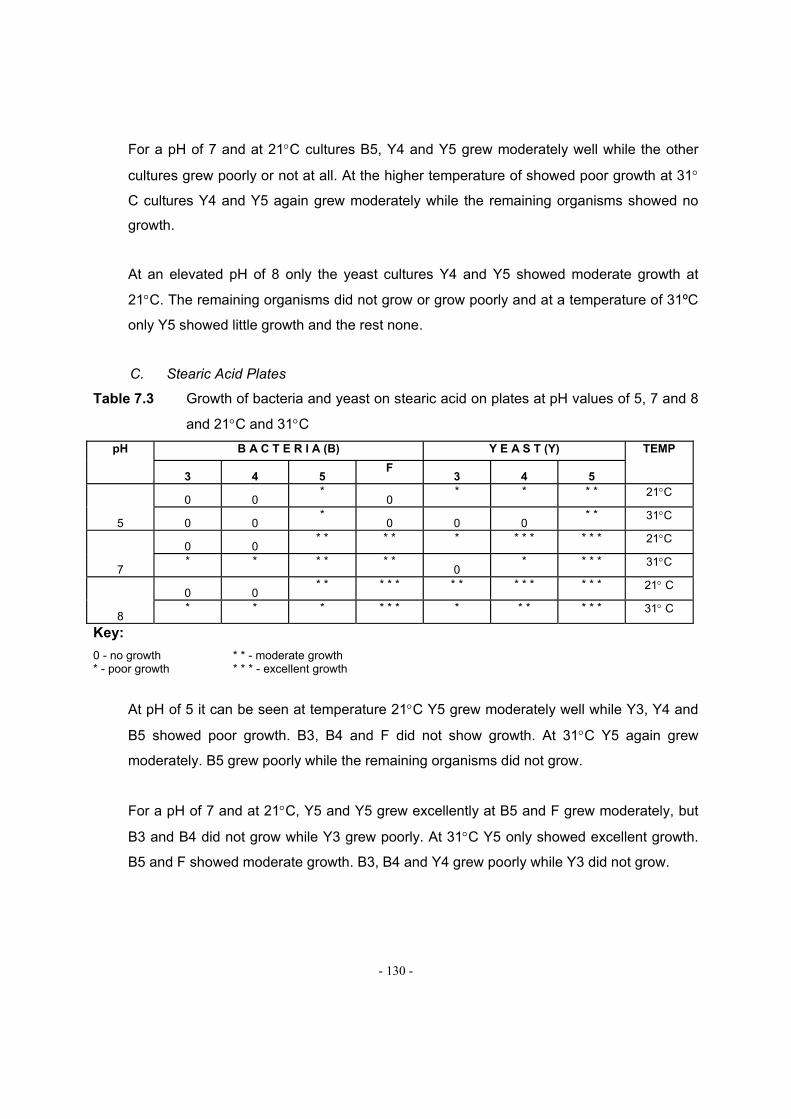
- 130 -
For a pH of 7 and at 21C cultures B5, Y4 and Y5 grew moderately well while the other
cultures grew poorly or not at all. At the higher temperature of showed poor growth at 31
C cultures Y4 and Y5 again grew moderately while the remaining organisms showed no
growth.
At an elevated pH of 8 only the yeast cultures Y4 and Y5 showed moderate growth at
21C. The remaining organisms did not grow or grow poorly and at a temperature of 31ºC
only Y5 showed little growth and the rest none.
C. Stearic Acid Plates
Table 7.3 Growth of bacteria and yeast on stearic acid on plates at pH values of 5, 7 and 8
and 21C and 31C
pH B A C T E R I A (B) Y E A S T (Y) TEMP
3 4 5 F
3 4 5
5
0 0 *
0 * * * * 21C
0 0 *
0 0 0 * * 31C
7
0 0 * * * * * * * * * * * 21C
* * * * * * 0
* * * * 31C
8
0 0 * * * * * * * * * * * * * 21 C
* * * * * * * * * * * * 31 C
Key:
0 - no growth * * - moderate growth * - poor growth * * * - excellent growth
At pH of 5 it can be seen at temperature 21C Y5 grew moderately well while Y3, Y4 and
B5 showed poor growth. B3, B4 and F did not show growth. At 31C Y5 again grew
moderately. B5 grew poorly while the remaining organisms did not grow.
For a pH of 7 and at 21C, Y5 and Y5 grew excellently at B5 and F grew moderately, but
B3 and B4 did not grow while Y3 grew poorly. At 31C Y5 only showed excellent growth.
B5 and F showed moderate growth. B3, B4 and Y4 grew poorly while Y3 did not grow.

- 131 -
At a pH of 8, Y4, Y5 and F showed good growth at 21C. B5 grew moderately. Remaining
organisms grew poorly or not at all. At 31C only Y5 and F grew extremely well. Candida
spp grew moderately. Remaining organisms grew poorly.
7.2.3.3 Identification
The identifications of the isolates were not 100% correct. Therefore only tentative
identification was done. The results from the API identification indicated that the bacterial
culture was B. lactosporus (96.8% certainty). The other cultures showed very low
correlation factors with less than 80% assurance; therefore these organisms were not
identified with this method. The yeast cultures were identified as a Candida succiphila and
a Rhodosporidium sp.
7.2.3.4 FOG Degradation
The graphs for FOG degradation at pH’s 5, 7 and 8 at 21 and 31C can be seen in
Appendix 26.
7.2.3.5 COD Removal
The graphs for COD degradation at pH’s 5, 7, 8 at 21 and 31C can be seen in Appendix
27.
The FOG removal rates have been detailed below (Table 7.4). The following results were
recorded:
pH 5: At 21C F (90%) showed high FOG removal, followed by Candida sp (53%), Bacillus
sp (42%) and lastly by Rhodosporidium sp (11%). At 31 C a high percentage of FOG was
utilized except by Candida sp (27%). Rhodosporidium sp removed 91%, F removed 86%
and Bacillus sp removed 81%.
pH 7: Only Candida sp (87%) removed high percentage of FOG while the remaining
organisms removed an average percentage at 21C. FOG percentage removal was 56%
(F), 52% (Bacillus sp) and 52% (Rhodosporidium sp). At 31C Rhodosporidium sp was
only able to remove 68% FOG. F, Bacillus sp and Candida sp were only able to remove
49%, 40% and 42% respectively.

- 132 -
pH 8: F removed 59% of FOG which was just above average at 21C. Excellent removal
was observed by Bacillus sp (74%), Candida sp (75%) and Rhodosporidium sp (75%). At
31C both Candida sp and Rhodosporidium sp were able to remove 85% FOG. Bacillus sp
removed 47% while F had the lowest FOG removal at 9%.
Table 7.4 Final FOG removal percentage of F, Bacillus sp, Candida sp and
Rhodosporidium sp in batch tests
pH B A C T E R I A Y E A S T T E M PF
Bacillus sp Candida sp Rhodosporidium
sp
5 90 42 53 11 21C 86 81 21 91 31C
7 56 52 82 52 21C 49 40 42 68 31C
8 59 74 75 75 21C 9 47 85 85 31C
7.2.4 Discussion
7.2.4.1 Preliminary Screening
Preliminary screening was performed in order to:
1. To reduce the number of isolates.
2. To determine which of the isolates were able to degrade or utilize fatty acid.
3. To determine which of the isolate were able to grow in the presence of fatty acids
under the designated pH and temperature parameters
A. Oleic Acid Batch Test
Oleic acid was used for preliminary screening as they form part of the FOG triglyceride
structure in edible oil effluent. Table 7.1 shows the results of the yeast and bacteria
isolates to utilize oleic acid in batch tests. Yeast cultures were better able to utilize or grow
in oleic acid than the bacterial cultures. Although bacteria B3, B4, Bacillus sp and F
performed extremely well by removing almost all of the oleic acid, B1, B2, B6 and B7 did
not utilize oleic acid. Y3, Candida sp and Rhodosporidium sp performed just as well has
B3, B4, Bacillus sp and F. But Y1, Y2 and Y3 did not initially utilize oleic acid or utilized it
poorly. But as days progressed these cultures were able to utilize almost all of the oleic

- 133 -
acid. Eventually only Y2 performed as well as the Y3, Y4 and Y5. The organisms able to
utilize oleic acid may have been able to induce lipase activity under these conditions. A
possible reason for the slow start of the other organisms could be due to:
- pH and temperature were not conducive for the organisms to grow (not tested or
maintained);
- Limited nutrient availability;
- Oleic acid concentration may have been to low or too high. This may have inhibited
growth of the organism;
- Oleic acid was not able to be used as a carbon source by a particular organism;
- External environmental conditions or nutrient concentration may have not been
conducive for lipase production or activity; and
- Organisms may have an inefficient lipase system.
- Bacillus sp, isolate F and Y2, Candida sp and Rhodosporidium sp were chosen for
further study because they demonstrated very good acid degradation rates
B. Oleic and Stearic acid Plates
Table 7.2 and 7.3; show the growth of the isolates on oleic and stearic acid agar plates,
respectively. Oleic and stearic acid plates were used to determine which of the chosen
isolates were able to grow at pH values of 5, 7, 8 and temperatures 21C and 31C.
Oleic acid plates showed that Candida sp and Rhodosporidium sp were able to grow at
pH 5, 7, and 8 and at both temperatures, except at a pH of 8 and at 31C. Bacillus sp, F
and Y3 were only able to grow up to pH 7 (21C). B3 and B4 grow poorly or not at all.
Stearic acid plates showed growth of Rhodosporidium sp on all the plates. Candida sp, F
and Bacillus sp seemed only to grow from pH 7 to pH 8. The organisms showed fairly
different growth rates on oleic and stearic acid plates. A possible explanation could be due
to the state or form of the fatty acids at these temperatures. Oleic acid was liquid while
stearic acid was almost in a solid form at room temperature. It was reported that fatty
acids in a more solid form are more difficult to degrade (Ratheledge, 1994). From this
experiment Bacillus sp, F, Candida sp and Rhodosporidium sp were chosen for further
experimentation.
- 134 -
7.2.4.2 FOG’s
Most organisms cannot tolerate extreme pH values. Under extreme alkaline or acidic
conditions to which organisms do not function, microbial cell components may be
hydrolyzed or enzymes may be denatured. Amino acids are zwitterions, having both basic
and acidic portions. The pH affects the dissociation of these functional groups on proteins
molecule. In order to perform enzymatic activity, enzymes must be in a particular state of
dissociation. Certain pH values will be optimal for activities of specific enzymes. The pH of
an environment affects microorganisms and microbial enzymes directly and also
influences the dissociation and solubility of any molecules that indirectly influence
organisms. The availability of required nutrients, such as ammonium and phosphate,
which limit microbial growth and mobility of toxic heavy metals (Atlas and Bartha, 1993). In
addition to affecting survival and growth, temperature influences the metabolic activities of
microorganisms.
The results of this study indicated the capabilities of isolates Bacillus sp, F, Candida sp
and Rhodosporidium sp to utilize and degrade FOG in sunflower oil effluent under pH
values of 5, 7 and 8 and at 21C and 31C (Table 7.4). It was assumed that yeast and
bacteria are able to reduce FOG levels in edible oil effluent. This assumption was based
on early works by Huss, (1908) and Harrisson, (1927; cited Ratheledge, 1994). They
found that bacteria and yeast were able to be cultivated on oils and fats. Earlier works by
Pan et al (1959; cited Ratheledge, 1994) also showed that it was possible that vegetable
oil could be utilized as a sole carbon source of carbon and energy.
From the result obtained it can be clearly seen that the yeast and bacterial isolates were
able to reduce FOG levels in the sunflower oil effluent under the different pH and
temperature values. However, there were no definitive trends, as organisms behaved
differently under different conditions. The bacteria showed more constant FOG
degradation abilities than the yeast with the highest FOG removal being observed at pH 5
21C and 31C which ranged between 90% and 81%, with the exception of Bacillus sp at
21C where only 42% FOG was removed. However, a high removal of FOG, by Bacillus
sp, was observed at pH 8 at 21C with 74%.

- 135 -
It appears that pH values have a greater physiological effect on bacteria than temperature,
which was also concluded by Ratheledge, (1994). He stated that the attainment of
optimum initial pH and the maintenance of the pH during growth of culture were of great
importance. He also stated that maintenance of a constant pH during growth of a culture is
especially important for those organisms that produce acid but are not acid tolerant (in this
study isolates were not tested for acid tolerance). This could possible explain why the
bacteria removed FOG so erratically. In this study the pH was not maintained in the batch
culture as to prevent the risk of contamination by the pH probe and pH chemicals. It also
seems that the temperature affects the bacteria differently at different pH values.
Yeasts are known to grow very well when the initial culture medium pH is between 4 - 6,
but many yeast are capable of growth at lower pH than bacteria, but do not generally grow
well at alkaline pH values (Walker, 1998). From this study it was observed that the
percentage FOG utilization increased as pH increased (although Rhodosporidium sp did
remove 95% FOG at pH 5, 31 C). This supported the works of Jeffery et al (1999), who
observed that this range (pH 8) appears to favor both emulsification of oil and its cleavage
by fungal lipase activity, as well as their utilization for cell growth. They also observed that
an increase in pH alone could be responsible for most of the enhanced sunflower oil
utilization and biomass growth. Although it has been stated that yeasts do not perform well
under alkaline conditions the highest FOG removal occurred at pH 8 by both Candida sp
and Rhodosporidium sp (75% and 85% respectively) while the lowest FOG removed was
11% by Rhodosporidium sp at pH 5 (21C). Another possible explanation for this occurring
could be that actively growing yeasts acidify their growth medium through a combination of
differential ion uptake proton secretion during nutrient transport (Walker, 1998). Most
laboratory and industrial yeast tend to grow well at between 20oC and 30C (Winkelmann,
1998). For Rhodosporidium sp at 31C, the FOG removal rates increased from 21% (pH 5)
to 42% (pH 7) to 85% (pH 8). This seemed to indicate that temperature enabled the yeast
to remove FOG at a greater rate as the pH increases.
From these batch tests it was also observed that in negative control the edible oil effluent
seemed to degrade itself. The reasons for this are unclear but could be related to
extraction efficiency, solvents used and the change of organic fraction over time due to
hydrolysis and photo-degradation. These factors could also explain why the FOG values

- 136 -
appeared to increase above initial values. Furthermore placing the microbial population
under stress could have caused cells to undergo lysis. Cells that lysed could have
released their internal lipid components that may have added to the external FOG.
Poor FOG utilization could be explained by the following:
- Failure of yeast to perform well at pH 5 could be attributed to the possibility that the
pH inhibits lipase activity. Koh et al (1983; cited Ratheldge) found that out of 200
isolates only a few were effective in the degradation palm oil. These authors
seemed to have had their media pH at 5.5, but most yeast lipase activity occurs at
between pH 6.5 and 7.0 (Ratheledge, 1994).
- Poor microbial degradation could be attributed to concentration, level or quantity
FOG present. It is stated that if FOG concentration are too high or too low it may
inhibit the microorganism (as in the oleic batch tests).
- Tan and Gill (1985b; cited Ratheldge, 1994) observed that for successful growth of a
microorganism to occur on a lipid, the culture medium had to be maintained close
too the optimum pH of the lipase that was needed to hydrolyze the oil. During this
study pH was not maintained which may have contributed to some of the organism’s
low performance.
- Another factor to be taken into account for successful microbial growth is the
dispersal and viscosity of oil and fats within the vessel (Tan and Gill, 1985b; cited
Ratheledge, 1994). Poor removal of FOG could have been attributes to poor
agitation. As different agitation rates may be needed for different organisms
(Ratheledge, 1994). High viscosity of FOG compounds could have attributed to poor
FOG utilization. This was found by Wakelin and Forster, (1997). They found that the
high viscosity of castor oil resulted in this oil being less effectively dispersed in the
culture medium than other FOG substrates.
- Nutrient availability or depletion could also be a factor. Once growth is established
an oil, all other nutrient must continue to be present otherwise only partial utilization
will ensue (Ratheledge, 1994). As this experiment was done under batch tests no
nutrients were added. Therefore nutrient concentrations were not maintained. This
could have resulted in some of the average rates of FOG removal.
- Poor removal by the organisms could also be caused by those organisms being in
the lag phase, due to slower growth rates (growth rates were not determined in this
- 137 -
study). Wakelin and Forster (1997) observed that poor FOG was removed when the
activated sludge was under a lag phase.
7.2.4.3 FOG Removal in Association with COD
FOG is a lipid, which, is component of organic compounds and, thus, measured as COD
(Raunkjaer et al, 1994; cited Dueholm et al., 2001). However, COD has many other
separate fractions such as readily biodegradable COD and soluble COD (Wentzel et al.,
1999). Although COD consist of many fractions, each fraction is not measured separately
but as a whole.
The COD concentrations recorded during this study showed a general trend of an initial
COD decrease within the first three days and then, subsequent, increases until day 7. The
COD elevation could be attributed to cell shock due to the new environment. This could
have lead to cell lysis, resulting in release of internal organic matter into the external
environment. The control was also observed to show such early increases at pH 5, 21C.
The reason for this occurrence is unclear. However, it is noticed that these increases
seem to have occurred at pH 5. Therefore, it could be possible that certain organisms may
not initially tolerate an environment at pH 5. The decrease of COD, on the other hand,
could be due to organisms utilizing FOG and other organic matter.
Although COD concentrations, generally, increased by the day 7, FOG was still being
removed. This could prove that FOG forms a small component of COD. Because even
though FOG was removed COD increases still occurred.
7.2.5 Conclusion
From this study it can be concluded that pH and temperature affect the ability of
organisms to utilize FOG. These factors seem to affect the organisms simultaneously or
individually. The effect of pH and temperature on the organism’s ability to utilize FOG was
not conclusively quantified. Further studies need to be done in order to determine the
exact relationship or effect that pH, temperature and COD have on FOG utilization. It can
also be concluded that microorganisms may only enhance FOG degradation rather that be
totally responsible for FOG degradation (this was indicated by the spontaneous

- 138 -
degradation of the effluent in the control batch). It is possible that pH control may have an
effect on FOG degradation.
7.3 FUNGAL (MOULDS) DEGRADATION OF EDIBLE OIL EFFLUENTS
Microbiological treatment of high lipid containing waste effluents prior to discharge into
water systems could prove to be an effective approach in removing, or reducing a major
component of these pollutants. Reports have demonstrated that many fungi have the
ability to degrade a wide variety of hazardous organic compounds (Ratledge, 1994).
The powerful degrading capabilities of many fungi are attributed to their unique metabolic
activities or enzyme systems. Fungal lipases are often produced in high concentrations
that assist in the fungal degradation of various lipids (Anke, 1997).
Therefore similar experiments were made to determine the effectiveness of using fungi
(specifically moulds) to degrade the triglyceride component (i.e. the long chain fatty acids)
found in the effluents discharged from edible oil industries. The possibility of using fungi
to biologically treat lipid waste effluents offers an environmentally sound and cost-effective
method to produce better quality effluents (Anke, 1997).
7.3.1 Aims and Objectives
The aim of this study was to evaluate the degradative capabilities of the fungal cultures for
edible oil effluent treatment by optimizing growth parameters. The objectives were as
follows:
1. To determine the optimum pH at a temperature of 21oC and 31C
2. To determine the growth capabilities on solid media containing fatty acids as sole
carbon sources.
- 139 -
7.3.2 Materials and Methods
7.3.2.1 Collection of soil samples:
Soil samples surrounding the effluent discharge pipe at the edible oil industry in
Pietermaritzburg, was collected in a sterile universal. Samples were processed
immediately on arrival back to the laboratory.
7.3.2.2 Isolation and Identification of fungi from soil samples:
Exactly 1 g of soil sample was added into 9 mL of an osmotically neutral saline solution
(0.9% NaCl) for 24 hr to maintain microbial cell stability and viability. Thereafter, 1 mL of
the saline mixture was serially diluted from 10-1 to 10-8 concentrations to reduce the initial
amount of microorganisms. Inoculum from the samples with lower concentrations (i.e. 10-4
to 10-8) was point inoculated onto Sabouraud Dextrose Agar (SDA) plates (Appendix 28) to
obtain fungal monocultures. These agar plates were then incubated in an incubator
(Scientific Series 9000) for 5 to 6 days at 25oC to promote successful fungal growth.
Frequent sub-culturing of the evident fungal growth on these plates was then performed
until fungal monocultures (specifically moulds) were obtained. Purity checks of these
isolates were determined by morphological and microscopic appearances. Identification of
these pure isolates was performed by staining the cultures of interest with Lactophenol
cotton blue solution (Appendix 29) and viewing their appearances microscopically. These
microscopic appearances were stored onto computer and various books containing fungal
pictures and related literature were employed to identify these fungal monocultures.
7.3.2.3 Growth potential of isolated fungi on fatty acids:
A growth medium containing the essential fungal growth nutrients (i.e. potassium,
vitamins, trace minerals, trace elements, iron and zinc sources), used by fungi for growth
and activation of enzymes required for organic compound degradation were obtained from
the University of Natal in Pietermaritzburg. Aliquots (1 mL) of these growth nutrients which
came in 3 separate sterile universals, potassium, magnesium and nitrogen sources, as
well as bacteriological agar and commercially available long chain fatty acids (oleic and
stearic acids as an organic source) were used to produce long chain fatty acid containing
agar plates (Appendix 24/25) at discrete pH values of 5, 7 and 8. Studies suggest that

- 140 -
sunflower oil does contain significant quantities of linoleic and oleic acids. The fungal
monocultures, obtained previously, were point inoculated onto the plates and incubated
(Scientific Series 9000) separately at either 21oC or 31oC respectively for 7 to 8 days.
Following incubation the growth potential was determined by visual observation of fungal
growth.
Fungal degradation of fatty acids from an edible oil effluent in batch cultures:
Effluent was obtained from the deodorizer at the refinery of Company X, as this effluent
contains significant amounts of FFA’s and other organic compounds. Mixtures containing
the fungal growth nutrients (i.e. growth medium) and the raw edible oil effluent at discrete
pH values of 5, 7 and 8 were produced (Appendix 23) to determine the ability of the fungal
monocultures in degrading the long chain fatty acid components. Thereafter, 500 mL of
these mixtures at the poised pH values were decanted into sterile 1 L conical flasks for
further experimentation. Loopfuls of the fungal monocultures, freshly cultured, on SDA
plates were used to aseptically inoculate the 1 L conical flasks that contained. Duplicate
sets of the batch culture flasks were aerated for 10 days at either 21oC or 31oC
respectively. Over the period of experimentation daily samples were taken for COD
analysis (Appendix 3a) and every second day FOG’s (Appendix 10) analysis. Also,
uninoculated 1 L conical flask’s containing the above mentioned mixtures poised at the
different pH's of 5, 7 and 8 and at either of the temperatures served as the controls.
7.3.3 Results and Discussion
From these results (Table 7.5) it can be seen that both the Alternaria sp. and Mucor spp.
were capable of good growth on oleic acid agar plates at a pH of 5 and at 21oC.
Furthermore, growth declined for both Mucor spp. as the pH was increased to pH 7 and
pH 8 respectively while the Alternaria sp. was unable to grow at the elevated pH value.
Table 7.5: Fungal growth on oleic acid agar plates, at 21oC and pH’s 5, 7 and 8,
respectively.
PH Temperature (oC) Alternaria sp. Mucor sp. 1 Mucor sp. 2 5 21 ++++ ++++ ++++ 7 21 O ++ +++ 8 21 O ++ 2
Key: ++++ = Excellent growth +++ = Good growth ++ = Moderate growth + = Little growth O = No growth

- 141 -
Table 7.6: Fungal growth on oleic acid agar plates at 31oC and at pH's of 5, 7, and 8
respectively:
pH Temperature (oC) Alternaria sp. Mucor sp. 1 Mucor sp.2 5 31 O ++++ ++ 7 31 O + ++ 8 31 O O O
Key: ++++ = Excellent growth +++ = Good growth ++ = Moderate growth + = Little growth O = No growth
Similarly to the previous temperature the two Mucor spp. showed good to moderate
growth at lower pH values (Table 7.6) with decreasing growth potential as the pH
increased. The Alternaria sp., On the other hand did not grow at any of the pH poised
plates at 31oC.
Using stearic acid as a carbon source the Alternaria sp. was again unable to grow at any
of the pH poised plates. Mucor sp. 1 grew well at a pH of 5 but as the pH increased,
growth declined almost to a minimum. On the other hand Mucor sp. 2 showed relatively
good initial growth and as the pH increased, growth increased significantly. (Table 7.7)
Table 7.7: Fungal growth on the stearic acid agar plates at 21oC and pH’s 5, 7 and 8
respectively:
pH Temperature (oC) Alternaria sp. Mucor sp. 1 Mucor sp. 2 5 21 O ++++ ++ 7 21 O +++ +++ 8 21 O + ++++
Key: ++++ = Excellent growth +++ = Good growth ++ = Moderate growth + = Little growth O = No growth
Table 7.8: Fungal growth on stearic acid agar plates at 31oC and at pH’s 5, 7, and 8
respectively:
pH Temp (31oC) Alternaria sp. Mucor sp. 1 Mucor sp. 2 5 31 O ++++ ++ 7 31 O ++++ +++ 8 31 O +++ +++
Key: ++++ = Excellent growth +++ = Good growth ++ = Moderate growth + = Little growth
O = No growth
For the plates incubated at 31oC the Alternaria sp. was incapable of growth on any of the
agar plates (Table 7.8). The Mucor sp. 1, however, recorded excellent growth initially with
a decrease in pH value, while Mucor sp.2 showed an increase with increasing pH.
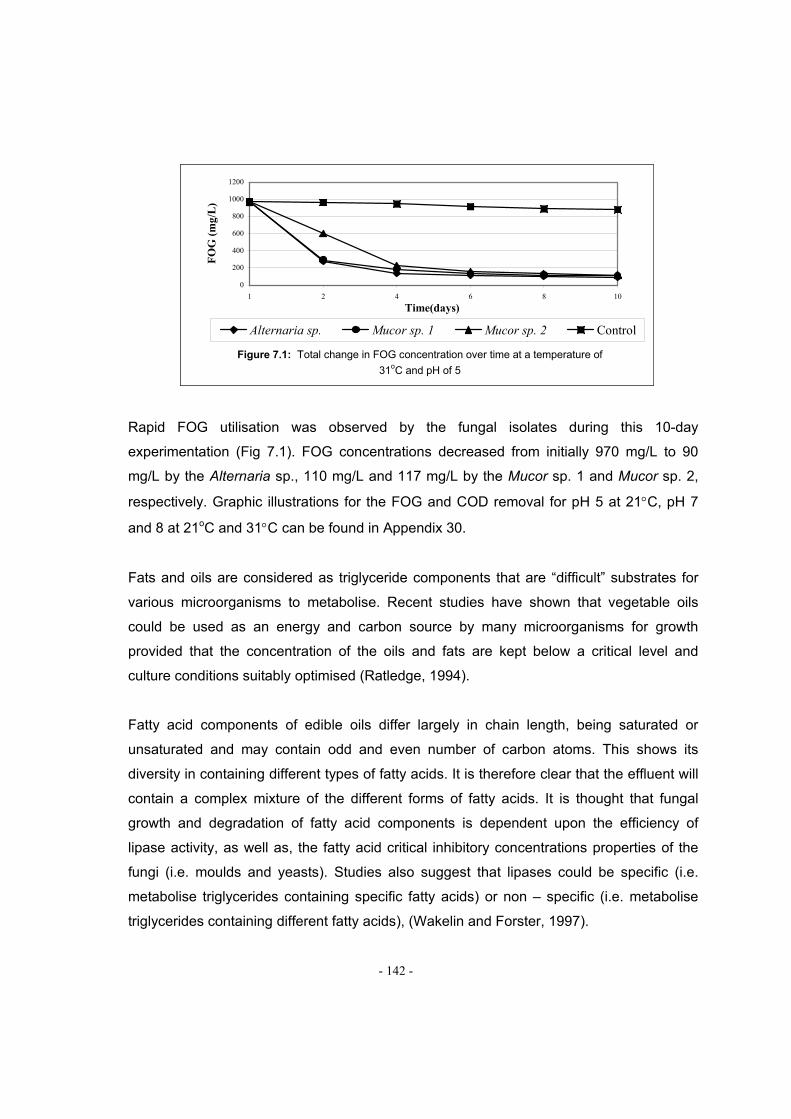
- 142 -
Figure 7.1: Total change in FOG concentration over time at a temperature of
31oC and pH of 5
0
200
400
600
800
1000
1200
1 2 4 6 8 10
Time(days)
FO
G (
mg/
L)
Alternaria sp. Mucor sp. 1 Mucor sp. 2 Control
Rapid FOG utilisation was observed by the fungal isolates during this 10-day
experimentation (Fig 7.1). FOG concentrations decreased from initially 970 mg/L to 90
mg/L by the Alternaria sp., 110 mg/L and 117 mg/L by the Mucor sp. 1 and Mucor sp. 2,
respectively. Graphic illustrations for the FOG and COD removal for pH 5 at 21C, pH 7
and 8 at 21oC and 31C can be found in Appendix 30.
Fats and oils are considered as triglyceride components that are “difficult” substrates for
various microorganisms to metabolise. Recent studies have shown that vegetable oils
could be used as an energy and carbon source by many microorganisms for growth
provided that the concentration of the oils and fats are kept below a critical level and
culture conditions suitably optimised (Ratledge, 1994).
Fatty acid components of edible oils differ largely in chain length, being saturated or
unsaturated and may contain odd and even number of carbon atoms. This shows its
diversity in containing different types of fatty acids. It is therefore clear that the effluent will
contain a complex mixture of the different forms of fatty acids. It is thought that fungal
growth and degradation of fatty acid components is dependent upon the efficiency of
lipase activity, as well as, the fatty acid critical inhibitory concentrations properties of the
fungi (i.e. moulds and yeasts). Studies also suggest that lipases could be specific (i.e.
metabolise triglycerides containing specific fatty acids) or non – specific (i.e. metabolise
triglycerides containing different fatty acids), (Wakelin and Forster, 1997).
- 143 -
Considering the above mentioned properties or characteristics, the following observations
were noticed in tables 7.1 to 7.4. The Alternaria species grew relatively well at a pH of 5 at
21oC on the oleic acid agar medium but or no growth was observed on the stearic acid
agar medium. This probably occurred due to the lipase produced by this fungal isolate as
been relatively specific under the prevailing conditions. The overall poor growth observed
by the Alternaria sp. on both the fatty acid containing agar media could be attributed to
either the concentration of the fatty acid incorporated in the agar medium had a toxic effect
on this fungal isolate, or, alternatively, the solid media did not allow for enzyme expression
and/or activity. The other fungal isolates both belonging to the Mucor spp. were capable of
growing successfully on both the oleic and stearic acid agar media under varying pH and
temperature conditions. These successes in growth by both the Mucor spp. can be largely
attributed to the presence of a non – specific lipase producing system.
Microorganisms utilise various industrial pollutants or natural occurring substances as
sources of carbon, nitrogen, phosphorus, sulphur or other elements that maybe required
by the cells to sustain growth. However organic components such as carbonaceous
materials that are oxidised by microorganisms to provide energy for efficient growth are of
the utmost importance (Alexander, 1999). Lipids (characterised as either fats and long
chain fatty acids, oils and greases) are considered as important organic constituents of
various wastewaters, as they contribute between 30% and 40% of the total organic matter
(expressed as COD), (Dueholm et al., 2001). Studies have shown that various
microorganisms (i.e. moulds and yeasts) are capable of effectively using long chain fatty
acids as sole sources of carbon and energy, and that if the fatty acids are present along
with water insoluble substrates (i.e. vegetable oils), then partitioning of the fatty acids
between the aqueous and oil phases will diminish the toxic effects of the fatty acids
(Ratledge, 1994).
Carbonaceous material can be divided into two principle forms, i.e. biodegradable and
non-biodegradable. Each form has two principle fractions, namely soluble and particulate.
The readily biodegradable material is rapidly utilised by microorganisms whilst the
particulate fraction or slowly biodegradable COD is effectively absorbed but assimilated
more slowly. The non–biodegradable particulate material cannot be hydrolysed by
individual microorganisms or microbial populations (Lilley et al., 1997).

- 144 -
Referring to Figure 7.4, (Appendix 31), the rapid fungal (i.e. moulds) metabolism of the
soluble readily biodegradable fraction is shown by the initial decrease in the COD values.
Those isolates belonging to the Mucor spp showed a slow but steady decline in the total
organic matter present which was shown by the gradual decrease in COD values. The
presence of relatively unfavourable conditions (a pH of 5 at 21oC) for organic substrate
utilisation resulted in less than 50 % reduction of the total COD fraction present in the
edible oil effluent, by both the Mucor spp. Previous studies show that for particular
microorganisms to grow on a specific compound, it must be converted to intermediate
products that characterise major metabolic sequences. If these compounds cannot be
modified enzymatically to yield these intermediates, then these compounds will not be able
to serve as energy and carbon sources and hence the energy yielding and biosynthetic
processes will not function (Alexander, 1999). The lack of growth and poor organic
substrate utilisation observed by both the Mucor spp. could indicate that the organic
constituents in the edible oil effluent were unable to be enzymatically modified to yield
these intermediates under the prevailing conditions. However the fungal isolate belonging
to the Alternaria spp., showed higher metabolic activity under the prevailing conditions and
resulted in a 59% reduction in the total COD fraction.
Similar experiments made i.e. a pH 5 of at 31oC also showed initial rapid decrease in COD
values observed for the Alternaria sp. was probably largely attributed to the efficient
utilisation of the soluble readily biodegradable fraction. Constant COD values thereafter
represent the presence of a readily biodegradable fraction. Other organisms take a bit
longer but get to the same constant period eventually. This indicates that the Alternaria sp.
expresses lots of lipases and exhibits higher metabolic rates at this higher temperature.
Reports suggest that the percentage of carbon substrate that is converted into cells is an
indication of biological efficiency of converting the substrate into biomass (Alexander,
1999). The efficiency of utilising the organic constituents present in the edible oil effluent
as growth and energy substrate’s by the fungal isolates under these prevailing conditions
was indicated by the extremely high COD reduction rates that were observed (i.e. 93% by
the Alternaria sp. and 91% by both the Mucor spp).

- 145 -
Occasionally prior to degradation of many organic compounds, a period whereby no
destruction of the organic substrate or pollutant is observed but thereafter disappearance
or rapid degradation of this pollutant or substrate occurs. This period of no destruction is
referred to as an acclimation period (Alexander, 1999). This phenomenon is probably
observed by the Mucor spp 1 in some of the experiments whereby although initial COD
utilisation rates were slow and erratic, rapid utilisation of the organic matter was observed
after the forth day (i.e. shown by rapidly decreasing COD values and an overall COD
reduction of 87%). The Alternaria spp. however, did not require an acclimation period as it
grew efficiently during many of the mentioned conditions resulting in a 92% COD
reduction.
A compound not readily dissolved in water is considered as been not readily accessible for
microbial utilisation. The rapid uptake of this compound by the microbial cell from the
aqueous phase and subsequent rapid utilization of it as a carbon and energy source for
growth is inhibited, unless the microbe has a special mechanism for uptake and
assimilation of the organic substrate using special degradative enzymes (Alexander,
1999). Recent studies have shown that the aerobic removal of fats, oils and greases (i.e.
FOG’s) by various microorganisms involves the initial extracellular attack on triglycerides
via the hydrolysis of the ester bonds by microbial lipases. The term FOG used in this study
collectively represents the triglyceride component (i.e. the long chain fatty acids) that
would be present in the vegetable oil effluent (Wakelin and Forster, 1997).
From the results mentioned and shown it can be seen that the fungal isolate belonging to
the Alternaria sp. has unique capabilities to utilise and breakdown the FOG components of
the edible oil effluent very efficiently under the varying pH and temperature conditions.
This was observed by an 88% reduction (in Fig. 7.3, Appendix 31), and up to 90%
reduction in the other experiments. This probably, also, indicates the ability of this isolate
to utilise the available long chain fatty acids as sources of carbon and energy for efficient
growth. Possibly attributing to this unique capability is that the Alternaria sp. has a strong
lipase producing enzyme system that has a high degree of specificity for unsaturated fatty
acids in an aqueous system, as sunflower oil is known to constitute significantly large
amounts of unsaturated fatty acids in it (e.g. linoleic acid). Also, lipases reveal their highest
activity at an oil - water interface or areas were a greater exposure of the fatty acid to the
- 146 -
microbe or water is evident (Ratledge, 1994). Owning to this property it is clearly seen that
the Alternaria sp. was able to efficiently grow in the presence of long chain fatty acids in an
aqueous system. However this organism grew poorly on the fatty acid agar plates possibly
due to the lack of an increased surface area of exposure to the fatty acid constituents and
a lack of nutrient diffusion on the fatty acid agar plates. Studies have revealed that among
that the many extracellular lipase producing fungi that have been isolated from sunflower
seed, those belonging to the Alternaria sp. were one of the strongest extracellular lipase
producers (Roberts et al., 1987). The lipase producing system of the isolate from the
Alternaria sp. could also be regarded as been specific, in that little to no growth was
observed on the fatty acid agar plates that separately contained oleic and stearic fatty
acids respectively. Although it can be speculated that the organism was probably capable
of utilising the long chain fatty acids such as linoleic acid which would have been
abundantly available in the edible oil effluent.
Many microorganisms are capable of excreting biosurfactants into the extracellular
medium for the conversion of the water insoluble substrates into sizes of less than 1um,
which can then be easily assimilated by these microbes (i.e. Pseudo - solubilization),
(Alexander, 1999). This phenomenon could also probably attribute largely to the efficiency
of the Alternaria spp. in reducing the FOG component present in the edible oil effluent and
it can probably, also, be considered that lipase production in this fungal isolate is
constitutive, i.e. does not require to be grown on an oil containing medium, prior to
experimentation, to induce lipase producing activities.
Previous studies have shown that the failure of microbes to use long chain fatty acids as a
growth source could be attributed to their insolubility that makes it difficult to metabolise
initially and rather than because of its toxicity. However, growth by some microorganisms
in the presence of long chain fatty acids has been observed when the pH of the growth
medium is maintained between ranges 5.5 and 7. It is considered that the composition of
the growth medium, its pH, chain length of the fatty acid and the inhibitory concentration of
the fatty acids in the aqueous growth medium largely determines the microbial utilisation
or breakdown of the fatty acid component (Ratledge, 1994). Considering the above-
mentioned properties and the differing FOG removal capabilities of all the fungal isolates,
it can be suggested that FOG removal is likely to be affected by substrate specificity of the
- 147 -
induced extra-cellular lipase, the physical and chemical characteristics of the substrate
and the pH of the culture medium.
Many fungi belonging to the Mucor spp. have strong lipolytic activity when grown in the
presence of triglyceride components, or oils, as an organic substrate (Akhtar et al., 1980).
Reports have also shown that the extracellular lipase produced by the Mucor spp. is both
constitutive and inducible, though the nature of the triglyceride inducing the lipase is
specifically inhibited by its hydrolysis products (Nagaoka et al., 1969). Lipase productivity
by fungi belonging to the Mucor spp. depends largely upon prevailing culture conditions
such as pH and temperature of the growth environment. The optimum pH range of pH 6 to
pH 8 is considered essential for lipase excretion by this fungal genus. Also significant
lipolytic activity has been evident at pH 5 provided that the required substrate is available
(Lazar and Schröder, 1992). Studies show that a pH of 8 has appeared to favour both
emulsification of sunflower oil and it’s cleavage by fungal lipase activity for utilisation for
cell growth and production of fungal lipids (Jeffery et al., 1999). This activity probably
explains the high FOG removal rates observed in some of the experiments, where FOG
removal rates ranged from 74% to 80% for both the Mucor spp. Enhanced sunflower oil
degradation was observed in other studies by the those belonging to the Mucor spp. in the
presence of increasing pH’s and adequate biomass formation (Jeffery et al., 1999).
Considering the above properties, it is evident that excellent lipase production (i.e. shown
by an 89% reduction in the FOG content in the edible oil effluent) was observed at a pH of
5 at 31oC by both Mucor spp. Significant FOG removal was also observed as the pH
parameters were increased from pH 5 to pH 8.
Among various physical, chemical and biological factors that influence microbial growth
and destruction of the organic pollutant, essential nutrient availability, aeration, pH and
temperature are considered of the utmost performance for efficient degradation. Oil
degradation is considered strongly temperature dependant and both growth and
degradation rates increase with an increase in temperature (Alexander, 1999). Rapid COD
and FOG removal rates were observed at a temperature of 31oC when compared to the
removal rates observed at a temperature of 21oC. However, Mucor spp. 1 showed lower
COD and FOG removal rates at a pH of 8 at 31oC (Appendix 31) possibly due to the
temperatures been too sensitive for efficient growth. Extremes of alkalinity or acidity tend

- 148 -
to decline microbial growth and lipolytic activity (Ratledge, 1994), however it was observed
that both the varying pH and temperature parameters did largely affect the overall
performance of the Alternaria spp. Also, better COD and FOG removal rates were
observed at pH’s of 8 than pH’s of 7 pertaining to both Mucor spp, hence showing the
ability of these isolates to grow and have exhibit increased levels of lipolytic activity at this
highly alkaline condition.
Although many microbes are frequently the major and occasionally the sole means for
degradation of a particular compound, the absence of a microorganism often does result in
the partial disappearance or breakdown of the compound or substance rather slowly over
a period of time (Alexander, 1999). This phenomenon was observed in all the controls (i.e.
uninoculated flasks) that were also subjected to the varying pH and temperature
parameters. This was observed by slow declining COD and FOG removal rates.
7.3.4 Conclusions
It can be concluded from this study that different fungi (i.e. specifically moulds) have
different patterns of lipolytic activity and that lipase production by these fungal isolates
were largely influenced by varying pH and temperature parameters. Also, differences in
FOG hydrolysis could be attributed to differences in the substrate specificity of the
extracellular lipases produced by the isolates. The use of the Alternaria spp. to breakdown
the long chain fatty acids in the sunflower oil effluent seems to be best option as it
performed more efficiently and effectively then both Mucor spp. It can be concluded that
the parameters of 31oC and pH 5 offers the best controlled conditions for the removal of
the FOG constituents in an edible oil effluent, which was shown by a 90% FOG removal
rate by the Alternaria spp. and 89% removal rates by both Mucor species. Lastly it can be
concluded that lipase activity in both the Mucor spp. are non-specific and those produced
by the Alternaria spp. can be considered specific and lipase production by all the isolates
can be considered constitutive.

- 149 -
CHAPTER 8
GENERAL CONCLUSIONS AND RECOMMENDATIONS
8.1 CONCLUSIONS
- Bench scale activated sludge treatment process has shown that balancing of the
TKN/COD ratio, P/COD ratio and RBCOD/Sti ratios of the influent facilitated
favorable biological remediation of the oil effluent.
- Good COD and FOG removal rates were obtained using the bench scale process.
- Phosphorus removal capacity of the biomass was good. The possible limit in
phosphorus removal of the process could be attributed to the limited availability of
RBCOD.
- Findings have shown that Prefermentation served to increase VFA production
thereby enhancing biological phosphorus removal.
- Using anaerobic digestion technology to evaluate edible oil effluent treatment the
following was concluded:
o The use of barium chloride to reduce the sulphate content in edible oil effluent
was effective
o Anaerobic toxicity studies showed that the maximum influent COD that could
be treated successfully was 2000 mg/L.
o Anaerobic digestion using fed-batch configuration can achieve 30%
biodegradation of COD present in edible oil effluent.
o The experiments showed that ABR configuration was unsuitable for anaerobic
digestion.
- Current research findings conclusively showed that in order for edible oil effluent to
be successfully treated biological, pretreatment is essential.
- Comparison of a variety of pretreatment methods showed that chemical coagulation
and flocculation with C40 proved to be the most effective pretreatment method for
edible oil treatment.
- Comparison in costs to dispose of the various effluents by Durban Metro
Wastewater, showed that the biologically treated edible oil effluent will be the
cheapest to dispose of costing R0.50/kL, while the raw effluent and flocculated
effluent will cost R23.88/kL and R3.84/kL respectively.

- 150 -
- Findings from investigations on using monocultures of yeast, bacteria and fungi
showed that pH and temperature impacts on the organisms’ ability to utilize the
organic content.
- When comparing the degradative capabilities of the individual monocultures to
activated sludge to treat the oil effluent, findings show that activated sludge
treatment process would be a method of choice.
- Up-scaling of the aerobic treatment process from bench scale to a larger laboratory
scale activated sludge treatment process focusing on organic removal only
presented the following findings:
o Due to the high FOG content of the edible oil effluent, successful biological
treatment using activated sludge necessitated pretreatment with C40
(commercial flocculent), which presented the best results.
o The activated sludge showed successful removal of COD from the effluent
with the maximum concentration removed of 1550 mg/L and percentage
removed was greater than 80% at steady state.
o However, fluctuation of process performance with regards to process COD
removal efficiencies could undoubtedly be attributed to the variability of the
organic strength of the effluent from industry and regular disruptions in supply.
o The F/M ratio varied and ranged from 0.27 to 1.33 mg COD/mg MLSS.d
during the phases and the system responded accordingly.
o More than 90% of the influent COD was biodegradable.
8.2 RECOMMENDATIONS
- Conventional pretreatment technology for wastewater treatment in the edible oil
sector has been limited to the use of ferric chloride, alum, and other polyelectrolytes
and more commonly used is DAF. Future studies should focus on the chemical
characterization of the commercial flocculent C40 to further reduce the cost and
enhance accessibility. The successful application of C40 will support the premise
that large scale application on site at the industry will be comparatively more
efficient, cheaper and most important it requires far less space than DAF and
therefore more practically.

- 151 -
- Pretreatment technology complimented activated sludge treatment and can be used
in combination for the treatment of high FOG edible oil effluents.
- An alternate approach to biological treatment could involve primary treatment of the
effluent by anaerobic digestion followed by aerobic treatment as a polishing step.
However this approach would require more space and therefore not as favorable as
combined pretreatment with activated sludge.
- The sludge that is produced from the pretreatment process comprises a mixture of
coagulant and edible FOG that could be used as a supplement to animal feed, thus
further minimizing waste production and generating income.
- Parallel investigations showed that the raw effluent comprised of valuable essential
oils that could be extracted and purified for commercial purposes. (Results not
presented in current investigation).
- Future research will include constructing a mass balance, to distinguish whether the
biomass in solution is indeed degrading the effluent, or whether the effluent is
merely adhering to the surface of the activated sludge flocs and vessel walls

- 152 -
REFERENCES
Akhtar, M.W., Mirza, A. Q. Chughtai, M.I.D. (1980) Lipase Induction in Mucor hiemalis. Applied and Environmental Microbiology. 257 –263.
Alexander, M. (1999) Biodegradation and Bioremediation (2nd ed). Academic Press: USA. Anke, T. (1997). Fungal Biotechnology. Germany: Chapman & Hall GmbH. Arce Systems. (2000). Overview of the Peroxone Process. [online] Accessed from
http://www/arcesuste.com/products/peroxone/peroxone.htm (Accessed on 29 March 2001).
Atkinson, B. W. (1999) Identification of Polyphosphate accumulating bacteria from pilot and full-
scale nutrient removal activated sludge. Masters dissertation: Biotechnology. Technikon Natal, Durban.
Atlas, R. M. and Bartha, R. (1993) Microbial Ecology Fundamental and Application ( 3rd ed),
New York, Benjamin/Cummings Publishing. Comp. Inc. Bachmann, A., Beard, V.L. and McCarthy, P.L. (1985). Performance characteristics of the
anaerobic baffled reactor. Water Research. Vol 19(1). pp 99-106. Bannister, S. S. and Pretorius, W. A. (1998) Optimization of Primary Sludge Acidogenic
Fermentation for Biological Nutrient Removal. Water SA. Vol 24(1). pp 35 - 41. Barber, W.P. and Stuckey, D.C. (1998). The influence of start-up strategies on the performance
of the anaerobic baffled reactor. Environmental Technology. Vol 19. pp 489-501. Barnett, J. A., Payne, R. W. and Yarrow, D. (1990). Yeasts: Characteristics and identification.
2nd ed. Bath Press: Great Britain. Bdjanovic. D., van Loosdrecht, M. C. M., Hooijmans, C. M., Mino, T., Alaerts, G. J. and Heijnen,
J. J. (1997). Bioassay for glycogen determination in biological phosphorus removal systems. In: Proceedings of the 2nd International Conference on Microorganisms in Activated Sludge and Biofilm Processes, July 21 - 23, Berkley, California, USAA, pp 335 - 342.
Bitton, G. (1994). Waste Water Microbiology. USA: John Wiley-Liss. Blitz, J. (1963). Fundamentals of Ultrasonics. Butterworths: London. Bolitho, V. N. (1976). Controlling the access of nutrients from point and diffused sources with
special reference to the Pretoria/Witwatersrand/Vereeniging region. Water SA. Vol 2(4) pp 145 - 149.
Boyer, M. J. (1996). Environmental impact and waste management. In: Hui, Y. H. (ed) Bailey’s
Industrial oil and fat products, Vol. 4. John Wiley & Sons, New York.

- 153 -
Buchan, L. (1983). Possible biological mechanism of phosphorus removal. Water Science and Technology. Vol 15. pp 87 - 103.
Buchan, L. (1981). The location and nature of accumulated phosphorus in seven sludges from
activated sludge plants which exhibited enhanced phosphorus removal. Water SA. Vol 7. pp 1 - 7.
Bulock, J. and Kristiansen, B (eds).(1987. Basic Biotechnology. California: Jovanovich
Publishers. Callander, I.J. and Barford, J.P. (1983). Recent advances in anaerobic digestion technology,
Process Biochemistry. pp 24-30. Casey, T. G., Ekama, G. A., Wentzel, M. C. and Marais GvR. (1995). Filamentous organism
bulking in nutrient removal activated sludge system. Paper 1: Rhetorical overview of cause and control. Water SA. Vol 21(3) pp 231 - 238.
Chutter, F. M. (1990). Evaluation of the impact of the 1mgP/L phosphate P standard on the
water quality and trophic status of Hartbeespoort Dam. Water Sewage and Effluent. Vol 10(1) pp 29 - 33.
Comeau, Y., Oldham, W. K. and Hall K. J. (1986). Dynamics of carbon reserves in biological
dephosphatation of wastewater. In: R. Ramadori (Ed) “Biological phosphate removal from wastewaters “, Advances in Water Pollution Control 4,. Pergamon Press, Oxford, pp 39 - 55.
Dalzel, J. M. (1994. Food industry and the environment. Practical issues and cost implications.
Blackie Academic and Professional. London: UK. Danesh, S. and Oleszkiewicz, J. A. (1997) Volatile fatty acid production and uptake in biological
nutrient removal systems with process separation. Water Environment Research. Vol 69(6) pp 1106 - 1111.
Department of Water Affairs and Forestry. (1997). White paper on water policy. Accessed from
http://www.policy.org.za/govt/white-papers/water.htm Department of Water Affairs. (1986). Management of the Water Resources of the Republic of
South Africa. CTP Book Printers, Cape Town, South Africa Dillon, P. J. and Molot, L. A. (1996). Long term phosphorus budgets and an examination of
the steady state mass balance model for central Ontario lakes. Water Res. Vol 20(10) pp 2273 - 2280.
Dirkgroup. (2000). Dirk Power Ultrasound. [online] Accessed from
http://www.dirkgroup.com/ustrrasound.htm (Accessed on 2 April 2001). Dold, L. P., Wentzel, M. C., Billing, A. E., Ekama, G. A. and Marais, GvR. (1991). Activated
sludge simulation programs. Published by: Water Research Commission, P. O. Box 824, Pretoria, 0001, South Africa.

- 154 -
Droste, R. L. (1997). Theory and Practice of water and wastewater. John Wiley and Sons inc. Dueholm, T. E., Andreasen, K. H. and Nielsen, P. H. (2001). Transformation of lipid inactivated
sludge, Water Science and Technology. Vol 43(1). pp 165 - 172. Edzwald, J. K. (1995). Principles and applications of dissolved air flotation. Water Science and
Technology. Vol 31(3 - 4) pp 59 - 62. Ekama, G. A. and Wentzel, M. C. (1997). Denitrification kinetics in biological N & P removal
activated sludge systems for biological treating municipal wastewaters. Journees Internationales’d Etude du Cebedeau, Liege, Palais des Congre’s 22 -23 May, 1997.
Ekama, G. A. and Marsis, GvR. (1984). Influence of wastewater characteristics on process
design. In: Wiechers, HNS, Ekama, GA, Gerber, GFP, Deay, GF, Malan, W, Marais, GvR, Osborn, DW, Pitman, AR, Potgieter, Djj and Pretorious, WA (eds). Theory, Design and Operation of Nutrient Removal Activated Sludge Processes. Water Research Commission: Pretoria, South Africa. pp 3.1 - 3.10.
Ekama, G. A., Marais, GvR. and Siebritz, I. P. (1984). Biological excess phosphorus removal.
In: Wiechers, HNS, Ekama, GA, Gerber, GFP, Deay, GF, Malan, W, Marais, GvR, Osborn, DW, Pitman, AR, Potgieter, Djj and Pretorious, WA (eds). Theory, Design and Operation of Nutrient Removal Activated Sludge Processes. Water Research Commission: Pretoria, South Africa.
Encyclopedia Britannica (15th ed) (1983). v 18; pp 840 - 843. Encyclopedia Britannica:
Chicago. Eroglu, V., Ozturk, I., San, H.A. and Demir, I. (1990). Comparative evaluation of treatment of
alternatives for wastewaters from edible oil industry. Water Science and Technology. Vol 22(9). pp 225-234.
Faust, C. B. (1995). Modern Chemical Techniques. The Royal Society of Chemistry: London. Forster, C. S. (1992). Oils, fats and greases in wastewater treatment. Journal of Chemical Tech.
And Biotech: International Journal of Biotechnology and Chemical Processes: 402 - 404. Fuhs, G. W. and Chen, M. (1975). Microbiological basis of phosphate removal in the activated
sludge process for the treatment of wastewater. Microb. Ecol. Vol 2. pp 119 - 138. Government Gazette (1984). Requirements for the purification of wastewater or effluent.
Government Gazette. Vol 227(991) pp12 - 17. Grant, P. E. (1980). Treatment of fatty effluents. In: Food Industry Wastes: Disposal and
Recovery. Herzka, A. and Booth, R. G. (Ed) Applied Science Publishers. London and New Jersey.
Hamdi, M. (1991). Effects of agitation and pretreatment on the batch anaerobic digestion of
olive mill wastewater. Bioresource Technology. Vol 36(2). pp 173-178.

- 155 -
Hesby, J. C. (1998) Oxidation and Disinfection. In: American Water Works Association. Water treatment and plant design. McGraw-Hill, Inc:USA.
Hilton, M G. and Oleszkiewicz, J. A. (1989). Sulphide-induced inhibition of anaerobic digestion.
Journal of Environmental Engineering. 114 pp 1377 – 1391. Horan, N.J. (1990). Biological Wastewater Treatment Systems: Theory and Operation. USA:
John Wiley and sons. Hui, Y. H. (1996a). Baileys Industrial Oil and Fat Products Edible oil and fats products
Processing Technology (5 th ed), (vol 2), New York, John Wiley and Sons Inc Hui, Y. H. (1996b). Baileys Industrial Oil and Fat Products Edible oil and fats products
Processing Technology (5 th ed), (vol 1), New York, John Wiley and Sons Inc. Jeffery, J. Kock, J.L. Du Preez, J.C. Bareetseng, A.S. Coetzee, D.J. Botes, P.J. Botha, A.
Schewe T. and Nigam, S. (1999). Effect of Acetate and pH on Sunflower Oil Assimilation by Mucor circinelloides f. circinelloides. Systematic and Applied Microbiology. Vol 22. pp156 –160.
Joska, M. A. and Bolton, J. (1994). Preliminary investigation into algal weeds in inland waters.
Water Res. Report No. 426/1-94. Kiely, G. (1997). Environmental Engineering. McGraw-Hill Inc: London. Kloos, S. D. (2000). A Discussion on ozone Chemistry [online] Accessed from
http://www.osminics.com/products/page/ 965.htm Kuba, T., Smolder, G. van Loosdtecht, M. C. M. and Heijnen, J. J. (1993) Biological phosphorus
removal from wastewater by anaerobic - anoxic sequencing batch reactor. Water Science and Technology. Vol 27(5-6) pp241 - 252
Lazar, G. and Schröder, F.R (1992). Degradation of Lipids by Fungi. In: Microbial Degradation
of Natural Products, New York: VCH Publishers, Inc. pp. 268 –290. Leahy, J. G. and Colwell, R. R. (1990). Microbial Degradation of hydrocarbons in the
Environment: Microbial Rev. Vol 54 (3). pp 305 - 315. Letterman, R. D., Amirtharoja, A and O’ Melia, C. R. (1999). Coagulation and Flocculation. In:
Letterman R. D. (ed) Water Quality and Treatment. McGraw-Hill Inc: USA. Lilley, I.D., Pybus, P. J. and Power, S. P. B. (1997). Operating manual for Biological Nutrient
Removal in Wastewater Treatment. Report no: T.T. 83/97. Water Research Commission. Pretoria: South Africa.
Loots, P. A., Ollermann, R. A., Pearce, K. and Saayman, G. B. (1994). Pilot studies on phosphate crystallization in biological wastewater treatment systems. WRC Report No. 366/1/94.

- 156 -
Lötter, L. H. and Murphy, M. (1985). The identification of heterotrophic bacteria in an activated sludge plant with particular reference to polyphosphate accumulation. Water SA. Vol 11(4) pp 179 - 184.
McCarthy , P. L. and McKinney, R.E.( 1961). Volatile Acid Toxicity in Anaerobic Digestion.
Water Pollution Control Federation. Vol 33(3). pp 223-232. McCarthy, P. L. (1964). Anaerobic waste treatment fundamentals. Public Works. Vol 95. pp
107-112. McDermott, G. N. (1982). Environmental aspects of animal and vegetable oil processing. In:
Baileys Industrial Oils and Fat Products. Vol 2. Swern, D. (ed), Wiley: New York pp 527 - 586.
McGhee, T. J. (1991) Water Supply and Sewerage (6th ed). McGraw-Hill, Inc: Singapore. Metcalf and Eddy. (1991). Wastewater engineering: Treatment, disposal and reuse. 3rd ed.
McGraw-Hill, Inc: NY Mino, T., van Loosdtecht, M. C. and Heijnen, J. J. (1998). Microbiology and biochemistry of the
enhanced biological phosphate removal process. Water Res. Vol 32(11) pp 3193 - 3207. Mkhize, S. P. and Bux, F. (2001). Assessment of activated sludge to remediate edible oil
effluent. South Africa Journal of Science. Vol 97. pp 380 - 382. Mkhize, S. P., Atkinson, B. W. and Bux, F. (2000). Evaluation of a laboratory-scale biological
process for the treatment of edible oil effluent. Water SA. Vol 26(4) pp 555 - 558. Mkhize, S. P. (2002). Assessment of a biological nutrient removal process for remediation of
edible oil effluent. Masters dissertation – Technikon Natal pp 113. Munch, V. E. (2000). Prefermenter Technology Book. Accessed from www.scitravel.com
(Accessed on 28:01:2000). Nachaiyasit, S. and Stuckey, D.C. (1995). Microbial response to environmental changes in an
Anaerobic Baffled Reactor (ABR). Antonie van Leeuwenhoek. Vol 67. pp 111-123. Nachaiyasit, S. and Stuckey, D.C. (1997a). The effect of shock loads on the performance of an
Anaerobic Baffled Reactor (ABR).1. Step changes in feed concentration at constant retention time. Water Research. Vol 31(11). pp 2737-2746.
Nachaiyasit, S. and Stuckey, D.C. (1997b). The effect of shock loads on the performance of an
Anaerobic Baffled Reactor (ABR). 2. Step and transient hydraulic shocks at constant feed strength. Water Research. Vol 31(11). pp 2747-2754.
Nagaoka, K. Yamada, Y. Koaze, Y. (1969) Production of Lipases with a newly Isolated Mucor
sp. Agricultural and biological chemistry. Vol. 33(3). 299 – 305.

- 157 -
Novotny, G. (1998). Wastewater characterisation for evaluation of biological phosphorus removal wastewater fraction. Accessed from http://www.dnr.state.wi.us/org/water/wm/ww/biophos/3frac/htm
Orhon, D., Tasli, R. and Sozen, S. (1999). Experimental Basis of Activated Sludge. Treatment
for Industrial Wastewaters - The State of the art. Water Science and Technology. Vol 4(1). Elsevier Science Ltd: Britain pp 1 - 11.
Orhon, D. and Artan, N. (1994). Energetics of microbial processes. In: Orhon, D. and Artan, N.
(eds) Modeling of Activated Sludge Systems. Technomic Publishing Company, Pennsylvania, USA. pp 39 - 110.
Owen, W.F., Stuckey, D.C., Healy, J. B., Young, L.Y.jr. and McCarthy, P. L. (1979). Bioassay
for monitoring biochemical methane potential and anaerobic toxicity. Water Research. Vol 13. pp 485-492.
Ozturk, I., Allison, H. and Eroglu, V. (1990). Pilot and full-scale treatability studies on
wastewaters from an edible oil refining industry. Proceedings of the 44th Purdue Industrial Waste Conference. USA: Lewis Publishers INC.
Parker, H. W. (1975). Wastewater Systems Engineering. Prentice-Hall: New Jersey. Pitman, A. R. (1991). Design considerations for nutrient removal plants. Water Science and
Technology. Vol 20(4-6) pp 51 - 62. Pryor, M. J. and Freese, S. D. (1998). Enhanced Coagulation for the removal of disinfection by-
products precursors. Report to the WRC by Umgeni Water. WRC Report No.. TT 105/98.
Qasim, S. R. (1994). Wastewater Treatment Plants. Planning, Design and Operation.
Technomic Publishing Comp, Inc: USA. Ratledge, C. (1994). Biodegradation of Oils, Fats and Fatty Acids. In: Biochemistry of Microbial
Degradation., The Netherlands: Kluwer Academic Publishers. pp. 89-141. Roberts, R. G., Morrison, W. H. and Robertson, J. A. (1987). Extracellular Lipase Production by
Fungi from Sunflower Seed. Mycologia. Vol 79(2). pp 265 –273. Ross, W.R., Novella, P.H., Pitt, A. J., Lund, P., Thomson, B.A., King, P.B. and Fawcett, K. S.
(1992). Anaerobic Digestion of Wastewater Sludge: Operating Guide, WRC Report No 390.
Rudd, R. T. (1979). The necessity for the promulgation of standards for the limitation of nutrients
in effluents in sensitive areas in South Africa. In: Nutrient Removal from Municipal Effluents, Technology Transfer Seminar, Pretoria, 17th May, 1979.
Rustrian, E., Delgenes, J. P., Bernet, N. and Moletta, R. (1999). Acidogenic activity: Process of
carbon source generation for biological nutrient removal. Water Science and Technology. Vol 40(8) pp25 - 32.

- 158 -
Sacks, J., Buckley, C.A. and Stuckey, D.C. (1998). Treatment of high-strength or toxic effluents in an Anaerobic Baffled Reactor (ABR). WISA Biennial Conference, Cape Town: South Africa. pp A2 30- A2 33.
Sarner, E., Hultman, B.G. and Berglund, A. E. (1988). Anaerobic treatment using new
technology for controlling H2S toxicity. Tappi Journal. pp 41-45. Saw, S. B., Anderson, G. K. and Sanderson, J. A. (1987). Comparison of the anaerobic contact
and packed bed processes for the treatment of edible oil wastewaters. Proceedings of the 41st Industrial Waste Conference, Purdue University. Ann Arbor Science Publishes. Pp 178 – 187.
Schonheit, P., Kristjansson, J. K. and Thauer, R. K. (1982). Kinetic mechanism for the ability of
sulfate reducers to out-compete methanogens for acetate. Archives of Microbiology. Vol 132. pp 285 - 288.
Sedlak, R. (1991). Phosphorus and Nitrogen Removal from Municipal Wastewater Principles
and Practice.(2nd Ed).The Soap and Detergent Association:N.Y Seng, W.C. (1980). Wastewater treatment for edible oil refineries. Journal of the American Oil
Chemists Society. Vol 57(12). pp 926A-928A. Sengul, F. (1990) A case study on sunflower seed oil industries waste characterization,
classification and treatment, Wat. Sci. Tech. Vol 22(9) pp 241 - 248. SGD, ‘What are Yeasts? (2001). [online]. Accessed from http://genome-
www.stanford.edu/Saccharomyces/VL-what_are_yeasts.html. (Accessed on 17 January 2001).
Shelton, D. R. and Tiedjie, J. M. (1984). General method for determining an anaerobic
biodegradation potential. Applied and Environmental Microbiology. Vol 47(4) pp 850 – 857.
Sidat, M., Bux, F. and Kasan, H. C. (1999). Polyphosphate accumulation by bacteria isolated
from activated sludge. Water SA. Vol 25(2). pp 175 - 179. Singer, P. C. and Reckhow, D. A. (1999. Chemical Oxidation. In: Letterman R. D. (ed) Water
Quality and Treatment. McGraw-Hill Inc.:USA. Speece, R.E. (1983). Anaerobic biotechnology for industrial wastewater treatment.
Environmental Science and Technology. Vol 17(9). pp 416A-427A. Speece, R.E. (1996). Anaerobic Biotechnology for Industrial Wastewaters. Tenessee:
Archae Press. Spellman, F. R. (1999). Spellmans Standard Handbook for Wastewater Operators. Vol 12.
Technomic Publishing Company, Inc: USA. Stafford, D.A., Wheatley, B. I. and Hughes, D. E. (eds.). (1980). Anaerobic Digestion. England:
Applied Science Publishers.
- 159 -
Standard Methods for the Examination of Water and Wastewater. (1989). (17th ed). American
Public Health Association: Washington DC. Surujlal, S. (1999). Assessment of Edible Oil Effluent Production. Nat. Dip. Report. Technikon
Natal. Starkenburg W., van Rensink, J. H. and Rijis, G. B. J. (1993). Biological P- removal: State of the
art in Netherlands. Water Science and Technology. Vol 27(5 - 6). pp 317 - 323. Sutton, P. M., Mishra, P. N. and Crawford, P. N. (1994). Combining biological and physical
processes for treatment of oily wastewaters. International biodeterioration and Biodegradation. Vol 33. pp 2 - 21.
Switzenbaum, M.S., Giraldo-Gomez, E. and Hickey, R.F. (1990). Monitoring of the anaerobic
methane fermentation process. Enzyme and Microbial Technology. Vol12. pp 772-730. Treatment of Waste Water. (2000). APTTM:Biological Nutrient Removal From Sewage.
Accessed from www.isr.gov.au/industry/environ/Background/Water/water1.html (Accessed on 21 September 2000).
Wakelin, N.G. and Forster, C.F. (1997). An Investigation into Microbial Removal of Fats, Oils
and Greases. Bioresource Technology. Vol 59(1). pp 37 – 43. Walker, G. M. (1998). Yeast Physiology and Biotechnology, New York, John Wiley and
Sons Ltd. Wentworth, L. (2001). Peroxone. [online] Available from
http://www.technow.org/search/remediatation/RemDetail.cfm?&TechID=332. (Accessed on 14 May 2001).
Wentzel, M. C., Loewenthal, R. E., Ekama, G. A. and Marais, GvR. (1988). Metabolic behavior
of Acinetobacter spp. in enhanced biological phosphorus removal - a biochemical model. Water SA. Vol 12(4). pp 81 - 92.
Wentzel, M. C., Mbewe, A. and Ekama, G. A. (1995). Batch test for measurement of readily
biodegradable COD and active organism concentrations in municipal waste waters. Water SA. Vol 21(2). pp 117 - 124.
Wentzel, M. C., Mbewe, A., Lakay, M. T. and Ekama G. A. (1999). Batch test of the
carbonaceous material in municipal wastewater. Water SA. Vol 25 (3). pp 327 - 335. Wentzel, M .C., Ekama, G. A., Dold, P. L. and Marias, GvR. (1990). Biological excess
phosphorus removal - steady state process design. Water SA. Vol 16. pp 29 - 48. Wentzel, M. C. and Ekama, G. A. (1997). Principles in the design of single sludge activated
sludge systems for biological removal of carbon, nitrogen and phosphorus. Water Environment research. Vol 69(7).

- 160 -
Wentzel, M. C., Loewenthal, R. E., Ekama, G. A. and Marais, GvR. (1986). Metabolic behavior of Acinetobacter spp. in enhanced biological phosphorus removal - a biochemical model. Water SA. Vol 12(4). pp 209 - 224.
Wentzel, M. C. (1992). Phosphorus removal from sewage in activated sludge systems. First
IAWQ Technical Tour Nutrient Removal and Anaerobic Digestion in South Africa. Volume one – Nutrient Removal, 11 - 23 October, 1992.
White, G. C. (1999). Handbook of Chlorination and Alternative Disinfectants (4th ed) John Wiley
and Sons: USA. Winkelmann ,G. ( ed ), (1998) Microbial Degradation of Natural Products, Germany, VCH, pp.
268 - 287. WRC Report. (1989). Water and Wastewater Management in the Edible Oil Industry .Report
No.145:(TT 40/89).Pretoria, South Africa. Zhou, G. and Fang, H H. P. (1998). Competition between methanogenesis and
sulfideogenesis on anaerobic wastewater treatment. The Water Institute of Southern Africa Biennial Conference and Exhibition. pp 1 - 8.

- 161 -
APPENDICES
APPENDIX 1: VOLATILE FATTY ACID DETERMINATION
Equipment:
3 10 mL centrifuge tube with caps
4 2 mL vials with caps
5 1 mL pipette
6 Pasteur pipettes
7 Gas chromatograph (GC) (Pye Unican 4 500)
8 Centrifuge
Reagents:
9 Di-Ethyl Ether
10 98% Sulphuric acid
Preparation of samples:
11 1 mL of sample was pipetted in to a 10 mL centrifuge tube
12 2 mL of Di-ethyl ether was added
13 3 drops of sulphuric acid was added for preservation of samples
14 the sample was then centrifuged at 2000 rpm for 3 min
15 the di-ethyl ether layer was then pipetted in to a 2 mL vial and stored in the fridge until
use.
Gas Chromatography configurations
- Gas Flows - Hydrogen Gas 30 mL/min @ 86.161 kPa
- Nitrogen Gas 80 mL/min @ 103.393 kPa
- Air 136.4 mL/min @ 68.929 kPa
- Column Type: SP 100, using Flame Ionization Detector (FID)
- Column Temperature: 120C
- Injector and Detector Temperature: 200C

- 162 -
APPENDIX 2: ALKALINITY AS CaCO3 DETERMINATION
INTRODUCTION
The methods for the determination of alkalinity in natural or treated waters are also used for
wastewaters. Although methods for the relative proportions of hydroxide, carbonate and
hydrogen carbonate alkalinity are given, they are rarely required in the case of wastewaters.
Colour and turbidity in the sample make use of indicators difficult or impossible, hence the
simplest alternative is to use an electrometric method.
Principle of method:
The alkalinity of natural or treated waters is usually due to the presence of hydrogen carbonate,
carbonate and hydroxide compounds of calcium, magnesium, sodium and potassium. The total
alkalinity is determined by titration of the sample to the end-point of a suitable indicator having a
colour change at pH 4.5 titration to an end-product of pH 8.3 determines approximately the
alkalinity contributed by hydroxide and half of carbonate present (pH 8.3 is approximately that of
a dilute hydrogen carbonate solution). The use of these two titrations enables an approximate
calculation to be made of the concentrations of the three forms of alkalinity.
Method:
The samples were analysed in duplicate. 100 mL of filtered sample was placed in a conical
flask. The conical flask was placed over a white surface. 3 drops of phenolphthalein indicator
were added to the solution. The pink sample was titrated with 0.1 N sulphuric acid solution to a
colorless end-point. Few drops of methyl orange indicator were added to the solution. The
yellow colored solution was titrated with the standard acid until the first perceptible colour
change towards orange was achieved.
Calculation of results:
Alkalinity for 100 mL sample as mg CaCO3/L = Volume of 0.1 N sulphuric acid (mL) x 50.
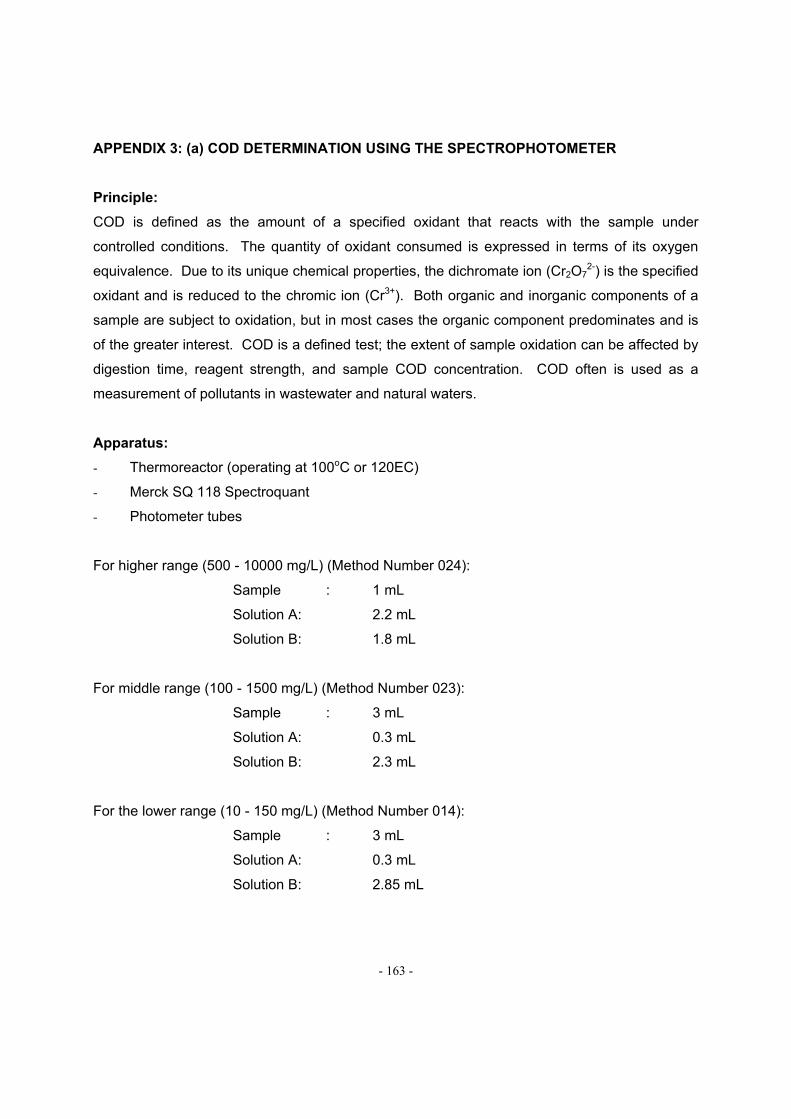
- 163 -
APPENDIX 3: (a) COD DETERMINATION USING THE SPECTROPHOTOMETER
Principle:
COD is defined as the amount of a specified oxidant that reacts with the sample under
controlled conditions. The quantity of oxidant consumed is expressed in terms of its oxygen
equivalence. Due to its unique chemical properties, the dichromate ion (Cr2O72-) is the specified
oxidant and is reduced to the chromic ion (Cr3+). Both organic and inorganic components of a
sample are subject to oxidation, but in most cases the organic component predominates and is
of the greater interest. COD is a defined test; the extent of sample oxidation can be affected by
digestion time, reagent strength, and sample COD concentration. COD often is used as a
measurement of pollutants in wastewater and natural waters.
Apparatus:
- Thermoreactor (operating at 100oC or 120EC)
- Merck SQ 118 Spectroquant
- Photometer tubes
For higher range (500 - 10000 mg/L) (Method Number 024):
Sample : 1 mL
Solution A: 2.2 mL
Solution B: 1.8 mL
For middle range (100 - 1500 mg/L) (Method Number 023):
Sample : 3 mL
Solution A: 0.3 mL
Solution B: 2.3 mL
For the lower range (10 - 150 mg/L) (Method Number 014):
Sample : 3 mL
Solution A: 0.3 mL
Solution B: 2.85 mL
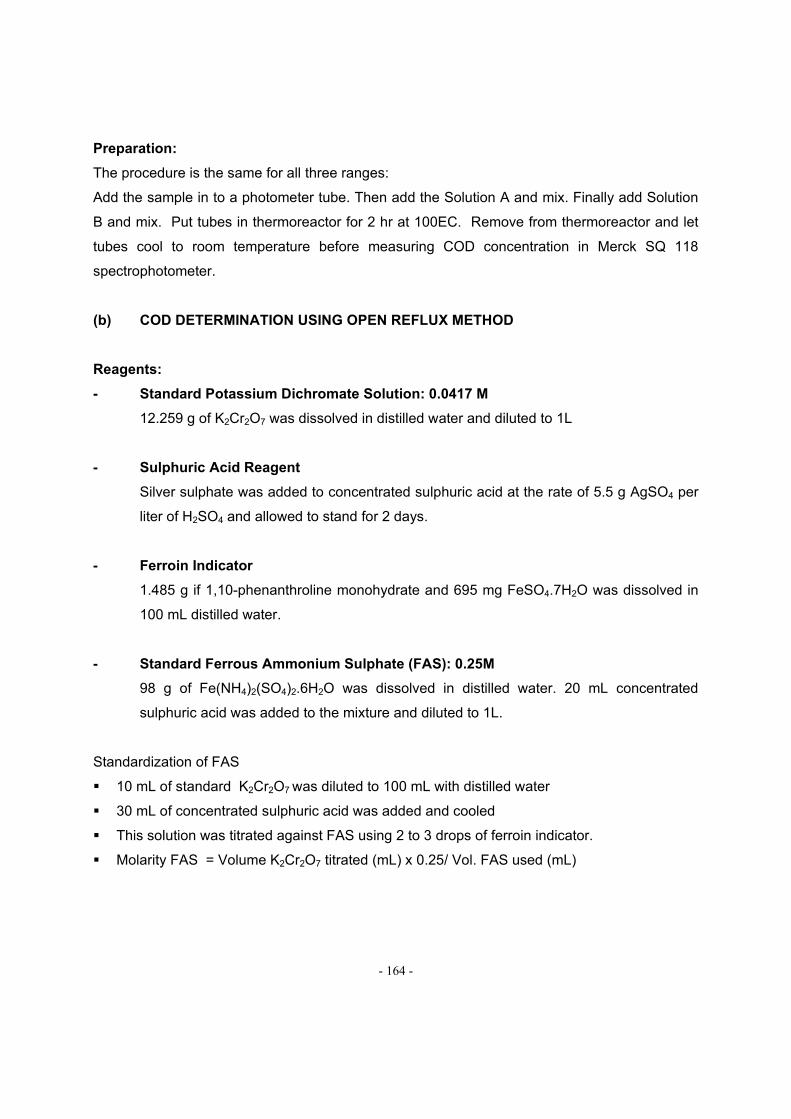
- 164 -
Preparation:
The procedure is the same for all three ranges:
Add the sample in to a photometer tube. Then add the Solution A and mix. Finally add Solution
B and mix. Put tubes in thermoreactor for 2 hr at 100EC. Remove from thermoreactor and let
tubes cool to room temperature before measuring COD concentration in Merck SQ 118
spectrophotometer.
(b) COD DETERMINATION USING OPEN REFLUX METHOD
Reagents:
- Standard Potassium Dichromate Solution: 0.0417 M
12.259 g of K2Cr2O7 was dissolved in distilled water and diluted to 1L
- Sulphuric Acid Reagent
Silver sulphate was added to concentrated sulphuric acid at the rate of 5.5 g AgSO4 per
liter of H2SO4 and allowed to stand for 2 days.
- Ferroin Indicator
1.485 g if 1,10-phenanthroline monohydrate and 695 mg FeSO4.7H2O was dissolved in
100 mL distilled water.
- Standard Ferrous Ammonium Sulphate (FAS): 0.25M
98 g of Fe(NH4)2(SO4)2.6H2O was dissolved in distilled water. 20 mL concentrated
sulphuric acid was added to the mixture and diluted to 1L.
Standardization of FAS
10 mL of standard K2Cr2O7 was diluted to 100 mL with distilled water
30 mL of concentrated sulphuric acid was added and cooled
This solution was titrated against FAS using 2 to 3 drops of ferroin indicator.
Molarity FAS = Volume K2Cr2O7 titrated (mL) x 0.25/ Vol. FAS used (mL)

- 165 -
- Mercuric Sulphate
HgSO4 crystals or powder
- Potassium Hydrogen Phthalate (KHP)
425 mg of KHP was dissolved in distilled water and diluted to 1L. KHP has a theoretical
COD of 1.176 mg O2/mL and this solution has a theoretical COD of 500g O2/mL.
Procedure
Samples with COD > 50 mg O2/mL sample were used and those with COD > 900 mg O2/L
smaller sample volumes were used and diluted to 50 mL.
Samples were placed in 500 mL refluxing flasks and 1 g of HgSO4, glass beads and 5 mL
sulphuric acid reagent added.
Samples were cooled to prevent loss of volatile materials
25 mL of K2Cr2O7 solution was added. The flask was attached to a condenser and cooling
water turned on.
The remaining sulphuric acid reagent (70 mL) was added through the open end of the
condenser.
The open end of the condenser was covered and the sample refluxed for 2 hr.
Thereafter, the condenser was disconnected and the sample cooled to room temperature.
Excess K2Cr2O7 was titrated against FAS using Ferroin indicator
The endpoint of the titration was taken as the first sharp colour change from blue-green to
reddish brown.
- 166 -
APPENDIX 4: ORTHO-PHOSPHATE (PO4-P) DETERMINATION
INTRODUCTION
Phosphate in water and wastewater may be present in two main forms: the organically bound
phosphate, and the inorganic phosphate. The inorganic phosphate is further divided into two
main forms based on its reactivity and its availability for utilization as a nutrient source by plants.
The polyphosphate which is a polymeric form is inert in water and is not available as a plant
nutrient. Yet the orthophosphate form on the other hand, is readily available in water and
wastewater as a plant nutrient. This is the form of phosphate that needs to be monitored and
controlled to prevent eutrophication of water resources.
Principle of Method:
The sample is mixed with a reagent that reacts with the orthophosphate group in water, which
produces a distinct yellow solution the absorbance of which can be measured using a
spectrophotometer.
Method:
The samples were first diluted with deionised water to a desired concentration range.
Spectroquant analysis method 14842 for 1.0 – 30 mg/L PO4-P using SQ 118 Merck photometer.

- 167 -
APPENDIX 5: TOTAL NITROGEN (TKN) DETERMINATION
INTRODUCTION
Nitrogen in wastewater appears both as oxidized nitrogen and reduces forms. Both the
ammonium (free and saline) and the organic forms are present in wastewater and constitute the
total nitrogen.
Principle of the Method:
The sample is mixed with reagent 1 in the presence of a catalyst. After heating in a thermal
block, the sample is mixed with the second reagent, which results in immediate colour
development. The resultant colored solution is measured using a photometer
Method:
Spectroquant analysis method 14537 for 0.5 – 15 mg/L N using SQ 118 Merck photometer.

- 168 -
APPENDIX 6: FREE AND SALINE AMMONIA (NH4-N)
INTRODUCTION
The free and saline ammonium nitrogen is readily available in wastewater as a plant nutrient
that is responsible for eutrophication phenomenon. Free and saline ammonia may result in
wastewater from biodegradation of organic nitrogen. Hence it is important to determine both
organic and ammonium nitrogen in wastewater in order to control and prevent the mineralization
of water resources.
Principle of the method:
Ammonia is quantitatively separated from other forms of nitrogen in wastewater through sample
distillation under alkaline conditions. The ammonia is then determined colorimetrically after
addition of Nessler’s reagent.
Method:
Spectroquant analysis method, 14739 for 0.01 – 2.0 mg/L NH4-N, using SQ 118 Merck
photometer.

- 169 -
APPENDIX 7: NITRATES (NO3 -N) DETERMINATION
INTRODUCTION
Nitrate is the oxidized form of nitrogen. It is not usually found in domestic wastewater influents.
But industrial wastewater may contain appreciable amount of nitrates that results from the
oxidation of the total nitrogen in wastewater due to chemical processes and harsh
environmental conditions that industrial water may be subjected to during manufacturing and
processing. As a result it is important to test for this form of nitrogen from industrial effluents
although it is not necessary to do the same for domestic wastewater.
Principle of method:
The sample is reacted with a colour-forming reagent in the presence of a strong oxidizing acid.
The resultant colored solution is measured against the blank using a photometer.
Method:
Spectroquant analysis method 14542 for 2.0 – 80 mg/L NO3- using SQ 118 Merck photometer.
- 170 -
APPENDIX 8: SULPHATE (SO42-) DETERMINATION
INTRODUCTION
Sulphate is widely distributed in nature and may be present in natural water in concentrations
ranging from a few to several thousand milligrams per liter. Mine drainage waste and some
selected chemical industrial wastewaters may contribute large amounts of point source sulphate
deposition.
Principle of method:
The sample reacts with Barium chloride at low pH that results in the formation of Barium
sulphate. At high pH excess Barium reacts with Methylthymol blue to produce a chelate. The
uncomplexed Methylthymol blue is gray. The gray uncomplexed Methylthymol blue indicates the
concentration of sulphates.
Method:
The samples were first diluted with deionised water to desired concentration ranges.
Spectroquant analysis method 14564 for 100 – 1000 mg/L SO42- using SQ 118 Merck
photometer.

- 171 -
APPENDIX 9: TOTAL SUSPENDED SOLIDS (TSS) DETERMINATION
Principle:
A well mixed sample is filtered through a weighed standard glass-fiber filter and the residue that
is retained on the filter is dried to a constant weight at 103oC to 105oC. The increase in weight
of the filter represents the total suspended solids (Standard Methods, 1989).
Apparatus:
- Glass Fibre Filters (pore size of 0.45�m)
- Desiccator
- Drying oven, for operation at 103oC to 105oC
- Analytical balance, capable of weighing 0.1mg
- Graduated measuring cylinder
- Filtration apparatus
- Membrane filter apparatus
- Aluminum weighing dish (if not available foil is used)
- Beaker
Procedure:
a) Preparation of glass-fiber filter disk: Insert disk with wrinkled side up in filtration
apparatus. Apply vacuum and wash disk with three successive 20 mL portions of
distilled water. Continue suction until all traces of water is removed, then turn off
vacuum and discard washings. Remove filter from filtration apparatus and place on
aluminum weighing dish. Dry in an oven at 103oC to 105EC for 1 hr. Cool in dessicator
to balance temperature and weigh. Store in dessicator until needed.
b) Sample analysis: Put pre-treated and pre weighed filter in filtering apparatus. Turn
vacuum pump on and add small volume of distilled water to seat filter. Mix sample in
properly beaker and add 50 mL of this to measuring cylinder. Add to filter. Wash filter
with three successive 10 mL volumes of distilled water. Continue suction until all
washings are gone through. Carefully remove filter and place on aluminum weighing

- 172 -
disk and dry in oven at 103oC to 105oC for 1 hr. Cool in dessicator to balance
temperature and weigh.
Calculation:
mg total suspended solids/L = (A - B) x 1000
Sample volume, mL
where: A = weight of filter + dried residue, mg, and
B = weight of filter, mg.
- 173 -
APPENDIX 10: FATS, OILS AND GREASES (FOG) DETERMINATION
Principle:
In the determination of oil and grease, an absolute quantity of a specific substance is not
measured. Instead, groups of substances with similar physical characteristics are determined
quantitatively on the basis of their common solubility in an organic extracting solvent. “Oil and
grease” is defined as any material recovered as a substance soluble in the solvent. It includes
other material extracted by the solvent from an acidified sample and not volatilized during the
test.
Apparatus:
- Separatory funnel
- Bulb or flat bottomed flask
- Funnel
- Filter paper
- Heating mantle
- Distillation unit
- Desiccator
Reagents
- Hydrochloric acid or sulfuric acid, 1:1: mix equal volumes of either acid and distilled water
- n-Hexane, boiling point 69oC
- Sodium sulfate, Na2SO4, anhydrous crystal
Procedure:
A sample volume of 30 mL was used. The sample was acidified with HCl to pH 2 lower. The
sample was then transferred to the separatory funnel. The container where the sample was kept
was rinsed with 30 mL of hexane and added to the separatory funnel. The funnel was shaken
vigorously for 2 min. The layers were allowed to separatory. The bottom layer which was the
sample was drained in to the original container. The top organic layer was drained through a
funnel containing a filter paper and 10 g Na2SO4, both have been solvent rinsed, into a clean,
tared bulb flask. The extraction was done twice more with 30 mL of solvent each time. The
- 174 -
extracts were drained in the tared flask and the filter and Na2SO4 were rinsed with 10 to 20 mL
of solvent. Distillation from flask in a heating mantle was then carried out thereafter. A drip tip
was connected to the end to of distillation apparatus to collect the solvent. When the solvent
condensation came to an end the flask was removed and cooled in a dessicator. The flask was
then weighed.
Calculation:
If the organic solvent is free from residue, the gain in weight of the tared distilling flask is due to
oil and grease.
mg oil and grease/L = (A - B) x 1000
mL sample
where: A = Total gain in weight of tared flask
B = Residue from solvent blank
- 175 -
APPENDIX 11: pH DETERMINATION
Principle:
Measurement of pH is a frequently used test in water chemistry. Almost every phase of water
supply and wastewater treatment, e.g., acid-base neutralisation, water softening, precipitation,
coagulation, disinfection, and corrosion control, is pH-dependant. pH is used in alkalinity and
carbon dioxide measurements and many other acid-base equilibria. At a given temperature the
intensity of the acidic or basic character of a solution is indicated by pH or hydrogen ion activity.
Apparatus:
Beckman 50 pH meter consisting of pH probe and temperature probe
Procedure:
a) Instrument calibration: The pH and Temperature probes were submerged in a pH 4
buffer solution, so as to calibrate the pH to a pH of 4. Both probes were then submerged
in a pH 7 buffer solution, to calibrate the meter to a pH of 7. After each calibration, the
pH and temperature probes were rinsed with distilled water.
Measurement of pH: the pH and temperature probes were place in the sample. The pH button
on the meter pressed. When a fixed reading was obtained, this was regarded as the true pH of
the sample. Both the probes were then rinsed using distilled.

- 176 -
APPENDIX 12: PREPARATION OF THE NUTRIENT MEDIUM ACCORDING TO
OWEN et al., (1979).
The defined nutrient medium containing trace elements, minerals and vitamins were prepared
according Owen et al., (1979). The stock solutions for preparation of the nutrient medium are
presented in Table 12.1 and the method for the preparations is presented in Table 12.2.
Table 12.1: Stock solutions for preparation of mineral salts mediumSTOCK SOLUTION COMPOSITION CONCENTRATION (g/L) S2 Rezazurin 1 S3 (NH4)2HPO4 26.7 S4 CaCl2.2H2O
NH4Cl MgCl2.6H2O KCl MnCl2.4H2O CoCl2.6H2O H3BO3 CuCl2.2H2O Na2MoO4.2H2O ZnCl2
16.7 26.6 120 86.7 1.33 2 0.38 0.18 0.17 0.14
S5 FeCl2.4H2O EDTA
20 20
S6 Cysteine 50 S7 Biotin
Folic acid Pyridoxine HCl Riboflavin Thiamin Nicotinic acid Pantothenic acid Vitamin B12 p-aminobenzoic acid Thiotic acid
0.002 0.002 0.01 0.005 0.005 0.005 0.005 0.0001 0.005 0.005
Table 12.2: Preparation of the defined mineral salts solution STEP METHOD VOLUME (mL) MASS (g) 1 1 L of deionised water was added to a 2 L vessel 2 The following were added:
Stock solution S2 Stock solution S3 Stock solution S4
1.8 5.4 27
3 Deionised water was added up to 1.8 L 4 Boiled for 15 min 5 Cooled to room temperature 6 The following were added:
Stock solution S7 Stock solution S5 Stock solution S6
1.8 1.8 1.8
7 NaHCO3 was added as powder 8.4

- 177 -
APPENDIX 13: MIXED LIQUOR SUSPENDED SOLIDS (MLSS) AND VOLATILE
SUSPENDED SOLIDS (VSS) DETERMINATION
MLSS DETERMINATION
Principle:
MLSS is defined as the total amount of organic and mineral suspended solids contained in the
mixed liquor of the activated sludge reactor. This value offers the system operator a crude
measure of the biomass contained within the process.
Apparatus:
- Centrifuge tubes (50 mL)
- Centrifuge (capable of 3 000 rpm)
- Crucibles
- Drying oven (operating at 103oC to 105oC
- Desiccator
Procedure:
A sample volume of 50 mL was added into a centrifuge tube. Tube was then centrifuged at 3
000 rpm for 6 min. The supernatant was discarded and the sludge pellet was quantitatively
scooped into a pre-weighed crucible. The crucible was placed in the drying oven at 103oC to
105oC and left overnight to dry. After 24 hr it was removed from oven and placed in dessicator.
The cooled crucible was then re-weighed.
Calculation:
mg MLSS/L = (A - B) x 1000
Sample volume, (mL)
where: A = mass of crucible + sludge
B = mass of crucible

- 178 -
VSS DETERMINATION:
Principle:
The residue from the MLSS is ignited to a constant weight at 550oC. The remaining solids
represent the fixed total, dissolved, or suspended solids while the weight lost on ignition is the
volatile solids. The determination is useful in control of wastewater treatment plant operation
because it offers a rough approximation of the amount of organic matter present in the solid
fraction of wastewater, activated sludge, and industrial wastes.
Apparatus:
- Muffle furnace (operating at 550oC)
S Crucible with residue from MLSS determination.
S Desiccator
Procedure:
Once the MLSS determination is complete, the crucible is then place in muffled furnace at
550oC for 1 hr. The crucible is then place in a dessicator and cooled. The crucible is then re-
weighed.
Calculation:
mg VSS/L = (A - B) x 1000
Sample volume, (mL)
where: A = weight of residue + crucible before ignition, mg
B = weight of residue + crucible after ignition, mg.
- 179 -
APPENDIX 14: PREPARATION OF COAGULANTS
Ferric Chloride (Fecl3) Coagulant (Pryor and Freese, 1998)
- 0.2 mL of 43% FeCl3 was pipetted into a 100 mL volumetric flask and was made up to
the 100 mL mark with distilled water.
- When added to an 800 mL effluent sample, 1 mL of the FeCl3 solution yielded 1 mg/L (1
ppm) of FeCl3.
- This solution was prepared fresh whenever required, since occurred causing a color
change from yellow to cloudy orange.
Aluminum Sulphate (Alum)
- 4 mL of 43.7% alum (density – 1.29) was pipetted into a 1000 mL volumetric flask and
was made up to the 1000 mL mark with distilled water.
- When added to an 800 mL effluent sample, 1 mL of the alum solution yielded 2 mg (2
ppm) of alum.
Polymeric coagulants
- The following polymeric coagulants were prepared: dimethyldiallylamonium chloride
(DMDAAC/PAC – Z553D); DMDAAC/PAC – LP526, unblended polyamines/PAC
(PA/PAC – 735) and PA – U5000.
- 0.8 mL of the coagulant was pipetted in to a 1000 mL volumetric flask and was made up
to the 1000 mL mark with distilled water.
- When added to an 800 mL effluent sample, 1 mL of the coagulant solution yielded 1
mg/L (ppm) of coagulant.

- 180 -
APPENDIX 15: IODOMETRIC METHOD I
Preparation of Reagents
Potassium Iodide (KI) Solution
- 20 g of KI crystals were added to a 5 L volumetric flask, which was, subsequently
filled to the mark with distilled water
- Potassium dichromate (K2Cr2O7) solution
- 4.8994 g of anhydrous potassium dichromate was dissolved in distilled water and made
up to the 1 L mark.
- The molarity of the solution was calculated using the following equations:
No. of moles = mass (m)
Molar mass (M) . . . (1)
Molarity = no. moles
Volume (v) . . . (2)
Starch Indicator Solution
- Cold water was added to 5 g of starch to produce a thin paste, which was ground
in a mortar.
- The paste was added to 1 L of boiling distilled water, stirred and allowed to settle
overnight.
- The clear supernatant was collected and used
Sodium Thiosulphate
- 25 g of sodium thiosulphate was added to 1 L of freshly boiled distilled water.
The Standardization of Sodium Thiosulphate using the Dichromate Method
1 mL of concentrated sulphuric acid, 10 mL of K2Cr2O7 and 1 mL KI were added to 80 mL of
distilled water with constant stirring.
the above mixture was allowed to stand for 6 minutes in the dark
this was titrated against sodium thiosulphate, until the yellow color was discharged.

- 181 -
1 mL of starch indicator solution was added and titration continued until the blue color
disappeared
the volume of the titrant was recorded and inserted in to the following equation:
C1 V1 = C2 V2 . . . (3)
Where: C1 and C2 = the concentrations of the sodium thiosulphate and the K2Cr2O7
respectively.
V1 and V2 = the volumes of the sodium thiosulphate and the K2Cr2O7 respectively.
Calculation:
Calculation of the concentration of sodium thiosulphate:
1. Sodium thiosulphate: 25 g in 1 L
2. K2Cr2O7: Mass of sample = 4.8994 g
Molar mass = 294.1846 g/mol
Volume of sample = 1 dm3
Using equation 1: The number of moles of K2Cr2O7 = 1.6654 x 10⁻²
Using equation 2: The molarity of K2Cr2O7 = 0.01666 mol. dm-3
The normality of the K2Cr2O7 = 0.1 N.
3. Concentration of Sodium thiosulphate
Using equation 3: C = 0.1020 N.

- 182 -
Calculation of standard curve:
a. The amount of Na2S2O3 consumed per minute
TIME Na2S2O3 (mL)
1 0.2
2 0.4
3 0.4
4 0.6
5 0.6
6 1.0
7 1.0
8 1.2
9 1.4
10 1.6
b. The amount of ozone consumed per minute
# The results from the previous table were placed in the following equation to
determine the amount of ozone in mg/L consumed in the corresponding minutes.
O3 (consumed) = Volume (Na2S2O3) x 24000 x 0.1020
Vol (sample)
Amount of ozone consumed per minute
TIME OZONE (mg/L)
1 1.224
2 2.448
3 2.448
4 3.672
5 3.672
6 6.12
7 6.12
8 7.344
9 8.568
10 9.792
The above points were used to plot the calibration curve.

- 183 -
TIME (MIN)
0 1 2 3 4 5 6 7 8 9 10
OZ
ON
E (
mg
/mL
)
0
2
4
6
8
10
12
Figure 15.1: Ozone calibration curve

- 184 -
APPENDIX 16: INDIGO COLORIMETRIC METHOD
- Preparation of Reagents
1. Indigo Stock Solution
0.25 mL of concentrated phosphoric acid was added to 125 mL of distilled water in a 250 mL
volumetric flask.
While being stirred, 192 mg of potassium indigo trisulphonate was added
Distilled water was added up to the mark
A 1:100 dilution exhibited an absorbance of 0.2 + 0.010 at 600 nm using an Ultraspec 2000
spectrophotometer.
2. Indigo Reagent
10 mL of indigo stock solution, 1 g of sodium dihydrogen phosphate and 0.7 mL of
phosphoric acid were added to a 100 mL volumetric flask and diluted to the mark with
distilled water.
The Spectrophotometric, Gravimetric Method
10 mL of indigo reagent was added to a 100 mL volumetric flask and diluted to the mark with
distilled water. This was the blank.
The tare weight of a beaker was obtained and 10 mL of indigo reagent was added.
Sample was added to the beaker, until the blue solution turned faint.
The beaker containing the solution was weighed.
The blank and the sample were analysed in 1 cm cells using a UV/Vis spectrophotometer,
Ultraspec 2000, at a wavelength of 600 nm.
Residual ozone was calculated using the following equation:
mg O3/L = (AB x 100) - (AS x VT)
f x VS x b
- 185 -
Where: AB, AS = Absorbance of the blank and sample respectively
VS = Volume of the sample (mL)
= [(Final weight - tare weight) g x 1.0 mL/g] - 10 mL
VT = Total volume of sample + indigo (mL)
= (Final weight - tare weight) g x 1.0 mL/g
b = Path length
f = 0.42
Total ozone consumed was calculated by the following equation:
Total O3 consumed = Amount of O3 added (from calibration curve) - Residual
ozone
3. Use of the Ultrospec 2000
The machine was allowed to self-calibrate
Once calibrated, the required wavelength was chosen by pressing the “wave” button
Distilled water was placed in a 1 cm cell and placed in the first cell of the machine.
This is the reference and therefore, the “ref” button was pressed.
Sample was placed in a quartz cell and the sample button was pressed and the
absorbance measured and recorded.
RESIDUAL OZONE CALCULATION
mg O3/L = [(AB) x 100) - (AS x VT)]
F x VS x b
VT = (final weight - tare) x 1.0 mg/L
= (890.4 g - 504.7) x 1.0 mg/L
= 386.33 mL

- 186 -
VS = [(final weight - tare)g x 1.0 mg/L]
= 386.33mL - 10 mL
= 376.33 mL
b = path length = 1 cm
AB = Abs Blank = 0.336
AS = Abs Sample = 0.036
f = 0.42
mg O3/L = [(AB) x 100) - (AS x VT)]
F x VS x b
= [(0.336 x 100) - (0.036 x 386.33)]
(0.42) (376.33) (1)
= 19.59
158.06
= 0.1246 mg O3/L

- 187 -
APPENDIX 17: THIN LAYER CHROMATOGRAPHY (TLC)
Preparation of Reagents
Mobile Phase
20% ethyl acetate in hexane was prepared by adding 40 mL of ethyl acetate to 160
mL hexane.
Procedure;
Extraction
40 mL of sample was added to a separating funnel
10 mL of hexane was added to the funnel and shaken vigorously
The funnel was held in an upright position with the aid of a bosshead attached to a
clamp.
The layers were allowed to separate.
The top hexane layer was collected and stored in a polyvial while the bottom layer was
discarded.
Plating
A microheamatocrit tube was used to transfer the sample to the TLC plate.
The origin was marked 1 cm away from the bottom of the plate using a pencil. The
sample spots were marked.
The sample was applied and the plate was placed in the tank, which contained
approximately 20 mL of the mobile phase.
The mobile phase was allowed to run until it was approximately 1 cm away from the top
edge of the plate.
The process was then stopped and the solvent front marked.
Detection and Evaluation
The plates were viewed under UV lamp, compounds marked and their intensities
recorded.
Rf and HRf values were calculated in the following way:
Rf = distance sample moved from the origin
Distance solvent front moved from origin
HRf = Rf x 100
- 188 -
APPENDIX 18: ULTRASONICS
Use of a Virtis Virsonic 100
The machine mode was adjusted to continuous.
The probe was placed in a beaker of ice and the output power adjusted until the required
output was achieved
The probe was placed in the sample for the required time.
Use of a Sonnicator Bath
Water was filled in the UMC5 and the sample contained within a glass bottle was placed
inside
The lid was placed on top and the timer set to the required time
The machine was then switched on.

- 189 -
APPENDIX 19: PHASES CONDUCTED DURING LABORATORY SCALE
TREATMENT
Table 19.1 Activity during the phases of the laboratory scale treatment process.
PHASE PERIOD ACTIVITY
1 18/5/00 - 24/5/00
Pilot plant operated as a Phoredox Process for biological nitrogen & phosphorus removal. Effluent was not pre-treated and system failed after five days due to very high FOG loading (approximately 8 200 mg/L)
2 25/5/00 - 05/6/00
Due to high FOG, an efficient pre-treatment protocol was developed and optimized. The pilot plant was operated as Phoredox process. Although, the FOG was low, the phosphorus removal capacity was poor and COD removal efficiency decreased. Process was terminated.
3 06/6/00 - 21/7/00
Refinery process was changed, i.e. citric acid was used instead phosphoric acid. Therefore the effluent contained minimal amount of phosphorus and there was no need for nutrient removal. The process configuration was changed to facilitate carbon removal only. In order to maintain the biological integrity of the system the effluent was supplemented with nitrogen and phosphorus. However an erroneous setting of the dissolved oxygen meter i.e. limit 6 mg02/L instead of 5 mg 02/L. This resulted in a bulking problem and subsequent loss of MLSS and poor overall COD removal efficiency. Influent COD concentration was maintained at 500 mg/L.
21/5/00 - 27/ 5/00 The process was shut down completely and completely and the system including tubing was cleaned thoroughly
4 A 28/7/00 - 16/9/00
The process was restarted with fresh Darvill seed inoculum. The MLSS was 2546 mg/L. The sludge age was maintained at 16 days. The COD of the influent feed was increased to 800 mg/L. The free and saline ammonia (FSA) concentration in the effluent was high. In order to solve the latter problem, the feed supplementation ratio was changed from 100:10:1 to 100:5:1 (C:N:P). In addition, the system configuration was also changed to introduce an anoxic zone and the process was operated as a modified MLE process. Sustaining constant influent feed concentration was problematic due to precipitation caused by resident flocculent in the feed tank and variation amongst the different batches of effluent collected. Therefore in order to determine the efficiency of the process, COD removal rates were reflected as percentages (result section). The pH was maintained at pH ± 7.
4 B – 4F 17/9/00 - 02/2/01
Process remained as an MLE configuration. The influent COD increased to approximately 1200 mg/L. The MLSS was set at 3500 mg/L. On the 21/10/00, there was a shut down of the refinery process at the industry and subsequently there was no supply of feed influent. The final effluent had to be recycled and served as influent in order to sustain the system. The effluent supply normalized on 3/11/00 On 01/12/00 the effluent feed concentration was increased to approximately 1500 mg/L. On 12/12/00 the influent concentration was increased to approximately 1800 mg/L. However, it was difficult to maintain exact influent feed concentration (reasons mentioned previously) There was a disruption in influent supply for 1 month. However, the final effluent was recycled to sustain the system during this period. No analyses were conducted.
5 06/3/01 - 07/10/01
The process remained as an MLE configuration. However there was a decrease in the influent COD which was uncontrollable since the quality and strength of the influent was dependent on the supply from industry. The process parameters remained the same.

- 190 -
APPENDIX 20: MALT EXTRACT AGAR
Composition g/L
Malt Extract 17.0
Agar 15.0
Preparation
Suspended 17 g in 1 L of demineralized water.
Bring to the boil with frequent stirring until completely dissolved
Autoclave under mild conditions (10 min at 115C)

- 191 -
APPENDIX 21: NUTRIENT AGAR
Composition g/L
Meat Extract 1.0
Peptone 5.0
Yeast Extract 2.0
Sodium chloride 8.0
Agar 15.0
Preparation:
Suspend 31 g in 1 L distilled water
Bring to the boil
Sterilize by autoclaving at 121EC for 15 min.
When almost cooled, pour in to petri dishes and allow gel to form.

- 192 -
APPENDIX 22: PURITY CHECK
Prepare methylene blue solution by adding 1 g methylene blue powder to 100 mL
distilled water.
Place one drop methylene blue to a clean slide
With the aid of an inoculating loop transfer the yeast to the droplet on the slide. Spread
yeast. Place cover slip over the slide.
Examine under the microscope using 100 x objective (oil immersion).

- 193 -
APPENDIX 23: NUTRIENT SOLUTION
1 L of distilled was added to a conical flask
The following constituents were weighed out on an analytical balance and then added to
the distilled water:
2g NH4CL; 1 g KH2PO4; 0.2 mg FeCl3; 0.2 mg MnCl2; 0.2 mg ZnCl2; 0.005 mg biotin, 0.1
mg thiamine; and 0.5 g MgSO4.7H2O.
The medium was transferred to a schott bottle and sterilized by autoclaving at 121oC for
15 min.
Double strength solution: add two times the amount of nutrients in one liter
The solution was then autoclaved at 121oC for 15 min. The cooled solution was then used
to dilute the effluent as required.

- 194 -
APPENDIX 24: OLEIC ACID PLATES
Composition:
Nutrient Solution
Macro nutrients 1 mL/L
Micro nutrients 1 mL/L
Vitamins 1 mL/L
Agar 15 g/L
Oleic acid 50 mL/L
Distilled water 1000 mL/L
Preparation
Mix nutrient solution and agar with distilled water
Autoclave at 121C for 15 min.
Add oleic acid when media is about 45C.
Cool to room temperature.
Shake vigorously before pouring on to Petri dish.

- 195 -
APPENDIX 25: STEARIC ACID PLATES
Composition:
Nutrient Solution
Macro nutrients 1 mL/L
Micro nutrients 1 mL/L
Vitamins 1 mL/L
Agar 15 g/L
Stearic acid 25 g/L
Distilled water 1000 mL/L
Preparation
Mix nutrient solution and agar with distilled water
Autoclave at 121C for 15 min.
Add oleic acid when media is about 45C.
Cool to room temperature.
Shake vigorously before pouring on to Petri dish.

- 196 -
APPENDIX 26: FOG DEGRADATION GRAPHS FOR BACTERIA AND YEAST ISOLATES
The reduction in FOG concentrations following batch tests inoculation with Bacillus sp, F,
Candida and Rhodosporidium sp. are shown in Figures 7.1 to 7.6. Likewise the COD reduction
and percentage removal is illustrated in Figures 7.7 to 7.12.
F i g u r e 7 . 1 : F O G r e m o v a l b y F , B a c i l l u s s p , C a n d i d a s p a n d R h o d o s p o r i d i u m s p i n b a t c h t e s t a t p H 5 , 2 1 o C
T i m e ( d a y s )
0 3 5 7
FO
G (
mg
/L)
0
1 0 0
2 0 0
3 0 0
4 0 0
5 0 0
6 0 0
7 0 0
8 0 0
9 0 0
1 0 0 0
1 1 0 0
1 2 0 0
C o n t r o lFB a c i l l u s s p .C a n d i d a s pR h o d o s p o r i d i u m s p .
Figure 7.1: pH 5, 21C
In Fig. 7.1 initial FOG concentration was 1005 mg/L. The control remained relatively stable but
still showed slight FOG reduction. Final FOG was 901 mg/L (day 7). F reduced rapidly from
initial to day 3 (600 mg/L) and day 5 (380 mg/L). However, between day 5 and day 7 FOG
decreased to 96 mg/L. Bacillus sp also reduced FOG from initial to day 3 (580 mg/L). By day 7
the FOG concentration had elevated to 358 mg/L. Candida sp diminished FOG from initial to
day 5 (468 mg/L). But FOG increased to 184 mg/L by day 7. Rhodosporidium sp showed worst
FOG reduction. Between initial and day 3 (896 mg/L), but between day 3 and day 7 the FOG
escalated to 542 mg/L.
T i m e ( d a y s )
F i g u r e 7 . 2 : F O G r e m o v a l b y F , B a c i l l u s s p , C a n d i d a s p a n d R h o d o s p o r i d i u m s p i n b a t c h t e s t a t p H 5 , 3 1 o C
0 3 5 7
FO
G (
mg
/L)
0
1 0 0
2 0 0
3 0 0
4 0 0
5 0 0
6 0 0
7 0 0
8 0 0
9 0 0
1 0 0 0
1 1 0 0
1 2 0 0
C o n t r o lFB a c i l l u s s p .C a n d i d a s pR h o d o s p o r i d i u m s p

- 197 -
Figure 7.2: pH 5, 31 C
Initial FOG concentration was 964 mg/L (fig. 7.2). Control slowly degraded to 878 mg/L by day
7. F slowly degraded FOG to 694 mg/L (day 3) and 479 (day 5). Between day 5 and day 7 FOG
was rapidly utilized to 138 mg/L. Initially Bacillus sp reduced FOG instantly to 326 mg/L (day 3).
Bacillus sp slowed down between day 3 and day 5 (220 mg/L) to finally reduce FOG to 180
mg/L (day 7). FOG was not utilized very well by Candida sp at this parameter. By day 7 FOG
was only diminished to 762 mg/L. Between initial and day 3 (808 mg/L) Rhodosporidium sp
degraded slowly. By day 5 and day 7 utilization increased quickly as FOG was measured at 316
mg/L and 87 mg/L respectively.
T i m e ( d a y s )
0 3 5 7
FO
G (
mg
/L)
0
1 0 0
2 0 0
3 0 0
4 0 0
5 0 0
6 0 0
7 0 0
8 0 0
9 0 0
1 0 0 0
1 1 0 0
1 2 0 0
C o n t r o lFB a c i l l u s s p .C a n d i d a s pR h o d o s p o r i d i u m s p
F i g u r e 7 . 3 : F O G r e m o v a l b y F , B a c i l l u s s p , C a n d i d a s p a n d
R h o d o s p o r i d i u m s p i n b a t c h t e s t a t p H 7 , 2 1 o C
Figure 7.3: pH 7, 21C
FOG concentration, in Fig. 7.3, was initially measured to be 718 mg/L. The control was
observed to degrade itself to a final concentration of 394 mg/L (day 7). F degraded FOG at a
moderate pace throughout this test. FOG concentrations were measured to be 518 mg/L (day
3), 496 mg/L (day 5) and 316 mg/L (day 7). Bacillus sp also performed at relatively the same
pace as F to reduce FOG to a final concentration of 342 mg/L (day 7). Candida sp also showed
moderate rate of FOG utilization between day 1 and day 5 but thereafter decreased FOG fairly
quickly. On day 3, day 5 and day 7 FOG was measured to be 434 mg/L, 326 mg/L and 130
mg/L respectively. Rhodosporidium sp performed the best. Degradation began instantly as FOG
concentration was measured to be 734 mg/L on day 3. By day 5 (416 mg/L) Rhodosporidium sp
slowed down. But by day 7 the FOG concentration was measured at 316 mg/L.

- 198 -
F i g u r e 7 . 4 : F O G r e m o v a l b y F , B a c i l l u s s p , C a n d i d a s p a n d
R h o d o s p o r i d i u m s p i n b a t c h t e s t s a t p H 7 , 3 1 o C
T i m e ( d a y s )
0 3 5 7
FO
G (
mg
/L)
0
1 0 0
2 0 0
3 0 0
4 0 0
5 0 0
6 0 0
7 0 0
8 0 0
9 0 0
1 0 0 0
1 1 0 0
1 2 0 0
C o n t r o lFB a c i l l u s s pC a n d i d a s pR h o d o s p o r i d i u m s p
Figure 7.4: pH 7, 31C
In Fig.7.4: FOG concentration was 1148 mg/L. Control was measured at 1012 mg/L, 1010 mg/L
and 996 mg/l on the respective days. F decreased FOG from 766 mg/L on day 3 to 635 mg/L
and 590 mg/L on day 5and day 7 respectively. Bacillus sp also performed as well as F. FOG
was reduced to 994 mg/L, 821 mg/L and 694 mg/L on respective days. Candida sp performed
very well. FOG concentration was reduced from 664 mg/L on day 3 to 415 mg/L on day 5,
eventually to 360 mg/L on day 7. Rhodosporidium sp rapidly decreased FOG to 464 mg/L by
day 3 to reduce to a final concentration of 368 mg/L (day 7).
F i g u r e 7 . 5 : F O G r e m o v a l b y F , B a c i l l u s s p , C a n d i d a s p a n d
R h o d o s p o r i d i u m s p i n b a t c h t e s t a t p H 8 , 2 1 o C
T i m e ( d a y s )
0 3 5 7
FO
G (
mg
/L)
0
1 0 0
2 0 0
3 0 0
4 0 0
5 0 0
6 0 0
7 0 0
8 0 0
9 0 0
1 0 0 0
1 1 0 0
1 2 0 0
C o n t r o lFB a c i l l u s s p .C a n d i d a s pR h o d o s p o r i d i u m s p .
Figure 7.5: pH 8, 21C
Initial concentration was 1056 mg/L. Control was relatively stable to have a final concentration
of 972 mg/L. F utilized FOG rapidly by day 3 (630 mg/L). By day 5 F slowed down reduction to
428 mg/L. Bacillus sp started degradation slowly but by day 7 it had accelerated its pace. FOG
was measured at 902 mg/L, 358 mg/L and 278 mg/L on the respective days. Candida sp also
started slowly. By day 3 FOG was only lessened to 752 mg/L. By day 5 (394 mg/L) utilization

- 199 -
occurred rapidly but by day 7 (266 mg/L) it had slowed down again. Rhodosporidium sp
performed relatively the same as Candida sp. FOG was 628 mg/L (day 3), 310 mg/L (day 5) and
268 mg/L (day 7).
F i g u r e 7 . 6 : F O G r e m o v a l b y F , B a c i l l u s s p , C a n d i d a s p a n d
R h o d o s p o r i d i u m s p i n b a t c h t e s t s a t p H 8 , 3 1 o C
T i m e ( d a y s )
0 3 5 7
FO
G (
mg
/L)
0
1 0 0
2 0 0
3 0 0
4 0 0
5 0 0
6 0 0
7 0 0
8 0 0
9 0 0
1 0 0 0
1 1 0 0
1 2 0 0
C o n t r o lFB a c i l l u s s p .C a n d i d a s p .R h o d o s p o r i d i u m s p
Figure 7.6: pH 8, 31C
Initial FOG was 1020 mg/L. Control gradually deceased from 912 mg/L to 889 mg/L and finally
to 737 mg/L. F utilize FOG poorly only reducing it to 983 mg/L (day 3), 965 mg/L (day 5) and
928 mg/L (day 7). Bacillus sp performed little better than F, by reducing FOG to 786 mg/L, 561
mg/L and 544 mg/L on the respective days. Candida sp reduced FOG quickly by day 3 (328
mg/L), by day 5 (496 mg/L) it had slowed down. But by day 7 utilization had increased again to
reach final concentration of 148 mg/L. Rhodosporidium sp did not show much capability for the
first 3 days (728 mg/L). By day 5 (252 mg/L) and day 7 (156 mg/L) Rhodosporidium sp rapidly
utilized FOG.

- 200 -
APPENDIX 27: COD DEGRADATION GRAPHS FOR BACTERIA AND YEAST ISOLATES
(N.B.: The increase in COD could be attributed to Soluble Microbial Presence (SMP)).
F i g u r e 7 . 7 : C O D c o n c e n t r a t i o n v s t i m e f o r F , B a c i l l u s s p , C a n d i d a s p a n d
R h o d o s p o r i d i u m s p i n b a t c h t e s t s a t p H 5 , 2 1 o C
T i m e ( d a y s )
0 3 5 7
CO
D (
mg
/L)
2 0 0
4 0 0
6 0 0
8 0 0
1 0 0 0
1 2 0 0
1 4 0 0
1 6 0 0
1 8 0 0
2 0 0 0
2 2 0 0
2 4 0 0
2 6 0 0
2 8 0 0
3 0 0 0
C o n t r o lFB a c i l l u s s p .C a n d i d a s p .R h o d o s p o r i d i u m s p
Figure 7.7: pH 5, 21 C
Initial COD concentration was 1010 mg/L. Control COD concentration increased to 2615 mg/L
(day 3) and eventually decreased slightly to 2599 mg/L (day 5) and to 2589 mg/L (day 7). F
reduced COD to 545 mg/L (day 3) and 234 mg/L (day 5). By Day 7 COD increased to 407 mg/L.
Bacillus sp reduced COD to 855 mg/L (day 3). But by day 5 and day 7 COD had increased to
1016 mg/L and 1448 mg/L respectively. Candida sp initially increased COD to 1271 mg/L (day
3) but COD decreased drastically to 302 mg/L by day 5. On day 7 COD measured at 479 mg/L.
Rhodosporidium sp rapidly decrease COD to 539 mg/L (day 3). But by day 5 and 7 the COD
concentration increased to 1192 mg/L and 1227 mg/L respectively.
F i g u r e 7 . 8 : C O D c o n c e n t r a t i o n v s t i m e f o r F , B a c i l l u s s p , C a n d i d a s p a n d
R h o d o s p o r i d i u m s p i n b a t c h t e s t a t p H 5 , 3 1 o C
T im e ( d a y s )
in i t a l 3 5 7
CO
D (
mg
/L)
2 0 0
4 0 0
6 0 0
8 0 0
1 0 0 0
1 2 0 0
1 4 0 0
C o n t r o lFB a c i l lu s s pC a n d id a s pR h o d o s p o r id iu m s p
Figure 7.8: pH 5, 31C
In Fig. 7.8 initial COD concentration was 709 mg/L. COD for control decreased gradually from
678 mg/L (day 3), to 612 mg/L (day 5) and to 610 mg/L (day 7). F slowly decreased COD to 652
mg/L, 576 mg/L and 758 mg/L on the respective days. Bacillus sp did not decrease the COD
concentration. COD increased to 978 mg/L on day 3, 1028 mg/L on day 5 and 1286 mg/L on

- 201 -
day 7. COD was drastically reduced by Candida sp by day 3 (468 mg/L). But began increasing
by day 5 (700 mg/L), to reach a final concentration of 956 mg/L by day 7. Rhodosporidium sp
reduced COD to 509 mg/L (day 3) but increased it to 692 mg/L and 708 mg/L by day 5 and 7
respectively.
F ig u re 7 .9 : C O D c o n c e n tra t io n v s t im e fo r F , B a c illu s s p , C a n d id a s p a n d
R h o d o s p o rid iu m s p in b a tc h te s t a t p H 7 , 2 1 o C
T im e (d a y s )
in ita l 3 5 7
CO
D (
mg
/L)
2 0 0
4 0 0
6 0 0
8 0 0
1 0 0 0
1 2 0 0
1 4 0 0
C o n tro l FB a c illu s s pC a n d id a s pR h o d o s p o r id iu m s p .
Figure 7.9: pH 7, 21 C
In Fig. 7.9 COD concentration on day 1 was 981 mg/L. Control COD remained fairly stable up to
day 5 but increased to 1192 mg/L by day 7. F decreased COD to 475 mg/L (day 3). But
increases were observed on day 5 (794 mg/L) and day 7 (894 mg/L). Bacillus sp slowly
decreased COD to 811 mg/L and 734 mg/L by day 3 and 5 respectively. But an increase was
measured on day 7 (878 mg/L). Candida sp reduced COD to 887 mg/L. But showed large
increases on day 5 (1006 mg/L) and day 7 (1086 mg/L). COD was initially reduced very slowly
by Rhodosporidium sp for the first three days (887 mg/L). By day 5 and 7 the COD elevated to
986 mg/L and 1136 mg/L respectively.

- 202 -
F i g u r e 7 . 1 0 : C O D c o n c e n t r a t i o n v s t i m e f o r F , B a c i l l u s s p , C a n d i d a s p a n d
R h o d o s p o r i d i u m s p i n b a t c h t e s t a t p H 7 , 3 1 o C
T i m e ( d a y s )
i n i t a l 3 5 7
CO
D (
mg
/L)
2 0 0
4 0 0
6 0 0
8 0 0
1 0 0 0
1 2 0 0
1 4 0 0
1 6 0 0
1 8 0 0
C o n t r o lFB a c i l lu s s p .C a n d id a s pR h o d o s p o r id iu m s p
Figure 7.10: pH 7, 31 C
Initial COD concentration was 1150 mg/L (Fig. 7.10). Control showed COD increasing to 1185
mg/L by day 3, decreasing to 1024 mg/L by day 5 and again an increase to 1380 mg/L by day 7.
F reduced COD to 405 mg/L (day 3). But between day 3 and day 7 COD increased to 1346
mg/L (day 5) and 1586 mg/L (day 7). Bacillus sp slowly decreased COD between day 3 (1092
mg/L) and day 5 (920 mg/L). By day 7 it had increased to 1266 mg/L. Candida sp showed a little
change in COD concentration by day 3 (1050 mg/L). After day 3 COD concentration began
increasing to 1270 mg/l (day 5) and 1660 mg/L (day 7). Rhodosporidium sp decreased COD to
965 mg/L (day 3) and 525 mg/L (day 5). By day 7 COD elevated to 964 mg/L.
F ig u r e 7 .1 1 : C O D c o n c e n t r a t io n v s t im e f o r F , B a c i l lu s s p , C a n d i d a s p a n d
R h o d o s p o r id iu m s p in b a t c h t e s t a t p H 8 , 2 1 o C
T im e ( d a y s )
in i t a l 3 5 7
CO
D (
mg
/L)
1 0 0
3 0 0
5 0 0
7 0 0
9 0 0
1 1 0 0
C o n t r o l FB a c i l lu s s p .C a n d id a s pR h o d o s p o r id iu m s p .
Figure 7.11: pH 8, 21 C
COD concentration was initially measured at 1111 mg/L. Control remained relatively stable with
decrease in concentration from day 1 to day 5 (1012 mg/L), but increased slightly to 1056 mg/L
by day 7. COD concentrations for F decreased drastically to 347 mg/L by day 3. On day 5 and 7
the COD was measured at 414 mg/L and 506 mg/L respectively. Bacillus sp COD was
measured to be 109 mg/L, 924 mg/L and 1094 mg/L on the respective days. Candida sp slowly

- 203 -
reduced COD by day 3 (1002 mg/L) and day 5 (942 mg/L), to then increase it slightly by day 7
(954 mg/L). Rhodosporidium sp reduced COD rapidly to 677 mg/L (day 3). Thereafter COD was
measured at 634 mg/L on day 5 and 740 mg/L on day 7.
F ig u re 7 .1 2 : C O D c o n c e n tra t io n v s t im e fo r F , B a c il lu s s p , C a n d id a s p a n d
R h o d o s p o r id iu m s p in b a tc h te s ts a t p H 8 , 3 1 o C
T im e (d a y s )
in ita l 3 5 7
CO
D (
mg
/L)
2 0 0
4 0 0
6 0 0
8 0 0
1 0 0 0
1 2 0 0
C o n tro l FB a c il lu s s p .C a n d id a s p .R h o d o s p o r id iu m s p .
Figure 7.12: pH 8, 31 C
Initial COD concentration was 1026 mg/L. Control showed a decrease from 710 mg/L (day 3) to
658 mg/L (day 5). On day 7 it was measured at 682 mg/L. F decreased COD to 534 mg/L (day
3) and 320 mg/L (day 5). By day 7 COD had increased to 493 mg/L. Bacillus sp started slower
by reducing COD to 770 mg/L (day 3) and 595 mg/L (day 5), but increased to 618 mg/L by day
7. Candida sp only reduced COD to 980 mg/L, 631 mg/L and 788 mg/L by the respective test
days. Rhodosporidium sp also barely reduced COD. COD was reduced to 820 mg/L (day 3),
672 mg/L (day 5) and slightly rose to 711 mg/L by day 7.

- 204 -
APPENDIX 28: SABORAUD DEXTROSE AGAR (SDA)
60 g of Biolab Saboraud Dextrose Agar powder was weighed out using a top balance
This was then put in to a 1 L conical flask and 1 L of distilled water was added
The contents of the flask was then boiled until the agar dissolved
The contents was then poured in to Schott bottle and sterilized by autoclaving at 121oC
for minutes.
When almost cooled the media was then poured in to the petri dishes and left to solidify.
- 205 -
APPENDIX 29: LACTOPHENOL COTTON BLUE SOLUTION
Composition
Lactic acid 20 mL
Phenol 20 mL
Glycerol 40 mL
Distilled water 20 mL
Aniline blue 0.05 g
Procedure:
Mix the above contents in to a beaker (except the Aniline blue dye) and heat gently
using a hot plate/magnetic stirrer (Agimatic) until completely dissolved. Then add the
Aniline blue dye. Lactophenol cotton blue solution, results.

- 206 -
APPENDIX 30: COD AND FOG GRAPHS FOR THE FUNGAL ISOLATES
Figure 7.13: Total change in COD Concentration over time by fungal isolates at a temperature of 21 C and pH of 5
0
500
1000
1500
1 2 3 4 5 6 7 8 9 10Time (days)
CO
D (
mg/
L)
Alternaria sp. Mucor sp. 1 Mucor sp. 2 Control
Figures 7.13 and 7.14 21C, pH 5
For the Alternaria sp. the total COD concentrations showed an overall decrease from 1010 mg/L
to an eventual 410 mg/L. Also, moderate decreases in total COD concentrations were observed
for both Mucor spp., i.e. Mucor sp. 1 showed a decline from 1010 mg/L to 669 mg/L while Mucor
sp. 2 recorded a decrease from 1010 mg/L to 597 mg/L. The control showed a slow decrease in
concentrations from 1010 mg/L to 851 mg/L by the end of the tenth day.
Figure 7.14: Total change in FOG concentration over time by the fungal isolates at a
temperature of 21oC and pH of 5
0
100
200
300
400
500
600
700
1 2 4 6 8 10Time (day)
FO
G (
mg/
L)
Alternaria sp. Mucor sp. 1 Mucor sp. 2 Control
An overall decrease in the FOG from initial concentrations in the edible oil effluent was
observed by all the fungal isolates. Decreases in FOG concentrations from 612 mg/L to 88 mg/L
were observed by the Alternaria sp. Isolates belonging to the Mucor spp., i.e. Mucor sp. 1 and
Mucor sp. 2, showed a decrease in FOG concentrations from 612 mg/L to 335 mg/L and 247

- 207 -
mg/L respectively. It was also observed that the FOG concentration in the control steadily
decreased from 612 mg/L to 402 mg/L by the end of the tenth day.
Figure 7.15: Total change in COD concentration over time at a temperature of 31oC and pH of 5
0
200
400
600
800
1000
1200
1400
1 2 3 4 5 6 7 8 9 10
Time (days)
CO
D (
mg/
L)
Alternaria sp. Mucor sp. 1 Mucor sp. 2 Control
Figures 7.15 and 7.16. pH 5, 31C
As expected overall rapid decreases in COD concentrations by all the isolates and the control
was observed. Decreases in COD concentrations ranged initially from 1204 mg/L to 90 mg/L by
the Alternaria sp., 103 mg/L by the Mucor sp. 1 and 110 mg/L by Mucor sp. 2. The control
showed a gradual decline in concentrations from 1204 mg/L to 610 mg/L.
Figure 7.16: Total change in FOG concentration over time at a temperature of 31oC and pH of 5
0
200
400
600
800
1000
1200
1 2 4 6 8 10
Time(days)
FO
G (
mg/
L)
Alternaria sp. Mucor sp. 1 Mucor sp. 2 Control
Rapid FOG utilisation was observed by the fungal isolates during this 10-day experimentation.
FOG concentrations decreased from initially 970 mg/L to 90 mg/L by the Alternaria sp., 110
mg/L and 117 mg/L by the Mucor sp. 1 and Mucor sp. 2, respectively

- 208 -
Figure 7.17: Total change in COD concentration over time by the fungal isolates
at a temperature of 21oC and pH of 7
0
200
400
600
800
1000
1200
1400
1 2 3 4 5 6 7 8 9 10Time (days)
CO
D (
mg/
L)
Alternaria sp. Mucor sp. 1 Mucor sp. 2 Control
Figures 7.17 and 7.18. pH 7, 21C
Initial COD concentrations were 1160 mg/L and thereafter fluctuated during the 10 day period,
especially when considering the Mucor spp. However, overall reductions in COD concentrations
were observed for example decreases to 325 mg/L by the Alternaria sp., 719 mg/L by Mucor
sp.1 and 623 mg /L by Mucor sp. 2. A minor reduction to 978 mg/L of the COD concentration
was observed in the control.
Figure 7.18: Total change in FOG concentration over t ime at a temperature of 21oC and pH 7
0
200
400
600
800
1000
1200
1 2 4 6 8 10Time (days)
FOG
(m
g/L
)
Alternaria sp. Mucor sp. 1 Mucor sp. 2 Control
Overall decreases in FOG concentrations from an initial concentration of 1010 mg/L to eventual
concentrations of 146 mg/L by the Alternaria sp., 211 mg/L by Mucor sp. 1 and 319 mg/L by the
Mucor sp. 2 respectively were recorded. Likewise the COD concentrations of the control
decreased from 1010 mg/L to 463 mg/L.
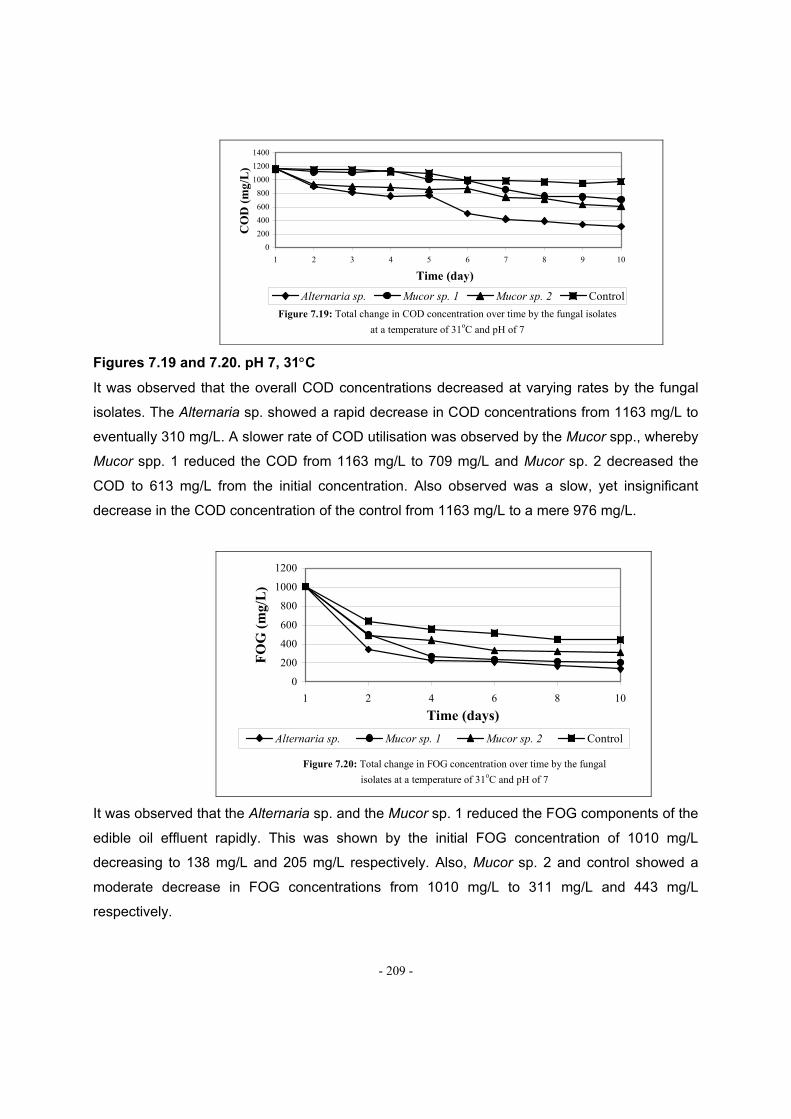
- 209 -
Figure 7.19: Total change in COD concentration over time by the fungal isolates
at a temperature of 31oC and pH of 7
0
200
400
600
800
1000
1200
1400
1 2 3 4 5 6 7 8 9 10
Time (day)
CO
D (
mg/
L)
Alternaria sp. Mucor sp. 1 Mucor sp. 2 Control
Figures 7.19 and 7.20. pH 7, 31C
It was observed that the overall COD concentrations decreased at varying rates by the fungal
isolates. The Alternaria sp. showed a rapid decrease in COD concentrations from 1163 mg/L to
eventually 310 mg/L. A slower rate of COD utilisation was observed by the Mucor spp., whereby
Mucor spp. 1 reduced the COD from 1163 mg/L to 709 mg/L and Mucor sp. 2 decreased the
COD to 613 mg/L from the initial concentration. Also observed was a slow, yet insignificant
decrease in the COD concentration of the control from 1163 mg/L to a mere 976 mg/L.
Figure 7.20: Total change in FOG concentration over time by the fungal
isolates at a temperature of 31oC and pH of 7
0
200
400
600
800
1000
1200
1 2 4 6 8 10
Time (days)
FO
G (
mg/
L)
Alternaria sp. Mucor sp. 1 Mucor sp. 2 Control
It was observed that the Alternaria sp. and the Mucor sp. 1 reduced the FOG components of the
edible oil effluent rapidly. This was shown by the initial FOG concentration of 1010 mg/L
decreasing to 138 mg/L and 205 mg/L respectively. Also, Mucor sp. 2 and control showed a
moderate decrease in FOG concentrations from 1010 mg/L to 311 mg/L and 443 mg/L
respectively.

- 210 -
Figure 7.21: Total change in COD concentration over time at a temperature of
21oC and pH of 8
0
200
400
600
800
1000
1200
1400
1 2 3 4 5 6 7 8 9 10
Time (day)
CO
D (
mg/
L)
Alternaria sp. Mucor sp. 1 Mucor sp. 2 Control
Figures 7.21 and 7.22. pH 8, 21C
Slight fluctuations in the COD concentrations were observed by both Mucor spp. but an overall
decrease of the total COD concentration from an initial concentration of 1262 mg/L to 166 mg/L
by Mucor sp. 1 and 603 mg/L by Mucor sp. 2 was shown. The Alternaria sp. showed an efficient
decline in COD concentrations from 1262 mg/L to 106 mg/L and the control also decreased to
776 mg/L from the initial COD concentration.
Figure 7.22: Total change in FOG concentration by the fungal isolates at a temperature
of 21oC and pH of 8
0
200
400
600
800
1000
1200
1 2 4 6 8 10
Time (days)
FO
G (
mg/
L)
Alternaria sp. Mucor sp. 1 Mucor sp. 2 Control
An overall decrease of FOG concentrations during the 10 day experimental period by all the
fungal isolates was observed. Initial FOG concentrations decreased from 1018 mg/L to 110
mg/L by the Alternaria sp., to 202 mg/L by the Mucor sp. 1, to 261 mg/L by the Mucor sp. 2 and,
to 450 mg/L by the control.

- 211 -
Figure 7.23: Total change in COD concentration by the fungal isolates at a
temperature of 31oC and pH of 8
0
200
400
600
800
1000
1200
1400
1 2 3 4 5 6 7 8 9 10
Time (day)
CO
D (
mg/
L)
Alternaria sp. Mucor sp. 1 Mucor sp. 2 Control
Figures 7.23 and 7.24. pH 8, 31C
It is observed that a reduction in the COD concentrations by all the fungal isolates and the
control had occurred. The initial COD concentration of 1262 mg/L was decreased to 106 mg/L
by the Alternaria sp., 588 mg/L by Mucor sp. 1, 446 mg/L by Mucor sp. 2 and 641 mg/L during
the control experiments.
Figure 7.24: Total change in FOG concentration by the fungal isolates at a temperature of 31oC and pH of 8
0200
400600800
10001200
1 2 4 6 8 10Time (days)
FOG
(m
g/L
)
Alternaria sp. Mucor sp. 1 Mucor sp. 2 Control
The initial FOG concentration of 1020 mg/L was observed to decrease to 116 mg/L by the
Alternaria sp., 225 mg/L and 214 mg/L by Mucor sp.1 and Mucor sp. 2 respectively. The control
FOG concentration decreased to 602 mg/L from the initial concentration.