development of carboxylic acid search prefilters for spectral library matching
TRANSCRIPT
Microchemical Journal 103 (2012) 21–36
Contents lists available at SciVerse ScienceDirect
Microchemical Journal
j ourna l homepage: www.e lsev ie r .com/ locate /mic roc
Development of carboxylic acid search prefilters for spectral library matching
Barry K. Lavine a,⁎, Kadambari Nuguru a, Nikhil Mirjankar a, Jerome Workman b,c
a Department of Chemistry, Oklahoma State University, Stillwater, OK 74078, United Statesb Unity Scientific LLC, 117 Old State Road, Brookfield, CT 06804, United Statesc National University, La Jolla, CA 923037-1011, United States
⁎ Corresponding author.E-mail address: [email protected] (B.K. Lavin
0026-265X/$ – see front matter © 2012 Elsevier B.V. Aldoi:10.1016/j.microc.2012.01.001
a b s t r a c t
a r t i c l e i n f oArticle history:Received 24 December 2011Accepted 1 January 2012Available online 5 January 2012
Keywords:Carboxylic acid search prefiltersLibrary searchingSpectral matchingSpectral pattern recognition
435 infrared (IR) absorbance spectra of 140 carboxylic acids and 295 noncarboxylic acids which included alde-hydes, ketones, esters, amides as well as compounds containing both carbonyls and alcohols were preprocessedusing the wavelet packet tree to enhance subtle but important features in the data. Wavelet coefficients that opti-mized the separation of the spectra by functional group in a plot of the two largest principal components of thedatawere identifiedusing a genetic algorithm (GA) for pattern recognition analysis. Because principal componentsmaximize variance, the bulk of the information encoded by the wavelet coefficients selected by the pattern recog-nition GA is characteristic of the carboxylic acid functional group. The carboxylic acid search prefilter developed aspart of this study was successfully validated using two external validation sets. The first validation set consisted of24 carboxylic acids and 61 noncarboxylic acids and the second validation set consisted of 264 carboxylic acids and72 noncarboxylic acids.
© 2012 Elsevier B.V. All rights reserved.
1. Introduction
Infrared (IR) spectroscopy is an established laboratory method forchemical identification. The widespread popularity of IR spectroscopy isa result of the peaks present in an IR spectrum being directly related tothe fundamental vibration frequency of specific functional groups or tovibrational modes characteristic of the entire molecule. The combinationof group frequencies and the fingerprint region has made IR the methodof choice for qualitative analysis of organic compounds.
Currently, there is renewed interest in IR spectral library matching[1,2] because of the higher quality and larger amounts of IR data, im-provements in computing power, and workers who are less welltrained in the art of interpreting IR spectra. However, most IR librarymatching algorithms [3] are not interpretative since they involvesome form of point by point numerical comparison (often involvingthe computation of the Euclidean distance) between an unknownand each spectrum of the library. The problem with treating an IRspectrum as a set of points is that band shifting is not handled welland bands of low intensity, which may be highly informative, areoften ignored. For these reasons, commercial IR library searching al-gorithms are limited to identity searches. Because the number ofcompounds in an IR library is typically 30,000 whereas the numberof organic compounds in existence is several million, there is a needfor search algorithms that can perform similarity searches in IR spec-tral libraries.
e).
l rights reserved.
Using search prefilters, many of the problems encountered in IR li-brary searching can be remedied. A search prefilter [4,5] is a quick testto identify library spectra that are dissimilar to the unknown. Prefiltersallow for more sophisticated and correspondingly more time-consuming algorithms to be used for library matching since the size ofthe library can be trimmed down for a specificmatch. To ensure an inter-pretative search, the information contained in the prefilter should beabout chemical structure. However, any substructure searching functionused in IR library matching should have the appropriate degree of fuzzi-ness. If the range of the function is too narrow, the substructure elementof interest may be overlooked in an exotic environment. A range that istoo wide may generate too many false positives.
Pattern recognition methods have been used to develop searchprefilters with only a limited degree of success [6–9]. The reasonscan be attributed to the complex nature of the modeling problem.Structure-spectral relationships cannot always be modeled using asingle spectral band. Furthermore, wavelengths should be includedin the search prefilter to exclude compounds that contain functionalgroups or other substructural features that could be confused withthe functional group of interest. Using a genetic algorithm (GA) forpattern recognition analysis and feature selection [10–15], a searchprefilter for specific detection of carboxylic acids based on the re-sponse function to a simple binary classification problem, carboxylicacids versus noncarboxylic acids, has been developed and validatedas part of this study. Carboxylic acids have somewhat highly charac-teristic features but are difficult to distinguish in large libraries of or-ganic compounds due to their somewhat indistinct band shapes.Experts do not agree on the exact position of peaks in their spectra.Liquid phase carboxylic acids are often indistinguishable from

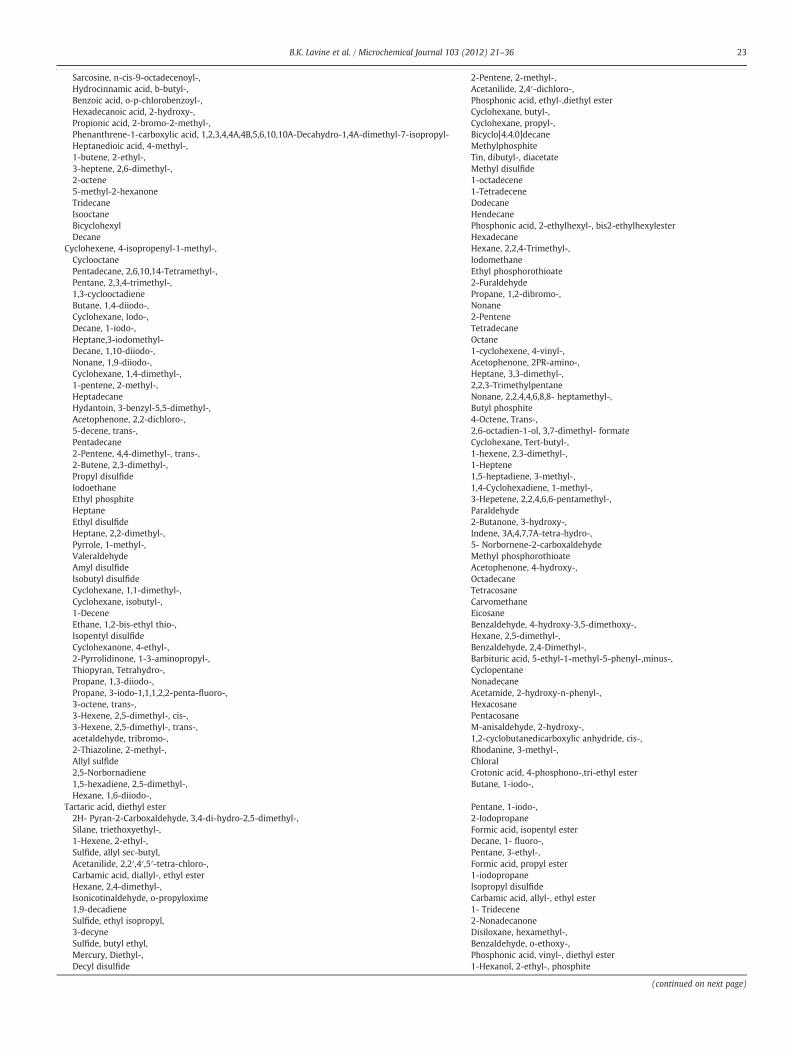
Table 1Training set.
Cyclohexanevaleric acidCyclopentanepropionic acidCyclopropanecarboxylic acidButyric acid, 2,2-dimethyl-,Propionic acid, 2-mercapto-,Valeric acid, 3-methyl-,Propionic acid, 3-ethyoxy-,3-methylbutyric acid2-Methylacrylic acid2-Nonenoic acidDodecanoic acidAcetic acid, Phenyl-,Hydrocinnamic acid4-decenoic acid, trans-,2-Hexenoic acid, trans-,2-Dodecenoic acid, trans-,Crotonic acid, 3-methyl-4,4,4-trifluoro-,Cycloundecanecarboxylic acidLinoleic acidButyric acid, 3-methyl-4,4,4-trifluoro-,Benzoic acid, 4-hydroxy-3-methoxy-,acetateHeptadecanoic acidP-cymene-2-butyric acid, a-methyl-,Sebacic acid, monoethyl esterAcetic acid, 2-isopropyl-5-methylcyclohexyl-oxy-l-,Hydrocinnamic acid, erythro-b-ethyl-a-methyl-,Cyclopentaneacetic acid, a-phenyl-,Cycloheptaneacetic acid, 1-carboxy-,Acetic acid, 4-chloro-o-tolyloxy-,Propionic acid, 3,3pr-cyclohexyl-idenedithio-di-,2-Thiophenecarboxylic acid, 5-ethyl-,Acetic acid, o-chlorophenoxy-,1-cyclohexene-1-acetic acid, a-ethyl-,Acetic acid, 3-4-dimethoxy-phenyl-,Acetic acid, diphenyl-,Hendecanoic acid, 11-bromo-,Acetic acid, p-isopropylphenyl-,Acetic acid, p-methoxyphenyl-,Benzoic acid, 2,4,6-trimethyl-,Acetic acid, p-bromophenoxy-,Cycloheptanecarboxylic acid, 1-hydroxy-,p-toulic acid, a-mercapto-,2-pentenoic acid2-cylcopentene-1-acetic acidHydrocinnamic acid, o-methoxy-,
Hydrocinnamic acid, p-methyl-,1,2-cyclopropanedicarboxylic acid, trans-, 1,2-dimethyl-,Benzoic acid, p-dodecyloxy-,Benzoic acid, p-cyclohexyloxy-,Cyclopentanecarboxylic acid, 1-m-tolyl-,Stearic acid, 2-bromo-,Octanoic acid, 2-oxo-,Salicylic acid, 3,5-diisopropyl-,Benzoic acid, p-phenyl-,Acetic acid, 2,3-xylyloxy-,Propionic acid, 2,2- diphenyl-,1,4-cyclohexanedicarboxylic acid, trans-,Propionic acid, 2-p-tert-butyl-phenyl thio-2-methyl-,Propionic acid, 2-benzylthio- 2-methyl-,Cyclopropanecarboxylic acid, 2-phenyl-, trans-,1,4-cyclohexanedicarboxylic acidButyric acid, 4-benzoyl-,1-Adamantanecarboxylic acidPropionic acid, 3-p-chloro-phenoxy-,Benzoic acid, p-2-butoxyethoxy-,Benzoic acid, 2,4-dimethyl-,3-Butenoic acid, 4-phenyl-,Cinnamic acid, b-methyl-,2-Pentenoic acid, 3-methyl-2-phenyl-,Acetic acid, 6-isopropyl-m-tolyloxy-,Acetic acid, 1-naphthlyoxy-,Naphthalenedicarboxylic acid, 4A,8A-,1,4,5,8-tetrahydro-,cis-Hydratropic acid, p-fluoro-,Acetic acid,2,5-dimethoxy-phenyl-,3-Pyridineacrylic acidAcetic acid, o-tolyl-,Cinnamic acid, p-ethoxy-,Acrylic acid, 3-chloro-, trans-,Hexadecanedioic acid2-Isoindolinepropionic acid, 1,3-di-oxo-,Cinnamic acid, p-acetoxy-,Acetic acid, p-methoxyphenoxy-,Adipic acid, 3-methyl-,Benzoic acid, 3,5-diiodo 4-hydroxy-,Benzoic acid, 3,5-dimethyl- 4-nitro-,Undecanoic acid, 11-p-acetylphen-oxy-Cyclohexaneacetic acid, 2-oxo-,Cyclobutaneacetic acid, 3-acetyl- 2,2-dimethyl-,
Butyric acid, 2-phenyl-,Butyric acid, 4-chloro-,Benzoic acid, 3,4,5-trimethoxy-,Tetradecanedioic acidBenzoic acid, p-formyl-,Cinnamic acid, trans-,Butyric acid, 2,2-diphenyl-,Hendecanoic acid, 11-cyano-,Propionic acid, 2-hydroxy-2-methyl-,Valeric acid, 5-phenyl-,Cinnamic acid, p-methoxy-,Hexanoic acid, 6-bromo-,2-Biphenylcarboxylic acidValeric acid, 5-bromo-,Succinic acid, monomethyl esterPropionic acid, 2,3-dichloro-,Malonic acid, benzyl-,Tetradecanoic acid, 2-bromo-,Butyric acid, 3-hydroxy-,Benzoic acid, o-mercapto-,Phthalic acid, hexahydro-, trans-,Hexanoic acid, 2-carboxy-,Valeric acid, 2-o-tolyl-,Acetic acid, m-methoxyphenyl-,Propionic acid, A-2,4,5-trichloro-phenoxy-,Tridecanedioic acidHexanoic acid, 2-phenyl-,Glutaric acid, 2,2-dimethyl-,m-anisic acid, 4-methyl-,Butyric acid, 4-P-nitrophenyl-,Propionic acid, 3,3-pr-dithiodi-Isonicotinic acid, 1-oxide
1-dodecene1-Hexadecene2-Heptenoic acid, trans-,2-Undecenoic acid2-Benzofuranbutyric acid, 7-methoxy-,5-Norbornene-2-carboxylic acid9-Octadecenoic acid, 12-hydroxy-,Octadecanoic acid, 2-methyl-,Acetic acid, 2,5-xylyloxy-,2-Isoindolineacetic acid, 1,3-di-oxo-a-isobutyl-,Benzo-b-thiophene-3-acetic acidFumaric acid, monoheptyl esterFumaric acid, monododecyl esterFumaric acid, monotetradecyl esterValeric acid, 3-methyl-2-phenyl-,Butyl PhosphateStilbenediol, 4,4PR-A,APR-diethyl-diacetateCyclohexaneTetrahydrobenzene2-pentene,2,4,4-trimethyl-,2,4-DimethylpentaneHexane2-Butene, 2-Methyl-,3-Methylpentane2,2,5-Trimethylhexane2,3-dimethylbutaneMehtylcyclopentanePentane2-methylbutaneMorpholine, 4-acetyl-,Hexadecane, 6,11-dipentyl-,2,4-Hexadiene, 2,5-dimethyl-,
22 B.K. Lavine et al. / Microchemical Journal 103 (2012) 21–36
Sarcosine, n-cis-9-octadecenoyl-,Hydrocinnamic acid, b-butyl-,Benzoic acid, o-p-chlorobenzoyl-,Hexadecanoic acid, 2-hydroxy-,Propionic acid, 2-bromo-2-methyl-,Phenanthrene-1-carboxylic acid, 1,2,3,4,4A,4B,5,6,10,10A-Decahydro-1,4A-dimethyl-7-isopropyl-Heptanedioic acid, 4-methyl-,1-butene, 2-ethyl-,3-heptene, 2,6-dimethyl-,2-octene5-methyl-2-hexanoneTridecaneIsooctaneBicyclohexylDecane
2-Pentene, 2-methyl-,Acetanilide, 2,4′-dichloro-,Phosphonic acid, ethyl-,diethyl esterCyclohexane, butyl-,Cyclohexane, propyl-,Bicyclo[4.4.0]decaneMethylphosphiteTin, dibutyl-, diacetateMethyl disulfide1-octadecene1-TetradeceneDodecaneHendecanePhosphonic acid, 2-ethylhexyl-, bis2-ethylhexylesterHexadecane
Cyclohexene, 4-isopropenyl-1-methyl-,CyclooctanePentadecane, 2,6,10,14-Tetramethyl-,Pentane, 2,3,4-trimethyl-,1,3-cyclooctadieneButane, 1,4-diiodo-,Cyclohexane, Iodo-,Decane, 1-iodo-,Heptane,3-iodomethyl-Decane, 1,10-diiodo-,Nonane, 1,9-diiodo-,Cyclohexane, 1,4-dimethyl-,1-pentene, 2-methyl-,HeptadecaneHydantoin, 3-benzyl-5,5-dimethyl-,Acetophenone, 2,2-dichloro-,5-decene, trans-,Pentadecane2-Pentene, 4,4-dimethyl-, trans-,2-Butene, 2,3-dimethyl-,Propyl disulfideIodoethaneEthyl phosphiteHeptaneEthyl disulfideHeptane, 2,2-dimethyl-,Pyrrole, 1-methyl-,ValeraldehydeAmyl disulfideIsobutyl disulfideCyclohexane, 1,1-dimethyl-,Cyclohexane, isobutyl-,1-DeceneEthane, 1,2-bis-ethyl thio-,Isopentyl disulfideCyclohexanone, 4-ethyl-,2-Pyrrolidinone, 1-3-aminopropyl-,Thiopyran, Tetrahydro-,Propane, 1,3-diiodo-,Propane, 3-iodo-1,1,1,2,2-penta-fluoro-,3-octene, trans-,3-Hexene, 2,5-dimethyl-, cis-,3-Hexene, 2,5-dimethyl-, trans-,acetaldehyde, tribromo-,2-Thiazoline, 2-methyl-,Allyl sulfide2,5-Norbornadiene1,5-hexadiene, 2,5-dimethyl-,Hexane, 1,6-diiodo-,
Hexane, 2,2,4-Trimethyl-,IodomethaneEthyl phosphorothioate2-FuraldehydePropane, 1,2-dibromo-,Nonane2-PenteneTetradecaneOctane1-cyclohexene, 4-vinyl-,Acetophenone, 2PR-amino-,Heptane, 3,3-dimethyl-,2,2,3-TrimethylpentaneNonane, 2,2,4,4,6,8,8- heptamethyl-,Butyl phosphite4-Octene, Trans-,2,6-octadien-1-ol, 3,7-dimethyl- formateCyclohexane, Tert-butyl-,1-hexene, 2,3-dimethyl-,1-Heptene1,5-heptadiene, 3-methyl-,1,4-Cyclohexadiene, 1-methyl-,3-Hepetene, 2,2,4,6,6-pentamethyl-,Paraldehyde2-Butanone, 3-hydroxy-,Indene, 3A,4,7,7A-tetra-hydro-,5- Norbornene-2-carboxaldehydeMethyl phosphorothioateAcetophenone, 4-hydroxy-,OctadecaneTetracosaneCarvomethaneEicosaneBenzaldehyde, 4-hydroxy-3,5-dimethoxy-,Hexane, 2,5-dimethyl-,Benzaldehyde, 2,4-Dimethyl-,Barbituric acid, 5-ethyl-1-methyl-5-phenyl-,minus-,CyclopentaneNonadecaneAcetamide, 2-hydroxy-n-phenyl-,HexacosanePentacosaneM-anisaldehyde, 2-hydroxy-,1,2-cyclobutanedicarboxylic anhydride, cis-,Rhodanine, 3-methyl-,ChloralCrotonic acid, 4-phosphono-,tri-ethyl esterButane, 1-iodo-,
Tartaric acid, diethyl ester2H- Pyran-2-Carboxaldehyde, 3,4-di-hydro-2,5-dimethyl-,Silane, triethoxyethyl-,1-Hexene, 2-ethyl-,Sulfide, allyl sec-butyl,Acetanilide, 2,2′,4′,5′-tetra-chloro-,Carbamic acid, diallyl-, ethyl esterHexane, 2,4-dimethyl-,Isonicotinaldehyde, o-propyloxime1,9-decadieneSulfide, ethyl isopropyl,3-decyneSulfide, butyl ethyl,Mercury, Diethyl-,Decyl disulfide
Pentane, 1-iodo-,2-IodopropaneFormic acid, isopentyl esterDecane, 1- fluoro-,Pentane, 3-ethyl-,Formic acid, propyl ester1-iodopropaneIsopropyl disulfideCarbamic acid, allyl-, ethyl ester1- Tridecene2-NonadecanoneDisiloxane, hexamethyl-,Benzaldehyde, o-ethoxy-,Phosphonic acid, vinyl-, diethyl ester1-Hexanol, 2-ethyl-, phosphite
(continued on next page)
23B.K. Lavine et al. / Microchemical Journal 103 (2012) 21–36
Tetramethylurea2-hexene, 2,5-dimethyl-,Imidazole-2-carboxaldehyde, 1-benzyl-,Heptadecane, 6,9,12-tripropyl-,Acetic anhydridePropionic anhydride2,6,6-trimethylbicyclo[3.1.1]hept-2-eneHeptane, 1-iodopentadecafluoro-,2-Benzofurancarboxaldehyde, 3-methyl-,Formamide, N-A-methylbenzyl-Phosphine oxide, dimethyltetra-decyl-,Ammonium thiocyanate, tetrapentyl-,Valeric acid, 4-hydroxy-3-mercapto-, G-lactonePhosphine oxide, dimethylhexa-decyl-,Benzo-B-Thiophene-2-carboxaldehyde, 7-methyl-,Carbamic acid, dimethyl-, M-nitro-phenyl ester1-Pyrrolidinepropionitrile, B- oxo-,2,6-Pyridinedicarboxylic acid, 4-methoxy-, dimethyl ester1-oxa-6-thiacycloheptadecan-17-onePhosphoramidic acid, cyclohexyl-, diethyl esterAcetamide, N-butyl-N-P-tolyl-sulfonyl-,3-quinolinecarboxaldehydeDocosaneCyclohexane, 1-hexyl-4-tetradecyl-, trans-,Cyclopentane, butyl-,2-hexanone, 5- methyl-, oxime3-furoic acid, 5-formyl-2-trifluoro-methyl-ethyl esterSalicylaldehyde,5-methoxy-,Cyclohexane, vinyl-,
Ethyl phosphonateCyclohexene, 1-methyl-,Octanoyl chlorideMethyl sulfide1-Butene, 2-methyl-,Acetyl chloride liquidPhosphonic acid, 1-butyl-, dibutyl esterHexyl phosphite1-Hexene2-pentene, 4-methyl-,Thiophene, 2-iodo-,1-piperazine carboxylic acid, methyl ester2-Thiophenecarboxaldehyde, 5-chloro-,Formamide, N-ethyl-,Carbamic acid, dibutyl-, ethyl esterAcetamide, N,N-diisopropyl-,Benzaldehyde, 2,3,4-trimethoxy-,Malonic acid, piperonyl-, diethyl esterEthyl sulfiteMethyl sulfate-D62-pentanone, oximePentyl sulfite2-octanone, oximeCycloocteneNicotinaldehyde2-Norbornene2-Imidazolidinone,1-allyl-,Tin, tetraethyl-,Tin trichloride, butyl-,Silane, tetramethyl-,dimethyl sulfoxideCycloheptatrien-1-one, 2,4,6-, 2-hydroxy-4- isopropyl-,lactamide
Ethylene, 1,1-difluoro-,Cyclobutane, octafluoro-Ethylene, fluoro-,Methane, trifluoro-,Pyrrole-2-carboxaldehydeTropoloneM-dithianeCinnamic acid, o-bromo-a-cyano-,ethyl esterDimethyl hydrogen phosphite3,5-heptanedione, 2,2,6,6-tetramethyl-,Glycolic acid, ethyl ester4-octanone, 5-hydroxy-,Acrylamide, N-1,1-dimethyl-3-oxobutyl-Formic acid, chloro-, hexyl esterP-Benzoquinone, 2,6-Dimethyl-,Benzophenone, decafluoro-,Thiadiazole, 1,3,4-,2,5-dimethyl-,Benzophenone, 2-amino-2,5-di-chloro-,FlavanoneNicotinic acid, hydrazideMaleic acid, 2-acetyl-1,2-di-methylhydrazino, dimethyl ester8-Hexadecanone, 9-hydroxy-,Hydantoin, 1-acetyl-3,5-dimethyl-2-thio-,5-Pyrimidinecarboxylic acid, 2,4-bis-methyl thio-ethyl esterAcetic acid, bromo-,pentachloro-phenyl ester1,4-Piperazinedicarboxylic acid, diethyl esterPhthalimide, N-1-formylethyl-dl-,2-Azetidinone, 1,4-diphenyl-3-ethyl-,Hydantoin, 5,5-dimethyl-2-thio-,Butyrophenone, 4PR-Hydroxy-,2-butanone, 3,3-dimethyl-, oximeHippuric acid, methyl estervanillin, acetatevanillin, 6-bromo-,1-butene, 3,3-dimethyl-,Tin, tetramethyl-,Pentane, 3,3-dimethyl-,3-heptene, 2,2-dimethyl-, trans-,Glutaric acid, 3-oxo-, diethyl esterEthylene, tetrafluoro-,Methane, fluoro-,Silane, tetrafluoro-,1-pentene, 2,4,4-trimethyl-,1-Octene2-hexene, trans-,3-hexene, trans-,Pentane, 2,3,3-trimethyl-,
Benzothiazin-3,4H-one, 2H-1,2- 2-ethyl-, 1,1-dioxide3,8-diazabicyclo-3.2.1-octan-2-one, 8-methyl-3-3-methyl-2-butenyl-Ethane, hexafluoro-,Ethane, 1,1-difluoro-,Butane2-Butene, trans-,1-ButeneEthanePropanePropeneIsobutaneIsobutylene
Table 1 (continued)
24 B.K. Lavine et al. / Microchemical Journal 103 (2012) 21–36

25B.K. Lavine et al. / Microchemical Journal 103 (2012) 21–36
compounds that contain both the carbonyl and hydroxyl function-ality. For these reasons, searching spectral libraries for carboxylicacids often gives positive identification for organic compoundmixtures containing both a broad O-H group and a narrow C=Ofunctionality. Because of these complications, the successful develop-ment of a carboxylic acid search prefilter for IR library searching haseluded previous workers [16–18]. Using wavelet transformed IR spec-tra, we will demonstrate that search prefilters developed from infor-mative wavelet coefficients that are identified using a patternrecognition GA can accurately screen organic compounds for thepresence of carboxylic acids with a high degree of accuracy.
In this study, vapor phase spectra of carboxylic acids where the O-Hgroup is not hydrogen bonded are investigated. TheO-H stretch in vaporphase spectra is relatively narrow and it is unusual to have the carboxyl-ic acid O-H group overlapped by the O-H stretching band of otherhydroxylic compounds. As liquid carboxylic acids have a broad O-Hstretching vibration that can be confused with other compoundscontainingO-H and carbonyl groups, someof the problems encounteredwhen searching liquid phase spectral libraries are avoided.
2. IR spectral data
All vapor phase IR spectra used in this study were collected from4000 cm−1 to 450 cm−1 with a nominal resolution of 4 cm−1 acrossthe entire spectral region using either a Digilab FTS-14 or FTS-15 Fou-rier transform spectrometer. A Sadtler 102 chromatographic infraredanalyzer (CIRA) was used as the sampling device to measure all
Table 2Validation set 1.
Valeric acid, 2-ethyl-4-methyl-,Adipic acid, 2-5-dimethyl-,Valeric acid, 5-hydroxy-4-methyl-, acetateAcetic acid, p-tolyl-,Valeric acid, 5-amino-,Benzoic acid, 3,5-dimethyl-,Benzoic acid, 3-trifluoromethyl-,Acetic acid, 3,5-xylyloxy-,3-Octenoic acidButyric acid, 4-phenyl-,Acetic acid, iodo-,O-toulic acid, a-carboxy-,Glutaric acid, 3-methyl-,Cinnamic acid, a-methyl-,9-Octadecenoic acid, trans-,2-Naphthoic acid, 1,2,3,4-tetra-hydro-,Adipic acid, monoethyl esterPyrazinecarboxylic acidCyclopentaneacetic acid, 1-hydroxy-a-phenoxy-,Cyclopentanepropionic acid, 2-trans-carboxymethyl-3-oxo-,Fumaric acid, monoundecyl ester2-Tetradecenoic acid, trans-,4-Pentynoic acid, 5-phenyl-,Butyric acid, 3-methyl-2-o-tolyl-,2-ThiophenecarboxaldehydeHeptadecane, 6,12-diethyl-9-pentyl-Butyric acid, Ethyl esterEthyl phosphateFormic acid, methyl esterAnthranilic acid, methyl esterSalicylic acid, benzyl esterCarbonic acid, diethyl esterFormic acid, chloro-, phenyl esterMethacrylic acid, 2-hydroxyethyl ester1,5-cyclooctadieneHeptane, 2,2,4,6,6-pentamethyl-,Anthranilic acid, cyclohexyl esterBenzophenone, 2-hydroxy-5-methyl-,Methacrylic acid, 2-dimethylamino-ethyl esterSalicylic acid, isopentyl esterDicyclopentadieneCyclododecene
reference spectra. The carrier gas was helium. All IR spectra measuredand recorded generally conformed to Coblentz specifications [19]. Thecompounds were examined at temperatures ranging from 25 °C to300 °C depending on the vaporization temperature required for theparticular compound and the stability of the compound. Thermallysensitive compounds such as esters and acid chlorides were mea-sured at the lowest possible cell temperature to reduce oxidation orthermal decomposition while the reference spectra were measured.For liquid samples, 1 μl of sample was injected into the CIRA at the se-lected injection port and cell temperature. For samples that weresolids at ambient temperature, approximately 1 mg of sample was in-troduced into the system using the CIRA solid sampling accessory.
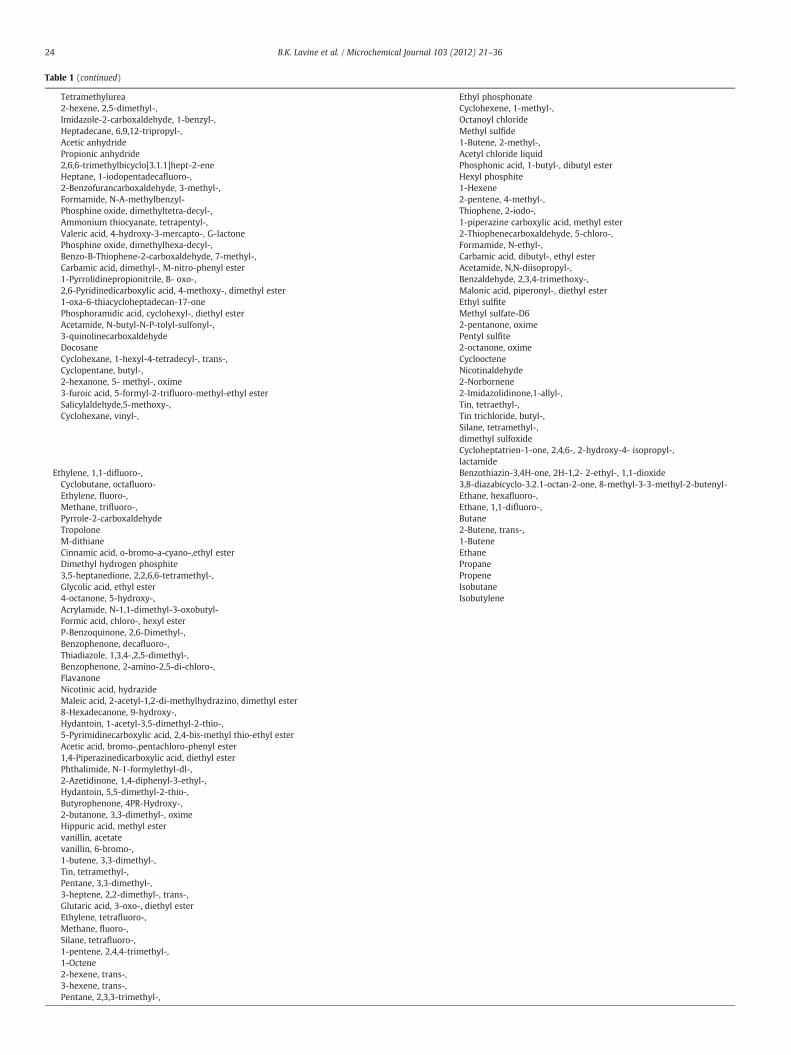
The vapor phase IR spectra were divided into a training set (seeTable 1) of 430 spectra and two validation sets of 84 (see Table 2)and 253 spectra (see Table 3) respectively. The training set consistedof 140 carboxylic acids and 290 noncarboxylic acids (see Table 4).Noncarboxylic acids included aldehydes, ketones, esters, amides,acid chlorides as well as compounds that contained at least two ofthese functionalities. The first validation set (see Table 5) consistedof 24 carboxylic acids, 17 phosphates, alkenes, alkynes, and alkanes,16 esters, 12 ketones, 13 amides, 6 alcohols, 1 aldehyde, and 1 acidchloride. 9 validation set compounds had more than one functionalgroup and 6 of these compounds had both the carbonyl and hydroxylgroups. The second validation set consisted of 240 carboxylic acidsand 13 noncarboxylic acids. The noncarboxylic acids (see Table 3) in-cluded 2 alkanes, 3 alkenes, 2 amides, 2 esters, 2 ketones, 1 aldehydesand 1 thiol.
Acetophenone, 3'- fluoro-4′- methoxy-,Adamantane, 1,3-dimethyl-,cis-decahydronaphthaleneHexahydro-2-Azepinone2(10)-PineneMercury, chloroethyl-,P-Benzoquinone, 2,5-Dihydroxy-,Furan, 3,4-Bis-acetoxymethyl-,TricosaneFluorene, dodecahydro-,Carbamic acid, diphenyl-, ethyl esterCarbamic acid, isopropyl esterCyclotetrasiloxane, octamethyl-,Boric acid, 2-ethylhexyl esterSuccinyl chlorideCyclohexane, trans-1,2-dimethyl-,Acetanilide, 2-chloro-4′-nitro-,Phthalimide, N-2-Hydroxoyethyl-Succinimide, N-P-Chloroanilino- methyl-Nicotinamide, N,N-dipropyl-,2-Penten-4-one, 2-hydroxy-5-methoxy-,Octyl disulfideAcetophenone, 2′,3′,4′-tri-hydroxy-,AS-triazine-3,5-2H,4H-dione,2-methyl-Phosphine oxide, diethyltetra-decyl-,Pyridizineacetic acid,1-6H-3-chloro-6-oxo-, ethyl esterHydantoin, 1-ethyl- 3-methyl-2-thio-,Acetamide, N-ethyl-N-P-tolyl-sulfonyl-,Cyclohexane, 1-dodecyl-4-octyl-, trans-,Ketone, di-2-pyridyl,1,4-Naphthoquinone, 3-methyl- 2,5,8-trihydroxy-,1-butene, 3-methyl-,Octadecane, 1-iodo-,FuroinKetone, 4-methyl-2-pyridyl 2-thienyl,Piperidine, 1-trichloroacetyl-,Butyric acid, hydrazide2-cyclohexen-1-one, 3-amino-5,5-di-methyl-,10-Eicosanone, 11-hydroxy-,Propionic acid, 3-6-hydroxy-M-anisoyl-methyl esterBenzoic acid, 3,4-dihydroxy-, ethyl ester2-Propen-1-one, 1,3-di-2-thienyl-,
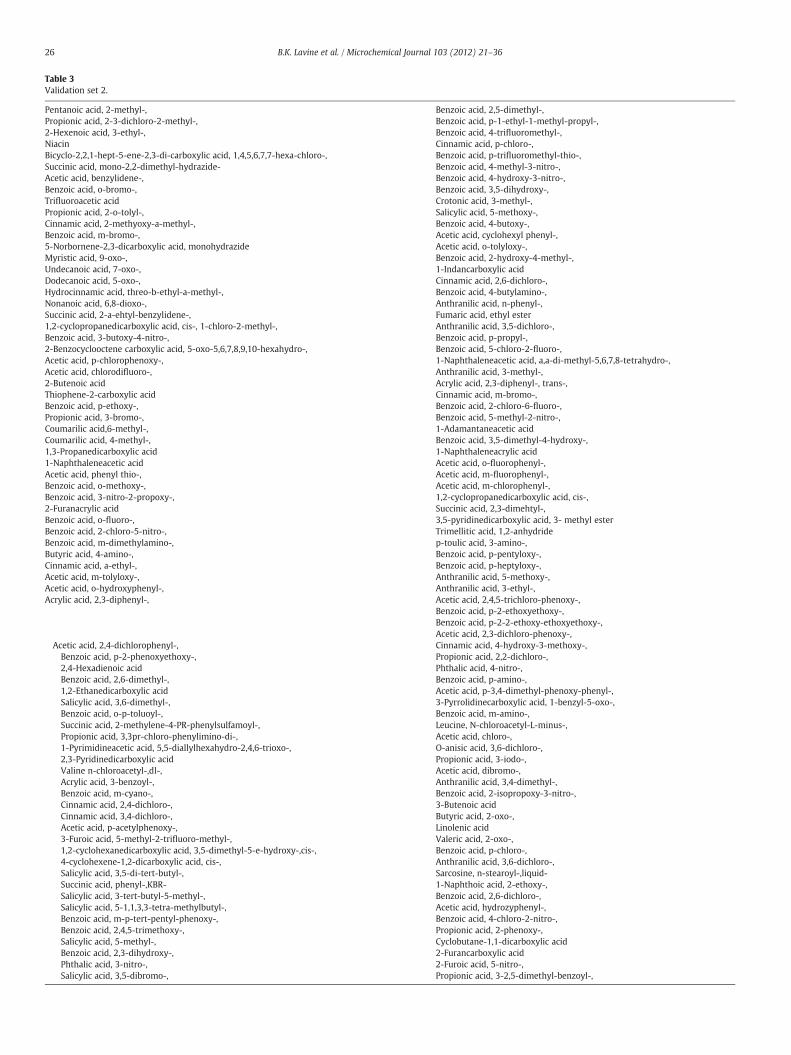
Table 3Validation set 2.
Pentanoic acid, 2-methyl-,Propionic acid, 2-3-dichloro-2-methyl-,2-Hexenoic acid, 3-ethyl-,NiacinBicyclo-2,2,1-hept-5-ene-2,3-di-carboxylic acid, 1,4,5,6,7,7-hexa-chloro-,Succinic acid, mono-2,2-dimethyl-hydrazide-Acetic acid, benzylidene-,Benzoic acid, o-bromo-,Trifluoroacetic acidPropionic acid, 2-o-tolyl-,Cinnamic acid, 2-methyoxy-a-methyl-,Benzoic acid, m-bromo-,5-Norbornene-2,3-dicarboxylic acid, monohydrazideMyristic acid, 9-oxo-,Undecanoic acid, 7-oxo-,Dodecanoic acid, 5-oxo-,Hydrocinnamic acid, threo-b-ethyl-a-methyl-,Nonanoic acid, 6,8-dioxo-,Succinic acid, 2-a-ehtyl-benzylidene-,1,2-cyclopropanedicarboxylic acid, cis-, 1-chloro-2-methyl-,Benzoic acid, 3-butoxy-4-nitro-,2-Benzocyclooctene carboxylic acid, 5-oxo-5,6,7,8,9,10-hexahydro-,Acetic acid, p-chlorophenoxy-,Acetic acid, chlorodifluoro-,2-Butenoic acidThiophene-2-carboxylic acidBenzoic acid, p-ethoxy-,Propionic acid, 3-bromo-,Coumarilic acid,6-methyl-,Coumarilic acid, 4-methyl-,1,3-Propanedicarboxylic acid1-Naphthaleneacetic acidAcetic acid, phenyl thio-,Benzoic acid, o-methoxy-,Benzoic acid, 3-nitro-2-propoxy-,2-Furanacrylic acidBenzoic acid, o-fluoro-,Benzoic acid, 2-chloro-5-nitro-,Benzoic acid, m-dimethylamino-,Butyric acid, 4-amino-,Cinnamic acid, a-ethyl-,Acetic acid, m-tolyloxy-,Acetic acid, o-hydroxyphenyl-,Acrylic acid, 2,3-diphenyl-,
Benzoic acid, 2,5-dimethyl-,Benzoic acid, p-1-ethyl-1-methyl-propyl-,Benzoic acid, 4-trifluoromethyl-,Cinnamic acid, p-chloro-,Benzoic acid, p-trifluoromethyl-thio-,Benzoic acid, 4-methyl-3-nitro-,Benzoic acid, 4-hydroxy-3-nitro-,Benzoic acid, 3,5-dihydroxy-,Crotonic acid, 3-methyl-,Salicylic acid, 5-methoxy-,Benzoic acid, 4-butoxy-,Acetic acid, cyclohexyl phenyl-,Acetic acid, o-tolyloxy-,Benzoic acid, 2-hydroxy-4-methyl-,1-Indancarboxylic acidCinnamic acid, 2,6-dichloro-,Benzoic acid, 4-butylamino-,Anthranilic acid, n-phenyl-,Fumaric acid, ethyl esterAnthranilic acid, 3,5-dichloro-,Benzoic acid, p-propyl-,Benzoic acid, 5-chloro-2-fluoro-,1-Naphthaleneacetic acid, a,a-di-methyl-5,6,7,8-tetrahydro-,Anthranilic acid, 3-methyl-,Acrylic acid, 2,3-diphenyl-, trans-,Cinnamic acid, m-bromo-,Benzoic acid, 2-chloro-6-fluoro-,Benzoic acid, 5-methyl-2-nitro-,1-Adamantaneacetic acidBenzoic acid, 3,5-dimethyl-4-hydroxy-,1-Naphthaleneacrylic acidAcetic acid, o-fluorophenyl-,Acetic acid, m-fluorophenyl-,Acetic acid, m-chlorophenyl-,1,2-cyclopropanedicarboxylic acid, cis-,Succinic acid, 2,3-dimehtyl-,3,5-pyridinedicarboxylic acid, 3- methyl esterTrimellitic acid, 1,2-anhydridep-toulic acid, 3-amino-,Benzoic acid, p-pentyloxy-,Benzoic acid, p-heptyloxy-,Anthranilic acid, 5-methoxy-,Anthranilic acid, 3-ethyl-,Acetic acid, 2,4,5-trichloro-phenoxy-,Benzoic acid, p-2-ethoxyethoxy-,Benzoic acid, p-2-2-ethoxy-ethoxyethoxy-,Acetic acid, 2,3-dichloro-phenoxy-,
Acetic acid, 2,4-dichlorophenyl-,Benzoic acid, p-2-phenoxyethoxy-,2,4-Hexadienoic acidBenzoic acid, 2,6-dimethyl-,1,2-Ethanedicarboxylic acidSalicylic acid, 3,6-dimethyl-,Benzoic acid, o-p-toluoyl-,Succinic acid, 2-methylene-4-PR-phenylsulfamoyl-,Propionic acid, 3,3pr-chloro-phenylimino-di-,1-Pyrimidineacetic acid, 5,5-diallylhexahydro-2,4,6-trioxo-,2,3-Pyridinedicarboxylic acidValine n-chloroacetyl-,dl-,Acrylic acid, 3-benzoyl-,Benzoic acid, m-cyano-,Cinnamic acid, 2,4-dichloro-,Cinnamic acid, 3,4-dichloro-,Acetic acid, p-acetylphenoxy-,3-Furoic acid, 5-methyl-2-trifluoro-methyl-,1,2-cyclohexanedicarboxylic acid, 3,5-dimethyl-5-e-hydroxy-,cis-,4-cyclohexene-1,2-dicarboxylic acid, cis-,Salicylic acid, 3,5-di-tert-butyl-,Succinic acid, phenyl-,KBR-Salicylic acid, 3-tert-butyl-5-methyl-,Salicylic acid, 5-1,1,3,3-tetra-methylbutyl-,Benzoic acid, m-p-tert-pentyl-phenoxy-,Benzoic acid, 2,4,5-trimethoxy-,Salicylic acid, 5-methyl-,Benzoic acid, 2,3-dihydroxy-,Phthalic acid, 3-nitro-,Salicylic acid, 3,5-dibromo-,
Cinnamic acid, 4-hydroxy-3-methoxy-,Propionic acid, 2,2-dichloro-,Phthalic acid, 4-nitro-,Benzoic acid, p-amino-,Acetic acid, p-3,4-dimethyl-phenoxy-phenyl-,3-Pyrrolidinecarboxylic acid, 1-benzyl-5-oxo-,Benzoic acid, m-amino-,Leucine, N-chloroacetyl-L-minus-,Acetic acid, chloro-,O-anisic acid, 3,6-dichloro-,Propionic acid, 3-iodo-,Acetic acid, dibromo-,Anthranilic acid, 3,4-dimethyl-,Benzoic acid, 2-isopropoxy-3-nitro-,3-Butenoic acidButyric acid, 2-oxo-,Linolenic acidValeric acid, 2-oxo-,Benzoic acid, p-chloro-,Anthranilic acid, 3,6-dichloro-,Sarcosine, n-stearoyl-,liquid-1-Naphthoic acid, 2-ethoxy-,Benzoic acid, 2,6-dichloro-,Acetic acid, hydrozyphenyl-,Benzoic acid, 4-chloro-2-nitro-,Propionic acid, 2-phenoxy-,Cyclobutane-1,1-dicarboxylic acid2-Furancarboxylic acid2-Furoic acid, 5-nitro-,Propionic acid, 3-2,5-dimethyl-benzoyl-,
26 B.K. Lavine et al. / Microchemical Journal 103 (2012) 21–36
Propionic acid, 2-p-tert-butyl-phenoxy-,Acetic acid, p-chlorophenyl-,p-anisic acid, 3-amino-,Propionic acid, 2-o-chlorophen-oxy-,3-Furoic acidAcetic acid, p-ethoxyphenylthio-,Anthranilic acid, 5-methyl-,Acetic acid, dodecylthio-,m-toluic acid, 2-amino-5-chloro-,Cinnamic acid, o-chloro-,Benzoic acid, m-fluoro-,Benzoic acid, 2-chloro-3-nitro-,Acetic acid, 3,4-dichlorophenyl-,Anthranilic acid, n-methyl-,Benzoic acid, o-amino-,Salicylic acid, 3-phenyl-,
Acetic acid, m-hydroxyphenyl-,Benzoic acid, o-acetyl-,Benzoic acid, p-methylthio-,2-Furoic acid, 5-bromo-,Propionic acid, 3-phenoxy-,Propionic acid, 3-chloro-,2-Thiophenecarboxylic acid, 5-methyl-,Benzoic acid, 3,5-dichloro-,4-Cyclooctene-1-carboxylic acidAcetic acid, A-P-chlorophenyl-a-methyl-,Benzoic acid, 2-chloro-5-fluoro-sulfonyl-,Benzoic acid, p-methoxy-,Acetic acid, p-fluorophenyl-,Undecanedioic acidBenzoic acid, 5-chloro-2-nitro-,Salicylic acid, 3-methyl-,Benzoic acid, 3,5-dimethoxy-,Benzoic acid, o-phenoxy-,Cinnamic acid, 2,5-dimethoxy-,
2-Benzofuranacrylic acid, 5-chloro-A,3-dimethyl-,2-Benzofuranacrylic acid, 5-chloro-A,3-dimethyl-,Cinnamic acid, 3,4-dimethoxy-,Acetic acid, p-fluorophenoxy-,2-Pyrrolidinecarboxylic acid, 5-oxo-,2-Butenoic acid, cis-2-methyl-,Benzoic acid, p-cyano-,Valeric acid, 4-methyl-2-oxo-,Nonadecanoic acidBenzoic acid, 3-hydroxy-4-nitro-,Benzoic acid, 3,5-dinitro-,Cinnamic acid, 3,4,5-trimethoxy-,2-Indolecarboxylic acidDodecanoic acid, 2-hydroxy-,2-Thiopheneacetic acidTricontanoic acidBenzoic acid, 3,5-dimethoxy-4-hydroxy-,Hexadecanoic acid, 2-bromo-,Nicotinic acid, 6-chloro-,Benzoic acid, 2,4-dimethoxy-,Octanoic acid, 2-hydroxy-,Heneicosanoic acidCinnamic acid, a-fluoro-,Terephthalic acid, tetrachloro-,Benzoic acid, 2-chloro-4-nitro-,3-Hexenoic acidOctanoic acid, 2-bromo-,2-pentenoic acid, 4-methyl-,3-Nonenoic acidAcetic acid, 3,4-methylenedioxy-phenyl-,Valeric acid, 2-hydroxy-4-methyl-,Benzoic acid, p-butyl-,Cinnamic acid, m-methoxy-,Acetic acid, 3,4,5-trimethoxy-phenyl-,Propionic acid, 3,3PR-thio-di-,Hydrocinnamic acid, 3,4,5-tri-methoxy-,2-Dodecenedioic acid, trans-,2-Furoic acid, 5-ethyl-,Cinnamic acid, m-trifluoro-methyl-,Acetic acid, pentafluorophenoxy-,Acetic acid, isobutoxy-,Cinnamic acid, a-methyl-m-nitro-,2H-Cyclopenta-b-furan-4-propionic acid, hexahydro-2-oxo-,Benzoic acid, 4-amino-3-nitro-,Dodecanoic acid, 2-bromo-,Crotonic acid, 2-methyl-, trans-,
13-Docosenoic acid, cis-,Salicylic acid, Salicylate1,8-Naphthyridine-3-carboxylic acid, 1,4-dihydro-1-ethyl-7-methyl-4-oxo-2-Hexadecenoic acid, trans-,3-Benzofuranpropionic acid, 2,3-dihydro-5-methoxy-,2-Benzofuranpropionic acid, 5-chloro-,Hydrocinnamic acid, 2-bromo-4,5-di-methoxy-,4H-Pyran-3-carboxylic acid, 5,6-dihydro-2-methyl-MethylcyclohexaneCyclohexane, pentyl-,1,1-Cyclopropanedicarboxylic acid, diethyl esterBenzenethiol, M-Methoxy-,Cyclohexene, 4-isopropenyl-1-methyl-,D-,CyclodecanoneKetone, Methyl 2-Thienyl,Phosphorothioic acid, o,o-dimethyl o-2-nitro-p-tolyl esterAcetamide, 2-chloro-N,N-diiso-propyl-,3-fluoro-p-anisaldehydeCyclopropanecarboxamide, N- ethyl- 2-phenyl-, cis-,Bivinyl1,5-Heptadiene, 2-methyl-,
27B.K. Lavine et al. / Microchemical Journal 103 (2012) 21–36
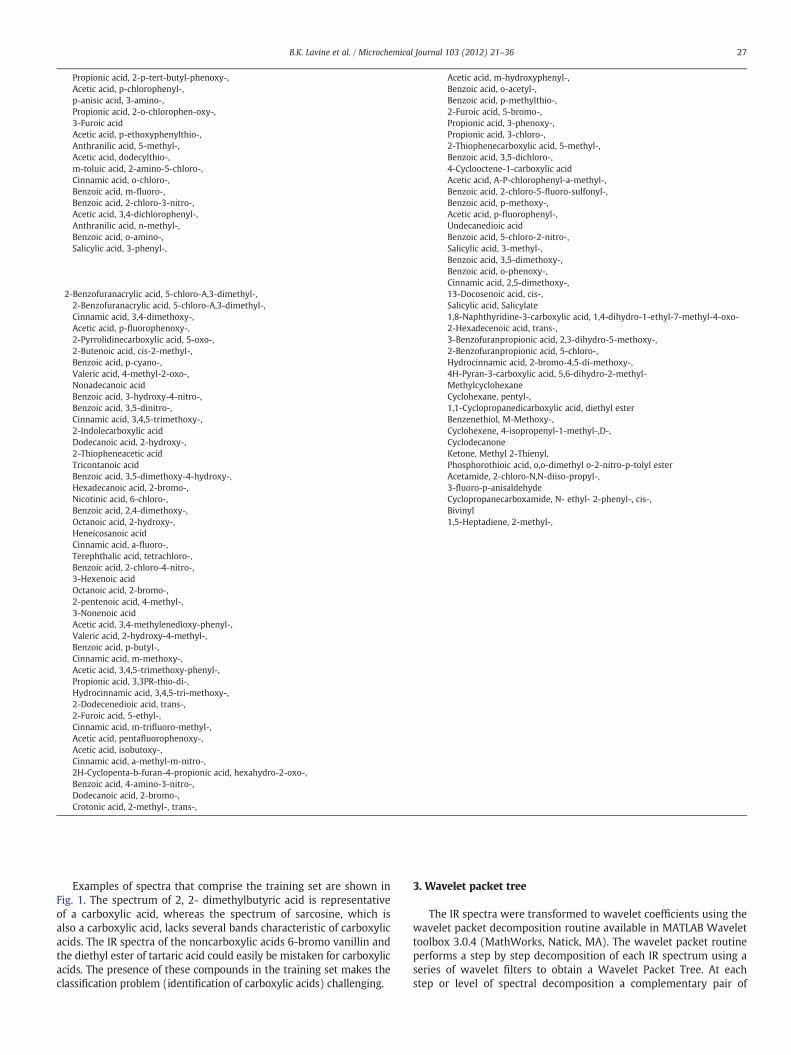
Examples of spectra that comprise the training set are shown inFig. 1. The spectrum of 2, 2- dimethylbutyric acid is representativeof a carboxylic acid, whereas the spectrum of sarcosine, which isalso a carboxylic acid, lacks several bands characteristic of carboxylicacids. The IR spectra of the noncarboxylic acids 6-bromo vanillin andthe diethyl ester of tartaric acid could easily be mistaken for carboxylicacids. The presence of these compounds in the training set makes theclassification problem (identification of carboxylic acids) challenging.
3. Wavelet packet tree
The IR spectra were transformed to wavelet coefficients using thewavelet packet decomposition routine available in MATLAB Wavelettoolbox 3.0.4 (MathWorks, Natick, MA). The wavelet packet routineperforms a step by step decomposition of each IR spectrum using aseries of wavelet filters to obtain a Wavelet Packet Tree. At eachstep or level of spectral decomposition a complementary pair of

Table 4EPA vapor phase library spectra training set.
Functional group No. ofcompounds
Carboxylic acids 140Negative class (phosphates, alkenes, alkynes, alkanes) 202Aldehydes (10 aldehydes also contained ethers, 2 containedamine, 2 had esters and 1had amide)
25
Ketones (6 ketones also contained alcohol, 2 had amine, 1had ester and 1 had ether)
20
Esters (7 were also amides, 4 had ether, 3 had amine, 2 hadalcohol, 2 had aldehyde, 1 had ketone and 1 had acid chloride )
26
Amides (7-esters, 4-amines, 2-alcohols, 1-aldehyde) 30Acid chlorides 3
28 B.K. Lavine et al. / Microchemical Journal 103 (2012) 21–36
low-pass and high-pass wavelet filters is used that consist of scaledwavelet functions corresponding to that level of decomposition. The lowpass wavelet filter uses a stretched out smoother (high scaled) form ofwavelet function which extracts lower frequency signal componentsfrom the spectrum. The high pass wavelet filter uses a compressed (lowscaled) form of wavelet function with rapidly changing features thatextracts higher frequency components of the signal from the spectrum.When a spectral signal is passed through a wavelet filter, the similaritybetween the scaled wavelet function and sections of the signal is re-presented by wavelet coefficients that form a wavelet packet. At thefirst level of decomposition the spectrum is broken down into a low-frequency and a high-frequency wavelet packet. Each wavelet packetformed is further broken down into two more wavelet packets at sub-sequent levels until the required level of decomposition is achieved thusproducing the Wavelet Packet Tree. The wavelet coefficients from eachwavelet packet of the wavelet packet tree were than organized in formof a data vector to represent that IR spectrum.
4. Genetic algorithm for pattern recognition analysis
The wavelet packet transformed data was analyzed using a geneticalgorithm (GA) developed for pattern recognition and featureselection. The pattern recognition GA selects wavelet coefficientsfrom the data that optimize the separation of carboxylic acids fromnon carboxylic acids in a principal component (PC) plot of the data.The principal component analysis (PCA) routine incorporated in thefitness function of the pattern recognition GA acts as an informationfilter that confines the search space to only those wavelet coefficientswhose PC plots show clustering on the basis of functional group. Aboosting routine incorporated into the fitness function enables thepattern recognition GA to focus on spectra or functional groups that aredifficult to classify by changing the value of their sample (spectrum)weight or class (functional group) weight. Spectra that are alwayscorrectly classified are weighed less heavily than spectra that are consis-tently misclassified. Over time, the pattern recognition GA learns its opti-mal parameters using a mechanism similar to that of a neural network.
Table 5EPA Vapor Phase Library Spectra Validation Set I.
Functional group No. ofcompounds
Carboxylic acids 24Negative class (phosphates, alkenes, alkynes, alkanes) 17Esters (1 ester contained OH, 3 esters contained amine and 2contained amide)
16
Ketones (4 ketones contained OH and 1 contained amine) 12Amides (1 amide contained OH and 2 contained esters) 13Alcohols 6Acid chloride 1Aldehyde 1
The fitness function of the pattern recognition GA, known asPCKaNN, uses machine learning to score the PC plots. To identifywavelet coefficients that optimize the separation of carboxylic acidsand noncarboxylic acids in a PC plot of the data, sample and classweights (see Eqs. (1) and (2)), which facilitate the tracking and scoringof the PC plots and their corresponding wavelet coefficient subsets, arecomputed during each generation. CW(c) is theweight of class c (c variesfrom 1 to the total number of classes in the data set), and SW(s) is thesample weight of sample s in the class. The sum of the sample weightsthat comprise a class is equal to its class weight, and the class weightssum to 100.
CWðcÞ ¼ 100CWðcÞ
∑c
CWðcÞ ð1Þ
SW sð Þ ¼ CWðcÞ SW sð Þ∑s∈c
SW sð Þ : ð2Þ
The fitness function score, F(d), for each chromosome (waveletcoefficient subset) is computed using Eq. (3). Euclidean distancesare computed between a given sample point and every other pointin the PC plot. These distances are than arranged from smallest tolargest for each sample. Kc for class c in Eq. (3) is a user definedvalue. For each sample (spectrum) in the data set, a poll is taken ofthe sample's Kc nearest neighbors. For the most rigorous classificationof the data, the value of Kc is equal to the number of samples comprisingclass c. The sample hit count (SHC), which is the number of Kc nearestneighbors samples with the same class label as the data point in ques-tion, is computed for each spectrum (0bSHC(s)bKc). The contributionof each sample in class c to the overall fitness is then computed. Thesum of the individual sample contributions of class c gives the contribu-tion of class c to the overall fitness score, and the sum of the contribu-tions of all of the classes yields the value of F(d).
F dð Þ ¼ ∑c∑s∈c
1Kc
� SHCðsÞ � SWðsÞ ð3Þ
Boosting allows the fitness function of the pattern recognition GAto focus on spectra and/or functional groups in the data that are diffi-cult to classify by adjusting their sample and/or class weights oversuccessive generations. This is done by computing the sample-hitrate (SHR) and the class-hit rate (CHR) as shown in Eqs. (4) and (5)respectively. SHR of sample s is the average value of SHC(s)/Kc forthis sample over all of the wavelet coefficient subsets in a generation(φ is the number of chromosomes in the population), whereas CHR isthe average SHR value (AVG) of the samples belonging to that class.Sample weights and class weights are adjusted using a perceptron,see Eqs. (6) and (7), where P is the momentum set by the user, g isthe previous generation, and g+1 is the current generation forwhich new weights are being computed. Samples and classes withlower hit rates are boosted more heavily than samples or classesthat score well. Boosting modifies the fitness function of the patternrecognition GA by altering the class and/or sample weights using in-formation from the previous generation. Boosting minimizes theproblem of convergence to a local optimum as the population isevolving towards a solution.
SHRðsÞ ¼ 1φ
Xφ
i¼1
SHCi sð ÞKc
ð4Þ
CHRgðcÞ ¼ AVGðSHRgðsÞ :∀s∈cÞ ð5Þ
CWgþ1 sð Þ ¼ CWg sð Þ þ Pð1� CHRgðsÞÞ ð6Þ
500 1000 1500 2000 2500 3000 3500 40000
0.5
1Butyric acid, 2,2-dimethyl-,
500 1000 1500 2000 2500 3000 3500 40000
0.5
1Sarcosine, n-cis-9-octadecenoyl-,
500 1000 1500 2000 2500 3000 3500 40000
0.5
1Tartaric acid, diethyl ester
500 1000 1500 2000 2500 3000 3500 40000
0.5
1Vanillin, 6-bromo-,
Fig. 1. Spectra of 2, 2-dimethyl butyric acid, n-cis-9-octadecenonyl-sarcosine, tartaric acid (diethyl ester), and 6-bromo-vanillin.
−1 −0.9 −0.8 −0.7 −0.6 −0.5 −0.4 −0.3 −0.2 −0.1−0.6
−0.4
−0.2
0
0.2
0.4
0.6
0.8
PC1
PC
2
2D PC Plot Dim(444)
1
1
1
1
1
1
1
1
1
1
1
11
1
1
1
1
11
11
1
1
1
1
1
1
1
11
1
1
1
1
1
1
1
1
1
111
1
1
11
1
1
1
11
1
1
1
1
1
1
1
1
1
1
1
1
1
1
1
1
1
1
1
11
1
1
1
1
1
1
1
1
11
11
1
1
1
1
1
1
1
1
1
1
1
1
1
111
1
1 1
1
1
1
1
1
1
1
111
1 1
1
1
1
1
1
1
1 1
11
1
1
1
1
1 1
1
1
11
1
1
11
1
2
2
222 2
2
2
22
2
222
2
2
2
2
2
2
22 2
2
22
2
222
2
2
22
2
2
22222
2
2
2
22 2
2
2
2
22
22
2
22
2
2
22
222
2
2
2
2
2
2
2
2
2
222
22
2
2
2
2
2
2
22
2
2
2
2
2
2
2
22
2
2
2
2
2
22
2
2
2
22
2
2
2
22
22 22
2
2
2
2
2
2
2
2
2
222 2
2
2
2
2
22
2
22
2 2
22
2
22
2
2
22
2
2
2
2
2
2
2
2
2
2
2
2
2
2 2
2
2
2
22
2
2
2
2
2
2
22
2
2
22
22
22
2
2
2
2
2
2
2
2
22
22
2
2
2
2
2
2
22
2 2
2
2
2
2
2
2
2
2
2
2
2
2
2
2
2
2
2 2
2
2
2
2
2
22
2
2
2
2
2
2
2
2
2
2 2
22
2
2
2
2
22 2
22
2
2
2
2
2
2
22
2
2
2
22
2
2
2
2
2
2
2
22
2
2
2
22
2
2
2
22
2
2
2
2
2
222 2
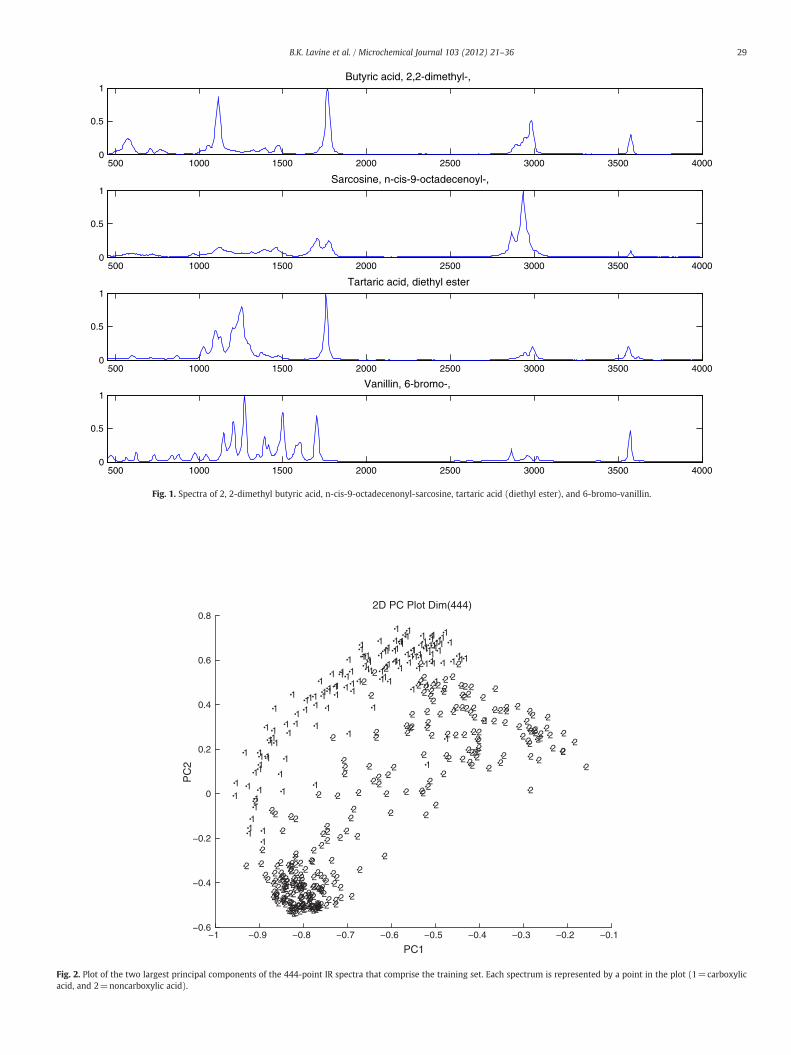
Fig. 2. Plot of the two largest principal components of the 444-point IR spectra that comprise the training set. Each spectrum is represented by a point in the plot (1=carboxylicacid, and 2=noncarboxylic acid).
29B.K. Lavine et al. / Microchemical Journal 103 (2012) 21–36
−0.4 −0.35 −0.3 −0.25 −0.2 −0.15 −0.1 −0.05 0−0.3
−0.2
−0.1
0
0.1
0.2
0.3
0.4
PC1
PC
2
2D PC Plot Dim(8)
11
1 1
1
111
11
1
1
11
1 1 11
11
11
1
1
1
11
1
1
1
11 1
1
11
1
1
1
1
1
1 1
11
1
1
1
1
11
11 111
1
11
1
1
1
1
11
11
1
111
1
1
1
11
1
1
1
11
1
11
1
1
1111
111
1
1
11
1
1111
1
1
1
1
1
1
11
1
1
1
1
11
1
1
1
1
1
1
1
11
1
11 1
1
11
11
1
1
111
1
22
22222
2222222
2
22 2
2
2
22222
2 222
2 222 222 22222
2
22
22 22
2
2
222
2
22 22
2
2 222
2222
2
2222
2222
2
22
2
222
2222
22
22
2
2
2
222
2
22222
2
2222 22 2222222 222
2
22 2
2
22222
22
2
22
2
2 2
2
2
22
22
222 222
2
22
22
22
2
22 2
2
22
2
2
2222
2
2
22
22
2
222
2
2
2
222
2
2
2
22
2
2
22
2 2
2
2 222
2
22
2
222 2
2
22
2
2
2 2
22
22
2
22
2222 2
2
2
2
2
2
2
2
22
2
2 222222
22 2
2
222
2
2
2
22222
2
22
222
2
2
2
2
2
2
2
222
2
2
2
2
2
22
22
2
2222 2222
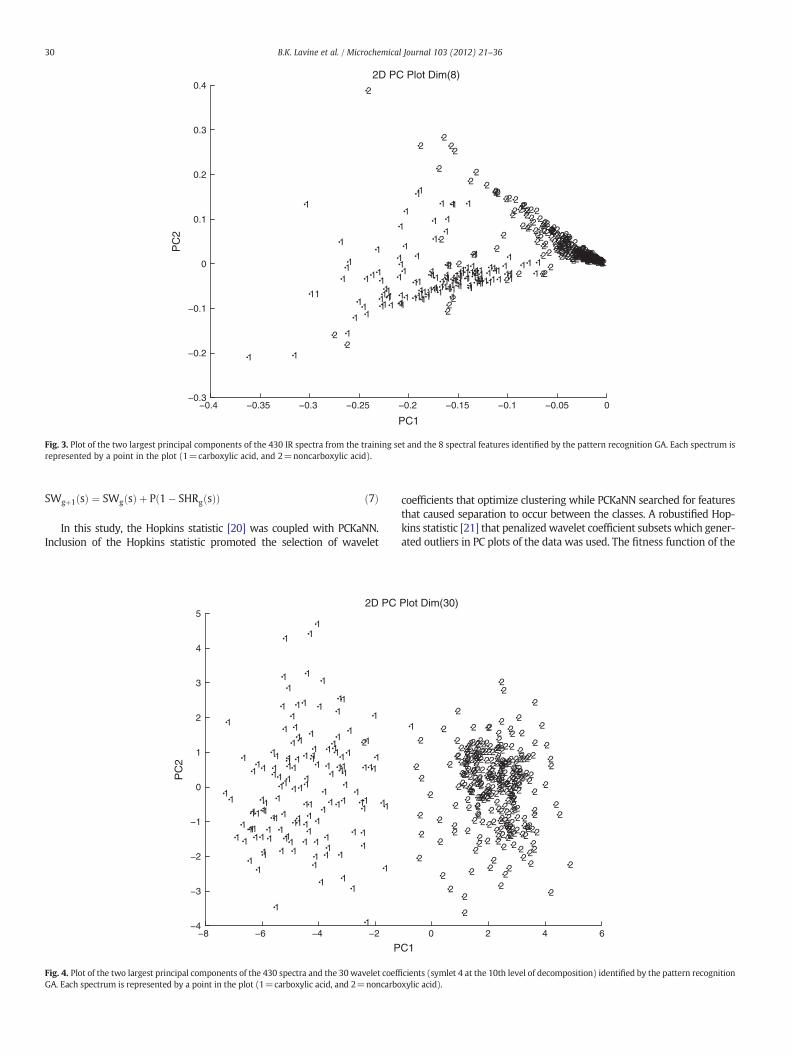
Fig. 3. Plot of the two largest principal components of the 430 IR spectra from the training set and the 8 spectral features identified by the pattern recognition GA. Each spectrum isrepresented by a point in the plot (1=carboxylic acid, and 2=noncarboxylic acid).
30 B.K. Lavine et al. / Microchemical Journal 103 (2012) 21–36
SWgþ1 sð Þ ¼ SWg sð Þ þ Pð1� SHRgðsÞÞ ð7Þ
In this study, the Hopkins statistic [20] was coupled with PCKaNN.Inclusion of the Hopkins statistic promoted the selection of wavelet
−8 −6 −4 −2−4
−3
−2
−1
0
1
2
3
4
5
P
PC
2
2D PC
1
1
1
1
1
1
1
1
11
1
1
11
11
1
1
11
1
11 1
1
11
1
1
1
1
1
1
1
11
1
1
1
11
1
11
1 1
1
1
1
1
11
111
1
1
1
1
1
1
1
1
1
1
11
1
1
1
1
11
1
1
1
1
1
1
1
1
1
1
1
1
1
1
1
1
1
1
1
1
1
1
1
1
1
1
1
1
1
1
1
1
1 11
1
1
1
11
1
1
1
1
11
1
1
1
1
11
1
1 1
1
1
1
1
1
1
1
11
1
1
2
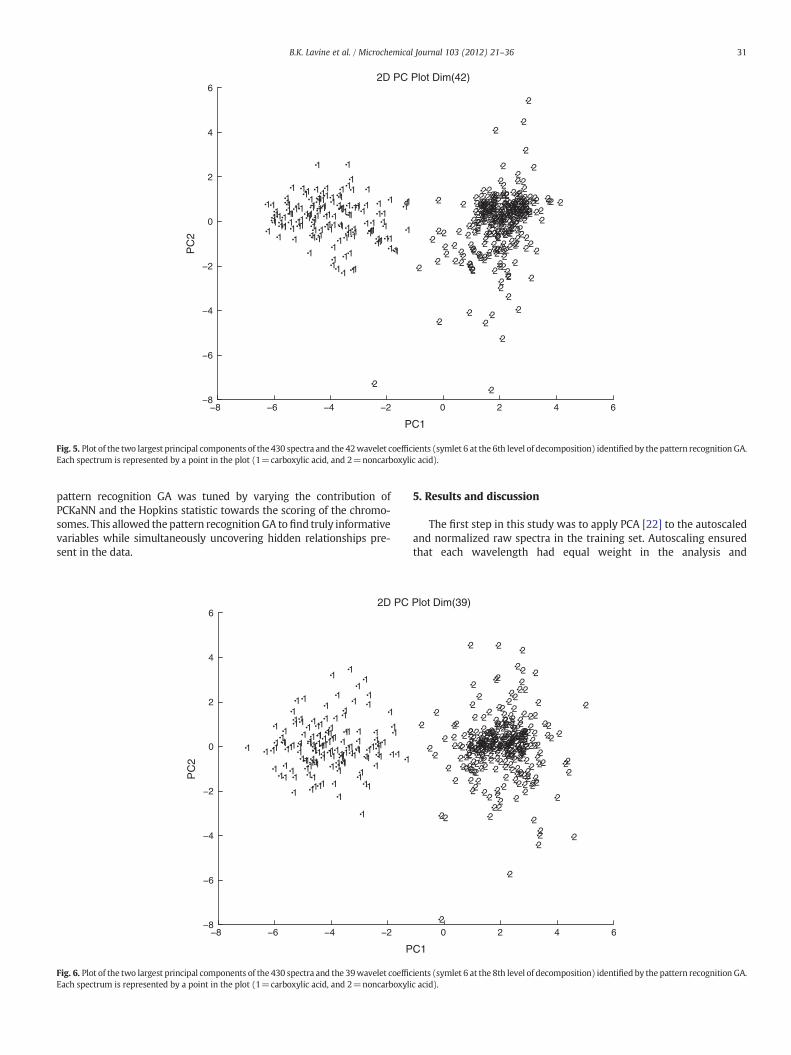
Fig. 4. Plot of the two largest principal components of the 430 spectra and the 30 wavelet coeffiGA. Each spectrum is represented by a point in the plot (1=carboxylic acid, and 2=noncarbo
coefficients that optimize clustering while PCKaNN searched for featuresthat caused separation to occur between the classes. A robustified Hop-kins statistic [21] that penalized wavelet coefficient subsets which gener-ated outliers in PC plots of the data was used. The fitness function of the
0 2 4 6
C1
Plot Dim(30)
1
2
2
2
2
22
22
2222
2 2
2
2
22
2
2
2
2
2
2
2
2
2
222
2
2
2
2
22
2
22
2
22
2
2
2
2
2
2
22
2
2
22
2
22
2
2
22
2
2
2
2
2
2 2
2
2
2
22
2
222
2
2
2
2
22
2
2
22
2
2
2
2
2
2
2
2
22
2
2
2
2 2
2
2
2 22
2
2
2
22
2
2
22
222
2
22
2 2
2
22
22
2
2
22
2
2
2
2
2
22
2
2
2
22
2
2
2
2
2
222
2
2
222
2
2
2
2 2
2
2
2
22
2
2
2
2
2
2
2
2
2
2
2
22
2
222
2
2
2
2
2
2
2
2
2
2
2
222
2
2
2
2
2
22
2
2
2
2
2
2
2
2
2
2
2
2
22
2
22
2
2
2
2
2
2
2
22 22
2
22
2
2
2
22
222
2
2
2
2
2
2
2
2
2
2
2
2
2
2
2
2
22
22
2
2
2
2
2
2
2
2
2
2
2
2
2
2
22
2
2
2
2
2
2
2
2
22
2
2 2
cients (symlet 4 at the 10th level of decomposition) identified by the pattern recognitionxylic acid).
−8 −6 −4 −2 0 2 4 6−8
−6
−4
−2
0
2
4
6
PC1
PC
2
2D PC Plot Dim(42)
1
1
1
1
1 1 1
1 1
1
11 1
11
1
1
1
1
11
11
1
1
11
1
11
1
1
1
1
111
1
1
11
1
1
1
1
1
1
1
1
1
1
1
1
111
11
11
1
1
11
1
1
1
1
1
11
1
1
1
1
1
1
111
1
11 1
11
1
11
1
1
1
1
11
11
1
1
1
11
1
1
1
1
1
1
11
1 1
111
1
1
1
11 1
1 11
1
1
1
11
1
11
1
1 11
1
1
1
1
2
2
2
2 22
2
2
22222
2
2
2
2
2
2
2
2
2
22 2
22
2
22
2
2 2
2
22
2
22
222
2
22
2 2
2
2
2
2 2
2
2
22
2
2
2
22 2
2
2
2
22 22
2
22 2
222
2
2
2
22
2
2
2
22
2
2
2
2
2
2 2
2
2
2
2
2
2 22 222
222
2
2
2
22
2
2
2
2 222
22
2
2
2
2
22
22
2
2
2
2
2
2
2
2
2
2
22
2
2
22
2
2
2 2
2
2
2
2
22
2
22
2
2
2
22
2
2
222 2
22
2
2 2
2
2
22
2
222 2
22
2
222
22
2
2
22
22
2
2
2
2
22
2 2
2
2
2
22
2
2
2
22
22
2
2
2
2
22
22
22
2
2
2
2
2
2
2
2
2
2
2
2
222 22 2
22
2
2
2
22
2
2
2
2
2
222
22
2
2
2
2
2
2
2
2
2 2
2
2
2
22
2
2
2
2
2
2
2
22
22
2
2
22 2
2
2
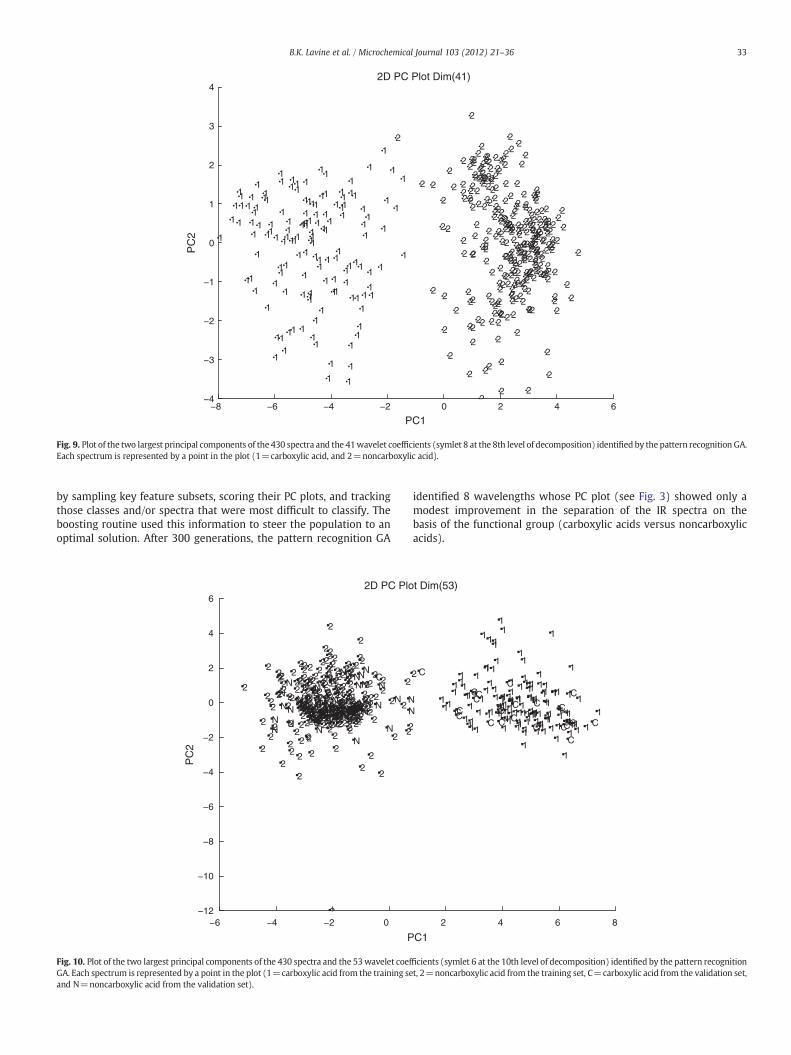
Fig. 5. Plot of the two largest principal components of the 430 spectra and the 42wavelet coefficients (symlet 6 at the 6th level of decomposition) identified by the pattern recognition GA.Each spectrum is represented by a point in the plot (1=carboxylic acid, and 2=noncarboxylic acid).
31B.K. Lavine et al. / Microchemical Journal 103 (2012) 21–36
pattern recognition GA was tuned by varying the contribution ofPCKaNN and the Hopkins statistic towards the scoring of the chromo-somes. This allowed the pattern recognition GA to find truly informativevariables while simultaneously uncovering hidden relationships pre-sent in the data.
−8 −6 −4 −2−8
−6
−4
−2
0
2
4
6
P
PC
2
2D PC
1111
1
11
1
1
1
1
1
1
1
1 1 1
1
11 1 1
11
1111
1
1
1
1
1
1
1
1
11
11
11
1
11
1
11
1
1
1
1
11
1
11
1
1
11
1
1
1
1
1 1
11
1
1
1
1
1
1
1
1
11
11
1
1
1
1
11
1
1
11
1
1
1
1
1
11
1
1
11
1
11
1
1
1
1
1
1
1 11
11
1 11
1
1
1
1
11
1
1
1 1 111 1
1
1
1
1 11
1
Fig. 6. Plot of the two largest principal components of the 430 spectra and the 39wavelet coefficEach spectrum is represented by a point in the plot (1=carboxylic acid, and 2=noncarboxyli
5. Results and discussion
The first step in this study was to apply PCA [22] to the autoscaledand normalized raw spectra in the training set. Autoscaling ensuredthat each wavelength had equal weight in the analysis and
0 2 4 6
C1
Plot Dim(39)
2
2
2
22
22
22222
2 2
2
22
2
2 2
22
2
2
2
2
22
2
22
2 22 22
2
222
222
222 2
2
2
2
2
22
2
2 22
2
2
22
2
22
2
2
2 22
22
22
2222
22
2
222
2 2
2
2
2
22
222
2
22
2
2
22
22
2
2
2 222
222 2 2
2
222
2
2
2
222
2
2
22 2
2
2
2
22
22 222
2
2
22
22
22
2
22
2 2
2
2
2
2
22
2
2
2
2
2
22
2
22
2
22
2
2
2
2
2
2
2
2
2
2
2
22
2
2
22
22
2
2 2
2
2
2
222
2
22
2
2
2
2
2
2
2
2
2
2
2
22
2
2
2
2
2
2
2 2
2
2
2
2
2
2
22
2
2
2
2
2
2
2
22
2
2
22
2
2
2
22
2
2
2
2
2
2
2
2
22
2
2
22
2
2
2
2
2
22
2
2
2
2
2
2
22
2
2
2
2
2
2
2
22
2 22
2
22
22
2
ients (symlet 6 at the 8th level of decomposition) identified by the pattern recognition GA.c acid).
−6 −4 −2 0 2 4 6 8−12
−10
−8
−6
−4
−2
0
2
4
6
111 1 1
1111
1
1
111
11
1
11
11
11
1
1 11
11
1
1
11
1
1
1 1
1
11
11
1
1
1
1
1
1 1
1
11
111 1 111
1
1
11
1
11
1
1
1
1
1
1
1
111 1
1
1
1
1
1
11
1
1
1
11
1
11
1
1
111
1
111
1 1
1 11
11
111
1
1
1
11
1
11 1
1
1
1
11
11
11
1
111
1
1
1
11 1
12
22
22
22
2222
222
2
22
2
2
2
22 2
2
2
22
22 2
2
22 22
2
22222 222
2
2
22
2
2 22
22
222
2
22
22
22
2
2
2
2
2
2
2
22 22
2
2
2
2
2
2
22
222
22
22
22
2
2
22
2 222222
22
2
22 2
222
2 2
2 222
22
2
2
2
2
2
2 22 22
2
2
222
2
2 2
2
2
2
2
22
2
2
2
22
2
2
2
2
22
22
2
22
22
2
2 2
2 222
22 2
2
22
2
2
222
2
22
2
2
2
2
2
22
22
2
2
2
22
2
2
2
22
2
22
2
2
222
222
2
2
2
2
2
2
2
22
22
2
2
2
22
2
2
22 2
2
22
2
22
22222
2
22
2
2
2
22
2
2
2
2
2
22
2
222
222
2
22
2
2
2
2
2
2
2
22 22
22
2
2 2
2
2
2
2
2 222
2
2D PC Plot Dim(53)
PC1
PC
2
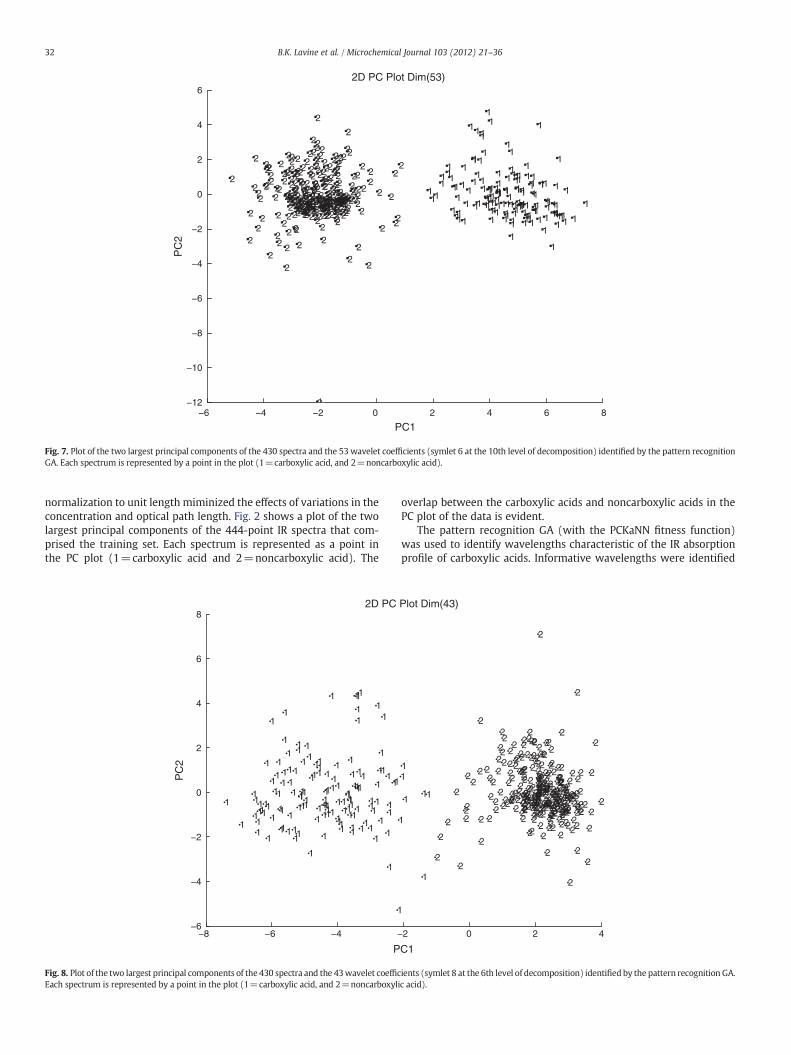
Fig. 7. Plot of the two largest principal components of the 430 spectra and the 53 wavelet coefficients (symlet 6 at the 10th level of decomposition) identified by the pattern recognitionGA. Each spectrum is represented by a point in the plot (1=carboxylic acid, and 2=noncarboxylic acid).
32 B.K. Lavine et al. / Microchemical Journal 103 (2012) 21–36
normalization to unit length miminized the effects of variations in theconcentration and optical path length. Fig. 2 shows a plot of the twolargest principal components of the 444-point IR spectra that com-prised the training set. Each spectrum is represented as a point inthe PC plot (1=carboxylic acid and 2=noncarboxylic acid). The
−8 −6 −4 −−6
−4
−2
0
2
4
6
8
P
PC
2
2D PC
1
1
1
1
1 1
11
11
1
11 1
1
1
1111
11
1
1
1
1
1
1
1
1
1
1
111
1
1
111
1
1
1
1
11
1
1
11
111
1
1
1
1
1
1
1
1
1
1
1
1
1
1
1
1
1
1 1
1
1
1
1
1
1
1
1 1
11
1
1
1
11
11
1
1
1
1
111
1
1
1
1
1
1
11
1
1
1
11
1
1
1
1
1
1
1
1
11
1
1
1
11
1
1
1
1
1
11
1
Fig. 8. Plot of the two largest principal components of the 430 spectra and the 43wavelet coefficEach spectrum is represented by a point in the plot (1=carboxylic acid, and 2=noncarboxyli
overlap between the carboxylic acids and noncarboxylic acids in thePC plot of the data is evident.
The pattern recognition GA (with the PCKaNN fitness function)was used to identify wavelengths characteristic of the IR absorptionprofile of carboxylic acids. Informative wavelengths were identified
2 0 2 4
C1
Plot Dim(43)
1
1
1
1
1
1
122
2
22
2
22 2
2
22 2
2
2
2
22
2 2
222
22
2
2
2
2
2 22
2
2
22
22
2
2
2
2 222
2
22
2
2222
22
2
2
2
222 2
2
22
2
2
2
2
22
2
2
2
22
22
2
22
2
2
2
22
22
2
2
2
2
2
222
22
222 2
2
2
2
22
2
2
2
22 2
2
22
2
22
2
2
2
2
2
2
222
2
22
22
2
2
2
22
2
2
2
2
222
2
2
2
2
2
2
2
2 2
2
22
2
2
2
2
2 2
2
2
2222
2
22 2
2
2
22
2
2
2
2
2
22
2
2
2
2 2
22
2
22
2
2
2
22
2
22
22 2
2
22
22
2
2
22
2
2
2
22
2
2
2
2
2
22
2
2
2
2
2
2
2
22
2
2
2
2
22
2
222
2
2
2
2
2
2
2
2
2
2
2
2
22 22
2
2
2
22
22
2
22
22
22
2
2
2
2
22
2
2
222
2 2
2
2
222
2
2
ients (symlet 8 at the 6th level of decomposition) identified by the pattern recognition GA.c acid).
−8 −6 −4 −2 0 2 4 6−4
−3
−2
−1
0
1
2
3
4
PC1
PC
2
2D PC Plot Dim(41)
11
1
1
1
1 11
1
1
1
11 1
1
1
1
11
1 1
1
1
1
1
1
1
1
1
1
1
1
1
1
1
1
1
11
1
1
1
1
1
1
1
11
1
1
111
1
1
1
1 1
1
1
11
1
1
1
1
1
1
1
1
1
1
1
1
1
11 1
1
1
1
1
1
11
1
1
1
1
11
1
1
1
1
1
1
1
1
1
1
1
1
1
11
1
1
11
1
1
1
11
11
1
1
11
1
1
11
1
1
1
1
1
1
1
1
1
1
1
1
11
1
22
2
2
2
2
2
2
2
2
2
22
2
2
2
2
22
2
2
2
22
22
2
22
2
2
2
2
2
22
2
2
222
2
2
2
2
2
2
2
2
2
2
2
22
2
2
2
2
2
2
2
22
2
2
2
2
2
2
2
2
2
2
22
2
2
2
2
2
2
2
2
2
2
22
2
2
2
2
2
2
2
2
2
2
2
2
2
2
22
2
2
2
2
22
2
2
2
2
2
2
2
2
22
2
2
2
2
2
2
2
2
2
2
2
2
2
2
2
2
2
2
2
2
2
2
2
22
2
2
2
2
2
2
2
2
2
2
2
22
2
2
2
2
2
22
2
2
2
2
2
2
2
2
22
2
2
2
22
2
2
2
22
2
2
22
2
22
2
2
2
2
2
2
2
2
2
2
2
2
2
2
2
2
2
2
2
2
2
2
2
2
2
2
2
2
2
2
22
2
22
2
2
2
2
2
2
22
2
2
2
2
2
222
2
22
2
2
2
2
2 22
2
2
2
2
22
22 2
2
2
2
2
2
2
22
2
2
2
2
2
2
2
2
2
2
2
2
2
2222
2
2
2
2
22
2
22
Fig. 9. Plot of the two largest principal components of the 430 spectra and the 41wavelet coefficients (symlet 8 at the 8th level of decomposition) identified by the pattern recognition GA.Each spectrum is represented by a point in the plot (1=carboxylic acid, and 2=noncarboxylic acid).
33B.K. Lavine et al. / Microchemical Journal 103 (2012) 21–36
by sampling key feature subsets, scoring their PC plots, and trackingthose classes and/or spectra that were most difficult to classify. Theboosting routine used this information to steer the population to anoptimal solution. After 300 generations, the pattern recognition GA
−6 −4 −2 0−12
−10
−8
−6
−4
−2
0
2
4
6
2
22
22
22
2222
222
2
22
2
2
2
22 2
2
2
22
22 2
2
22 22
2
22222 222
2
2
22
2
2 22
22
222
2
22
22
22
2
2
2
2
2
2
2
22 22
2
2
2
2
2
2
22
222
22
22
22
2
2
22
2 222222
22
2
22 2
222
2 2
2 222
22
2
2
2
2
2
2 22 22
2
2
222
2
2 2
2
2
2
2
22
2
2
2
22
2
2
2
2
22
22
2
22
22
2
2 2
2 222
22
2
22
2
2
222
2
22
2
2
2
2
2
22
22
2
2
2
22
2
2
2
22
2
22
2
2
222
222
2
2
2
2
2
2
2
22
22
2
2
2
22
2
2
22 2
2
22
2
22
22222
2
22
2
2
2
22
2
2
2
2
2
22
2
222
222
2
22
2
2
2
2
2
2
2
22 22
22
2
2 2
2
2
2
2
2 222
2
CC
N
N
N
NN
N
N
NN
N
NN
N
N
N
NN
N
N
NN
N NNN
N
NN
NN
N
N
NN
N
NNN N
NN
N
N
N
N
N NN
N
NN N
N
N
N
N
NN
NNN
2D PC Plo
P
PC
2
Fig. 10. Plot of the two largest principal components of the 430 spectra and the 53wavelet coefGA. Each spectrum is represented by a point in the plot (1=carboxylic acid from the training seand N=noncarboxylic acid from the validation set).
identified 8 wavelengths whose PC plot (see Fig. 3) showed only amodest improvement in the separation of the IR spectra on thebasis of the functional group (carboxylic acids versus noncarboxylicacids).
2 4 6 8
111 1 1
1111
1
1
111
11
1
11
11
11
1
1 11
11
1
1
11
1
1
1 1
1
11
11
1
1
1
1
1
1 1
1
11
111 1 111
1
1
11
1
11
1
1
1
1
1
1
1
111 1
1
1
1
1
1
11
1
1
1
11
1
11
1
1
111
1
111
1 1
1 11
11
111
1
1
1
11
1
11 1
1
1
1
11
11
11
1
111
1
1
1
11 1
1
2
C C
CC
C
CC C
C
C
C
C
CCC
C
CC
CC
CC
t Dim(53)
C1
ficients (symlet 6 at the 10th level of decomposition) identified by the pattern recognitiont, 2=noncarboxylic acid from the training set, C=carboxylic acid from the validation set,
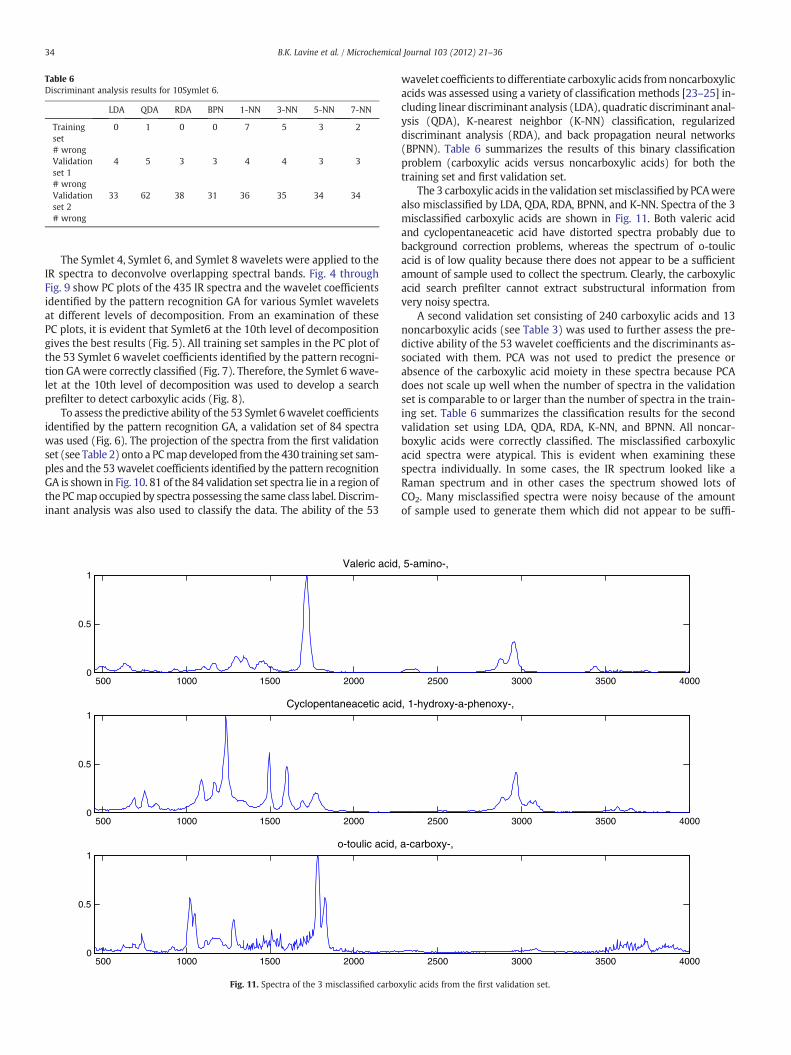
Table 6Discriminant analysis results for 10Symlet 6.
LDA QDA RDA BPN 1-NN 3-NN 5-NN 7-NN
Training 0 1 0 0 7 5 3 2set# wrongValidation 4 5 3 3 4 4 3 3set 1# wrongValidation 33 62 38 31 36 35 34 34set 2# wrong
34 B.K. Lavine et al. / Microchemical Journal 103 (2012) 21–36
The Symlet 4, Symlet 6, and Symlet 8 wavelets were applied to theIR spectra to deconvolve overlapping spectral bands. Fig. 4 throughFig. 9 show PC plots of the 435 IR spectra and the wavelet coefficientsidentified by the pattern recognition GA for various Symlet waveletsat different levels of decomposition. From an examination of thesePC plots, it is evident that Symlet6 at the 10th level of decompositiongives the best results (Fig. 5). All training set samples in the PC plot ofthe 53 Symlet 6 wavelet coefficients identified by the pattern recogni-tion GA were correctly classified (Fig. 7). Therefore, the Symlet 6 wave-let at the 10th level of decomposition was used to develop a searchprefilter to detect carboxylic acids (Fig. 8).
To assess the predictive ability of the 53 Symlet 6wavelet coefficientsidentified by the pattern recognition GA, a validation set of 84 spectrawas used (Fig. 6). The projection of the spectra from the first validationset (see Table 2) onto a PCmapdeveloped from the 430 training set sam-ples and the 53wavelet coefficients identified by the pattern recognitionGA is shown in Fig. 10. 81 of the 84 validation set spectra lie in a region ofthe PCmap occupied by spectra possessing the same class label. Discrim-inant analysis was also used to classify the data. The ability of the 53
500 1000 1500 20000
0.5
1Valeric acid
500 1000 1500 20000
0.5
1Cyclopentaneacetic acid
500 1000 1500 20000
0.5
1o-toulic acid,
Fig. 11. Spectra of the 3 misclassified carbo
wavelet coefficients to differentiate carboxylic acids fromnoncarboxylicacids was assessed using a variety of classification methods [23–25] in-cluding linear discriminant analysis (LDA), quadratic discriminant anal-ysis (QDA), K-nearest neighbor (K-NN) classification, regularizeddiscriminant analysis (RDA), and back propagation neural networks(BPNN). Table 6 summarizes the results of this binary classificationproblem (carboxylic acids versus noncarboxylic acids) for both thetraining set and first validation set.
The 3 carboxylic acids in the validation setmisclassified by PCAwerealso misclassified by LDA, QDA, RDA, BPNN, and K-NN. Spectra of the 3misclassified carboxylic acids are shown in Fig. 11. Both valeric acidand cyclopentaneacetic acid have distorted spectra probably due tobackground correction problems, whereas the spectrum of o-toulicacid is of low quality because there does not appear to be a sufficientamount of sample used to collect the spectrum. Clearly, the carboxylicacid search prefilter cannot extract substructural information fromvery noisy spectra.
A second validation set consisting of 240 carboxylic acids and 13noncarboxylic acids (see Table 3) was used to further assess the pre-dictive ability of the 53 wavelet coefficients and the discriminants as-sociated with them. PCA was not used to predict the presence orabsence of the carboxylic acid moiety in these spectra because PCAdoes not scale up well when the number of spectra in the validationset is comparable to or larger than the number of spectra in the train-ing set. Table 6 summarizes the classification results for the secondvalidation set using LDA, QDA, RDA, K-NN, and BPNN. All noncar-boxylic acids were correctly classified. The misclassified carboxylicacid spectra were atypical. This is evident when examining thesespectra individually. In some cases, the IR spectrum looked like aRaman spectrum and in other cases the spectrum showed lots ofCO2. Many misclassified spectra were noisy because of the amountof sample used to generate them which did not appear to be suffi-
2500 3000 3500 4000
, 5-amino-,
2500 3000 3500 4000
, 1-hydroxy-a-phenoxy-,
2500 3000 3500 4000
a-carboxy-,
xylic acids from the first validation set.
500 1000 1500 2000 2500 3000 3500 40000
0.5
1Benzoic acid, 3,5-dihydroxy-,
500 1000 1500 2000 2500 3000 3500 40000
0.5
1Acetic acid, o-hydroxyphenyl-,
500 1000 1500 2000 2500 3000 3500 40000
0.5
1Acetic acid, dodecylthio-,
500 1000 1500 2000 2500 3000 3500 40000
0.5
1Leucine, N-chloroacetyl-L-minus-,
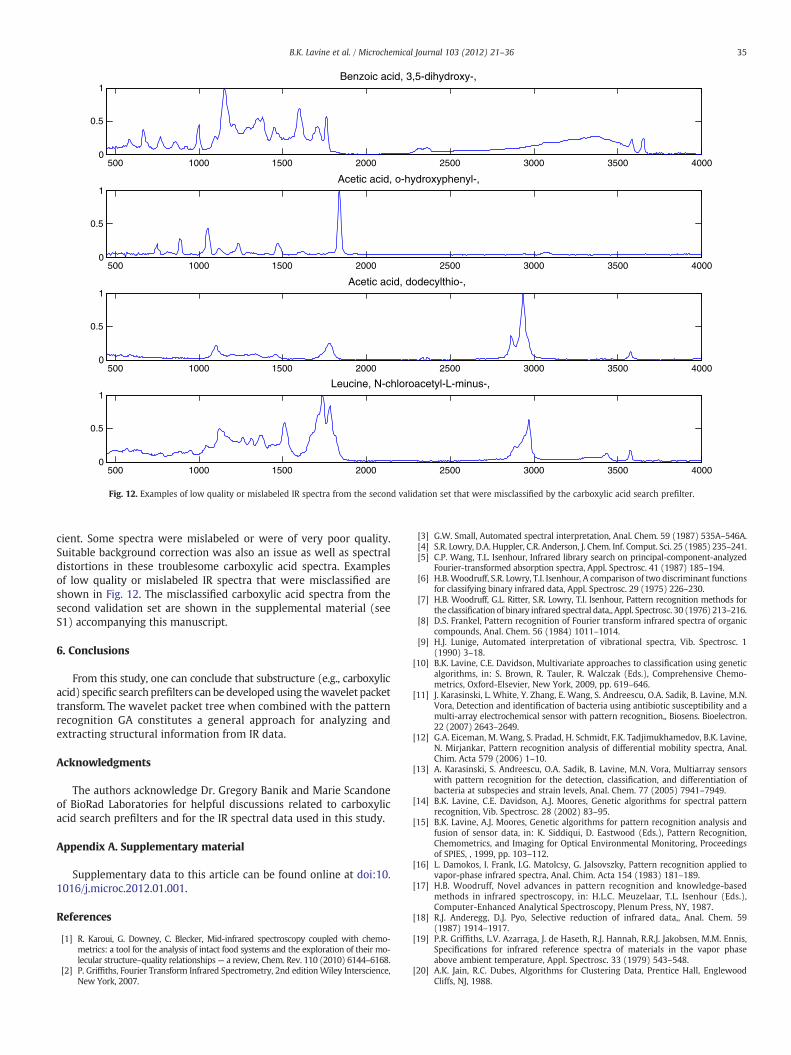
Fig. 12. Examples of low quality or mislabeled IR spectra from the second validation set that were misclassified by the carboxylic acid search prefilter.
35B.K. Lavine et al. / Microchemical Journal 103 (2012) 21–36
cient. Some spectra were mislabeled or were of very poor quality.Suitable background correction was also an issue as well as spectraldistortions in these troublesome carboxylic acid spectra. Examplesof low quality or mislabeled IR spectra that were misclassified areshown in Fig. 12. The misclassified carboxylic acid spectra from thesecond validation set are shown in the supplemental material (seeS1) accompanying this manuscript.
6. Conclusions
From this study, one can conclude that substructure (e.g., carboxylicacid) specific search prefilters can be developed using thewavelet packettransform. The wavelet packet tree when combined with the patternrecognition GA constitutes a general approach for analyzing andextracting structural information from IR data.
Acknowledgments
The authors acknowledge Dr. Gregory Banik and Marie Scandoneof BioRad Laboratories for helpful discussions related to carboxylicacid search prefilters and for the IR spectral data used in this study.
Appendix A. Supplementary material
Supplementary data to this article can be found online at doi:10.1016/j.microc.2012.01.001.
References
[1] R. Karoui, G. Downey, C. Blecker, Mid-infrared spectroscopy coupled with chemo-metrics: a tool for the analysis of intact food systems and the exploration of their mo-lecular structure–quality relationships— a review, Chem. Rev. 110 (2010) 6144–6168.
[2] P. Griffiths, Fourier Transform Infrared Spectrometry, 2nd editionWiley Interscience,New York, 2007.
[3] G.W. Small, Automated spectral interpretation, Anal. Chem. 59 (1987) 535A–546A.[4] S.R. Lowry, D.A. Huppler, C.R. Anderson, J. Chem. Inf. Comput. Sci. 25 (1985) 235–241.[5] C.P. Wang, T.L. Isenhour, Infrared library search on principal-component-analyzed
Fourier-transformed absorption spectra, Appl. Spectrosc. 41 (1987) 185–194.[6] H.B. Woodruff, S.R. Lowry, T.I. Isenhour, A comparison of two discriminant functions
for classifying binary infrared data, Appl. Spectrosc. 29 (1975) 226–230.[7] H.B. Woodruff, G.L. Ritter, S.R. Lowry, T.I. Isenhour, Pattern recognition methods for
the classification of binary infrared spectral data,, Appl. Spectrosc. 30 (1976) 213–216.[8] D.S. Frankel, Pattern recognition of Fourier transform infrared spectra of organic
compounds, Anal. Chem. 56 (1984) 1011–1014.[9] H.J. Lunige, Automated interpretation of vibrational spectra, Vib. Spectrosc. 1
(1990) 3–18.[10] B.K. Lavine, C.E. Davidson, Multivariate approaches to classification using genetic
algorithms, in: S. Brown, R. Tauler, R. Walczak (Eds.), Comprehensive Chemo-metrics, Oxford-Elsevier, New York, 2009, pp. 619–646.
[11] J. Karasinski, L. White, Y. Zhang, E. Wang, S. Andreescu, O.A. Sadik, B. Lavine, M.N.Vora, Detection and identification of bacteria using antibiotic susceptibility and amulti-array electrochemical sensor with pattern recognition,, Biosens. Bioelectron.22 (2007) 2643–2649.
[12] G.A. Eiceman, M. Wang, S. Pradad, H. Schmidt, F.K. Tadjimukhamedov, B.K. Lavine,N. Mirjankar, Pattern recognition analysis of differential mobility spectra, Anal.Chim. Acta 579 (2006) 1–10.
[13] A. Karasinski, S. Andreescu, O.A. Sadik, B. Lavine, M.N. Vora, Multiarray sensorswith pattern recognition for the detection, classification, and differentiation ofbacteria at subspecies and strain levels, Anal. Chem. 77 (2005) 7941–7949.
[14] B.K. Lavine, C.E. Davidson, A.J. Moores, Genetic algorithms for spectral patternrecognition, Vib. Spectrosc. 28 (2002) 83–95.
[15] B.K. Lavine, A.J. Moores, Genetic algorithms for pattern recognition analysis andfusion of sensor data, in: K. Siddiqui, D. Eastwood (Eds.), Pattern Recognition,Chemometrics, and Imaging for Optical Environmental Monitoring, Proceedingsof SPIES, , 1999, pp. 103–112.
[16] L. Damokos, I. Frank, I.G. Matolcsy, G. Jalsovszky, Pattern recognition applied tovapor-phase infrared spectra, Anal. Chim. Acta 154 (1983) 181–189.
[17] H.B. Woodruff, Novel advances in pattern recognition and knowledge-basedmethods in infrared spectroscopy, in: H.L.C. Meuzelaar, T.L. Isenhour (Eds.),Computer-Enhanced Analytical Spectroscopy, Plenum Press, NY, 1987.
[18] R.J. Anderegg, D.J. Pyo, Selective reduction of infrared data,, Anal. Chem. 59(1987) 1914–1917.
[19] P.R. Griffiths, L.V. Azarraga, J. de Haseth, R.J. Hannah, R.R.J. Jakobsen, M.M. Ennis,Specifications for infrared reference spectra of materials in the vapor phaseabove ambient temperature, Appl. Spectrosc. 33 (1979) 543–548.
[20] A.K. Jain, R.C. Dubes, Algorithms for Clustering Data, Prentice Hall, EnglewoodCliffs, NJ, 1988.

36 B.K. Lavine et al. / Microchemical Journal 103 (2012) 21–36
[21] B.K. Lavine, K. Nuguru, N. Mirjankar, One stop shopping — feature selection,classification, and prediction in a single step, J. Chemom. 25 (2011) 116–129.
[22] J.E. Jackson, A User's Guide to Principal Component Analysis, Wiley Intersceince,NY, 1991.
[23] J.T. Tou, R.C. Gonzalez, Pattern Recognition Principles, Addison Wesley PublishingCompany, Reading, MA, 1974.
[24] G.J. McLachlan, Discriminant Analysis and Statistical Pattern Recognition, WileyInterscience, New York, 1992.
[25] J. Zupan, J. Gasteiger, Neural Networks in Chemistry and Drug Design, 2nd EditionWiley-VCH, NY, 1999.