development of d sight office of aviation research ... · aircraft inspection system: phase ll ......
TRANSCRIPT

Office of Aviation Research Washington, D.C. 20591
Development of a D SIGHT Aircraft Inspection System: Phase ll
Transportation Development Centre Montreal, Quebec, Canada
March 1996
Final Report
This document is available to the U.S. public through the National Technical Information Service, Springfield, Virginia 22161.
@ Transport Transports U.S. Department of Transportation Canada Canada Federal Aviation Administration

NOTICE
This document is disseminated under the sponsorship of the U.S. Department of Transportation in the interest of information exchange. The United States Government assumes no liability for the contents or use thereof. The United States Government does not endorse products or manufacturers. Trade or manufacturer's names appear herein solely because they are considered essential to the ~bjective of this report.

Technical Report Documentation Page
' TP l247OE 4. TlUe and Subtitle
1. Report No.
DEVELOPMENT OF A D SIGHT AIRCRAFT INSPECTION SYSTEM: PHASE I1
2. Government Accesslon No.
F. Karpala and O.L. Hageniers 9. Performlng Organization Name and Address
Diffiacto Limited 2835 Kew Drive Windsor, Ontario N8T 3B7 12. Sponsoring Agency Name and Address
U.S. Department of Transportation Federal Aviation Administration Office of Aviation Research Washington, D.C. 20591 15. Supplementary Notes
Transportation Development Centre 800 Rene' Levesque Blvd. W., 6th Floor Montreal, Quebec H3B 1 X9
FAA Technical Center Monitor: Dave Galella. AAR-430
3. Reclplent's Catalog No.
5. Report Date
March 1996
6. Performlng Organization Code
8. Performing Organization Report No.
10. Work Unit No. (TRAIS)
11. Contract or Grant No.
PA-7 13. Type of Report and Period Covered
Final Report 14. Sponsoring Agency Code
AAR-430
16. Abstract
This report presents Phase 11 results of an international Project Arrangement between the Federal Aviation Administration and Transport Canada Aviation for the development and testing of a nondestructive inspection system for aircraft corrosion detection in fuselage lap splice joints. The process is based on D SIGHT, an optical technique developed by Diffract0 Limited.
This report describes the further development of the D SIGHT system hardware and sofhvare based upon results obtained from prototype testing during Phase I. A better understanding of the corrosion process and the sensitivity of D SIGHT has been established by imaging numerous corroded specimens containing both artificially accelerated and naturally occurring corrosion in lap splices. A computer model was developed and validated which can accurately predict D SIGHT signatures for a variety of lap splice geometries. Finally, the new system was field tested at airline maintenance facilities to obtain user feedback.
Aircraft, corrosion, nondestructive inspection, aging aircraft
17. Key Words
Document is available to the public through the National Technical Information Service, Springfield, Virginia 22161
18. Distribution Statement
I
o m DOT F1700.7 (8-72) Reproduction of completed page authorized
I
19. Security Classif. (of thls report)
Unclassified
21. No. of Pages
65
20. Security Classif. (of this page)
Unclassified
22. Price


PREFACE
The authors are grateful to the Transportation Development Centre (TDC) of Transport Canada and the Federal Aviation Administration (FAA) for their support in funding this project. The authors also wish to acknowledge the funding assistance of the National Research Council Canada, Institute for Aerospace Research (NRCIIAR) under a collaborative research agreement.
Special thanks go to Ms. Danielle Favreau, Science Contracting Officer, for her support and assistance, and Mr. Jean-Louis Rene, Senior Development Officer at TDC, who assumed the efficient coordination of this project. Further thanks go to Mr. Bill Miller of Transport Canada (Airthworthiness) and Mr. David G. Galella of the FAA for their input and guidance during the project.
We are especially thankful to Jetzy Komorowski and his research team from NRCIIAR for their technical skill, enthusiasm, and timely execution of critical aspects of this project involving the accelerated corrosion experiments and the corrosion modelling effort.
Research Team:
Diffract0 Ltd.
Dr. Frank Karpala, Project Manager, Researcher Dr. Omer Hageniers, Researcher William James, Researcher Marc Noel, Researcher Eldon Cooper, Researcher Rodger Reynolds, Researcher Don Clarke, Senior Technician
NRCIIAR
Jetzy Komorowski, Project Leader, Senior Research Officer Ronald Gould, Technical Officer Anton Marincak, Technical Officer Nick Bellinger, Associate Research Officer
iii


TABLE OF CONTENTS
Page
EXECUTIVE SUMMARY
1 INTRODUCTION
2 HARDWARE DEVELOPMENT
2.1 Summary of Major Revisions 2.2 Hardware Description
2.2.1 Host Controller 2.2.2 Pendant Controller 2.2.3 DAIS-250C Sensor 2.2.4 Printer
3 SOFTWARE DEVELOPMENT
3.1 General 3.2 DAIS File Structure 3.3 Description of Program Modules
3.3.1 Inspection Plan Module 3.3.2 InstallICalibrate Module 3.3.3 Acquisition Module 3.3.4 Analysis Module 3.3.5 Repair Module
4 ACCELERATED CORROSION TESTING AND NDI
4.1 Specimen Preparation 4.2 Specimen Disassembly and Reassembly 4.3 Corrosion Test Setup and Specifications 4.4 Pre- and Postexposure NDI
4.4.1 D SIGHT 4.4.2 Shadow Moire 4.4.3 Eddy Current
4.5 Results and Discussion
5 CORROSION MODELLING AND D SIGHT SIMULATION
5.1 Motivation 5.2 Mathematical Model and Assumptions 5.3 Finite Element Model 5.4 Results and Discussion
5.4.1 Mathematical Model 5.4.2 Finite Element

6 FIELD TRIALS
British Royal Air Force 6.1.1 Background 6.1.2 lnspections
6.1.2.1 RAF Brize Norton Airforce Base 6.1.2.2 RAF Boscoome Downs Airforce Base 6.1.2.3 DRA - Defence Research Agency, Ministry of Defence 6.1.2.4 Unattended lnspections 6.1 .2.5 Difficulties with the Equipment and Procedure
6.1.3 RAF Initial Recommendations and Summary Northwest Airlines 6.2.1 Background 6.2.2 lnspections 6.2.3 Observations by the DAlS Inspection Crew
6.2.3.1 Hardware 6.2.3.2 Software
6.2.4 Northwest Airlines - Reaction to the DAlS Air Canada 6.3.1 lnspections 6.3.2 Performance and Results United Airlines 6.4.1 lnspections 6.4.2 Performance and Results On-Aircraft lnspections
7 CONCLUSIONS
8 PUBLICATIONS FROM PHASE I AND PHASE II

LlST OF FIGURES
Fiuure Pane
Dais Hardware Configuration and Connections Pendant and Computer Host DAIS-250C Prototype Sensor DAIS-250C Sensor Drawing Example Turtle Diagram with Sensor Placements Relationship of Dais Modules and System Files Image Display Window Analysis Dialog Box for Viewing and Marking Defects Typical Calibration Specimen Deformed Shapes Predicted by Mathematical Model for Various Rivet Row Spacing Ratios Simulated D SIGHT Signatures for Different Percentage Thickness Loss Simulated D SIGHT Images of Multilayered Lap Joints lnspecting 8-737 Crown lnspecting B-747 Belly Signatures Moderate Corrosion lnspecting Upper Window Belt B-747 Fuselage lnspection 8-747 Forward Belly lnspection Upper Window Belt lnspection Low-level Corrosion Signatures No Corrosion Signatures
LlST OF TABLES
Pane
lnspection Plan Menu ltems Install/calibrate Menu ltems Acquisition Menu ltems Analysis Menu ltems lmage Print Menu Items Repair Planning Menu ltems Precorrosion lnspection Matrix Postcorrosion lnspection #2 Matrix (Inspection Carried Out - Y Or Not - N) Postcorrosion lnspection #3 Matrix (Inspection Carried Out - Y Or Not - N) Postcorrosion lnspection #4 Matrix (Inspection Carried Out - Y Or Not - N) Postcorrosion lnspection #5 Matrix (Inspection Carried Out - Y Or Not - N) Final NDI lnspection and Results Matrix Oxides and Volumetric Increase for Aluminum Air Canada lnspection Summary
vii

ABBREVIATIONS
ASNT ASTM CCD DIA DAIS DND DPI D SIGHT FAA I10 LCD MB MHz NDIINDT NRCIIAR PC PEP RAF RAM TCA TDC TFT VAC VDC VGA WPLABS
American Society for Nondestructive Testing American Society for Testing and Materials Charge Coupled Device Digital to Analog D SIGHT Aircraft Inspection System Department of National Defence of Canada Dots Per Inch Diffract0 Sight Federal Aviation Administration InputIOutput Liquid Crystal Display Megabyte Megahertz Nondestructive InspectionINondestructive Testing National Research Council Canadallnstitute for Aerospace Research Personal Compter Personal Expandable Platform Royal Air Force Random Access Memory Transport Canada Aviation Transportation Development Centre Thin Film Transistor V ~ l t s Alternating Current Volts Direct Current Video Graphics Adpater Wright Patterson Laboratory

EXECUTIVE SUMMARY
In 1992, an agreement was reached between Transport Canada Aviation (TCA), Transportation Development Centre (TDC), and the Federal Aviation Administration (FAA) providing for research funds for Phase I of this project. In 1994, after a very successful Phase I program, additional funding for Phase II was agreed to by these agencies.
This report summarizes the results of the second phase of development for a nondestructive inspection (NDI) system based on D SIGHT. It is a natural follow-on program that had four primary objectives:
develop specifications and software and design and build a field use prototype
develop a further understanding of the corrosion process and the sensitivity of D SlGHT by artificially accelerating corrosion in lap splices and monitoring the results for additional specimens
e develop a computer model of the corrosion process in a lap splice in order to be able to predict the D SlGHT signatures for a variety of lap splice geometries that would othetwise be difficult to acquire
develop experience using the new hardware under field conditions and record feedback from NDI managers and technicians to improve system features, reliability, and user satisfaction
For Phase II, both hardware and software were completely changed to reflect the knowledge gained from Phase I experience. Primarily, the user interface was changed both in hardware and software because it is so crucial to a successful data collection, retrieval, and analysis system. A graphical Windows environment was introduced and a large VGA monitor was provided to the pendant operator. Image acquisition and retrieval becomes very easy with the introduction of a graphical turtle diagram representation of the aircraft surface.
The accelerated corrosion testing continued from the first phase and provided additional support' for the high sensitivity of D SlGHT to pillowing in corroded lap splices down to the 2 to 3 percent level. The computer modelling and D SlGHTsimulation also provides a useful way to study the potential of D SlGHT on new joint configurations as well as draw attention to configurations that may be unacceptable for visual inspection due to the low levels of pillowing that develop. The fact that D SlGHT is measuring the extent of pillow deflections rather than material loss also draws attention to techniques that may be reporting false material loss simply because of manufacturing tolerances especially at low corrosion levels. The realistic images that come from the surfaces generated by simulation of corroded lap splices followed by simulated D SlGHT inspection reinforces the need to build an image library that can be used as a visual standard in making evaluations during image analysis. This activity will be carried out in the follow-on work in Phase Ill.
During Phase II, field trips were made to Northwest Airlines, in Minneapolis-St. Paul, Air Canada, in Montreal, and United Airlines, in San Francisco. A field trip to the RAF in England is also

summarized to include the experience of corrosion detection with the original prototype developed in Phase I. The new hardware performed well in the field trials with the exception of connectors that were difficult to manufacture and broke down easily. These connectors were eventually discarded in favour of a newer style that provided better strain relief. The major modifications to the optical train were particularly successful in eliminating the contamination from dust and highlighter. The new software philosophy using a turtle diagram (planar surface drawing) graphical user interface was particularly well received by NDI personnel but the software itself was not entirely error free during the field trials. However, the process of planning, acquiring, and analyzing images did force many of the features to be exercised in the field. Improvements to the software and hardware were introduced based on these findings.

1 INTRODUCTION
The first phase of this project was to develop a breadboard system for the nondestructive inspection (NDI) of aircraft lap joints for corrosion and to develop an understanding of the detection capability and sensitivity of D SIGHT relative to other technologies. The breadboard system developed, based on D SIGHT, was extremely successful and the reasons for its high detection sensitivity to corrosion became known. The results of this first phase are summarized in the Transportation Development Centre (TDC) report, TP 11 983E, or the equivalent Federal Aviation Administration (FAA) report DOTIFAAICT-94/56, entitled, "Characterization of Corrosion and Development of a Breadboard Model of a D SlGHTAircraft Inspection System", published in Feb. and Aug. 1994, respectively. The system became known as DAIS which stands for D SIGHT Aircraft Inspection System. -
The second phase of this project extended the results of the first phase and included the following major tasks. The primary organization responsible for completing each task is indicated in parentheses.
develop specifications, design, and build the prototype hardware (Diffracto)
design, code, and debug system software (Diffracto)
perform accelerated corrosion testing and NDI on library corrosion specimens to document detection sensitivity (NRCIIAR)
develop a computer model (finite element) of the corrosion process in lap splices and use the result to generate simulated D SlGHTimages from the output surface (NRCIIAR and Diffracto for image generation)
obtain hands-on experience and performance evaluation from field trials with the new prototype system at airline overhaul facilities (Diffracto, NRCIIAR)
These tasks were divided into essentially two areas: hardware and software development of the technology and determination of sensitivity and corrosion detection ability from a practical and theoretical level. The two came together during field trials that attempted to make use of both the developed hardware and the knowledge of detection capability derived from the modelling and laboratory work.

2 HARDWARE DEVELOPMENT
2.1 Summary of Major Revisions
At the end of Phase I, a number of important recommendations were made to improve the breadboard sensor and host hardware. The main problems were as follows:
sensor weight too great for ease of use sensor optics were susceptible to highlighter contamination small mirror could not be used for illumination and viewing due to the constant danger of dust contamination camera depth of field needed improvement host computer weight was excessive power supply was bulky along with the host computer pendant monitor image was too small and of poor quality loose connector mating
All of these problems were addressed in Phase II. In fact, a major redesign of the sensor, host, and pendant was initiated. The sensor was redesigned completely to take advantage of a new board-level camera with greater sensitivity than the previous model. The optics were packaged to be as free of contamination as possible. Also, the enclosure was redesigned with sections removed and replaced with cloth to produce a lighter sensor. The weight was reduced by 10 percent while eliminating many of the contamination issues experienced with the first prototype.
Because of a major shift in software philosophy, major hardware changes were made to move away from a reliance on RS-170 video to VGA video. The VGA video mode would permit the display of both images as well as graphics. The VGA mode also required a new custom cable to permit VGA signals to the pendant. In addition, a new compact power supply providing a 48 VDC power bus was mounted directly in the host. The host computer was also changed with a smaller and lighter model having an LCD display for the VGA. The result was fewer components and a lighter system overall. The VGA graphical display mode also required a new display for the pendant along with new packaging. All the improvements and specifications of the new hardware are outlined in the sections that follow.
2.2 Hardware Description
The new DAIS system consists of the following components:
D SIGHT image acquisition sensor @ host controller o pendant controller o printer
These components are depicted in figure 1 in the typical configuration. The purpose of the system is to acquire D SIGHT image data from aircraft surfaces for visual interpretation by an inspector. The system also provides the ability to display and print the image data for

interpretation, store, and retrieve the image data for record keeping, record analysis results and repair areas, and permit user input of identifying information.
Host Computer I
DAIS -i: Printer Hardware Configuration
Operator Pendant
Sensor-head FIGURE 1. DAIS HARDWARE CONFIGURATION AND CONNECTIONS
2.2.1 Host Controller
The host controller consists of an industrial PC computer with an LCD VGA display monitor, keyboard, and disk drives as well as hardware necessary for image capture, communication with the pendant and sensor, and printing functions. Image video display capability is provided at the host on the 10-inch VGA display. User input is made through keyboard entry and a built-in mouse. The power and control modules for the remote pendant and sensor reside in the host controller enclosure in an extended chassis. A custom cable connect panel is supplied to interface to the special boards and power modules. The system can be powered with switchable 1201240 VAC.

The minimum computer specifications are as follows:
486-66 MHz processor 16 MB RAM 1.44 MB, 3.5" disk drive 540 MB hard drive parallel port TFT LCD 10-inch VGA monitor (256 simultaneous colors) 101 -key keyboard built-in mouse
Additional hardware include:
8 bit, 640x480 image capture board DIA I10 board for light control power supplies for pendant and sensor
2.2.2 Pendant Controller
A portable pendant device is an integral part of the system to provide control of the sensor functions at a remote location from the host. The pendant is connected to the host by a cable approximately 30.5 m (1 00 ft.) to minimize the movement of the host controller during inspection tasks. A cable, about 4.5 m (15 ft) in length, is provided to connect the remote pendant to the sensor. Each cable is equipped with industrial connectors and mating connectors are provided on the sensor, pendant, and host controller. An industrial custom cable is provided for RS-170, VGA signals, RS-232 signals, power, and sense lines.
The pendant consists of a TFT LCD 10-inch VGA video display monitor with an integral touch screen for user input of control commands. The monitor and cable connectors are packaged in an industrial enclosure with convenient handles. The pendant will provide full control of image acquisition and the ability to display video and system menu items. The new pendant and host computer are shown in figure 2.
2.2.3 DAIS-250C Sensor
The DAIS-250C corrosion sensor consists of an enclosure with integral handles, a CCD camera and lens, a white light source, a retroreflective screen, and glass mirrors to reduce package size. The optical components for the sensor have been optimized to maximize detection sensitivity for pillow signatures caused by corrosion. The camera, lens, light source, and electronics are enclosed in a self-contained module equipped with a filtered fan system in order to protect the components from dust and contamination. A thermal switch is included to protect the components from excessive heat in case of component failure or blocked air circulation.
Each corrosion sensor is equipped with an identification (ID) number chip to identify it uniquely to the DAIS system. In addition, a solid-state CCD camera is provided with a industrial camera lens. A low-power white light source is provided with a bulb life exceeding 2000 hours. For ease of cleaning, a commercial retroreflector is used with a protective coating.

The sensor enclosure for the DAIS-250C sensor is a hybrid design having both rigid end caps to protect critical components and a central clothlframe section to reduce weight. The enclosure serves two purposes: to support the internal optical components and geometry and to block ambient light that would reduce image contrast and sensitivity from entering the inspection area. Manipulation of the sensor into any orientation is made possible by rigid handles at approriate locations. The enclosure footprint and field of view are rectangular in shape and the inspection area varies in size depending on the sensor type. No-mar feet and a light-blocking rubber skirt are provided at the base of the sensor to reduce possible damage to the aircraft surface and to prevent ambient light from entering the sensor. The completed sensor is shown in figure 3 and a drawing showing internal structure is shown in figure 4.
The sensor specifications are given below:
camera camera camera surface camera camera
tY Pe CCD, 112" format, 768x494 pixels orientation 90 deg. rotation, clockwise from normal view to surface distance 1.19 m (47 in.) to retroreflector 457 mm (18 in.) (nominal) grazing angle 22.5 degrees lens 35 mm @ f l I , fixed focus
lamp reflector diameter halogen with integral 50 mm (2 in.) stipple reflector
effective lamp location 38 mm (1.5 in.), off-axis, below lens retroreflector 3M, Scotchlite 3290, coated field of view 131 mm x 580 mm (5.1 5" x 22.85") weight 4.5 kg. (10 Ibs)
2.2.4 Printer
The system printer is a commercial laser printer with 600 DPI or better. The printer is equipped with a standard letter paper tray. Connection of the printer to the host controller is provided with standard printer and power cables.
FIGURE 2. PENDANT AND COMPUTER HOST
FIGURE 3. DAIS-250C PROTOTYPE SENSOR


3 SOFTWARE DEVELOPMENT
3.1 General
The problem of coordinating and finding inspection data from specific locations on the aircraft has led to the development of a graphical user interface for the collection, retrieval, and analysis of image data based on the concept of a turtle diagram (a planar drawing of the surface of an aircraft). Figure 5 shows a turtle diagram with the basic characteristics required: reference labels having meaning to the aircraft and NDI technician and critical placement positions for the inspection along lap splices representing areas requiring inspection. Reference to the image data can be made by selecting the box associated with the position on the aircraft drawing.
DAlS software uses this Windows graphical user interface during the inspection process both at the host and pendant. In addition, a modular structure is used to simplify and isolate major functions that need not require all system hardware. The Windows software environment is ideal for this modularity and has the added capability of simultaneously displaying live video in a window and graphics on a VGA monitor.
The software structure for DAlS is based on five broad operational requirements that have been identified for the inspection system: inspection plan creation, sensor installation and calibration, image acquisition, image analysis and reporting, and repair planning. Only the sensor install and calibrate module and the image acquisition module require connection of the entire system hardware; otherwise, the remaining modules could be used at the host in the NDI shop.
1
2
3
4
5
6
7
8
9
10
11
12
13
14
15
16
17
18
19
XI
21
FIGURE 5. EXAMPLE TURTLE DIAGRAM WITH SENSOR PLACEMENTS

3.2 DAlS File Structure
Three main types of files in the DAlS system will record the inspection activities. The inspection plan files (.PLN) are designed once for a specific aircraft type and can be reused or modified depending on maintenance requirements and schedules. The aircraft work files (.AIR) embody a particular inspection plan file (i,e., contain the plan within it) along with the inspection status, analysis results, repair results, and image filenames for a particular aircraft tail number. The aircraft work file will incorporate information from the acquisition module, the image analysis module, and the repair module as it is updated. All image data will be stored in individual files in either Bit-Mapped image file format (.BMP) or in Tagged lmage File format (.TIF) depending on the user's preference. The names of the image files will be created automatically from information related to the position of the placement in the plan, the sequential group number, and the sequential number of the placement within the group. Users will interface to these image files graphically through the turtle diagram. The aircraft work file could be archived for comparison with future inspections even if all the images associated with it have been deleted, since it records the defects found and any repair actions on the turtle diagram and not the images themselves. Figure 6 shows the five modules schematically and the corresponding input and output files.
Inspection _ _ _ Plan (.PLN)
lmage Files
(.BMP) Aircraft (.TIF) Work File (.AIR)
Visual Analysis
Sensor Tarset Type
File (.TGL) Definitions 1 (.SNR)
Sensor SINID, 4
Module
Calibration File
( . W
Aircraft Work File (.AIR) "
(during create) Inspection
Plan ( . P W - Sensor SIN ID
Calibration
(.INl) v v File ( HD) Image
Acquisition DUSCALJN Module ..
Image Work File (.AIR)
(.TIF)
FIGURE 6. RELATIONSHIP OF DAlS MODULES AND SYSTEM FILES
8

3.3 Description of Program Modules
3.3.1 Inspection Plan Module
The inspection plan module is basically a graphical editor that creates an inspection plan from an existing planar drawing of the aircraft (turtle diagram) and the footprint of sensors needed to accomplish the desired inspection. The goal of this module is to allow an experienced inspector to design a plan of inspections for a set of DAIS sensors from the inspection requirements of a regular maintenance schedule or service bulletin. The inspection plan can then be executed by NDI technicians who will be guided by the plan each time the inspection is needed. This will result in a consistent set of inspections that can be compared over time. The aircraft drawing is presumed to already exist and must satisfy a limited set of constraints during its creation. Once an inspection plan is created it can be used over and over again. More than one inspection may be created due to different inspection schedules or needs.
Table 1 summarizes the functions and the menu system for inspection planning.
TABLE 1. INSPECTION PLAN MENU ITEMS
I tail number, etc., to create an inspection plan file (.PLN)
Menu Item
File -
I File I Opens an existing plan file
Button Submenu Item Function
- Create.. .
1 save
Loads aircraft drawing file(s) and user information for a specific aircraft given by its
Modify ... I - I save I Saves the changes to the opened plan file
Modifies the list of drawing DXF files and the user header information
Close
Save As...
Print Turtle Diagram ... -
Saves the changes to the inspection plan in a new file
P~inter Setup ...
Exit
Closes the opened plan file without leaving the program
Prints the turtle diagram to the system printer specified
Allows configuration of printer settings
Exit Exits the program to Windows

TABLE 1. INSPECTION PLAN MENU ITEMS (cont'd)
Button Function I Menu ltem I Submenu ltem I Select Page.." Page Displays a list of available plan pages for selection
Previous Page I Loads previous page in plan file from the current page
Next Page I Loads next page in plan file from the current page
Zoom Eull Sets turtle diagram size to include the entire diagram in the display window
Zoom In Zoom + Enlarges the size of the turtle diagram by the selected zoom increment and centers it about the position of the cursor
Reduces the size of the turtle diagram by the selected zoom increment and centers it about the position of the cursor
Zoom _Out Zoom -
Zoom Increment ... Sets the zoom increment as a percent of full scale to 1 %, 5% , lo% or 25%
New.. .
Merge ...
New Starts a new group definition
Rename
Merge
Renames the selected placement group
Merges the two selected groups using the name of the first
1 Delete Delete
Edit Group
Deletes the selected placement group
Edjt Group Selects placement group for editing of placements
Placement - Settings ... Settings Sets sensor model, orientation, overlap, and surface radii parameters for subsequent placement operations
Allows setting changes to an individual placement
Creates a single placement on the turtle diagram with a mouse click
Change.. . Change
Single Single
Line Creates a line of sensor placements on the turtle diagram based on two point specification
Array Creates an array of sensor placements on the turtle diagram based on three point specification

TABLE 1. INSPECTION PLAN MENU ITEMS (cont'd)
Menu Item
options I Units ... -
-
Close Group
I - 1 Selects English (in) or Metric (mm) units I
Submenu Item
Delete
Close Terminates editing of placements in current Group
-
Help - I contents ... l ~ i s i a ~ s contents of help document I
Button
Delete
I Using Help ... I I Explains how to use help I
Function
Deletes a single placement
3.3.2 InstallICalibrate Module
About ...
The installlcalibrate module is intended to be used infrequently; it is required whenever a new sensor is purchased or when a spatial recalibration is warranted due to sensor repair, sensor damage, or hardware component drift. Each sensor is equipped with an ID number chip that will identify it to the system in terms of sensor type, model number, and its unique spatial calibration to a known spatial calibration target. The spatial calibration is needed to allow the removal of the "keystone" or perspective effect found in all D SIGHT images as well as aircraft surface curvature by making the image appear as a flat, top-view image. The calibration results in a set of parameters for a spatial camera model and does not relate to defects or defect calibration whatsoever. Table 2 summarizes the functions and menu items for installing and calibrating.
Displays release version of program
TABLE 2. INSTALLICALIBRATE MENU ITEMS
Menu Item
Install ...
Help ... -
Calibrate ... -
List ... -
Deinstall ... -
1 Contents ... I 1 Displays contents of help document
Submenu Item
Calibrate
List
Deinstall
1 Exit 1 I I Exits program to Windows
Button
Install
Provides parametric spatial calibration of camera for removal of perspective distortion in saved images
Generates printable list of installed sensors along with calibration status
Allows user to remove sensor from active list of available sensors
Using Help ... -
About ...
Function
Reads ID number from sensor and user selects DAIS model number
Explains how to use help
Displays release version of program

3.3.3 Acquisition Module
The image acquisition module is a key module that uses an existing inspection plan, designed for a specific aircraft type and maintenance schedule, and applies it to a particular aircraft tail number. The goal of this module is to remove the burden of where to inspect and what has been inspected already by providing a graphical color display of the inspection areas that have or have not been inspected, and the remaining inspection areas. In addition, the module will automatically prompt the technician to position a specific sensor in preplanned areas that cover a logical section (eg., top of wing) of the aircraft. Each logical section or group created by the inspection planner, however, can be selected arbitrarily by the technician depending on the availability of that area for inspection. The module also removes the burden of managing images and filenames by allowing the position of the inspection area on the turtle diagram to define an internal filename that can be accessed graphically rather than by a filename. An aircraft work file will keep track of completed inspections and any outstanding inspections. This file may be opened and closed as many times as needed over the course of the inspection process until all the inspections are finished. The file is also available for image analysis of already completed inspections or repair planning before the remaining inspections are finished.
The primary video window displaying the D SIGHT image is shown in figure 7. The light is automatically adjusted to a preset target level and the image will remain live for a preset time.

Table 3 summarizes the functions and menu for the acquisition program.
TABLE 3. ACQUISITION MENU ITEMS
Menu ltem
Submenu ltem Button Function
File - Create.. . - Loads inspection plan file (.PLN) and user information for a specific aircraft given by its tail number, etc., to create an aircraft work file (.AIR)
Open ... -
Modify Header ... -
File Opens an existing aircraft work file -
Modifies the user header information
Save - Save Saves the changes to the opened aircraft work file
Closes the opened aircraft work file without leaving the program
Exits the program to Windows Exit Exit
Page - Select Page.. - Page Displays a list of available plan pages for selection
Previous Page - Loads previous page in inspection plan from the current page
Next Page - Loads next page in inspection plan from the current page
Zoom Eull Sets turtle diagram size to include the entire diagram in the display window
Enlarges the size of the turtle diagram by the selected zoom increment and centers it about the position of the cursor
Zoom in Zoom +
Zoom Out Zoom - Reduces the size of the turtle diagram by the selected zoom increment and centers it about the position of the cursor --- - - -
Sets the zoom increment as a percent of full scale to 1 %, 5%, 10% or 25%
Opens an existing placement group
Zoom I ngement..
Group
!mage
Open
Close Close - Closes the opened placement group
Acquire Displays live image capable of being saved for the particular placement box highlighted
Acquire.. --
Displays a stored image file for the particular placement box highlighted
Recall.. - Recall
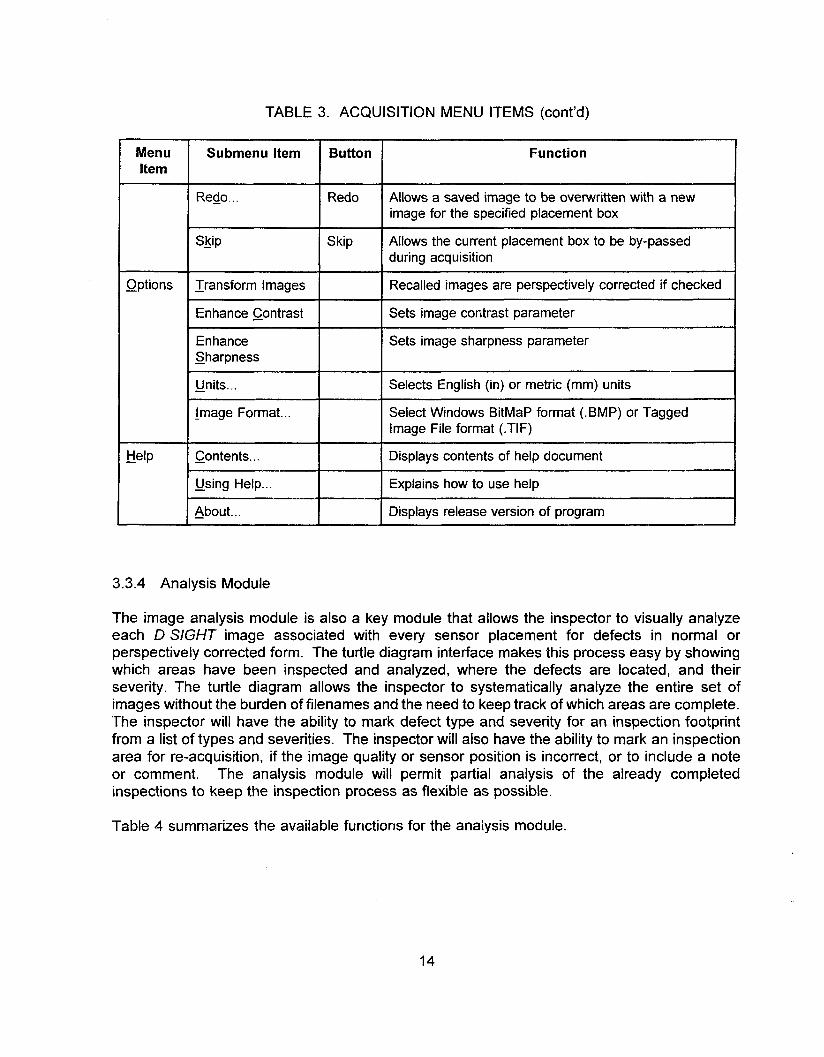
TABLE 3. ACQUISITION MENU ITEMS (cont'd)
Options -
Help -
Submenu Item Button
Skip I Skip
Enhance Contrast
Enhance Sharpness -
Units ... -
image Format.. .
I
Contents. .. - I Using Help ... - I About ... -
Function
Allows a saved image to be overwritten with a new image for the specified placement box
Allows the current placement box to be by-passed during acquisition I --
Recalled images are perspectively corrected if checked I --
Sets image contrast parameter I Sets image sharpness parameter
Selects English (in) or metric (mm) units I Select Windows BitMaP format (.BMP) or Tagged image File format (.TIF)
--
Displays contents of help document
Explains how to use help I Displays release version of program
3.3.4 Analysis Module
The image analysis module is also a key module that allows the inspector to visually analyze each D SIGHT image associated with every sensor placement for defects in normal or perspectively corrected form. The turtle diagram interface makes this process easy by showing which areas have been inspected and analyzed, where the defects are located, and their severity. The turtle diagram allows the inspector to systematically analyze the entire set of images without the burden of filenames and the need to keep track of which areas are complete. The inspector will have the ability to mark defect type and severity for an inspection footprint from a list of types and severities. The inspector will also have the ability to mark an inspection area for re-acquisition, if the image quality or sensor position is incorrect, or to include a note or comment. The analysis module will permit partial analysis of the already completed inspections to keep the inspection process as flexible as possible.
Table 4 summarizes the available functions for the analysis module.

TABLE 4. ANALYSIS MENU ITEMS
Menu ltem
Function Submenu Item
File -
Button
Open.. . - I File I Opens an existing aircraft work file (.AIR)
Print Images ... I I Prints the images from the specified group or page
Modify Header.. . -
Save -
Close
Print Turtle - Diagram.. .
Prints the turtle diagram to the system printer specified
Save
Printer Setup ... I I Allows configuration of printer settings
Modifies the user header information
Saves the changes to the opened aircraft work file
Closes the opened aircraft work file without leaving the program
Exit I Exit ( Exits the program to Windows
Select Page.. . - Page Displays a list of available plan pages for selection
Previous Page - Loads previous page in inspection plan from the current page
Next Page - Loads next page in inspection plan from the current page
Zoom Eull Sets turtle diagram size to include the entire diagram in the display window
Zoom In Zoom + Enlarges the size of the turtle diagram by the selected zoom increment and centers it about the position of the cursor
Zoom Qut Zoom - Reduces the size of the turtle diagram by the selected zoom increment and centers it about the position of the cursor
Zoom Increment ... Sets the zoom increment as a percent of full scale to 1 %, 5%, 10% or 25%
--
Open I Open I Opens an existing placement group
Close I Close ( Closes the opened placement group
mage Analyze.. . Analyze Displays stored image for the particular placement box highlighted for visual interpretation and recording of results on turtle diagram
Displays a stored image file for the particular placement box highlighted
Recall.. . Recall

TABLE 4. ANALYSIS MENU ITEMS (cont'd)
Menu ltem
Options -
Help -
Submenu ltem I l Function
Redo.. . I Redo I Allows an analyzed image for the highlighted inspection box to be re-evaluated
Skip I Skip
Enhance Sharpness
Allows the current placement box to be by-passed during visual interpretation and analysis
Recalled images are perspectively corrected if checked - -
Sets image contrast parameter
Sets image sharpness parameter
Units ... - I I Selects English (in) or metric (mm) units
Contents.. . - I I Displays contents of help document
Using Help ... - Explains how to use help
About.. . - Displays release version of program
The critical display of the image is provided in a dialog box as shown below. If the image in the placement box indicates corrosion and is marked accordingly, the placement box is marked in red on the turtle diagram on exit with an OK. The aircraft work file is then updated with the defect type and severity. If no corrosion is found, the placement box is marked with green on exit with an OK.
JRE 8. ANALYSIS DIALOG BOX FOR VIEWING AND MARKING DEFE CTS

When images need to be printed, a new menu is presented that includes several criteria for selecting the images that are desired. Menu functions are listed in table 5.
TABLE 5. IMAGE PRINT MENU ITEMS
Menu 1 Submenu ltem ltem
Button Function
Page I Select Page ... I Page I Displays a list of available plan pages for selection - I Previous Page
Next Page I Zoom Eull
Zoom In
Loads previous page in inspection plan from the current page
Zoom Out
Zoom +
Zoom Increment ...
- --
Loads next page in inspection plan from the current page
Sets turtle diagram size to include the entire diagram in the display window
Enlarges the size of the turtle diagram by the selected zoom increment and centers it about the position of the cursor
Sets the zoom increment as a percent of full scale to 1 %, 5%, 10% or 25%
Zoom - Reduces the size of the turtle diagram by the selected zoom increment and centers it about the position of the cursor
Selects or deselects images from all placement boxes on the current page
Selection -
All with Color
All on Page
All with Severity
by Group
by Placement
Color
Severity
Group
Selects or deselects images from all placement boxes with the selected color
Selects or deselects images from all placement boxes marked with defects with the selected severity level
Selects or deselects images for a group by clicking on any member of the group
Placement
Sets flag to perspectively correct images (if calibrated) prior to printing or display
Selects or deselects images for individual placements from any group by clicking on the placement box
Options -
w r a s t 1 I increases image contrast. if set
Transform Image
E e - p I I Increases image sharpness, if set I - Sharpness I

TABLE 5. IMAGE PRINT MENU ITEMS (cont'd)
Menu ltem Submenu Item I Button I Function
I cancel I Cancel image printing and exit print menu
Units -
Print ... -
- -
Selects English (in) or metric (mm) units
3.3.5 Repair Module
Print ...
The repair module is intended to produce a repair plan that may span several inspection areas or fractions of them. By observing the locations and severity of defects, the engineer can propose a repair strategy for the affected areas from a knowledge of the aircraft, physical constraints, and defect locations. The resulting marks on the turtle diagram should provide a visual repair plan for the affected areas, including any special instructions regarding the repair. The repair plan can also be tagged for completed repairs.
Display print dialog box for selection of copies, resolution, and printer setup functions including paper type, orientation, and driver options
Table 6 summarizes the functions and menu for the repair program.
TABLE 6. REPAIR PLANNING MENU ITEMS
Menu Item
File -
Page -
Submenu Item Button Function
Open ... - File Opens an existing aircraft work file (.AIR)
Modify Header . I - I Modifies the user header information I Save - Saves the changes to the opened aircraft work I Save I file
I I Closes the opened aircraft work file without leaving the program
Print Turtle Diagram ... - Prints the turtle diagram to the system printer specified
Printer Setup ... Allows configuration of printer settings
Exit I Exit I Exits the program to Windows I Select Page.. . - Displays a list of available plan pages for
selection
Previous Page - I I Loads previous page in inspection plan from the current page

TABLE 6. REPAIR PLANNING MENU ITEMS (cont'd)
Menu ltem
Zoom -
Repair -
Options -
Help -
Submenu ltem I Button
Next Page -
Zoom Eull
Zoom in Zoom +
Zoom Qut Zoom -
Zoom Increment ... I
Create - I Create
Delete Delete --
Confirm Confirm
Units ... -
Contents.. . -
Using Help ... -
About ...
Function
Loads next page in inspection plan from the current page
Sets turtle diagram size to include the entire diagram in the display window
Enlarges the size of the turtle diagram by the selected zoom increment and centers it about the position of the cursor - -- -
Reduces the size of the turtle diagram by the selected zoom increment and centers it about the position of the cursor
Sets the zoom increment as a percent of full scale to 1 %, 5%, 10% or 25%
Starts the definition of a new repair zone including the ability to draw a rectangular area over the turtle diagram and textual information
Deletes one of the existing repair zones
Indicates that the repair is complete by changing the color of the repair zone to green (complete) from red (planned) or viceversa
Marks individual placement boxes for re- acquisition by changing color to yellow
Selects English (in) or metric (mm) units
Displays contents of help document
Explains how to use help
Displays release version of program

4 ACCELERATED CORROSION TESTING AND NDI
4.1 Specimen Preparation
Accelerated corrosion testing was carried out by the Structures, Materials, and Propulsion Laboratory of the IARINRC during Phase I of the project and at the conclusion of that phase it was decided to continue the accelerated corrosion testing effort. This was done primarily to extend the accelerated corrosion work to constructions of lap splices not included in the Phase I work. The following sections summarize the Phase II work as described in the technical report, LTR-ST-2006, written by R.W. Gould, A. Marincak, and J.P. Komorowski of NRCIIAR.
A total of 27 specimens representing several constructions of longitudinal and circumferential lap joints were prepared for exposure to a corrosive environment in a salt fog chamber. The first 24 are summarized in table 7. Included were a number of unaltered original specimens as removed from the aircraft. Typically the specimens were disassembled to verify the condition of the joint. The protective coatings of selected surfaces were removed prior to reassembly and corrosion testing. Specimen reconstruction included the original skin material and stiffener structure.
Corrosion library panel No. L1011-12 was chosen as the source for accelerated corrosion specimens representing the lap splice construction of a Lockheed LA01 1 widebody aircraft. Four accelerated corrosion specimens were fabricated from this parent piece. These specimens are identified as 12A through 12D. Each specimen has three lap splices (top, middle, bottom). The original (middle) lap splice has an adhesive bond at the faying surface. This bond could not be released and so all middle laps were left intact as control specimens. There was one exception for specimen 12C in which the mating surface of the stringer was prepared for corrosion testing. The new top and bottom lap splices were constructed parallel to and on either side of the original lap splice.
Corrosion library panels WA3, WA4, WA6, and WA7 were the sources for accelerated corrosion specimens representing the lap and circumferential splice construction of a Douglas DC-10 widebody aircraft. Two specimens were remanufactured from WA3 and are identified as WA3A and WA3D. Both have a single lap splice as well as an adjacent skinlstringer prepared for corrosion testing. Four lap specimens were remanufactured from WA4 and are identified as WA4A through WA4D. All four have a single lap splice. One accelerated corrosion specimen was taken from WA6. This specimen is identified as WA6A and represents the construction of the lap splice, skin doubler, and stringer in the area of the lower window belt. This specimen was not disassembled but was prepared as an accelerated corrosion test specimen by drilling small holes from the inner surfaces in selected areas to expose various layers of the construction to the corrosive medium. Two specimens were prepared from specimen WA7 for Phase I. Testing was continued in Phase II. The specimens are identified as WA7A and WA7B. These two specimens are circumferential splices. These specimens were previously exposed for 695 hours with no evidence of corrosion activity at the end of Phase I testing. However prior to the start of Phase II corrosion exposure, the D SlGHTinspection indicated that detectable corrosion levels had occurred in both joints. The specimens had been stored for nine months in a laboratory environment yet enough corrosive medium must have remained in the joint to allow the corrosion to continue. It would seem from this experience that it will be difficult to arrest

corrosion once it is initiated without specimen disassembly. This points to the need for any studies attempting to compare various corrosion NDI techniques to be carried out in a short period of time to prevent significant changes in corrosion levels.
Corrosion library panel 56T19 was the source for one accelerated corrosion specimen representing the lap splice construction of a Douglas DC-9 aircraft. This specimen is from the intersection of a lap and circumferential splice.
Three DC-9 lap splice specimens from Phase I were included in the last corrosion exposure period. These specimens (25, 26, and 27) were part of an investigation into the influence of rivet spacing on D SIGHT inspection signatures.
The specimens are each nominally of 0.19 m2 to 0.14 m2 (1.5 to 2 sq.ft.) in surface area. Each of the specimens was inspected by D SIGHT and shadow moire prior to inclusion in the corrosion test and at subsequent inspection intervals and with eddy current during the final inspection.
4.2 Specimen Disassembly and Reassembly
Selected specimens were opened to prepare one or more surfaces of the joint for corrosion activity. The fasteners were removed, and if present, the adhesive layer or sealant was also removed. The formed tail of the aluminum rivet was first drilled with a bit having a smaller diameter than the rivet . This reduced the rivet strength and made it easy to chisel off the formed tail. The remaining rivet was then punched out with the specimen placed face down on a padded surface.
Those specimens which incorporated an adhesive layer were heated to 50°C to facilitate separation of the skins. The selected surface was abraded with a medium or ultrafine ScotchBrite disc to remove the protective primer and/or cladding. The speed of the tool was regulated to avoid overheating the skin.
The specimen components were relocated with and held initially by Kleeko fasteners. New rivets were installed in the original holes. An air driven riveting gun was mounted in an arbour press and configured to allow a single operator to carry out the riveting procedure. This procedure also reduced the introduction of deformations and marks from hand-held riveting. The original countersinks were adjusted when required to provide a flush fit for the head of the new rivet.
The outboard surfaces, which were to be monitored during the test, were brought to a uniform condition. Where the original paintlprimer system was damaged and degraded, it was chemically striped and repainted in a gloss white finish. Intact original paint systems were retained but were spray painted gloss white to cover multiple colors. The inboard surface and new fasteners were spray painted with a zinc chromate primer.

TABLE 7. PRECORROSION INSPECTION MATRIX
Y - lnspection carried out N - lnspection not carried out
TIMIB - Top/ MiddleIBottom lap (1) Three laps per specimen. Center lap is unaltered original/control (except 12C) (2) One adjacent stringer per specimen has protective coating removed for accelerated corrosion (3) Not torn down. Lap, doubler, and window frame drilled from back side to introduce corrosion

4.3 Corrosion Test Setup and Specifications
The prepared specimens were suspended by plastic straps inside a Singleton Salt Fog Test Cabinet (SCCH Model #22) and arranged so that they did not contact or overlap each other.
The cabinet is made of plain steel with an interior lining of inert, oven-cast, seamless PVC. It is uniformly heated by water jackets on all four sides and the bottom. The top is covered with a Plexiglas dome. The cabinet is equipped with a humidifying (bubble) tower with a micro bubble aerator for generating humidified air. Distilled water inside the bubble tower, which is fed from a 10-gallon supply reservoir, is maintained at a constant level by a Level-matic (patented) control unit. The bubble tower is instrumented with a pressure gauge and an airflow meter. The output flow rate is controlled by regulating the pressure of the air supply to the tower. The humidified air from the bubble chamber is fed into a fog tower reservoir inside the cabinet where it is mixed with the salt solution before being dispelled through an atomizer into the dispersion tower. The latter is fitted with internal baffles to produce a homogenous mist of free-falling spray without directional corrosion effects. The salt solution is brought into the fog tower from another reservoir (36 gallon capacity) by gravity feed. The temperatures inside the bubble tower and the cabinet are monitored by automatic electronic controls with digital displays. The corrosion cabinet was fitted with an exhaust condenser assembly, wherein the salt fog exhaust from the cabinet was condensed by mixing it with a continuous supply of recirculated water and collected for disposal into a third reservoir.
The cabinet was operated in the manual mode under a continuous spray cycle with daily system function checks by the operator.
For the application of accelerated corrosion to the lap and circumferential splice specimens, the humidifying (bubble) tower temperature was maintained at 35°C (95°F) and the temperature inside the salt spray cabinet at 48°C (1 18°F).
A bubble tower pressure of 90 KPa (13 psi) is used in the operation of this cabinet to prevent contamination of the room environment as was experienced in Phase I when the chamber was operated at the recommended pressure of 125 KPa (1 8 psi). This results in a fog collection rate of 0.8 ml per hour.
As per ASTM standard B638 for Copper Accelerated Acetic Acid Salt Spray Testing (CASS Test), the salt solution was prepared with 5 parts by weight of sodium chloride dissolved in 95 parts of distilled or reagent grade water and reagent grade copper chloride (CuCI2*2H,O) added at a rate of 0.25 gllitre. The pH of the salt solution is lowered to a value of 2.8-2.9 by the addition of glacial acetic acid, which provided the atomized salt spray with a pH value between 3.1 and 3.3.
4.4 Pre- and Postexposure NDI
At intervals, the specimens were removed from the salt spray cabinet and inspected for corrosion activity. Prior to inspection, the specimens were washed with water to remove the accumulated salt deposits. The test matrix includes a total of five inspection periods: at 0 hr. (precorrosion), and at 695, 1 145, 1455, and I647 hrs.
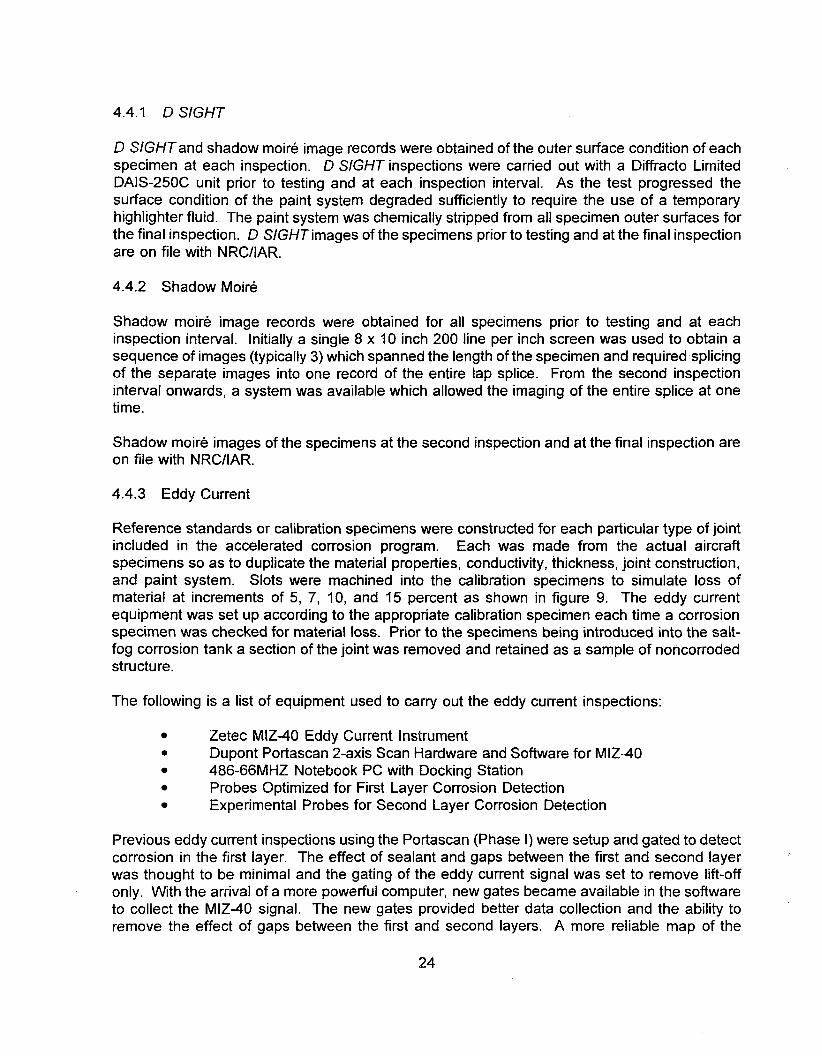
4.4.1 D SIGHT
D SlGHTand shadow moire image records were obtained of the outer surface condition of each specimen at each inspection. D SIGHT inspections were carried out with a Diffract0 Limited DAIS-250C unit prior to testing and at each inspection interval. As the test progressed the surface condition of the paint system degraded sufficiently to require the use of a temporary highlighter fluid. The paint system was chemically stripped from all specimen outer surfaces for the final inspection. D SlGHTimages of the specimens prior to testing and at the final inspection are on file with NRCIIAR.
4.4.2 Shadow Moire
Shadow moire image records were obtained for all specimens prior to testing and at each inspection interval. Initially a single 8 x 10 inch 200 line per inch screen was used to obtain a sequence of images (typically 3) which spanned the length of the specimen and required splicing of the separate images into one record of the entire lap splice. From the second inspection interval onwards, a system was available which allowed the imaging of the entire splice at one time.
Shadow moire images of the specimens at the second inspection and at the final inspection are on file with NRCIIAR.
4.4.3 Eddy Current
Reference standards or calibration specimens were constructed for each particular type of joint included in the accelerated corrosion program. Each was made from the actual aircraft specimens so as to duplicate the material properties, conductivity, thickness, joint construction, and paint system. Slots were machined into the calibration specimens to simulate loss of material at increments of 5, 7, 10, and 15 percent as shown in figure 9. The eddy current equipment was set up according to the appropriate calibration specimen each time a corrosion specimen was checked for material loss. Prior to the specimens being introduced into the salt- fog corrosion tank a section of the joint was removed and retained as a sample of noncorroded structure.
The following is a list of equipment used to cat-ry out the eddy current inspections:
Zetec MIZ-40 Eddy Current Instrument e Dupont Portascan 2-axis Scan Hardware and Software for MIZ-40
486-66MHZ Notebook PC with Docking Station Probes Optimized for First Layer Corrosion Detection Experimental Probes for Second Layer Corrosion Detection
Previous eddy current inspections using the Portascan (Phase I) were setup and gated to detect corrosion in the first layer. The effect of sealant and gaps between the first and second layer was thought to be minimal and the gating of the eddy current signal was set to remove lift-off only. With the arrival of a more powerful computer, new gates became available in the software to collect the MIZ-40 signal. The new gates provided better data collection and the ability to remove the effect of gaps between the first and second layers. A more reliable map of the

corrosion specimens could now be generated. At present five percent thickness loss or greater can be reliably detected in the first layer.
The selection of the appropriate eddy current probe was not a straightforward process. Initially the probe was a standard off-the-shelf single coil unit selected to match the first layer skin thickness. Optimum setup with the MIZ-40 gave results of 10 percent or greater thickness loss with a "go" or "no-go" type of mapping on the Portascan. To improve upon this sensitivity, a reflection type probe was obtained. In this type of probe the pickup coil is separate from the drive coil. The new probe increased the sensitivity of the system to material loss and gave fewer false calls. Through numerous setups and different suppliers, an optimum probe and configuration were found which detected a loss of thickness to 5 percent or greater with the ability to map various levels of corrosion. One probe, which had the greatest sensitivity, was sent to the manufacturer along with our calibration specimen and MIZ-40 settings for improvement. This advanced probe is currently in use. Other sources of corrosion probes are being investigated.
The DC-10 specimens have introduced problems for eddy current inspection. Until now the corrosion specimens were inspectable because the lap joint was in the first layer. In the DC-10 specimens, the joints are covered with a "beauty strip" so the lap is in the second layer. A calibration specimen was constructed from a DC-10 structure. Material was removed to represent a 5 percent and 10 percent thickness loss in the back face of the beauty strip, the lap joint front face, and the lap joint back face. The current probes and setup can reliably detect material loss in the first layer only. Corrosion detection in the second layer is difficult. A lower frequency must be used to penetrate to the second layer which results in a diminished sensitivity to material loss. The effect of gaps and sealant between the first and second layer results in an increase in the number of false calls due to the inability of the single frequency technique to distinguish between an air gap and the presence of corrosion.
In an effort to solve this problem a set of probes manufactured by Zetec is currently being evaluated. The manufacturer has made these probes specifically for the detection of corrosion in the second layer. As well, a new technique utilizing "signal mixing" is now under development. The eddy current probe is now excited at two separate frequencies. Corrosion detection in the second layer is enhanced by minimizing the undesirable signals by virtue of the mixing process.
The test matrix includes a total of five inspection periods: at 0 hr. (precorrosion) and at 695, 1145, 1455, and 1647 hrs. There were some departures from this inspection regime and these are all shown in tables 7 to 12.
The calibration test pieces are made from the same material as the corrosion test specimens. The material is machined from the skins as a ratio of thickness loss.

---I FIRST LAYER C A P
r -- / TamD LAYER
FIGURE 9. TYPICAL CALIBRATION SPECIMEN
TABLE 8. POSTCORROSION INSPECTION #2 MATRIX (INSPECTION CARRIED OUT - Y OR NOT - N)
P
SPECIMEN PQSTEXPCZSURE NDL TOTAL
Start Inspectian Duration D SfGffT Date Date [hours]
1-3 1 12A TlMlB 22/9/94 2111 0194 695 Y I Y I N I 695
TIMIB - Top1 MiddlelBottorn lap

TABLE 9. POSTCORROSION INSPECTION #3 MATRIX (INSPECTION CARRIED OUT - Y OR NOT - N)
-
TIM16 - Top/ MiddleIBottom lap

TABLE 10. POSTCORROSION INSPECTION #4 MATRIX (INSPECTION CARRIED OUT - Y OR NOT - N)
nM/B - Top/ MiddleIBottom lap

TABLE 11. POSTCORROSION INSPECTION #5 MATRIX (INSPECTION CARRIED OUT - Y OR NOT - N)
T/M/B - Top/ MiddleIBottom lap

TABLE 12. FINAL NDI INSPECTION AND RESULTS MATRIX
- , . . . . . . . , , , , , . . . . . . . . . . P. . , . . . . , , .. . . . . . . . . .
QSION DETECTION
1 I 12AT 1 31/1/95 I st 1 24/3/95 1 720 1 2367 RH-end 1 RH-end I Y
Doubler
(1) lmmersed 813 to 15/3/95 then hung
(2) lmmersed 2313 to 27/3/95 then hung
(3) Previous Phase 1 exposure. 1007 hours. Immersed 2313 to 29/3/95 then hung
Corrosion indications: RH-end - Right hand end of specimen
ENDS - Both ends of the specimen Y - Throughout the joint area
N - No indication

4.5 Results and Discussion
Periodic inspections of the exposed specimens were limited to D SlGHT and shadow moire since most of these did not indicate any corrosion activity. Only during the last inspection interval were positive corrosion indications recorded. This would suggest that corrosion requires a gestation or initiation period even on the surfaces on which the alloys were exposed following the removal of the protective coatings.
The considerable time of total exposure resulted in a degradation of the exterior specimen surfaces. Both optical inspection methods require a suitable surface condition. For D SIGHT, a temporary application of solid film highlighter was necessary in some cases. Shadow moire requires a flat uniformly coloured surface, hence a white powder coating was applied prior to inspection.
Specimen number 21, which was a backdrilled lower window belt lap joint and doubler, skinlstringer specimens 14 and 16, and lap splice specimen 18 (all typical of DC-10 constructions) did not develop detectable levels of corrosion.
The rivet spacing ratio in the L l O l l joints is approximately 0.5 (i.e., the distance between fasteners along the splice is twice the distance between the rows). As could be expected from the model of pillowing developed under Task 1.6, the D SlGHT signature is dominated by a wave occurring between fasteners rather than the depressed fasteners which are typical of a rivet spacing ratio 1 .O. The rivet spacing ratio of 0.5 results in a configuration amenable to D SlGHT corrosion detection.
Specimen number 24 contains both a circumferential butt splice and a longitudinal multi-layered splice, both typical DC-9 lap constructions. The modelling of corrosion pillowing for the DC-9 longitudinal joint indicated that corrosion detection will be more difficult for this type of joint. As predicted by the pillowing model, the bulging along the lap splice was not readily detectable in the longitudinal view but quite pronounced in the perpendicular view. This is directly related to the rivet spacing ratio for this splice being close to 2.0. The eddy current inspection of this lap splice is difficult as well due to the rivet spacing and probe size requirements.
As in the Phase I accelerated corrosion testing, the D SlGHT and shadow moire methods produced similar corrosion indications. Eddy current indications were absent in specimens 9, 12, 15, and 24. The corrosion levels in these specimens seem to be below the 5 percent thickness loss threshold of the eddy current corrosion detectability as used in this study. All other eddy current findings correlated with D SlGHT and shadow moire indications. The level of corrosion found by eddy current varied from 5 to 7 percent thickness loss.
All specimens will be subjected to teardown and microfocus X-ray inspections during Phase Ill of the project.
A significant corrosion initiation period was observed. Once corrosion had formed, the accumulation seemed to be relatively rapid. Significant differences in D SlGHT corrosion signatures were recorded. These can be related to the different rivet spacing ratio as predicted by modelling.

D SlGHTcan detect corrosion in a lap splice below 5 percent corrosion thinning level. For rivet spacing ratios greater than 1 .O, DAIS head placement along the greater rivet spacing direction might facilitate the inspection.
Future studies of NDI method corrosion detection capabilities will have to take place in a short period of time prior to test specimen teardown as it is very difficult to arrest the corrosion process.
Temporary solid film application to corroded external specimen surfaces for D SlGHTinspections was shown to be an effective highlighting alternative.

5 CORROSION MODELLING AND D SIGHT SIMULATION
5.1 Motivation
The application of D SlGHT to detect corrosion in lap joints is based on the observation that corrosion produces surface deformations in the aircraft skin commonly known as "pillowing" in between the fasteners of the joints. These deformations are caused by the accumulation of corrosion products between the faying (surfaces) elements of the joint.
Preliminary work carried out in Phase I of this agreement indicated that the level of bulging was influenced by the corrosion product volumetric increase. This increase was found to be over 6 times greater than the thickness loss which explained the high sensitivity of D SlGHTto lap joint corrosion. Phase II of this project proposed that finite element techniques be used to determine the surface deformation of corroded lap joints. These deformations would then be used to simulate D SlGHT images of the surfaces so that other joint structures could be simulated in the future without relying on actual samples. in most cases it is difficult, if not impossible, to obtain corroded specimens of a wide variety of joint configurations at various levels of corrosion.
The chemical composition of the corrosion product determined in Phase I was used to develop a mathematical model for correlating the amplitude of the pillowing deformation of the outer skin of a lap joint to the degree of corrosion inside the joint. The model was first used to determine the degree of corrosion in a plate that was fixed at four corners. Finite element techniques were then used in conjunction with the mathematical model to determine the amplitude of the pillowing in actual lap joints. These results were used to generate simulated D SIGHT images of corroded lap joints for calibration of the D SlGHTAircraft Inspection System (DAIS).
Corrosion tests will be carried out on a limited number of specimens to verify the modelling in Phase Ill. Given the large variety of lap joint designs, modelling should be a more cost effective way to calibrate the D SlGHT lap splice images.
The following sections summarize technical report, LTR-ST-2005, written by N.C. Bellinger, J.P. Komorowski, and S. Krishnakumar from NRCIIAR, that describes the model derivation and computer simulation results.
5.2 Mathematical Model and Assumptions
An analytical model of the pillowing of fuselage lap joints was developed on the premise that after the lap joint disbonds, assuming the surfaces were initially bonded, the aircraft skin between the rivets deforms perpendicularly to the joint surface. This creates a space within the joint due to the additional volume required by the corrosion product. Chemical analysis carried out at NRC on corrosion samples indicated that the insoluble product consisted of aluminum oxide trihydrate (aluminum hydroxide) mixed with a small proportion of aluminum oxide monohydrate. The molecular volume ratios for the different oxides are given in table 13. As can be seen from this table, the molecular volume of aluminum hydroxide is approximately 6.5 times that of pure aluminum.

TABLE 13. OXIDES AND VOLUMETRIC INCREASE FOR ALUMINUM
Aluminum Oxide Trihydrate AI20,*3H2O 155.96 2.42 5.78 6.454
The model assumes that the product of corrosion is distributed within the joint such that a uniform lateral pressure is exerted on the fuselage skins. It was also assumed that the lap joint was symmetrical about its mid-plane, thus only the outer skin was modeled. The closed-form classical plate theory of Timoshenko and Kriger was used to calculate the deformation of the outer skin supported by equidistant rivets and subjected to a uniform lateral pressure. As a first approximation, the dimensions of the rivets were taken to be small, that is, they offered only point supports. The plate segment bounded by four rivets was considered to be pinned at its four comers and subjected to a uniform pressure. Symmetrical boundary conditions were applied to all four edges of the plate.
5.3 Finite Element Model
The mathematical model was derived for a section of an infinite flat plate with rivets at each comer simulated by point supports. However, an actual lap joint, can contain free edges and stiffeners, which cannot be modeled using a closed-form solution. Therefore, finite element techniques were required to develop a model of an actual aircraft lap joint. The commercially available NlSA finite element code, which operates on the Silicon Graphics Series L Challenge at NRC, was used for all numerical analysis. Initially, a convergence study was carried out on the flat plate model to determine the effect that element type and size had on the accuracy of the results. Two finite element models were generated for the convergence study; one used 3-D second-order general shell elements with six degrees of freedom (three translation and three rotational), while the other used 3-D second-order brick elements with three degrees of freedom (three translational). Both models were fixed at the four corners, and symmetrical boundary conditions were placed along the edges. A constant pressure of 6.89 kPa (1 psi) was applied normal to the surface of the plate. As a criterion of convergence, when the finite element simulation results were within 3 percent of the closed-form solution, the model was assumed to have converged.

Using the results from the convergence study, two fuselage lap joint configurations were modeled; one with a rivet spacing ratio, bla, of 1 (equally spaced rivets) and the other with a ratio of 2. Since lap joints contain stiffeners, the joints were not symmetrical about their mid- planes and thus both skins had to be modeled. Initially, a constant pressure of 6.89 kPa (1 psi) was applied to both the outer and inner skins of the joint.
5.4 Results and Discussion
5.4.1 Mathematical Model
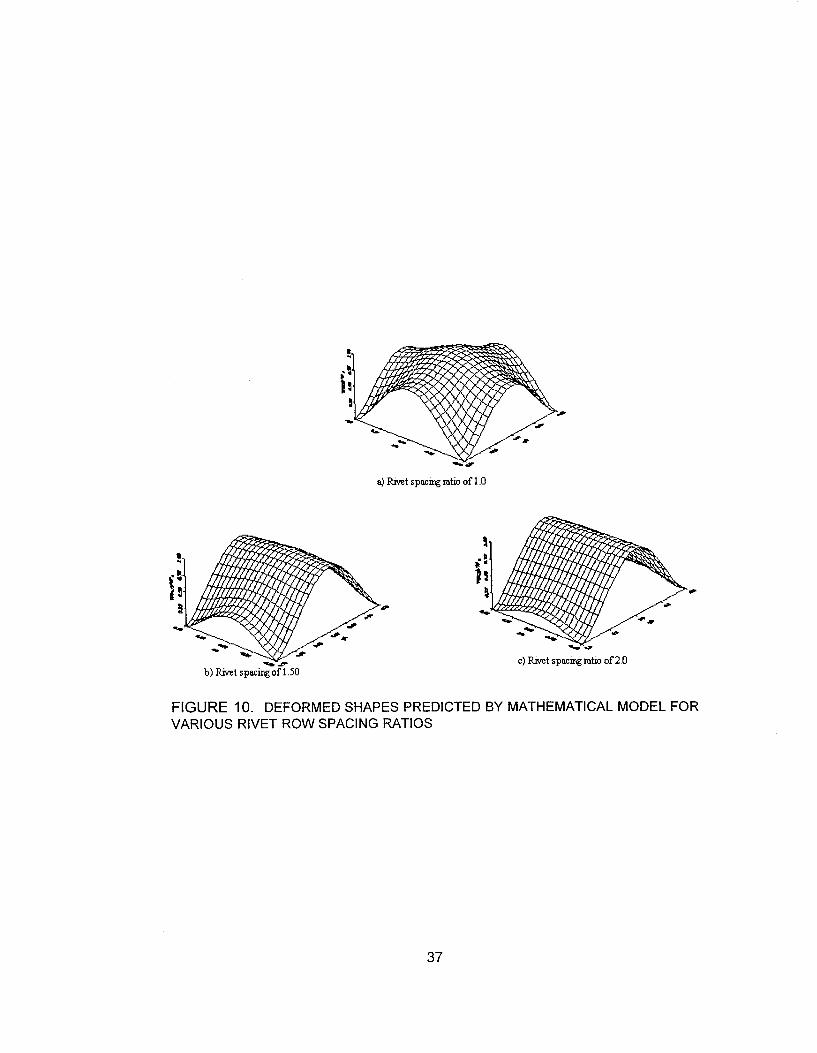
A FORTRAN program was written to calculate the central deflection and volume under the deflected plate as well as the deformed shape for various rivet spacings. The central deflection height and volume under the deflected plate were used to normalize the data for analysis purposes. The maximum deflection occurs when the rivet spacing is equal (i.e., forms a square) and tends to level off as the rivet spacing ratio increases. The deformed shapes of plates with rivet spacing ratios of 1 .O, 1.5, and 2.0 are shown in figure 10. The plots are normalized with respect to the central deflections. For equally spaced rivets, the deflection at the mid-points of the edges is 0.75 times the central deflection. However, as the rivet spacing ratio increases, the relative deflections at the shorter edges decrease while those at the longer edges increase. For example, the deflections at the mid-points of the short and long edges for a rivet spacing ratio of 2 are 0.18 and 0.995 times the central deflection, respectively. This indicates that if visual inspection was used to determine the extent of corrosion within a joint with a high rivet spacing ratio, it may be difficult to detect the deformation. Also, since eddy current inspection techniques require a relatively large probe due to the low frequencies required to penetrate the skin thickness, it could be difficult to detect corrosion between the closely spaced rivets. On the other hand, D SlGHTwould have a clear advantage since it is adaptable to the detection of any out-of- plane phenomena leading to a change in surface topography greater than 4 micrometers.
5.4.2 Finite Element
As mentioned earlier, two finite models were generated to determine the accuracy of the 3-D general shell and 3-D brick elements to model the out-of-plane displacements. The mesh size was refined to determine the effect that element size has on the accuracy of the results. From this study it was concluded that the 3-D general shell elements could not accurately model the pillowing effect. Upon refining the mesh, the 3-D general shell elements produced results that were, at best, 7 percent higher than the closed-form solution while the 3-D brick elements were within 2 percent. Having met the convergence criterion, the 3-D brick elements were used to model all lap joints.
A finite element model was generated using first-order brick elements for a lap joint with three rows of equally spaced rivets. First-order elements were used in order to increase the number of data points which, in turn, would increase the accuracy of the simulated D SIGHT image. Symmetrical boundary conditions were applied along the long edges of the joint, while clamped boundary conditions were applied along the short edges. The z-displacements were fixed along the centerline of the rivets. A constant pressure of 6.89 kPa (1 psi) was applied to both the outer and inner skins.

The out-of-plane displacements obtained from the initial run were used to determine the volume under the deformed shape. The required volume for a number of percentage thickness losses ranging from 2 to 20 percent were then determined. The applied pressure was modified and the finite element analysis was re-run for each case. The displacement results for the outer skin were then used in a program, written by Diffract0 Ltd. which simulates the D SIGHT inspection technique. This program uses the algorithm referred to as "ray tracing" which is a three dimensional rendering technique that produces realistic signatures. Since symmetrical boundary conditions were used in the finite element analysis, the length of the lap joint was increased by mirroring the out-of-plane displacements. The resulting images for a joint of approximately 30 cm (12 inches) in length, are shown in figure 11 for a percentage thickness loss of 2, 6, 10 and 15 percent. These four signatures are presented to show the clear difference which occurs due to the increase in corrosion products. Note that as the corrosion products increase, the rivets are more pronounced.
Further analysis was carried out on the simulated images using the image processing system (IPS) developed by the Structures, Materials, and Propulsion Laboratory of IARINRC. Light intensity profiles were obtained along five lines in each image, one along each rivet row and one in between the rows. All the profiles had a sinusoidal waveform with the maximum peak occurring in the vicinity of the rivets. To compare the different profiles, the average light amplitude was calculated for the row of rivets near the edge of the joint for each image. The average light amplitude increased linearly as the thickness loss increased up to 8 percent. When these results are normalized with respect to the average overall light intensity (obtained by averaging the line profiles) for each image the values continuously increase, nonlinearly, until the 10 percent thickness loss after which they appear to remain constant. However, since figure 1 I shows a distinct difference in the simulated D SIGHT signatures between the 10 and 15 percent thickness loss, then the profiles should also be distinctive. The difference between the 10 and 15 percent thickness loss profiles is the presence of what can be termed a "peak secondary waveform" at the location of the rivets.
-xi#
a) Rivet spacmg ratio of 1.0
c) Rivet spacing ratio of 2 0 b) Rivet spacing of 1 SO
FIGURE 10. DEFORMED SHAPES PREDICTED BY MATHEMATICAL MODEL FOR VARIOUS RIVET ROW SPACING RATIOS

FIGURE 11. SIMULATED D SIGHT SIGNATURES FOR DiFFERENT PERCENTAGE THICKNESS LOSS

The line intensity profiles also indicate that the amplitude of this secondary waveform increases as the corrosion products increase above 10 percent. These image processing results indicate that it may be possible to attempt an automated D SlGHT image analysis. It is important to note that the most common NDI techniques (i.e., eddy current) measure the thickness of the skins and estimate corrosion by comparing the measured thickness to the original (or manufactured) thickness specification. The measured thickness may be affected by prior maintenance activity, manufacturing tolerances, and corrosion. Therefore the amount of material loss in a thin skin for a small amount of corrosion (less than 5 percent) could be well within the manufacturers tolerance for the aluminum sheet. On the other hand, D SlGHT measures the surface deformation or deflection caused by the formation of the corrosion product and not the actual thickness loss. The magnitude of the deformation is significantly larger than the magnitude of the material loss. As a result, D SlGHT is capable of distinguishing a very small change in percentage thickness loss by measuring the surface deflection, as shown by the ray tracing results.
The finite element model of a multilayer lap joint with a rivet spacing ratio of 2 was also generated. The applied boundary conditions are identical to those used in the previous model. Since this was a multi-layer joint, it was assumed that corrosion would occur in the first layer where the outer and inner skin make contact and in the second layer between the finger doubler and the inner skin. The configuration of the joint is such that a gap is present between the inner and outer skins caused by the placement of the finger doubler. This gap is significant in that it can contain corrosion products without causing out-of-plane displacements. To take this into account, the gap volume was determined and compared to the volume required by a specified thickness loss and the pressure applied to the gap was modified accordingly.
The out-of-plane displacements for a 5 and 10 percent thickness loss were used to generate the simulated D SlGHT signatures in figure 12. The signatures are not as pronounced as in the case for the rivet spacing ratio of 1 due to the fact that the out-of-plane displacements are a magnitude smaller. However, of significance is the fact that there was a D SlGHT indication of the corrosion in the second layer, although subtle.
The results can be summarized as follows:
1. A mathematical model has been derived that correlates the pillowing displacements and the thickness loss due to corrosion.
2. This model is independent of the thickness of the skin.
3. The rivet spacing affects the magnitude of the corrosion induced pillowing in lap joints and may significantly reduce the ability to detect corrosion visually.
4. It has been shown that D SIGHT is capable of detecting small changes in percentage thickness loss, thus demonstrating important improvement over currently deployed methods.
5. It has been shown D SIGHT images are a measure of the volume of the corrosion product which is present in a joint, and using the simulated signatures determined in this report, the thickness loss that has occurred in the skin can be estimated.

6. Preliminary D SIGHT image processing indicates that automated analysis for corrosion might be possible.
FIGURE 12. SIMULATED D SIGHT IMN
10%
3ES OF MULTILAYERED LAP JOINTS

6 FIELD TRIALS
6.1 British Royal Air Force
6.1.1 Background
The field trip to England was not an official trip under the contract. However, the results are reported here because they reinforce some of the concerns that have been found with the original prototype in field use. Several of the criticisms and suggestions have already been acknowledged and have been implemented in the new equipment developed in Phase II. At the time of this field trial, the new equipment was not yet completed so the original prototype developed in Phase I was sent instead. The field trial was performed in November, 1994, at various Air Force bases in England. Diffracto's representative at the field trial was David Willie.
The RAF has initiated a 3-year investigation into exploring practical and functional nondestructive inspection equipment. The RAF began its inquiries into the DAIS-250C at the ASNT show in Atlanta, GA, in the fall of 1994. Flight Lieutenant Noel Murray brought the D SIGHT technology to the attention of Sgt. Bill Bolton of the NDT group of the Central Servicing Development Establishment. Sgt. Bolton expressed interest in the speed and ease of the DAIS-250C and asked for the Diffract0 equipment to be tried at different military locations in England.
6.1.2 Inspections
6.1.2.1 RAF Brize Norton Airforce Base
The first task of the DAIS-250C was to inspect the belly skin of a VC-10. While it was made expressly clear that the greatest advantage of the DAIS-250C was unmistakably along lap joints, the RAF team wished to document rivet rows just forward of the wing fairings on both sides of the VC-10. The VC-10 has a long history with the RAF and is mostly employed as a "workhorse," including considerable duty as a fuel tanker. The tail number of the aircraft inspected was actually the last VC-10 in the fleet to not have its belly replaced: it was scheduled to do so within the next sixty days.
The lap joint below the window belt seemed to indicate light to moderate corrosion. There were definite areas of severe anomalies where the lap joint butted together. The "lifting" could very well be an indication of heavy machining or structural stress.
The rivet rows were extremely difficult to position in the field of view. Basically, heavy paint with no markings made for slower acquisition. In several areas a wavy type of signal prevailed, but few if any typical corrosion signatures were found. The VC-10 uses a double skin and the RAF was looking for indications of corrosion between the layers of the skin, not necessarily along lap joints.
The DAIS-250C was also used around the front access portal. It was relatively easy to see the indications of corrosion around this access area. However, the area also showed signs of previous repairs and we very well may have been looking at considerable amounts of bonding adhesive.

6.1.2.2 RAF Boscoome Downs Airforce Base
The Boscoome Downs facility provided us with two aircraft for corrosion inspection, a BAe Andover C.Mk and a BAe One-Eleven. Both aircraft were first manufactured in 1963. The Andover proved to be a difficult subject for D SIGHT. Most of the Andover was refurbished with rather tall rivet heads, not broad flat mushroom rivets, but the raised flat head type of rivet. The images showed some pillowing; however, the typical haloing signature surrounding the rivet head was not apparent in the images.
The BAe One-Eleven had been inspected prior to Diffracto's arrival on base. The RAF NDT team had apparently acquired some images along a lap joint, but again most of the data acquisition was targeted along rivet rows in the belly area of the aircraft. A great deal of these images proved to be unusable because highlighter fluid got onto the optics. But this was overcome in subsequent inspections with a cleaning of the optics.
6.1.2.3 BRA - Defence Research Agency, Ministry of Defence
The originally stated purpose of this visit was to look only at various composite materials. The agenda quickly changed when DRA brought out completely characterized specimens of VC-10. The better part of a morning was spent capturing images for Robert Smith, one of the developers of the Andscan System which was purchased along with DAIS by ARlNC last year. The RAF team handled the entire acquisition and captured some very good images. The group of scientists that gathered to witness the demonstration were impressed with the immediacy of DAIS. Smith seemed to know every inch of his samples and was soon able to read the signatures very easily. The images were saved under direction of Smith. He planned on correlating the D SIGHT images with his own scans.
When all of the VC-10 images had been taken, the demonstration moved to another part of the complex to look at a Jaguar wing. The composite material was extremely used with considerable impact damage present. The RAF took several images of obvious impact sites and presumably clear areas of the wing.
6.1.2.4 Unattended Inspections
The RAF NDT team retained the DAIS-250C for an additional week. The only other aircraft openly discussed was a Boeing 707, located at RAF Swanton Morley. The intention with the 707 inspection was to concentrate on lap joint inspection. Sgt. Bolton indicated that they would like Diffracto's interpretation of the images upon return of the DAIS-250C.
6.1.2.5 Difficulties with the Equipment and Procedure
(a) The most serious problem of the entire trip originated not from the equipment, but from the power source. There were continual "brown outs" while working at RAF Brize Norton. Once the NDT team was convinced the problem was not with the DAIS-25OC, but with power demands, things proceeded quickly.
(b) The RAF was not pleased with the demands of setting up log files.

(c) The original concentration on acquiring images from heavily painted rivet rows, not lap joints, quickly turned the two-man requirement into a four-man effort.
(d) Highlighter drips and dust.
6.1.3 RAF Initial Recommendations and Summary
(a) The RAF would like to see a simpler system for cataloguing images.
(b) Due to the alignment difficulties encountered with rivet rows, they suggested a small LCD monitor be affixed to the sensor head.
The Royal Air Force was extremely impressed with the speed and simplicity of the system. When it was suggested that images could be acquired by technicians at any location for further investigation by a small group of experts, it was made clear that they favour putting together a "squad" of DAlS inspectors that would travel to various bases. Further, the original purpose of buying a DAIS-250C would be to document pieces of various aircraft for long term condition studies. The speed of the DAlS would allow them to record several images from several different tail numbers, quickly building a Surface Condition Archive.
The RAF NDT team will be looking at their own correlations between DAIS, eddy current and other NDI methods, and actual tear down to evaluate the DAIS-250C for "viability in current maintenance programs". The highlighting procedure was generally sloppily done. They had little patience with thinning out streaks, stopping runs, or re-applying highlighter when necessary. Speed was definitely the objective, not the quality of the images. When we really took our time at the DRA facility in RAF Farnborough, the RAF NDT team seemed determined to match the quality of the specimen images at the following week RAF Swanton Morley 707 inspection.
The RAF NDT team is extremely interested in the next generation of the DAIS-250C. They very much want to observe a demonstration at a North American air carrier. The turtle diagram mapping is much like the "Kipper" diagram they currently use and they feel there might be a good fit. They were very critical of the first generation (menu-driven) software and did not like the nomenclature of printer functions in particular. They definitely want to see and try the new generation DAIS-250C.
6.2 Northwest Airlines
6.2.1 Background
Field Trial - Northwest Airlines, St. Paul, MN. - December 20, 21, 1994
Attended by:
Frank Karpala Diffract0 Limited Marc Noel Diffract0 Limited David Willie Diffract0 Limited

Jerzy Komorowski NRCIIAR Ron Gould NRCIIAR Dave Galella FAA
The purpose of this field trip was to observe and test the new DAlS hardware and software in the field and to capture D SlGHT images with the newly configured DAIS-250C sensor head, operator pendant, and graphical user interface software.
6.2.2 Inspections
12120194 DAY ONE 747-200
The initial attempts to bring up the acquisition module software and implement it resulted in a fallback to a "manual" image acquisition and archiving routine. This laborious system of keystroking placement identification, image acquisition and archiving, reiterated the problems recognized with the first DAlS prototypes. Lap joints were imaged along stringers 39L and 44L between body stations 460 and 720. A total of 29 D SlGHT images were acquired in 26 minutes.
Diffract0 staff worked to correct software problems via modem through the day and evening of the 20th.
1 212 1 194 DAY TWO 727-200
With replaced and reworked files, the image acquisition software performed well within its design expectations. The first inspection task on the 727 was to acquire images from crown stringers 4L and 4R. The second task was to acquire images from the aft belly section of the 727. The locations of the belly inspection, released to us the day before, were included in the inspection plan prepared on the evening of December 20th.
The crown was completely unobstructed and totally accessible. The inspection plan for the crown, created on the morning of the 21st, allowed for "production" type image acquisition. The acquisition along stringers 4R and 4L was demarcated by body stations 360 and 1183. Beginning aft and working counterclockwise to the nose and aft again, a total of 116 D SlGHT images were archived in 45 minutes of acquisition time. The average placementlcapture time was 24 seconds per D SlGHT image with a travel rate of 3 Wminute. Acquisition time was calculated by noting the stamped time of the first and last image in an array.
The aft belly inspection area of the 727 was also readily accessible; however, the belly was thoroughly coated with grease and dirt. It was successfully wiped clean with Electron highlighter fluid and countless sheets of shop towelling. Body stations 11 83 and 950 marked the boundaries of lap joint inspection along stringers, 26L, 26R, 27L, 27R, 28L, 28R, 29L, 29R, and 30. A total of 152 D SlGHT images were acquired and archived in 1 hour and 16 minutes for an average placementlcapture time of 30 seconds per D SlGHT image. The travel rate for this particular inspection was 2.3 feet per minute.

The acquisition rates may seem slower than first anticipated simply because there were a lot of stops and starts during acquisition to change operator positions, to explain the inspection procedure to Northwest personnel, and to explain what the images meant.
6.2.3 Observations by the DAIS Inspection Crew
6.2.3.1 Hardware
Sensor
The sensor-head seemed to be unbalanced when the operator used the handles for sensor placement to vertical positions on the aircraft. It was recommended that a large handle be mounted at the balance point of the sensor. The handle would "wrap" around the sensor, facilitating an operator's comfort preference and need for placement control. And the sensor's feet (pegs) seemed to slide far too easily on highlighted surfaces.
Pendant
The support neck strap was not overly favored as the sole method of controlling the pendant's weight. The monopod was very effective in transferring all the pendant's weight to the floor. The combination of monopod (as weight bearer) and the loosened neck strap (as an equipment safety precaution) was favored by all. During long acquisition runs, the monopod is a necessity.
Pendant-to-Sensor Cable
The length of cable between the pendant and sensor seemed limiting. It was noted by Noel that under the belly of the aircraft the sensor operator often "tugged the pendant operator along". The sensor operator generally began to move immediately to the next location after hearing "OK from the pendant operator. Meantime, the pendant operator was watching the screen and not where the sensor was going. A longer cable should allow for enough slack between the two at all times alleviating cable and connector wear and tear.
PEP Power Portable
The overall performance of the PEP was good. The physically fixed mouse requires some getting used to, but ultimately performs well. Positioning the LCD screen so more than two people can see a clear screen image at one given time was a bit taxing. This was overcome by splitting the audience between the computer screen and the pendant screen.
6.2.3.2 Software
The acquisition and analysis modules required a severe shakedown to indicate the proper direction to finish coding.

The lamp within the sensor head was set to turn off after each placement. We thought it might be slowing down the acquisition process.
a There was a problem with "double-clicking" on the pendant's touch screen. The touch screen's setup preferences were adjusted.
a The pendant's interface is now being optimized for "large controls only". Small controls are going to be avoided at the pendant.
6.2.4 Northwest Airlines - Reaction to the DAIS
At the inspector level there was some concern about the need to record inspection results on the computer. The idea that entire lap joints, at every panel location, could be inspected with relative ease and speed; however, created interest and excitement. The interpretation of the actual D SIGHT images seemed to raise the greatest number of questions. Inspectors were interested in learning how to read corrosion signatures.
Inspector comments on the software, even in its Windows environment, gravitated to a basic "fear of computers"; however, after watching the inspection crew for a while, observers began to understand the simplicity of the acquisition module. Because there was writing, saving, printing, and jumping to other applications (Mosaic, Program Manager, File Manager), the process looked more complicated than it is to people familiar with computers. The simplicity of picking a footprint off the .AIRcraft plan (after acquisition) and recalling that exact D SIGHT image proved to be the most exciting aspect of the software.
Northwest management seemed more interested in what was found rather than how it was found or how fast the inspection proceeded. Both Jeff Register and John Yuen (NDT Managers) questioned what image indications were being looked for and how to put a "value" on the signatures. The NDT managers were first and foremost interested in the final analysis on the corrosion findings. Only light corrosion indications were found in some areas including the aft belly area.
6.3 Air Canada
Air Canada - Dorval Airport, Montreal, February 2, 1995
Plane Inspected:
Boeing 747-200
Attended by:
Frank Karpala Diffract0 Ltd. Dave Willie Diffract0 Ltd. Omer Hageniers Diffracto Ltd. Jerzy Komorowski NRCIIAR

Ron Gould NRCIIAR Nick Bellinger NRCIIAR Jean-Louis Rene TDC Bill Miller TCA Dave Galella FAA Bob Hastings DND Charlie Buynak WPLABS
6.3.1 Inspections
The aircraft was undergoing routine maintenance and was near completion for our field trial and .progress review meeting. The aircraft surface was freshly painted with a white colour and was sufficiently reflective that no highlighting was required. Only portions of the aft left side of the aircraft were inspected. Both horizontal lap splices (stringers) as well as some circumferentials were inspected.
A roving platform was used for staging and had the ability to move position as well as elevate to the required height. Table 14 summarizes the inspected areas and the total number of images recorded with the turtle diagram interface.
TABLE 14. AIR CANADA INSPECTION SUMMARY
Stringer
19L
23L
In addition, two circumferentials were inspected at body stations 1740 and 1961 between stringers 34 and 51. A total of 37 images were taken in 16 minutes of inspection time.
34L
6.3.2 Performance and Results
Body Station Range
1961-2180
1961-2180
Because the aircraft was about to be released back to the fleet, it was not surprising that no significant corrosion indications were found. The equipment performed very well at the field trial and the new graphical interface with the turtle diagram was particularly comfortable to use.
1480-21 80
As was the case in many other field trials, the platforms and the inability to move quickly around the aircraft decreases the inspection rate because only about 5-6 images could be captured
Images Acquired
12
12
TOTAL
38
Inspection Time (min)
4
4
136
Inspection Rate (Wmin)
5
5
14 4.5
62 3.7

before the platform had to be moved. However, it did become clear that the creation of the inspection plan has to account for the staging as well as the normal requirements of the inspection. Different forms of the inspection plan could have reduced the amount of movement needed while covering the required areas. At the time of the field trial, not all the software features were in place to increase the flexibility of image acquisition. Either there must be enough software flexibility for acquisition, or the inspection plan must take the movement around the aircraft into consideration during the initial plan creation.
6.4 United Airlines
United Airlines - San Francisco, CA, February 15, 1995
Plane Inspected:
Boeing 737-291A: Flight Hours 44797 hours 49 minutes at time of inspection. Cycles: 34801at time of inspection.
Attended by:
David J. Willie Diffract0 Ltd. Dr. Frank Karpala Diffracto Ltd.
6.4.1 Inspections
The DAlS 250C was used on February 15th in Dock 4 of United Airlines' San Francisco Maintenance Facility.
The crown of the 8-737 was chosen as the first acquisition site for two reasons: the area was not being worked on, and we were expecting a group of interested people from United to observe a demonstration. The space on the crown would have afforded everyone a good vantage point.
Work began at Body Station 1016 and proceeded towards the radome along Stringer 4 Right to Body Station 259.5. Moving across to Stringer 4 Left, DAlS acquisition started at BS 259.5 and carried on to Body station 540. A total of 65 D SIGHT images were acquired from the crown in 45 minutes of placementlcapture time. Placementkapture time was calculated by noting the beginning and ending time stamps from the actual .BMP image files. Further calculations reveal a travel rate of 1.7 feet per minute.
DAlS operators encountered some positioning problems due to an extremely heavy coat of paint: the body station indicators (circumferentials and ribs) were particularly hard to see until they were actually viewed live by DAIS. Acquisition time-outs were extended to allow for extra positioning time, which consequently added to overall acquisition times.

While gathering data along the crown stringers, the system encountered its first (and only) hardware problem of the visit. The pendant-to-sensor cable began to short at the sensor-head connector. As more and more time was monopolized correcting for the uncooperative coupling device, the acquisition rate finally slowed to a stop. The inspection was terminated on Stringer 10 between BS 540 and 360 rightside.
6.4.2 Performance and Results
The DAlS 250C equipment performed very well overall with the exception of the failed connector. These connectors (eight connectors in all) are absolutely critical to the operation of DAlS in acquisition mode. After this field trip, alternative connection products were researched and ultimately replaced the original coupling devices.
Due to the heavy paint on the fuselage, the sensor operator was very much at the command of the pendant operator. Although the live DAlS image guided the proper placement and alignment of the sensor-head, it became clear that an additional visual guide for this situation would be a great help, for example, by indicating the location of the ribs, at some point above the sensor's footprint of the lap joint, with a small grease pencil mark before acquisition in the particular area. While this additional step has not been necessary in other field trials (on commercial aircraft), it is apparent that heavily applied paint will slow placement location and acquisition rates.
The pendant touch-screen performed very well under the "tap mode", which was set up under user preferences. Both inspectors found the tap mode to be a more accommodating technique than the "double click" mode based on time. As more time is spent operating the pendant, the finger placement and screen manipulation tasks become more effortless to execute.
While the majority of this field test was spent on the crown of the 737, the operators did gather some images along Stringer 10 above the window belt on the right side. The only problem experienced here was that the sensor head remains unbalanced with considerably more weight to the camera end. An additional handle location towards the balance point might alleviate a great deal of this balance problem.
The areas investigated on the crown of the B-737 were not expected to be areas with a high probability of finding obvious corrosion signatures, and the heavy paint presented a more difficult analysis task. Paint sag was evident at all areas on the aircraft. Inspection rate was lower than expected partly due to the problem with the failed connector.
6.5 On-Aircraft Inspections
The following figures (figures 13 to 21) show the new DAIS equipment being used at various facilities during the field trials. A few typical D SIGHT images of the aircraft surfaces are also shown at different corrosion levels (figure 15, figure 20, and figure 21).

FIGURE 13. INSPECTING B-737 CROWN
FIGURE 14. INSPECTING B-747 BELLY
FIGURE 15. SIGNATURES MODERATE CORROSION
FIGURE 16. INSPECTING UPPER WINDOW BELT

FIGURE 18. B-747 FORWARD BELLY INSPECTION
FIGURE 17. 8-747 FUSELAGE INSPECTION
FIGURE 19. UPPER WINDOW BELT INSPECTION
FIGURE 20. LOW-LEVEL CORROSION SIGNATURES
FIGURE 21. NO CORROSION SIGNATURES

7 CONCLUSIONS
Many important advances resulted from the Phase II effort. The design of a new sensor and host helped reduce the overall weight of the system and provide more reliable equipment. The software developments were also received with great enthusiasm by NDI technicians because they made the user interface to the location of the image data easier to manage.
The result of thousands of hours of accelerated corrosion testing have also helped to improve the confidence in D SIGHT technology as a means of detecting low levels of corrosion. The computer modelling is particularly significant in that additional work can begin to predict the stress levels in all types of joint configurations and to address issues of damage tolerance. For D SIGHT, a method is now available to derive signatures of corroded lap splices at different levels of pillowing. This will provide a visual standard to judge the corrosion level.
The results of the field trials remain an important basis for improvement of the equipment and techniques for inspection. A great deal is learned by performing inspections on actual aircraft to determine the problems with the design of the equipment. These field trials also indicate areas of improvement because each situation is slightly different from the last.

8 PUBLICATIONS FROM PHASE I AND PHASE II
Phase l
1. J. P. Komorowski, R. W. Gould, "D SlGHTfor Aircraft Corrosion Inspection", Report of Task 5.1, 5.2, and 5.3, LTR-ST-1943, NRCIIAR, Aug. 1993
2. S. Krishnakumar, J. P. Komorowski, I. Sproule, "Chemical Characterization of Corrosion Products in Fuselage Lap Joints", LTR-ST-1952, NRCIIAR, Nov. 1993
3. J. P. Komorowski, R. W. Gould, A. Marincak, and S. Krishnakumar, "Application of D SIGHT for Corrosion Detection in Fuselage Lap and Butt Joints", LTR-ST-1960, NRCIIAR, Feb. 1994
4. F. Karpala and 0 . L. Hageniers, "Characterization of Corrosion and Development of a Breadboard Model of a D SlGHTAircraft lnspection System: Phase I", Final Report, Transport Canada Publication No. TP 11983E, Feb. 1994, and FAA Report No. DOTIFAAICT-94/56, Aug. 1994
Phase ll
F. Karpala, 0 . L. Hageniers, J. P. Komorowski, "Theory and Application of D SlGHT for Corrosion Detection", Proceedings of ASNT Spring Conference, March, 1994
0 . L. Hageniers and F. Karpala, "Aging Aircraft lnspection Using D SlGHT ", 1994 ASNT Fall Conference and Quality Testing Show, Atlanta, Georgia, Sept 19-23, 1994
N. C. Bellinger, S. Krishnakumar, J. P. Komorowski, "Modelling of Pillowing Due to Corrosion in Fuselage Lap Joints", 7th CASl Symposium on Aerospace Structures and Materials, Winnipeg, Manitoba, May, 1994 (Proceedings), also published in Canadian Aeronautics and Space Journal, Vol. 40, No. 3, Sept. 1994
J. P. Komorowski, S. Krishnakumar, R. W. Gould, N. C. Bellinger, F. Karpala, 0 . L. Hageniers, "Double Pass Retroreflection for Corrosion Detection in Aircraft Structures", AGARD 79th meeting of the Structures and Materials Panel, Specialist Meeting on: "Corrosion Detection in Aircraft Structures", AGARD CP-565, Oct. 1994, Seville, Spain Note: this paper has been accepted for publication in "Materials Evaluation"
D. J. Willie, "Applying D SIGHT Technology to Aging Aircraft Corrosion NDI", Airframe Finishing, Maintenance and Repair Conference and Exposition, Bellevue, Washington, Mar 13-16, 1994, SAE Technical Paper Series #951140
N. C. Bellinger, J. P. Komorowski, and S. Krishnakumar, "Numerical Modelling of Pillowing Due to Corrosion in Fuselage Lap Joints", LTR-ST-2005, NRCIIAR, Apr. 1995
R. W. Gould, A. Marincak, and J. P. Komorowski, "Accelerated Corrosion Testing and NDI - Report on Task 1.5", LTR-ST-2006, NRCIIAR, Apr. 1995