development of drive cycle and fuel economy for auto-lpg jeepney
TRANSCRIPT

Academic Research Presented in the 10th EASTS Conference in Taipei on September 11, 2013
DEVELOPMENT OF DRIVE CYCLE AND ASSESSMENT OF THE
PERFORMANCE OF AUTO-LPG POWERED PUBLIC UTILITY
JEEPNEYS IN MAKATI CITY, PHILIPPINES
Nirman POKHARELa, Ernesto ABAYA
b,Karl VERGEL
c, Ricardo G. Sigua
d
a, b
Graduate Student, Institute of Civil Engineering, University of the Philippines,
Diliman, Quezon City 1101 cAssociate Professor,Institute of Civil Engineering, University of the Philippines,
Diliman, Quezon City 1101 dProfessor,Institute of Civil Engineering, University of the Philippines, Diliman,
Quezon City 1101
aE-mail: [email protected]
bE-mail: [email protected]
cE-mail: [email protected]
dE-mail: [email protected]
Abstract: This study developed of drive cycle for the Auto-LPG Jeepney. Five statistical
candidate drive cycles were selected which had the least absolute value differences. Among
the five, one was selected and was found to be non-drivable due to aggressive acceleration in
some parts, thus, it had to undergo smoothening using Moving Averages Method. The final
drive cycle had the following properties: maximum speed 43.2 km/h, average speed 7.7 km/h,
maximum acceleration 0.9 m/s2, duration 1,279 second and idle time 44.6%. An on-road test
was also conducted for all the three Auto-LPG powered jeepneys in which boarding and
alighting data, passenger load factors and fuel consumption factor (full tank method) were
generated. The estimated fuel efficiency factor was 3.54 km/litre. The developed drive cycle
was tested at the U. P. Vehicle Research and Testing Laboratory to determine its drivability
and measure maximum power of the Auto-LPG jeepney used. The maximum power observed
was 51.8 KW.
Keywords: drive cycle, speed, acceleration, chassis dynamometer, Auto-LPG jeepneys,
alternative fuel
1. Introduction
Quality air is essential to maintain life on earth. Unfortunately, the quality of air we breathe
today has been deteriorating and it now poses grave threat to humans and the environment. In
Metro Manila alone, studies on air quality revealed that the major source of pollution comes
from motor vehicles. Compared with the stationary sources and area sources-, the two other
identified sources of pollution in the metropolis, pollution from vehicle emissions has been
increasing more rapidly, and causes more prevalent and adverse effects to public health,
particularly on the young and the elderly. The problem of air pollution is exacerbated by global
warming. For its part, the Philippine government has enacted several laws, notably, Republic
Act 9367 (Biofuels Acts of 2006) and Republic Act 8749 (Clean Air Act of 1999) to respond to
the need to explore cleaner and alternative fuels. In addition, it is continually looking for ways

to upgrade fuel quality to approximate international standards. According to the
Department of Energy (DOE), alternative fuels are fuels that are not composed substantially of
petroleum and therefore, are alternatives to petroleum. As a substitute to this “traditional” fuel,
it is expected to yield significant energy security and environmental benefits to its users. The
government has put priority on four alternative fuels with potential use in the transport sector
namely, (1) Compressed Natural Gas (CNG), (2) Liquefied Petroleum Gas (LPG), (3)
Bio-Ethanol and (4) Biodiesel.
1.1 Significance of the Study
With the increasing demands for a cleaner and healthier environment and for the need to
address air pollution caused by emissions from the transport sector, there is a growing need to
conduct studies on the various options that can contribute in mitigating these emissions. In
addition, the jeepney drivers and operators as well as the commuting public have also
suffered from the uncontrolled escalation of fuel prices. With the twin effects of gas
emissions and fuel prices on the people and environment, studies on alternative fuels have
become more urgent.
So far, drive cycles for Auto-LPG taxis and for diesel jeepneys and gasoline tricycles
have been developed. This study on Auto-LPG powered in jeepney is a contribution to further
understand the Auto-LPG jeepney operation. With a more methodical study on the Auto-LPG
in jeepneys through the use of various data gathering methods as applied to on-road tests and
laboratory research settings, and involving jeepney drivers and operators/owners, as well as
the community public at large, data and insights on the Auto-LPG industry as applied to
jeepneys will be established. The study can provide a pool of data to be used in further
studies such as power and emissions as measured in a chassis testing laboratory.
Furthermore, the data can also be used in economic studies relating to sustainable transport
systems and impacts on climate change.
1.2 Conceptual Design
There are four main areas of inquiry of the study, namely, development of drive cycle,
chassis dynamometer test, fuel efficiency and economy. From these areas of inquiry, data
were generated -- such as on speed profile using GPS. Fuel consumption was recorded daily
using “full tank method”. Developed candidate drive cycles were tested at the chassis
dynamometer laboratory to determine their driveability. From these, the final drive cycle
was selected.
2. Review of Related Literature
A study on initiated performance testing of vehicles using chassis dynamometer in the
Philippines was conducted by Ricardo G. Sigua for the DOE and Department of Science and
Technology (DOST). The 1995 study simulated the urban and highway traffic conditions. The
developed drive cycles was involved the procedures: (1) collected speed traces by chase car
technique, (2) developed micro trips (small trips of at least 2 minutes in duration which had
to start and end at zero velocity) from on-board data logging, (3) generated target cycles
(actual) and candidates (synthetic) or derived cycles by combining micro trips at random, (4)
screened candidate cycles using joint probability density function and (5) selected the best

drive cycle.
Abuzo, et.al (2003) study on in-use tricycles in Metro-Manila focused on solutions to
reduce emissions from tricycles to enable them to comply with the standards. The study was
able to develop drive cycle for tricycles, quantify on-road emissions from tricycles and
evaluate the effects of various engine types like fuel-oil ratios and loads on on-road
emissions.The most representative driving cycle for the corresponding group was determined
by the smallest sum square difference (SSD) between the speed acceleration probability
distribution (SAPD) of the candidate cycle and the overall SAPD. Equations 1 shows the
formula for the SSD.
SSD = ∑ ∑ (𝑝𝑖𝑗 − 𝑞𝑖𝑗)2𝑁𝑎𝑗=1
𝑁𝑠𝑖=1 Eq. (1)
where, Ns : number of speed classes
Na : number of acceleration classes
Pij : ijth entry of the SAPD of the candidate cycles and,
Qij : ijth entry of the SAPD of the overall driving speed
profiles.
In the study on the effect of coco-methyl ester (CME) blends on fuel economy, engine
performance and idle opacity of PUJs, Thaweesak (2009) developed drive cycles by
conducting a survey on speed profiles of jeepneys running on diesel. The developed drive
cycle for diesel jeepney was then used to compare fuel consumption with different blends of
CME and neat diesel. The tests on the jeepney were conducted at the U. P. Vehicle
Research and Testing Laboratory (UP VRTL).
Diaz, et. al. (2010) developed a drive cycle model for taxicabs operating in
Metro-Manila. A Dev C++
program was developed to analyze the statistical computation of
the target and candidate cycles and probability distribution.
2.2 Review of International Studies
In the city of Pune, India, Kamble et al. (2009) developed a drive cycle by adopting
the use of micro-trips extracted from real-world data. The methodology was claimed to be
unique because the driving cycle was constructed considering five important parameters of
the time-space profile namely, the percentage acceleration, deceleration, idle, cruise, and the
average speed. The method used was designed to better capture the heterogeneous traffic
behaviors.
The Hong Kong drive cycle was developed in order to quantify vehicular emission
(Hung et al., 2007). On-road real world driving data were collected from February to
December, 2004. The combination of microtrips was taken at 135, 140 and 200 seconds for
highway, urban and sub-urban drive cycles respectively. A candidate cycle was selected only
if it was less than 5% absolute percentage difference to target statistics.
A study “Development of Automobile Bangkok Driving Cycle for Emissions and
Fuel Consumption Assessment” by Tamsanya et al. (2006) which aimed to develop a realistic
driving cycle for Bangkok traffic.The methodologies adopted in development of BDC were:

Random selection of microtrips with simulated computer program
Series of microtrips connected targeting 1200 seconds
Equal idle periods were inserted in-between these series of microtrips a driving cycle
is formed
Numerous candidate cycles were generated
One cycle was chosen as Bangkok Driving Cycle (BDC) closer to target statistics.
3. Methodology
Basically, there were five main methodologies used, namely: on-road tests drive
cycle development using GPS, boarding and alighting survey, fuel consumption survey and
socio-economic survey of operators through key informant interview. Fig.1 shows the
procedures that were followed in gathering and processing the data generated using the
various methodologies cited.
Fig. 1 Flowchart of the Procedures Adopted for the Development of Drive Cycles and Fuel
Economy
3.1 On-Road Tests
The on-road test observed the passenger occupancy in between stops of the public transport
route served by the Auto-LPG jeepney. Counts of passenger boarding and alighting were
recorded to determine passenger load factor in peak hours and off-peak hours. The generated
data were also used to compute for operating cost and actual revenue per day of the
Auto-LPG jeepney drivers. The tests were equipped with handheld GPS devices that recorded
tracks at 1-second interval for the development of drive cycle.
On-Road Survey
GPS DEVICES
Tracking Data
( set at 1 second interval )
Passenger Boarding
& Alighting Survey
Data Logging
Software
(1) Mapsource
(2) MS Excel
(3) MS
Notepad
Generation
Target Cycle
Generation of
Candidate
Cycles
Fuel Consumption
Survey
Passenger Load
Factor Estimation
Selection
of Drive
Cycles
Smoothening
of Drive
Cycle
Testing of Drive
Cycle (Chassis
Dynamometer)
Dev C++
Program (Alvin,
2010)

The five-days on-road test was conducted for one month on weekdays (Monday to
Thursday) and weekend (Saturday) from January 22, 2012 to January 30, 2012. Sixteen stops
were identified based on importance of the intersections, business area and market places.
These stops were indicated on the map on Figure 2.A separate 6 days on-road test was
conducted to determine the fuel consumption for Auto-LPG jeepneys in the study route
The study route, Pasong Tamo (now called Don Chino Roces Avenue) is a north-south
connecting a major highway, the EDSA and other arterial roads like Pasay Road, Gil Puyat
Avenue and J. P. Rizal Avenue in Makati City, Metro Manila. EDSA was also the target of
southbound passengers from PRC going to Mantrade where the MRT Line 3 Magallanes
Station is located. The land use pattern in the study site comprised the Central Business
District (CBD) on the eastern side and partially residential urban areas on the western and
northern sides. Along the study routes, there are several supermarkets and few schools.There
are no public utility buses and other large vehicles plying the study route. Private cars are also
predominant type of vehicles but the PUJs are the major public transport mode.
Fig.2 The Study Route (Mantrade – PRC) and Vicinity and 3 Sample Auto-LPG PUJs
The National Center for Transportation Studies (NCTS) of the University of the
Philippines requested for permission from the LigangTransportasyon at Operators saPilipinas
(LTOP), the group of Auto-LPG-powered jeepney operators of these PUJs. In agreeing to
cooperate in the study, the LTOP allowed the on-board survey in three of its Auto-LPG

jeepneys which have been plying the route from Mantrade to the Philippine Racing Club
(PRC) also Pasong Tamo since 2009.
The specification of sample vehicles is given in Table 1 below.
Table 1 Specifications of Sample Vehicles, Date and Duration of and Summary of
Speed-Time Traces Collected from GPS Devices
3.2 Drive Cycle Development
There are two ways of developing a driving cycle. One is composed from various
driving modes of constant acceleration, deceleration and speed (like the NEDC and
Economic Commission for Europe (ECE), and is referred as modal or polygonal. However,
these widely used driving cycles like NEDC bring considerable uncertainties when the
emission estimation is carried out for a specific city or region. The other type is derived from
actual driving data and is referred as “real world” cycle. Examples of such cycles are the
FTP-75, BDC and the HDC. These “real world” cycles more dynamic driving in real world
conditions result in higher emissions compared to those under the standard emission modal
test cycles (Tzirakis et al., 2006).
This study adopted the definition of “real world” in developing the driving cycle for
Auto-LPG powered jeepneys.The driving cycle of the Auto-LPG jeepney was constructed
considering three important parameters i.e. speed-time trace, idle time and the maximum
speed observed during on-road survey through GPS. The steps involved are:
1. Collection of speed time trace
2. Cleaning and processing of speed data
3. Selection of microtrips
4. Generation of target cycle
5. Generation of candidate cycles

3.2.1 Collection of Speed-Time Trace
The data were collected from three samples Auto-LPG powered PUJs plying along the
study route, from Mantrade (Magallanes, Edsa) to Philippine Race Club (PRC) along Pasong
Tamo in Makati City. Table 1 shows a sample summary of data collected.The speed time
traces were collected from two models of Garmin GPS devices set at 1-second intervals to
generate the target cycles. The GPS devices are Oregon®450 and GPSMAP76CSx.
3.2.2 Cleaning and Processing of Speed Data
The software “Mapsource” product of Garmin Limited especially made for the
Garmin GPS was used to download and export the speed data in spread sheet (Microsoft
Excel). The data generated are the tracking of vehicle speed at one-second intervals that
coincided with the on-road test runs.Since the maximum speed during on-road test was not
noticed more than 60 km/h, the speed data above 60 km/h were removed from the list to
make the analysis of the results more realistic.
3.2.3 Generation of Target Cycle
The target cycle is a series of microtrips embodied as a single speed data in every
second interval. Before the target cycle was run in the program, it was converted in text
format of MS Notepad from MS Excel so that the program could run and suggest the output
as a “Candidate Drive Cycles” among several lowest frequency distribution percentage
differences.
3.2.4 Generation of Candidate Drive Cycles
The target drive cycle data was run in the Dev C++
program by selecting the minimum
absolute percentage difference in several trials. Five candidate drive cycles were selected
among 20 trials in lowest absolute percentage difference Basically, the criteria used for the
selection of candidate cycle were the following, according to priority:
1. Lowest absolute percentage difference
2. Maximum speed compared to real speed data
3. Percentage of idle time (total zero speed)
4. Driving patterns
3.2.5 Smoothening of Statistical Data of the Drive Cycle
Smoothening of drive cycle is the process of tapering the speed profile within the
criteria limit so that the cycle will not lose its characteristics. The Moving Average Method
(Roberson, 2012) was chosen to be smooth the statistical speed data.
The theory behind this method is expressed in the following formula Eq. 2.
Mav(ti) = Eq. (2)
Where,
W(ti) = waveform is any time-varying or spatial-varying series of related data
n = window width
n
11
itn
1)W(
4. Results and Discussion
4.1 Drive Cycle Development for Auto-LPG Jeepney
Test runs on weekendscould not represent the characteristics of real world data.
Nonetheless, the test runs were taken randomly in order to compare with the off-peak runs on
weekdays. Idle time of was measured 44.5% in the target cycle. The idle time showed the
actual delays due to stopping at intersections, waiting for passengers and traffic congestion.
As such, the data were gathered during three weekdays (Monday, Tuesday and Thursday).
The traffic characteristics in these days were considered to represent the real world data for
the development of the drive cycles.
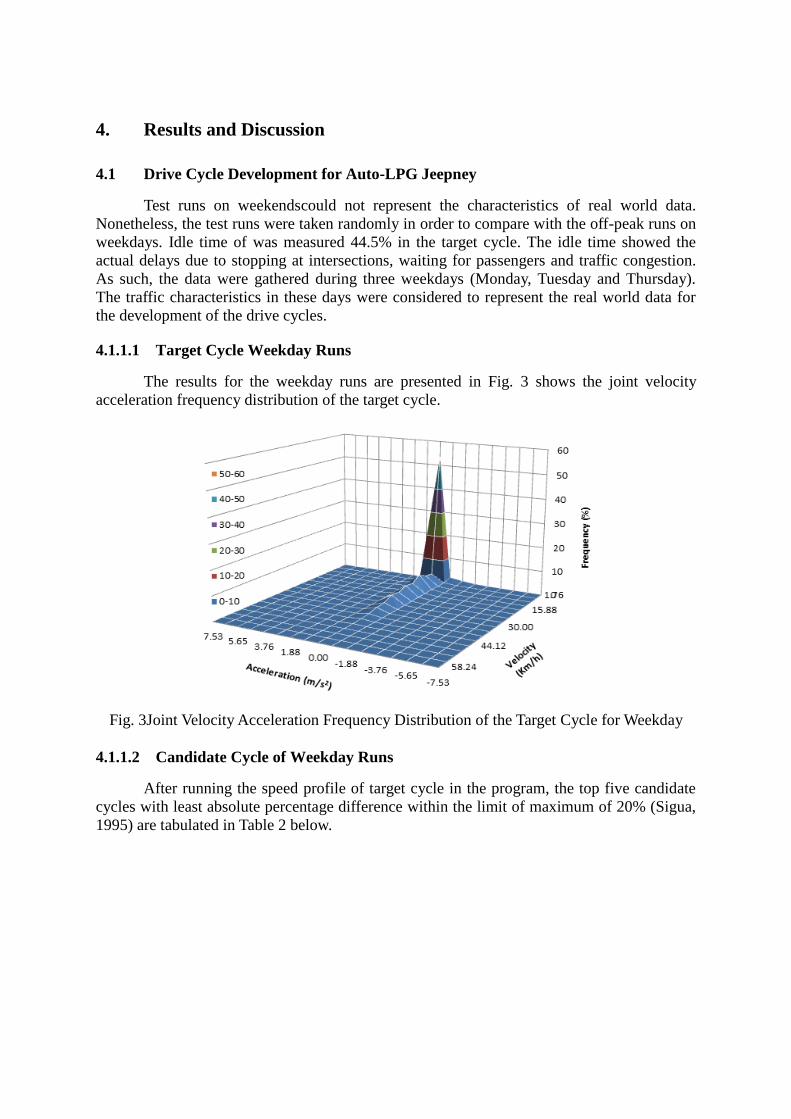
4.1.1.1 Target Cycle Weekday Runs
The results for the weekday runs are presented in Fig. 3 shows the joint velocity
acceleration frequency distribution of the target cycle.
Fig. 3Joint Velocity Acceleration Frequency Distribution of the Target Cycle for Weekday
4.1.1.2 Candidate Cycle of Weekday Runs
After running the speed profile of target cycle in the program, the top five candidate
cycles with least absolute percentage difference within the limit of maximum of 20% (Sigua,
1995) are tabulated in Table 2 below.

Table 2 Comparison of Properties of the Top Five Candidate Cycles with Target Cycles for
Weekday Runs
Candidate Cycles (1) (2) (3) (4) (5) Target
absolute percent diff. (%) 6.05 6.12 6.17 6.45 6.55 NA
max. velocity (km/h) 55 46 39 55 38 59
max. acceleration (m/s2) 5.69 4.44 4.86 5.69 4.44 7.78
avg. velocity (km/h) 7.89 7.71 7.7 7.75 7.84 7.89
avg. acceleration (m/s2) 0 0 0 0 0 0
min. velocity (km/h) 0 0 0 0 0 0
min. acceleration (m/s2) -4.17 -3.96 -4.03 -4.17 -3.33 -7.78
class intervals 17 17 17 17 17 17
class width (velocity) 3.52 3.53 3.53 3.53 3.53 3.53
class width (acceleration) 0.94 0.94 0.94 0.94 0.94 .94
distance (km) 2.793 2.75 2.666 2.495 2.126 NA
duration (Second) 1274 1284 1246 1086 1136 NA
idle time (%) 53.61 54.75 54.25 54.76 58.54 53.83 *Due to congestion, the idle time was found to be 9.3% higher than during the weekends
Since the difference in absolute percentage is less than 1%, the distribution of all the
candidate cycles with respect to the target cycle is almost the same.
4.1.2 Comparative Analysis of Target Cycles of Weekend and Weekday Runs
Fig. 4.13 Comparison of Weekday and Weekend Target Cycles
Fig. 4 Comparison of Weekday and Weekend Target Cycles
Data on the target cycle were the actual data collected from the on-road test and
hence represented the actual speed, idle time and average speed recorded. As the results
obtained from the both target cycles of the weekday and weekend runs were different in
traffic characteristics, there were significant differences in properties (Fig. 4). The shares of
idle time are 53.83% and 44.5% on weekdays and weekends, respectively. The average

velocity on weekdays was 7.89 km/h and 11.43 km/h on weekends. The higher idle time and
lower average velocity on weekdays can be attributed to traffic congestion.
4.1.3 Comparison of Candidate Cycles with Local Drive Cycles
Because of similarity, DC 251 (Thaweesak, 2009) for diesel-powered jeepney was
used in this study in comparing selected candidate cycles. The result of this comparison is
summarized in Table 3 below. As shown, the idle time of Auto-LPG was twice that of the DC
251. DC 251 was 83 seconds longer in duration and 1,271 meter longer by distance. On the
other hand, the average speed was more or less the same, that is, 46 km/h.
Table 3 Comparison of Selected Candidate Cycles with Diesel Jeepney Drive Cycle
Parameters Drive Cycle
Auto-LPG Diesel (DC 251)
Absolute percentage difference (%) 6.12 17.78
Max. velocity (km/h) 46 45.8
Max. acceleration (m/s2) 4.44 1.972
Avg. velocity (km/h) 7.71 10.59
Avg. acceleration: (m/s2) 0 0
Min. velocity (km/h) 0 0
Min. acceleration (m/s2) -3.96 -2.667
Duration (in Second) 1284 1367
Distance (in meter) 2750 4021
Idle Time (%) 54.75 27.72
Vehicle Weight Jeepney Jeepney
4.2 Chassis Dynamometer Test of Auto-LPG Powered Jeepney
Chassis dynamometer test is a reliable tool to analyse the power of vehicles, fuel efficiency
and emission. It helps to measure the fuel efficiency of the particular vehicles while running a
vehicle on a drive cycle on a chassis dynamometer. Although emission levels would depend
upon the speed of vehicle, it is also standardized by driving the vehicle on a drive cycle on
the dynamometer.
Since the dedicated drive cycle for Auto-LPG jeepney was developed to run on the
chassis dynamometer, the test was scheduled and performed at the University of the
Philippines Mechanical Vehicle Research and Testing Laboratory (VRTL), Department of
Mechanical Engineering, UP Diliman on February 21, 2013.
4.2.1 Testing of Drivability of New Drive Cycle
The statistical speed data of selected candidate cycle (as shown in Fig. 5) having absolute
percentage difference of 6.12% for weekday runs was employed for the chassis dynamometer
tests. The study made three runs for simulated 18-passenger capacity and three runs for
simulated 23-passenger capacity.

Fig. 5 Selected Candidate Cycle of Auto-LPG Jeepney for Chassis Dynamometer Test
While the chassis dynamometer was started to follow the drive cycle patterns, some locations
of speed profile especially at the 315 second and 1054 second were found not to be drivable
due to aggressive acceleration to achieve the speed from 0 to 32 km/h in 1 second (Fig. 6).
The statistical speed was found to be difficulty to drive during the testing. However, the
driving was still able to run within the upper and lower boundary limit of Chassis
Dynamometer (AVL) as it was set.
As it was practiced, UP VRTL had set the system with allowance limit ±2 seconds
and ±1.5 km/h in time and speed, respectively. Due to the aggressive acceleration, the drive
cycle was smoothened using “Moving Average Method”.
4.2.1.1 Smoothening of Statistical Drive Cycle
Applying Eq. 3(Robertson, 2010) with appropriate window width n, three trials were made
with the boundary limit of the chassis dynamometer of ±1.5 km/h for speed and ±2 sec for
time.
In order to determine an appropriate window width n, trials of smoothened cycles were
computed in odd numbers e.g., 3, 5 and 7 as shown in Table 4. The three smoothened cycles
were compared with in the default driving envelope of chassis dynamometer.
Table 4 Comparison of Properties of Smoothened Drive Cycle with Selected Statistical
Candidate Drive Cycle and Target Drive Cycle
0
10
20
30
40
50
60
1 101 201 301 401 501 601 701 801 901 1001 1101 1201
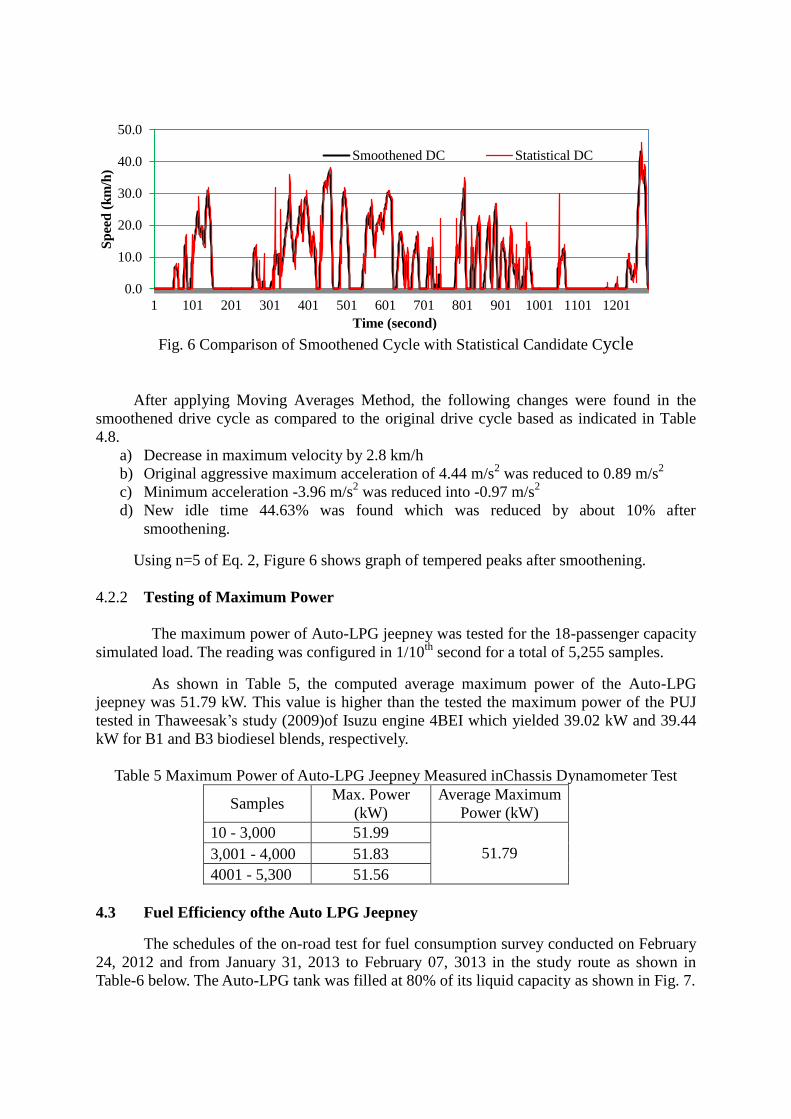
Fig. 6 Comparison of Smoothened Cycle with Statistical Candidate Cycle
After applying Moving Averages Method, the following changes were found in the
smoothened drive cycle as compared to the original drive cycle based as indicated in Table
4.8.
a) Decrease in maximum velocity by 2.8 km/h
b) Original aggressive maximum acceleration of 4.44 m/s2 was reduced to 0.89 m/s
2
c) Minimum acceleration -3.96 m/s2 was reduced into -0.97 m/s
2
d) New idle time 44.63% was found which was reduced by about 10% after
smoothening.
Using n=5 of Eq. 2, Figure 6 shows graph of tempered peaks after smoothening.
4.2.2 Testing of Maximum Power
The maximum power of Auto-LPG jeepney was tested for the 18-passenger capacity
simulated load. The reading was configured in 1/10th
second for a total of 5,255 samples.
As shown in Table 5, the computed average maximum power of the Auto-LPG
jeepney was 51.79 kW. This value is higher than the tested the maximum power of the PUJ
tested in Thaweesak’s study (2009)of Isuzu engine 4BEI which yielded 39.02 kW and 39.44
kW for B1 and B3 biodiesel blends, respectively.
Table 5 Maximum Power of Auto-LPG Jeepney Measured inChassis Dynamometer Test
Samples Max. Power
(kW)
Average Maximum
Power (kW)
10 - 3,000 51.99
51.79 3,001 - 4,000 51.83
4001 - 5,300 51.56
4.3 Fuel Efficiency ofthe Auto LPG Jeepney
The schedules of the on-road test for fuel consumption survey conducted on February
24, 2012 and from January 31, 2013 to February 07, 3013 in the study route as shown in
Table-6 below. The Auto-LPG tank was filled at 80% of its liquid capacity as shown in Fig. 7.
0.0
10.0
20.0
30.0
40.0
50.0
1 101 201 301 401 501 601 701 801 901 1001 1101 1201
Sp
eed
(k
m/h
)
Time (second)
Smoothened DC Statistical DC

Fig. 7 Filling Up of Auto-LPG Tank at 80% of its Liquid CapacityDuring On-Road Test
4.3.1 Fuel Efficiency of Auto-LPG Public Utility Jeepneys
Measured on-road fuel consumption was summarizedas shown in Table-6.
Table-6Summary of On-Road Fuel Consumption Survey of Auto-LPG Jeepneys
Tes
t
No.
Date of
Survey
Sample
Vehicle
Whole Day
Auto-LPG
Consumption
Total Travelled
Distance Fuel Efficiency
Plate No. litre km km/litre
A B C D E F= E / D
1 2/24/2012 TWF 418 21.84 59.02 2.70
2 1/31/2013 TXT 985 20.26 83.86 4.14
3 2/1/2013 TXT 985 20.32 84.26 4.15
4 2/4/2013 TWF 418 28.98 87.34 3.01
5 2/5/2013 TWF 418 26.60 87.34 3.28
6 2/7/2013 TXT 985 19.95 79.40 3.98
Average Fuel Efficiency of Auto-LPG Jeepney 3.54
4.3.2 Fuel Economy of Auto-LPG Operation
Fuel economy is directly related to the cost of the operation of utility service, the
prevailing price of the fuel, maintenance cost, and other administrative costs. Based on
government data from 2011 to 2013 there were fluctuations in the prices of Auto-LPG,
especially during the period from February 2012 to February 2013 when the on-road tests
took place. The cost of fuel starting 2012 was significantly higher.The analysis of fuel
economy in this study is limited to the fuel price and fuel efficiency.
The formula applied in computing for fuel economy is shown in Eq.3. It is expressed
in cost per kilometer.

unit price of fuel
Fuel Economy = ------------------------ in Pesos/km Eq. (3)
fuel efficiency
Table 7 shows the computed fuel economy of PUJ operations according to the type of
fuels. The price of Auto-LPG fuel was based on actual purchase in February 2013. Figure 8
shows the increments in fuel prices from year 2009 to 2012.
Table 7 Recent Fuel Economy in Public Utility Jeepneys by Fuel Type
Fuel Type
Fuel
Efficiency
(km/li)
Price of
Fuel
(Peso/li)
Fuel
Economy
(Peso/Km)
Remarks
Auto-LPG
(On-road Test) 3.54 30.25 8.55
Actual Purchased Rate,
Feb. 3013
Diesel 5.54 41.45 7.48 DOE, March 2012
Biodiesel (B2) 5.63 44.00 7.82 Manila Bulletin, Nov.
2012
Fig. 8Increments in Fuel Prices from 2009 to 2012 by Fuel Type
(Percentage of Average Annual Increment) [Source: Oil Monitor, DOE]
4.4 Service Utility of Auto-LPG Jeepney in Pasong Tamo
The observed service utility of Auto-LPG jeepneys in the study route was analyzed from the
boarding and alighting data. The service utility was computed and expressed in
passenger-kilometre for each day as shown in Figure9.
3.7%
3.2%
1.7%
0.0% 0.5% 1.0% 1.5% 2.0% 2.5% 3.0% 3.5% 4.0%
Gasoline
Diesel
Auto-LPG

Fig. 9 Daily Service Utility of Auto-LPG Jeepneys
During weekends, the average utility service of Auto-LPG jeepneys was a minimum
of 187 passenger-kilometers in the northbound direction and a maximum of 362
passenger-kilometers in the southbound direction. On weekdays, the average utility service
varied from 260 to 284 passenger-kilometers in both directions.
5. Conclusions
The drive cycle for the Auto-LPG jeepney (DC ALPG-1) is developed. The parameters of the
smoothened, the statistical candidate drive cycle and target cycle are shown in the Table 8
below.
Table 8Parameters of DC ALPG-1 (Smoothened Drive Cycle), Statistical Drive Cycle and
Target Cycle
Parameters DC ALPG-1 Statistical
Candidate Cycle Target Cycle
Absolute % difference 44.75 6.12 N/A
Max. velocity (km/h) 43.2 46 59
Max. acceleration (m/s2) 0.89 4.44 7.78
Avg. velocity (km/h) 7.71 7.71 7.89
Avg. acceleration (m/s2) 0 0 0
Min. velocity: (m/s2) 0 0 0
Min. acceleration (m/s2) -0.97 -3.96 -7.78
Idle Time (%) 44.63 54.75 53.83
The plot of smoothened drive cycle is shown in Figure 10.
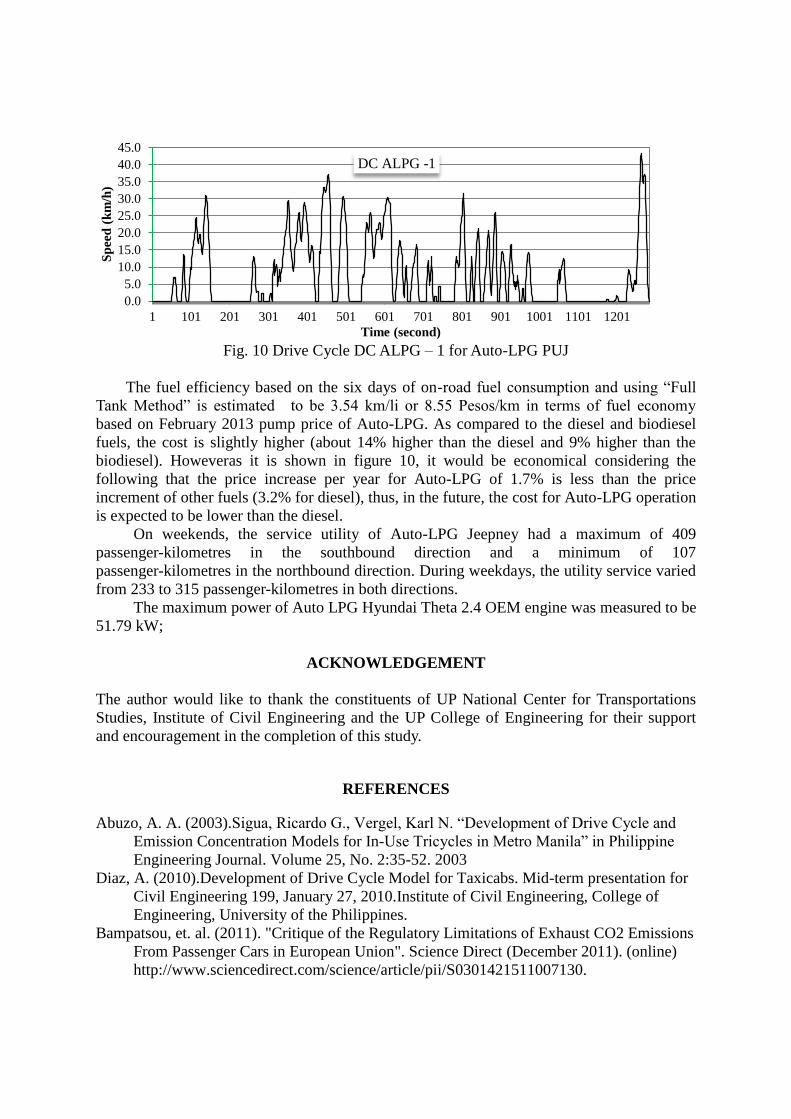
Fig. 10 Drive Cycle DC ALPG – 1 for Auto-LPG PUJ
The fuel efficiency based on the six days of on-road fuel consumption and using “Full
Tank Method” is estimated to be 3.54 km/li or 8.55 Pesos/km in terms of fuel economy
based on February 2013 pump price of Auto-LPG. As compared to the diesel and biodiesel
fuels, the cost is slightly higher (about 14% higher than the diesel and 9% higher than the
biodiesel). Howeveras it is shown in figure 10, it would be economical considering the
following that the price increase per year for Auto-LPG of 1.7% is less than the price
increment of other fuels (3.2% for diesel), thus, in the future, the cost for Auto-LPG operation
is expected to be lower than the diesel.
On weekends, the service utility of Auto-LPG Jeepney had a maximum of 409
passenger-kilometres in the southbound direction and a minimum of 107
passenger-kilometres in the northbound direction. During weekdays, the utility service varied
from 233 to 315 passenger-kilometres in both directions.
The maximum power of Auto LPG Hyundai Theta 2.4 OEM engine was measured to be
51.79 kW;
ACKNOWLEDGEMENT
The author would like to thank the constituents of UP National Center for Transportations
Studies, Institute of Civil Engineering and the UP College of Engineering for their support
and encouragement in the completion of this study.
REFERENCES
Abuzo, A. A. (2003).Sigua, Ricardo G., Vergel, Karl N. “Development of Drive Cycle and
Emission Concentration Models for In-Use Tricycles in Metro Manila” in Philippine
Engineering Journal. Volume 25, No. 2:35-52. 2003
Diaz, A. (2010).Development of Drive Cycle Model for Taxicabs. Mid-term presentation for
Civil Engineering 199, January 27, 2010.Institute of Civil Engineering, College of
Engineering, University of the Philippines.
Bampatsou, et. al. (2011). "Critique of the Regulatory Limitations of Exhaust CO2 Emissions
From Passenger Cars in European Union". Science Direct (December 2011). (online)
http://www.sciencedirect.com/science/article/pii/S0301421511007130.
0.0
5.0
10.0
15.0
20.0
25.0
30.0
35.0
40.0
45.0
1 101 201 301 401 501 601 701 801 901 1001 1101 1201
Sp
eed
(k
m/h
)
Time (second)
DC ALPG -1

Barlows, et. al. (2009), I.S.A Reference Book of Driving Cycles for Use in the Measurement
of Road Vehicle Emissions (Published Project Report). United Kingdom: TRL Limited
and Department for transport, Cleaner Fuels and Vehicles. June, 2009.
BRCGB. “LPG Around the World”. http://brcgb.co.uk/about-lpg/lpg-around-the-world
(4 April 2013).
Department of Transportation and Communication.“Financing Sustainable Transport
System”.Ministerial Conference on Global Environment and Energy in Transport
(MEET) Follow-Up Meeting, Hokkaido, Japan. June 17-18, 2009.
Fabian, H. et. al. (2009).CO2 Emissions from the Land Transport Sector in the Philippines:
Estimates and Policy Implications. Proceedings of the 17th Annual Conference of the
Transportation Science Society of the Philippines. 2009.
Gas Production and Supply Division, Electrical and Mechanical Services Department. “LPG
Vehicle Initiatives in Hong Kong”, in Works Digest Issue No. 53 (2003), pp 1-3.
Hung, W.T., et al. (2007). Development of a Practical Driving Cycle Construction
Methodology: A Case Study in Hong Kong in Transportation Research Part D (2007):
115-128. (available online at www.sciencedirect.com and www.
Elsevier.com/locate/trd. (November 2012).
Indian Auto LPG Coalition. “Auto LPG in India” (online).
http://www.iac.org.in/auto-lpg-in-india (4 April 2013).
Kamble, et. al. (2009) “Development of Real-world Driving Cycle: Case Study of Pune.
India”. India: Central Institute of Road transport- IIT Bombay. 2009. 109 “Liquefied
Petroleum Gas”. (online)
Resurreccion, Lyn., Science Editor. “Now It’s LPG for jeepneys”. BusinessMirror.com.ph.
23 April 2011.http://www.pinoyprogress.com/showthread.php?p=18122. (March,
2013).
Robertson, D. Gordon E. Data Smoothing. Canada: University of Ottawa. (online) www.
health.ottawa.ca/biomech/courses/apa6903/Data%20smoothing.ppt (November 2012).
Sigua, R.G. (1995). Initiated Performance Testing of Vehicles Using Chassis Dynamometer
in the Philippines (a 1995 Study Report for Department of Energy and Department of
Science and Technology). 110
Subida, R. et.al. (2005). Integrated Environmental Strategies: Philippine Project Report
(Focus on the Transportation Sector). December, 2005.
Sukanya, T. et. al.(2006).Development of Automobile Bangkok Driving Cycle for Emissions
and Fuel Consumption Assessment.The Second Joint International Cofnerence on
“Sustainable Energy and Environment (SEE 2006)”. 21-23 November 2006. Bangkok,
Thailand. 1-6.
Thaweesak, S. (2009).Effect of Coco-Methyl Ester (CME) Blends on Fuel Economy, Engine
Performance and Idle Opacity of Public Utility Jeepneys.A thesis presentation in partial
fulfillment of the requirements of the University of the Philippines for the Degree of
M.S. Environmental Engineering.