development of environmental indicators in unep
TRANSCRIPT

8/3/2019 Development of Environmental Indicators in UNEP
http://slidepdf.com/reader/full/development-of-environmental-indicators-in-unep 1/17
Development of environmental indicators in UNEP
M. Schomaker, Division of Environment Information and Assessment, U nited Nations Environment Programme ( U NEP), Nairobi, Kenya
This presentation will go slightly beyond the issue of indicators and consider the entire arrayof information and data collection, management, and analysis, since they are all relevant toindicators for assessing and reporting on sustainable development. First the United NationsEnvironment Programme (UNEP) setting will be outlined, then a number of indicator-relatedissues will be touched upon as part of assessment and reporting, finishing with a listing of specific UNEP work on land quality indicators.
GENERAL UNEP SETTING
It should be realized that UNEP, unlike FAO, is not an implementing agency. Its main role isin catalyzing actions, liaison and conflict resolution. UNEP tries to promote activities byproviding small financial contributions resulting in joint outputs, by jointly developingframeworks others can link up to and by providing expert advice. All its activities take placeas joint efforts with other institutions (both within and outside the UN; at international,regional and national level). UNEP's mission is broad, working mostly at global and regionallevels and covering "the environment" as a whole:
"To provide leadership and encourage partnership in caring for the environment byinspiring, informing and enabling nations and people to improve their quality of life withoutcompromising that of future generations."
Within this general context UNEP's assessment mandate is:
"To keep under review the state of the world environment (SOE); enhance understanding of the critical linkages between environment and human activities; identify priorities for international action; flag emerging issues; and strengthen national, regional, and globalinformation handling capacities."
UNEP's assessment framework for fulfilling this mandate can be illustrated in Figure 1, inwhich all groups of activities needed for integrated assessment and reporting are reflected.Often there are not enough reliable, well structured, easily accessible data available; oftenprogress made in a project or programme is based on expert opinion and educatedguesswork. Besides, there are no straightforward, internationally-agreed methodologies for integration of natural resources data with socio-economic data; for scale integration (both
spatial and temporal); and for change indicators. Assessment efforts still tend to take placeon an isolated case study or subject level. There are, among others, different schools of thought, different methodologies, different entry points, data availability and compatibilityproblems, scale problems and different ways of presenting information.
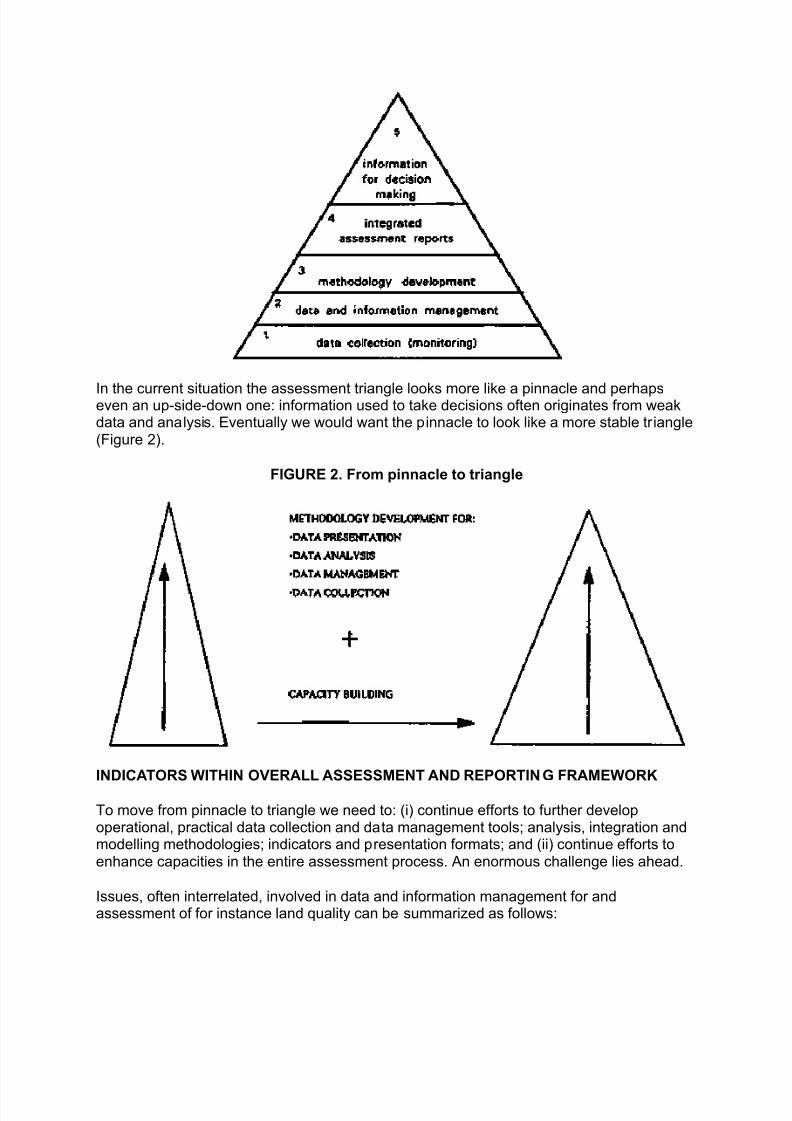
FIGURE 1. Providing the knowledge base for decision making
8/3/2019 Development of Environmental Indicators in UNEP
http://slidepdf.com/reader/full/development-of-environmental-indicators-in-unep 2/17
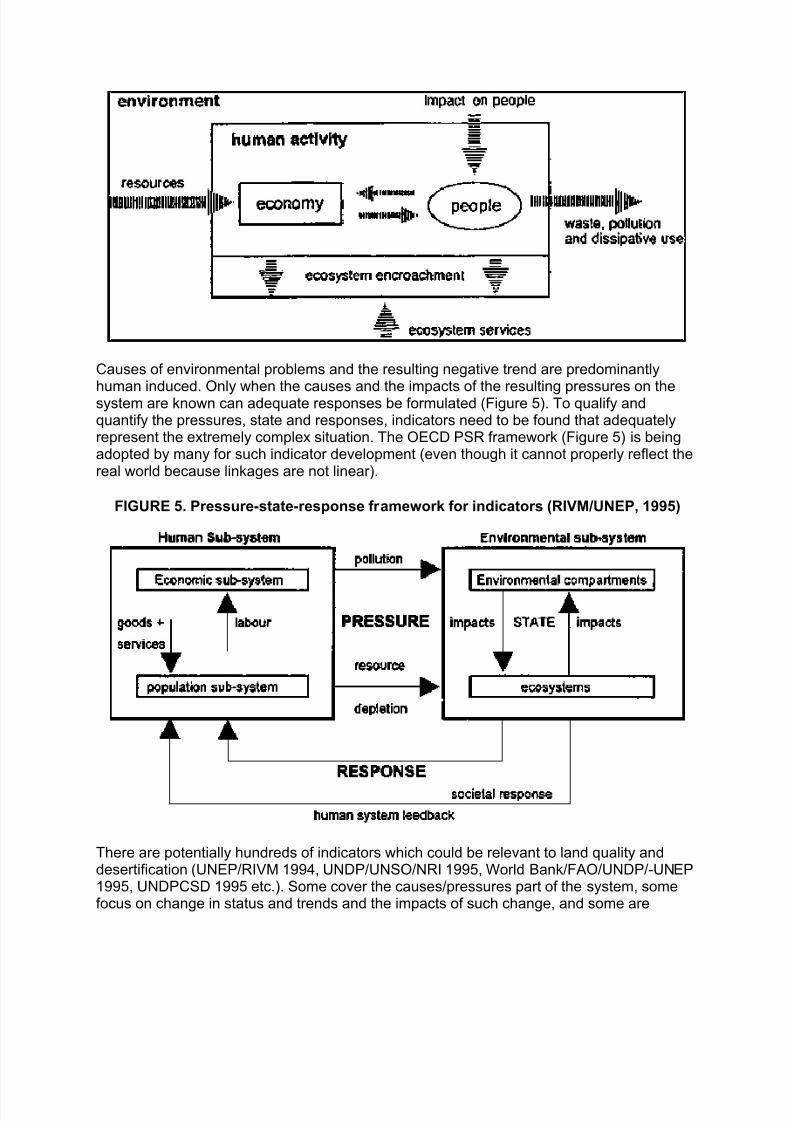
In the current situation the assessment triangle looks more like a pinnacle and perhapseven an up-side-down one: information used to take decisions often originates from weakdata and analysis. Eventually we would want the pinnacle to look like a more stable triangle(Figure 2).
FIGURE 2. From pinnacle to triangle
INDICATORS WITHIN OVERALL ASSESSMENT AND REPORTING FRAMEWORK
To move from pinnacle to triangle we need to: (i) continue efforts to further developoperational, practical data collection and data management tools; analysis, integration andmodelling methodologies; indicators and presentation formats; and (ii) continue efforts toenhance capacities in the entire assessment process. An enormous challenge lies ahead.
Issues, often interrelated, involved in data and information management for andassessment of for instance land quality can be summarized as follows:

8/3/2019 Development of Environmental Indicators in UNEP
http://slidepdf.com/reader/full/development-of-environmental-indicators-in-unep 3/17
1. user relevance;2. integration;3. scale issues;4. methodological and science issues;5. data issues;6. assessment capacity.
User relevance
Many assessment activities still take place within the realm of science. More direct links arenecessary between the actual users and producers of information. Assessment activitiesshould preferably be formulated together with users, in fact upon the request of users (for their purposes). Depending on who wants to know, different levels of detail and differentforms of information are needed. Once the "why" is clear the kind of data needed can bedecided upon. Users are often considered in the context of the decision-making cycle whichincludes four stages (Figure 3).
FIGURE 3. The decision-making cycle (adapted from Winsemius 1986, in RIVM/UNEP,1995)
Decision-making processes take place at all levels of government and involve manydifferent cultural, social, institutional, economic and environmental inputs andconsiderations. Depending on what level and which stage in the cycle, the kind of information needed differs.

8/3/2019 Development of Environmental Indicators in UNEP
http://slidepdf.com/reader/full/development-of-environmental-indicators-in-unep 4/17
For problem identification and awareness raising, general descriptive indicators are needed.But even then, different audiences need customized material; for instance to reach nationalpolicy-makers one would opt for a different presentation than for the general public.
For strategy, policy, project formulation one would need more detailed indicators, alsofocusing on the causes of a certain problem and on projections of impacts, throughmodelling, scenarios, cost-benefit and multi-criteria analysis, so that effective, and realistic,responses can be formulated.
For the actual implementation of land quality related policies, goals and targets need to beestablished at national and local level (more quantitative indicators). Here the social andeconomic context becomes increasingly important. The people living on the land will have todecide on what is needed and on how and when they want to and can reach certain targets.
Assessment and information aspects should focus on negotiation to agreement on targetsamong all the stakeholders who in various ways have interests in the land.
To evaluate the effectiveness of policies and actions, one needs to find quantitative
indicators that illustrate how the situation has changed in relation to the goals and targets.
In summary: indicators should clearly serve the specific users and stakeholders, bothconsidering the level of aggregation (from local population to high-level international policy-makers) and the stage in the decision-making cycle.
Integration
Over the past decades UNEP has been focusing on state and trends, with emphasis onenvironmental sub-systems such as climate, desertification and biodiversity. However,though it is indeed necessary to know where a problem occurs, one also needs to
know why the problem occurs in order to be able to formulate responses. There is anurgent need to focus more on the inter-linkages between the environmental system and thehuman system (Figure 4) rather than the individual components. Not only should researchand assessment activities cover both sub-systems; inter-linkages between the two are evenmore important.
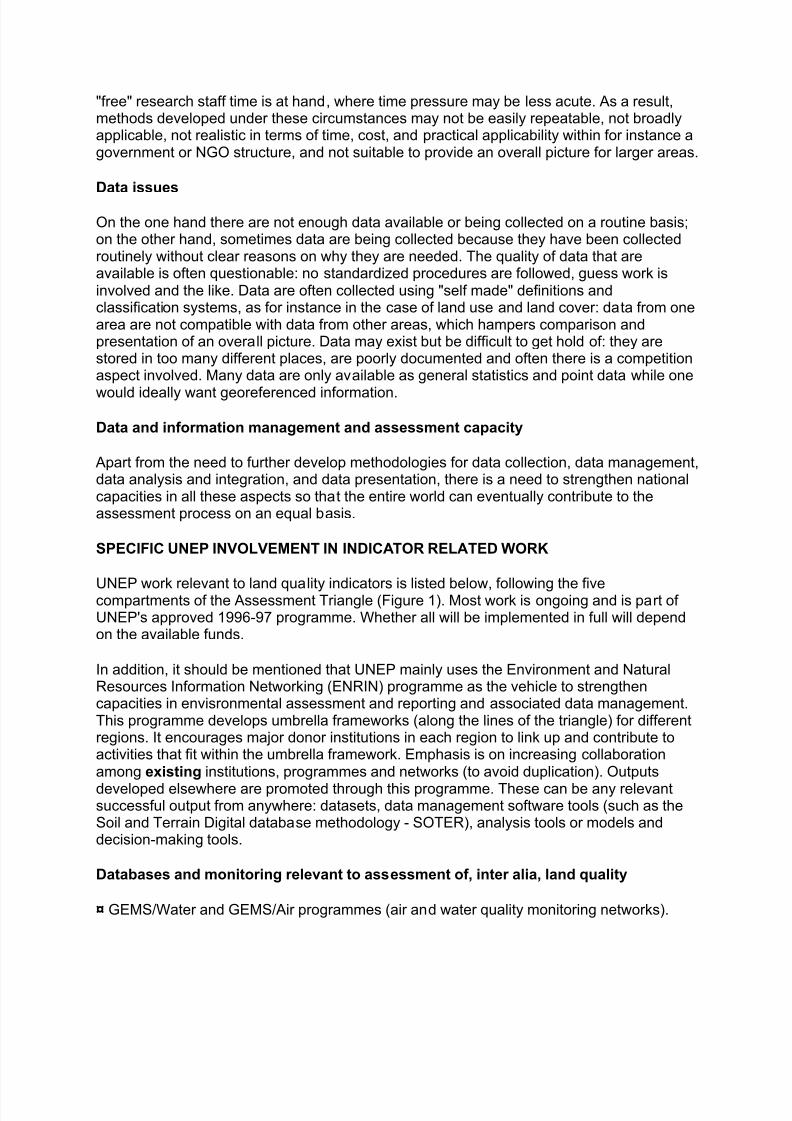
FIGURE 4. A model of human interaction with the environment (RIVM/UNEP, 1995)
8/3/2019 Development of Environmental Indicators in UNEP
http://slidepdf.com/reader/full/development-of-environmental-indicators-in-unep 5/17
Causes of environmental problems and the resulting negative trend are predominantly
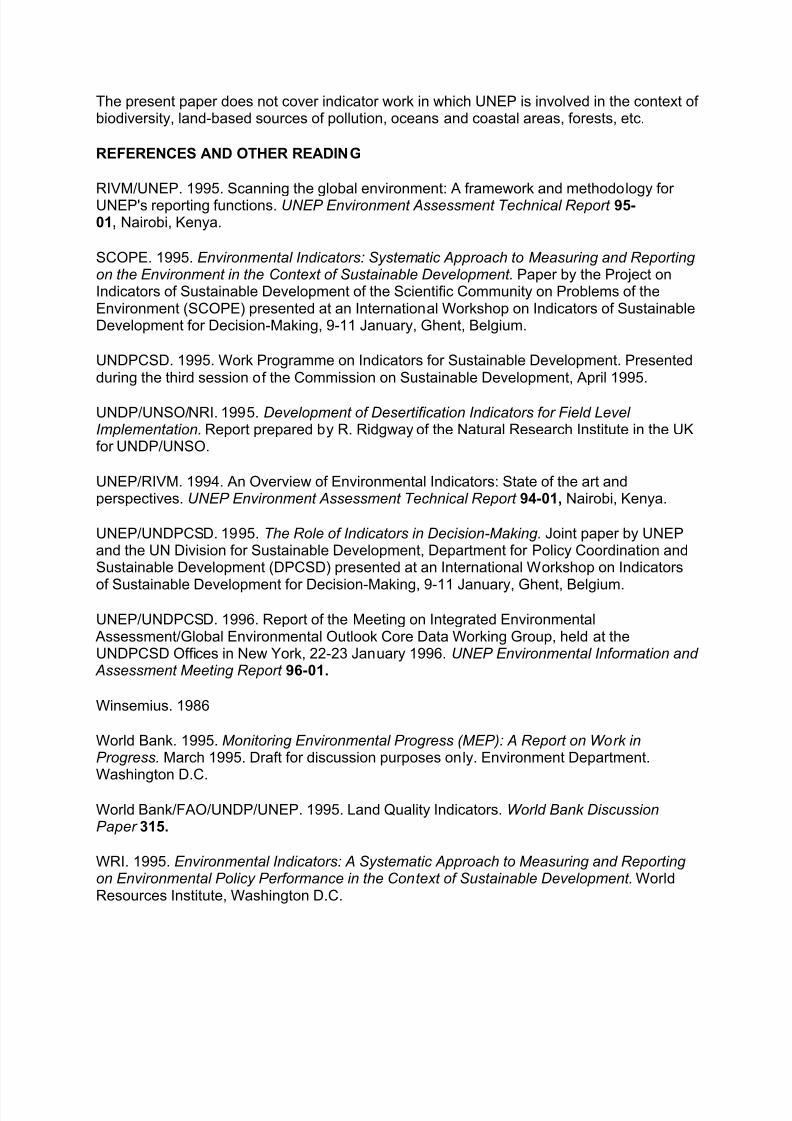
human induced. Only when the causes and the impacts of the resulting pressures on thesystem are known can adequate responses be formulated (Figure 5). To qualify andquantify the pressures, state and responses, indicators need to be found that adequatelyrepresent the extremely complex situation. The OECD PSR framework (Figure 5) is beingadopted by many for such indicator development (even though it cannot properly reflect thereal world because linkages are not linear).
FIGURE 5. Pressure-state-response framework for indicators (RIVM/UNEP, 1995)
There are potentially hundreds of indicators which could be relevant to land quality anddesertification (UNEP/RIVM 1994, UNDP/UNSO/NRI 1995, World Bank/FAO/UNDP/-UNEP1995, UNDPCSD 1995 etc.). Some cover the causes/pressures part of the system, somefocus on change in status and trends and the impacts of such change, and some are

8/3/2019 Development of Environmental Indicators in UNEP
http://slidepdf.com/reader/full/development-of-environmental-indicators-in-unep 6/17
related to responses. The challenge before us is to find those core indicators that aresufficiently representative and at the same time easy to understand and measure on aroutine basis. To put it differently, indicators should beSMART: specific, measurable, achievable, r elevant and time-bound. Indicators are neededat different aggregation levels (see also the section on user relevance).
Scale issues
Ideally some persons would want to have detailed data on "everything". We would want tobe able to move smoothly from an abundance of detailed field data to summarizedinformation for national level purposes to even more condensed information for sub-regional, regional and eventually global level purposes (the Indicator Pyramid, Figure 6).
FIGURE 6. The Information/Indicator Pyramid (SCOPE, 1995 and WRI, 1995)
For practical reasons (constraints in available time, human and financial resources) wewould want to find shortcuts. We would want to determine simple, direct links between fieldlevel data, general statistics and remotely sensed data at decreasing levels of detail(through extrapolation, spatial modelling techniques and the like). Once such relationshipsare established we would be able to monitor over time and to indicate which temporalscales are relevant for which aspects. For many of these wishes there is not yet a responseor solution.
Methodological and science issues
This very much relates to the scale issues mentioned above. Most assessment work stilltakes place on an isolated, scientific case study basis. Methods developed are very site-specific. Work is often carried out within the university realm (PhD studies and the like): anideal situation where usually more equipment is available than in the real world, where
8/3/2019 Development of Environmental Indicators in UNEP
http://slidepdf.com/reader/full/development-of-environmental-indicators-in-unep 7/17
"free" research staff time is at hand, where time pressure may be less acute. As a result,methods developed under these circumstances may not be easily repeatable, not broadlyapplicable, not realistic in terms of time, cost, and practical applicability within for instance agovernment or NGO structure, and not suitable to provide an overall picture for larger areas.
Data issues
On the one hand there are not enough data available or being collected on a routine basis;on the other hand, sometimes data are being collected because they have been collectedroutinely without clear reasons on why they are needed. The quality of data that areavailable is often questionable: no standardized procedures are followed, guess work isinvolved and the like. Data are often collected using "self made" definitions andclassification systems, as for instance in the case of land use and land cover: data from onearea are not compatible with data from other areas, which hampers comparison andpresentation of an overall picture. Data may exist but be difficult to get hold of: they arestored in too many different places, are poorly documented and often there is a competitionaspect involved. Many data are only available as general statistics and point data while one
would ideally want georeferenced information.
Data and information management and assessment capacity
Apart from the need to further develop methodologies for data collection, data management,data analysis and integration, and data presentation, there is a need to strengthen nationalcapacities in all these aspects so that the entire world can eventually contribute to theassessment process on an equal basis.
SPECIFIC UNEP INVOLVEMENT IN INDICATOR RELATED WORK
UNEP work relevant to land quality indicators is listed below, following the fivecompartments of the Assessment Triangle (Figure 1). Most work is ongoing and is part of UNEP's approved 1996-97 programme. Whether all will be implemented in full will dependon the available funds.
In addition, it should be mentioned that UNEP mainly uses the Environment and NaturalResources Information Networking (ENRIN) programme as the vehicle to strengthencapacities in envisronmental assessment and reporting and associated data management.This programme develops umbrella frameworks (along the lines of the triangle) for differentregions. It encourages major donor institutions in each region to link up and contribute toactivities that fit within the umbrella framework. Emphasis is on increasing collaborationamong existing institutions, programmes and networks (to avoid duplication). Outputs
developed elsewhere are promoted through this programme. These can be any relevantsuccessful output from anywhere: datasets, data management software tools (such as theSoil and Terrain Digital database methodology - SOTER), analysis tools or models anddecision-making tools.
Databases and monitoring relevant to assessment of, inter alia, land quality
¤ GEMS/Water and GEMS/Air programmes (air and water quality monitoring networks).

8/3/2019 Development of Environmental Indicators in UNEP
http://slidepdf.com/reader/full/development-of-environmental-indicators-in-unep 8/17
¤ The planned Global Terrestrial Observing System (GTOS), comparable and linked to thealready existing Global Oceans and Global Climate Observing Systems (GOOS andGCOS). Once operational GTOS will provide an excellent umbrella mechanism for datacollection and sharing; co-sponsors are FAO, International Council of Scientific Unions(ICSU), UNESCO, UNEP and World Meteorological Organization (WMO).
¤ Further methodological development of the GLASOD approach (in Asia); and preparationof (sub-) regional Soil and Terrain Digital databases or shells (SOTER); with ISRIC andFAO.
¤ World Overview of Conservation Approaches and Technologies (WOCAT) and UNEP'sdrylands management success stories programme; GLASOD showing the negative side(human-induced degradation) and WOCAT, supported by University of Bern, FAO, severalbilateral donors, the positive side (successful responses).
¤ Digital Elevation Model (DEM): an elevation database from which many products can bederived, a joint USGS-EROS Data Centre, UNEP, National Aeronautics and Space
Administration (NASA) product; available for Africa on the WWW; other continents to followin 1996.
¤ Land cover characterization using advanced very high resolution radiometer (AVHRR); a joint USGS-EROS Data Centre, UNEP and NASA product, using the InternationalGeosphere-Biosphere Programme (IGBP) processing protocols; Latin America first half 1996; related project implemented for a number of countries in Asia and the Pacific.
¤ Population distribution (through spatial modelling); with CGIAR and NCGIA.
¤ Core Data Working Group activities: focus on core data for integrated environment
assessments and for UNEP's new Global Environment Outlook reports (seeunder Assessment Reports below).
Data and information management (data access; meta-data; data harmonization; GIS;decision support tools; database structures; etc.)
¤ Mercure satellite system which will link UNEP's data and information sources to theInternet and World Wide Web facilities, etc. This will improve data accessibility and sharing.System currently being installed.
¤ Development of meta-data and associated information system for UNEP data andinformation and for referencing to other data in the world, all in support of assessment and
reporting activities. A sub-system for land quality indicators is under consideration (theconcepts behind such complicated information systems still need much thought andexperimentation).
¤ UNEP/FAO Initiative on Standardizing Land Cover and Land Use Classification Systems,with the Institute of Terrestrial Ecology (ITE), World Conservation Monitoring Centre(WCMC) and International Institute for Aerospace Survey and Earth Sciences (ITC); aflexible attribute-based approach (including software).

8/3/2019 Development of Environmental Indicators in UNEP
http://slidepdf.com/reader/full/development-of-environmental-indicators-in-unep 9/17
¤ International Center for Research in Agroforestry (ICRAF), International Institute for LandReclamation and Improvement (ILRI) and UNEP work on a tool for spatial characterization(a CDROM with a Data Exploration Tool).
Support of methodology development for assessment
¤ Integration of socio-economic and natural resources aspects and scale integration (casestudy based, eventually to lead to more generally applicable methodology).
¤ Indicator development (the issue that links all assessment components together):considering both the biophysical and the social dimensions; contribute to ongoing and newinitiatives such as Department for Policy Coordination and Sustainable Development(DPCSD), United Nations Sudano-Sahelian Office (UNSO), SCOPE, InternationalDevelopment Research Centre (IDRC), International Institute for Sustainable Development(IISD), World Bank, FAO, UNEP, UNDP Land Quality Indicators programme, UNEPsuccess story analysis and others. There is an urgent need to bring all these efforts on oneline.
¤ Forecasting/scenarios/modelling: in the framework of the Global Environment Outlook(GEO) process (see GEO below). For instance some modelling work on linking foodproduction and land degradation, but mainly the even more complicated integratedmodelling issues.
Assessment reports
¤ Sectoral assessments, such as: Global Water Assessment; the World Atlas of Desertification.
¤ Integrated outlooks on the global environment - GEOs: biennial and decadal; replacingUNEP's more traditional state-of-the-environment reports; involving much regionalconsultation; supported by working groups on data, scenarios, modelling, policy; productionprocess still under development; first trial issue early 1997.
¤ Technical reports, datasets, software tools, decision-making tools (e.g., indicators)resulting from the work listed above (for instance a whole range of GEMS/Water andGEMS/Air publications both covering specific assessments and methodological material inthe form of guidelines and monitoring standards; publications on social dimension issues;the References list directly indicator related publications).
Information sharing
Outputs will be produced as a family of products. The same base material will becustomized for specific target groups: brochures, popular environment library booklets,hands-on booklets, newsletters (e.g., EarthViews, Desertification Bulletin), videos,electronic information sharing, summary reports for policy and decision-makers, moreelaborated technical reports and basic data for technicians and the scientific community.
8/3/2019 Development of Environmental Indicators in UNEP
http://slidepdf.com/reader/full/development-of-environmental-indicators-in-unep 10/17
The present paper does not cover indicator work in which UNEP is involved in the context of biodiversity, land-based sources of pollution, oceans and coastal areas, forests, etc.
REFERENCES AND OTHER READING
RIVM/UNEP. 1995. Scanning the global environment: A framework and methodology for UNEP's reporting functions. U NEP Environment Assessment Technical Report 95-01, Nairobi, Kenya.
SCOPE. 1995. Environmental Indicators: Systematic Approach to Measuring and Reporting on the Environment in the Context of Sustainable Development. Paper by the Project onIndicators of Sustainable Development of the Scientific Community on Problems of theEnvironment (SCOPE) presented at an International Workshop on Indicators of SustainableDevelopment for Decision-Making, 9-11 January, Ghent, Belgium.
UNDPCSD. 1995. Work Programme on Indicators for Sustainable Development. Presentedduring the third session of the Commission on Sustainable Development, April 1995.
UNDP/UNSO/NRI. 1995. Development of Desertification Indicators for Field Level Implementation. Report prepared by R. Ridgway of the Natural Research Institute in the UKfor UNDP/UNSO.
UNEP/RIVM. 1994. An Overview of Environmental Indicators: State of the art andperspectives. U NEP Environment Assessment Technical Report 94-01, Nairobi, Kenya.
UNEP/UNDPCSD. 1995. The Role of Indicators in Decision-Making. Joint paper by UNEPand the UN Division for Sustainable Development, Department for Policy Coordination andSustainable Development (DPCSD) presented at an International Workshop on Indicators
of Sustainable Development for Decision-Making, 9-11 January, Ghent, Belgium.
UNEP/UNDPCSD. 1996. Report of the Meeting on Integrated Environmental Assessment/Global Environmental Outlook Core Data Working Group, held at theUNDPCSD Offices in New York, 22-23 January 1996. U NEP Environmental Information and
Assessment Meeting Report 96-01.
Winsemius. 1986
World Bank. 1995. Monitoring Environmental Progress (MEP): A Report on Work inProgress. March 1995. Draft for discussion purposes only. Environment Department.Washington D.C.
World Bank/FAO/UNDP/UNEP. 1995. Land Quality Indicators. World Bank DiscussionPaper 315.
WRI. 1995. Environmental Indicators: A Systematic Approach to Measuring and Reporting on Environmental Policy Performance in the Context of Sustainable Development. WorldResources Institute, Washington D.C.
8/3/2019 Development of Environmental Indicators in UNEP
http://slidepdf.com/reader/full/development-of-environmental-indicators-in-unep 11/17
Environmental indicator From Wikipedia, the free encyclopedia
Environmental indicators are simple measures that tell us what is happening in the environment. Since the
environment is very complex, indicators provide a more practical and economical way to track the state of the
environment than if we attempted to record every possible variable in the environment. For example,
concentrations of ozone depleting substances (ODS) in the atmosphere, tracked over time, is a good indicator
with respect to the environmental issue of stratospheric ozone depletion..
Kemi's Idea of Definitions and use
Environmental indicators have been defined in different ways but common themes exist.
³An environmental indicator is a numerical value that helps provide insight into the state of the environment or
human health. Indicators are developed based on quantitative measurements or statistics of environmental
condition that are tracked over time. Environmental indicators can be developed and used at a wide variety of
geographic scales, from local to regional to national levels.´ [1]
³A parameter or a value derived from parameters that describe the state of the environment and its impact on
human beings, ecosystems and materials, the pressures on the environment, the driving forces and the
responses steering that system. An indicator has gone through a selection and/or aggregation process to
enable it to steer action.´ [2]
Environmental indicator criteria and frameworks have been used to help in their selection and presentation.
It can be considered, for example, that there are major subsets of environmental indicators in-line with the
Pressure-State-Response model developed by the OECD. One subset of environmental indicators is the
collection of ecological indicators which can include physical, biological and chemical measures such as
atmospheric temperature, the concentration of ozone in the stratosphere or the number of breeding bird pairs in
an area. These are also referred to as ³state´ indicators as their focus is on the state of the environment or
conditions in the environment. A second subset is the collection of indicators that measure human activities
or anthropogenic pressures, such as greenhouse gas emissions. These are also referred to as ³pressure´
indicators. Finally, there are indicators, such as the number of people serviced by sewage treatment, which
track societal responses to environmental issues.
Environmental indicators, in turn, should be considered as a subset of sustainable development indicators
which are meant to track the overall sustainability of a society with respect to its environmental, social and
economic integrity and health.

8/3/2019 Development of Environmental Indicators in UNEP
http://slidepdf.com/reader/full/development-of-environmental-indicators-in-unep 12/17
A common framework spearheaded by the European Environment Agency [3] is the ³DPSIR´ or ³drivers,
pressures, state, impact, response´ framework. Drivers and pressures are indicators of the human activities
and resulting pressures on the environment in the form of pollution or land-use change, for example. State and
impact indicators are the resulting conditions in the environment and the implications for the health of
ecosystems and humans. The response indicators measure the reaction of human society to the environmental
issue. Criteria tend to focus on three key areas ± scientific credibility, policy/social relevance and practical
monitoring and data requirements.
An example of an environmental indicator: Trend in global temperature anomalies of the last 150 years as an indicator of
climate change
Environmental indicators are used by governments, non-government organizations, community groups and
research institutions to see if environmental objectives are being met, to communicate the state of the
environment to the general public and decision makers and as a diagnostic tool through detecting trends in the
environment.
Environmental indicators can be measured and reported at different scales. For example, a town may track air
quality along with water quality and count the number of rare species of birds to estimate the health of the
environment in their area. Indicators are developed for specific ecosystems, such as the Great-Lakes in North
America.[4] National governments use environmental indicators to show status and trends with respect
to environmental issues of importance to their citizens.[5][6]
Others have attempted to monitor and assess the
state of the planet using indicators.
[7]
8/3/2019 Development of Environmental Indicators in UNEP
http://slidepdf.com/reader/full/development-of-environmental-indicators-in-unep 13/17
Contents
[hide]
1 Audience
2 Indicator systems and communicating them
3 See also
4 Notes
5 References
6 External links
[edit] Audience
The type of indicators selected or developed should be partially based on who will be using the information
from the indicators. There are generally three possible audiences to consider, each with different information
needs. These audiences are: 1) technical experts and science advisors, 2) policy-makers, decision makers and
resource managers, and 3) general public and media.
The technical experts and scientists will be interested in detailed and complex indicators. These indicators
should have scientific validity, sensitivity, responsiveness and have data available on past conditions. The
audience that includes policy-makers and resource managers will be concerned with using indicators that are
directly related to evaluating policies and objectives. They require their indicators to be sensitive, responsive
and have historical data available like the technical audience, but they are also looking for indicators that are
cost-effective and have meaning for public awareness. Finally, the general public responds to indicators thathave clear and simple messages and are meaningful to them, such as the UV index and the air quality
index.[8][9]
[edit]Indicator systems and communicating them
Individual indicators are designed to translate complex information in a concise and easily understood manner
in order to represent a particular phenomenon (e.g. ambient air quality). In contrast, indicator systems (or
collections of indicators), when seen as a whole are meant to provide an assessment of the full environment
domain or a major subset of it (e.g. forests).
Some indicator systems have evolved to include many indicators and require a certain level of knowledge and
expertise in various disciplines to fully grasp. A number of methods have been devised in the recent past to boil
down this information and allow for rapid consumption by those who do not have the time or the expertise to
analyse the full set of indicators. In general these methods can be categorized as numerical
aggregation (e.g. indices), short selections of indicators (e.g. core set or headline indicators), short visual
assessments (e.g. arrows, traffic signals), and compelling presentations (e.g. maps or the dashboard of

8/3/2019 Development of Environmental Indicators in UNEP
http://slidepdf.com/reader/full/development-of-environmental-indicators-in-unep 14/17
sustainability). Many prominent environmental indicator systems have adjusted their indicator systems to
include or report solely on a limited ³indicator set´ (e.g. the OECD¶s ³Key Environmental Indicators´ and the
³Canadian Environmental Sustainability Indicators´)
What is an Indicator? In the widest sense, an indicator is a sign or a signal that can convey a message, The messageconveyed may be simple or it may be complex. Indicators provide us with information on things,situations, activities, processes or phenomena that exist or that are occurring in our surroundings.
According to McQueen and Noack[1], indicators are defined as ³. . .measures that summarizeinformation relevant to a particular situation, or a reasonable proxy for such a measure´.Examples of indicators include:
y A directional signal of an automobile: It can indicate when and how an automobile will turn.
y The temperature reading on a thermometer:
y It can indicate indoor or outdoor comfort levels;
y It can indicate the likelihood of disease-related conditions.
Indicators can have their greatest value as proxies or substitutes for measuring conditions that areso complex that currently there are limited possibilities for direct measurement. For example, datafrom reconnaissance orbiter photographs²and such other indirect measurements as explorationrover-based spectrographs taken recently²of the surface of Mars indicate the likely past presenceofwater.
Also, indicators may be aggregated or grouped (with or without weighting) into what are referred toas either indices or indexes. Often, these indices or indexes are useful in conveying complicatedinformation in a simple, straightforward manner. A good example of an index is The AmericanConsumer Satisfaction Index: a conglomeration²or aggregation²of econometric data collectedthrough interviews. It is used to indicate how comfortable consumers say they feel about their economic condition²and that of the U.S.economy.Indicators are developed and used predominantly to highlight the workings or the performance²or the lack thereof²of a system. The system may be biological, physical, chemical, economic or social. These indicators can tell us something about a system's status²and over time, about asystem's operating trends. Indicators are used worldwide by scientists, governments, private-sector entities, and organizations and individuals in the general public. Their use of indicators boils downto having a ³need-to-know´.
Again, indicators are as varied as the types of systems they monitor . However, according to theWebsite of Sustainable Measures, a provider of sustainability training services, there are certaincharacteristics that useful, effective, defensible and believable indicators have in common:
y Effective indicators are relevant; they show you something about the system that you need to know.
y Effective indicators are easy to understand, even by people who are not experts.
y Effective indicators are reliable; you can trust the information that the indicator is providing.

8/3/2019 Development of Environmental Indicators in UNEP
http://slidepdf.com/reader/full/development-of-environmental-indicators-in-unep 15/17
y Effective indicators are based on accessible data; the information is available or can be gathered while there is still
time to act.
Why Use Indicators? When properly developed, validated, and applied, indicators can assess trends, compare placesand situations, provide simplified data, monitor progress, identify performance issues, and provide
early warning information or signal emerging issues. In addition, indicators can help decision-makers and experts as well as involved, lay stakeholders identify information gaps and researchpriorities, and inform and influence policy development and program planning. This help canextend to the adjustment of strategies and resource allocation to improve the effectiveness of programs. Finally, indicators are typically applied for the purpose of telling a story, in particular tothe public. Here they can provide a picture of trends and changes, assisting withinformation, education and awareness efforts. Overall, indicators are developed and used to clarifythe operation of processes or to measure the impacts and outcomes of actions taken.Environmental Indicators Environmental indicators are developed, validated and used to track changes to the quality and
condition of the air , water, land, andecological systems²and their resident biota²on variousgeographic and temporal (that is, time) scales. Other types of indicators focus on human health,social and economic conditions. For example, biological markers²also called biomarkers²arevalued in disclosing, understanding, preventing and managing diseases inhumans, domesticated organisms and in wildlife. Ideally, environmental indicators presentscientifically-based, scientifically-defensible, and credible information on the status of, and trendsin, environmental- and health-related conditions or situations.Examples of environmental indicators include:
y The concentration of ozone in the stratosphere. It can indicate the effect of chlorofluorocarbons and the likelihood of increased levels of ultraviolet radiation.
y The number and diversity of organisms in a stream. These can indicate whether an aquatic ecological system isfunctioning normally.
Who Uses Environmental Indicators? Over the last decade, a wealth of environmental indicators have appeared in the monitoring andreporting activities of such international organizations as the Organisation for Economic Co-operation and Development, the World Health Organization, theWorld Bank and the United NationsEnvironment Programme. In addition, they are being used by multi-national agencies such astheNorth American Commission for Environmental Cooperation (CEC) and the EuropeanEnvironment Agency - both of which maintain comprehensive indicator programs. Indicators havealso found use at national as well as municipal levels (Environment Canada, theU.S. Environmental
Protection Agency
, the Mississippi 2020 Network, Inc.) and in the private sector (The World EconomicForum, The Business Roundtable). You can refer to other examples provided in the Further Reading section, below.Three Key Groups of Environmental Indicators There is no universal set of environmental indicators. Although many indicators appear to be thesame, most indicators are developed narrowly by an agency or organization for specific, mission-oriented needs. For the purpose of better understanding how indicators are developed and used,
8/3/2019 Development of Environmental Indicators in UNEP
http://slidepdf.com/reader/full/development-of-environmental-indicators-in-unep 16/17
indicator experts commonly group environmental indicators into the three categories discussedbelow.
State of the Environment Indicators Descriptive "State of the Environment Indicators" focus on gathering information, based on
existing, available information. They are used typically for "State of the Environment" reporting bygovernment or think-tank agencies. Their focus is on providing a picture of what is happening tothe environment, charting trends and changes in degradation or in environmental improvements.Descriptive indicators reflect the situation as it is, without reference to what it should or could be.Most sets of descriptive-style indicators in use are based on the so-called Drivers-Pressures-State-Impact-Response (DPSIR) model.
Examples of State of the Environment indicators include:
y Greenhouse-gas emissions (driving force indicator)
y CO2 emissions in key sectors (residential, business, transportation) ( pressure indicator)
y
G
lobal temperature ( state/im pact indicator)y Greenhouse-gas emissions and removals (res ponse indicator)
These examples are from the European Environment Agency indicator set.
Sustainability Indicators Another large group of indicators has been developed in order to measure sustainabilityor sustainable development. These kind of indicators have gained momentum since the 1992 RioEarth Summit. Since then, a number of countries have adopted sustainable development goals onwhich they report their progress. Canada, New Zealand, Norway, and the United Kingdom areexamples of countries that are fairly advanced in sustainability reporting. The work undertaken byinternational organizations such as theOrganization for Economic Development (OECD) and
the United Nations Commission on Sustainable Development (UNCSD) has and continues to playa strong catalytic and intellectual role in the development of sustainability indicators.
Sustainability indicators typically focus on a range of issues and are, ideally, broad enough topermit a complete appraisal of systems spanning both natural and managed ecosystems. Theseindicators can measure more than one aspect of the parameter and will commonly focus on bothtime, threshold (e.g.; efficiency, sufficiency, equity, and quality of life). Examples include:
y CO2 emissions per capita
y Percentage of forest renewal for harvested forest areas
y R enewable energy consumed versus total energy consumed
y R ecovery of residential materials per capita
Environmental Performance Indicators
Performance indicators are commonly used by businesses, governments and non-governmentalorganizations to monitor , track and present to interested parties and the public overall progress onstated goals and benchmarks. Performance indicators monitor whether goals and targets will bemet or not, and can communicate the need for additional measures. Unlike descriptive indicators,performance indicators focuses on the distance from a target, comparing actual conditions with aspecific set of reference conditions. Ideally, performance indicators will report on results (e.g., a

8/3/2019 Development of Environmental Indicators in UNEP
http://slidepdf.com/reader/full/development-of-environmental-indicators-in-unep 17/17
declining trend in emissions of nitrous oxide to the atmosphere), not efforts (e.g., number of fines laid oncompanies out of compliance).