development of environmental metabarcoding analysis for
TRANSCRIPT

Central Washington University Central Washington University
ScholarWorks@CWU ScholarWorks@CWU
All Master's Theses Master's Theses
Summer 2021
Development of Environmental Metabarcoding Analysis for Use in Development of Environmental Metabarcoding Analysis for Use in
Ecological Studies of Aquatic Fungal and Oomycete Communities Ecological Studies of Aquatic Fungal and Oomycete Communities
Using Nanopore Sequencing Using Nanopore Sequencing
Douglas Bennett Central Washington University, [email protected]
Follow this and additional works at: https://digitalcommons.cwu.edu/etd
Part of the Biology Commons, Fresh Water Studies Commons, and the Parasitology Commons
Recommended Citation Recommended Citation Bennett, Douglas, "Development of Environmental Metabarcoding Analysis for Use in Ecological Studies of Aquatic Fungal and Oomycete Communities Using Nanopore Sequencing" (2021). All Master's Theses. 1550. https://digitalcommons.cwu.edu/etd/1550
This Thesis is brought to you for free and open access by the Master's Theses at ScholarWorks@CWU. It has been accepted for inclusion in All Master's Theses by an authorized administrator of ScholarWorks@CWU. For more information, please contact [email protected].

DEVELOPMENT OF ENVIRONMENTAL METABARCODING ANALYSIS FOR USE IN
ECOLOGICAL STUDIES OF AQUATIC FUNGAL AND OOMYCETE
COMMUNITIES USING NANOPORE SEQUENCING
__________________________________
A Thesis
Presented to
The Graduate Faculty
Central Washington University
___________________________________
In Partial Fulfillment
of the Requirements for the Degree
Master of Science
Biological Sciences
___________________________________
by
Douglas Marvin Bennett
August 2021

ii
CENTRAL WASHINGTON UNIVERSITY
Graduate Studies
We hereby approve the thesis of
Douglas Marvin Bennett
Candidate for the degree of Master of Science
APPROVED FOR THE GRADUATE FACULTY
________________ _____________________________________________
Dr. James E. Johnson, Committee Chair
________________ _____________________________________________
Dr. Clay Arango
________________ _____________________________________________
Dr. Paul James
________________ _____________________________________________
Dean of Graduate Studies

iii
ABSTRACT
DEVELOPMENT OF ENVIRONMENTAL METABARCODING ANALYSIS FOR USE IN
ECOLOGICAL STUDIES OF AQUATIC FUNGAL AND OOMYCETE
COMMUNITIES USING NANOPORE SEQUENCING
by
Douglas Marvin Bennett
August 2021
One of several factors contributing to amphibian decline are organisms called
water molds (oomycetes), which parasitize and kill amphibian and fish eggs, larvae, and
occasionally adults. Amphibian decline is one of the most difficult issues facing
ecologists and conservationists to date; half of amphibian species are in severe decline
and one third of amphibian species are facing extinction, threatening the stability of
ecosystems globally. Multiple oomycete species are known to cause the disease
saprolegniasis and contribute to amphibian decline; however, the full range of species
involved is not presently known. This study evaluated the Oxford Nanopore minION
DNA sequencer (R9.2 chemistry) for use in DNA barcoding multiplexed samples. This
study aimed to develop new methods of environmental metabarcoding analysis to
assess aquatic oomycete and fungal communities using the internal transcribed spacer
(ITS) DNA barcode. A proof-of-concept survey was performed to assess community
composition and diversity of aquatic oomycetes and Fungi in 4 freshwater habitats with

iv
saprolegniasis present. Samples were taken April 15, 2016 at 4 sites along Interstate-90
near Snoqualmie Pass (Wenatchee National forest, Washington) during Rana cascadae
and Anaxyrus boreas breeding season near eggs with saprolegniasis.
The minION produced high but uneven throughput across all four sites. The
sequence accuracy and error type prevented chimera checking and phylotype
assignment. Sequences were matched using NanoOK to the UNITE database to assign
operational taxonomic units (OTUs). FUNGuild was used to assign trophic modes to
OTUs to evaluate functional diversity. The recovered oomycete OTUs were low (~1% of
all reads) and represented plant pathogenic phyla. Fungal recovery was broad with
aquatic taxa represented heavily. Diversity analysis showed little difference between
sites, with evidence that uneven throughput affected beta-diversity indices from
assessing compositional differences. Trophic mode analysis showed little difference
between sites.
Overall, this study found that the minION sequence data presented multiple
bioinformatic challenges for metabarcoding using the ITS region. With low recovery of
oomycetes, further study is needed to determine the availability of oomycete zoospores
for collection via the sampling methods used in this study. Additionally, oomycete
specific primers are recommended for increased recovery.

v
ACKNOWLEDGMENTS
I would like to thank Central Washington University and the Department of
Biological Sciences for the laboratory space and resources to make this study possible.
My advisor Dr. Jim Johnson for helping fund this project and sticking with it to the end.
My committee members Dr. Clay Arango and Dr. Paul James for coming on board and
giving their time for this project. Dr. Steve Wagner for helping to find and decide on field
sites. Kayleigh Wiklund-Mullen for being an awesome field partner and wading through
swamps and snow with me. The faculty and staff that I was so lucky to work with over
the years, you are all amazing and I am so lucky to consider you my friends. My parents
Greg and Jeneen for their constant support. My grandparents Rose and Dave Whitfield
for providing me with housing and support during my time at CWU.

vi
TABLE OF CONTENTS
Chapter Page
I INTRODUCTION ............................................................................................. 1
Oomycete Taxonomy and Ecology ......................................................... 1 Saprolegniasis and Amphibian Decline .................................................. 2 Factors Affecting Amphibian Disease Severity ....................................... 3 Inventory and Identification of Aquatic Oomycetes ............................... 4 Environmental Metabarcoding and eDNA Sampling .............................. 5 DNA Sequencing Technology .................................................................. 6 Study Design ............................................................................................ 9 Study Aims ............................................................................................ 11
II METHODS ................................................................................................... 13
Study Area ............................................................................................. 13 Sampling and Sequencing Preparation ................................................. 16
Sequence Processing ............................................................................. 18 Community Structure Analysis .............................................................. 21 Functional Diversity ............................................................................... 22
III RESULTS ...................................................................................................... 23
Sequencing ............................................................................................ 23 NanoOK ................................................................................................. 24 Traditional Diversity .............................................................................. 29 Functional Diversity ............................................................................... 32
IV DISCUSSION ................................................................................................. 34
Nanopore Metabarcoding ..................................................................... 34 eDNA Methods ...................................................................................... 36 Fungal Community Recovery ................................................................ 37 Traditional Diversity .............................................................................. 39 Functional Diversity ............................................................................... 39 Future Research .................................................................................... 40 Conclusions ........................................................................................... 42

vii
TABLE OF CONTENTS (CONTINUED)
Chapter Page
REFERENCES ................................................................................................ 44

viii
LIST OF TABLES
Table Page
1 Metrichor quality filtering during basecalling of 2D sequences ................. 23
2 NanoOK quality filtering statistics .............................................................. 25
3 Alpha diversity indices measured at each site............................................ 30
4 Sorenson-Dice index matrix comparing each pair of sites ......................... 32
5 Jaccard distance index matrix comparing each pair of sites ...................... 32

ix
LIST OF FIGURES
Figure Page
1 Study area with individual ponds indicated by arrows............................... 14
2 Sequence analysis flowchart ....................................................................... 19
3 OTU Abundance of phyla at Mardee Lake .................................................. 26
4 OTU abundance at Swamp Creek ............................................................... 27
5 OTU abundance at Swamp Lake ................................................................. 27
6 OTU abundance at Gold Creek Stockpile .................................................... 28
7 OTU accumulation curve of all sites ........................................................... 29
8 Renyi Diversity plots showing each site as alpha increases on the x axis
comparing diversity on the y axis ............................................................... 31
9 Proportion of assigned OTUs for each trophic mode at each site ............. 34
1
CHAPTER I
INTRODUCTION AND LITERATURE REVIEW
Oomycete Taxonomy and Ecology
Water molds (oomycetes) are fungus-like protists belonging to the kingdom
Chromista; but were originally characterized as Fungi, in the now defunct Class
Phycomycetes, due to their morphology (Dick 1976; 2001). Phylogenetic analysis placed
the oomycetes evolutionarily closer to diatoms, brown-algae, and other protists in the
kingdom Chromista (Beakes et al. 2012). As a group, the Chromista are unified by the
production of heterokont zoospores with one tinsel type flagellum and production of
chlorophyll a & c containing chloroplasts among photosynthetic representatives
(Cavalier-Smith and Chao 2006). The oomycetes have lost their chloroplasts and the
production of chlorophyll over time (Cavalier-Smith and Chao 2006).
Oomycetes are mostly pathogens of plants (Huxley 1881; Lucas et al. 1991;
Kiesecker et al. 2001; Beakes and Thines 2017). Oomycetes of the order Saprolegniales
are mostly saprotrophs that decompose organic matter, making them important
contributors to nutrient cycling; however, several species are implicated in causing the
amphibian and fish disease saprolegniasis (Huxley 1881; Kiesecker et al. 2001; Beakes
and Thines 2017). The Peronosporales includes plant pathogenic genera Pythium and
Phytophthora (Lucas et al. 1991). Phytophthora infestans has been identified as the
pathogen causing late blight disease; an outbreak of which led to the potato famine in

2
1840s Europe (Yoshida et al. 2013). Overall, members of the oomycetes impact the
ecology of numerous organisms, contribute to nutrient availability, and can be
devastating to industry.
Saprolegniasis and Amphibian Decline
Oomycetes have also been implicated causing the disease saprolegniasis in
salmonids and other fish dating back to the late 1800s (Huxley 1881) and have been
shown to affect egg clutches as well as juveniles, particularly in aquaculture, as a disease
of the fins and body (Earle and Hintz 2014). Fish hatcheries globally are susceptible to
Saprolegnia parasitica due to the fish dense ponds with low water flow (Willoughby and
Roberts 1992; Earle and Hintz 2014).
Saprolegniasis has been shown to be a major cause of amphibian decline,
specifically in Anurans (frogs), and a minor factor in Caudata (salamanders) decline
(Blaustein et al. 1994). Eggs and embryos are the most common life stage where
saprolegniasis occurs. Larvae and adult frogs can also have saprolegniasis on their skin,
though this is less common than egg infections (Kim et al. 2008). As high as 80% clutch
mortality has been observed in severe cases of amphibian egg saprolegniasis, so
mitigation of this disease is important to reducing amphibian decline (Kiesecker et al.
2001).
Understanding amphibian decline represents a major challenge facing ecologists
and conservationists; half of all species are in severe decline and one third of all
amphibian species are facing extinction, threatening the stability of ecosystems globally

3
(Blaustein and Kiesecker 2002; Stuart et al. 2004). Amphibian decline is thought to be
the result of anthropogenic factors, such as deforestation, habitat fragmentation, and
habitat use, as well as biological factors of parasitism and disease (Beebee and Griffiths
2005). Anthropogenic factors are being monitored regularly as they affect a larger
number of organisms; however, there is still a lack of understanding of the biological
factors impacting decline, such as the diseases saprolegniasis and chytridiomycosis
(Bienentreu and Lesbarrères 2020). Amphibians are important predators of insects and
are food sources for freshwater fish, birds, and mammals. Increased study of
saprolegniasis is not only beneficial for preserving the amphibians affected but also the
ecosystems to which these amphibians belong.
Factors Affecting Amphibian Disease Severity
Amphibian disease severity varies widely and relatively little is known about how
species of oomycetes may interact with each other and other organisms (Kiesecker and
Blaustein 1997). It is known that disease severity is affected by several environmental
factors such as: temperature, ultraviolet light, and pH level; the response to these
factors depends upon the water molds present (Banks and Beebee 1988; Kiesecker and
Blaustein 1995; Hatch and Blaustein 2000; Kiesecker et al. 2001; Blaustein et al. 2003).
Infection timing in embryonic development has also been shown to affect egg survival
(Fernández-Benéitez et al. 2011). Phylogenetic studies have identified at minimum
seven and as many as twelve different phylotypes of water mold associated with active
infection of amphibian eggs (Johnson et al. 2008; Petrisko et al. 2008). Further evidence

4
suggests more species than initially indicated may contribute to pathogenicity and egg
mortality (Fernández-Benéitez et al. 2008; 2011; Brady 2010; Ault et al. 2012). A
succession pattern was also found in saprolegniasis infections, finding that Saprolegnia
ferax and Saprolegnia declina are typically among the first colonizers on an amphibian
egg with the number of phylotypes found increasing as the eggs age (Ault et al. 2012).
Inventory and Identification of Aquatic Oomycetes
Historically, conducting biodiversity inventories of the oomycetes required the
isolation of axenic cultures from water or soil samples. While relatively inexpensive, this
approach is very labor and time intensive. These methods include baiting for motile
water mold zoospores in small water samples (20-30 mL) or from obviously infected
materials in sterile water. Commonly used baits include seeds, salmon eggs, and
snakeskin (Sparrow 1960; Stevens et al. 1974). The baits chosen for a study may select
for different species potentially limiting the recovery of slower growing or rare species
(Stevens et al. 1974). Overall, these methods tend to select for the most aggressive and
fastest growing species in any sample. As a result, many species may fail to be
recovered, limiting the understanding of saprolegniasis and aquatic ecosystems.
Morphological identification of pathogens from infected eggs or materials is also
problematic. Morphological identification relies upon reproductive structures and
spores to be present (Johnson 1956; Seymour 1970). However, recent molecular
phylogenetic studies suggest that the morphology of the oomycetes does not accurately
reflect phylogeny (Dieguez-Uribeondo et al. 2007; Johnson et al 2008). Due to the

5
difficulty finding morphological traits that accurately identify monophyletic groups,
identification of water molds in many studies is currently done primarily using DNA
sequence data and phylogenetic analysis (Johnson et al. 2008; Sandoval-Sierra 2014).
This approach allows one to more accurately identify morphologically variable or cryptic
species that are difficult to assign to groups morphologically (Johnson et al. 2008).
The phylogenetic identification approach is exemplified in studies using DNA
barcoding, the use of a short universal sequences which can be used to determine
species boundaries as well as evolutionary relationships (White et al. 1990, Hebert et al.
2003). For oomycetes and Fungi, the primary barcode is the internal transcribed spacer
(ITS) region which codes for spacers between ribosomal subunits and a portion of the
rRNA (Leclerc et al. 2000; Seifert et al. 2007; Robideau et al. 2011, Schoch et al. 2012;
Choi et al. 2015, Riit et al. 2016). Subsequent phylogenetic studies, using DNA
barcoding, have identified water molds by phylotype; which is an identification based
upon less than 97% similarity by genetic distance between individuals and may
represent a more accurate assignment of individual species given the lack of clarity in
water mold taxonomy (Parrent et al. 2006; Ault et al. 2012).
Environmental Metabarcoding and eDNA Sampling
Environmental metabarcoding is a relatively new approach which involves taking
environmental DNA (eDNA) samples from soil, air, water or other materials, extracting
all the DNA from the sample, and sequencing the DNA to identify species of interest
(Ogram et al. 1987; Lydolf et al. 2005; Lodge et al. 2012). Environmental metabarcoding

6
is used in bacterial research as well as for cryptic amphibian species (Taberlet et al.
2012; Sapp et al. 2016). This approach has been used effectively in soil environments to
detect terrestrial oomycetes; however, it has not yet been employed for use in the
study of aquatic oomycetes (Schmidt et al. 2013).
The primary use of eDNA is to use targeted primers to detect specific individuals
or selected groups of individuals; although, a wide range of applications have emerged
(Taberlet et al. 2012). The targeted approach has been used to detect cryptic amphibian
species in streams (Goldberg et al. 2011) and for detecting invasive fish (Davison et al.
2016). Since there is a lack of clarity of the identities and taxonomy of pathogenetic
oomycetes, species specific primer sets have not been developed (Fernández-Benéitez
et al. 2008; 2011; Brady 2010; Ault et al. 2012). As a result, the targeted detection of
pathogenic oomycetes was not available at the time of this study.
The alternative approach, used in this study, is to utilize general barcoding
primers and optimize PCR conditions to maximize return of oomycete sequences. The
environmental metabarcoding approach removes the need for cultures and thus
removes bait selection and competition as a barrier for identification. Considering the
bias of traditional isolation methods, the limitations of morphological identification, and
the lack of clarity of oomycetes involved in saprolegniasis, the environmental
metabarcoding approach is highly appealing for the study of oomycetes as it removes
major limitations of previous studies.

7
DNA Sequencing Technology
In early studies, the ITS region was sequenced for individual isolates using Sanger
sequencing (Horton and Bruns 2001; Hulvey et al. 2007). This was done because, at the
time, this was the only sequencing technology available. It also has the advantage of
relatively long read lengths (~1000 bp), which enabled the sequencing of each strand
with a single reaction. However, this type of sequencing requires either pure (axenic)
cultures (Sanger and Coulson 1975; Sanger et al. 1977) or cloned PCR fragments that can
be sequenced individually (e.g. Arcate et al. 2006; Hassan et al. 2011; Ault et al. 2012).
In order to sequence eDNA recovered from mixed soil and water samples, PCR
fragments had to be subcloned into bacteria in order to isolate individuals. Culture and
subcloning methods were time consuming, labor intensive, and expensive limiting larger
studies of the ecology of microbial environments.
Second-generation sequencing technology, such as Illumina and Pyrosequencing,
have increased throughput for whole genome sequencing but with shorter read lengths
than Sanger sequencing. These technologies simultaneously sequence an array of
individual DNA strands via synthesis with modified nucleotides, allowing for the
sequencing of mixed samples (Ahmadian et al. 2006). This lowered the cost and time
investment per sample dramatically from the labor-intensive approach required with
Sanger sequencing. The other advantage to this second-generation approach is that a
relative abundance of individuals in the sample can be estimated based upon the
number of sequences that are read, with some consideration to amplification bias if the

8
samples have undergone PCR (O’Brien et al. 2005; Lamb et al. 2019). As a result, second-
generation sequencing has reduced the time and labor of environmental metabarcoding
studies (Jumpponen et al 2010; Schmidt et al. 2013).
The Oxford Nanopore minION is the third generation DNA sequencer which
takes a novel approach to DNA sequencing (Laver et al. 2015; Weirather et al. 2017).
The minION uses sequencing by shape rather than by synthesis. The DNA is drawn
through a Nanopore via motor protein as buffer flows through the pore. The change in
ion flow caused by the unique shape of each nucleotide as it passes through the pore is
detected by an electrode downstream of the pore. This technology can sequence
individual strands of DNA without amplification. Additionally, Nanopore sequencing
offers much greater read length (average ~2 kbp) which allows the sequencing of the
entire ITS while also having multiple samples in the same run. Making the minION ideal
for this type of metabarcoding study. The drawback of this technology is lower accuracy,
the chemistry used in this experiment was known to have an average accuracy of ~90%
at the time of this study.
At the time this study was conducted the average read length of Illumina was
less than 300 bp and would not be able to sequence the entire ITS (Quail et al. 2008).
Pyrosequencing was capable of around 600 bp at the time of this study, however it was
prohibitively expensive (Ahmadian et al. 2006). For this study, the choice was between
sequencing the entire ITS region at an expensive cost or roughly half the ITS at a much
lower cost when considering second-generation technology. The Oxford Nanopore
minION at the time of this study was roughly half the cost for sequencing the entire ITS

9
compared to Pyrosequencing. The minION was selected for this study as it presented
the most cost-effective solution for the environmental metabarcoding approach used in
this study. One question of this study was whether the lower accuracy of the minION
could be overcome by increased coverage of the ITS region for identification of species
or phylotypes.
Study Design
Most of the early studies of amphibian saprolegniasis focused on identifying sites
and severity of disease conditions; and used morphology to identify the pathogens
responsible (e.g. Banks and Beebee 1988; Blaustein et al. 1994). As a result of the
problems with morphological identification methodology, Saprolegnia ferax and
commonly just Saprolegnia sp. were the most common species identified as causing
most infections (e.g. Banks and Beebee 1988; Kiesecker and Blaustein 1995; 1999).
Subsequently, there is a lack of clarity as to how the presence of individual species of
oomycetes affects disease severity. Recent studies have identified several distinct
phylotypes associated with amphibian embryos and demonstrated some of these are
also pathogenic (Fernández-Benéitez et al. 2008; Johnson et al. 2008; Petrisko et al.
2008; Brady 2010; Ault et al. 2012). Given that traditional isolation techniques are
biased for the fastest growing individuals or may misidentify organisms present due to
poor taxonomy, a survey of the oomycetes in habitats where saprolegniasis occurs is
warranted.

10
Locally, the cascades frog (Rana cascadae) and western toad (Anaxyrus boreas)
are both affected by saprolegniasis (Hatch and Blaustein 2000; Kiesecker et al. 2001).
The western toad is currently considered a state candidate for preservation in
Washington; although, globally the population is listed as least concern (IUCN 2020).
The cascades frog is near threatened globally (Hammerson and Pearl 2004). These
species can both be found in the high alpine lakes in the Cascade mountains in
Washington (Cohen and Stebbins 1995).
Western toads and cascades frogs utilize habitat differently. Western toads are a
migrating species that rely upon temporary ponds from melting snow to make the
journey from overwintering sites to breeding ponds (Bartelt et al. 2004). Cascades frogs
are typically found in or near small ponds, lakes, and occasionally in temporary pools
near streams (Cohen and Stebbins 1995; Resetarits 1996). Cascades frogs typically
hibernate in the mud in shallower portions of ponds and lakes (Cohen and Stebbins
1995). These lifestyle dissimilarities could influence exposure to oomycetes during non-
breeding months.
Egg laying behavior is also slightly different between the western toad and
cascades frog. Western toad egg clutches are laid in long strings, which could be a
behavioral adaptation to prevent the spread of saprolegniasis (Kiesecker and Blaustein
1997). Cascades frogs lay large egg masses and females will group together to lay eggs
making them more susceptible to saprolegniasis (Kiesecker and Blaustein 1997).
Zoospore recovery near infected eggs of each species could vary between species as egg
density varies, as well as differences in host specificity of pathogenic species.

11
Reproduction of oomycetes can be asexual, producing motile zoospores, or
sexual, producing non motile oospores (Wardrip et al. 1999; Hardham 2001). Zoospores
are flagellate and are produced in a zoosporangium from the hyphal stage of water
mold. Zoospores can encyst multiple times prior to the germination of hyphae; these
cysts can persist in harsh environmental conditions and show chemotaxis to hosts and
substrates (Ho 1975). The potential presence of zoospores, near amphibian eggs with
saprolegniasis, swimming chemotactically to reinfect the egg masses or search for a new
host, provides an opportunity for collection. Spores can be filtered from this sample
using commonly available filters, as the spores are a similar size to bacteria (Stevens et
al. 1974; Dick 2001).
Both the western toad and cascades frog being affected by saprolegniasis, their
overlapping locality, and lifestyle differences provides an excellent opportunity to study
oomycetes related to saprolegniasis. Potential capture of zoospores by water sample
limits potential biases observed in traditional study methods. The eDNA sampling
approach is also less invasive than identification of pathogens on infected eggs, as
collection of infected materials often disturbs neighboring eggs. Considering these
factors, a proof-of-concept study was performed using water samples collected near
eggs of these two local amphibians with saprolegniasis present.
Study Aims
The aim of these experiments was to evaluate the use of Oxford Nanopore
sequencing for DNA barcoding of the ITS region and eDNA sampling methods to study

12
oomycetes. The minION presented the most cost-effective approach at the time of this
study; as well as, potentially providing more accurate identification due to complete
sequencing of the ITS region, despite expected lower basecalling accuracy, compared to
other technologies. The study sites selected for this experimental survey represent a
variety of habitat conditions where saprolegniasis was present and, if successful, could
have provided a baseline for future studies of amphibian saprolegniasis. An ecological
analysis was also performed to assess the community recovered and evaluate any
potential problems presented by the sequencing and sampling methods used in this
study.

13
CHAPTER II
METHODS
Study Area
This study focused on the central Cascades near Snoqualmie Pass, WA
along the Interstate-90 (I-90) corridor. Four freshwater ponds were selected for the
presence of breeding western toads and cascades frogs and presence of saprolegniasis.
All 4 sites were sampled on April 15, 2016, during the spring snow melt. Snoqualmie
pass regularly sees frozen conditions from November to March, with the main snow
melt typically occurring around the first week of April. The 4 ponds selected were:
Swamp Lake, Swamp Creek, Mardee Lake, and Gold Creek Stockpile as shown in Figure
1.
Swamp Lake is about 0.69 km north of I-90 located immediately east of Kachess
Lake Rd, at the time sampled the water was about 0.5-2 m in depth with remnants of
emergent vegetation from the previous year still present. Swamp Lake had both
cascades frog and western toad breeding occurring at the time of sampling, with some
sightings of pacific chorus frog (Pseudecaris regilla) eggs and northwest salamander
(Abystoma gracile) eggs which showed no signs of disease. It is possible other
salamanders were present, but at the time of sampling none were observed.

14
Figure 1: Study area with individual ponds indicated by arrows. (http://www.google.com/maps)
Swamp Creek are located approximately 15.6 km southeast of the Snoqualmie
Pass summit. Swamp Creek is located less than 80 m south of I-90 and located north of
Stampede Pass Rd, this was the most heavily polluted pond of the 4 selected due to its
proximity to I-90. Swamp Creek features shallow (<0.5 m depth) and deep (>1 m depth)
sections, samples were taken in the shallow section approximately 20 m north of
Stampede Pass Rd where cascades frog eggs were located.

15
Gold Creek Stockpile was a recently renovated site which, in the summer of
2015, was restored to natural habitat after the removal an asphalt parking lot. Gold
Creek Stockpile is located approximately 3 km southeast of the Snoqualmie Pass
summit, 0.1 km north of Lake Mardee Rd (NF-4832), approximately 0.18 km north of I-
90. Gold Creek Stockpile consisted of 2 ponds at the time of sampling, with the ground
mostly free of foliage, cascades frogs were found breeding in the southern most pond
which was on average about 1 m in depth and lacked riparian or in water vegetation.
The egg mass where samples were taken was partially dehydrated and spread on the
bank of the pond, showing the water level had reduced substantially since the egg mass
was deposited. Two other egg masses were present at the time of sampling; however,
the egg mass with the most eggs submerged with the highest signs of infection were
chosen for sampling.
Mardee Lake was the most remote site, located approximately 3.1 km southeast
of Snoqualmie pass summit, approximately 0.4 km east of NF-9090 Rd, 0.64 km north of
I-90. Mardee Lake was very similar to Swamp Lake in terms of size, depth, and foliage.
Only Cascade frog eggs were found at Mardee Lake with the largest egg mass being
approximately 2 m long x 1 m wide x 0.5 m deep.
Sampling and Sequencing Preparation
Water samples were taken as close to the edge of the egg mass as possible near
areas of active infection, avoiding the capture of tadpoles and plant debris, using two
sterilized 300 mL centrifuge bottles per site. Active infection was identified as eggs with

16
large hyphal structures present, samples were taken where multiple eggs were showing
infection. When western toad and cascade frog eggs were both present, one sample
was taken at the highest infection site for each species. Samples were then filtered using
Millipore HV sterile 0.45 µm vacuum filtration cups (EMD Millipore, Burlington, MA).
The filter was aseptically removed from the cup, cut into quarters, and separated into
1.7 mL sterile tubes. Samples were stored at 20⁰C for 24-48 hours prior to DNA
extraction and PCR.
Extraction was performed using a modified hotSHOT technique (Truett et al.
2000), with the addition of 0.1 mL of .05 mm sterile glass bead and two 2 mm sterile
glass beads to each sample; followed by a one minute of bead beating prior to
incubation at 95⁰C for one hour. Following extraction, samples were then amplified
using ITS5 and ITS4 primers to select for oomycetes (White et al. 1990). PCR conditions
were optimized by a preliminary experiment using a DNA extract from a mixed culture
of oomycetes isolated from Swamp Lake. Water samples were taken from this mixed
culture and extracted using the same method as the pond samples. From these samples
several temperature protocols and primers were tested and the amount of DNA from
extraction was varied to maximize DNA amplification. PCR was performed using a
touchdown temperature protocol decreasing annealing temperature from 58°C to 50°C,
stepping down 2°C every 5 cycles, for a total of 40 cycles. This approach prioritizes
individuals that matched the primers well, while allowing for amplification of less
abundant individuals (Hecker and Roux 1996). PCR was performed in 25 µL aliquots
using PCR buffer at recommended concentration, 2.5 mM MgCl2, 200 µM of dNTPs, 0.4

17
µM of each primer (ITS5 and ITS4), 1.25 units Taq DNA polymerase, and 5 µL of each
DNA extract. Following PCR, samples were run on a 1% agarose gel with ethidium
bromide and imaged using a UV transilluminator. For each site, the four 25 µL PCR
products showing the highest amplification visually were combined and purified using
QiaQUICK PCR Purification Kit (Qiagen LLC, Germantown, MD). The DNA samples were
eluted in 45 µL of TE buffer for library preparation.
Samples were prepared following a modified library preparation protocol
supplied by Oxford Nanopore for whole genome sequencing with the minION sequencer
(Oxford Nanopore Technologies, Oxford, UK). Each sample was modified using NEBNext
Ultra II end repair mix (New England Biolabs, Ipswich, MA) to leave TA ends on each
DNA strand. Following end modification, Oxford Nanopore sequencer adapters were
attached to the sample DNA using TA ligase (New England Biolabs, Ipswich, MA). The
adapter mix included what is necessary to pull the DNA through the pore and a loop
connecting both complimentary strands so that the sequencer would be able to read
the forward and reverse strands of each sample. Sequencing both complimentary
strands results in two dimensional (2D) reads with higher accuracy than single stranded
(1D) reads (Jain et al. 2016). The DNA was then purified using magnetic streptavidin
beads (New England Biolabs, Ipswich, MA) to remove any non-nucleotide molecules and
remaining small fragments of DNA, including unbound TA-adapters. DNA was eluted
from the beads using Oxford Nanopore running buffer. Sequencing was performed using
Oxford Nanopore minION sequencer using an R9.2 flow cell. Each site was allotted 24

18
hours of run time, the flow cell was flushed between samples using a flow cell wash kit
(Oxford Nanopore Technologies, Oxford, UK).
Sequence Processing
Minknow (Oxford Nanopore Technologies, Oxford, UK) was used to
collect the DNA sequences from the Nanopore sequencer. Sequence data was then
uploaded to Metrichor (Oxford Nanopore Technologies, Oxford, UK) for basecalling and
initial quality filtering. Sequences that were 1D or failed Metrichor quality filtering were
removed from the dataset. Poretools (Loman and Quinlan 2014) was used to then
extract the sequences into .fasta file format for input into FungalITSPipeline (Nilsson et
al. 2009) and NanoOK (Leggett et al. 2016). This analysis pipeline is shown in Figure 2.
FungalITSPipeline was used as a means of reducing the UNITE fungal database
(public release 28.06.2017) to a usable size for NanoOK. Each sample was aligned to
sequences in the UNITE database resulting in a possible 10 best matches by e-score for
the ITS 1 and its 2 regions individually. Every reference sequence which passed the
pipeline’s quality filter was then extracted from the UNITE database by Samtools
(http://www.htslib.org/) to generate a truncated database for input into NanoOK.
NanoOK is a program designed to deal with Nanopore data using optimized LAST
(https://gitlab.com/mcfrith/last, Tokyo, Japan) alignments to align each sequence. LAST is
an alignment tool that has been shown to be more accurate than, widely used, Basic
local alignment search tool (BLAST) (NCBI, Bethesda, MD) when dealing with Nanopore
data as it penalizes less for insertions and deletions that are prevalent in Nanopore data

19
compared to BLAST along with other alignment optimizations for Nanopore data (Jain et
al. 2015).
Figure 2: Sequence analysis flowchart.
NanoOK reports the number of sequences that match each reference from the
UNITE database. Due to the low quality of the sequencing data and the lack of ability to
check for chimeric sequences, there is low confidence in the identification to species
level assigned by NanoOK. Instead, each group assigned by NanoOK was treated as an

20
operational taxonomic unit (OTU) most likely representing a unique group, as standard
distance-based assignment of phylotype was unavailable. NanoOK calculates alignment
scores for each sequence and assigns identity based upon the highest alignment score.
Ecological evaluations were made from the output of NanoOK by treating each match to
an OTU as a proxy for relative abundance (O’Brien et al. 2005). In order to ensure
accurate recovery of oomycetes, it was confirmed that oomycete reference sequences
were included in the truncated database prior to analysis. Additional oomycete
references were added to the database from Genbank (NCBI) after initial analyses found
poor recovery, and NanoOK analyses were rerun.
Community Structure Analysis
For this experiment, multiple traditional measures of biodiversity were used to
evaluate the communities at each site. R version 4.1.0 (R Core Team 2020) was used in
the Rstudio (Rstudio team 2021) environment with biodiversityR (Kindt and Coe 2005)
and vegan (Oksanen et al. 2020) packages for all diversity index calculations. A species
accumulation curve was calculated with error bars sampled randomly 1000 times using
biodiversityR (https://cran.r-project.org/web/packages/BiodiversityR/index.html) and
vegan (https://cran.r-project.org/web/packages/vegan/index.html) to evaluate OTU
recovery with sampling effort (Ugland et al. 2003; Kindt and Coe 2005; Oksanen et al.
2020). A Renyi diversity profile plot was generated using biodiversityR to assess relative
diversity as indices increase in dominance influence (Kindt and Coe 2005).

21
Alpha diversity measures were used to evaluate the overall health of sampled
habitats by looking at OTU richness and evenness. Shannon’s diversity is one of the most
common diversity indices used across ecological studies (e.g. Magurran 1988; Krebbs
2001). Shannon’s diversity was used for this study as the data fit the assumptions of this
index. Oomycete and Fungal spores are indefinite in the water column and, based upon
initial results, nearly all available individuals sampled were recovered. Inverse-Simpson’s
index was used as a dominance measure to evaluate diversity weighted by the most
abundant individual OTUs present in each sample (Simpson 1949; Magurran 1988).
Beta diversity indices were used to evaluate the compositional differences
between sampling sites. For this purpose, the Sorenson-Dice index (Southwood 1978)
and the Jaccard Distance index were calculated (Janson and Vegelius 1981). Both indices
do not consider the abundance of any individuals found, but rather compare the
richness of OTUs found at each site.
Functional Diversity
For this experiment, the trophic modes of the OTUs represented at each site
were evaluated. Using the tool FUNGuild (Nguyen et al. 2016) trophic modes were
assigned to OTUs based upon the taxonomic data available from the UNITE database
and is referenced to a curated database of trophic mode identifications. The FUNGuild
database assigns trophic modes and guilds to Fungi using published research of
individual taxa. While assignments using FUNGuild are reliable, they are limited due to
the incomplete nature of the current database. Trophic mode was determined to be

22
more appropriate for this application, as ecological guilds produced highly nested results
and provided little clarity for the dataset. This analysis provides a look into the different
ecological niches of OTUs recovered in this survey.

23
CHAPTER III
RESULTS
Sequencing
Initial quality filtering began during the basecalling process where the output
from the sequencer is converted into the actual DNA sequence. Metrichor gives a
quality rating based upon the signal quality of each read; additionally, this program sorts
sequences by strand direction and 2D reads. Only 2D sequences from the basecalling
procedure were used to remove redundancy from having matching strands and as a
quality filter, 2D sequences have ~10% higher accuracy on average. Even with higher
accuracy, still only 10.93% of the 322 711 reads passed initial quality filters across all
sites as shown in Table 1. Swamp Creek and Mardee Lake produced lower pass
percentage and lower overall throughput than the other two sites.
Table 1: Metrichor quality filtering during basecalling of 2D sequences.
Site Pass Fail Total Reads Pass %
Swamp Lake 15 377 107 008 122 385 12.56
Swamp Creek 760 24 773 25 533 2.97
Mardee Lake 3 136 65 225 68 361 4.58
Gold Creek 16 011 90 421 106 432 15.04
Total 35 284 287 427 322 711 10.93
Mean 8 821 71 857 80 678
The passed sequences were then used to query the UNITE fungal database using
FungalITSPipeline in order to produce a truncated database for use with NanoOK. The
24
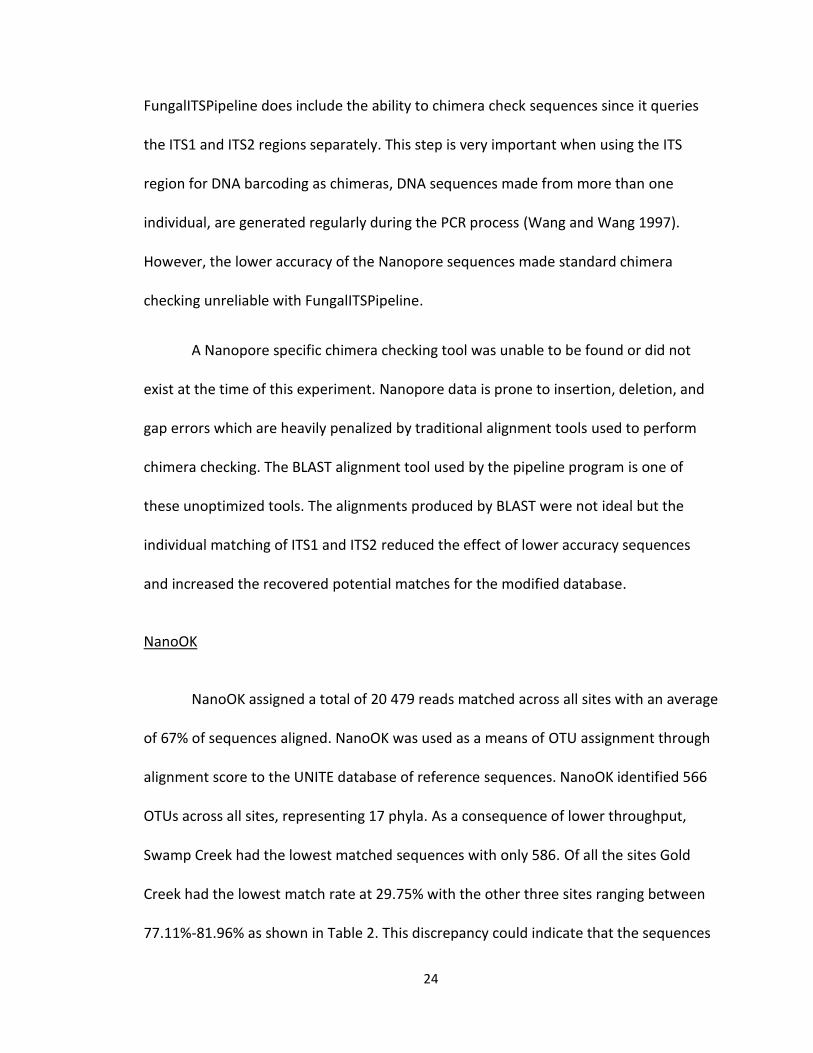
FungalITSPipeline does include the ability to chimera check sequences since it queries
the ITS1 and ITS2 regions separately. This step is very important when using the ITS
region for DNA barcoding as chimeras, DNA sequences made from more than one
individual, are generated regularly during the PCR process (Wang and Wang 1997).
However, the lower accuracy of the Nanopore sequences made standard chimera
checking unreliable with FungalITSPipeline.
A Nanopore specific chimera checking tool was unable to be found or did not
exist at the time of this experiment. Nanopore data is prone to insertion, deletion, and
gap errors which are heavily penalized by traditional alignment tools used to perform
chimera checking. The BLAST alignment tool used by the pipeline program is one of
these unoptimized tools. The alignments produced by BLAST were not ideal but the
individual matching of ITS1 and ITS2 reduced the effect of lower accuracy sequences
and increased the recovered potential matches for the modified database.
NanoOK
NanoOK assigned a total of 20 479 reads matched across all sites with an average
of 67% of sequences aligned. NanoOK was used as a means of OTU assignment through
alignment score to the UNITE database of reference sequences. NanoOK identified 566
OTUs across all sites, representing 17 phyla. As a consequence of lower throughput,
Swamp Creek had the lowest matched sequences with only 586. Of all the sites Gold
Creek had the lowest match rate at 29.75% with the other three sites ranging between
77.11%-81.96% as shown in Table 2. This discrepancy could indicate that the sequences

25
are either of low quality, high in chimeras, or that the individuals represented were not
included in the UNITE database. Most likely the latter being the case.
Table 2: NanoOK quality filtering statistics.
Site Matched Unmatched Total Match %
Swamp Lake 12 603 2 774 15 377 81.96
Swamp Creek 586 174 760 77.11
Mardee Lake 2 526 610 3 136 80.61
Gold Creek 4 764 11 247 16 011 29.75
Total 20 479 14 805 35 284
Mean 5 119.75 3 701.25 8 821 67.38
The phyla found at each site are summarized in Figures 3-6. Each site shows a
mixture of terrestrial and aquatic phyla primarily from the kingdom of Fungi. The
Chromista, includes water molds, was strongly represented at each site, with Mardee
Lake showing exceptionally lower Chromista than the other sites.
Unfortunately, the Chromista reference sequences matched lacked further
taxonomic information, water. All 3 544 Chromista sequences recovered matched to 2
reference sequences from uncultured individuals recovered from 2 different soil studies
(Hollister et al. 2010; Lan 2015). Additional oomycete references were added to the
truncated database and analyses rerun, this resulted in less than 5% of the previously
matched Chromista sequences being identified mostly as members of Pythium and
Phytophthora, plant pathogenic water molds typically found in soils or plants (Lucas et
al. 1991; Arcate et al. 2006). It is possible that zoospores were not collected, and a close
relative of the oomycetes was instead recovered. Without further study, it cannot be

26
determined if the lack of recovery is due to low sequence quality or a problem with
sampling.
The fungal taxa recovered were highly aquatic as expected and in the rough
proportions to be expected as well (Goh and Hyde 1996; Shearer et al. 2007; Hu et al.
2013). A low-level recovery of terrestrial fungal phyla was observed across all sites.
While there was some variation between sites, the Ascomycota and Chytridiomycota
were the highest represented phyla overall. One surprise is the recovery of
Rozellomycota in such high numbers, this basal group of Fungi are pathogens to a
number of micro-organisms including other Fungi, oomycetes, and arthropods (Corsaro
et al. 2016).
Figure 3: OTU Abundance of phyla at Mardee Lake. X-axis varies by site.
0 200 400 600 800 1000 1200 1400
Ascomycota
Basidiomycota
Blastocladiomycota
Chytridiomycota
Entorrhizomycota
Glomeromycota
Monoblepharomycota
Mortierellomycota
Mucormycota
Rozellomycota
Neocallimastigomycota
Chromista
Metazoa
Protozoa
Rhizaria
Unidentified
OTU Abundance (reads)
Ph
yla

27
Figure 4. OTU abundance at Swamp Creek. X-axis varies by site.
Figure 5. OTU abundance at Swamp Lake. X-axis varies by site.
0 20 40 60 80 100 120 140 160 180
Ascomycota
Basidiomycota
Blastocladiomycota
Chytridiomycota
Entorrhizomycota
Glomeromycota
Monoblepharomycota
Mortierellomycota
Mucormycota
Rozellomycota
Neocallimastigomycota
Chromista
Metazoa
Protozoa
Rhizaria
Unidentified
OTU Abundance (reads)
Ph
yla
0 500 1000 1500 2000 2500 3000 3500 4000 4500 5000
Ascomycota
Basidiomycota
Blastocladiomycota
Chytridiomycota
Entorrhizomycota
Glomeromycota
Monoblepharomycota
Mortierellomycota
Mucormycota
Rozellomycota
Neocallimastigomycota
Chromista
Metazoa
Protozoa
Rhizaria
Unidentified
OTU Abundance (reads)
Ph
yla

28
Figure 6. OTU abundance at Gold Creek Stockpile. X-axis varies by site.
As a survey of the Snoqualmie Pass corridor, the species accumulation curve
shown in Figure 7 shows that, with only four samples, the data is approaching the OTU
plateau; suggesting that a significant amount of the sampled population was recovered.
The species accumulation curve indicates that as a survey method, the metabarcoding
approach is an efficient method to observe the sampled habitats.
0 200 400 600 800 1000 1200 1400
Ascomycota
Basidiomycota
Blastocladiomycota
Chytridiomycota
Entorrhizomycota
Glomeromycota
Monoblepharomycota
Mortierellomycota
Mucormycota
Rozellomycota
Neocallimastigomycota
Chromista
Metazoa
Protozoa
Rhizaria
Unidentified
OTU Abundance (reads)
Ph
yla

29
Figure 7: OTU accumulation curve of all sites. Error bars sampled randomly 1000 times.
Traditional Diversity
In terms of alpha diversity measures, shown in Table 3, lower richness and
abundance were observed at Swamp Creek. Swamp Creek is comparable to Mardee
Lake and Gold Creek Stockpile in mean reads per OTU at 7.3, 12, and 10 respectively.
Swamp Lake had the highest mean individuals per OTU but scored the lowest in both
diversity indices, indicating that this mean was likely heavily skewed by high abundance
of the dominant OTUs. Gold Creek Stockpile was the most diverse site by both diversity
indexes, likely influenced by it having the highest richness. Of note, Shannon’s index was
not much higher for Gold Creek Stockpile compared to the other sites, but the Inverse-
Simpson’s index indicates that it is likely not as heavily dominated as the other sites
which all scored similarly.

30
Table 3: Alpha diversity indices measured at each site.
Index Sites
Mardee Lake
Swamp Creek
Swamp Lake
Gold Creek Stockpile
Richness 210 80 237 477
Abundance 2 528 586 12 603 4 764
Mean individuals per OTU 12.0 7.3 53.2 10.0
Shannon’s diversity 3.0 2.8 2.5 4.3
Inverse-Simpson's 8.0 8.7 7.2 21.0
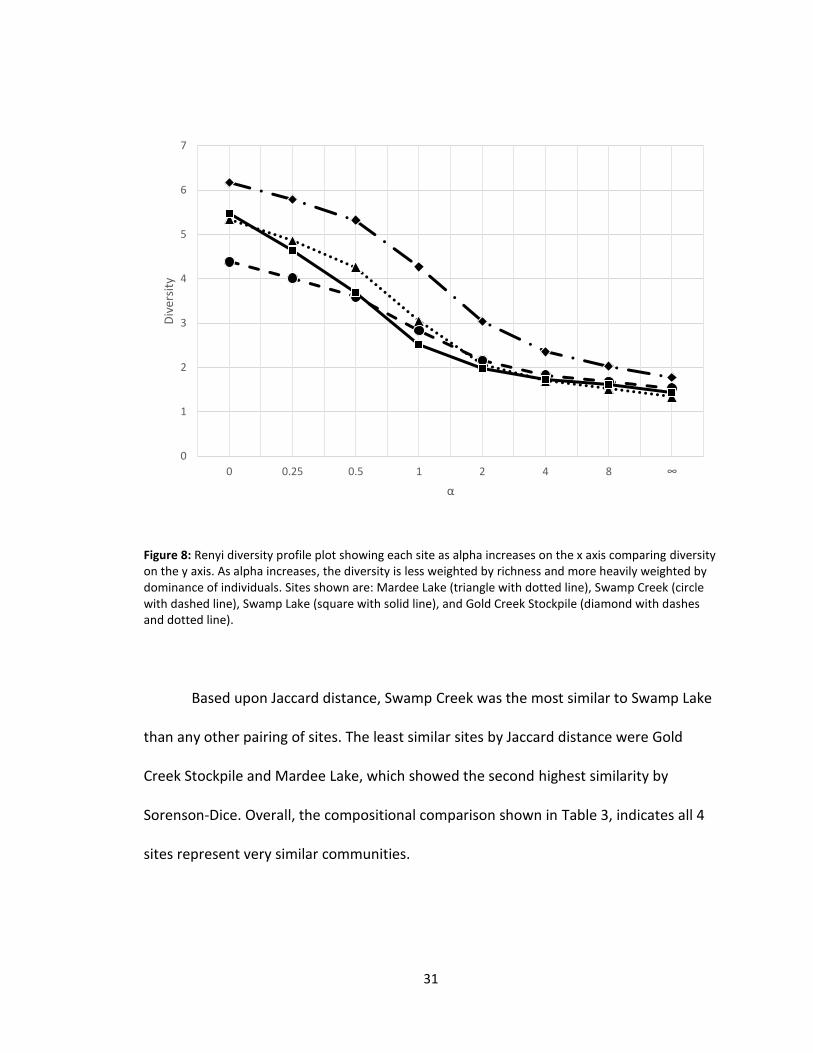
The Renyi diversity profile plot shown in Figure 8, compares the diversity values
of each site as dominance increases to assess community structure. Gold Creek
Stockpile at all points is higher at all points than the other three sites as a result of
higher abundance. The similarity of the curves observed indicate that the community
structures at each site were also similar. Swamp Creek had a slightly flatter profile,
indicating that is slightly more evenly distributed.
The Sorenson-Dice index (Table 4) and Jaccard distances (Table 5) evaluate the
beta-diversity of the four sites. These indices identify compositional differences
between sites. While Gold Creek Stockpile differed most from Mardee Lake by Jaccard
distance, but Swamp Creek by Sorenson-Dice index. Swamp Creek overall was the least
similar to all other sites by Sorenson-Dice index, this could be due to Swamp creek
having the lowest overall richness of only 80 OTUs, all other sites had greater than 210
OTUs.
31
Figure 8: Renyi diversity profile plot showing each site as alpha increases on the x axis comparing diversity on the y axis. As alpha increases, the diversity is less weighted by richness and more heavily weighted by dominance of individuals. Sites shown are: Mardee Lake (triangle with dotted line), Swamp Creek (circle with dashed line), Swamp Lake (square with solid line), and Gold Creek Stockpile (diamond with dashes and dotted line).
Based upon Jaccard distance, Swamp Creek was the most similar to Swamp Lake
than any other pairing of sites. The least similar sites by Jaccard distance were Gold
Creek Stockpile and Mardee Lake, which showed the second highest similarity by
Sorenson-Dice. Overall, the compositional comparison shown in Table 3, indicates all 4
sites represent very similar communities.
0
1
2
3
4
5
6
7
0 0.25 0.5 1 2 4 8 ∞
Div
ersi
ty
α

32
Table 4: Sorenson-Dice index matrix comparing each pair of sites.
Sorensen-Dice Mardee Lake Swamp Creek Swamp Lake
Swamp Creek 0.3399
Swamp Lake 0.4838 0.3123
Gold Creek Stockpile 0.4865 0.3037 0.5014
Table 5: Jaccard distance index matrix comparing each pair of sites.
Jaccard Distance Mardee Lake Swamp Creek Swamp Lake
Swamp Creek 0.8262
Swamp Lake 0.8444 0.9528
Gold Creek Stockpile 0.7525 0.8700 0.8250
Functional Diversity
The functional diversity at each site was determined using FUNGuild to assign
trophic modes to each OTU. Gold Creek showed more than double the proportion of
symbiotrophic individuals compared to the other 3 sites as shown in Figure 9.
Symbiotrophic individuals represent mycorrhizal Fungi and lichenized Fungi which are
symbionts with another species; symbiotrophs are typically hard to detect due to
limited spore production compared to other Fungi. Mycorrhizal and lichenized Fungi are
almost exclusively found in terrestrial habitats. Saprotrophic individuals were the most
heavily represented overall, showing the highest proportion of assigned individuals.
Microfungi make up the majority of representatives from the pathotroph-saprotroph-
symbiotroph mode; this group is the second most represented across all sites and
represents individuals that are adaptable to their environment, capable of occupying a

33
variety of habitat niches. However, 91.22% of all individuals were not able to be
assigned by FUNGuild due to lack of information in the underlying database which relies
upon published research for trophic mode assignments. OTU’s aligned with sequences
for Cladosporium sp., the most common genus of fungal spore in the air, was unassigned
despite being found more frequently than any other Fungi due to a lack of research
supporting an assignment.
Figure 9: Proportion of assigned OTUs for each trophic mode at each site. Gold Creek Stockpile is black, Swamp Lake is light grey, Swamp Creek is white, and Mardee Lake is dark grey.
0 0.1 0.2 0.3 0.4 0.5 0.6
Pathotroph
Pathotroph-Saprotroph
Pathotroph-Saprotroph-Symbiotroph
Pathotroph-Symbiotroph
Saprotroph
Saprotroph-Symbiotroph
Symbiotroph
Proportion of Assigned OTUs
Tro
ph
ic M
od
e

34
CHAPTER IV
DISCUSSION
Nanopore Metabarcoding
The Oxford Nanopore MinION was chosen for its ability to sequence the entire
ITS region at a lower cost compared to Pyrosequencing at the time of this study. The
lower basecalling accuracy of the minION (~90% for the R9 chemistry used in this study)
compared with its competitors Illumina (99.5%) and Sanger sequencing (99.9%) also
presented challenges for bioinformatics and reduced confidence in OTU assignments.
(Jain et al. 2016; Winand et al. 2020).
The inability to perform traditional sequence quality checks, for example
chimera checking, contributed to this lack of confidence. The low basecall accuracy also
hindered phylogenetic distance analysis to assign phylotype, as sequences are only as
close as the accuracy of the sequencer allows. Phylotype assignment typically occurs at
97% similarity, at ~90% accuracy all samples fall outside of that threshold just by
random error, so nearly all individuals would appear as a unique phylotype. The high
insertion, deletion, and gap error in Nanopore data prevented the use of standardized
bioinformatics tools, such as Qiime (http://qiime.org/) and Mothur
(https://mothur.org/), forcing analysis to rely on Nanopore specific tools still in
development.
The throughput achieved in this experiment was 322 711 reads, which is
considerably less than the yield from current Illumina chemistry of greater than 1 million

35
paired end reads per sample, but significantly greater than achievable with Sanger
sequencing which only produces one sequence per sample (Sanger 1977; Winand et al.
2020). However, differences in throughput between samples created problems with
ecological analyses. This could be due to variations in pore availability between the two
flow cells used or due to non-nucleotide contamination in prepared libraries. All
sequencing libraries were processed using the same reagent lots, so reagent and
preparation variability is minimal. Ultimately, throughput inequality showed to be an
influential factor in ecological analyses performed in this study.
As used in this study, the minION was determined to be less than ideal for ITS
metabacoding; however, the minION has been shown to be better suited for genome
sequencing where the depth of coverage and long read lengths can help to error correct
and aid alignment to templates (Laver et al. 2015; Greig et al. 2019). While
advancements in chemistry have increased accuracy, currently 98.3%, from the R9.2
chemistry used in this experiment, the lack of Nanopore specific bioinformatic tools for
barcoding is a hinderance for its use for ITS metabarcoding (Morrison et al. 2020).
Variability in flow cell throughput makes consistency difficult and the increased
cost of using a new flow cell for every sample makes this technology comparable in cost
to Pyrosequencing. Illumina sequencing has come down considerably in cost and current
read lengths allow for full sequencing of the ITS (Rocchi et al. 2017). These factors make
Illumina a much more promising technology for metabarcoding moving forward.
Sequence data generated by the Illumina chemistry can also be used with most
bioinformatics tools currently available.

36
eDNA Methods
The methods used in this study, eDNA sampling with a single filtration step, were
designed to have as little bias as possible. By performing a single filtration, spore loss
due to repeated filtration was reduced as well as cost. While members of Chromista
were captured, the water molds present near western toad and cascades frog mating
sites were unable to be assessed.
The Chromista OTUs accounted for 17.3% of all reads, with 3 544 individuals
matched across all sites. The only 2 Chromista OTU references initially matched are from
uncultured DNA found in 2 different soil studies (Hollister et al. 2010; Lan 2015). No
other taxonomic information was available for these sequences. The follow up analysis
recovered low levels of Phyophthora and Pythium (<5% of previously matched
Chromista sequences) which are plant pathogenic oomycetes. One possibility is the lack
of recovery is due to poor sequence quality and that the sampling methods used in this
experiment captured zoospores. Another possibility is that close relatives of the
oomycetes were recovered and not the oomycetes themselves since oomycete
references were confirmed to be included in the database used for OTU assignment.
The last possibility is that the chemotactic ability of oomycetes keeps individuals closer
to the egg mass then can be sampled (Van West et al. 2002). However, without more
accurate sequence data, it is unclear why the survey failed to recover oomycetes.
A comparison study was considered using culture methods or collection of
infected eggs at the same time water samples were taken, there was sufficient funds

37
available to Sanger sequence any isolates. Morphological identification, as discussed in
the introduction, is problematic, at best individuals could have been identified to genus.
Previous studies at Swamp Lake could have been used as a reference; however, the lack
of recovery of oomycetes means such a comparison is unnecessary.
Fungal Community Recovery
As a survey, the environmental metabarcoding of aquatic samples used in this
study recovered a wide range of Fungi. The phyla recovered were in expected
proportions based upon known aquatic habitat usage among Fungi (Goh and Hyde 1996;
Shearer et al. 2007; Hu et al. 2013). The Chytridiomycota and Ascomycota were the two
most abundant groups across all sites; chytrids are a water adapted group which
produces motile spores, and the Ascomycota includes ubiquitous saprotrophs capable of
utilizing a wide range of habitats. The recovery of terrestrial phyla could be due to the
lakes, ponds, and creeks sampled being shallow enough to allow terrestrial Fungi to
grow or they could be acting as a spore sink for airborne spores. Lakes have been shown
to act as pollen and spore sinks allowing study of past flora from waterbed sediments
(Mudie et al. 2021). The methods used in this study could provide an avenue for the
survey of aquatic fungal communities and to a lesser degree the survey of spore
availability in the surrounding forest.
The survey conducted in this experiment is a proof of concept for the eDNA
methods and minION sequencer used. As shown in Figure 7, the majority of OTUs
present collected by the methods used were recovered in just 4 samples. However, it is

38
likely that the number of OTUs captured is likely smaller than what the data suggests.
Due to the basecalling error rate of the minION chemistry used in this study, the
alignment accuracy of the sequences likely produced false OTUs. The ITS region being
600-800bp long, does not require a large difference in sequence to identify an organism;
so, it is likely that the random error of the Nanopore sequence data could cause a false
match to an OTU not actually present in the sample. Additionally, the inability to
perform chimera checking during data analysis means there are likely some OTUs that
represent chimeric sequences or closely related species not present in the sites
sampled.
The analysis workflow used in this experiment generally follows workflows from
established pipelines such as PIPITS for Illumina data (Gweon et al. 2015). The main
difference being the separation of the ITS1 and ITS2 sequences for each read done by
PIPITS allowing chimera checking and determining OTUs based upon distance between
sequences rather than by match quality to refence sequences. As stated above, the
phylogenetic distance from Nanopore data is only as close as the error rate allows us to
observe. Assignment of OTUs based upon match to reference, as opposed to
phylogenetic distance, is less representative of the individuals present; especially with
high error causing closely related species to be matched falsely. These factors likely
produced an overly diverse appearing dataset, with higher species richness than present
in the water column.

39
Traditional Diversity
Ecological diversity observed was very similar among the sites sampled. Gold
Creek Stockpile stood out in most diversity measures, as the site with the highest
richness. Inverse-Simpson’s index indicated that Gold Creek Stockpile was less
dominated by few OTUs than the other sites. The Renyi diversity profile plot in Figure 8
showed that all sites had similar community structure. The experimental design of this
project, as a result of funding limitations, did not allow for sample replication; as such,
traditional comparisons of diversity indices, such as ANOVA or Kruskal-Wallis test, were
not able to be performed.
Compositionally, all 4 sites appeared very similar by Sorenson-Dice and Jaccard
distance measures. It is possible with more accurate sequencing, and subsequent OTU
assignment, that variances detected by diversity indices would equalize. More even
throughput could also influence the diversity index values; especially the Sorenson-Dice
index which appeared to be more sensitive to the differences in richness observed.
Statistical methods have been proposed for correcting for unequal throughput when
statistically comparing index values between sites and could improve the fidelity of
Nanopore data when evaluating community structure (Willis 2019).
Functional Diversity
The trophic mode assessment performed using FUNGuild, confirmed that the
individuals observed at Gold Creek Stockpile were slightly anomalous compared to the

40
other 3 sites. Symbiotrophic individuals were higher at Gold Creek Stockpile. These
individuals are almost exclusively terrestrial mycorrhizae and lichenized Fungi. As
expected, most individuals recovered were saprotrophic, almost all Fungi utilize some
amount of saprotrophism. Microfungi were the second most abundant group found
belonging to the pathotroph-saprotroph-symbiotroph mode. Microfungi produce a large
number of spores and can utilize a wide range of habitats and niches. Overall, there was
not much difference in functional diversity between the 4 sites. This result was not
particularly surprising given the similarity in sites sampled for this experiment. However,
the incomplete nature of the FUNGuild database left the majority of OTUs, 91.2%
overall, with unassigned trophic modes. A more complete database could provide a
more accurate evaluation of the trophic distribution of OTUs recovered.
Future Research
Further PCR optimization could produce better throughput for the oomycetes;
however, a more effective approach would probably be to use ITS primers more specific
to oomycetes. Subsequent to this study, oomycete specific ITS primers have been
developed (Riit et al. 2016). With better targeted ITS primers combined with a more
accurate sequencing technology, the eDNA sampling and filtration methods used in this
study could be an effective tool for studying water molds and Fungi (Riit et al. 2016,
Ruiz-Gomez et al. 2019).
A follow up to this study is necessary to determine if the eDNA sampling used in
this study can collect oomycete zoospores near an active site of amphibian

41
saprolegniasis. A study using oomycete specific primers with Illumina chemistry, should
provide sufficient data to determine if pathogenic oomycetes can be recovered via the
sampling methods used in this study. If successful, future studies should explore the
sampling biases of this approach, such as sampling depth, location, and time of
collection, as an important next step before more complex ecological comparisons can
be made using this study’s methodology.
If unsuccessful at capturing zoospores near infections, sampling locality could be
varied to determine if potential pathogens are available for capture away from active
saprolegniasis; if they are, the absence of individuals near infections if found
consistently elsewhere could be inferred as an indicator of pathogenicity. Confirmation
of this could be determined by an infected egg collection at the same time of sampling
and metabarcoding analysis of individuals recovered to confirm their presence at
infection.
Future fungal ecological studies, using the environmental metabarcoding
methods of this experiment, are certainly promising. Fungal specific ITS primers and
optimized PCR conditions could further improve recovery of Fungi and more accurate
basecalling could provide better fidelity of aquatic fungal communities. As with the
oomycetes, exploration of sampling biases is an important next step before more
complex ecological comparisons can be made using this study’s sampling and filtering
methodology.

42
Conclusions
In conclusion, the minION sequencer and environmental metabarcoding
methods used in this study failed to survey the oomycetes. The R9.2 flow cell chemistry
used in this experiment did not provide basecalling accuracy or subsequent sequence
matching sufficient for confident OTU assignment to species or genus. Throughput
inconsistency between samples also influenced ecological analyses. Overall, the
Nanopore sequencer was not optimal for the environmental metabarcoding approach
used in this study. To improve oomycete recovery, the PCR optimization strategy used in
this study could be improved by using oomycete specific ITS primers that had not been
developed at the time of this study (Riit et al. 2016). Improved oomycete DNA
amplification combined with a more accurate sequencing platform, such as Illumina or
Pyrosequencing, could be used to determine if the sampling approach used in this study
is effective at capturing zoospores.
Fungal recovery in this study was higher than anticipated. Phyla composition
reflects high abundance in aquatic taxa with lower recovery of terrestrial taxa. Alpha
and beta diversity analyses were affected by throughput inequality. As a result, all four
sites appeared very similar in composition and community structure. Trophic mode
analysis also returned expected results based upon taxa recovered. Further expansion of
the FUNGuild database is important to increase confidence trophic modes and guilds
represented in analyses are close to sampled populations.

43
Future studies should refine methodology for both oomycete and Fungi.
Exploration of methodological biases is an important step to more complex ecological
questions of aquatic habitats.

44
REFERENCES
Ahmadian A, Ehn M, Hober S. 2006. Pyrosequencing: History, biochemistry and future. Clinica Chimica Acta. 363(1):83–94. doi:10.1016/j.cccn.2005.04.038.
Arcate JM, Karp MA, Nelson EB. 2006. Diversity of Peronosporomycete (Oomycete) communities associated with the rhizosphere of different plant species. Microb Ecol. 51(1):36–50.
Ault KK, Johnson JE, Pinkart HC, Wagner RS. 2012. Genetic comparison of water molds from embryos of amphibians Rana cascadae, Bufo boreas and Pseudacris regilla. Dis of aquat org. 99(2):127–137. doi:10.3354/dao02456.
Banks B, Beebee TJC. 1988. Reproductive success of natterjack toads Bufo calamita in two contrasting habitats. J of Anim Ecol. 57(2):475–492. doi:10.2307/4919.
Bartelt PE, Peterson CR, Klaver RW. 2004. Sexual differences in the post-breeding movements and habitats selected by western toads (Bufo boreas) in southeastern Idaho. Herpetologica. 60(4):455–467.
Beakes GW, Glockling SL, Sekimoto S. 2012. The evolutionary phylogeny of the oomycete “fungi.” Protoplasma. 249(1):3–19. doi:10.1007/s00709-011-0269-2.
Beakes GW, Thines M. 2017. Hyphochytriomycota and Oomycota. In: Archibald JM, Simpson AGB, Slamovits CH, Margulis L, Melkonian M, Chapman DJ, Corliss JO, editors. Handbook of the protists. Springer International Publishing. 435-505.
Beebee TJC, Griffiths RA. 2005. The amphibian decline crisis: A watershed for conservation biology? Biol Cons. 125(3):271–285. doi:10.1016/j.biocon.2005.04.009.
Bienentreu J-F, Lesbarrères D. 2020. Amphibian disease ecology: Are we just scratching the surface? Herpetologica. 76(2):153–166. doi:10.1655/0018-0831-76.2.153.
Blaustein AR, Grant Hokit D, O’Hara RK, Holt RA. 1994. Pathogenic fungus contributes to amphibian losses in the pacific northwest. Biol Cons. 67(3):251–254. doi:10.1016/0006-
3207(94)90616-5.
Blaustein AR, Kiesecker JM. 2002. Complexity in conservation: lessons from the global decline of amphibian populations. Ecol Lett. 5(4):597–608. doi:10.1046/j.1461-0248.2002.00352.x.
Blaustein AR, Romansic JM, Kiesecker JM, Hatch AC. 2003. Ultraviolet radiation, toxic chemicals and amphibian population declines. Divers and Dist. 9(2):123–140. doi:10.1046/j.1472-4642.2003.00015.x.

45
Brady SF. 2010. Virulence of three Saprolegnia species on amphibian embryos. [Ellensburg, WA]: Central Washington University.
Cavalier-Smith T, Chao EE-Y. 2006. Phylogeny and megasystematics of phagotrophic heterokonts (kingdom Chromista). J Mol Evol. 62(4):388–420. doi:10.1007/s00239-004-0353-8.
Choi Y-J, Beakes G, Glockling S, Kruse J, Nam B, Nigrelli L, Ploch S, Shin H-D, Shivas RG, Telle S, et al. 2015. Towards a universal barcode of oomycetes – a comparison of the cox1 and cox2 loci. Mol Ecol Resc. 15(6):1275–1288. doi:https://doi.org/10.1111/1755-0998.12398. http://onlinelibrary.wiley.com/doi/abs/10.1111/1755-0998.12398.
Cohen NW, Stebbins RC (Robert C. 1995. A natural history of amphibians. Princeton, N.J.: Princeton, N.J. : Princeton University Press (Cohen NW, editor).
Corsaro D, Michel R, Walochnik J, Venditti D, Müller K-D, Hauröder B, Wylezich C. 2016. Molecular identification of Nucleophaga terricolae sp. nov. (Rozellomycota), and new insights on the origin of the Microsporidia. Parasitol Res. 115(8):3003–3011. doi:10.1007/s00436-016-5055-9.
Davison PI, Créach V, Liang W-J, Andreou D, Britton JR, Copp GH. 2016. Laboratory and field validation of a simple method for detecting four species of non-native freshwater fish using eDNA. J of Fish Biol. 89(3):1782–1793. doi:10.1111/jfb.13086.
Dick MW. 1976. The ecology of aquatic Phycomycetes. In: Gareth Jones EB, editor. Recent advances in aquatic mycology. London: Paul Elek. p. 513–542.
Dick MW. 2001. The Peronosporomycetes. In: Esser K, editor. The mycota VII part A. Berlin: Springer-Verlag. p. 39–72.
Diéguez-Uribeondo J, Fregeneda-Grandes JM, Cerenius L, Pérez-Iniesta E, Aller-Gancedo JM, Tellería MT, Söderhäll K, Martín MP. 2007. Re-evaluation of the enigmatic species complex Saprolegnia diclina–Saprolegnia parasitica based on morphological, physiological and molecular data. Fung Gen and Biol. 44(7):585–601. doi:10.1016/j.fgb.2007.02.010.
Earle G, Hintz W. 2014. New approaches for controlling Saprolegnia parasitica, the causal agent of a devastating fish disease. Trop Life Sci Res. 25(2):101–109.
Fernandez-Beneitez MJ, Ortiz-Santaliestra ME, Lizana M, Dieguez-Uribeondo J. 2008. Saprolegnia diclina: another species responsible for the emergent disease “Saprolegnia infections” in amphibians. FEMS Microbiol Lett. 279(1):23–29
Fernández-Benéitez M, Ortiz-Santaliestra M, Lizana M, Diéguez-Uribeondo J. 2011. Differences in susceptibility to Saprolegnia infections among embryonic stages of two anuran species. Oecologia. 165:819–26. doi:10.1007/s00442-010-1889-5.

46
Goh TK (The U of HK Hong Kong), Hyde KD. 1996. Biodiversity of freshwater fungi. J of ind microbiol & biotech. 17(5/6):328–345. doi:10.1007/BF01574764.
Goldberg CS, Pilliod DS, Arkle RS, Waits LP. 2011. Molecular detection of vertebrates in stream water: A demonstration using Rocky Mountain tailed frogs and Idaho giant salamanders. PLoS ONE. 6(7):e22746. doi:10.1371/journal.pone.0022746.
Greig DR, Jenkins C, Gharbia S, Dallman TJ. 2019. Comparison of single-nucleotide variants identified by Illumina and Oxford Nanopore technologies in the context of a potential outbreak of Shiga toxin–producing Escherichia coli. GigaScience. 8(8). doi:10.1093/gigascience/giz104. [accessed 2021 Jul 27]. https://doi.org/10.1093/gigascience/giz104.
Gweon HS, Oliver A, Taylor J, Booth T, Gibbs M, Read DS, Griffiths RI, Schonrogge K. 2015. PIPITS: an automated pipeline for analyses of fungal internal transcribed spacer sequences from the Illumina sequencing platform. Meth in Ecol and Evol. 6(8):973–980. doi:10.1111/2041-210X.12399.
Hammerson G, Pearl C. 2004 Apr 30. IUCN red list of threatened species: Rana cascadae. IUCN red list of threat spec. [accessed 2021 Jul 22]. https://www.iucnredlist.org/en.
Hardham AR. 2001. The cell biology behind Phytophthora pathogenicity. Australasian Pl Path. 30(2):91–98. doi:10.1071/AP01006.
Hassan SED, Boon E, St-Arnaud M, Hijri M. 2011. Molecular biodiversity of arbuscular mycorrhizal fungi in trace metal-polluted soils. Mol Ecol. 20(16):3469–3483. doi:10.1111/j.1365-294X.2011.05142.x.
Hatch AC, Blaustein AR. 2000. Combined effects of UV-B, nitrate, and low pH reduce the survival and activity level of larval cascades frogs (Rana cascadae). Arch Environ Contam Toxicol. 39(4):494–499. doi:10.1007/s002440010132.
Hebert PDN, Cywinska A, Ball SL, deWaard JR. 2003. Biological identifications through DNA barcodes. Proc R Soc Lond B. 270(1512):313–321. doi:10.1098/rspb.2002.2218.
Hecker KH, Roux H. 1996. High and low annealing temperatures increase both specificity and yield in touchdown and stepdown PCR. BioTechniques. 20(478–485):7.
Ho HH. 1975. Observations on the behavior of zoospores of a Saprolegnia species. Mycologia. 67(2):425–428. doi:10.2307/3758436.
Hollister EB, Schadt CW, Palumbo AV, James Ansley R, Boutton TW. 2010. Structural and functional diversity of soil bacterial and fungal communities following woody plant encroachment in the southern Great Plains. Soil Biol and Biochem. 42(10):1816–1824. doi:10.1016/j.soilbio.2010.06.022.

47
Horton TR, Bruns TD. 2001. The molecular revolution in ectomycorrhizal ecology: peeking into the black-box. Mol Ecol. 10(8):1855–1871. doi:10.1046/j.0962-1083.2001.01333.x.
Hu D-M, Liu F, Cai L. 2013. Biodiversity of aquatic fungi in China. Mycology. 4(3):125–168. doi:10.1080/21501203.2013.835752.
Hulvey JP, Padgett DE, Bailey JC. 2007. Species boundaries within saprolegnia (Saprolegniales, Oomycota) based on morphological and DNA sequence data. Mycologia. 99(3):421–429.
Huxley TH. 1881. A contribution to the pathology of the epidemic known as the “salmon disease.” Proc of the R Soc of Lond. 33:380–389.
IUCN SSC Amphibian Specialist Group. 2020. Anaxyrus boreas (amended version of 2015 assessment). The IUCN red list of threatened species 2020: e.T3179A176026188. https://dx.doi.org/10.2305/IUCN.UK.2020-3.RLTS.T3179A176026188.en. Downloaded on 22 July 2021.
Jain M, Fiddes IT, Miga KH, Olsen HE, Paten B, Akeson M. 2015. Improved data analysis for the MinION nanopore sequencer. Nat meth. 12(4):351–356. doi:10.1038/nmeth.3290.
Jain M, Olsen HE, Paten B, Akeson M. 2016. The Oxford Nanopore MinION: delivery of nanopore sequencing to the genomics community. Genome Biol. 17(1):239. doi:10.1186/s13059-016-1103-0.
Janson S, Vegelius J. 1981. Measures of ecological association. Oecologia. 49(3):371–376.
Johnson J, Belmont S, Wagner R. 2008. DNA barcoding as a means to identify organisms associated with amphibian eggs. Herp Cons and Biol. 3.
Johnson Jr. TW. 1956. The genus Achlya: morphology and taxonomy. Ann Arbor: The University of Michigan Press.
Jumpponen A, Jones KL, Mattox JD, Yaege C. 2010. Massively parallel 454-sequencing of fungal communities in Quercus spp. ectomycorrhizas indicates seasonal dynamics in urban and rural sites. Mol Ecol. 19(s1):41–53. doi:10.1111/j.1365-294X.2009.04483.x.
Kiesecker JM, Blaustein AR. 1995. Synergism between UV-B radiation and a pathogen magnifies amphibian embryo mortality in nature. PNAS. 92(24):11049–11052. doi:10.1073/pnas.92.24.11049.
Kiesecker JM, Blaustein AR. 1997. Influences of egg laying behavior on pathogenic infection of amphibian eggs. Cons Biol. 11(1):214–220.
Kiesecker JM, Blaustein AR. 1999. Pathogen reverses competition between larval amphibians. Ecology. 80(7):2442–2448.
48
Kiesecker JM, Blaustein AR, Belden LK. 2001. Complex causes of amphibian population declines. (Cover story). Nature. 410(6829):681. doi:10.1038/35070552.
Kim S, Eom A-H, Park D, Ra N-Y. 2008. Detection of infectious fungal diseases of frogs inhabiting in Korea. Mycobiology. 36(1):10–12. doi:10.4489/MYCO.2008.36.1.010.
Kindt, R., Coe, R. (2005). Tree diversity analysis. A manual and software for common statistical methods for ecological and biodiversity studies. World Agroforestry Centre (ICRAF), Nairobi (Kenya). ISBN 92-9059-179-X, http://www.worldagroforestry.org/output/tree-diversity-analysis.
Krebbs CJ. 2001. Ecology: The experimental analysis of distribution and abundance, 5th Ed. SciTech B N. 25(3):68.
Lamb PD, Hunter E, Pinnegar JK, Creer S, Davies RG, Taylor MI. 2019. How quantitative is metabarcoding: A meta-analytical approach. Mol Ecol. 28(2):420–430. doi:10.1111/mec.14920.
Lan, A.F., (2015). Culture-independent analysis for endophytic fungi diversity of Hanlian (Magnolia soulangeana) [Data set]. Unpublished (915512376). NCBI Nucleotide Database. http://www.ncbi.nlm.nih.gov/nuccore/KP843453.1
Laver T, Harrison J, O’Neill PA, Moore K, Farbos A, Paszkiewicz K, Studholme DJ. 2015. Assessing the performance of the Oxford Nanopore Technologies MinION. Biomol Det and Quant. 3:1–8. doi:10.1016/j.bdq.2015.02.001.
Leclerc MC, Guillot J, Deville M. 2000. Taxonomic and phylogenetic analysis of Saprolegniaceae (Oomycetes) inferred from LSU rDNA and ITS sequence comparisons. Antonie Van Leeuwenhoek. 77(4):369–377. doi:10.1023/A:1002601211295.
Leggett RM, Heavens D, Caccamo M, Clark MD, Davey RP. 2016. NanoOK: multi-reference alignment analysis of nanopore sequencing data, quality and error profiles. Bioinformatics (Oxford, England). 32(1):142–144. doi:10.1093/bioinformatics/btv540.
Lodge DM, Turner CR, Jerde CL, Barnes MA, Chadderton L, Egan SP, Feder JL, Mahon AR, Pfrender ME. 2012. Conservation in a cup of water: estimating biodiversity and population abundance from environmental DNA. Mol Ecol. 21(11):2555–2558. doi:10.1111/j.1365-294X.2012.05600.x.
Loman NJ, Quinlan AR. 2014. Poretools: a toolkit for analyzing nanopore sequence data. Bioinformatics (Oxford, England). 30(23):3399–3401. doi:10.1093/bioinformatics/btu555.
Lucas JA, Shattock R, Shaw D, Cooke L. 1991. Phytophthora : Symposium of the British mycological society, the British society for plant pathology, and the society of Irish plant pathologists held at Trinity College, Dublin, September 1989. Cambridge: Cambridge University Press.

49
Lydolf MC, Jonas Jacobsen, Peter Archander, M. Thomas P. Gilbert, David A. Gilichinsky, Anders J. Hansen, Eske Willerslev, Lene Lange. 2005. Beringian paleoecology inferred from permafrost-preserved fungal DNA. Appl Environ Microbiol. 71(2):1012–1017. doi:10.1128/AEM.71.2.1012–1017.2005.
Magurran AE. 1988. Ecological diversity and its measurement. Princeton University Press. [accessed 2019 Apr 22]. https://press.princeton.edu/titles/4238.html.
Morrison GA, Fu J, Lee GC, Wiederhold NP, Cañete-Gibas CF, Bunnik EM, Wickes BL. 2020. Nanopore sequencing of the fungal intergenic spacer sequence as a potential rapid diagnostic assay. J of Clin Microbiol. 58(12):e01972-20. doi:10.1128/JCM.01972-20.
Mudie PJ, Yanko-Hombach VV, Mudryk I. 2021. Palynomorphs in surface sediments of the North-Western Black Sea as indicators of environmental conditions. Quat Intern. 590:122–145. doi:10.1016/j.quaint.2020.05.014.
Nguyen NH, Song Z, Bates ST, Branco S, Tedersoo L, Menke J, Schilling JS, Kennedy PG. 2016. FUNGuild: An open annotation tool for parsing fungal community datasets by ecological guild. Fung Ecol. 20:241–248. doi:10.1016/j.funeco.2015.06.006.
Nilsson RH, Bok G, Ryberg M, Kristiansson E, Hallenberg N. 2009. A software pipeline for processing and identification of fungal ITS sequences. Source Code Biol Med. 4:1. doi:10.1186/1751-0473-4-1.
O’Brien HE, Parrent JL, Jackson JA, Moncalvo J-M, Vilgalys R. 2005. Fungal community analysis by large-scale sequencing of environmental samples. Appl Environ Microbiol. 71(9):5544–5550. doi:10.1128/AEM.71.9.5544-5550.2005.
Ogram A, Sayler GS, Barkay T. 1987. The extraction and purification of microbial DNA from sediments. J of microbiol meth. 7(2):57–66. doi:10.1016/0167-7012(87)90025-X.
Oksanen J, Blanchet FG, Friendly M, Kindt R, Legandre P, McGlinn D, Minchin PR, O’Hara RB, Simpson GL, Solymos P, et al. 2020. Community Ecology Package. [accessed 2021 Jul 28]. https://cran.r-project.org/web/packages/vegan/vegan.pdf.
Parrent JL, Morris WF, Vilgalys R. 2006. CO2-enrichment and nutrient availability alter ectomycorrhizal fungal communities. Ecology. 87(9):2278–2287. ://000240253000017.
Petrisko JE, Pearl CA, Pilliod DS, Sheridan PP, Williams CF, Peterson CR, Bury RB. 2008. Saprolegniaceae identified on amphibian eggs throughout the Pacific Northwest, USA, by internal transcribed spacer sequences and phylogenetic analysis. Mycologia. 100(2):171–180.
Quail MA, Kozarewa I, Smith F, Scally A, Stephens PJ, Durbin R, Swerdlow H, Turner DJ. 2008. A large genome center’s improvements to the Illumina sequencing system. Nat Meth. 5(12):1005–1010. doi:10.1038/nmeth.1270.

50
R Core Team. 2020. A language environment for statistical computing. Vienna, Austria: R Found for Stat Comp. http://www.R-project.org/.
Resetarits WJ. 1996. Oviposition site choice and life history evolution. Amer Zool. 36(2):205–215.
Riit T, Tedersoo L, Drenkhan R, Runno-Paurson E, Kokko H, Anslan S. 2016. Oomycete-specific ITS primers for identification and metabarcoding. MycoKeys. 14:17–30. doi:10.3897/mycokeys.14.9244. http://mycokeys.pensoft.net/articles.php?id=9244.
Robideau GP, Cock AWAMD, Coffey MD, Voglmayr H, Brouwer H, Bala K, Chitty DW, Désaulniers N, Eggertson QA, Gachon CMM, et al. 2011. DNA barcoding of oomycetes with cytochrome c oxidase subunit I and internal transcribed spacer. Mol Ecol Res. 11(6):1002–1011. doi:10.1111/j.1755-0998.2011.03041.x.
Rocchi S, Valot B, Reboux G, Millon L. 2017. DNA metabarcoding to assess indoor fungal communities: Electrostatic dust collectors and Illumina sequencing. J of Microbiol Meth. 139:107–112. doi:10.1016/j.mimet.2017.05.014.
RStudio Team. 2021. RStudio: Integrated development environment for R. RStudio, PBC, Boston, MA URL http://www.rstudio.com/.
Ruiz Gómez FJ, Navarro-Cerrillo RM, Pérez-de-Luque A, Oβwald W, Vannini A, Morales-Rodríguez C. 2019. Assessment of functional and structural changes of soil fungal and oomycete communities in holm oak declined dehesas through metabarcoding analysis. Sci Rep. 9(1):5315. doi:10.1038/s41598-019-41804-y.
Sandoval-Sierra JV, Martín MP, Diéguez-Uribeondo J. 2014. Species identification in the genus Saprolegnia (Oomycetes): Defining DNA-based molecular operational taxonomic units. Fung Biol. 118(7):559–578. doi:10.1016/j.funbio.2013.10.005.
Sanger F, Coulson AR. 1975. A rapid method for determining sequences in DNA by primed synthesis with DNA polymerase. J of mol biol. 94(3):441,IN19,447-446,IN20,448. doi:10.1016/0022-2836(75)90213-2.
Sanger F, Nicklen S, Coulson AR. 1977. DNA sequencing with chain-terminating inhibitors. PNAS. 74(12):5463–5467. doi:10.1073/pnas.74.12.5463.
Sapp M, Lewis E, Moss S, Barrett B, Kirk S, Elphinstone JG, Denman S. 2016. Metabarcoding of bacteria associated with the acute oak decline syndrome in England. Forests. 7(5):95. doi:10.3390/f7050095.
Schmidt P-A, Bálint M, Greshake B, Bandow C, Römbke J, Schmitt I. 2013. Illumina metabarcoding of a soil fungal community. Soil Biology and Biochemistry. 65:128–132. doi:10.1016/j.soilbio.2013.05.014.

51
Schoch CL, Seifert KA, Huhndorf S, Robert V, Spouge JL, Levesque CA, Chen W, Consortium FB. 2012. Nuclear ribosomal internal transcribed spacer (ITS) region as a universal DNA barcode marker for Fungi. PNAS of the USA. 109(16):6241–6246.
Seifert KA, Samson RA, de Waard JR, Houbraken J, Levesque CA, Moncalvo JM, Louis-Seize G, Hebert PD. 2007. Prospects for fungus identification using CO1 DNA barcodes, with Penicillium as a test case. PNAS of the USA. 104(10):3901–3906
Seymour RL. 1970. The genus Saprolegnia. Nova Hedwigia (Beiheft). 19:1–124.
Shearer CA, Descals E, Kohlmeyer B, Kohlmeyer J, Marvanová L, Padgett D, Porter D, Raja HA, Schmit JP, Thorton HA, et al. 2007. Fungal biodiversity in aquatic habitats. Biodivers Conserv. 16(1):49–67. doi:10.1007/s10531-006-9120-z.
Simpson EH. 1949. Measurement of diversity. Nature (London). 163(4148):688–688. doi:10.1038/163688a0.
Southwood R. 1978. Ecological methods : with particular reference to the study of insect populations. 2nd ed., rev. London : New York: London : Chapman and Hall.
Sparrow FK. 1960. Aquatic Phycomycetes. 2nd rev. ed. Ann Arbor: Ann Arbor : University of Michigan Press.
Stevens RB, Mycological Society of America, Mycology Guidebook Committee. 1974. Mycology guidebook. Seattle: University of Washington Press (Stevens RB, editor).
Stuart, S., Chanson, J. S., Cox, N. A., Young, B. E., Rodrigues, A. S. L., Fishman, D. L. and Waller, R. W. 2004. Status and trends of amphibian declines and extinctions worldwide. - Science 306: 1783-1786.
Taberlet P, Coissac E, Hajibabaei M, Rieseberg LH. 2012. Environmental DNA. Mol Ecol. 21(8):1789–1793. doi:10.1111/j.1365-294X.2012.05542.x.
Truett GE, Heeger P, Mynatt RL, Truett AA, Walker JA, Warman ML. 2000. Preparation of PCR-quality mouse genomic DNA with hot sodium hydroxide and tris (HotSHOT). BioTechniques. 29(1):52, 54.
Ugland KI, Gray JS, Ellingsen KE. 2003. The species–accumulation curve and estimation of species richness. J of Anim Ecol. 72(5):888–897. doi:10.1046/j.1365-2656.2003.00748.x.
Van West P, Morris BM, Reid B, Appiah AA, Osborne MC, Campbell TA, Shepherd SJ, Gow NAR. 2002. Oomycete plant pathogens use electric fields to target roots. MPMI. 15(8):790–798. doi:10.1094/MPMI.2002.15.8.790.

52
Wang GC, Wang Y. 1997. Frequency of formation of chimeric molecules as a consequence of PCR coamplification of 16S rRNA genes from mixed bacterial genomes. Appl and Environ Microbiol. 63(12):4645–4650. doi:10.1128/aem.63.12.4645-4650.1997.
Wardrip CL, Seps SL, Skrocki L, Nguyen L, Waterstrat PR, Li X. 1999. Diagnostic exercise: Fluffy, white, cotton candy-like growth on the gills, fins, and skin of salamanders (Ambystoma tigrinum). Contemp top in lab anim sci. 38(1):81.
Weirather JL, de Cesare M, Wang Y, Piazza P, Sebastiano V, Wang X-J, Buck D, Au KF. 2017. Comprehensive comparison of Pacific Biosciences and Oxford Nanopore Technologies and their applications to transcriptome analysis. F1000Res. 6:100. doi:10.12688/f1000research.10571.2.
White TJ, Bruns T, Lee S, Taylor J. 1990. Amplification and direct sequencing of fungal ribosomal RNA genes for phylogenetics. In: Innis MA, Gelfand DH, Sninsky JJ, White TJ, editors. PCR protocols: a guide to methods and applications. New York: Academic Press, Inc. p. 315–322.
Willis AD. 2019. Rarefaction, alpha diversity, and statistics. Front Microbiol. 0. doi:10.3389/fmicb.2019.02407. [accessed 2021 Jul 27]. https://www.frontiersin.org/articles/10.3389/fmicb.2019.02407/full.
Willoughby LG, Roberts RJ. 1992. Towards strategic use of fungicides against Saprolegnia parasitica in salmonid fish hatcheries. J of fish dis. 15(1):1–13. doi:10.1111/j.1365-2761.1992.tb00631.x.
Winand R, Bogaerts B, Hoffman S, Lefevre L, Delvoye M, Van Braekel J, Fu Q, Roosens NH, De Keersmaecker SC, Vanneste K. 2020. Targeting the 16S rRNA Gene for Bacterial Identification in Complex Mixed Samples: Comparative Evaluation of Second (Illumina) and Third (Oxford Nanopore Technologies) Generation Sequencing Technologies. Int J of Mol Sci. 21(1):298. doi:10.3390/ijms21010298.
Yoshida K, Schuenemann VJ, Cano LM, Pais M, Mishra B, Sharma R, Lanz C, Martin FN, Kamoun S, Krause J, et al. 2013. The rise and fall of the Phytophthora infestans lineage that triggered the Irish potato famine. Baulcombe D, editor. eLife. 2:e00731. doi:10.7554/eLife.00731.