development of equilibrium model of vacuum distillation ...umpir.ump.edu.my/12860/1/fkksa - mohammad...
TRANSCRIPT

III
DEVELOPMENT OF EQUILIBRIUM MODEL OF
VACUUM DISTILLATION FOR
BENZENE/TOLUENE SEPARATION USING
MOSAIC SOFTWARE
MOHAMMAD FIRDAUS BIN SAHDA
Thesis submitted in partial fulfilment of the requirements
for the award of the degree of
Bachelor of Chemical Engineering
Faculty of Chemical & Natural Resources Engineering
UNIVERSITI MALAYSIA PAHANG
JUNE 2015
©MOHAMMAD FIRDAUS BIN SAHDA (2015)

VIII
ABSTRACT
This paper presents development of equilibrium model of vacuum distillation for
benzene/toluene separation using MOSAIC software. The vacuum distillation process
was modeled using MOSAIC software by key in the relevant equations and functions
that related to vacuum distillation. The generated code from MOSAIC then transferred
to MATLAB® environment to get the data for plotting the graph of temperature and
composition profiles of vacuum distillation. The range of temperature in the vacuum
distillation column was from 299 K to 318 K. The separation of benzene and toluene
using vacuum distillation produce high purity of benzene at distillate which was 85 %
of vapour mole fraction at distillate stream. Meanwhile, 92% of vapour mole fraction at
bottom stream was toluene.

IX
ABSTRAK
Tujuan kajian ini dibuat adalah untuk membangunkan model penyulingan vakum dalam
keseimbangan bagi pemisahan benzene/toluene dengan menggunakan perisian
MOSAIC. Proses penyulingan vakum dimodelkan dengan memasukkan persamaan dan
fungsi yang berkaitan penyulingan vakum ke dalam perisian MOSAIC. Kod dihasilkan
daripada MOSAIC kemudian dipindahkan ke persekitaran MATLAB® bagi
mendapatkan data untuk memplot graf profil suhu dan komposisi penyulingan vakum.
Julat suhu dalam ruang penyulingan vakum adalah dari 299 K hingga 318 K. Pemisahan
benzena dan toluena menggunakan penyulingan vakum menghasilkan benzena
berketulenan tinggi dimana 85 % daripada pecahan mol cecair pada aliran sulingan
adalah benzena. Sementara itu, 92 % daripada pecahan mol cecair pada aliran bawah
adalah toluena .

X
TABLE OF CONTENTS
SUPERVISOR’S DECLARATION ............................................................................... IV
STUDENT’S DECLARATION ...................................................................................... V
Dedication ....................................................................................................................... VI
ACKNOWLEDGEMENT ............................................................................................. VII
ABSTRACT ................................................................................................................. VIII
ABSTRAK ...................................................................................................................... IX
TABLE OF CONTENTS ................................................................................................. X
LIST OF FIGURES ....................................................................................................... XII
LIST OF TABLES ....................................................................................................... XIII
NOMENCLATURE .................................................................................................... XIV
1 INTRODUCTION .................................................................................................... 1
1.1 Motivation and statement of problem ................................................................ 1
1.2 Objectives ........................................................................................................... 2
1.3 Scope of this research ......................................................................................... 2
2 LITERATURE REVIEW ......................................................................................... 3
2.1 Vacuum Distillation Column ............................................................................. 3
2.1.1 General Introduction ................................................................................... 3
2.1.2 Advantages of VD ...................................................................................... 3
2.1.3 The drawback of VD ................................................................................... 4
2.2 Benzene and Toluene ......................................................................................... 4
2.2.1 Global market of benzene and toluene ....................................................... 4
2.2.2 Application of benzene and toluene ............................................................ 5
2.2.3 Benzene and Toluene Synthesis ................................................................. 5
2.3 Equilibrium MODEL of VD .............................................................................. 5
2.3.1 Assumptions of VD Models ....................................................................... 5
2.3.2 Mathematical Modelling of EQ .................................................................. 6
2.4 MOSAIC ............................................................................................................ 8
2.4.1 Introduction ................................................................................................. 8
2.4.2 Advantages of Using MOSAIC .................................................................. 8
2.5 Summary ............................................................................................................ 9
3 METHODOLOGY ................................................................................................. 10
3.1 Conditions for Benzene/Toluene VD Column ................................................. 10
3.1.1 Assumptions Used In Modelling .............................................................. 10
3.1.2 Conditions of Benzene/Toluene Separation ............................................. 10
3.2 Procedure of using MOSAIC ........................................................................... 10
4 RESULTS AND DISCUSSION ............................................................................. 18
4.1 Result and Discussion ...................................................................................... 18
4.2 Comparison with Expected Results ................................................................. 20
4.3 Comparison between MOSAIC and other modelling environments ............... 20

XI
5 CONCLUSION ....................................................................................................... 23
5.1 Conclusion........................................................................................................ 23
5.2 Recommendation .............................................................................................. 23
REFERENCES ............................................................................................................... 24
APPENDICES ................................................................................................................ 26

XII
LIST OF FIGURES
Figure 1: The products from VD in refining plant (U.S. Energy Information
Administration, 2012) ........................................................................................... 3
Figure 2: Xylene/Toluene High Purity Distillation Column (Anderson, 1998) ............. 6
Figure 3: Generating of notation ........................................................................... 10
Figure 4: Generating of equation .................................................................................... 11
Figure 5: Generating of function ........................................................................... 12
Figure 6: Process of adding modelling equations .................................................... 12
Figure 7: Process of adding modelling functions .................................................... 13
Figure 8: Process of adding the functions of applications ........................................ 13
Figure 9: Process of setting the input variables ....................................................... 14
Figure 10: Preview of equation system .................................................................. 14
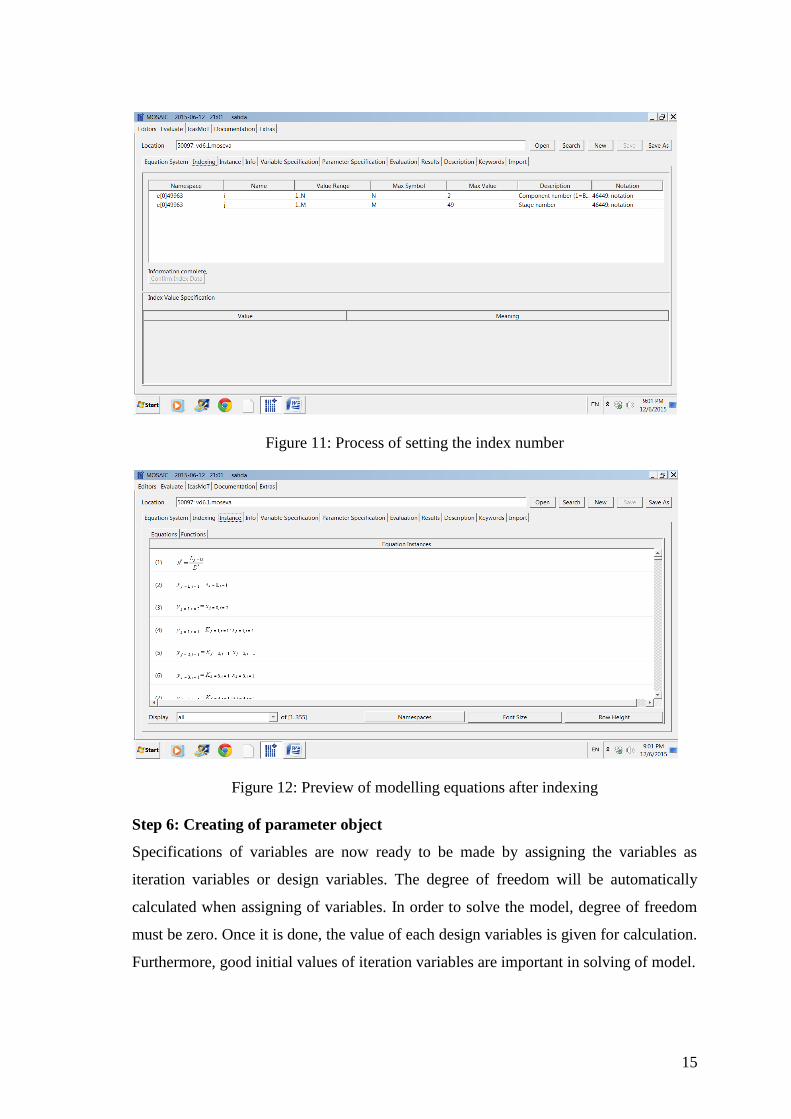
Figure 11: Process of setting the index number ...................................................... 15
Figure 12: Preview of modelling equations after indexing ....................................... 15
Figure 13: Process of setting variable specification ................................................. 16
Figure 14: Process of generating code ................................................................... 16
Figure 15: Process of solving generated code in MATLAB environment .................. 17
Figure 16: Temperature versus stage number ......................................................... 18
Figure 17: Vapour mole fraction versus stage number............................................. 19

XIII
LIST OF TABLES
Table 1: Comparison between Aspen Plus column and simulation result .................. 20
Table 2: Comparison of MOSAIC with other modelling software ............................ 21

XIV
NOMENCLATURE F Feed molar flow rate mol/s
H Enthalpy J/mol
L Liquid molar flow rate mol/s
Mj Molar liquid hold up on stage j mol/s
P Total pressure Pa
Po Saturated vapour pressure Pa
t time s
T Temperature K
V Vapour molar flow rate mol/s
x Liquid composition -
y Vapour composition -
z Feed composition -
Greek letters
ϕ Fugacity coefficient -
γ Activity coefficient -
Subscripts
i Component number
j Stage number
Superscripts
c Total number of components
List of abbreviations
EQ Equilibrium model
Bz Benzene
Tol Toluene
VD Vacuum distillation

1
1 INTRODUCTION
1.1 Motivation and statement of problem
Vacuum distillation (VD) is actually an ordinary distillation but operate at lower
pressure. The lowered pressure in distillation column reduces the boiling point of the
components in the mixture. As the result, VD is commonly used in petrochemical
industry to separate high boiling point hydrocarbon mixture. It also used to avoid
cracking the long chain hydrocarbon if the mixture is subject to high temperature. Many
researchers had produce various research to expand the application of vacuum
distillation such as removal of impurities from crude nickel (Liu et al., 2012), removing
lead from metallic mixture of waste printed circuit boards (X. Li, Gao, & Ding, 2013)
batch operation for sulfuric acid recycling (Jung, Song, Park, Na, & Han, 2014),
removal of impurities from crude lead with high impurities (Kong, Yang, Xiong, Liu, &
Xu, 2014), separation of Sn-Sb alloy(Wang et al., 2014), recovery of titanium from the
slurry formed in crude TiCl4 (Xiang, Wang, Wang, & Chen, 2014), separation of
elemental sulfur from zinc concentrate direct leaching residue (H. Li et al., 2014) and
preparation of Te nano powder (Kim et al., 2014).Toluene and benzene are important
chemicals because these chemical compounds are used as intermediate to produce other
chemicals. Benzene for example is used to produce ethylbenzene, cumene and
cyclohexane. Meanwhile, most of toluene converted to benzene and used to produce
toluene diisocyanate (TDI).
The development and implementation of new models is hard and expensive task. This is
because the complexity and low reusability of process models (Mangold, Motz, &
Gilles, 2002). Although with existence advanced modeling in market, model
formulation and configuration is still time consuming process in process modeling
(Lam, Li, & Xu, 2007).
Modeling of vacuum distillation can be done by using available commercial software
such as MatLab. This software requires the modeler to have extensive knowledge of
process and prone to produce error due to long and complicated codes. Other software
like AspenPlus is more to simulation of the chemical process rather than modeling and
cannot be used to produce custom models.

2
The introduction of MOSAIC modeling software had been a great help for the modeler
to create mathematical models for chemical processes. The unique feature such as latex
enables the user to key in mathematical expression as close as possible to the literatures.
Besides that, MOSAIC enables the code generation and translates it into different kinds
of program code such as C++.
1.2 Objectives
The following are the objectives of this research:
o To explore the modelling of VD of benzene/toluene separation by using
MOSAIC
1.3 Scope of this research
The following are the scope of this research:
i) Modelling of equilibrium(EQ) model of VD by using MOSAIC based on the
given parameters of benzene/toluene separation
ii) Validation of the modelled VD with results from Aspen Plus
iii) Comparison between MOSAIC and other modelling environments.

3
2 LITERATURE REVIEW
2.1 Vacuum Distillation Column
2.1.1 General Introduction
Vacuum distillation (VD) is one of the separation unit found in refinery plant. The
function of VD is to increases the amount of middle distillates and produces lubricating
oil base stock and asphalt. VD is used to prevent cracking long chain hydrocarbons
present in feed (Matar & Hatch, 2000).
Figure 1: The products from VD in refining plant (U.S. Energy Information
Administration, 2012)
.
The working principles of VD is the boiling point of mixture will be decrease when the
pressure is low. The lower boiling point that can achieve in VD compare to atmospheric
distillation had made VD preferable as separation method for heat sensitive material
such as foods, fruit juices, drugs and plant extracts.
2.1.2 Advantages of VD
Besides the reduction of boiling point of mixture, VD also increases the relative
volatility. In vacuum condition materials are more volatile hence more evaporation
takes place. More products will be collected at distillates, hence higher production rate.
By using VD, reduction of energy consumption can be achieved as the result of lower
boiling point of mixtures. Atmospheric distillation column tends to use huge amounts of
energy because of the evaporation process. According to Kunesh et. al (1995), the

4
reboilers of distillation columns use more than half of the process heat distributed to
plant operations. So, VD is good separation alternative to reduce reboiler operating cost
in plant.
The vacuum condition effect the position of azeotropic point for azeotropic mixture by
shifting up the point. Hence, the separation of azeotropic mixture is easier when the
vacuum condition is employed in distillation column (Repke & Klein, 2005).
2.1.3 The drawback of VD
Despite of few advantages of VD, this separation technique has the drawback of
requiring large size of condenser. Vacuum condition reduce the vapour dew point,
hence the condenser loses the driving force for heat transfer which is mean temperature
difference (MTD). More surface area is needed for the condenser to work properly. As
the result, the company has to pay high installation cost (Jung et al., 2014)
2.2 Benzene and Toluene
2.2.1 Global market of benzene and toluene
At present, the Asia-Pacific is the largest consumer of benzene and all of its
downstream derivatives, which consumed more than 45.0% of the total consumption in
2012. Among all the countries, China dominates the benzene market, which consumed
the maximum volume of benzene in 2012. The overall benzene demand is driven by the
producers of ethylbenzene, cyclohexane, and cumene which consuming almost 82.0%
of the total demand in 2012. Cumene manufacturing segment is expected to be the
largest user of benzene which is primarily driven by growing demand for phenol and
acetone (PRNewswire, 2014).
Throughout the world, consumption for toluene in virtually every region was negatively
impacted by the economic recession in 2008 and/or 2009. The developed regions (North
America and Western Europe) declined 8% and 17%, respectively. However, three
regions increased their production of toluene over the same time frame—the Middle
East, Northeast Asia and Southeast Asia. Since 2010, most regions have experienced
growth. The fastest growing regions are Africa, the Indian Subcontinent and Northeast
Asia.

5
However, demand in developing regions such as China, Thailand and the Middle East
saw continued growth during this period. As global economies begin to slowly recover,
toluene markets are anticipated to improve (IHS Chemical, 2013).
2.2.2 Application of benzene and toluene
Benzene and toluene are manufactured from fractions of crude oil distillation. Half of
the benzene manufactured is used to produce ethylbenzene the raw material to make
polystyrene. Another quarter is to produce cumene, which is then use to make phenol
and acetone. Besides that, benzene is use to make cyclohexane, the important
intermediate to make adipic acid and caprolactam. Meanwhile, over 50% of toluene
produced is converted into benzene. Toluene is also used to make TDI (toluene
diisocyanate), important chemical in production polyurethanes. In addition, toluene also
widely used as solvent for alkyd polymers (University of York, 2014)
2.2.3 Benzene and Toluene Synthesis
Nowadays, 80 % of benzene and toluene are primarily produced via:
1. Steam cracking of naphtha
2. Catalytic reforming of naphtha
Small amount of benzene which is about 20 % are produced from toluene using:
1. dealkylation
2. disproportionation (University of York, 2014)
2.3 Equilibrium MODEL of VD
2.3.1 Assumptions of VD Models
There is no available model for benzene/toluene vacuum distillation column but the
assumptions made by Kulkarni (1995) for xylene/toluene column can be used as
guidance. These assumptions were:
1. Each tray is a sieve tray.
2. Vapour holdup on each tray is negligible.
3. Liquid holdup on each tray varies with time.
4. Due to lower pressure, ideal gas behaviour describes the vapour phase.
5. Raoult’s law describes the vapour-liquid equilibrium (VLE) relationship.

6
6. Sensible heat changes on each tray are negligible.
7. Negligible secondary heating effects due to mixing.
8. Reflux from the accumulator is a saturated liquid.
9. The reboiler is an equilibrium stage,
10. All vapour is condensed in the condenser.
Figure 2: Xylene/Toluene High Purity Distillation Column (Anderson, 1998)
2.3.2 Mathematical Modelling of EQ
The first step of modelling begins with mathematical modelling by formulation of
equations to describe processes occurring in RD at the steady state. These formulated
equations or just MESH equations will be required in finding solution of the model. The
letters of MESH stand for material balance equations, phase equilibrium equations,
summation equations and heat balance equations.
Material balance equations
The material balance of every stages of VD can be represented by equation as follow:
Overall material balance
jjjjjjj
jRLVVLF
dt
dM 11

7
Components material balance
R
r
rjrijijjijjijjijjijj
ijjrvxLyVyVxLzF
dt
xdM
1
,,,11,11,,,
,
(Murat, Mohamed, &
Bhatia, 2003)
Since the model is assumed as steady state, and thus the derivative of material balance
will be equal zero. Both j and i are subscripts to represent the stages numbers and
components respectively. F represents feed flow rate, L represents liquid flow rate then
V will represent vapour flow rate. x and y are the mole fraction of liquid and vapour
respectively.
Furthermore, for integrated reactive part of equation, r represents the reaction rate and v
represents the stoichiometry of chemical components. The value of δ will be either 0 or
1 to decide whether reaction occurring at the stages or not. As there is no reaction in
column, the integrated reactive part and the value of δ are assigned zero.
Phase equilibrium equations
P
xPy
o
Phase equilibrium relation equation describes the relationship between liquid mole
fraction and vapour mole fraction of chemical components when vapour and liquid at
equilibrium state. For the ideal condition, the value of activity coefficient, γ and
fugacity, ϕ will be equal to 1. Saturated vapour pressure, Po can be calculated using of
Antoine equation and P is pressure of reactive distillation column.
Summation equations
0.1, c
i
ijx (Liquid phase)
0.1, c
i
ijy (Vapour phase)
From the summation equation, it states that sum of mole fraction of each component in
liquid phase and vapour phase of each stage will be equal to 1.
Enthalpy balance equations.
The energy balance of each stages of VD can be described by equation as follow

8
rj
R
r
R
rjj
V
jj
V
jj
L
jj
F
j
jrHHVHVHLHF
dt
dH,
1
,1111
(Murat et al., 2003)
Again, for the steady state, the derivative of energy balance will be equal to zero. The
reactive part of the equation, ΔH is enthalpy change of chemical reaction, r is the rate of
reaction and δ will decide whether the reaction taking place at each stages or not. The
summation of enthalpy change can be ignored as there is no reaction occurs in the
column.
2.4 MOSAIC
2.4.1 Introduction
MOSAIC is web-based modelling environment that ease the modelling works by:
1. Minimizing the modelling errors.
2. Minimizing the programming effort.
3. Avoiding the errors in documentation.
Encouraging and supporting the cooperative work.(Kuntsche, Barz, Kraus, Arellano-
Garcia, & Wozny, 2011)
2.4.2 Advantages of Using MOSAIC
One of the sources of error in programming of models is the visual difference between
mathematical expressions in documentation and the calculation expression in program
code. In MOSAIC modelling environment, this type of error is minimized by defining
the model equations directly in two-dimensional mathematic expressions. The use of
documentary language standard such as Latex is a good way to define model equations
in mathematic symbolic language.
MOSAIC software has versatile code generation functionality. The output of MOSAIC
is program code that can be use as a solution for simulations problems. The models
created using MOSAIC are independent from programming languages thus can be used
as input for other modelling tool software.
As the MOSAIC is web based software, model data base can be access over the internet.
The data base contain both the model related equations, equation systems and
calculation studies and the necessary data like simulation results, measurement data for

9
model validation, and meta information. These features offer the reusability of the
models created by the various developers.
2.5 Summary
The implementation of VD for separation purpose had brought many benefits in
chemical, food, pharmaceutical and waste treatment industry. The ability of VD to
separate mixture at lower temperature than atmospheric distillation makes it suitable for
heat sensitive materials such as plant extract, protein and polymers.

10
3 METHODOLOGY
3.1 Conditions for Benzene/Toluene VD Column
3.1.1 Assumptions Used In Modelling
The feed that enter the VD column can be assumed to contain only benzene and toluene.
In real situation, the feed usually contain other long chain carbon groups and aromatics.
As the concentration of these components is low it can be neglect.
3.1.2 Conditions of Benzene/Toluene Separation
The data used for modelling the benzene/toluene VD were taken from xylene/toluene
column as it has close chemical and physical properties. The distillate flow rate is
12.066 kmole/min. The feed temperature is 95 °C and entered at tray number 24 from
bottom. There are 49 trays with column diameter of 3.962 m (Anderson, 1998).
3.2 Procedure of using MOSAIC
Step 1: Creating of notation
The symbols with description are created in notation to represent the variables of
equations. Each variable can be represented by base name alone or together with
subscripts and superscripts. A notation can be valid for an entire model or only a small
portion of it. By introducing of subscripts and superscripts, it allows two or more
variables to have similar base name. Besides the creating of symbols for each variable,
the indices required for modelling are created as well in notation.
Figure 3: Generating of notation

11
Step 2: Creating of equation objects
The modelling equations can be created by using of Latex. Latex is a documentary
language which allows equations to be expressed in documentation level. Other than
basic equation systems, MOSAIC only supports differential algebraic equation systems
of first order at the moment (Esche et al., n.d.).
Figure 4: Generating of equation
Step 3: Creating of functions objects
Almost same as creating of equation objects, function objects are created by using Latex
as well. However, the method of creating functions is not as simple as creating of
equations. It may require creating of parameter list object if involving in parameter set
index. Parameter set index allows users to set the index on output variable and
parameters. The specification of output variable and input variables will be required.
The output variable will be the variable that is calculated while the input variables are
almost similar as design variables where the setting of its values will be required.
Lastly, the formula which leads to output variable will be written in form of Latex.

12
Figure 5: Generating of function
Step 4: Creating of equation system
All equations and functions of a model are connected by equation system for evaluation.
Adding of equations to equation system can be done easily, but for adding of functions,
it is required to set the output variables and input variables. Preview of all the added
equations and functions in equation system can be made.
Figure 6: Process of adding modelling equations

13
Figure 7: Process of adding modelling functions
Figure 8: Process of adding the functions of applications

14
Figure 9: Process of setting the input variables
Step 5: Creating of evaluation object
In order to create the evaluation object, the equation system first has to be loaded. Once
it is loaded, indexing can be made by specifying the max value of each index. After
indexing, all the equations and functions involved in modelling can be displayed.
Figure 10: Preview of equation system
15
Figure 11: Process of setting the index number
Figure 12: Preview of modelling equations after indexing
Step 6: Creating of parameter object
Specifications of variables are now ready to be made by assigning the variables as
iteration variables or design variables. The degree of freedom will be automatically
calculated when assigning of variables. In order to solve the model, degree of freedom
must be zero. Once it is done, the value of each design variables is given for calculation.
Furthermore, good initial values of iteration variables are important in solving of model.

16
Figure 13: Process of setting variable specification
Step 7: Code generation and evaluation
MOSAIC is not designed to be full solver as it is not able to solve complex models. The
solving of model can be made by code generation for other modelling environments.
The generated codes can be run at their own environment for the solving of model.
Figure 14: Process of generating code