development of green construction schemes · pdf filedevelopment of green construction schemes...
TRANSCRIPT

DEVELOPMENT OF GREEN CONSTRUCTION
SCHEMES TO REDUCE DEVELOPMENT
FOOTPRINT IN BUILDINGS
Asha S. V.(B070605CE)
Nikhil Menon (B060496CE)
Project Guide: Dr.Arun C

ACKNOWLEDGEMENT
We express our sincere gratitude to our project guide Dr. Arun C for his
valuable guidance rendered for the project work. This coupled with his
whole hearted cooperation and encouragement has made this work an
interesting and rare educational experience for us.
We are extremely happy to mention a great word of gratitude to Dr
Chandrakaran, Head of the Department, for providing us with all facilities
and infrastructure for the completion of this work.
We would also like to extend our gratefulness to all the staff members of the
Civil Engineering department and Department of Architecture, NITC. We also
thank our friends and well wishers who greatly helped us in our endeavour.

Objective:
Minimize Development Footprint – Green
Construction schemes.
Scope:
Reduced footprint -> 4/8 credits for GREEN
Rating acquired.
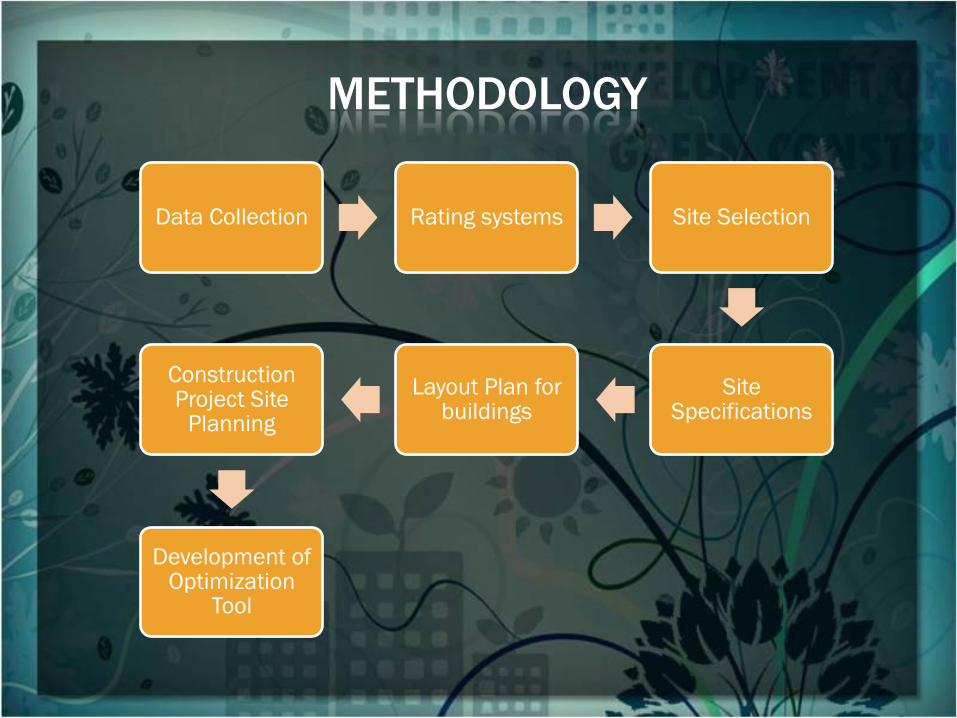
METHODOLOGY
Data Collection Rating systems Site Selection
Site Specifications
Layout Plan for buildings
Construction Project Site
Planning
Development of Optimization
Tool

GREEN STATISTICS

GREEN BUILDINGS
Structures constructed, operated and demolished in a healthy
and resource efficient manner.
Green building practices –
reduce or eliminate negative environmental impacts ,
improve existing unsustainable design,
construction and operational practices.

GREEN BUILDINGS
More immediate benefits-
Reduced operating cost
Enhanced building marketability
Increased worker productivity
Reduced potential liability resulting from indoor air quality
problems.

GREEN BUILDING CERTIFICATION
The Leadership in Energy and Environmental Design (LEED)
Green Building Rating System-Internationally accepted.
Setup -1998 by the United States Green Building Association.
LEED-India-nationally recognized rating system used by IGBC
(Indian Green Building Council)

LEED CERTIFICATION
LEED-INDIA – evaluates performance in the following key areas:
Sustainable site development
Water savings
Energy efficiency
Materials selection
Indoor environmental quality
Sustainable Design

RATING SYSTEM
Based on Points and Pre-requisites in each category.
69 points, 7 prerequisites in 6 categories.
Categories:
Sustainable Sites
Materials and Resources
Water Efficiency
Energy and Atmosphere
Innovation and Design
Indoor Environmental Quality

LEED CERTIFICATION LEVELS
Points are earned when all the pre-requisites are met with.
Certification level Points earned
Certified 26-32
Silver 33-38
Gold 39-51
Platinum 52-69

GREEN CONSTRUCTION IN INDIA
The green footprint in India - increased from 20,000 sq.ft in 2003 to 10million sq.ft in 2008.
Year Projected Certified
Green Buildings
(No.s per year)
Estimated Market
Potential in Million
US$
2006 20 80
2007 50 200
2008 150 500
2012 1000 4000

CII GODREJ CONVENTION CENTRE,HYDERABAD

GREEN CONSTRUCTION IN INDIA
Indian construction sector - growing at a rate of 9.2% . World
average - 5.5% - BOOM….
This growth encourages other manufacturing industries such as
cement, iron, chemicals etc.
The Green Building movement in India started with the
„Platinum Rating‟ obtained by the Green Business Centre
building in Hyderabad in 2003

REDUCING SITE DISTURBANCE
“To conserve existing natural areas and restore damaged
areas to provide habitat and promote biodiversity.”

REDUCING SITE DISTURBANCE
Two parts:
“Protecting or restoring habitat by limiting site disturbance including earthwork and clearing of vegetation, or replacing impervious surfaces with native or adapted vegetation.”
“Reducing the development footprint of the building.”

DEVELOPMENT FOOTPRINT
Development footprint - sum of building footprint,
access roads and parking.
Increase in development footprint results in:
Decrease in water quality
Decrease in vegetative cover
Increase in runoff borne pollutants
Groundwater depletion
Increased erosion and flooding in downstream areas

REDUCTION IN DEVELOPMENT FOOTPRINT
LEED – “the development footprint is to be reduced such that
the open space requirement given by the local zoning laws is
exceeded by 25%. ”
“For areas with no local zoning requirements designate open
space area adjacent to the
building that is equal to the building footprint.”

DECREASING DEVELOPMENT FOOTPRINT
Strategies:
Stacking the building program
Tuck under parking
Sharing facilities with neighbours

IDENTIFICATION OF SITE FOR THE PROJECT
An IT Park under construction in Mangalore, Karnataka.
Site Details:
Terrain - sloping. Slope varying from 20˚to 40˚.
Vegetation - naturally available shrubs.
Annual rainfall-4242.5mm.
Total Area – 68675.615 m2
Total Access Roads Area – 14262.295 m2

IDENTIFICATION OF SITE FOR THE PROJECT
Site Specifications:
9 Buildings – A to I.
E – optional, not considered for reduction of construction area.
15m main roads
8m subsidiary roads
Extensive road network around the site.

IDENTIFICATION OF SITE FOR THE PROJECT

IDENTIFICATION OF SITE FOR THE PROJECT
Areas:
Total plot area = 68,716m2
Total building footprint = 28,636m2
Total road area = 14,262m2
Parking = 7325m2
Development footprint = 50,223m2 (Tbf+Tra+P)

INDIVIDUAL BUILDING FOOTPRINTS
Building Plots Area (in m2) Area around the
building that is unused
(in m2)
Open space around the
building required
according to LEED India-
NC 2007
Block A 4919.833 879.413 3627.92
Block B 4046.797 1103.227 2781.07
Block C 4399.256 1143.186 2397.40
Block D 4918.256 877.836 3627.92
Block E 3000.000 - -
Block F 5145.076 1042.156 3627.92
Block G 8512.353 1708.776 2397.40
Block H 4296.176 1721.276 2397.40
Block I 5032.938 1458.228 3149.71

CURRENT PARKING DATA
Block Area (m2)
A 412.5
B 162.5
C 475
D 412.5
F 475
G 150
H 137.5
I 425
East 1825
West 3350
Total 7825

STRATEGIES TO MINIMIZE PARKING
Parking of vehicles in the building basement (underground
parking)
Promoting alternative transportation (such as low emission
vehicles, car and van pooling)
Reducing the parking space – required parking space for given
occupancy only 2500 m2 acc. to NBC 2005, whereas 7325 m2
provided

UNDERGROUND PARKING
Parking in the basement of each building
separately
Decrease in footprint due to
parking
7325 m2
Footprint before due to
access roads
14262.295 m2
Footprint after
implementation due to
access roads
10783.579 m2
Reduction in development
footprint
21.5%

UNDERGROUND PARKING
Parking in the basements of buildings nearest to gate only
Decrease in footprint due to
parking
7325 m2
Footprint before due to
access roads
14262.295 m2
Footprint after
implementation due to
access roads
6441.092 m2
Reduction in development
footprint
30.2%

ALTERNATIVE TRANSPORTATION
This strategy consists of:
Promoting use of low-emission vehicles
• Alternative fuel vehicles – 3% occupants.
• Preferred Parking with battery chargers.
• Supply facilities – liquid/gaseous form – separate
ventilation facilities – Outdoor.

ALTERNATIVE TRANSPORTATION
Minimizing parking needs
• Adherence to Local Building Bylaws.
Promoting Carpools and Vanpools
• Few people combine to commute – single vehicle->reduce
footprint
• Preferred Parking.

LIGHT POLLUTION CONTROL
“all the site and building mounted luminaries do not produce a
maximum initial luminance value not greater than 0.01
horizontal and vertical foot-candles at the site boundary and
beyond.”
Strategy:
• Site Lighting criteria for safe light levels.
• Avoid night sky pollution & site sky lighting.
DIJKSTRA’S ALGORITHM
Conceived by Dutch computer scientist Edsgar Dijkstra in
1959.
A graph search algorithm – solves single-source shortest path
problem.
Only for non-negative edge path costs
Used in routing.

ILLUSTRATION OF DIJKSTRA’S ALGORITHM

DIJKSTRA’S ALGORITHM
Parameters:
• Distance -> Cost
• Future Use of Path
Factors:
• Main Roads – 0.6
• Subsidiary Roads – 0.8
• Other Roads - 1

DIJKSTRA’S ALGORITHM
Objective:
• Shortest Path
Constraints:
• Site Disturbance
• Native Land undisturbed before const = undisturbed after
const.
• Entry and Exit Points
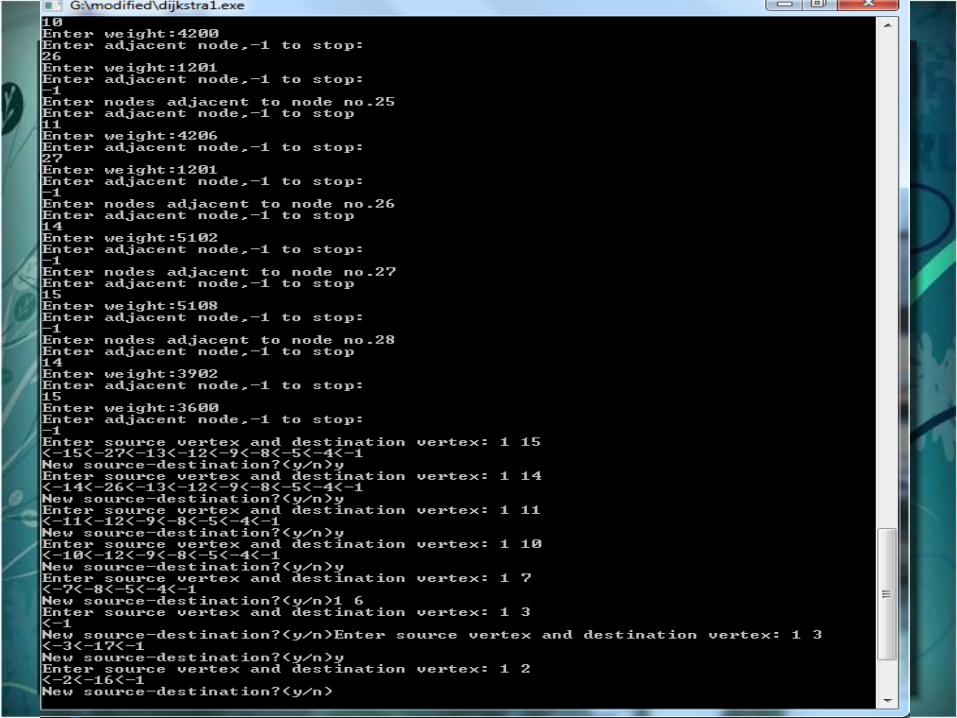

PATH OBTAINED FROM DIJKSTRA’S ALGORITHM

PATH OBTAINED FROM DIJKSTRA’S ALGORITHM

PATH OBTAINED FROM DIJKSTRA’S ALGORITHM

PATH OBTAINED FROM DIJKSTRA’S ALGORITHM

PATH OBTAINED FROM DIJKSTRA’S ALGORITHM

PATH OBTAINED FROM DIJKSTRA’S ALGORITHM

PATH OBTAINED FROM DIJKSTRA’S ALGORITHM

PATH OBTAINED FROM DIJKSTRA’S ALGORITHM

CONCLUSION AND SUMMARY
Main Objective : Reduce development Footprint
Various methods devised – reduce development footprint.
Successful Completion – 4/8 credits for Sustainable Sites ->
GREEN Rating.

REFERENCES
Barnhart, Mitchell (2009). “Green building
Design and Energy Conservation Techniques :
An EPA Perspective”
” Srinivas, “Green Buildings in India – Lessons
Learnt
Castalia Homes (2009). ” Building Green
Materials, Products, Recycling and
Management.”
.

DOE, EPA, US Geological Survey, Worldwatch Institute,
“Chandler Green Building Program (2008).”
IGBC (2007). “LEED INDIA NC Version 1.0 (2007) - Sustainable
Sites, Credits 1-8”
BIS (2005). “National Building Code - SP 7 (2005) - Part 3,
Development Control Rules.”
Central Indiana Housing Society and Green Building Overview

THANK YOU