development of high-resolution rapid refresh (hrrr...
TRANSCRIPT

Development of High-Resolution Rapid Refresh (HRRR) Ensemble Data Assimilation, Forecast
and Post-Processing
Isidora Jankov, Curtis Alexander, David Dowel, Trevor Alcott, Stan Benjamin and EMB
CORP Science Symposium, July 18-19, 2016, Fort Collins

Outline
RAP and HRRR models development including DA Shifting focus toward ensemble DA and forecasting Moving toward next generation of regional rapid-
refresh storm-scale ensemble Starting points in DA Experiments in stochastic physics arena for the
purposes of both DA and forecasting Statistical post-processing

RAP/HRRR: Hourly-Updating Weather Forecast Models
Initial & Lateral Boundary
Conditions
Initial & Lateral Boundary
Conditions
Expanded RAP to match NAM for
SREF
(July 2016)
13-km Rapid Refresh (RAPv3) – to 21h (July 2016)
3-km High-Resolution Rapid Refresh (HRRRv2)
– to 18h (July 2016)
750-m HRRR nest Wind Forecast
Improvement Project Experiment (ongoing)
Prototype 3-km storm-scale HRRR ensemble (HRRRE)
(Spring 2016)
3-km High-Resolution Rapid Refresh Alaska
Testing (HRRR-AK) w/MRMS radar data
(Spring 2016)
3
3-km High-Resolution Time Lagged Ensemble (HRRR-TLE)

Spring 2016 Experimental HRRRE
∆x=15 km
∆x=3 km
BC from GFS
IC mean from RAP, pert from GFS ensemble
Real-Time Web Graphics http://rapidrefresh.noaa.gov/HRRRE

HRRRE Design • Community tools
• WRF for numerical weather prediction • GSI for observation processing and ensemble-prior calculation • EnKF for data assimilation
• Hourly data assimilation from 2100 UTC day 0 to 1800 UTC day 1
• conventional observations only (radar reflectivity soon) • pure ensemble Kalman filter (EnKF)
• variety of scales, including explicit convection, represented in background error covariances from 3-km ensemble
• updated state variables: u, v, T, qv, geopotential, column dry air mass • covariance localization: 500 km horizontal, 0.4 scale height
• Ensemble 12+ h forecasts at selected times
• 18-member forecast at 1500 UTC provides initial and boundary conditions for NEWS-e
• Sources of ensemble spread
• initial condition perturbations from GFS ensemble • model integration • adaptive, multiplicative posterior inflation

HRRRE Resources
6
HRRRE Real-Time System on NOAA R&D “Jet” 2 May - 20 June 2016 (testing in March/April) HRRRE ~650x550 = 357,500 grdpts HRRR 1800x1060 = 1,908,000 grdpts HRRRE ~ 20% HRRR (1/5th) Ensemble Pre-Processing LBC 64 cores ~ 15 min IC 120 cores ~ 30 min Ensemble 3-km Data Assimilation (20 mem) WRF 1-hr cycle 72 cores/mem ~ 20 min GSI-EnKF 240 cores ~ 25 min Ensemble 3-km Forecast (3-18 mem) WRF 18-hr fcst 180 cores/mem ~120 min Post-processing 16 cores/mem ~5 min DA + FCST = ~5,000 cores (18 fcst mem)
HRRRE 15 km
HRRR 3 km
HRRRE 3 km

HRRRE: Case Study 09 May 2016
7
Tornadic supercell development near residual outflow boundary intersection
Courtesy Corey Gaustini
Convective initiation along dryline
Radar Obs 15z
Radar Obs 20z
Radar Obs 21z
Radar Obs 22z
Rain-cooled Boundary
20z

8
Effective use of the boundary observations in storm-scale ensemble data assimilation
HRRRE: Case Study 09 May 2016
HRRRX 15z-17z initializations Time-Lagged Ensemble HRRRE 15z + 7hr fcst valid 22z
1-hr Maximum Updraft Helicity Valid 22z (colors > 25 m2/s2)
Radar Obs 22z
Radar Obs 23z

Black = Observation Error Red = Ens Bias (mean obs innovation) Green = Total Spread (ensemble standard deviation + ob error) Blue = Ens Forecast Error (innovation standard deviation) Need accurate specification of observation error Ensemble spread << Observation error Not drawn towards obs in DA Based on results observation errors reduced for some datasets Want total spread to track with forecast errors of the day Ensemble spread < Forecast error (green < blue) Underdispersive Ensemble spread > Forecast error (green > blue) Overdispersive Ensemble generally underdispersive Ensemble design refinements planned including… statistical post-processing
HRRRE Observation Space Diagnostics: 1-hr cycling
ACARS temperature (K)
METAR specific humidity (g kg-1)

Stochastic physics for use in Regional/Storm Scales Ensembles
10
Motivation Issues with mixed-physics approach
Maintenance Inconsistent ensemble system (some schemes closer related than others) Each member has a unique climatology and mean error
Compare mixed-physics approach to stochastic parameter perturbation (SPP), Stochastic Kinetic Energy Backscatter (SKEB) and Stochastic Perturbation of Physics Tendencies (SPPT).
Experiment Design Regional RAP model simulations 7 days from 2013 convective season: May 23,29; June 7, 14, 20, 28; July 4 24 h forecasts 00 and12 Z initializations using different GEFS members Stochastic Parameter Perturbation, SKEB and SPPT Focus on convective Grell-Freitas and MYNN PBL Verification performed over CONUS Statistical significance testing by employing boot strap method with 95% confidence
interval

Experiments
11
Control mixed physics
(CU and PBL)
SPP (CU and PBL)
SPP+SKEB (CU + PBL)
SPP+SPPT (CU+PBL)
SPP+SKEB+SPPT (CU+PBL)
Impact of adding SKEB and SPPT on stochastic parameter perturbation
CU comparison
PBL comparison
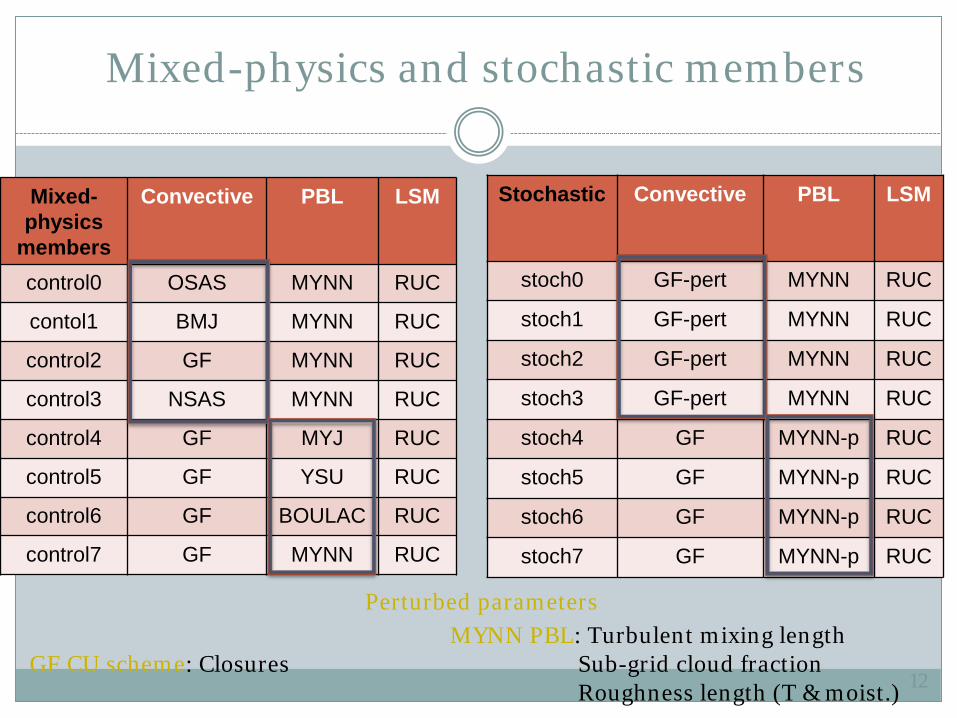
Mixed-physics and stochastic members
12
Mixed-physics
members
Convective PBL LSM
control0 OSAS MYNN RUC
contol1 BMJ MYNN RUC
control2 GF MYNN RUC
control3 NSAS MYNN RUC
control4 GF MYJ RUC
control5 GF YSU RUC
control6 GF BOULAC RUC
control7 GF MYNN RUC
Stochastic Convective PBL LSM
stoch0 GF-pert MYNN RUC
stoch1 GF-pert MYNN RUC
stoch2 GF-pert MYNN RUC
stoch3 GF-pert MYNN RUC
stoch4 GF MYNN-p RUC
stoch5 GF MYNN-p RUC
stoch6 GF MYNN-p RUC
stoch7 GF MYNN-p RUC
Perturbed parameters MYNN PBL: Turbulent mixing length
GF CU scheme: Closures Sub-grid cloud fraction Roughness length (T & moist.)

Precipitation Rank histograms for 00 Z initialization:
13

14
Ensemble Mean Bias – 00Z init. 0.254mm 6.35mm
12.7mm
Statistically Significant

Ensemble Mean GSS – 00Z Init.
15 0.254mm 6.35mm
12.7mm

16
0.254mm 12.7mm 25.4mm
12.7mm 25.4mm 0.254mm
Brier Score - 00 Z initialization
Brier Score - 12 Z initialization
During the day stochastic experiments significantly outperform the control. spp_skeb_sppt significantly better than others.
Situation opposite during the night.

17
RMSE-00Z Init. t2m
t850
u10
u250
h500
Spread-00Z Init.
Very similar results for 12Z simulations
spp_skeb_sppt spread significantly higher when compared to the control experiment, for most of the lead times (longer than 6hrs) and all variables.

18
00Z Init. CRPS for 00Z and 12Z Initializations 12Z Init.
t2m
t850
u10
u250
h500

SPP+SPPT – SPPT experiments

Stochastic Physics Tests Summary
20
Alone, the parameter perturbations of SPP introduce insufficient spread. When combined with SKEB and/or SPPT the spread is as large and for
some instances even larger than for a multi-physics ensemble. An ensemble created by combining three stochastic approaches (SPP,
SKEB and SPPT generally outperformed the multi-physics, control ensemble for most of the examined variables, most of the evaluated lead times, and most of the employed statistics.
SKEB made a larger impact on spread associated with upper level wind and geopotential heights, while SPPT had a larger impact on spread for near-surface temperature.
Combining SPP with SPPT has generally a positive impact, on the order of a 2-10% improvement over an ensemble using SPPT alone.
1. The results confirm the findings of previous studies that parameter perturbations alone do not generate sufficient spread to remedy the
under-dispersion in short-term ensemble forecasts 2. A combination of several stochastic schemes outperforms any single scheme. This result implies that a synthesis of different approaches is
best suited to capture model error in its full complexity.

Current and Future Work
Adding 14 more cases to the previous study Experimenting with HRRR (3km grid spacing) for application in HREF Focus on PBL and LSM:
PBL-In addition to mixing length, roughness length and cloud fraction we added perturbations to mass fluxes
LSM-Hydraulic Conductivity is currently being perturbed

HRRR Time-Lagged Ensemble (HRRR-TLE)
00 UTC
Real-time
Member 3
Obs
Member 2
Member 1
Supercell probability past hour 00
UTC
Deterministic HRRR:
High-resolution forecast provides small-scale details
Hourly-updating with fresh forecast always available
Time-Lagged Ensemble (HRRR-TLE):
Leverage runs in ensemble of opportunity
Form hazard likelihood probabilities
Less small-scale detail
Proxy for confidence/certainty
Underdispersive
HRRR Ensemble (HRRRE):
More expensive ensemble
More spread/dispersive/skill
22

HRRR-TLE Severe Weather Example
Forecasts valid 22-23z
All six forecasts combined to form probabilities valid 22z 27 April 2011
Spatial radius 45 km Time radius 1 hr UH threshold 25 m2/s2
10 - 11 hr forecast
9- 10 hr forecast
8 - 9 hr forecast
Forecasts valid 23-00z
11 - 12 hr forecast
10- 11 hr forecast
11 - 12 hr forecast
HRRR 11z Init
HRRR 12z Init
HRRR 13z Init
Neighborhood Search Point Probability
Tornadic Storm Probability (%)
23

HRRR Time-Lagged Ensemble (HRRR-TLE) Current Experimental Probability Products: • Based on 3 HRRRX runs (equal weight) • Starting with forecast hour two • 40-km neighborhood probabilities • 120-km spatial filter applied after identifying
neighborhood hazard exceedance
Real-Time Web Graphics (and grids via LDM/FTP) http://rapidrefresh.noaa.gov/hrrrtle
QP
F
Win
ter
Sev
ere
Avi
atio
n
Thunderstorms
Hail
24

HRRR-TLE Development: Bias Correction
99th %ile model climatology = 1.23”
99th %ile analysis climatology =
1.00”
Frequency Bias Correction Using “Quantile Mapping” Model forecast climatology adjusted to observation climatology for a particular threshold (1 inch / 6 hrs) Exploring modified gamma distribution for additional refinement in bias correction
25

HRRR-TLE Precipitation Products
Results: Probability of 0.5” Precipitation in 6 hours May-Aug 2015
Over- confident
Under- confident
With relatively small sample size (~50 forecasts) Produce statistically reliable probabilities 60% forecasts observed 60% of the time Produce probabilities with sufficient resolution/sharpness Large dynamic range to probabilities including extremes Still fundamentally underdispersive (overconfident)
26

HRRR-TLE Case Study: 18 April 2016
HRRR 23z 13hr pcp fcst HRRR 00z 12 hr pcp fcst HRRR 01z 11 hr pcp fcst
HRRR-TLE forecasts > 60% probability of 6hr QPF exceeding 100 year average return interval (ARI) in Houston,TX area based on ATLAS14
12hr QPE
27

HRRR-TLE: Product Development
Hazard Proxy Truth
Heavy rainfall QPF Stage-IV / MRMS
Snowfall rate Microphysics-based ASOS visibility
Precipitation type Microphysics-based ASOS type
Accumulating snow Explicit snow depth Point observations
Severe wind 80-m hourly max wind or 10-m gust
METAR/mesonet observations
Large hail Column graupel, updraft speed, ? MESH
Tornado* Updraft helicity Post-processed MRMS rotation
tracks
Lightning Lightning flash algorithm GLD360/NLDN
Visibility/Ceiling Post-processed field in development
ASOS or future CIMSS technique
General Convection Vertical motion, stability, reflectivity MRMS reflectivity
Product Development Methodology
28

HRRR-TLE: Project Timeline
Organization/Experiment Hazards Platform Timeline
WPC WWE PQPF, Snowfall, Snow Rate
NAWIPS and web site January 2016
NSSL/SPC EFP/EWP Tornadoes, Hail, Wind NAWIPS and AWIPSII May 2016
WPC FFaIR Refined PQPF and FF guidance NAWIPS June 2016
AWC Summer Experiment
Initial aviation hazards: ceiling, visibility, convection NAWIPS August 2016
WPC WWE Refined winter hazards and PQPF NAWIPS January 2017
AWC Winter Experiment Ceiling and visibility NAWIPS February 2017
NSSL/SPC EFP/EWP Refined severe weather guidance
NAWIPS and AWPSII May 2017
WPC FFaIR Refined FF guidance NAWIPS July 2017
AWC Summer Experiment/OPG Refined aviation hazards NAWIPS and
AWPSII August 2017
Initiate NCO ‘on-boarding” All IDP Late 2017 or
2018
Product Development Timeline Engage National Center Testbeds
29

HRRRE Future Work
Refine ensemble data assimilation and forecasting • Install radar reflectivity data assimilation • Stochastic physics (parameter perturbation, tendencies for both DA and
forecasting) • Apply HRRR-TLE statistical post-processing • Include lagged members? Real-Time Status Resume real-time HRRRE runs in Oct/Nov 2016 after ending 20 June 2016 HRRR-TLE runs continually available Together (EMC, ESRL, NSSL, NCAR, …) work toward building a national real-time storm-scale ensemble system (and eventually a global storm-scale ensemble system)
30