development of magnitude-bound relations for ... · development of magnitude-bound relations for...
TRANSCRIPT

Engineering Geology 197 (2015) 253–266
Contents lists available at ScienceDirect
Engineering Geology
j ourna l homepage: www.e lsev ie r .com/ locate /enggeo
Development of magnitude-bound relations for paleoliquefactionanalyses: New Zealand case study
B.W. Maurer a, R.A. Green a, M.C. Quigley b,c, S. Bastin c
a Department of Civil and Environmental Engineering, Virginia Tech, Blacksburg, VA, USAb School of Earth Sciences, University of Melbourne, Melbourne, Australiac Department of Geological Sciences, University of Canterbury, Christchurch, New Zealand
http://dx.doi.org/10.1016/j.enggeo.2015.08.0230013-7952/© 2015 Elsevier B.V. All rights reserved.
a b s t r a c t
a r t i c l e i n f oArticle history:Received 4 March 2015Received in revised form 18 August 2015Accepted 19 August 2015Available online 18 September 2015
Keywords:PaleoliquefactionEarthquakeMagnitude bound curveLiquefactionNew ZealandChristchurch
Magnitude-bound relations are often used to estimate paleoearthquakemagnitudes frompaleoliquefaction data.This study proposes New Zealand-basedmagnitude-bound curves that are developed using (a) liquefaction fieldobservations and (b) a newly proposed back-calculation approach that combines the simplified liquefactionevaluation procedure with a regionally appropriate ground motion prediction equation. For (b) bothdeterministic and probabilistic frameworks are proposed. The magnitude bound curves back-calculated usingeither the deterministic or probabilistic frameworks are advantageous in that they can be used to predict thespatial distribution of liquefaction in regionswhere historical liquefaction field observations are limited or poorlydocumented, and because soil- and site-specific conditions can be incorporated intomagnitude-bound analyses.Moreover, curves developed using the probabilistic framework allow for the range of possible causativeearthquake magnitudes to be better understood and quantified. To demonstrate the use of the proposedrelations, paleoliquefaction features discovered in eastern Christchurch (NZ) are analyzed. The 1869 ~Mw4.8Christchurch earthquake and/or 1717 ~Mw8.1 Alpine Fault earthquake are found to be themost likely candidatesamongst known historical and paleoearthquakes for triggering liquefaction over the permissible time range(ca. 1660 to 1905 A.D.). This study demonstrates the potential of the proposed magnitude-bound curves toprovide insight in to past, present, and future hazards, proving their utility even in cases of limited evidence.The approach of developing and applying magnitude bound curves proposed herein is not limited to parts ofNew Zealand, but rather, can be applied worldwide.
© 2015 Elsevier B.V. All rights reserved.
1. Introduction
In regions experiencing infrequent moderate-to-large earthquakes,the historic record may be insufficient to provide accurate inputsfor seismic hazard analyses because (1) some active faults may be his-torically seismically quiescent and not easily identifiable from surfaceevidence, thereby posing an unspecified potential earthquake source,and (2) seismic phenomena such as liquefaction and rockfall maypose a potential hazard but may not have occurred historically. The2010–2011 Canterbury earthquake sequence (CES) in New Zealandprovided a powerful demonstration of these limitations. The CESinvolved at least 7 damaging earthquakes sourced from at least 12 faults(Beavan et al., 2012) that were previously unidentified and historicallyseismically quiescent. As many as ten distinct episodes of liquefaction(Quigley et al., 2013) and five distinct episodes of rockfall (Mackeyand Quigley, 2014) occurred at some sites in the mainshock (Mw 7.1Darfield earthquake) and largest aftershocks (e.g., 2011 Mw 6.2Christchurch earthquake, 185 fatalities). Approximately 75% ofbuildings within the central business district (CBD) of Christchurchrequired demolition or extensive repair (Kam et al., 2011). Due toextensive liquefaction-induced land and infrastructure damage,
more than 6000 residential properties in eastern Christchurch werepurchased by the central government (http://cera.govt.nz/residential-red-zone) at a post-insurance pay out loss exceeding $NZ 1 b($US 800 m) (Parker and Steenkamp, 2012).
Pre-CES seismic hazard models for the region (e.g., Stirling et al.,2007) that combined regional active faults (source models) with ‘float-ing’ unidentified sources (distributed seismicity) indicated that(a) proximal, moderate Mw earthquakes from unidentified distributedsources (including blind faults) contributed the largest seismic shakinghazard to Christchurch, (b) earthquakes up to Mw 7.2 on unidentifiedsources beneath the Canterbury Plainswest of Christchurchwere possi-ble, and (c) expected return times of potentially liquefaction-inducingpeak ground accelerations (PGA ~0.1 to 0.2 g) for class C (shallowsoil) site conditions ranged from ca. 50 to 200 yr. However, prior tothe CES, none of this data had been seriously validated with rigorouspaleoseismic investigations in Christchurch. The occurrence of a highlydamaging series of earthquakes sourced from previously unknownand primarily blind faults highlighted the inherent incompleteness ofsource-based seismic hazard catalogs, demonstrating the necessity forgeologic studies of prehistoric phenomena such as rockfalls (Mackeyand Quigley, 2014) and liquefaction features (Bastin et al., 2015) to

254 B.W. Maurer et al. / Engineering Geology 197 (2015) 253–266
supplement seismic hazard models and predict the impacts of futureearthquakes. Despite a wealth of recent paleoliquefaction studies inChristchurch (e.g., Almond et al., 2012; Quigley et al., 2013; Bastinet al., 2015;Maurer et al., 2014; Villamor et al., 2014), a significant chal-lenge remains in understanding the spatial distribution of earthquakesources and shaking intensities that induced paleo-liquefaction, andare thus capable of inducing future liquefaction, in this region.
Paleoliquefaction studies have two phases. The first phase entails theperformance of field investigations, wherein paleoliquefaction featuresare located, mapped, and dated. The reader is referred to Obermeieret al. (2001, 2005) for broad overviews of paleoliquefaction fieldinvestigation, and to the intensive investigations by Obermeier andDickenson (2000), Tuttle (2001), Talwani and Schaeffer (2001), Cox etal. (2004), and Tuttle et al. (2002a, 2002b, 2005) for specific case studies.The second phase, and the focus of this study, is back-analysis, whereinquantitative techniques are used to determine themagnitude of the caus-ative paleoearthquake andbetter constrain its source location. Specifically,this study aims to advance the state of the art in back-analysis techniquesso that the results of field investigation can be used to accurately assessthe paleoseismic history of a region to the extent possible.
Back-analysis techniques have been increasingly applied inpaleoliquefaction studies in many seismically active regions(e.g., Obermeier, 1998; Tuttle, 2001; Talwani and Schaeffer, 2001; Coxet al., 2004; Green et al., 2005; Bastin et al., 2015). While several tech-niques have been proposed for estimating earthquake magnitudesfrom paleoliquefaction data, one of the more credible and widely-usedis the “magnitude-bound” procedure (e.g., Obermeier, 1998; Olsonet al., 2005a, 2005b; Papathanassiou et al., 2005; Pirrotta et al., 2007;Tuttle and Hartleb, 2012). This approach uses correlations relatingearthquake magnitude to the site-to-source distance of the mostdistal observation of liquefaction. Developed from observations in
4.5
5
5.5
6
6.5
7
7.5
8
8.5
9
9.5
Mag
nitu
de (
Mw
or M
s)
Distance to Most Distal Liquefaction Site (km)
(a)
4.5
5
5.5
6
6.5
7
7.5
8
8.5
9
9.5
1 10 100 1000
1 10 100 1000
Mag
nitu
de (
Mw
or M
s)
Distance to Most Distal Liquefaction Site (km)
(b)
Fig. 1. Magnitude-bound curves for various geographic and tectonic settings, where site-to-to fault rupture.
modern earthquakes, these correlations are commonly referred to asmagnitude-bound curves. Fig. 1 presents several such correlations fora variety of geographic and tectonic settings (Kuribayashi andTatsuoka, 1975; Ambraseys, 1988; Papadopoulos and Lefkopoulos,1993; Wakamatsu, 1993; Galli, 2000; Aydan et al., 2000;Papathanassiou, 2005; Pirrotta et al., 2007; Castilla and Audemard,2007), where site-to-source distance is quantified in terms of epicentraldistance (Fig. 1a) and the distance to most proximal fault rupture(Fig. 1b). The position of these curves, which bound the most distal liq-uefaction features, is inherently a function of earthquake source charac-teristics (e.g., rupture mechanism), transmission characteristics(e.g., ground motion attenuation and site effects), and liquefaction sus-ceptibility (e.g., soil state and gradation, and ground water depth). Be-cause these factors vary regionally, region-specific correlationsprovide more accurate estimates than those developed from globaldata (Obermeier et al., 2001; Olson et al., 2005a, 2005b).
In addition, inherent to these curves are differing criteria for data in-clusion, including the quality and extent of field study, the certainty ofearthquake source location and magnitude (e.g., instrumental vs.macroseismic), the style of faulting and focal depth, and the overallanomalousness of data. For example, in developing his curves,Ambraseys (1988) did not consider (1) deep-focus earthquakes,which produce more distal liquefaction than shallow crustal earth-quakes; or (2) anomalous cases that would bias the maximum site-to-source distance of liquefaction, including those where conditions great-ly enhanced liquefaction susceptibility, such as irrigatedfields or slopingground. Conversely, Castilla and Audemard (2007) included both deep-focus earthquakes and anomalous cases in developing their correlationfrom global data. For example, Castilla and Audemard (2007) includedata from the 1977 Mw7.5 Bucharest, Romania earthquake, having afocal depth of 91–110 km (Ambraseys, 1988; Berg et al., 1980), as well
Kuribayashi & Tatsuoka (1975): Japanese earthquakes
Ambraseys (1988): worldwide earthquakes
Papadopoulos & Lefkopoulos (1993): worldwide earthquakes
Papadopoulos & Lefkopoulos (1993): Greek earthquakes
Wakamatsu (1993): Japanese earthquakes
Galli (2000): Italian earthquakes
Aydan et al. (2000): Turkish earthquakes
Papathanassiou (2005): Agean regional earthquakes
Pirrotta et al. (2007): Sicilian regional earthquakes
Castilla and Audemard (2007): worldwide earthquakes
Ambraseys (1988): worldwide earthquakes
Papadopoulos & Lefkopoulos (1993): worldwide earthquakes
Papadopoulos & Lefkopoulos (1993): Greek earthquakes
Papathanassiou (2005): Agean regional earthquakes
source distance is quantified in terms of (a) epicentral distance and (b) closest distance

Fig. 2.Magnitude-bound relations for epicentral distance (Repi) to most distal liquefactionsite, and distance from fault (~Rjb) to most distal liquefaction site, using globaldata (Ambraseys, 1988); global data from earthquakes with liquefaction observations,as compiled by Ambraseys (1988), are also plotted.
255B.W. Maurer et al. / Engineering Geology 197 (2015) 253–266
as data from aftershocks following the 1989 Mw5.9 Bova del Tocuyo,Venezuela and Mw6.9 Loma Prieta, USA earthquakes. While further re-search is needed, it has been shown that surfacemanifestations of lique-faction may be observed at greater site-to-source distances duringaftershocks than in equivalent-magnitude mainshocks, possibly due toincreased liquefaction susceptibility from reduced aging-effects, or tothe presence of existing liquefaction dikes, which act as conduits be-tween liquefied strata and the ground surface (Green et al., 2013;Maurer et al., 2014). Due to the inclusion of this data, and as shown inFig. 1a, the Castilla and Audemard (2007) correlation estimates a signif-icantly lower magnitude at shorter site-to-source distances, as com-pared to using correlations proposed by other authors. Importantly,differing criteria for data selection can result in significant differencesto magnitude-bound curves. Therefore, in addition to using regionally-appropriate correlations, familiarity with the provenance of amagnitude-bound curve is critical; to place derivative results in propercontext, a user must be aware of a correlation's source data, develop-ment, and caveats for use.
While magnitude-bound curves specific to New Zealand have notyet been proposed, there is a clear and present need. In light of theprior inconspicuousness of local faults and the exceedance of designground-motions during the CES, there is a need to reassess themagnitude-recurrence rates of earthquakes local to Christchurch.Preliminary evidence suggests liquefaction-inducing earthquakesoccurred between A.D. 1000 and A.D. 1400 (Villamor et al., 2014) andbetween AD 1660 – 1803 and ca. 1905 (Bastin et al., 2015) in distinctparts of Christchurch, however the origins of these earthquakes areunknown. The penultimate earthquake on the source of the Darfieldearthquake (Greendale Fault) occurred ca. 20–30 kyr ago (Hornblowet al., 2014) and rock fall evidence suggests that no large earthquakeshave occurred on the local faults responsible for the 2011 FebruaryMw6.2 and June Mw6.0 Christchurch earthquakes within the last 6000to 8000 years (Mackey and Quigley, 2014), indicating that the CESsources were not responsible for the paleoliquefaction. Region-specificmagnitude-bound curves could thus assist in the interpretation ofsuch evidence and help to elucidate the region's paleoseismic history.As such, the objectives of this study are to: (1) develop a NZ-basedmagnitude-bound curve using the traditional approach of usingmodernliquefaction field observations; (2) develop NZ-based magnitude-bound curves using a newly proposed back-calculation approach usingthe simplified liquefaction evaluation procedure in conjunction with aregionally appropriate ground motion prediction equation (GMPE);and (3) demonstrate the use of these curves by analyzingpaleoliquefaction features recently discovered in Christchurch. It ishoped that these correlations ultimately aid in more accuratelyassessing the regional seismic hazard.
2. Development of NZ-based magnitude-bound curves
Two approaches are used to develop NZ-based magnitude-boundcurves for shallow crustal earthquakes. The first is the traditionalapproach using modern liquefaction field observations (e.g., Ambraseys,1988), but based on data from earthquakes in NewZealand only. The sec-ond is a newly proposed back-calculation approach using the simplifiedliquefaction evaluation procedure in conjunctionwith a regionally appro-priate GMPE. In this latter approach both deterministic and probabilisticframeworks are used; these frameworks are described in detail. Lastly,discrepancies between the curves developed using the two approachesare discussed, and recommendations are made for use in New Zealand.
2.1. Magnitude-bound curves based on field observations
The magnitude-bound curves shown in Fig. 1 were all developedusing field liquefaction observations. In each case, the site-to-sourcedistances of the most distal liquefaction features were compiled frommodern earthquakes with known magnitudes. While exceptional
cases exist, nearly all magnitude-bound curves in the literature are con-structed to bound the compiled data, rather than provide a best fit of thedata. Consequently, magnitude-bound curves almost always give alower-bound estimate of magnitude, rather than a median estimate.To demonstrate, the magnitude-bound curves of Ambraseys (1988)are plotted in Fig. 2 for epicentral distance (Repi) and “fault distance,”the latter being similar to Joyner-Boore distance (Rjb) as measured byAmbraseys (1988); the data used to develop these correlations arealso plotted. It can be seen that using either distance metric (i.e., Repi
or ~Rjb), the proposed magnitude-bound curves are drawn to boundthe respective datasets. As such, these relations give the minimumearthquake magnitude expected to induce liquefaction at any givensite-to-source distance.
Following in the style of Ambraseys (1988) and many others, datafrom historic shallow crustal earthquakes in New Zealand with docu-mented liquefaction observations are herein compiled. As summarizedin Table 1, there are at least 20 such events. While some of these historicearthquakes are also found in the Ambraseys (1988) database, theestimated magnitude and/or site-to-source distance of liquefaction arein most cases updated using recent refinements from the literature. Forexample, the 1848 Marlborough, New Zealand earthquake is listed inthe Ambraseys (1988) database as having a surface wave magnitude ofMs7.1, derived from macroseismic data. More recently, Mason and Little(2006) reinvestigated the rupture length and displacement of theAwatere Fault during the Marlborough earthquake and proposed a re-fined moment magnitude estimate of Mw7.4 to Mw7.7. Since this eventcontributes to the positioning of the magnitude-bound curve,refinement of the estimated magnitude is significant. Many other eventsin Table 1 have never before been compiled for use in magnitude-bound correlations. In some cases, the earthquake magnitude and/orsource location are uncertain; for these cases, published values from theliterature are given in Table 1 alongwith the value(s) deemedmost cred-ible and selected for inclusion in our development of a NZ-based correla-tion. For compatibility with prior studies, fault distance as compiled inTable 1 is themeasured Rjb, though themore general label is also retainedin consideration of themany uncertainties inherent to a paleoliquefactionstudy (e.g., varying focal depths and mechanisms).
In addition to the exclusionary rules proposed by Ambraseys (1988),caseswere omitted from thedatabase for the following reasons: (1) sev-eral aftershock events from the CESwere omitted because themost dis-tal liquefaction was observed at a site of prior recent liquefaction; asdiscussed previously, including these events could bias the maximumsite-to-source distance of liquefaction; and (2) observations of liquefac-tion in reclaimed land (e.g., liquefaction induced in the Port ofWellington by the 2013 Cook Strait and Lake Grassmere earthquakes)were omitted because the liquefaction susceptibility of artificial fills
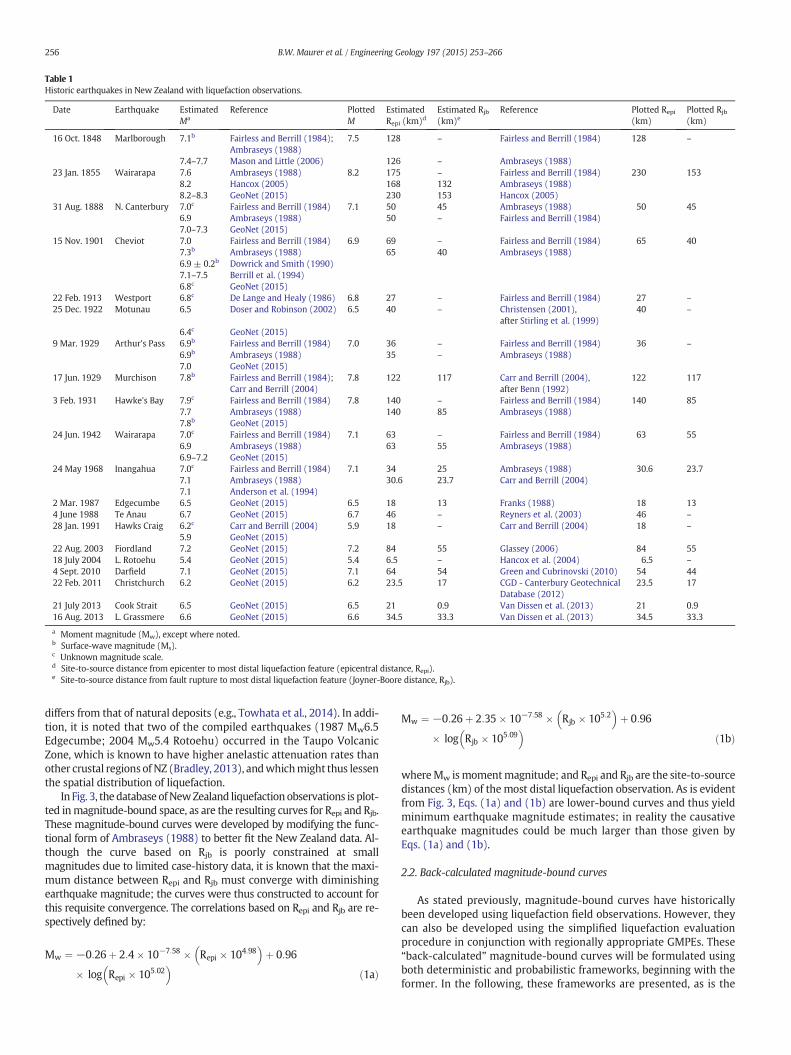
Table 1Historic earthquakes in New Zealand with liquefaction observations.
Date Earthquake EstimatedMa
Reference PlottedM
EstimatedRepi (km)d
Estimated Rjb
(km)eReference Plotted Repi
(km)Plotted Rjb
(km)
16 Oct. 1848 Marlborough 7.1b Fairless and Berrill (1984);Ambraseys (1988)
7.5 128 – Fairless and Berrill (1984) 128 –
7.4–7.7 Mason and Little (2006) 126 – Ambraseys (1988)23 Jan. 1855 Wairarapa 7.6 Ambraseys (1988) 8.2 175 – Fairless and Berrill (1984) 230 153
8.2 Hancox (2005) 168 132 Ambraseys (1988)8.2–8.3 GeoNet (2015) 230 153 Hancox (2005)
31 Aug. 1888 N. Canterbury 7.0c Fairless and Berrill (1984) 7.1 50 45 Ambraseys (1988) 50 456.9 Ambraseys (1988) 50 – Fairless and Berrill (1984)7.0–7.3 GeoNet (2015)
15 Nov. 1901 Cheviot 7.0 Fairless and Berrill (1984) 6.9 69 – Fairless and Berrill (1984) 65 407.3b Ambraseys (1988) 65 40 Ambraseys (1988)6.9 ± 0.2b Dowrick and Smith (1990)7.1–7.5 Berrill et al. (1994)6.8c GeoNet (2015)
22 Feb. 1913 Westport 6.8c De Lange and Healy (1986) 6.8 27 – Fairless and Berrill (1984) 27 –25 Dec. 1922 Motunau 6.5 Doser and Robinson (2002) 6.5 40 – Christensen (2001),
after Stirling et al. (1999)40 –
6.4c GeoNet (2015)9 Mar. 1929 Arthur's Pass 6.9b Fairless and Berrill (1984) 7.0 36 – Fairless and Berrill (1984) 36 –
6.9b Ambraseys (1988) 35 – Ambraseys (1988)7.0 GeoNet (2015)
17 Jun. 1929 Murchison 7.8b Fairless and Berrill (1984);Carr and Berrill (2004)
7.8 122 117 Carr and Berrill (2004),after Benn (1992)
122 117
3 Feb. 1931 Hawke's Bay 7.9c Fairless and Berrill (1984) 7.8 140 – Fairless and Berrill (1984) 140 857.7 Ambraseys (1988) 140 85 Ambraseys (1988)7.8b GeoNet (2015)
24 Jun. 1942 Wairarapa 7.0c Fairless and Berrill (1984) 7.1 63 – Fairless and Berrill (1984) 63 556.9 Ambraseys (1988) 63 55 Ambraseys (1988)6.9–7.2 GeoNet (2015)
24 May 1968 Inangahua 7.0c Fairless and Berrill (1984) 7.1 34 25 Ambraseys (1988) 30.6 23.77.1 Ambraseys (1988) 30.6 23.7 Carr and Berrill (2004)7.1 Anderson et al. (1994)
2 Mar. 1987 Edgecumbe 6.5 GeoNet (2015) 6.5 18 13 Franks (1988) 18 134 June 1988 Te Anau 6.7 GeoNet (2015) 6.7 46 – Reyners et al. (2003) 46 –28 Jan. 1991 Hawks Craig 6.2c Carr and Berrill (2004) 5.9 18 – Carr and Berrill (2004) 18 –
5.9 GeoNet (2015)22 Aug. 2003 Fiordland 7.2 GeoNet (2015) 7.2 84 55 Glassey (2006) 84 5518 July 2004 L. Rotoehu 5.4 GeoNet (2015) 5.4 6.5 – Hancox et al. (2004) 6.5 –4 Sept. 2010 Darfield 7.1 GeoNet (2015) 7.1 64 54 Green and Cubrinovski (2010) 54 4422 Feb. 2011 Christchurch 6.2 GeoNet (2015) 6.2 23.5 17 CGD - Canterbury Geotechnical
Database (2012)23.5 17
21 July 2013 Cook Strait 6.5 GeoNet (2015) 6.5 21 0.9 Van Dissen et al. (2013) 21 0.916 Aug. 2013 L. Grassmere 6.6 GeoNet (2015) 6.6 34.5 33.3 Van Dissen et al. (2013) 34.5 33.3
a Moment magnitude (Mw), except where noted.b Surface-wave magnitude (Ms).c Unknown magnitude scale.d Site-to-source distance from epicenter to most distal liquefaction feature (epicentral distance, Repi).e Site-to-source distance from fault rupture to most distal liquefaction feature (Joyner-Boore distance, Rjb).
256 B.W. Maurer et al. / Engineering Geology 197 (2015) 253–266
differs from that of natural deposits (e.g., Towhata et al., 2014). In addi-tion, it is noted that two of the compiled earthquakes (1987 Mw6.5Edgecumbe; 2004 Mw5.4 Rotoehu) occurred in the Taupo VolcanicZone, which is known to have higher anelastic attenuation rates thanother crustal regions of NZ (Bradley, 2013), andwhichmight thus lessenthe spatial distribution of liquefaction.
In Fig. 3, thedatabase ofNewZealand liquefaction observations is plot-ted inmagnitude-bound space, as are the resulting curves for Repi and Rjb.These magnitude-bound curves were developed by modifying the func-tional form of Ambraseys (1988) to better fit the New Zealand data. Al-though the curve based on Rjb is poorly constrained at smallmagnitudes due to limited case-history data, it is known that the maxi-mum distance between Repi and Rjb must converge with diminishingearthquake magnitude; the curves were thus constructed to account forthis requisite convergence. The correlations based on Repi and Rjb are re-spectively defined by:
Mw ¼ −0:26þ 2:4� 10−7:58 � Repi � 104:98� �
þ 0:96
� log Repi � 105:02� �
ð1aÞ
Mw ¼ −0:26þ 2:35� 10−7:58 � Rjb � 105:2� �
þ 0:96
� log Rjb � 105:09� �
ð1bÞ
whereMw ismomentmagnitude; and Repi and Rjb are the site-to-sourcedistances (km) of themost distal liquefaction observation. As is evidentfrom Fig. 3, Eqs. (1a) and (1b) are lower-bound curves and thus yieldminimum earthquake magnitude estimates; in reality the causativeearthquake magnitudes could be much larger than those given byEqs. (1a) and (1b).
2.2. Back-calculated magnitude-bound curves
As stated previously, magnitude-bound curves have historicallybeen developed using liquefaction field observations. However, theycan also be developed using the simplified liquefaction evaluationprocedure in conjunction with regionally appropriate GMPEs. These“back-calculated” magnitude-bound curves will be formulated usingboth deterministic and probabilistic frameworks, beginning with theformer. In the following, these frameworks are presented, as is the

Fig. 3.Magnitude-bound relations for epicentral distance (Repi) to most distal liquefactionsite, and distance from fault (Rjb) to most distal liquefaction site, using New Zealand data(a la Ambraseys, 1988); data from historic earthquakes in New Zealand with liquefactionobservations, as compiled in Table 1, are also plotted.
257B.W. Maurer et al. / Engineering Geology 197 (2015) 253–266
development of NZ-based correlations and a discussion of theassumptions used therein.
2.2.1. Framework: deterministic magnitude-bound curvesIn engineering practice, the potential for earthquake-induced
liquefaction is commonly assessed using the “simplified” liquefactionevaluation procedure (Whitman, 1971; Seed and Idriss, 1971). Firstdeveloped for the Standard Penetration Test (SPT), the originalprocedure has gone through numerous updates (e.g., Seed et al., 1985;Youd et al., 2001; Cetin et al., 2004; Idriss and Boulanger, 2008;Boulanger and Idriss, 2014) and versions have been developed for theCone Penetration Test (CPT) (e.g., Seed and DeAlba, 1986; Stark andOlson, 1995; Robertson and Wride, 1998; Moss et al., 2006; Idriss andBoulanger, 2008; Boulanger and Idriss, 2014) and shear-wave velocity(Vs) (e.g., Andrus and Stokoe, 2000; Kayen et al., 2013). In this proce-dure, the factor of safety against liquefaction (FSliq) for level ground con-ditions is equal to the ratio of the cyclic resistance of the soil (CRR) to theearthquake induced cyclic stress (CSRM = 7.5,σ′ = 1 atm, or for brevity,CSR). TheCSR subscripts indicate that it is computed for anMw7.5 earth-quake and in-situ vertical effective stress (σ′v) of 1 atm, reflecting theinfluence of shaking duration and overburden stress on liquefaction.To use this procedure for back-analysis at a paleoliquefaction site, thesoil stratum(i.e., the “critical layer”)with depth-thickness-density com-bination consistentwith the observed liquefaction response of the site isassumed to have an FSliq of 1.0 (Eq. (2)).
FSliq ¼ CRRCSRM¼7:5; σ 0
v¼1 atm¼ 1:0 ð2Þ
By substituting the general form of the simplified liquefaction evalu-ation procedure for level ground conditions (in this case, for SPT data)for CSR, the minimum peak ground acceleration required to induceliquefaction may be expressed as:
amax ¼ CRR N1ð Þ60cs� ��MSF Mwð Þ � Kσ � g� σ 0
vo
0:65� σv � rdð3Þ
where amax = peak geometric-mean horizontal ground acceleration;(N1)60cs = representative SPT blow count, normalized for overburdenpressure, corrected to an equivalent energy ratio of 60%, and adjustedfor fines content; MSF = magnitude scaling factor to adjust for theduration of shaking; Mw = moment magnitude; Kσ = dimensionlessfactor incorporating the effect of overburden pressure on liquefactionresistance; g = coefficient of acceleration due to gravity; σ′vo = initialin-situ vertical effective stress; σv = in-situ vertical total stress; and
rd = dimensionless stress reduction factor accounting for the non-rigid response of the soil column. Olson et al. (2005a), Green et al.(2005, 2014), and Green and Olson (2015) provide guidelines for selec-tion of critical layers and the representative in-situ parameters(i.e., (N1)60cs, σ′vo, σv) required in Eq. (3); the exact form of the remain-ing terms depends onwhich version of the simplified procedure is used(e.g., Youd et al., 2001; Cetin et al., 2004; Idriss and Boulanger, 2008).
As shown in Fig. 4a, the boundary defined by Eq. (3) separates com-binations of amax and Mw that are sufficient to induce liquefaction fromcombinations that are insufficient. As there are infinitely many combi-nations sufficient to induce liquefaction, a regionally appropriateGMPE is used to determine credible amax–Mw combinations for agiven site, where the GMPE defines amax as a function of earthquakemagnitude (Mw) and site-to-source distance (R), amongst other factors.A GMPE is plotted in Fig. 4b (dashed line) with variable Mw and R(e.g., Repi, Rrup, etc.) equal to the distance between the liquefaction siteand provisional earthquake source location. Thus, this line representsthe expected amax at the liquefaction site corresponding to variouscausative earthquake magnitudes. As indicated in Fig. 4b, the portionof this line plotting above the boundary defined by Eq. (3) correspondsto amax–Mw combinations that could induce liquefaction at the site. Theintersection of theGMPEwith the boundary-line (i.e., FSliq=1) thus de-fines the lower-bound amax–Mw combination. In other words, this givesthe minimum magnitude earthquake expected to induce liquefaction.Since both Eq. (3) and the GMPE compute amax as a function of Mw,the back-calculated amax–Mw solution requires iteration.
In addition to the amax defined by Eq. (3), there exists a thresholdshear strain (γt) belowwhich excess pore pressures are not expectedto develop, irrespective of the number of loading cycles (Dobry et al.,1980, 1982). In other words, there is an amax below which liquefac-tion will not occur regardless of shaking duration (where earthquakemagnitude is often used as a proxy for shaking duration), but this isnot explicitly considered by the cyclic-stress framework in Eq. (3).The solution obtained from Eq. (3) is therefore contingent on thisrequirement, which can affect the shape of the magnitude-boundcurve at far-field distances. Assuming γt = 10−4 for sands (Dobryet al., 1980, 1982), it follows from the formulation of CSR(e.g., Seed and Idriss, 1971) that:
amaxð Þt ¼Gmax � 10−4 � G=Gmaxð Þγt
0:65� σv � rdð4Þ
where (amax)t=minimumpeak geometric-meanhorizontal ground ac-celeration required to induce a threshold shear strain, γt, of 10−4;Gmax = small-strain shear modulus; (G/Gmax)γt = shear modulusreduction coefficient, determined at strain γt; and σv and rd are asdefined previously. (G/Gmax)γt may be estimated from (1) shearmodulus reduction curves for similar soils (e.g., Dobry et al. (1980)suggest a representative value of 0.75 for all sands); or (2) using amore refined G/Gmax model that considers the influence of in-situ con-ditions on modulus reduction behavior (e.g., Ishibashi and Zhang,1993; Darendeli, 2001). Lastly, Gmax can be computed from small strainshear wave velocities measured in-situ or can be estimated from otherin-situ test data (e.g., SPT, CPT) using one of several empirical relations(e.g., Seed et al., 1986; Rix and Stokoe, 1991). Thus, the iterative solutionto develop magnitude-bound curves should also account for (amax)t,such that the back-calculated amax–Mw solution shown schematicallyin Fig. 4b satisfies (amax)t.
In summary, the amax required to induce liquefaction (i.e., FSliq = 1)is computed from liquefaction triggeringmethodology using in-situ anddynamic soil parameters. AGMPE,which also accounts for site-responseeffects, is then used to determine the minimum magnitude earthquakerequired to induce this amax at variable site-to-source distances, the cu-mulative result being a magnitude-bound curve.

Fig. 4. (a) amax-Mw combinations sufficient to induce liquefaction at a hypothetical site; and (b) credible amax-Mw combinations at the samehypothetical site having site-to-source distanceR, as determined by a ground motion prediction equation (GMPE).
Fig. 5. Representative soil profiles used to develop deterministic (a) lower-bound; and(b) median back-calculated magnitude-bound curves, where: γ = total unit weight;(N1)60cs = SPT blow count, normalized for overburden pressure, corrected to anequivalent energy ratio of 60%, and adjusted for fines content (FC). The liquefiable stratain (a) and (b) are comprised of saturated clean sands having FC b5%.
258 B.W. Maurer et al. / Engineering Geology 197 (2015) 253–266
2.2.2. Assumptions and development: deterministic magnitude bound-curves
To develop a back-calculatedmagnitude-bound curvewhich boundsall of the data points (i.e., a lower-bound curve), it should be recognizedthat the data controlling the location of the curve correspond to thegreatest liquefaction susceptibility, the greatest seismic loading, orsome combination of the two scenarios. In other words, the site-to-source distance at which liquefaction can occur increases with thepresence of highly liquefiable soils and/or greater than expected seismicloading for a respective Mw and R. Thus, as seen in Figs. 2 and 3,data points plotting significantly “left” of the bounding curve (i.e., atshorter site-to-source distances) correspond to cases where either(1) lithospheric structure, the tectonic setting, source characteristics(e.g. directivity, stress drop), transmission characteristics, or aleatoricvariability produce lesser ground motions; or (2) the combination ofground water depth and soil properties result in lesser liquefactionsusceptibility. In light of this, a deterministic lower-bound curve isback-calculated herein using inputs corresponding to elevated liquefac-tion susceptibility and greater than expected seismic loading.
This lower-bound curve is generated using the Cetin et al. (2004)version of the simplified procedure to evaluate the representativesoil profile shown in Fig. 5a. Collectively, these inputs (i.e., (N1)60cs,σ′vo, σv) are consistent with “High” to “Very High” liquefactionsusceptibility, as given by Olson et al. (2005b) and adapted from Youdand Hoose (1977) and Youd and Perkins (1978). The Cetin et al.(2004) procedure was principally chosen for its probabilistic capabili-ties, the benefits of whichwill be discussed later in this paper. However,for the purposes of developing deterministic magnitude-bound curves,the procedure is used as recommended by Cetin et al. (2004) for deter-ministic assessments of liquefaction potential. To account for thethreshold strain (Eq. (4)), Gmax is estimated using the Seed et al.(1986) relation for SPT data, while (G/Gmax)γt is computed from theDarendeli (2001) model. In addition, the Bradley (2010, 2013) GMPEis utilized assuming: Site Class D (soil) conditions; a strike-slip faultfor which the depth to the top of rupture (Ztor) is 1 km; andmedian+0.5σ amax. The Bradley (2010, 2013) GMPE is a NZ-specificmodification of the Chiou and Youngs (2008) model that corrects em-pirically identified discrepancies for New Zealand recordings, and SiteClass D is a reasonable assumption for site-profiles with liquefiablesoils. For example, the majority of Christchurch strong motion stationsare located on Site Class D profiles (Wood et al., 2011; Wotherspoonet al., 2014). From a limited parametric analysis, the assumed focalmechanism (e.g., strike-slip vs. reverse)was found to be relatively insig-nificant compared to other uncertainties; the implications of the Ztor as-sumption are discussed subsequently, following the development of themagnitude-bound curves. Lastly, because the Bradley (2010, 2013)GMPE uses distance metrics based on fault geometry (e.g., Rjb, Rrup),
empirical conversions of site-to-source distance metrics (Scherbaumet al., 2004) are used to develop a magnitude-bound relation based onepicentral distance. It should be noted that while these conversions ap-pear reasonable, they are herein used beyond suggested limits of0 b Rjb b 100 km and 5.0 b Mw b 7.5, and as such, the validity of theresulting relation outside these limits is uncertain. With the above as-sumptions, and using the framework discussed previously,magnitude-bound relations for Repi and Rjb are computed, as shown inFig. 6a; alsoplotted is thedatabase of NewZealand liquefaction observa-tions given in Table 1. As can be seen in Fig. 6a, it is thus possible to back-calculate magnitude-bound curves consonant with field liquefactionobservational data using reasonable assumptions.
While lower-bound curves help to constrain paleoseismic histories,they may also significantly underestimate the magnitudes ofliquefaction-inducing paleoearthquakes. As evident from Figs. 2, 3, and6a, the back-calculated magnitudes of some earthquakes areunderestimated significantly when the most distal observation ofliquefaction plots far from the magnitude-bound curve. For example,in the 1968Mw7.1 Inangahua, New Zealand earthquake, themost distalliquefaction was observed at Rjb ≈ 24 km, or Repi ≈ 31 km (usingepicenter location and earthquake source dimensions from Andersonet al., 1994). Using the back-calculated curves shown in Fig. 6a, the caus-ative earthquake magnitude is erroneously estimated to be Mw6.1(using Rjb) or Mw6.2 (using Repi). As such, a median or “best-estimate”magnitude could be obtained using a correlation which provides abest fit of the Mw vs. R data, in lieu of one that bounds the data.A best-estimate magnitude-bound curve can be back-calculated usinginput-parameters representative of median conditions. To computesuch a curve, the Bradley (2010, 2013) GMPE is used to estimate the

Fig. 6. Magnitude-bound relations for epicentral distance (Repi) to most distal liquefaction site, and distance from fault (Rjb) to most distal liquefaction site, using: (a) back-calculatedlower-bound approach and (b) back-calculated median approach, as described in text; data from historic earthquakes in New Zealand with liquefaction observations, as compiled inTable 1, are also plotted.
259B.W. Maurer et al. / Engineering Geology 197 (2015) 253–266
median amax for the previously assumed conditions: a Class D site in astrike-slip tectonic environment with Ztor = 1 km. In addition, theCetin et al. (2004) procedure is used to evaluate the representativesoil profile shown in Fig. 5b, characterized as having “Moderate” to“High” liquefaction susceptibility according to Olson et al. (2005b).The resulting median curves for Repi and Rjb are shown in Fig. 6b alongwith the database of New Zealand liquefaction observations given inTable 1; as before, the relation based on Repi is computed using theconversions of site-to-source distance metrics given by Scherbaumet al. (2004). As expected, and shown in Fig. 6b, the back-calculatedmedian relations pass through the Mw vs. R data rather than bound it.
Inherent to the Bradley (2013) GMPE, and by corollary, the frame-work proposed herein, a value of Ztor must be assumed. While nearlyall Mw ≥ 7.0 crustal earthquakes have fault ruptures that reach theground surface, smallermagnitude earthquakes often donot, particular-ly those where reverse-slip is predominant (Boore, 2011). While the 4largest events of the CES (i.e., 4 Sept. 2010 Mw7.1; 22 Feb. 2011Mw6.2; 13 June 2011 Mw6.0; and 23 Dec. 2011 Mw6.0) all hadZtor ≤ 1 km (Beavan et al., 2012), some of the historic events compiledin Table 1 are known to have had deeper ruptures and larger Ztor values.In general, as Ztor increases for a given magnitude earthquake, thepredicted amax decreases at short Rjb, remains unchanged at moderateRjb, and increases at long Rjb; accordingly, the potential for liquefactionalso follows this trend. For example, if the magnitude-bound curvesshown in Fig. 6a were re-developed for an increase in Ztor to 5 km, themagnitude-bound curves would shift upward more than 0.1Mw for1 km b Rjb b 4 km (i.e., a larger magnitude earthquake is now neededto induce liquefaction at these distances), increase less than 0.1Mw for4 km b Rjb b 15 km, and decrease for Rjb N 15 km (i.e., a smallermagnitude earthquake is now needed to induce liquefaction at thesedistances), reaching a reduction of 0.17Mw at Rjb = 100 km. Conse-quently, the back-calculated curves may be less accurate for crustalearthquakes having greater rupture depths. The magnitude-boundcurves developed herein are intended for shallow crustal earthquakeswith low Ztor values; the user should recognize the limitations ofapplying these curves to deeper ruptures, for which a separate set ofcurves could be developed via the proposed framework.
2.2.3. Framework: probabilistic magnitude-bound curvesThe development of back-calculated, deterministic magnitude-
bound curves represents a significant advancement for regions wherewell-documented field liquefaction observational data is not available,allowing for soil- and site-specific conditions to be incorporatedin magnitude-bound analyses. However, the inputs needed in apaleoliquefaction study are uncertain, and deterministic frameworksare inherently limited insofar as accounting for this variability. A proba-bilistic framework could thus allow for the range of possible causativeearthquake magnitudes to be better understood and quantified. Such a
framework is made possible by the development of probabilistic lique-faction evaluation procedures (e.g., Cetin et al., 2004; Moss et al., 2006;Idriss and Boulanger, 2012; Boulanger and Idriss, 2014). Theseprocedures recognize that liquefaction does not always occurwhen pre-dicted by a deterministic procedure (i.e., FSliq b 1.0). In reality, there is aprobability of liquefaction (PL) associated with every combination ofcyclic-resistance and cyclic-stress. For example, the PL-triggering curvesproposed byCetin et al. (2004) are shown in Fig. 7a; it can be seen that fora given (N1)60cs, PL increases with increasing CSR. However, CSR is alsouncertain due to the uncertainties of the inputs that define it (i.e., amax,rd,σv,σ′vo). For example, the amax inducedby a given earthquake at a par-ticular site-to-source distance is uncertain, as shown in Fig. 7b using theBradley (2010, 2013) GMPE. Likewise, rd is uncertain, as computed by theMoss et al. (2006) relation shown in Fig. 7c. Collectively, these and otheruncertainties pertaining to soil/site conditions (e.g., Gmax, threshold shearstrain, penetration resistance, total stress, effective stress) appeal to theadvantages of probabilistic magnitude-bound curves.
The framework proposed herein does not attempt to quantify everyuncertainty entering a paleoliquefaction study, but it incorporates themost significant parameter variability and demonstrates how quantifi-able uncertainties can be accounted for; additional uncertainties, ifknown, could be incorporated in a similarmanner. Using the total prob-ability theorem to integrate over select uncertainties, the probabilitythat a site liquefies in an earthquake of magnitude, M, at site-to-source distance, R, can be expressed as:
P Site Liquefies EQK : M;Rjð Þ
¼Zamax
Zrd
P Site Liquefies amax; rdjð Þ f amax M;Rjð Þ f rd rdð Þ � drd � damax:
ð5Þ
In Eq. (5), the conditional probability of liquefaction P(SiteLiquefies|EQK:M,R) is given by a probabilistic liquefaction evaluationprocedure (e.g., Cetin et al., 2004; Moss et al., 2006; Boulangerand Idriss, 2012, 2014); the conditional probability density functionf(amax|M,R) is given by a GMPE; and frd(rd) is a probability density func-tion for rd. As discussed previously, “simplified” liquefaction evaluationprocedures do not explicitly account for the threshold strain (γt). Theprobability of an induced strain exceeding this threshold in an earthquakeof magnitude, M, at site-to-source distance, R, can be expressed as:
P γ≥γt EQK: M;Rjð Þ
¼Zamax
Zrd
ZG
Gmax
P γ≥γt amax; rd;G
Gmax
����� �
f amax M;Rjð Þ f rd rdð Þ f GGmax
GGmax
� �d
GGmax
⋅drd � damax: ð6Þ
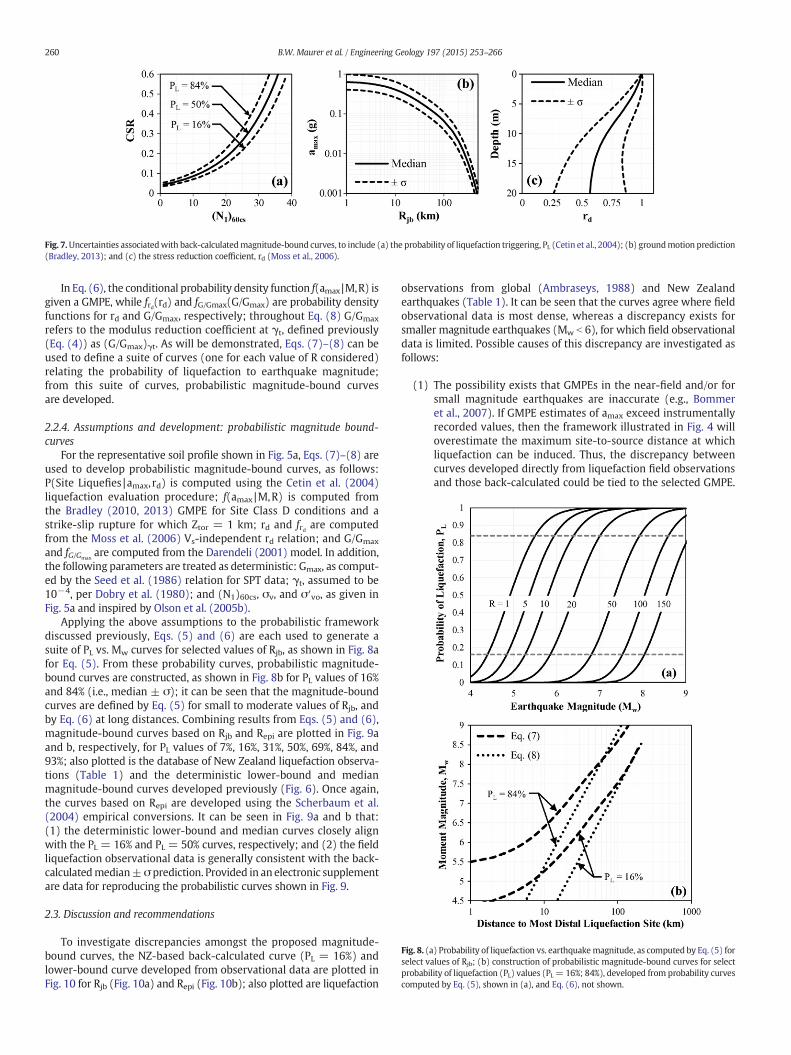
Fig. 7.Uncertainties associatedwith back-calculatedmagnitude-bound curves, to include (a) the probability of liquefaction triggering, PL (Cetin et al., 2004); (b) groundmotion prediction(Bradley, 2013); and (c) the stress reduction coefficient, rd (Moss et al., 2006).
Fig. 8. (a) Probability of liquefaction vs. earthquakemagnitude, as computed by Eq. (5) forselect values of Rjb; (b) construction of probabilistic magnitude-bound curves for selectprobability of liquefaction (PL) values (PL= 16%; 84%), developed from probability curvescomputed by Eq. (5), shown in (a), and Eq. (6), not shown.
260 B.W. Maurer et al. / Engineering Geology 197 (2015) 253–266
In Eq. (6), the conditional probability density function f(amax|M,R) isgiven a GMPE, while frd(rd) and fG/Gmax(G/Gmax) are probability densityfunctions for rd and G/Gmax, respectively; throughout Eq. (8) G/Gmax
refers to the modulus reduction coefficient at γt, defined previously(Eq. (4)) as (G/Gmax)γt. As will be demonstrated, Eqs. (7)–(8) can beused to define a suite of curves (one for each value of R considered)relating the probability of liquefaction to earthquake magnitude;from this suite of curves, probabilistic magnitude-bound curvesare developed.
2.2.4. Assumptions and development: probabilistic magnitude bound-curves
For the representative soil profile shown in Fig. 5a, Eqs. (7)–(8) areused to develop probabilistic magnitude-bound curves, as follows:P(Site Liquefies |amax, rd) is computed using the Cetin et al. (2004)liquefaction evaluation procedure; f(amax |M,R) is computed fromthe Bradley (2010, 2013) GMPE for Site Class D conditions and astrike-slip rupture for which Ztor = 1 km; rd and frd are computedfrom the Moss et al. (2006) Vs-independent rd relation; and G/Gmax
and fG/Gmaxare computed from the Darendeli (2001) model. In addition,
the following parameters are treated as deterministic: Gmax, as comput-ed by the Seed et al. (1986) relation for SPT data; γt, assumed to be10−4, per Dobry et al. (1980); and (N1)60cs, σv, and σ′vo, as given inFig. 5a and inspired by Olson et al. (2005b).
Applying the above assumptions to the probabilistic frameworkdiscussed previously, Eqs. (5) and (6) are each used to generate asuite of PL vs. Mw curves for selected values of Rjb, as shown in Fig. 8afor Eq. (5). From these probability curves, probabilistic magnitude-bound curves are constructed, as shown in Fig. 8b for PL values of 16%and 84% (i.e., median ± σ); it can be seen that the magnitude-boundcurves are defined by Eq. (5) for small to moderate values of Rjb, andby Eq. (6) at long distances. Combining results from Eqs. (5) and (6),magnitude-bound curves based on Rjb and Repi are plotted in Fig. 9aand b, respectively, for PL values of 7%, 16%, 31%, 50%, 69%, 84%, and93%; also plotted is the database of New Zealand liquefaction observa-tions (Table 1) and the deterministic lower-bound and medianmagnitude-bound curves developed previously (Fig. 6). Once again,the curves based on Repi are developed using the Scherbaum et al.(2004) empirical conversions. It can be seen in Fig. 9a and b that:(1) the deterministic lower-bound and median curves closely alignwith the PL = 16% and PL = 50% curves, respectively; and (2) the fieldliquefaction observational data is generally consistent with the back-calculatedmedian±σ prediction. Provided in an electronic supplementare data for reproducing the probabilistic curves shown in Fig. 9.
2.3. Discussion and recommendations
To investigate discrepancies amongst the proposed magnitude-bound curves, the NZ-based back-calculated curve (PL = 16%) andlower-bound curve developed from observational data are plotted inFig. 10 for Rjb (Fig. 10a) and Repi (Fig. 10b); also plotted are liquefaction
observations from global (Ambraseys, 1988) and New Zealandearthquakes (Table 1). It can be seen that the curves agree where fieldobservational data is most dense, whereas a discrepancy exists forsmaller magnitude earthquakes (Mw b 6), for which field observationaldata is limited. Possible causes of this discrepancy are investigated asfollows:
(1) The possibility exists that GMPEs in the near-field and/or forsmall magnitude earthquakes are inaccurate (e.g., Bommeret al., 2007). If GMPE estimates of amax exceed instrumentallyrecorded values, then the framework illustrated in Fig. 4 willoverestimate the maximum site-to-source distance at whichliquefaction can be induced. Thus, the discrepancy betweencurves developed directly from liquefaction field observationsand those back-calculated could be tied to the selected GMPE.

Fig. 9. Probabilistic back-calculated magnitude-bound relations for liquefaction probabilities (PL) of 7%, 16%, 31%, 50%, 69%, 84%, and 93% (i.e., median ± 1.5σ prediction),where site-to-source distance is quantified in terms of (a) distance to fault (Rjb); and (b) epicentral distance (Repi); also plotted is the database of New Zealand liquefactionobservations (Table 1) and the deterministic lower-bound and median magnitude-bound curves developed previously (Fig. 6).
261B.W. Maurer et al. / Engineering Geology 197 (2015) 253–266
However, this seems unlikely since: (1) the Bradley (2010,2013) GMPE provided predictions with sufficient accuracy inthe 4 September 2010, MW7.1 Darfield and 22 February 2011,Mw6.2 Christchurch earthquakes, independent of site-to-sourcedistance (Bradley, 2013); (2) the small magnitude predictionsneeded to develop magnitude-bound curves are within the pa-rameter space of the Bradley (2010, 2013) GMPE; and (3) itcan be shown using numerous other GMPEs that similar discrep-ancies exist between back-calculated magnitude-bound curvesand the field observational data shown in Fig. 10 for both NewZealand and global data.
(2) The possibility exists that estimates of FSliq are erroneous forsmall magnitude earthquakes. In the liquefaction triggeringframework used herein, the amplitude and duration of cyclicloading are respectively represented by amax and MSF, whereMSF is a function of Mw, amongst other factors. However, therelationship between Mw and MSF is uncertain for smallmagnitude events, and furthermore, many proposed MSFsdo not account for potentially-significant variables (e.g., soiltype, tectonic setting, and rupture-distance and -directivity)(e.g., Green and Terri, 2005; Green et al., 2008; Green and Lee,2010; Carter et al., 2014). Thus, the discrepancy between curvesdeveloped directly from liquefaction field observations andthose back-calculated could be tied to the selectedMSF. A recentstudy has shown that MSF is a function of soil response(Boulanger and Idriss, 2014), which is not accounted for in theMSF inherent to the Cetin et al. (2004) liquefaction evaluationprocedure. However, use of the Boulanger and Idriss (2014) liq-uefaction evaluation procedure only exacerbates the discrepancybetween the curves. Thus, while the possibility persists that thisdiscrepancy is related to magnitude-scaling, more research is
Fig. 10. Comparison of NZ-based magnitude-bound curves developed directly from field liquefaevaluation procedure and a regionally applicable GMPE: (a) distance to fault (Rjb) and (b) epearthquakes in New Zealand (Table 1) are also plotted.
required to develop MSFs that more fully account for soilresponse (e.g., Green and Terri, 2005; Lasley et al., 2015).
(3) It can be seen in Fig. 10 that magnitude-bound curves developeddirectly from liquefaction field observational data are subject tolimitations in data. For example, only 15% of the earthquakes intheAmbraseys (1988) database are smaller thanMw6.0, whereasthis percentage is even less for the New Zealand database.Amongst these limited cases, instances of high liquefactionsusceptibility and/or greater than expected seismic loadingmay be lacking (i.e., conditions which increase the maximumdistance to liquefaction). Since the curve developed from obser-vational data is controlled by relatively few small-magnitudeevents, its position may inaccurately represent the range of pos-sible outcomes. As such, as data is collected in future earthquakeshavingMw b 6, better constraint of the magnitude-bound curvesdeveloped from observational data will result.
The discrepancy between curves for small magnitude earthquakes isbelieved to be unrelated to the focal mechanism and focal depth as-sumed in the development of the back-calculated curves, as evidencedby a limited parametric study.
Despite the uncertainty noted above for smaller magnitude events,the back-calculatedmagnitude-bound curves developed herein are rec-ommended for analyses of paleoliquefaction evidence in New Zealand.Moreover, the probabilistic curves allow for the range of possiblecausative paleoearthquake magnitudes to be better understood andquantified. There are two principal ways in which these curves maybe used, as described in the following. First, there are scenarios wheremultiple paleoliquefaction features are investigated, dated, mapped,and assigned to a common causative paleoearthquake, but historic re-cords are incapable of suggesting how large the causative rupture may
ction observational data and back-calculated (PL = 16%) using the simplified liquefactionicentral distance (Repi); data from historic global earthquakes (Ambraseys (1988)) and

Fig. 11. Field photograph of liquefaction feeder dikes that formed during the 2010–2011Canterbury earthquake sequence (‘CES dike’) and a paleoliquefaction feeder dike thatformed between ca. 1660 and ca. 1905 A.D. Photograph taken of excavation floor, parallelto the ground surface, at ~1.2 m depth. Note similarity in morphology of CES dike on leftside of image and paleo-dike (image after Bastin et al., 2015).
262 B.W. Maurer et al. / Engineering Geology 197 (2015) 253–266
have been. For example, amongst several cases in the United States, Coxet al. (2007) delineated three paleoliquefaction fields in the southernMississippi Embayment and proposed that one of these fields had aprovisional maximum site-to-source distance of 23.5 km. While thecommonly-used Ambraseys (1988) magnitude-bound curve estimatesa magnitude of Mw6.0, the probabilistic curves developed herein givea more informative median ± σ estimate of Mw6.25 ± 0.45 for anequivalent liquefaction field in NewZealand. Second, there are scenariosinwhich an effort to determine themagnitude of an earthquake is aidedby the historic and paleoseismic records, but is complicated by the exis-tence of multiple possible causative earthquakes. For this scenario,which will be demonstrated herein, the probabilistic curves can beused to determine which earthquakes amongst a suite of possibleevents were more likely to have induced liquefaction at a particularsite. In the following, the use of the back-calculated magnitude-boundcurves is demonstrated by analyzing paleoliquefaction evidencerecently discovered in Christchurch.
3. Demonstration of NZ-based magnitude-bound curves
Following the CES, a series of trenches were dug to investigate thestructure and stratigraphy of modern, undisturbed liquefaction features(e.g., Green et al., 2012; Quigley et al., 2013). In some cases, trenchingalso uncovered evidence of paleoliquefaction within the subsurface.One such case is that of Sullivan Park in eastern Christchurch, a site ofintensive investigations by Bastin et al. (2013, 2015). Here, oxidized,pre-CES liquefaction dikes were found to be cross-cut by lateral spread-ing fissures formed during the CES (e.g., Fig. 11). Cross-cutting relation-ships and 14C dating indicate the causative earthquake most likelyoccurred between AD 1660–1803 and ca. 1905 (Bastin et al., 2015).Liquefaction was observed in the village of Kaiapoi, north ofChristchurch, during the 1901 Cheviot earthquake (e.g., Berrill et al.,1994), however the Sullivan Park site provides the first evidence forpre-CES liquefaction in Christchurch. Thus, this discovery, along withothers since (Tuttle et al., 2012; Villamor et al., 2014), provides the op-portunity for paleoliquefaction evidence to help clarify the paleoseismichistory of the region. For complete details of the Sullivan Park fieldinvestigation, and of the thorough efforts to date the paleoliquefactionfeature, see Bastin et al. (2015).
As listed in Table 1, 8 earthquakes with documented liquefactionobservations occurred in New Zealand between 1848 and 1930. Anadditional 4 events within or near the constrained timeframe (i.e., ca.1660 to ca. 1905) affected the Canterbury region with the potential toinduce liquefaction; these include the (1) 1870 ~Mw5.7 Lake Ellesmereearthquake (e.g., Downes and Yetton, 2012); (2) 1869 ~Mw4.8Christchurch earthquake (e.g., Downes and Yetton, 2012); (3) 1717~Mw8.1 Alpine Fault earthquake (e.g., Sutherland et al., 2007);and (4) ca. 1400–1500~ Mw7.1-Mw7.4 Porters Pass Fault earthquake(Howard et al., 2005). To investigate the possibility of these12 earthquakes to have induced liquefaction in Sullivan Park, themagnitude and corresponding site-to-source distance are plottedin Fig. 12 along with the probabilistic magnitude-bound curvesdeveloped previously. For some of these events, paleoseismic studieshave constrained the extents of fault rupture with reasonable accuracy.For example, Howard et al. (2005) mapped the Porters Pass Faultsystem extensively and proposed a history of recurrent earthquakes.Similarly, the extents of the 1717 Alpine Fault rupture are reasonablywell-constrained by on-fault evidence, with a northern terminus likelynear the Haupiri River (Sutherland et al., 2007; Berryman et al., 2012;De Pascale and Langridge, 2012). As discussed previously, the back-calculated magnitude-bound curves based on fault distance (i.e., Rjb)are derived directly from the framework established in this paper,whereas those based on Repi are derived from the former usingempirical conversions for site-to-source distance metrics proposed byScherbaum et al. (2004). It is therefore recommended that the curvesbased on Rjb be used whenever possible. However, paleoliquefaction
studies are often performed where faults do not manifest at the groundsurface or are otherwise unknown. For pre-instrumental earthquakes,a macroseismic epicenter may be all that is known, whereas forpre-historical events, an “energy center” interpreted from liquefactionevidence could be the only indication of source region (Obermeier,1996). For these cases, the magnitude-bound curves based on Repi arelikely more appropriate; for further discussion of this assumption anduncertainties relating to site-to-source distance metrics, see Greenet al. (2005) and Olson et al. (2005b). Thus, for 4 events where thedistance to fault rupture is reasonably well-constrained, the curvesbased on Rjb are used (Fig. 12a); for the remaining 8 events, the curvesbased on Repi are used (Fig. 12b). The plotted distances in Fig. 12 arethose from Sullivan Park to the fault ruptures (Fig. 12a) or epicenters(Fig. 12b). In addition, uncertainties are assigned to each Mw andsite-to-source distance, as summarized in Table 2.
From Fig. 12, it can be seen that 7 of the 12 earthquakes consideredplot below the PL = 7% magnitude-bound curves, and as such, it isvery unlikely that these events induced liquefaction in Sullivan Park.In addition, points plotting near the PL = 16% curves suggest the occur-rence of liquefaction that is marginal and isolated, rather than severeand widespread, where observations of the latter are more likely atsite-to-source distances plotting well above the PL = 50% magnitude-bound curves. As such, it is unlikely that any of the 12 events wouldinduce liquefaction in Christchurch comparable to that observed in thelargest events of the CES. For example, the fault rupturing in theMw6.2 Christchurch earthquake was within 5 km of much of theChristchurch urban area, to include Sullivan Park; it can be seen inFig. 12a that the corresponding magnitude-bound data would plotabove the PL = 93% curve. Possible causes of the paleoliquefaction inSullivan Park are further investigated as follows:
• It can be seen in Fig. 12a that the ca. 1400–1500~ Mw7.1 - Mw7.4Porter's Pass Fault earthquake (#1) plots just above the PL = 16%curve and might thus have induced isolated, marginal liquefaction inChristchurch. However, since this event is believed to have occurredprior to the incidence of liquefaction in Sullivan Park (i.e., 1660 to1905), it is likely not the causative earthquake.

Fig. 12. Investigating thepotential for 12historical earthquakes to induce liquefaction at Sullivan Parkusing probabilistic back-calculatedmagnitude-bound curves, as described in the text.Events are parsed into (a) those with constrained rupture extents; and (b) those with an estimated epicenter only; all data is provided in Table 2.
263B.W. Maurer et al. / Engineering Geology 197 (2015) 253–266
• It can be seen in Fig. 12a that the 1717 ~Mw8.1 Alpine Fault earth-quake (#2) plots between the PL = 31% and PL = 50% curves andmight thus have induced liquefaction at Sullivan Park. It is speculatedthat the extent and severity of liquefaction in Christchurch would befar less than that observed during the largest events of the CES, butthat sporadic marginal liquefaction might be expected.
• It can be seen in Fig. 12b that 3 events plot between the PL = 7% andPL = 16% curves: the 1869 ~Mw4.8 Christchurch earthquake (#6),1888 ~Mw7.1 North Canterbury earthquake (#8), and 1901 ~Mw6.9Cheviot earthquake (#9). While liquefaction was induced in Kaiapoiduring the Cheviot earthquake, none was observed in the vicinityof Sullivan Park (~10 km further from the provisional epicenter),or anywhere else in Christchurch. As such, the Cheviot earthquake isunlikely the causative event, but the possibility exists that very mar-ginal liquefaction was induced in Christchurch, but was not observedor documented. There is aminor possibility that theNorth Canterburyearthquake induced isolated and very marginal liquefaction inChristchurch, but the nearest observation was made in HammerSprings, ~100 km from Sullivan Park (Fairless and Berrill, 1984).Lastly, and of most interest, is the 1869 Christchurch earthquake.While this event plots below the PL = 16% curve, the uncertaintyassigned to the source location by Downes and Yetton (2012) hasimportant implications. Incorporating the uncertainty in epicenterlocation and Mw, the site-to-source distance for Sullivan Park couldactually be closer to the PL = 50% curve, and thus, similar to the1717 Alpine Fault earthquake insofar as expected liquefaction atSullivan Park. In addition, from analysis of CES aftershocks, Syracuseet al. (2013) delineated the previously unmapped North ChristchurchFault, shown in Fig. 13, and hypothesized that it was active prior to theCES (Syracuse et al., 2013). It can be seen in Fig. 13 that the epicenterof the 1869 earthquake proposed by Downes and Yetton (2012) falls
Table 2Potential causative earthquakes of paleoliquefaction in Sullivan Park, Christchurch.
Year Earthquakea Estimated Mw Plotted Mw Estimated Repi (km)b Plot
1400–1500 Porter's Pass1 7.1–7.3 7.2 – –1717 Alpine Fault2 8.0–8.2 8.1 – –1848 Marlborough3 7.4–7.6 7.5 – –1929 Murchison4 7.6–8.0 7.8 – –1855 Wairarapa5 8.0–8.3 8.2 311–351 3311869 Christchurch6 4.7–4.9 4.8 1.7–11.7 6.71870 L. Ellesmere7 5.6–5.8 5.7 19.4–54.4 34.41888 N. Canterbury8 7.0–7.3 7.1 82–122 1021901 Cheviot9 6.8–7.0 6.9 62–90 751913 Westport10 6.65–6.95 6.8 185–235 2151922 Motunau11 6.4–6.6 6.5 53–83 631929 Arthur's Pass12 6.9–7.1 7.0 81–126 101
a Numbers 1–12 indicate event identification, as labeled in Fig. 12b Site-to-source distance from earthquake epicenter (Repi) to Sullivan Park, Christchurch.c Site-to-source distance from fault (Rjb) to Sullivan Park, Christchurch.
near the surface projection of the proposed N. Christchurch Fault,which also encompasses Sullivan Park at its eastern boundary. Whileit can only be speculated that the 1869 rupture may have occurredon theN. Christchurch Fault, the findings of Syracuse et al. (2013) sup-port the possibility that the site-to-source distance to Sullivan Parkmay have been less than the estimate of 6.7 km plotted in Fig. 12b.
In summary, while there are several possible causative events of thepaleoliquefaction discovered by Bastin et al. (2015), the magnitude-bound curves developed herein suggest the 1869 ~Mw4.8 Christchurchor 1717 ~Mw8.1 Alpine Fault earthquakes are most likely amongstknown earthquakes during the constrained time frame. In addition, itis suggested the Porters Pass Fault is capable of inducing liquefactionin Christchurch, with the severity dependent on the extent of faultrupture, which has shown to be variable (Howard et al., 2005).To these culpable earthquakes, we must add the possibility of strongearthquakes on other faults throughout the region (identified orunidentified) (e.g., Barnes et al., 2011; Dorn et al., 2010). To this end,the magnitude-bound curves based on Rjb indicate that Mw ≥ 6 eventswithin 12 km of the site, Mw ≥ 7 events within 35 km of the site, andMw ≥ 8 events within 100 km of the site have PL ≥ 50%. Within thisrealm, the Greendale Fault (i.e., the source of the 2010 Mw7.1 Darfieldearthquake) is unlikely the cause of paleoliquefaction in Sullivan Park,since its central section is believed to have last ruptured ca. 20,000 toca. 30,000 years ago (Hornblow et al., 2014). To determine the causativeearthquake more definitively, there is a need for additional evidence atdifferent distances from the provisional source locations, and/or havingbetter-constrained ages from both paleoliquefaction deposits andpaleo-earthquake fault ruptures. Nonetheless, it has been demonstratedthat magnitude-bound curves can provide significant insight into past,
ted Repi (km) Estimated Rjb (km)c Plotted Rjb (km) Reference
60–80 70 Howard et al. (2005)115–135 125 Sutherland et al. (2007)140–170 155 Mason and Little (2006)166–206 186 Carr and Berrill (2004)– – GeoNet (2015)– – Downes and Yetton (2012)– – Downes and Yetton (2012)– – Doser and Robinson (2002)– – Berrill et al. (1994)– – Fairless and Berrill (1984)– – Doser and Robinson (2002)– – Doser and Robinson (2002)

Fig. 13. Location of Sullivan Park in relation to: (1)modeled faults active in the Feb. 2011 Christchurchmain shock (Beavan et al., 2013), as indicated by black rectangles with the bold linehighlighting the up-dip edge of the fault; (2) the North Christchurch Fault, as proposed by Syracuse et al. (2013) using high-resolution relocation of CES aftershocks (indicated by a whiterectangle); (3) historic earthquake epicenters (occurring through 8/2015) (GeoNet, 2015); and (4) the estimated epicenter of the 1869 Christchurch earthquake (indicated by a whitestar), as proposed by Downes and Yetton (2012).
264 B.W. Maurer et al. / Engineering Geology 197 (2015) 253–266
present, and future hazards, even in cases where physical evidence isvery limited.
4. Conclusions
To assist in the interpretation of paleoseismic histories, magnitude-bound curves are commonly used to estimate earthquake magnitudesfrom paleoliquefaction evidence. This study used two independentapproaches to develop New Zealand based magnitude-bound curves:(1) using field observational data; and (2) using a back-calculationframework with the simplified liquefaction evaluation procedure anda regionally applicable GMPE, wherein both deterministic and probabi-listic frameworkswere used. These back-calculated curves are advanta-geous in that they may be developed for regions having limited orpoorly documented field liquefaction observational data, and becausesoil- and site-specific conditions can be incorporated into magnitude-bound analyses. The proposed framework to develop back-calculatedcurves is thus a significant advancement. Moreover, probabilistic curvesallow for the range of possible causative earthquake magnitudes to bebetter understood and quantified, and are therefore recommended.Provided in an electronic supplement are data for reproducing theprobabilistic curves developed herein, which are intended for shallowcrustal earthquakes with low Ztor values; the user should recognizethe limitations of applying these curves to deeper ruptures.
To demonstrate the use of the proposed magnitude-bound curves,paleoliquefaction investigated by Bastin et al. (2015) in easternChristchurch was analyzed. The 1869 ~Mw4.8 Christchurch earthquakeand/or 1717 ~Mw8.1 Alpine Fault earthquake are found to be the mostlikely candidates amongst known historical and paleoearthquakesfor causing the paleoliquefaction between ca. 1660 and 1905 A.D. inSullivan Park. This study demonstrated the potential of the proposedmagnitude-bound curves to provide insight into past, present, andfuture hazards, proving their utility even in cases of limited evidence.When additional paleoliquefaction is discovered in New Zealand, thecurves developed herein will aid in more accurately assessing regional
seismic hazards. And, from a more global perspective, the approachesto develop and use magnitude bound curves proposed herein are notlimited to New Zealand, but rather, can be applied worldwide.
Acknowledgments
This study is based on work supported by the U.S. National ScienceFoundation (NSF) grants CMMI-0962952, CMMI-1407428 and CMMI-1435494, and US Geological Survey (USGS) grants G12AP20002 andG14AP00046. However, any opinions, findings, and conclusions or rec-ommendations expressed in this paper are those of the authors anddo not necessarily reflect the views of NSF or USGS. The authors alsogratefully acknowledge the input from Professor Adrian Rodriguez-Marek at Virginia Tech on computing probabilistic, back-calculatedmagnitude bound curves, and review comments by Drs. StephenObermeier and Tish Tuttle.
Appendix A. Supplementary data
Supplementary data to this article can be found online at http://dx.doi.org/10.1016/j.enggeo.2015.08.023.
References
Almond, P., Villamor, P., Tuttle, M., Langridge, R.M., Clark, K., Eger, A., Bastin, S., Quigley, M.,Barker, P., Vandergoes, M., 2012. Liquefaction induced by the 2010–2011 Canterburyearthquake sequence and implications of recently discovered paleoliquefaction features.Geol. Soc. Am. Abstr. Programs 44 (7), 414.
Ambraseys, N.N., 1988. Engineering seismology. Earthq. Eng. Struct. Dyn. 17, 1–105.Anderson, H., Beanland, S., Buck, G., Darby, D., Downes, G., Haines, J., Jackson, J., Robinson, R.,
Webb, T., 1994. The 1968 may 23 Inangahua, New Zealand, earthquake: an integratedgeological, geodetic, and seismological source model. N. Z. J. Geol. Geophys. 37 (1), 59–86.
Andrus, R.D., Stokoe, K.H., 2000. Liquefaction resistance of soils from shear-wave velocity.J. Geotech. Geoenviron. 126 (11), 1015–1025.
Aydan, O., Ulusay, R., Kumsar, H., Tuncay, E., 2000. Site investigation and engineering evaluationof the Duzce-Bolu earthquake of November 12, 1999. Turkish Earthquake Foundation,Istanbul (Report No. TDV/DR 09-51, 307 pp.).

265B.W. Maurer et al. / Engineering Geology 197 (2015) 253–266
Barnes, P.M., Castellazzi, C., Gorman, A., Wilcox, S., 2011. “Submarine Faulting Beneath PegasusBay, Offshore Christchurch. Report WLG2011-28. National Institute of Water andAtmospheric Research Ltd (NIWA), Wellington, New Zealand.
Bastin, S., Quigley, M., Bassett, K., 2015. Paleo-liquefaction in Christchurch, New Zealand. Bull.Geol. Soc. Am. http://dx.doi.org/10.1130/B31174.1.
Bastin, S.H., Quigley, M., Bassett, K., Green, R.A., 2013. Characterisation of Modern andPaleo-Liquefaction Features in Eastern Christchurch, NZ Following the 2010–12 CanterburyEarthquake Sequence. In: Chin, C.Y. (Ed.), Proc. 19th New Zealand Geotechnical Society(NZGS 2013) Symposium – Infrastructure, Lifelines, and Natural Disasters (Queenstown,New Zealand, 20–22 November).
Beavan, J., Motagh, M., Fielding, E.J., Donnelly, N., Collett, D., 2012. Fault slip models of the2010–2011 Canterbury, New Zealand, earthquakes from geodetic data and observationsof postseismic ground deformation. N. Z. J. Geol. Geophys. 55 (3), 207–221.
Benn, J.L., 1992. A review of earthquake hazards on the West Coast. The West Coast RegionalCouncil, Greymouth, New Zealand.
Berg, G.V., Bolt, B.A., Sozen, M.A., Rjahn, C., 1980. Earthquake in Romania — March 4, 1977:An Engineering Report. National Research Council and Earthquake Engineering ResearchInstitute, National Academy Press, Washington D.C. (39 pp.).
Berrill, J.B., Mulqueen, P.C., Ooi, E.T.C., 1994. Liquefaction at Kaiapoi in the 1901 cheviot,New Zealand, earthquake. Bull. N. Z. Natl. Soc. Earthq. Eng. 27 (3), 178–189.
Berryman, K., Cooper, A., Norris, R., Villamor, P., Sutherland, T.W., Schermer, E., Langridge, R.,Biasi, G., 2012. Late Holocene rupture history of the alpine fault in south Westland,New Zealand. Bull. Seismol. Soc. Am. 102 (2), 620–638.
Bommer, J.J., Stafford, P.J., Alarcon, J.E., Akkar, S., 2007. The influence of magnitude range onempirical ground-motion prediction. Bull. Seismol. Soc. Am. 97 (6), 2152–2170.
Boore, D.M., 2011. In: Akkar, S., Gulkan, P., van Eck, T. (Eds.), Ground-motion predictionequations (GMPEs) from a global dataset: the PEER NGA equationsEarthquake Data inEngineering Seismology 14. Springer, Netherlands, pp. 3–15 (276 pp.).
Boulanger, R.W., Idriss, I.M., 2012. Probabilistic standard penetration test-based liquefaction-triggering procedure. J. Geotech. Geoenviron. 138 (10), 1185–1195.
Boulanger, R.W., Idriss, I.M., 2014. CPT and SPT based liquefaction triggering procedures. ReportNo. UCD/CGM-14/01. Department of Civil and Environmental Engineering, University ofCalifornia at Davis, USA.
Bradley, B.A., 2010. NZ-specific pseudo-spectral acceleration ground motion predictionequations based on foreignmodels. Department of Civil and Natural Resources Engineering,University of Canterbury, Christchurch, New Zealand (324 pp.).
Bradley, B.A., 2013. A New Zealand-specific pseudo-spectral acceleration ground-motionprediction equation for active shallow crustal earthquakes based on foreign models. Bull.Seismol. Soc. Am. 103 (3), 1801–1822.
Carr, K., Berrill, J., 2004. “Liquefaction Case Histories from the West Coast of the South Island,New Zealand.”. Research Report 2004–04. Department of Civil Engineering, University ofCanterbury, Christchurch, New Zealand.
Carter, W.L., Green, R.A., Bradley, B.A., Cubrinovski, M., 2014. The Influence of Near-FaultMotions on Liquefaction Triggering during the Canterbury Earthquake Sequence. In:Orense, R.P., Towhata, I., Chouw, N. (Eds.), Soil Liquefaction During Recent Large-ScaleEarthquakes. CRC Press, Leiden, The Netherlands, pp. 57–68.
Castilla, R.A., Audemard, F.A., 2007. Sand blows as a potential tool for magnitude estimation ofpre-instrumental earthquakes. J. Seismol. 11, 473–487.
Cetin, K.O., Seed, R.B., Der Kiureghian, A., Tokimatsu, K., Harder, L.F., Kayen, R.E., Moss, R.E.S.,2004. Standard penetration test-based probabilistic and deterministic assessment ofseismic soil liquefaction potential. J. Geotech. Geoenviron. Eng. ASCE 130 (12), 1314–1340.
CGD — Canterbury Geotechnical Database, 2012. Aerial Photography Map Layer CGD0100 — 1June 2012, retrieved [12/12] from https://canterburygeotechnicaldatabase.projectorbit.com.
Chiou, B.S.-J., Youngs, R.R., 2008. An NGA model for the average horizontal component of peakground motion and response spectra. Earthq. Spectra 24, 173–216.
Christensen, S.A., Mar 2001. Regional Liquefaction Study forWaimakariri District. Proceedings ofthe New Zealand Society of Earthquake Engineering 2001 Technical Conference. NewZealand Society of Earthquake Engineering, Taupo NZ, pp. 23–25.
Cox, R.T., Larsen, D., Forman, S.L., Woods, J., Morat, J., Galluzzi, J., 2004. Preliminary assessment ofsand blows in the southern Mississippi embayment. Bull. Seismol. Soc. Am. 93 (3),1125–1142.
Cox, R.T., Hill, A.A., Larsen, D., Holzer, T., Forman, S.L., Noce, T., Gardner, C., Morat, J., 2007.Seismotectonic implications of sand blows in the southern Mississippi embayment. Eng.Geol. 89, 278–299.
Darendeli, M.B., 2001. Development of a new family of normalized modulus reduction andmaterial damping curves PhD Dissertation University of Texas at Austin, Austin, TX USA.
De Lange, W.P., Healy, T.R., 1986. New Zealand tsunamis 1840–1982. N. Z. J. Geol. Geophys. 29,115–134.
De Pascale, G.P., Langridge, R.M., 2012. New on-fault evidence for a great earthquake in A.D.1717, central alpine fault, New Zealand. Geology 40 (9), 791–794.
Dobry, R., Ladd, R.S., Yokel, F.Y., Chung, R.M., Powell, D., 1982. Prediction of pore water pressurebuildup and liquefaction of sands during earthquakes by the cyclic strain method, NBSBuilding Science Series 138. US Department of Commerce (152 pp.).
Dobry, R., Powell, D.J., Yokel, F.Y., Ladd, R.S., 1980. Liquefaction potential of saturated sand— thestiffness method. Proceedings of the 7th World Conference on Earthquake Engineering,Istanbul 3, pp. 25–32.
Dorn, C., Green, A.G., Jongens, R., Carpentier, S., Kaiser, A.E., Campbell, F., Finnemore, M., Pettinga,J., 2010. High -resolution seismic images of potentially seismogenic structures beneath thenorthwest Canterbury plains, New Zealand. J. Geophys. Res. 115 (B11).
Doser, D.I., Robinson, R., 2002. Modeling stress chanfes induced by earthquakes in the southernMarlborough region, south island, New Zealand. Bull. Seismol. Soc. Am. 92 (8), 3229–3238.
Downes, G., Yetton, M., 2012. Pre-2010 historical seismicity near Christchurch, New Zealand:the 1869 Mw4.7–4.9 Christchurch and 1870 Mw5.6–5.8 lake Ellesmere earthquakes. N. Z.J. Geol. Geophys. 55 (3), 199–205.
Dowrick, D.J., Smith, E.G.C., 1990. Surface wave magnitudes of some New Zealand earthquakes1901–1988. Bull. N. Z. Natl. Soc. Earthq. Eng. 23, 198–210.
Fairless, G., Berrill, J., 1984. Liquefaction during historic earthquakes in New Zealand. Bull. N. Z.Soc. Earthq. Eng. 17, 280–291.
Franks, C.A., 1988. Engineering geological aspects of the edgecomb, New Zealand earthquake of2 March 1987. Q. J. Eng. Geol. 21, 337–345.
Galli, P., 2000. New empirical relationships between magnitude and distance for liquefaction.Tectonophysics 324, 169–187.
GeoNet (2015). “New Zealand earthquake occurrence data: felt quakes.” bhttp://geonet.org.nz/N(Aug. 21 2015).
Glassey, P.J., 2006. Geological hazards: Southland district council lifelines study. GNS ScienceConsultancy Report 2006/100. GNS Science Research Centre, Dunedin New Zealand.
Geotechnical Reconnaissance of the 2010 Darfield (New Zealand) earthquake. In: Green, R.A.,Cubrinovski, M. (Eds.), Report of the National Science Foundation-Sponsored GeotechnicalExtreme Events Reconnaissance (GEER) Team, GEER Association Report No. GEER-024.
Green, R.A., Lee, J., 2010. The influence of near-fault rupture directivity on liquefaction. Proc.Ninth US National and Tenth Canadian Conf. on Earthquake Engineering, Toronto,Canada, 25–29 July 2010.
Green, R.A., Olson, S.M., 2015. Interpretation of liquefaction field case histories for use indeveloping liquefaction triggering curves. Proc. 6th International Conference on EarthquakeGeotechnical Engineering (6ICEGE), Christchurch, New Zealand, 2–4 November (in press).
Green, R.A., Terri, G.A., 2005. Number of Equivalent Cycles Concept for Liquefaction Evaluations -Revisited. J. Geotech. Geoenviron. 131 (4), 477–488.
Green, R.A., Cubinovski, M., Cox, B., Wood, C., Wotherspoon, L., Bradley, B., Maurer, B.W., 2014.Select liquefaction case histories from the 2010–2011 Canterbury earthquake sequence.Earthq. Spectra 30 (1), 131–153.
Green, R.A., Lee, J., White, T.M., Baker, J.W., 2008. The Significance of Near-Fault Effects onLiquefaction. Proc. 14th World Conf. on Earthquake Engineering, Paper No. S26-019.
Green, R.A., Maurer, B.W., Bradley, B.A., Wotherspoon, L., Cubrinovski, M., 2013. Implicationsfrom Liquefaction Observations in New Zealand for Interpreting Paleoliquefaction Data inthe Central-Eastern United States (CEUS). Final Technical Report Award No. G12AP20002.U.S. Geological Survey, Reston, VA.
Green, R.A., Maurer, B.W., Wotherspoon, L., Cubrinovski, M., Quigley, M., Bastin, S., 2012. Use ofliquefaction observations in New Zealand for interpreting paleoliquefaction features in theNMSZ. Seismol. Res. Lett. 84 (1), 153.
Green, R.A., Olson, S.M., Obermeier, S.F., 2005. Geotechnical analysis of paleoseismic shakingusing liquefaction effects: field examples. Eng. Geol. 76, 263–293.
Hancox, G.T., 2005. Landslides and liquefaction effects caused by the 1855 Wairarapaearthquake: then and now. In: Townend, J., Langridge, R., Jones, A. (Eds.), The 1855Wairarapa Earthquake Symposium: 150 years of thinking about magnitude 8+ earth-quakes and seismic hazard in New Zealand. Greater Wellington Regional Council.
Hancox, G.T., Dellow, G., Mc Saveney, B., Villamor, P., 2004. Reconnaissance studies of landslidescaused by the ML 5.4 Lake Rotoehu earthquake and swarm of July 2004. Institute ofGeological & Nuclear Sciences Science report 2004/24 (21 pp.).
Hornblow, S., Quigley, M., Nicol, A., Van Dissen, R., Wang, N., 2014. Paleoseismology of the 2010Mw 7.1 Darfield (Canterbury) earthquake source, Greendale fault, New Zealand.Tectonophysics 637, 178–190.
Howard, M., Nicol, A., Campbell, J., Pettinga, J.R., 2005. Holocene paleoearthquakes on the strike-slip Porters Pass Fault, Canterbury, New Zealand. N. Z. J. Geol. Geophys. 48, 59–74.
Idriss, I.M., Boulanger, R.W., 2008. Soil liquefaction during earthquakes. Monograph MNO-12.Earthquake Engineering Research Institute, Oakland, CA (261 pp.).
Ishibashi, I., Zhang, X.J., 1993. Unified dynamic shear moduli and damping ratios of sand andclay. Soils Found. 33 (1), 182–191.
Kam, W.Y., Akguzel, U., Pampanin, S., 2011. 4 weeks on: preliminary reconnaissance reportfrom the Christchurch 22 Feb 2011 6.3Mw earthquake. Report, New Zealand Society ofEarthquake Engineering, Wellington, New Zealand.
Kayen, R., Moss, R.E.S., Thompson, E.M., Seed, R.B., Cetin, K.O., Der Kiureghian, A., Tanaka, Y.,Tokimatsu, K., 2013. Shear-wave velocity-based probabilistic and deterministic assessmentof seismic soil liquefaction potential. J. Geotech. Geoenviron. 139 (3), 407–419.
Kuribayahsi, E., Tatsuoka, F., 1975. Brief review of liquefaction during earthquakes in Japan. SoilsFound. 15 (4), 81–92.
Lasley, S., Green, R.A., Rodriguez-Marek, A., 2015. Number of equivalent stress cycles forliquefaction evaluations in active tectonic and stable continental regimes. Journal ofGeotechnical and Geoenvironmental Engineering (in press).
Mackey, B.H., Quigley, M.C., 2014. “Strong proximal earthquakes revealed by cosmogenic 3Hedating of prehistoric rockfalls, Christchurch, New Zealand. Geology 42 (11), 975–978.
Mason, D.P.M., Little, T.A., 2006. Refined slip distribution and moment magnitude of the 1848Marlborough earthquake, Awatere fault, New Zealand. N. Z. J. Geol. Geophys. 49 (3), 375–382.
Maurer, B.W., Green, R.A., Bradley, B.A., Cubrinovski, M., 2014. Assessment of aging correctionfactors for liquefaction resistance at sites of recurrent liquefaction. 10th National Confer-ence on Earthquake Engineering, July 20–26, Anchorage Alaska. Network for EarthquakeEngineering Simulation (distributor) http://dx.doi.org/10.4231/D3B27PR92 (10 pp.).
Moss, R.E.S., Seed, R.B., Kayen, R.E., Stewart, J.P., Der Kiureghian, A., Cetin, K.O., 2006. CPT-basedprobabilistic and deterministic assessment of in situ seismic soil liquefaction potential.J. Geotech. Geoenviron. Eng. ASCE 132 (8), 1032–1051.
Obermeier, S.F., 1996. Using liquefaction-induced features for paleoseismic analysis. In:McCalpin, J.P. (Ed.), Paleoseismology. Academic Press, San Diego, CA, pp. 331–396.
Obermeier, S.F., 1998. Liquefaction evidence for strong earthquakes of Holocene and latestPleistocene ages in the states of Indiana and Illinois, USA. Eng. Geol. 50, 227–254.
Obermeier, S.F., Dickenson, S.E., 2000. Liquefaction evidence for the strength of ground motionsresulting from the late Holocene Cascadia subduction earthquakes, with emphasis on theevent of 1700 A.D. Bull. Seismol. Soc. Am. 90 (4), 876–896.
Obermeier, S.F., Olson, S.M., Green, R.A., 2005. Field occurrences of liquefaction-inducedfeatures: a primer for engineering and geologic analysis of paleoseismic shaking. Eng.Geol. 76, 209–234.
Obermeier, S.F., Pond, E.C., Olsen, S.M. with contributions by Green, R.A., Mitchell, J.K., and Stark,T.D. (2001). “Paleoliquefaction studies in continental settings: geologic and geotechnical fac-tors in interpretations and back-analysis.” U.S. Geological Survey Open-File Report 01–029.
Olson, S.M., Green, R.A., Obermeier, S.F., 2005a. Geotechnical analysis of paleoseismic shakingusing liquefaction features: a major updating. Eng. Geol. 76, 235–261.
Olson, S.M., Green, R.A., Obermeier, S.F., 2005b. Revised magnitude bound relation for theWabash valley seismic zone of the central United States. Seismol. Res. Lett. 76 (6), 756–771.
Papadopoulos, G.A., Lefkopoulos, 1993. Magnitude-distance relations for liquefaction in soilfrom earthquakes. Bull. Seismol. Soc. Am. 83 (3), 925–938.
Papathanassiou, G., Pavlides, S., Christaras, B., Pitilakis, K., 2005. Liquefaction case histories andempirical relations of earthquake magnitude versus distance from the broader Aegeanregion. J. Geodyn. 40, 257–278.

266 B.W. Maurer et al. / Engineering Geology 197 (2015) 253–266
Parker, M and Steenkamp, D. (2012). “The economic impact of the Canterbury earthquakes.”Reserve Bank of New Zealand: Bulletin 75(3): 13–25.
Pirrotta, C., Barbano, M.S., Guarnieri, P., Gerardi, F., 2007. A new dataset and empiricalrelationships between magnitude/intensity and epicentral distance for liquefaction incentral-eastern Sicily. Ann. Geophys. 50(6), 763–774.
Quigley, M., Bastin, S., Bradley, B., 2013. Recurrent liquefaction in Christchurch, New Zealandduring the Canterbury earthquake sequence. Geology 41 (4), 419–422.
Reyners, M., McGinty, P., Cox, S., Turnbull, I., O'Neill, T., Gledhill, K., Hancox, G., Beavan J.,Matheson, D., McVerry, G., Cousins, J., Zhao, J., Cowan, H., Caldwell, G., Bennie, S., the GeoNetteam. (2003). “The Mw7.2 Fiordland earthquake of August 21, 2003: background andpreliminary results.” Bull. N. Z. Soc. Earthq. Eng., 36(4): 233–248.
Rix, G.J., Stokoe, K.H., 1991. Correlation of initial tangent modulus and cone penetrationresistance. In: Huang, A.B. (Ed.), Calibration Chamber TestingInternational Symposium onCalibration Chamber Testing. Elsevier Publishing, New York, pp. 351–362.
Robertson, P.K.,Wride, C.E., 1998. Evaluating cyclic liquefaction potential using cone penetrationtest. Can. Geotech. J. 35 (3), 442–459.
Scherbaum, F., Schmedes, J., Cotton, F., 2004. On the conversion of source-to-site distancemeasuresfor extended earthquake source models. Bull. Seismol. Soc. Am. 94 (3), 1053–1069.
Seed, H.B., DeAlba, P., 1986. Use of the SPT and CPT tests for evaluating the liquefactionresistance of sands. Use of in-situ Tests in Geotechnical Engineering, ASCE GeotechnicalSpecial Publication 6, pp. 281–302.
Seed, H.B., Idriss, I.M., 1971. Simplified procedure for evaluating soil liquefaction potential. J. SoilMech. Found. Div. ASCE 97 (9), 1249–1273.
Seed, H.B., Tokimatsu, K., Harder, L.F., Chung, R.M., 1985. Influence of SPT procedures in soilliquefaction resistance evaluations. J. Geotech. Eng. Div. ASCE 111 (2), 1425–1445.
Seed, H.B., Wong, R.T., Idriss, I.M., Tokimatsu, K., 1986. Moduli and damping factors for dynamicanalyses of cohesionless soils. J. Geotech. Geoenviron. 112 (GT11), 1016–1032.
Stark, T.D., Olson, S.M., 1995. Liquefaction resistance using CPT and field case histories.J. Geotech. Eng. ASCE 121 (12), 856–869.
Stirling, M., Litchfield, N., Smith, W., Barnes, P., Gerstenberger, M., McVerry, G., Pettinga, J., 2007.Updated probabilistic seismic hazard assessment for the Canterbury region. EnvironmentCanterbury Report No. U06/6.
Stirling, M., Yetton, M., Pettinga, J., Berryman, K., Downes, G., 1999. Probabilistic seismic hazardassessment and earthquake scenarios for the Canterbury region, and historic earthquakesin Christchurch: stage 1 (part b) of Canterbury regional council's earthquake hazard andrisk assessment study. IGNS Report U99/18.
Sutherland, R, Eberhart-Phillips, D., Harris, R.A., Stern, T.A., Beavan, R.J., Ellis, S.M., Henrys, S.A.,Cox, S.C., Norris, R.J., Berryman, K.R., Townend, J., Bannister, S.C., Pettinga, J., Leitner, B.,Wallace, L.M., Little, T.A., Cooper, A.F., Yetton, M., and Stirling, M.W. (2007). “Do greatearthquakes occur on the Alpine Fault in central South Island, New Zealand?” p. 235–251in: Okaya, D.A.; Stern, T.A.; Davey, F.J. (eds) A continental plate boundary: tectonics atSouth Island, New Zealand. Washington, DC: American Geophysical Union. Geophysicalmonograph 175.
Syracuse, E.M., Thurber, C.H., Rawles, C.J., Savage, M.K., Bannister, S., 2013. High-resolutionrelocation of aftershocks of the Mw7.1 Darfield, New Zealand, earthquake and implicationsfor fault activity. J. Geophys. Res. 118 (8), 4184–4195.
Talwani, P., Schaeffer, W.T., 2001. Recurrence rates of large earthquakes in the South Carolinacoastal plain based on paleoliquefaction data. J. Geophys. Res. 106, 6621–6642.
Towhata, I., Maruyama, S., Kasuda, K., Koseki, J., Wakamatsu, K., Kiku, H., Kiyota, T., Yasuda, S.,Taguchi, Y., Aoyama, S., Hayashida, T., 2014. Liquefaction in the Kanto region during the2011 off the pacific coast of Tohoku earthquake. Soils Found. 54 (4), 859–873.
Tuttle, M.P., Hartleb, R., 2012. Appendix E: Central and Eastern U.S. paleoliquefaction database,uncertainties associated with paleoliquefaction data, and guidance for seismic sourcecharacterization, in the Central and Eastern U.S. Seismic Source Characterization for NuclearFacilities, Technical Report, EPRI, Palo Alto, CA, U.S. DOE, and U.S. NRC, 135 p. plus database.
Tuttle, M.P., 2001. The use of liquefaction features in paleoseismology: lessons learned in thenew Madrid seismic zone, central United States. J. Seismol. 5, 361–380.
Tuttle, M., Villamor, P., Almond, P., 2012. Paleoliquefaction lessons learned from the 2010–2011Canterbury, New Zealand, earthquakes. Geol. Soc. Am. Abstr. Programs 44 (7), 302.
Tuttle, M.P., Dyer-Williams, K., Barstow, N.L., 2002a. Paleoliquefaction study of the Clarendon-Lindon fault system, western New York state. Tectonophysics 353, 263–286.
Tuttle, M.P., Schweig, E.S., Campbell, J., Thomas, P.M., Sims, J.D., Lafferty, R.H., 2005. Evidence fornew Madrid earthquakes in A.D. 300 and 2350 B.C. Seismol. Res. Lett. 76, 489–501.
Tuttle, M.P., Schweig, E.S., Sims, J.D., Lafferty, R.H., Wolf, L.W., Haynes, M.L., 2002b.The earthquake potential of the new Madrid seismic zone. Bull. Seismol. Soc. Am. 92 (6),2080–2089.
Van Dissen, R., McSaveney, M., Townsend, D., Hancox, G., Little, T.A., Ries, W., Perrin, N.,Archibald, G., Dellow, G., Massey, C., Misra, S., 2013. Landslides and liquefaction generatedby the Cook Strait and Lake Grassmere earthquakes: a reconnaissance report. Bull. N. Z. Soc.Earthq. Eng. 46 (4), 196–200.
Villamor, P., Giona-Bucci, M., Almond, P., Tuttle, M., Langridge, R., Clark, K., Ries, W., Vandergoes,M., Barker, P., Martin, F., Bastin, S., Watson, M., Howarth, J., Quigley, M., 2014. Exploringmethods to assess paleoliquefaction in the Canterbury area. GNS Science ConsultancyReport 2014/183. GNS Science, Lower Hutt New Zealand (142 pp.).
Wakamatsu, K., 1993. History of Soil Liquefaction in Japan and Assessment of LiquefactionPotential Based on Geomorphology. A Thesis in the Department of Architecture Presentedin Partial Fulfillment of the Requirements for the Degree of Doctor of Engineering. WasedaUniversity, Tokyo, Japan.
Whitman, R.V., 1971. Resistance of soil to liquefaction and settlement. Soils Found. 11 (4),59–68.
Wood, C.M., Cox, B.R., Wotherspoon, L.M., Green, R.A., 2011. Dynamic site characterization ofChristchurch strong motion stations. Bull. N. Z. Soc. Earthq. Eng. 44 (4), 195–204.
Wotherspoon, L., Orense, R., Bradley, B.A., Cox, B., Green, R.A., Wood, C., 2014. Soil profilecharacterization of Christchurch strong motion stations. Proc. 10th National Conferenceon Earthquake Engineering (10NCEE), Anchorage, AK, 21–25 July.
Youd, T.L., Hoose, S.N., 1977. Liquefaction susceptibility and geologic setting. Proceedings of the6th World Conference on Earthquake Engineering, New Delhi, India 3, pp. 2189–2194.
Youd, T.L., Perkins, D.M., 1978. Mapping liquefaction-induced ground failure potential.J. Geotech. Eng. Div. 104, 433–446.
Youd, T.L., Idriss, I.M., Andrus, R.D., Arango, I., Castro, G., Christian, J.T., Dobry, R., Finn, W.D.L.,Harder, L.F., Hynes, M.E., Ishihara, K., Koester, J.P., Liao, S.S.C., Marcuson, W.F., Martin, G.R.,Mitchell, J.K., Moriwaki, Y., Power, M.S., Robertson, P.K., Seed, R.B., Stokoe, K.H., 2001.Liquefaction resistance of soils: summary report from the 1996 NCEER and 1998 NCEER/NSF workshops on evaluation of liquefaction resistance of soils. J. Geotech. Geoenviron.127 (4), 297–313.