development of measurement techniques - cisas.unipd.it · phd student gloria allevi curriculum...
TRANSCRIPT

PhD Student Gloria Allevi
Curriculum Mechanical Measurement for Engineering and Space
Event Request of admission to the second year of the PhD Course
Development of measurement techniques for aerospace components inspection

Shearography Inspection
• Quantitative defect size and morphology characterization in aerospace composites
• Improving the accuracy on the defect size estimation using wavelet transform

«Quantitative Defect Size Estimation in Shearography Inspection by Wavelet Transform and Shear Correction»
G.M. Revel, G. Pandarese, G. Allevi
Work discussed during the International Conference «Metrology for Aerospace»
Padua, 21-23 June 2017

Composite material
Shearography camera
Laser diode
Load Lamp
Speckle Images
Optical effect of coherent lightinteracting with rough surface
• Interferometric, full-field technique
• Short time inspection large area
• Transportable - on field application
Defect
Phase image
• No need of reference beam
• Output fist derivate along a specific direction (shear) of the out of plane –displacement of the observed surface

Proposed algorithm
1. Localized shear computation
(1)
(2)
200 400 600 800 1000 1200
100
200
300
400
500
600
700
800
900
1000
(3)

2. Wavelet Transform Scanning on theunwrapped phase map• Entropy based-threshold for imagebinarizing and centroid detection• Definition of a set of lines passingthrough the centroid (1 degree-pitch)• Deduction of the phase profiles alongthe scanning lines by a sub-pixelinterpolation• Computing the wavelet transform foreach profile.• Extracting the significant singularity ofthe wavelet representative of the edgeof the profile (Mexican Hat Wavelet)
Proposed algorithmLines passing through the centroid
Pixels
Pix
els
100 200 300 400 500 600
100
200
300
400
500
600
*
Investigated curve
Entropy threshold and centroid
0°
130°
10°
Structural intensity of the estimated wavelet maxima with weight functions
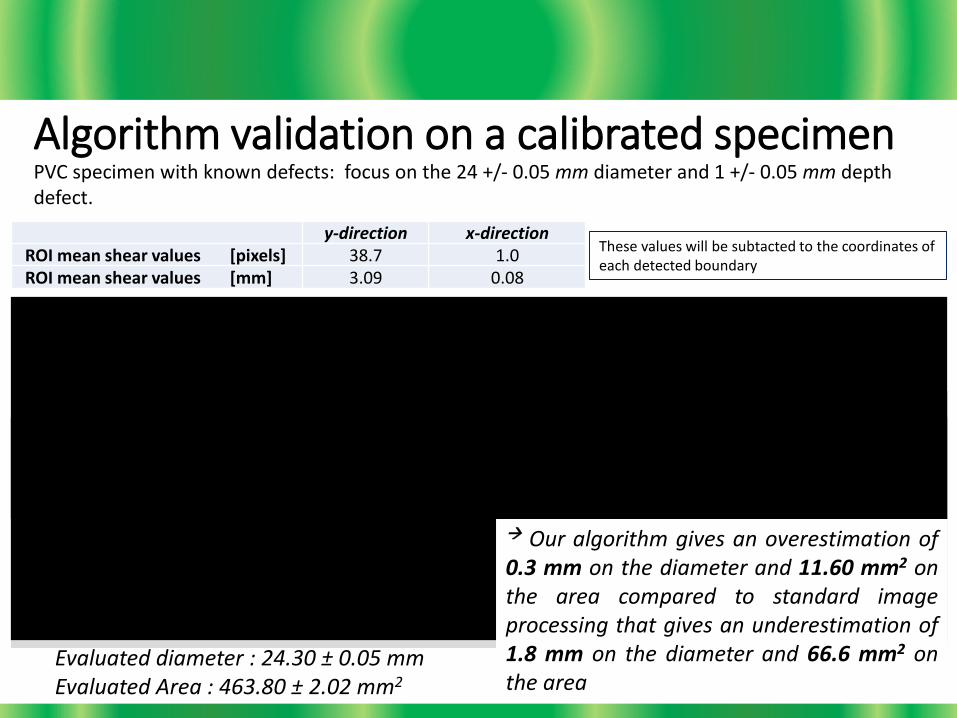
Algorithm validation on a calibrated specimenPVC specimen with known defects: focus on the 24 +/- 0.05 mm diameter and 1 +/- 0.05 mm depth defect.
• r = 2 Mexican Hat Wavelet to detect the signal curvatures• m0 = 0.008 optimal value in the range [0.005;0.15]
y-direction x-directionROI mean shear values [pixels] 38.7 1.0ROI mean shear values [mm] 3.09 0.08
These values will be subtacted to the coordinates of each detected boundary
Evaluated diameter : 24.30 ± 0.05 mmEvaluated Area : 463.80 ± 2.02 mm2
Our algorithm gives an overestimation of0.3 mm on the diameter and 11.60 mm2 onthe area compared to standard imageprocessing that gives an underestimation of1.8 mm on the diameter and 66.6 mm2 onthe area

Application on an aerospace component
• Sandwich panel with a Nomex® honeycomb core (24 mm) and a 1.5 mm depth-fiberglass skin
• A delamination of unknown size is on the panel
• The processed image was stored after a minute of relaxation successive to a 5 s thermal load, at a distance of 35 cm from the surface
Value Unit of measurementCalibration Factor 0.18 mm/pixelY - shear 2.89 mmX - shear 0.16 mm
Thermal load
SandwichPanel
Laser diodes
35 cm
• Estimated area : 765.50 mm2
• Equivalent diameter : 31.21 mm
20.5
21
21.5
22
22.5
23
23.5
24
24.5
0.5 0.7 0.9 1.1 1.3 1.5
Wav
elet
Tran
sfo
rmSc
ann
ing
eval
uat
ed-d
iam
eter
[m
m]
Contrast to Noise Ratio
20.5
21
21.5
22
22.5
23
23.5
24
24.5
0.5 0.7 0.9 1.1 1.3 1.5
Entr
op
yb
ased
-th
resh
old
mea
sure
d-d
iam
eter
[m
m]
Contrast To Noise Ratio
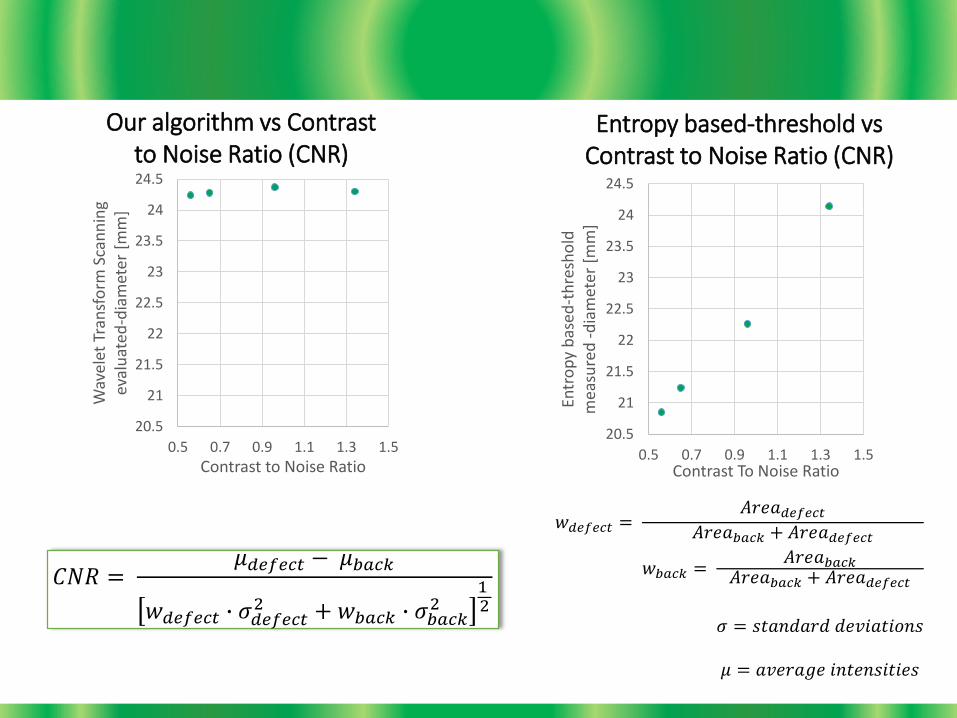
Our algorithm vs Contrast to Noise Ratio (CNR)
Entropy based-threshold vs Contrast to Noise Ratio (CNR)
𝐶𝑁𝑅 =𝜇𝑑𝑒𝑓𝑒𝑐𝑡 − 𝜇𝑏𝑎𝑐𝑘
𝑤𝑑𝑒𝑓𝑒𝑐𝑡 ∙ 𝜎𝑑𝑒𝑓𝑒𝑐𝑡2 + 𝑤𝑏𝑎𝑐𝑘 ∙ 𝜎𝑏𝑎𝑐𝑘
212
𝑤𝑑𝑒𝑓𝑒𝑐𝑡 =𝐴𝑟𝑒𝑎𝑑𝑒𝑓𝑒𝑐𝑡
𝐴𝑟𝑒𝑎𝑏𝑎𝑐𝑘 + 𝐴𝑟𝑒𝑎𝑑𝑒𝑓𝑒𝑐𝑡
𝑤𝑏𝑎𝑐𝑘 =𝐴𝑟𝑒𝑎𝑏𝑎𝑐𝑘
𝐴𝑟𝑒𝑎𝑏𝑎𝑐𝑘 + 𝐴𝑟𝑒𝑎𝑑𝑒𝑓𝑒𝑐𝑡
𝜎 = 𝑠𝑡𝑎𝑛𝑑𝑎𝑟𝑑 𝑑𝑒𝑣𝑖𝑎𝑡𝑖𝑜𝑛𝑠
𝜇 = 𝑎𝑣𝑒𝑟𝑎𝑔𝑒 𝑖𝑛𝑡𝑒𝑛𝑠𝑖𝑡𝑖𝑒𝑠

Thermography Inspection
• Feasibility study of Thermoelastic technique on a 3D printed- titanium alloy bracket
• Stress analysis (TSA) • Displacement field analysis (Optical Flow)

Thermoelasticeffect
Tem
pera
ture
( )I
p
TT
C
Constraint
Load cell
Sheaker
Component
FLIR Thermal Camera

• Load 8 Kg• Load frequency 30 Hz• Sampling frequency 150 Hz• Acquisition time 60 s
Phase (stress sign compression/traction)Amplitude ( stress distribution)

Comparison
Thermoelastic results CAD evaluated FEM3D reconstructedgeometry-evaluated FEM

Optical Flow Analysis• The hypothesis of brightness constancy is not valid!!!
• The formula must be evaluated frame by frame (no mean image!)
Selection of a Region Of Interest (ROI) Evaluation of mm/pixel ratio Post-processing Lock-In Gradient evaluation for each frame Y-displacement calculation
0
0 ,,,
I
tyxIyxIs
kjkj
𝐼0:mean image
𝐼: frame at istant 𝑡
𝐼: frame at istant 𝑡
s : gradient oriented -displacement
)(
,,,,
tI
ttyxItyxIy
y
kjkj

Vertical displacement magnitude [mm] at t = 0.02s
3.6001mm
10 20 30 40 50 60 70
-10
0
10
20
30
40
50
60 0
5
10
15
20
25
30
35
40
45
50Vertical displacement magnitude [mm] at t = 0.02s
3.6001mm
10 20 30 40 50 60 70
-10
0
10
20
30
40
50
60 0
5
10
15
20
25
30
35
40
45
50
0.1 0.2 0.3 0.4 0.5 0.6 0.7 0.8 0.9 1-15
-10
-5
0
5
10
Time [s]
Dis
pla
cem
ent
[mm
]
On average, the extracted pointsreveal a 5 mm maximum-verticaldisplacement at the load frequency
Example of time history of y-displacement
Region Of Interest

Future work
Thermography
• Optical flow code validation
• Application on thermal deformations measurements (comparison with Digital Image
Correlation)
• Application on thermal vacuum chamber-tests
• Thermoelastic/displacement modal analysis on aerospace structures
Shearography
• Algorithm improvement
• Making results independent on test conditions (load, shear, distance from the surface…)
• Comparison with ultrasound tests results

Thanks for your attention
PhD Student Gloria Allevi
Curriculum Mechanical Measurement for Engineering and Space
Event Request of admission to the second year of the PhD Course