development of modified natural zeolites and …
TRANSCRIPT
DEVELOPMENT OF MODIFIED NATURAL ZEOLITES AND STUDY OF
PHOSPHATE REMOVAL FROM AQUEOUS SOLUTIONS
by
Saki Kondo
B.Eng., Toyo University, 2007 M.Eng., Graduate School of Toyo University, 2009
THESIS SUBMITTED IN PARTIAL FULFILLMENT OF THE REQUIREMENTS FOR THE DEGREE OF
MASTER OF SCIENCE IN
NATURAL RESOURCES AND ENVIRONMENTAL STUDIES (ENVIRONMENTAL SCIENCE)
UNIVERSITY OF NORTHERN BRITISH COLUMBIA
March 2019
© Saki Kondo, 2019
brought to you by COREView metadata, citation and similar papers at core.ac.uk
provided by British Columbia's network of post-secondary digital repositories
i
Abstract
Lake eutrophication has been an issue in many countries including Canada. Controlling and
reducing the level of phosphorus, which is available as a form of phosphate in water, have been
studied to manage the lake eutrophication. Natural zeolite-based adsorbents are one of the best
candidates for water treatment due to its wide availability, cost-effectiveness, and superior
characteristics as an ion exchanger. In this study, the concept of struvite crystallization was
employed to develop magnesium-ammonium-modified zeolites (MNZ). Their removal
capacity of phosphate was tested with comparison of magnesium-modified zeolites (MZ) based
on the design of experiments (DOE) and response surface methodology (RSM). According to
RSM, MNZ was found to be more effective in removing phosphates from aqueous solutions
up to 92% of removal while MZ was effective up to 46% of removal. Contact time and zeolite
dosage were found to be the significant parameters on phosphate removal.
Keywords: Natural zeolite, eutrophication, phosphate, struvite, water treatment
ii
Table of Contents
Abstract ....................................................................................................................................... i List of Tables ............................................................................................................................ iv List of Figures ............................................................................................................................ v List of Acronyms ...................................................................................................................... vi Acknowledgements..................................................................................................................vii Chapter 1: Introduction and Literature Review ......................................................................... 1
1.1 Background of Study........................................................................................................ 1 1.2 Research Objective ........................................................................................................... 2 1.3 Novelty of Study .............................................................................................................. 3 1.4 Literature Review ............................................................................................................. 4
1.4.1 Lake Eutrophication and Controlling Phosphorus ..................................................... 4 1.4.2 Trigger Ranges of Phosphorus and Eutrophic State of Water ................................... 6 1.4.3 Natural Zeolites for Water Treatment ........................................................................ 7 1.4.4 Modified Natural Zeolites for Reducing Phosphate in Water .................................. 10 1.4.5 Formation of Struvite for Phosphate Removal ........................................................ 11
Chapter 2: Materials and Methods ........................................................................................... 15 2.1 Preparation of MZ and MNZ ......................................................................................... 15
2.1.1 Preliminary Test of Modification Process on NZ .................................................... 15 2.1.2 Preparation of MZ and MNZ for Phosphate Removal with DOE ........................... 17
2.2 Characterization of Zeolite Samples .............................................................................. 18 2.2.1 Chemical and Physical Properties of Zeolite Samples ............................................ 18 2.2.2 Trace Elemental Analysis by Leaching Test ............................................................ 19 2.2.3 Trace Elemental Analysis by Acid Digestion .......................................................... 19 2.2.4 Determination of Cation Exchange Capacity (CEC) ............................................... 20
2.3 Study of Phosphate Removal by Zeolite Samples ......................................................... 22 2.3.1 Preliminary Tests for Phosphate Removal ............................................................... 22 2.3.2 Optimization of Phosphate Removal Process Using DOE and RSM Statistical Methods ............................................................................................................................ 25
Chapter 3: Results and Discussion .......................................................................................... 29 3.1 Characterization of Zeolite Samples .............................................................................. 29
3.1.1 Chemical and Physical Properties of Zeolite Samples ............................................ 29 3.1.2 Trace Elemental Analysis by Leaching Test ............................................................ 31 3.1.3 Trace Elemental Analysis by Acid Digestion .......................................................... 32 3.1.4 Determination of Cation Exchange Capacity (CEC) ............................................... 37
iii
3.2 Study of Phosphate Removal by Zeolite Samples ......................................................... 40 3.2.1 Preliminary Tests for Phosphate Removal ............................................................... 40 3.2.2 Optimization of Phosphate Removal Process Using DOE and RSM Statistical Methods ............................................................................................................................ 46 3.2.3 Assessment of the Amounts of P on Spent Zeolite Samples.................................... 59
Chapter 4: Conclusion and Future Work ................................................................................. 64 References................................................................................................................................ 68
Appendix A .......................................................................................................................... 73 Appendix B .......................................................................................................................... 78
iv
List of Tables
Table 1. Total phosphorus trigger ranges for Canadian lakes and rivers (adopted from [10]) Table 2. Conditions for preliminary phosphate removal test #1, #2, and #3. Table 3. Independent variables of the experimental design (MZ and MNZ) Table 4. Major elements in leachate from ICP-OES analysis Table 5. Major elements in digestate from ICP-OES analysis Table 6. Decrease of Ba2+, Ca2+, K+, and Na+ in zeolite digestate Table 7. Comparison of Mg2+ in zeolite digestate and leachate Table 8. Comparison of Mg2+ in zeolite samples (digestate) Table 9. Amount of Mg2+ in zeolite samples (for DOE) determined by acid digestion Table 10. Comparison of Mg2+ increased after modification of zeolite samples Table 11. ECEC data from ICP-OES analysis Table 12. CEC data from EA analysis Table 13. Calculation of possible amounts of P removed by MZ Table 14. Calculation for possible amounts of struvite crystal formed
v
List of Figures
Fig.1. 3D Structure of clinoptilolite (Yellow: trapped cations, Red: Oxygen, Grey: Si or Al (Si/Al ≈ 4). Adopted from [12]) Fig.2 Phosphate removal via struvite crystallization (adopted from [32]) Fig.3 Interaction of NH4
+, PO43-, and Mg2+ ions present in struvite and other crystal formations
(adopted from [31]) Fig.4 Comparison of CEC and ECEC Fig.5 Amounts of NH4
+ on zeolite samples measured by EA
Fig.6 RE(%) from preliminary phosphate removal test #1 Fig.7 RE(%) from preliminary phosphate removal test #2 Fig.8 RE(%) from preliminary phosphate removal test #3 Fig.9 Mg content in solution after phosphate removal in test #3 Fig.10.1 RE(%) data from DOE (MZ) at pH 7 Fig.10.2 RE(%) data from DOE (MZ) at pH 9 Fig.11 Pareto Chart for results of MZ (output of Minitab software) Fig.12 Normal probability plot for results of MZ (output of Minitab software) Fig.13 Main effects plot for results of MZ (output of Minitab software) Fig.14 Interaction plot for results of MZ (output of Minitab software) Fig 15. Surface plot for RE(%): MZ [a. RE(%) vs. D, pH, b. RE(%) vs. D, hr, c. RE(%) vs. hr, pH] Fig.16 Comparison of RE(%) observed and predicted: MZ Fig.17.1 RE(%) data from DOE (MNZ) at pH 7 Fig.17.2 RE(%) data from DOE (MNZ) at pH 9 Fig.18 Pareto chart for results of MNZ (output of Minitab software) Fig.19 Normal probability plot: MNZ (output of Minitab software) Fig.20 Main effects plot for results of MNZ (output of Minitab software) Fig.21 Interaction plot for results of MNZ (output of Minitab software) Fig.22 Surface plot for RE(%): MNZ [a. RE(%) vs. hr, pH, b. RE(%) vs. D, pH, c. RE(%) vs. D, hr] Fig.23 Comparison of RE(%) observed and predicted: MNZ
vi
List of Acronyms
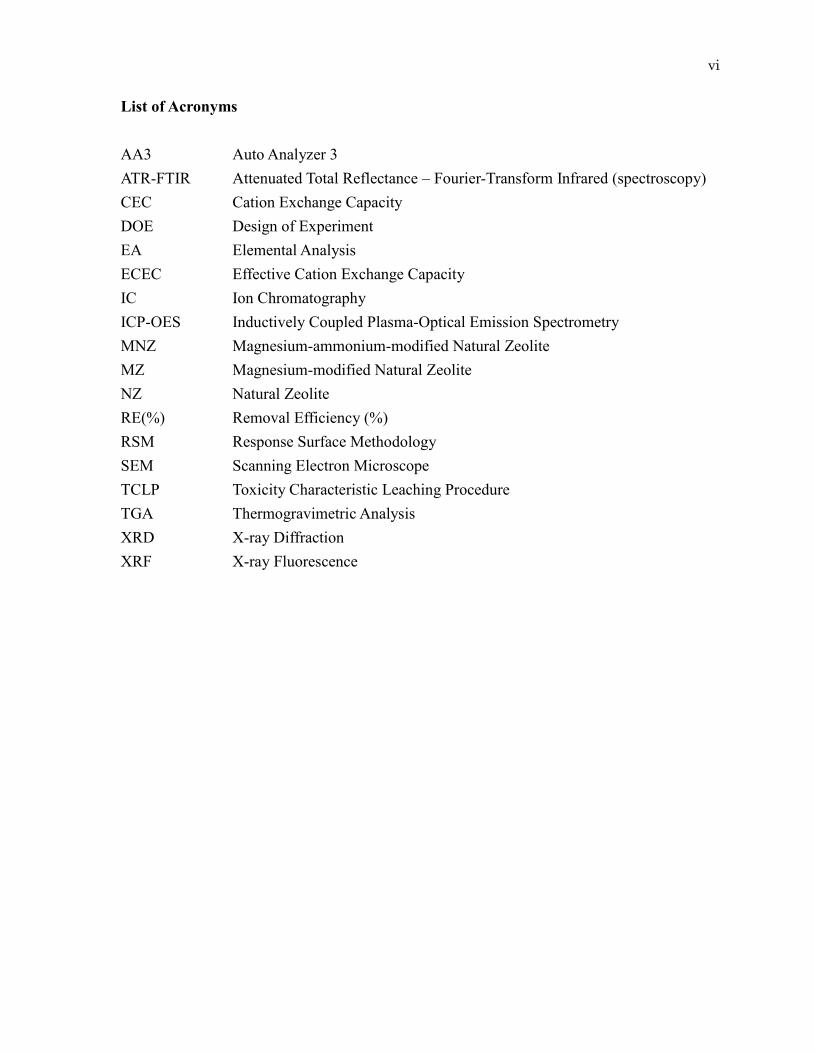
AA3 Auto Analyzer 3 ATR-FTIR Attenuated Total Reflectance – Fourier-Transform Infrared (spectroscopy) CEC Cation Exchange Capacity DOE Design of Experiment EA Elemental Analysis ECEC Effective Cation Exchange Capacity IC Ion Chromatography ICP-OES Inductively Coupled Plasma-Optical Emission Spectrometry MNZ Magnesium-ammonium-modified Natural Zeolite MZ Magnesium-modified Natural Zeolite NZ Natural Zeolite RE(%) Removal Efficiency (%) RSM Response Surface Methodology SEM Scanning Electron Microscope TCLP Toxicity Characteristic Leaching Procedure TGA Thermogravimetric Analysis XRD X-ray Diffraction XRF X-ray Fluorescence

vii
Acknowledgements
I would like to thank my co-supervisors, Drs. Ron Thring and Hossein Kazemian for their
support and guidance throughout my study. I also highly appreciate the feedback on my study
from the committee member, Dr. Chris Opio. In 2018, I was able to obtain a UNBC Research
Project Award for my study. I would like to thank my co-supervisors and Dr. Mike Rutherford
for their help on my application.
For sample measurement and data analysis, I would like to thank the staff at Northern
Analytical Laboratory Services (NALS) at UNBC for their service and advice. I highly
appreciate help from the analytical specialists, Charles Bradshaw and Erwin Rehl, as well as
valuable work experience as a student assistant and communications with students of NALS
team. As for ATR-FTIR measurements and chemical supplies, I would like to thank Liz Dunn
and Conan Ma for their help. As for my thesis writing, I greatly appreciate tutors at Academic
Success Centre for their suggestions and feedback.
In addition to UNBC community, I would like to thank everyone I have ever met in Prince
George since the beginning of my study, and people in Vancouver who encouraged me to attend
UNBC.
Finally, I am the most grateful for support from my mother in Japan that made it possible for
me to complete the MSc program.
1
Chapter 1: Introduction and Literature Review
1.1 Background of Study
Lake eutrophication has been a big issue not only in Canada but also worldwide. In
Canada, Lake Erie is one of the most famous lakes having a history of eutrophication problem
and many researchers have studied to control and reduce the level of phosphorus loading [1].
In nature, phosphorus normally exists as a pentavalent form such as orthophosphate. This is
the main target to remove from contaminated water.
Zeolite is a cost-effective material applied for treatment of several water bodies.
Natural zeolite has been recognized as one of the best candidates for water treatment due to its
wide availability. Modification on zeolite has also been proven to be effective to remove the
specific substances from contaminated water. Modified zeolite can be tailored towards various
applications on water treatment [2].
Struvite has been recognized as a kind of troublesome material which clogs the pipes
while contaminated water travels through [3]. Conversely, recent studies show that struvite
crystallization has a potential for phosphate recovery.
Mg-modified natural zeolite can be useful to remove both PO43- and NH4
+
simultaneously due to the formation of struvite crystal. This research is mainly based on the
2
recent findings and combination of previous studies towards removal of PO43- by using
modified natural zeolites.
1.2 Research Objective
The main objective of this research is to develop a zeolite-based adsorbent to uptake PO43-
from contaminated water. The following activities were conducted to fulfill the objective:
1. Modifying natural zeolites (NZ) with magnesium (Mg2+) as well as both Mg2+ and
ammonium (NH4+). While Mg-zeolites (MZ) are expected to uptake PO4
3- if the
contaminated water contains NH4+ as well, Mg-NH3-zeolites (MNZ) however, can
remove PO43- from contaminated water in the absence of NH4
+. This idea is based on the
hypothesis that Mg2+ can react with PO43- in the presence of NH4
+ to form magnesium
ammonium phosphate {=struvite: MgNH4PO4·6H2O. KSP=10-13.26~10-12.60 [3]} as a
precipitate.
2. Characterizing the natural zeolite and its modified form (MNZ and MZ) with various
methods and techniques, including elemental analysis by Inductively Coupled Plasma-
Optical Emission Spectrometry (ICP-OES), leaching test, elemental analysis by
combustion (EA) for Nitrogen, X-ray Diffraction (XRD), X-ray fluorescence (XRF),
Scanning Electron Microscope (SEM), Thermalgravimetric Analysis (TGA), Ion
3
Chromatography (IC) for anions, Attenuated Total Reflectance-Fourier Transform
Infrared spectroscopy (ATR-FTIR) for functional groups, and Auto Analyzer (AA3) for
NH4+ and PO4
3-.
3. Testing the removal capacity of MNZ and MZ with water body containing fixed amounts
of PO43- to examine how they are effective for the phosphate removal, as well as
determining the optimal conditions of MNZ and MZ for phosphate removal by applying
design of experiment (DOE) and response surface methodology (RSM).
4. Assessing the possible struvite crystal formation and the mechanisms of phosphate
removal based on the findings from the experimental results.
1.3 Novelty of Study
To the best of the author’s knowledge, this is the first time to conduct the modification
of NZ (Bromley deposit, Canadian natural zeolite) with both Mg2+ and NH4+. In addition, there
is no optimization study by DOE and RSM with both MNZ and MZ for assessment of
contaminant removal from water. It also would be beneficial to test the removal capacity using
solution with PO43- concentration of typical contaminated water with and without adding
ammonia by MNZ.
4
1.4 Literature Review
1.4.1 Lake Eutrophication and Controlling Phosphorus
Eutrophication is the process of organic enrichment of an ecosystem due to increased
nutrient inputs [4]. Cultural eutrophication is the dramatic plant growth created by increases in
nutrient concentration from human activity. This has been a major problem which affects most
surface waters [5]. Increases in human activities have highly accelerated the eutrophication
process, altering the carbon, nitrogen, and phosphorus cycles. In addition to natural sources,
nutrients can enter aquatic ecosystems via point and non-point sources such as:
a) municipal and industrial sewage discharges
b) runoff from fertilizers and manure applied to agricultural land
c) from diffuse sources in catchment areas
Non-point sources have been of higher concern since they are larger and more difficult to
manage [6].
According to Schindler et al. [7], the evidence that reducing inputs of phosphorus (P)
is effective in reducing eutrophication comes from four methods:
1. Long-term case histories
2. Multi-year whole lake experiments
3. Experiments where chemical treatments are used to remove P from the water column
5
4. Chemical additions to inhibit return of P from the sediments to the water column
Among those, the method #3 and #4 are related to this study. Although chemical treatments are
very expensive for large lakes, their effectiveness for phosphate removal in lakes was
demonstrated, indicating that controlling P is the key to reducing eutrophication in freshwaters.
One example is that the application of a lanthanum-modified bentonite clay (Phoslock) reduced
P concentrations by 92% in Lake Rauwbraken, Netherlands, causing once-hypereutrophic lake
to become oligo-mesotrophic state. [8]
Controlling both P and nitrogen (N) has been also studied for alleviating
eutrophication, however, there are different standpoints discussed regarding this subject.
Controlling only P inputs to freshwaters while disregarding the large anthropogenic
inputs of N can reduce algal uptake of N [6]. That would allow more N to be transported
downstream where it can worsen eutrophication problems in estuarine and coastal marine
ecosystems. Based on that fact, it was stated that improvements in the water quality of most
freshwater and coastal marine ecosystems would require a decrease in both N and P inputs.
On contrary, there were some eutrophic lakes reported where inputs of both N and P
were decreased for both case studies and whole-lake experiments, but none of those cases
provided evidence that dual nutrient control reduced eutrophication of lakes either more
effectively or rapidly rather than controlling only P [7]. From the previous study at Moses Lake,
6
Washington [9], the author was concluded that targeting both N and P can be too costly and it
may even promote blooms of N-fixing cyanobacteria, especially when there was high internal
P loading.
While reducing nitrogen seems more effective for mitigating eutrophication, there
were several cases reported in which adding N has lessened symptoms of eutrophication [7].
That can lead to the increase in the N:P ratio to values which allow more desirable species to
outcompete cyanobacteria, or to the action which N can play a role as an electron acceptor that
restricts the release of P from sediments.
1.4.2 Trigger Ranges of Phosphorus and Eutrophic State of Water
A trigger range is a desired concentration range for P. If the upper limit of the range is
exceeded, it indicates a potential environmental issue and then triggers further investigations.
There are varieties of natural physical and chemical water quality variables (salinity, pH,
nutrients, etc.) within and between ecosystem types. The preferred method for determining the
trigger ranges is to apply similar, high quality reference sites to decide natural levels. The
ranges are classified according to the trophic status of the reference site. In the Canadian system,
the trigger ranges are based on the trophic classification of the baseline condition or the status
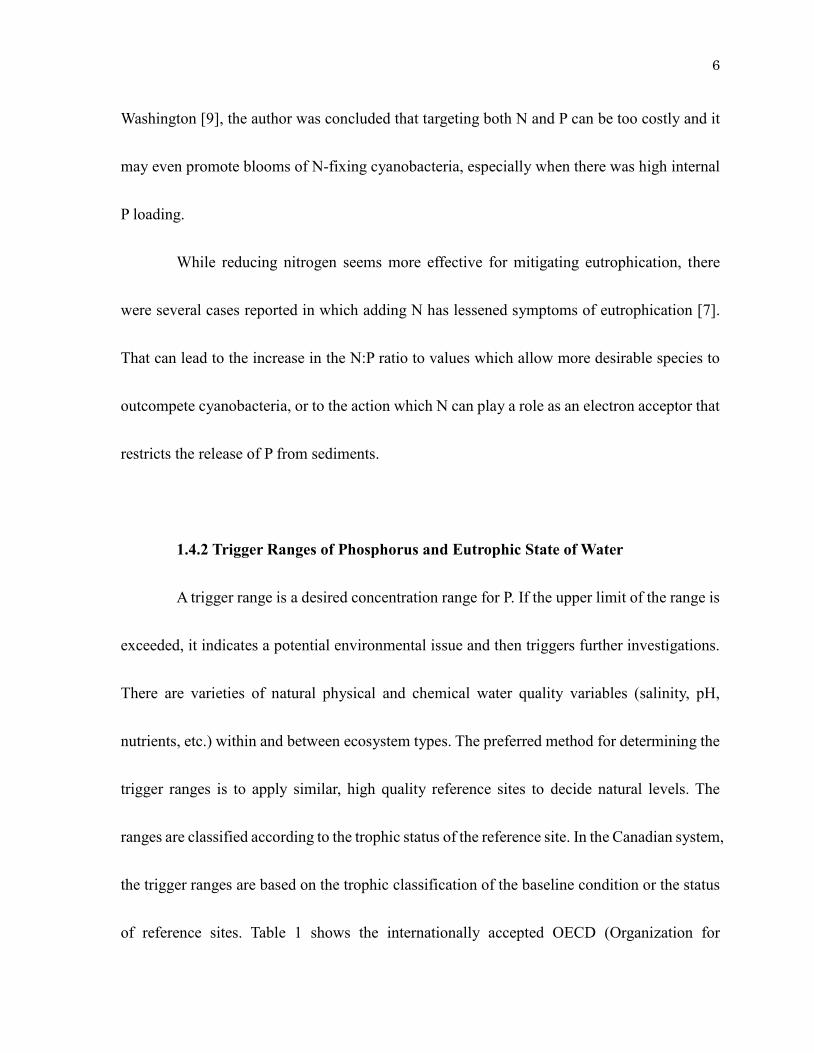
of reference sites. Table 1 shows the internationally accepted OECD (Organization for
7
Economic Co-operation and Development) trophic status values, which are suitable in the
Canadian system. [10]
Table 1. Total phosphorus trigger ranges for Canadian lakes and rivers (adopted from [10])
In aquatic systems, P arrives as a mixture of dissolved and particulate inputs and only exists in
pentavalent forms, such as orthophosphate (PO43-), pyrophosphate (P2O7
4-), and longer-chain
polyphosphates [11].
1.4.3 Natural Zeolites for Water Treatment
There are new research interests in natural zeolites (NZ) for environmental
applications because of their properties and wide availability around the world. Applications
of NZ for water and wastewater treatment have been explored over the decades. Mostly NZ
have been applied to remove cations, such as NH4+ and heavy metal, due to their nature of ion
exchange. However, NZ and modified NZ were also studied for removal of anions and organic
8
compounds from water systems [2].
Many kinds of natural zeolites were identified in the world. Clinoptilolite, mordenite,
phillipsite, chabazite, stilbite, analcime and laumontite are very common forms. Among those,
clinoptilolite: (K2, Na2, Ca)3Al6Si30O72·21H2O is one of the most abundant natural zeolites and
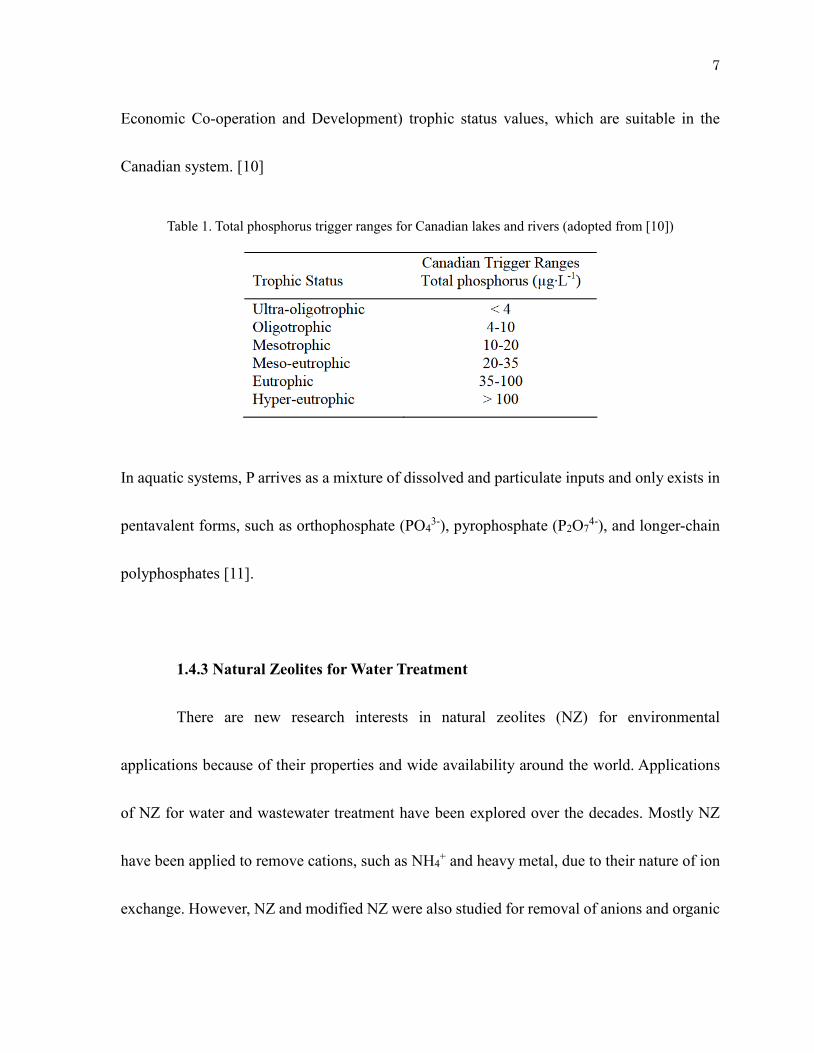
has been widely used for studies in water treatment [2]. Fig.1 shows the 3D structure of
clinoptilolite.
Fig.1. 3D Structure of clinoptilolite (Yellow: trapped cations, Red: Oxygen, Grey: Si or Al (Si/Al ≈ 4).
Adopted from [12])
The principal building block of zeolite framework is the tetrahedron, where Si or Al atom
occupies its center with 4 atoms of oxygen at the vertices. Substitution of Si4+ by Al3+ can
determine the negative charge of the framework, which is compensated by monovalent or
9
divalent cations settled with water. The aluminosilicate framework is the most established and
stable component [2].
Cation exchange capacity (CEC) is one of the important properties of zeolites [13].
CEC results from the existence of loosely bound cations of alkali and alkaline earths elements
in the structure of the zeolites. These loosely bound cations, often called exchangeable cations,
can be easily exchanged while zeolites are in contact with solutions containing saturating ions.
Natural zeolite and natural zeolite-based adsorbents have been studied for treating
different types of wastewater. The applications of zeolites in the agriculture were reported for
holding water and modifying infiltration rate and hydraulic conductivity [14]. Zeolites can be
used to hold nutrients in the soil as well as to reduce their leaching into water bodies. The
recent achievements on zeolite-based processes for treating special wastewaters were reviewed
[15]. The examples of special wastewaters are acid mine drainage (AMD) from extensive
mining activities, landfill leachate from huge urban waste landfills, nuclear fallout from
unshielded facilities due to nuclear explosion and accidents, and polluted urban runoff, which
is runoff of rainwater created by urbanization. For nuclear wastewater, Iranian natural
clinoptilolite-based adsorbent was also studied [16,17]. The studies for removal of arsenic
species from drinking water with Iranian natural and synthetic zeolites were also reported
[18,19]. Surfactant-modified natural zeolite (SMZ) was studied for the separation of petroleum
10
monoaromatic compounds, such as benzene, toluene, ethyl benzene, and xylene (BTEX)
[20,21].
1.4.4 Modified Natural Zeolites for Reducing Phosphate in Water
Various types of modified natural zeolites have been studied for reducing the
concentrations of PO43- in water body. Zirconium-modified natural zeolites were studied to
remove PO43- from solutions containing 0 - 12 mg/L of P for the application as amendments in
sediments [22]. SMZ was also studied to remove PO43- from solution containing 0.08 and 0.8
mmol/L of PO43-, which can be an appropriate representative of the real concentrations detected
in rivers, groundwaters, and wastewaters. SMZ was compared with Ca-form of natural and
synthetic zeolites in terms of phosphate removal capacity [23].
Simultaneous removal of NH4+ and PO4
3- has been also conducted. Alkaline-activated
and lanthanum-impregnated natural zeolites (NaOH, LaCl3 modified zeolite) were used to
remove both NH4+ and PO4
3- [24]. They performed adsorption tests with modified zeolites from
solution containing 20 mg/L of N and 5 mg/L of P. The phosphate adsorption was observed as
an increase from 0.20 mg/g for natural zeolite up to 8.96 mg/g for LaCl3-zeolite, and a slight
decrease on the ammonium adsorption capacity from 23.9 mg/g for NaOH-zeolite to 21.2 mg/g
for LaCl3-zeolite was observed [24]. The removal of both NH4+ and PO4
3- from aqueous
11
solution containing Ca, NH3, and PO4 (NH3 = 10 mg/L, molar ratio of Ca: PO4 = 5.01) was
studied. Natural zeolite was used as an adsorbent for the adsorption of NH4+ and the subsequent
use of ammonium-loaded zeolite as a seed for the precipitation of PO43- [25].
1.4.5 Formation of Struvite for Phosphate Removal
Struvite is a white crystal containing magnesium, ammonium, and phosphorus in
equal molar concentrations (molecular weight = 247.42 g/mol). Struvite can be formed due to
the general reaction as below:
𝑀𝑔2+ + 𝑁𝐻4+ + 𝑃𝑂4
3− + 6𝐻2𝑂 → 𝑀𝑔𝑁𝐻4𝑃𝑂4 ∙ 6𝐻2𝑂 (1)
However, this equation is too simplified to describe the process and mechanism of struvite
precipitation [3].
For the occurrence and development of struvite crystals, there are two main chemical
stages: nucleation and crystal growth. It is quite difficult to predict or control these mechanisms
because it is governed by a combination of several factors including the crystal state of initial
compounds, thermodynamic of liquid-solid equilibrium, and kinetics of reaction. In addition,
various physicochemical parameters have influence on the formation of the struvite crystals
such as the pH of the solution, mixing energy, temperature, and presence of foreign ions [26].
Over the past few decades, there have been many studies conducted to recover
12
phosphorous from different types of wastewaters, such as fertilizer industry wastewater,
municipal landfill leachate, swine wastewater, and so on. Struvite crystallization is one of the
processes which have been broadly researched with the potential for phosphorous recovery
[27].
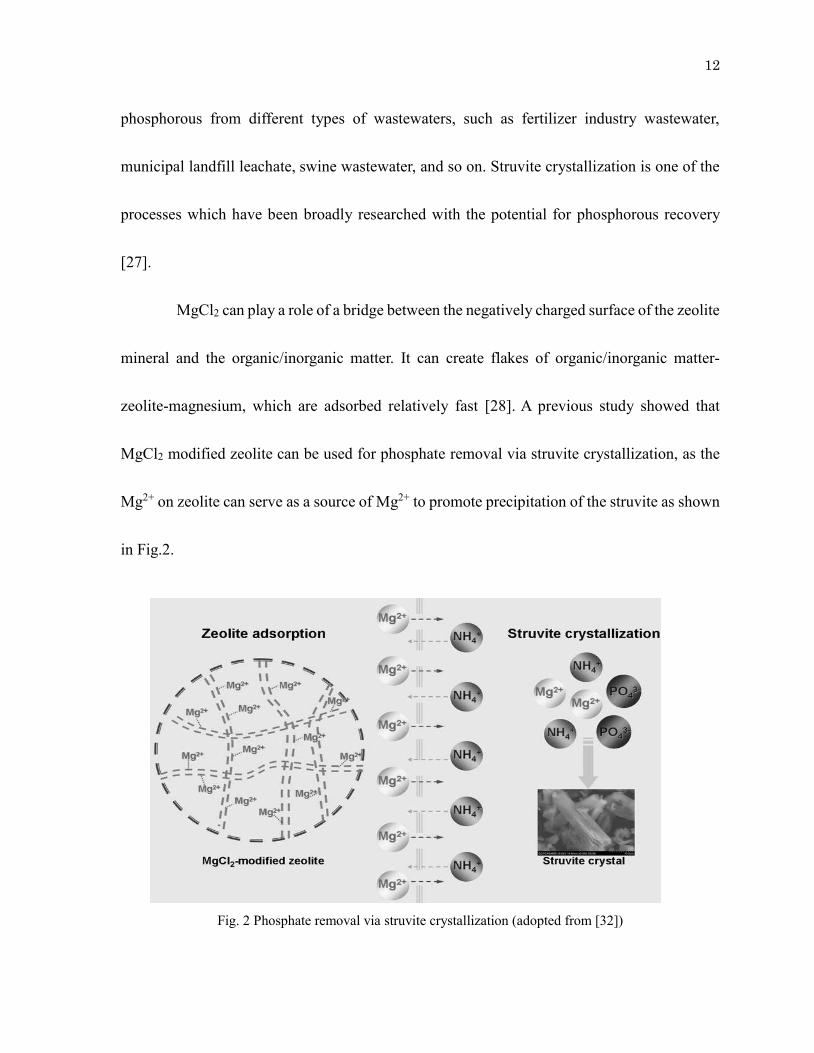
MgCl2 can play a role of a bridge between the negatively charged surface of the zeolite
mineral and the organic/inorganic matter. It can create flakes of organic/inorganic matter-
zeolite-magnesium, which are adsorbed relatively fast [28]. A previous study showed that
MgCl2 modified zeolite can be used for phosphate removal via struvite crystallization, as the
Mg2+ on zeolite can serve as a source of Mg2+ to promote precipitation of the struvite as shown
in Fig.2.
Fig. 2 Phosphate removal via struvite crystallization (adopted from [32])
13
The assessment of phosphorus removal via struvite precipitation has been conducted by using
different Mg2+ sources with design of experiments [29]. Recently, Mg-modified zeolites were
studied along with Ca-modified zeolites for simultaneous recovery of NH4+ and PO4
3- from
simulated wastewater [30].
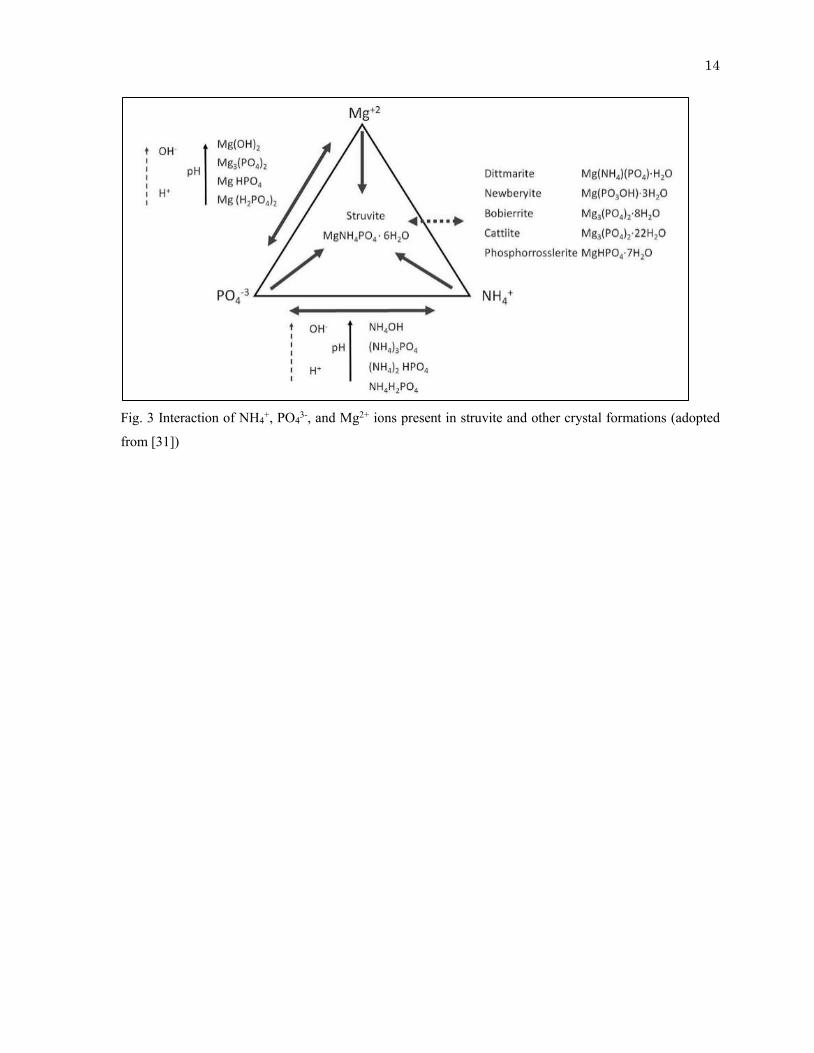
It was stated that the increase of Mg2+ concentration did not affect greatly on the
phosphate removal while increase of total NH4+ concentration can increase the P removal. At
high NH4+ concentrations, the estimated pH range for struvite formation was between 5 and 10
(total N = 5.0 mol/L, Mg = 0.1 mol/L); while at low NH4+ concentrations the pH range for
struvite formation was between 7 and 10 (total N = 0.1 mol/L, Mg = 0.1 mol/L). Fig.3 shows
the interaction of NH4+, PO4
3-, and Mg2+ ions present in struvite and other compounds.
Temperature is a less significant factor for struvite precipitation compared to the pH of solution,
ionic composition, and ionic supersaturation conditions [31].
14
Fig. 3 Interaction of NH4+, PO43-, and Mg2+ ions present in struvite and other crystal formations (adopted
from [31])
15
Chapter 2: Materials and Methods
2.1 Preparation of MZ and MNZ
2.1.1 Preliminary Test of Modification Process on NZ
To test the proposed modification process, preliminary modification procedures on
NZ were performed. A natural clinoptilolite sample from Bromley deposit (British Columbia),
obtained from Canadian Zeolite Corporation, was used for the entire experiment. Prior to the
modification process, particle size between 1-2mm (-10 +18 mesh) was selected by sieving the
powdered NZ sample using standard ASTM sieves, then washed with DI water, and dried in
the oven at 105 °C overnight.
Preparation of MZ:
MZ was prepared by using the adopted method from a previous study [32]. For
preliminary tests, 2 g of NZ was treated with 40 mL of 2 mol/L MgCl2 in 50 mL plastic
container. MgCl2 solution was prepared by using magnesium chloride hexahydrate
(MgCl2·H2O). Three different batches were prepared. All 50 mL containers were agitated by a
horizontal shaker in a water bath at 25 °C at 200 rpm for 24 hours. The amount of Mg loaded
on the modified zeolite was determined by ICP-OES (Agilent SVDV 5100 ICP-OES) after
16
acid digestion.
Preparation of MNZ:
MNZ was prepared by modifying NZ with a mixture of MgCl2 and ammonium acetate
(NH4Ac) solution using different molar ratios as shown below.
a): Molar ratio of MgCl2: NH4Ac = 1:1
b): Molar ratio of MgCl2: NH4Ac = 2:1
For each molar ratio, 2 g of NZ and 40 mL of desired mixed solutions by using 2 mol/L MgCl2
and/or 2 mol/L NH4Ac (both in DI water) were added to 50 mL plastic container. Three
different batches were prepared for each method. All 50 mL containers were agitated by a
horizontal shaker with water bath for 24 hours at 200 rpm, 25 °C. As a reference, unmodified
NZ were also treated with DI water under the same conditions as modified zeolites.
After modification process, all zeolite samples were washed thrice with DI water,
dried at desired temperatures (MZ: 105°C, MNZ: 50°C), and stored in a sealed container on
top of a saturated MgCl2 solution to control the relative humidity (33 - 35% at room
temperature). The amount of Mg on modified sample was measured by ICP-OES after acid
digestion. The amount of NH4+ on the modified sample was determined using combustion
elemental analysis technique (ECS 4010 CHNS-O Analyzer, Costech Analytical Technologies,
Inc.).
17
2.1.2 Preparation of MZ and MNZ for Phosphate Removal with DOE
After testing the effectiveness of modified zeolite produced during preliminary set of
experiments, MNZ and MZ were prepared at larger batches by following procedures in order
to conduct experimental design for optimizing phosphate removal process. Prior to the
modification process, two range of particle size of 1-2mm (-10 +18 mesh) and 2-4mm (-5 +10
mesh) was selected by sieving, washed with DI water, and dried in the oven at 105 °C overnight.
For preparation of MZ, 40 g of NZ and 400 mL of 2 mol/L MgCl2 solution were added
to 1 L plastic containers. Three different batches were prepared for each size of NZ. For
preparation of MNZ, method b) from the preliminary study was used. In a typical batch, 40 g
of NZ and 400 mL of the mixed solution consisted of MgCl2 and NH4Ac solution were added
to 1 L plastic containers. The mixed ammonium/magnesium solution was prepared by using 2
mol/L MgCl2 and 2 mol/L NH4Ac solutions to achieve the molar ratio of MgCl2: NH4Ac= 2:1
to make the total volume of 400 mL. Three similar modification batches were conducted in
parallel for each modified zeolite. All 1 L containers were agitated by a horizontal shaker in a
water bath at 25°C for 24 hours at 200 rpm.
After modification process, all zeolite samples were washed thrice with DI water,
dried at desired temperatures (MZ: 105°C, MNZ: 50°C), and stored in a sealed container on
top of the saturated MgCl2 solution to control the relative humidity (33 - 35% at room
18
temperature).
2.2 Characterization of Zeolite Samples
2.2.1 Chemical and Physical Properties of Zeolite Samples
Chemical and physical properties of zeolite samples were investigated to identify the
zeolite samples used in this study as natural clinoptilolite. X-ray Diffraction (XRD) was
performed using Rigaku Miniflex 300 to identify the crystalline phase of zeolite samples. The
quantitative chemical analysis by X-ray fluorescence (XRF) was performed to identify the
chemical composition of the natural clinoptilolite used in this study by PANalytical PW2400
Wavelength Dispersive. Thermogravimetric Analysis (TGA) was performed on zeolite samples
by Discovery TGA (TA Instruments). Zeolite samples were crushed into fine powders for the
analysis. The surface morphology of the natural zeolite was obtained by Scanning Electron
Microscope (SEM; JSM 600F, Joel Japan) operating at 10 keV of acceleration voltage and
coupled with energy dispersive X-ray analysis (EDAX).
ATR-FTIR (Platinum ATR Alpha II FTIR Spectrometer, Bruker) was used to identify
the IR spectra of NZ, MZ, and MNZ. Zeolite samples were prepared by crushing with the
laboratory ball mill. Before the analysis, the crushed zeolite samples were dried at 105 ºC
overnight. The spectra were collected from 24 scans at 4cm-1 resolution at the range of 4000-
19
370cm-1. Measurements were performed in triplicates for each zeolite sample.
2.2.2 Trace Elemental Analysis by Leaching Test
The leachability of different elements from NZ, MZ, and MNZ were tested using a
leaching procedure modified from US EPA method 1311 [33] and [34]. Acetic acid solution
with pH 2.9 was used as extraction fluid for the Toxicity Characteristic Leaching Procedure
(TCLP). TCLP is designed to determine if the toxic substances including metals and organic
compounds will leach into the soil or groundwater [35]. In this study, the TCLP procedure was
employed to confirm that the zeolite samples do not leach any unwanted heavy metal or other
trace elements to water bodies. Each leaching container was filled with 250 mL of TCLP
extraction fluid per gram of the zeolite sample. The leaching container was shaken at 50 rpm
with tilting shaker at room temperature for 20 hours. At the end of agitation, the leachates were
collected by filtering with membrane filters (pore size = 0.41 µm) using vacuum to separate
zeolite particulates. The collected leachates were analyzed by ICP-OES.
2.2.3 Trace Elemental Analysis by Acid Digestion
Acid digestion of NZ, MZ, and MNZ with a procedure modified from Lu et al. and
US EPA method 3050B [34,36], was used to dissolve zeolite constituents for analysis by ICP-
20
OES. For an acid regime, reverse aqua regia (RAR) was chosen which consists of nitric acid
(HNO3) to hydrochloric acid (HCl) molar ratio of 3:1. Concentrations of acids were 67–
70 %(w/w) for HNO3 and 34–37 %(w/w) for HCl. Zeolite samples were crushed into very fine
powders with a ball mill. 0.15 g of crushed zeolite samples was transferred to a 15 mL plastic
vial and acidic solutions were then added to achieve the acid regime of RAR.
Acid digestion process was performed with digestion blocks (DigiPrep) for 6 hours
via automated control of temperatures which gradually heat up the sample vials up to 95 °C.
After all the vials cooled down to room temperature, DI water was used topped up to make the
total volume of 15 mL on each vial to prevent further gassing of acids. All vials were shaken
manually and then centrifuged at 600 rpm for 30 min to separate the nondigested zeolite
constituents mainly silica. The supernatants were then collected and analyzed by ICP-OES.
2.2.4 Determination of Cation Exchange Capacity (CEC)
CEC of NZ, MZ, and MNZ were determined by ammonium acetate saturation
(AMAS) method [13] and elemental analysis (EA) by combustion.
AMAS method
NZ, MZ, and MNZ were crushed into fine powders using a laboratory ball mill. 0.1 g
21
of crushed zeolite samples and 10 mL of 2 mol/L NH4Ac solution were mixed in a 15mL plastic
vials. The plastic vials were thoroughly shaken by hand and kept overnight at room temperature.
The plastic vials were then centrifuged at 3000 rpm for 5 min to separate zeolite samples from
the solution. The separated solutions were analyzed for Na+, K+, Ca2+, and Mg2+ by ICP-OES
to determine effective CEC (ECEC). The separated zeolite samples were washed with DI water
once and dried at 50 ºC in the oven overnight. The dried zeolite samples were analyzed by EA
to determine CEC based on the amounts of saturated NH4+.
ECEC was determined by following the modified formula [37].
ECEC = Sum of exchangeable cations = Exchangeable (𝑁𝑎+ + 𝐾+ + 𝐶𝑎2+ + 𝑀𝑔2+) [𝑚𝑒𝑞]
Exchangeable cations =(a − b) × V
10 × 𝑀 × 𝑤 [meq] (2)
Where:
a = mg/L of Na+/K+/Ca2+/Mg2+ in the extraction solution
b = mg/L of Na+/K+/Ca2+/Mg2+ in blank
V = mL of NH4Ac used in extraction (= 10 mL)
M = atomic weights of Na+/K+/Ca2+/Mg2+ divided by ionic charge (Na: 23.00, K: 39.10, Ca:
20.04, Mg: 12.15)
w = gram of zeolite samples used
22
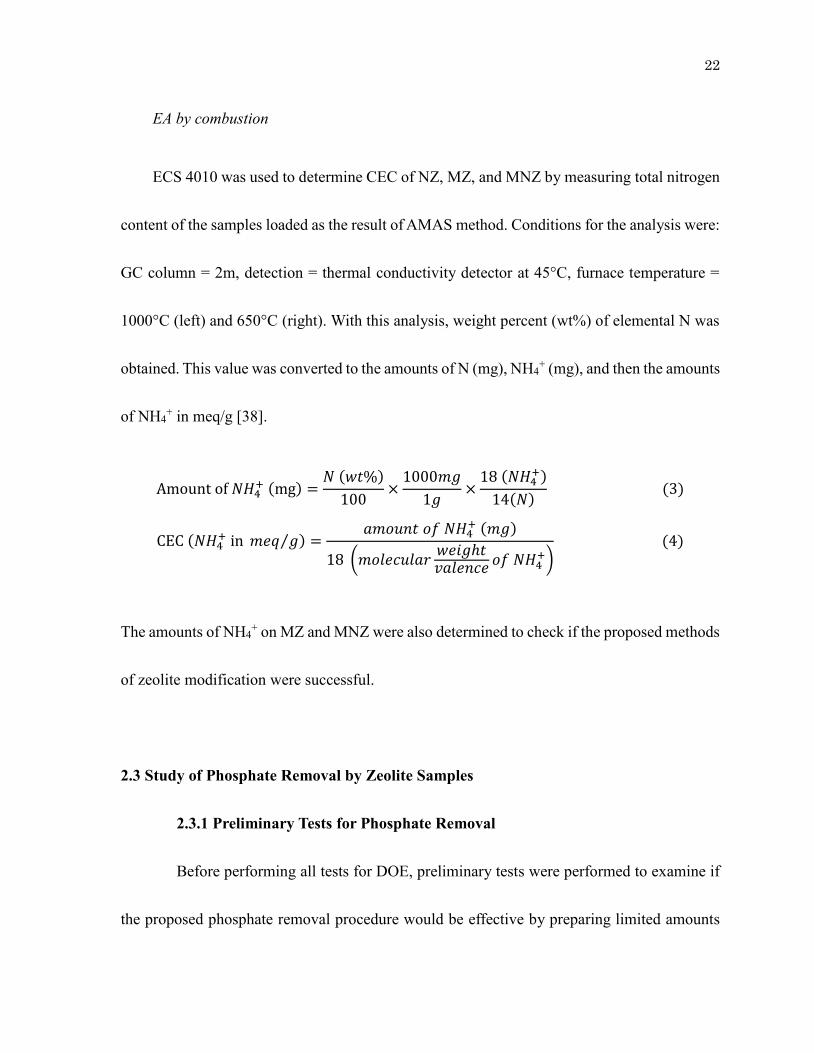
EA by combustion
ECS 4010 was used to determine CEC of NZ, MZ, and MNZ by measuring total nitrogen
content of the samples loaded as the result of AMAS method. Conditions for the analysis were:
GC column = 2m, detection = thermal conductivity detector at 45°C, furnace temperature =
1000°C (left) and 650°C (right). With this analysis, weight percent (wt%) of elemental N was
obtained. This value was converted to the amounts of N (mg), NH4+ (mg), and then the amounts
of NH4+ in meq/g [38].
Amount of 𝑁𝐻4+ (mg) =
𝑁 (𝑤𝑡%)
100×
1000𝑚𝑔
1𝑔×
18 (𝑁𝐻4+)
14(𝑁) (3)
CEC (𝑁𝐻4+ in 𝑚𝑒𝑞 𝑔⁄ ) =
𝑎𝑚𝑜𝑢𝑛𝑡 𝑜𝑓 𝑁𝐻4+ (𝑚𝑔)
18 (𝑚𝑜𝑙𝑒𝑐𝑢𝑙𝑎𝑟𝑤𝑒𝑖𝑔ℎ𝑡𝑣𝑎𝑙𝑒𝑛𝑐𝑒
𝑜𝑓 𝑁𝐻4+)
(4)
The amounts of NH4+ on MZ and MNZ were also determined to check if the proposed methods
of zeolite modification were successful.
2.3 Study of Phosphate Removal by Zeolite Samples
2.3.1 Preliminary Tests for Phosphate Removal
Before performing all tests for DOE, preliminary tests were performed to examine if
the proposed phosphate removal procedure would be effective by preparing limited amounts
23
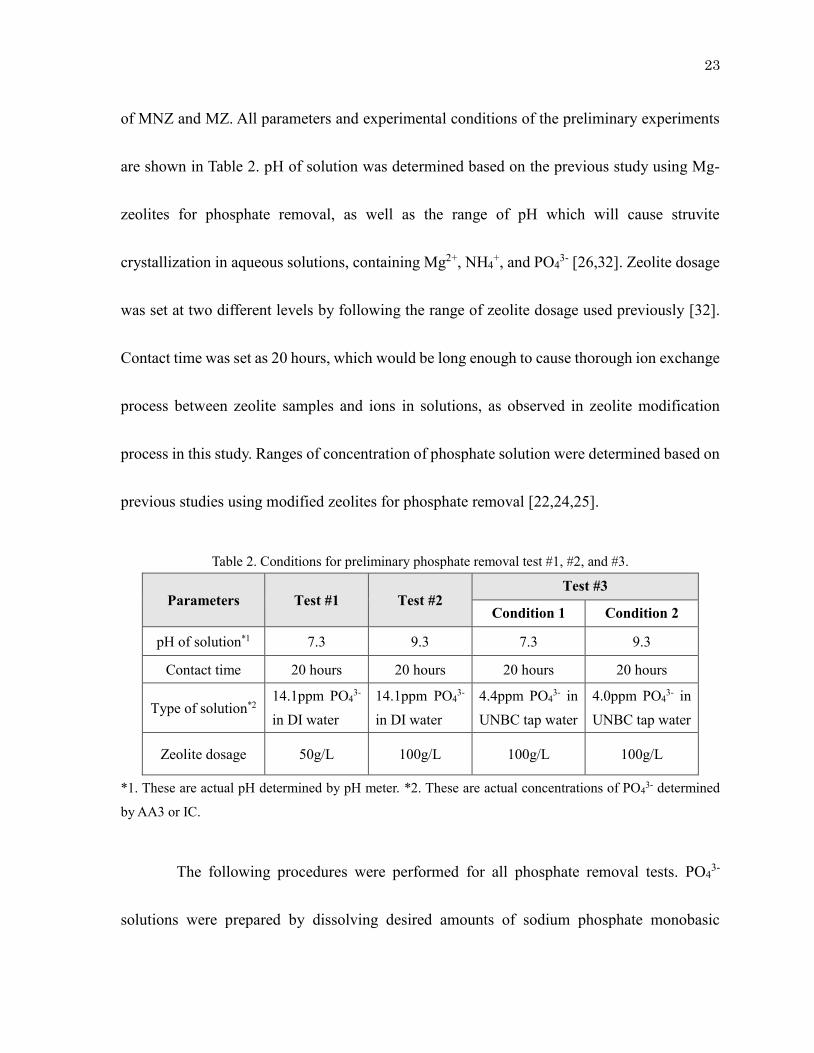
of MNZ and MZ. All parameters and experimental conditions of the preliminary experiments
are shown in Table 2. pH of solution was determined based on the previous study using Mg-
zeolites for phosphate removal, as well as the range of pH which will cause struvite
crystallization in aqueous solutions, containing Mg2+, NH4+, and PO4
3- [26,32]. Zeolite dosage
was set at two different levels by following the range of zeolite dosage used previously [32].
Contact time was set as 20 hours, which would be long enough to cause thorough ion exchange
process between zeolite samples and ions in solutions, as observed in zeolite modification
process in this study. Ranges of concentration of phosphate solution were determined based on
previous studies using modified zeolites for phosphate removal [22,24,25].
Table 2. Conditions for preliminary phosphate removal test #1, #2, and #3.
Parameters Test #1 Test #2 Test #3
Condition 1 Condition 2
pH of solution*1 7.3 9.3 7.3 9.3
Contact time 20 hours 20 hours 20 hours 20 hours
Type of solution*2 14.1ppm PO4
3-
in DI water 14.1ppm PO4
3- in DI water
4.4ppm PO43- in
UNBC tap water 4.0ppm PO4
3- in UNBC tap water
Zeolite dosage 50g/L 100g/L 100g/L 100g/L
*1. These are actual pH determined by pH meter. *2. These are actual concentrations of PO43- determined
by AA3 or IC.
The following procedures were performed for all phosphate removal tests. PO43-
solutions were prepared by dissolving desired amounts of sodium phosphate monobasic
24
monohydrate (NaH2PO4·H2O) to either DI water or UNBC tap water. The pH of PO43- solutions
was adjusted by 0.1 mol/L NaOH solution to the desired values. Desired amounts of NZ, MZ,
and MNZ, and 10 mL of PO43- solution were mixed in 15 mL plastic vials. The plastic vials
were shaken by a tilting shaker at 100 rpm at room temperature for the desired contact time.
Then, the plastic vials were centrifuged at 3000 rpm for 5 min to separate zeolite samples from
solution. Supernatant solutions were separated using syringe filters (pore size = 0.45 µm)
before analysis. The spent zeolites were washed with DI water once and dried at 105°C in the
oven overnight. The separated PO43- solutions were analyzed by AA3 (AutoAnalyzer3 Digital
Colorimeter, BRAN+LUEBBE. Method: Phosphate in Water and Seawater, No. G-175-96 Rev.
5) for test #1 and #2, and IC (Dionex ICS-5000, Thermo Scientific) for test #3 to determine
the concentrations of PO43- in solutions. The measured amounts of PO4
3- were used to calculate
removal efficiency, RE(%), of PO43-. RE(%) of PO4
3- was determined using the following
equation:
𝑅𝐸 (%) = (𝐶0 − 𝐶𝑒) 𝐶0⁄ × 100 (5)
where RE (%) is the removal efficiency of PO43-, Co is the initial concentrations of PO4
3-, and
Ce is the final concentrations of PO43-.
25
2.3.2 Optimization of Phosphate Removal Process Using DOE and RSM
Statistical Methods
Design of experiments (DOE) is a methodology for studying any response that differs
as a function of one or more independent variables. Two-level full factorial DOE is a special
subset of general factorial designs as it has only two levels of each variable. These experiments
are designated for 2k runs where k is the number of variables. 2k represents the number of
unique runs in each replicate of the design. When all the runs are performed in random order,
the 2k experiments can characterize all the variables under consideration, as well as resolve
two-factor and higher-order interactions [39].
In this study, a 24 full factorial design of experiment (DOE) was developed by using
Minitab software [40] to examine the effects of 4 independent variables on phosphate removal
by MZ and MNZ. Based on the previous studies and available sizes of natural zeolite samples,
the independent variables of experimental conditions were implemented as shown in Table 3;
(A) initial pH at 7 and 9, (B) contact time at 2 and 20 hours, (C) zeolite dosage (adsorbent
content) at 50 and 100 g/L, and (D) particle size at 1-2mm and 2-4mm [32,41,42]. The middle
levels for each independent variable were also examined for a possible curvature of data. There
is no middle level for (D) since it was a categorical variable. For each type of modified zeolites,
the number of total runs was 54 including 3 replicates and center points. The parameters
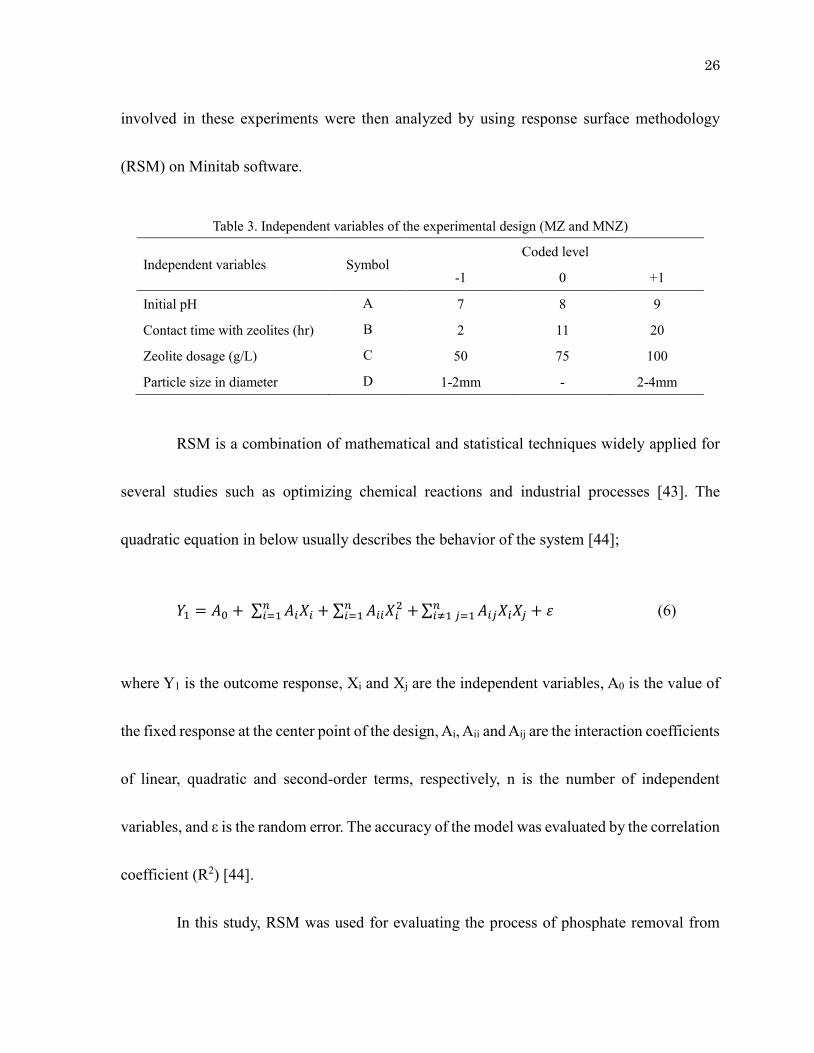
26
involved in these experiments were then analyzed by using response surface methodology
(RSM) on Minitab software.
Table 3. Independent variables of the experimental design (MZ and MNZ)
Independent variables Symbol Coded level
-1 0 +1
Initial pH A 7 8 9
Contact time with zeolites (hr) B 2 11 20
Zeolite dosage (g/L) C 50 75 100
Particle size in diameter D 1-2mm - 2-4mm
RSM is a combination of mathematical and statistical techniques widely applied for
several studies such as optimizing chemical reactions and industrial processes [43]. The
quadratic equation in below usually describes the behavior of the system [44];
𝑌1 = 𝐴0 + ∑ 𝐴𝑖𝑋𝑖𝑛𝑖=1 + ∑ 𝐴𝑖𝑖𝑋𝑖
2 +𝑛𝑖=1 ∑ 𝐴𝑖𝑗𝑋𝑖𝑋𝑗 + 𝜀𝑛
𝑖≠1 𝑗=1 (6)
where Y1 is the outcome response, Xi and Xj are the independent variables, A0 is the value of
the fixed response at the center point of the design, Ai, Aii and Aij are the interaction coefficients
of linear, quadratic and second-order terms, respectively, n is the number of independent
variables, and ε is the random error. The accuracy of the model was evaluated by the correlation
coefficient (R2) [44].
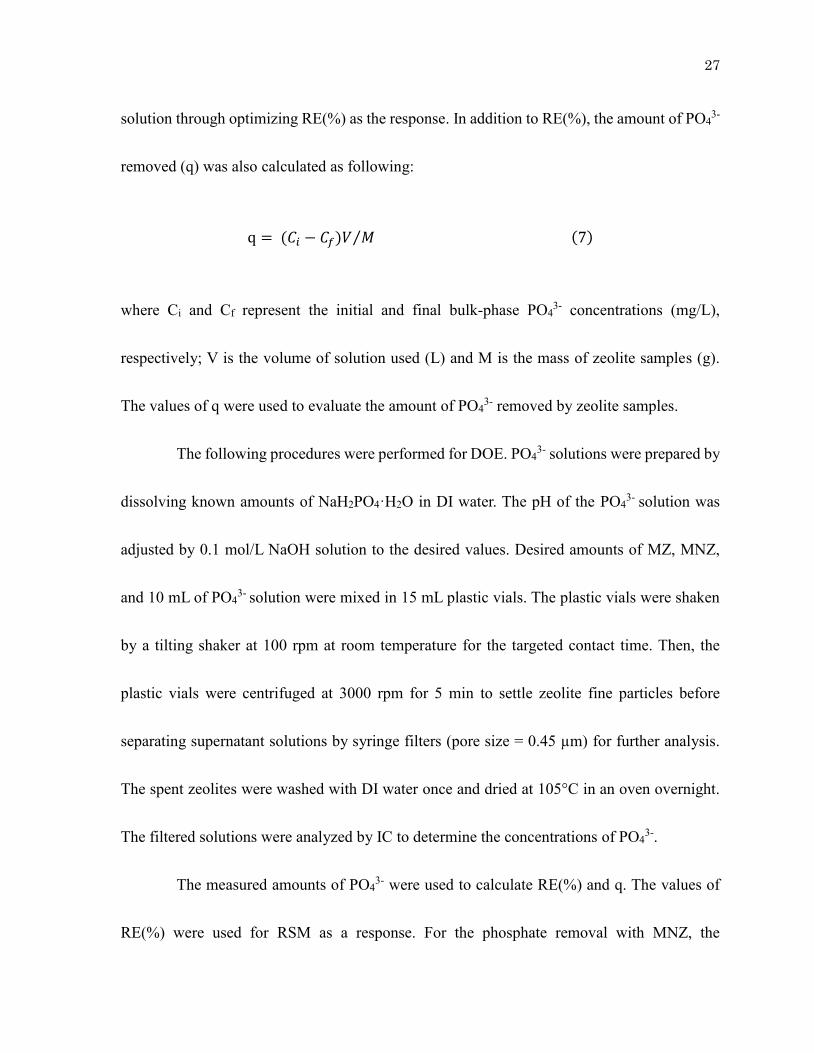
In this study, RSM was used for evaluating the process of phosphate removal from
27
solution through optimizing RE(%) as the response. In addition to RE(%), the amount of PO43-
removed (q) was also calculated as following:
q = (𝐶𝑖 − 𝐶𝑓)𝑉 𝑀⁄ (7)
where Ci and Cf represent the initial and final bulk-phase PO43- concentrations (mg/L),
respectively; V is the volume of solution used (L) and M is the mass of zeolite samples (g).
The values of q were used to evaluate the amount of PO43- removed by zeolite samples.
The following procedures were performed for DOE. PO43- solutions were prepared by
dissolving known amounts of NaH2PO4·H2O in DI water. The pH of the PO43- solution was
adjusted by 0.1 mol/L NaOH solution to the desired values. Desired amounts of MZ, MNZ,
and 10 mL of PO43- solution were mixed in 15 mL plastic vials. The plastic vials were shaken
by a tilting shaker at 100 rpm at room temperature for the targeted contact time. Then, the
plastic vials were centrifuged at 3000 rpm for 5 min to settle zeolite fine particles before
separating supernatant solutions by syringe filters (pore size = 0.45 µm) for further analysis.
The spent zeolites were washed with DI water once and dried at 105°C in an oven overnight.
The filtered solutions were analyzed by IC to determine the concentrations of PO43-.
The measured amounts of PO43- were used to calculate RE(%) and q. The values of
RE(%) were used for RSM as a response. For the phosphate removal with MNZ, the

28
concentrations of NH4+ in solutions after the phosphate removal were measured by AA3
(Method: Ammonia in Water and Seawater, No. G-171-96 Rev.4). All measured data was
provided in Appendix B.
29
Chapter 3: Results and Discussion
3.1 Characterization of Zeolite Samples
3.1.1 Chemical and Physical Properties of Zeolite Samples
The analysis using XRF is useful to identify the chemical composition of the sample.
It was found that oxides of Si and Al, and various metallic oxides are the main components of
the sample. From this data, the SiO2/Al2O3 ratio for NZ was calculated as 5.95. Since the ratio
is greater than 4.0, the zeolite samples can be considered as a clinoptilolite [45]. SEM image
can show the surface morphology of natural clinoptilolite. Octahedral shape was observed in
the SEM image, which was the similar observation in the previous study using natural zeolite
(clinoptilolite-rich tuff) [46].
XRD peaks (parameters: CuKα [λ=1.54059Å], 5°<2θ<40° with step width of 0.02°,
40kV, 15mA) showed that NZ, MZ, and MNZ have quite similar patterns. It indicates that the
framework crystallinity of the zeolite samples remained intact before and after modification
process. According to the XRD patterns, the main zeolitic phase of the samples corresponds to
the HEU structure, which can be either heulandite or clinoptilolite [47]. Combining with XRF
data of the chemical composition of the natural zeolite sample, in which the Si/Al ratio is higher
than 4, clinoptilolite can be considered as the major phase of the measured zeolite samples.
30
TGA was performed to obtain TG curves of MZ and MNZ (procedure: equilibrate at
27ºC; isothermal 5min; ramp 5ºC/min to 900ºC). The rapid weight loss (%) was observed as
2.7% (125-193ºC) for MZ and 2.4% (105-157ºC) for MNZ. This is the similar observation
from the previous study of natural clinoptilolite with thermal analysis [48]. For MZ, two major
changes in weight loss (%) were observed (2.73% at 125-193ºC and 0.76% at 597-683ºC)
whereas three major changes in weight loss (%) were observed for MNZ (2.39% at 105-157ºC,
2.41% at 343-457ºC, and 0.79% at 643-710ºC). The difference in total weight loss for MZ and
MNZ can be because of the difference in modified cations (Mg2+ for MZ, Mg2+ and NH4+ for
MNZ). The total weight loss was larger for MNZ than MZ. It was because of the large amount
of NH4+ retained on MNZ, which would not available on MZ.
IR spectra of NZ, MZ, and MNZ were obtained by ATR-FTIR. The major peak around
1026 cm-1 can be the indication of the silicon-oxy compounds (Si-O-Si) [49], which is one of
the main chemical constituents of natural clinoptilolite [50]. The presence of NH4+ on MNZ
can be explained by looking at the peak of 1442cm-1 as it was not observed neither on NZ nor
MZ. The information of obtained FTIR spectra can indicate that the major component of
zeolites before and after modification was unchanged.
All data in this section (3.1.1) is available on Appendix A.
31
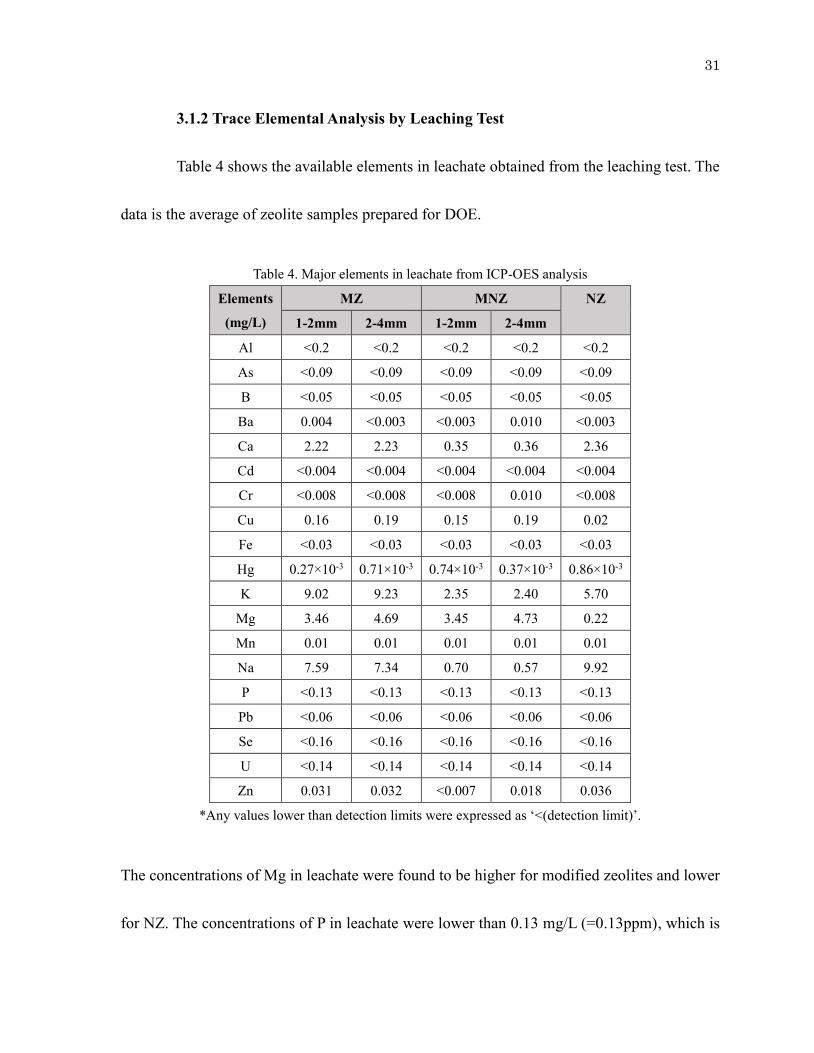
3.1.2 Trace Elemental Analysis by Leaching Test
Table 4 shows the available elements in leachate obtained from the leaching test. The
data is the average of zeolite samples prepared for DOE.
Table 4. Major elements in leachate from ICP-OES analysis
Elements
(mg/L)
MZ MNZ NZ
1-2mm 2-4mm 1-2mm 2-4mm
Al <0.2 <0.2 <0.2 <0.2 <0.2
As <0.09 <0.09 <0.09 <0.09 <0.09
B <0.05 <0.05 <0.05 <0.05 <0.05
Ba 0.004 <0.003 <0.003 0.010 <0.003
Ca 2.22 2.23 0.35 0.36 2.36
Cd <0.004 <0.004 <0.004 <0.004 <0.004
Cr <0.008 <0.008 <0.008 0.010 <0.008
Cu 0.16 0.19 0.15 0.19 0.02
Fe <0.03 <0.03 <0.03 <0.03 <0.03
Hg 0.27×10⁻³ 0.71×10⁻³ 0.74×10⁻³ 0.37×10⁻³ 0.86×10⁻³
K 9.02 9.23 2.35 2.40 5.70
Mg 3.46 4.69 3.45 4.73 0.22
Mn 0.01 0.01 0.01 0.01 0.01
Na 7.59 7.34 0.70 0.57 9.92
P <0.13 <0.13 <0.13 <0.13 <0.13
Pb <0.06 <0.06 <0.06 <0.06 <0.06
Se <0.16 <0.16 <0.16 <0.16 <0.16
U <0.14 <0.14 <0.14 <0.14 <0.14
Zn 0.031 0.032 <0.007 0.018 0.036
*Any values lower than detection limits were expressed as ‘<(detection limit)’.
The concentrations of Mg in leachate were found to be higher for modified zeolites and lower
for NZ. The concentrations of P in leachate were lower than 0.13 mg/L (=0.13ppm), which is
32
the detection limit of ICP-OES. It indicates that adding modified zeolites into aqueous solution
would not significantly increase the amount of P in solutions. Ca, K, and Na are the main
elements of clinoptilolite contributing to the ion exchange process in the aqueous environment.
The large amounts of those elements in zeolite leachate can be due to their characteristics of
ion exchange during the leaching process. Most of heavy metals and trace elements in zeolite
leachate were found to be lower than the detection limit. Other elements above the detection
limits can be considered as non-toxic according to the Canadian guideline [51] where Cu:
<1.0mg/L, Hg :<1.0×10⁻³mg/L, Mn: <0.05mg/L, and Zn:<5.0mg/L are regarded as non-toxic
for the aesthetic objectives of drinking water.
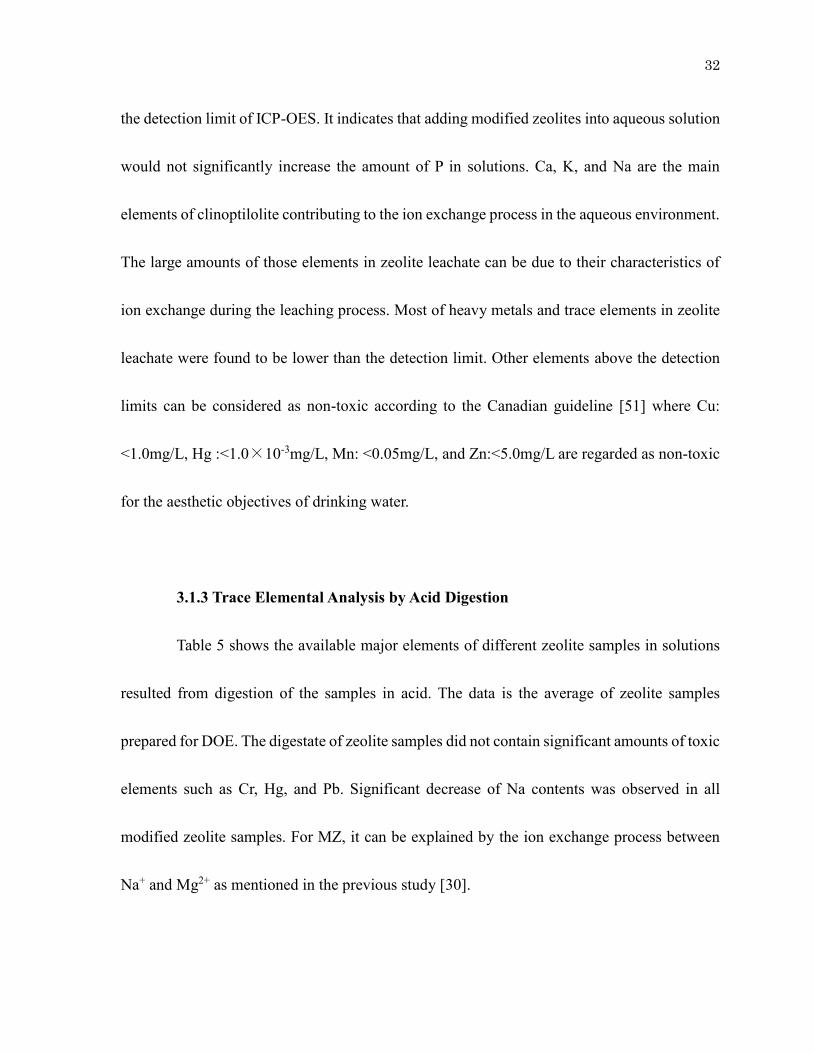
3.1.3 Trace Elemental Analysis by Acid Digestion
Table 5 shows the available major elements of different zeolite samples in solutions
resulted from digestion of the samples in acid. The data is the average of zeolite samples
prepared for DOE. The digestate of zeolite samples did not contain significant amounts of toxic
elements such as Cr, Hg, and Pb. Significant decrease of Na contents was observed in all
modified zeolite samples. For MZ, it can be explained by the ion exchange process between
Na+ and Mg2+ as mentioned in the previous study [30].
33
Table 5. Major elements in digestate from ICP-OES analysis
Elemental
(mg/kg)
MZ MNZ NZ
1-2mm 2-4mm 1-2mm 2-4mm
Ba 508 512 180 200 545
Ca 7799 7631 2515 2698 9167
Cr 3.1 1.8 2.2 2.5 2.0
Fe 3215 3294 3124 2915 3135
K 26144 25551 10563 10697 26616
Mg 4757 5378 3569 3946 1852
Hg 0.065 0.031 0.059 <0.022 <0.022
Na 3929 4082 419 472 6062
P 69 73 83 65 65
Pb 13 17 11 10 15
Zn 77 82 69 62 81
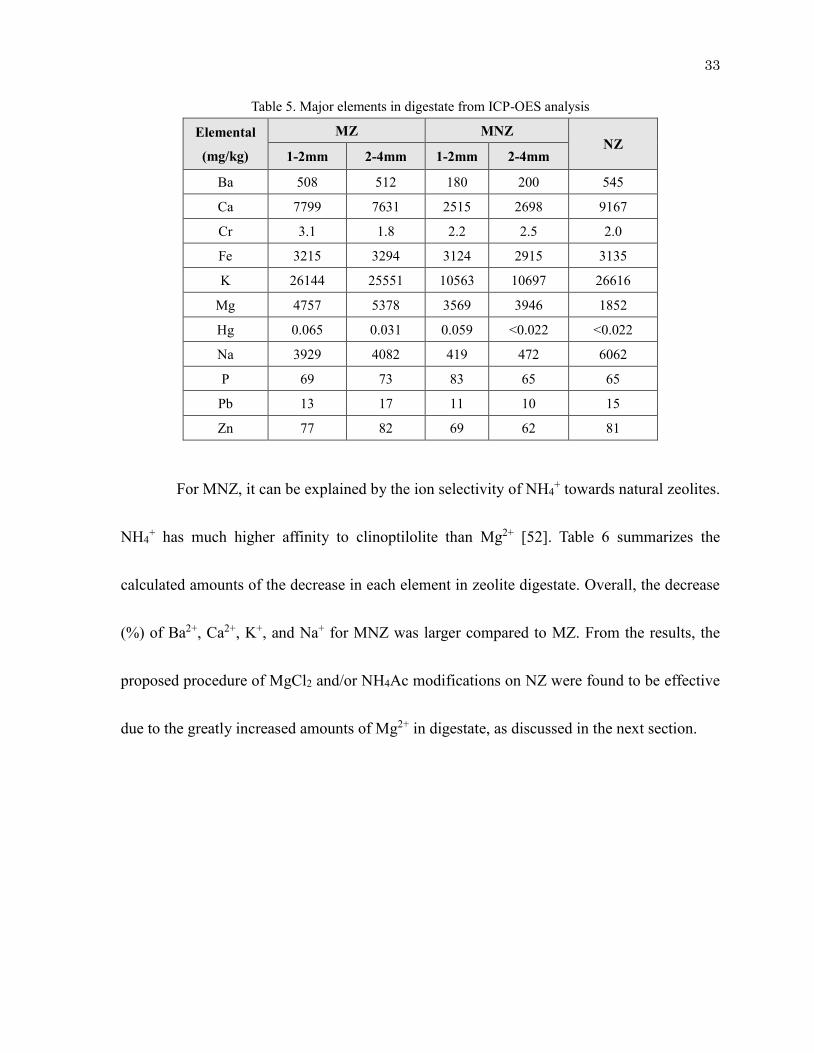
For MNZ, it can be explained by the ion selectivity of NH4+ towards natural zeolites.
NH4+ has much higher affinity to clinoptilolite than Mg2+ [52]. Table 6 summarizes the
calculated amounts of the decrease in each element in zeolite digestate. Overall, the decrease
(%) of Ba2+, Ca2+, K+, and Na+ for MNZ was larger compared to MZ. From the results, the
proposed procedure of MgCl2 and/or NH4Ac modifications on NZ were found to be effective
due to the greatly increased amounts of Mg2+ in digestate, as discussed in the next section.
34
Table 6. Decrease of Ba2+, Ca2+, K+, and Na+ in zeolite digestate
Elements (wt%)
MZ MNZ NZ 1-2mm 2-4mm 1-2mm 2-4mm
Ba 0.7 0.7 0.2 0.3 0.7 Decrease 0.0 0.0 0.5 0.4 -
Ca 10.1 9.9 3.2 3.5 11.7 Decrease 1.6 1.8 8.5 8.2 -
K 33.7 33.1 13.6 13.9 34.0 Decrease 0.2 0.8 20.3 20.1 -
Na 5.1 5.3 0.5 0.6 7.7 Decrease 2.7 2.4 7.2 7.1 -
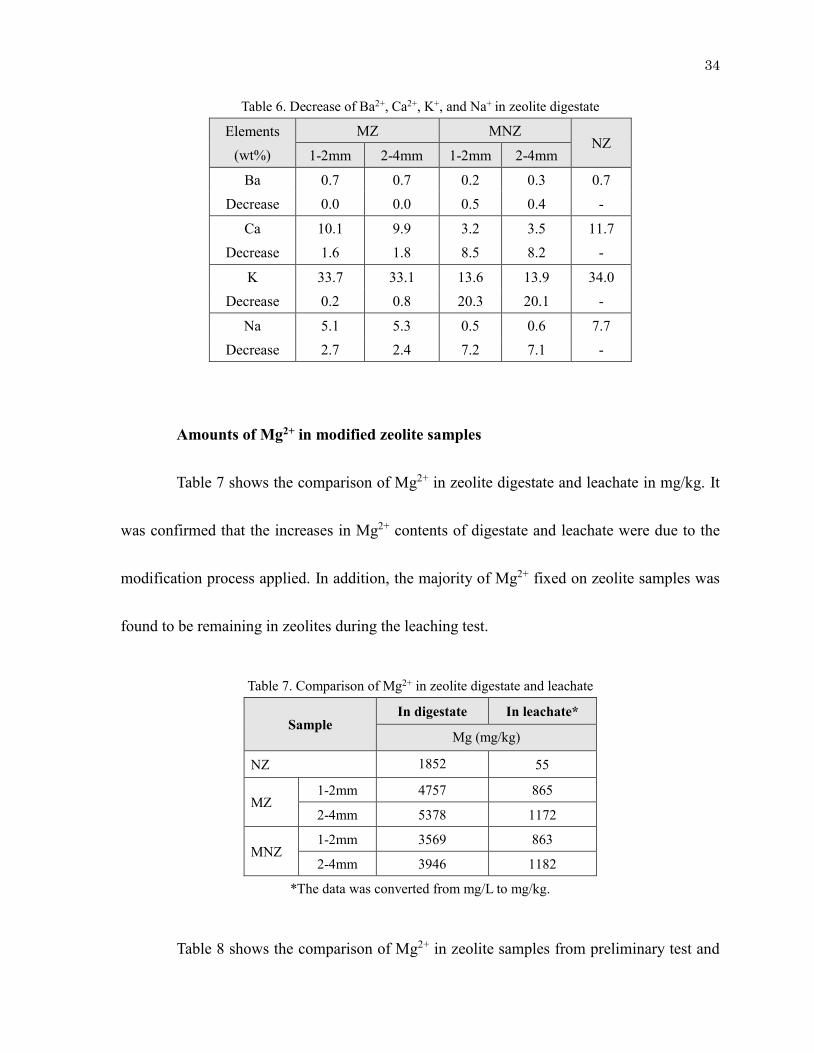
Amounts of Mg2+ in modified zeolite samples
Table 7 shows the comparison of Mg2+ in zeolite digestate and leachate in mg/kg. It
was confirmed that the increases in Mg2+ contents of digestate and leachate were due to the
modification process applied. In addition, the majority of Mg2+ fixed on zeolite samples was
found to be remaining in zeolites during the leaching test.
Table 7. Comparison of Mg2+ in zeolite digestate and leachate
Sample In digestate In leachate*
Mg (mg/kg)
NZ 1852 55
MZ 1-2mm 4757 865
2-4mm 5378 1172
MNZ 1-2mm 3569 863
2-4mm 3946 1182
*The data was converted from mg/L to mg/kg.
Table 8 shows the comparison of Mg2+ in zeolite samples from preliminary test and
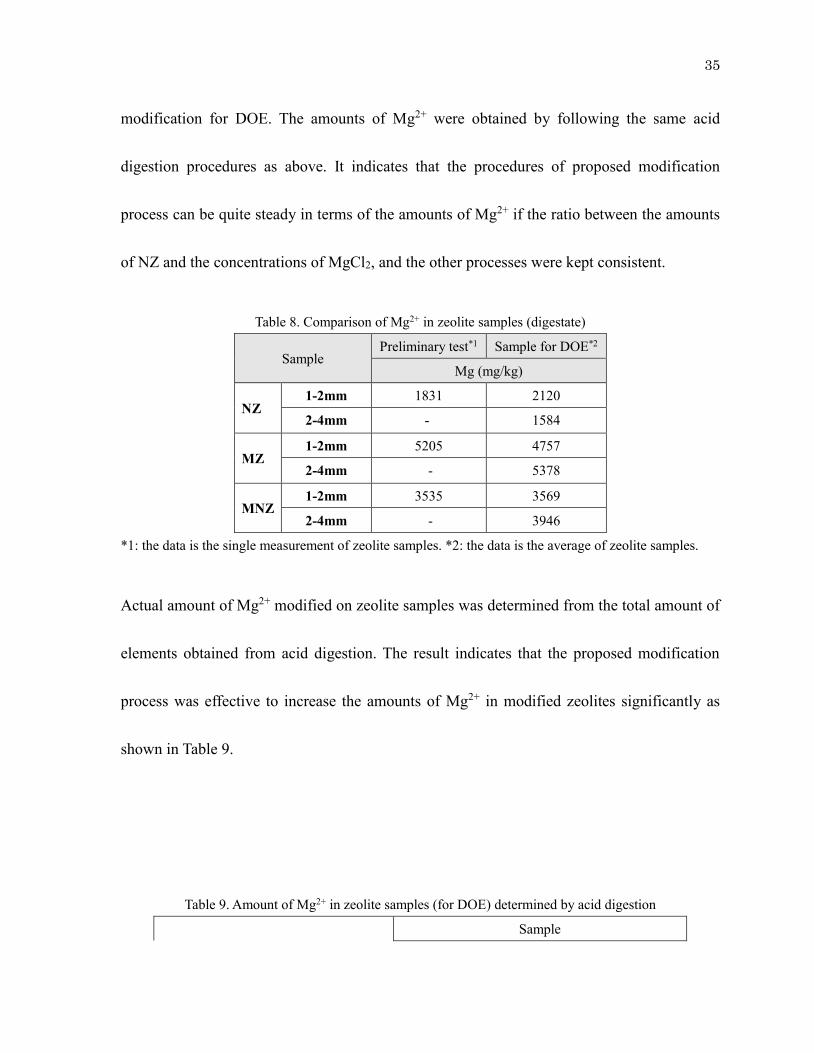
35
modification for DOE. The amounts of Mg2+ were obtained by following the same acid
digestion procedures as above. It indicates that the procedures of proposed modification
process can be quite steady in terms of the amounts of Mg2+ if the ratio between the amounts
of NZ and the concentrations of MgCl2, and the other processes were kept consistent.
Table 8. Comparison of Mg2+ in zeolite samples (digestate)
Sample Preliminary test*1 Sample for DOE*2
Mg (mg/kg)
NZ 1-2mm 1831 2120
2-4mm - 1584
MZ 1-2mm 5205 4757
2-4mm - 5378
MNZ 1-2mm 3535 3569
2-4mm - 3946
*1: the data is the single measurement of zeolite samples. *2: the data is the average of zeolite samples.
Actual amount of Mg2+ modified on zeolite samples was determined from the total amount of
elements obtained from acid digestion. The result indicates that the proposed modification
process was effective to increase the amounts of Mg2+ in modified zeolites significantly as
shown in Table 9.
Table 9. Amount of Mg2+ in zeolite samples (for DOE) determined by acid digestion
Sample
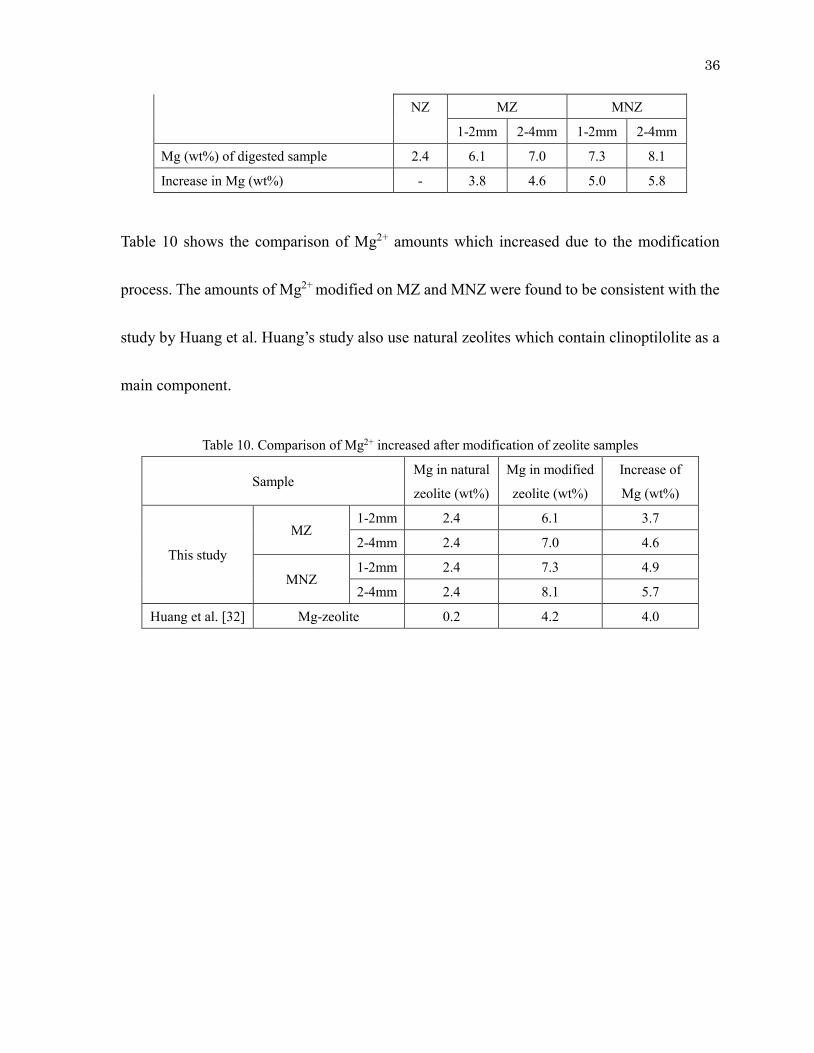
36
NZ MZ MNZ
1-2mm 2-4mm 1-2mm 2-4mm
Mg (wt%) of digested sample 2.4 6.1 7.0 7.3 8.1
Increase in Mg (wt%) - 3.8 4.6 5.0 5.8
Table 10 shows the comparison of Mg2+ amounts which increased due to the modification
process. The amounts of Mg2+ modified on MZ and MNZ were found to be consistent with the
study by Huang et al. Huang’s study also use natural zeolites which contain clinoptilolite as a
main component.
Table 10. Comparison of Mg2+ increased after modification of zeolite samples
Sample Mg in natural
zeolite (wt%)
Mg in modified
zeolite (wt%)
Increase of
Mg (wt%)
This study
MZ 1-2mm 2.4 6.1 3.7
2-4mm 2.4 7.0 4.6
MNZ 1-2mm 2.4 7.3 4.9
2-4mm 2.4 8.1 5.7
Huang et al. [32] Mg-zeolite 0.2 4.2 4.0
37
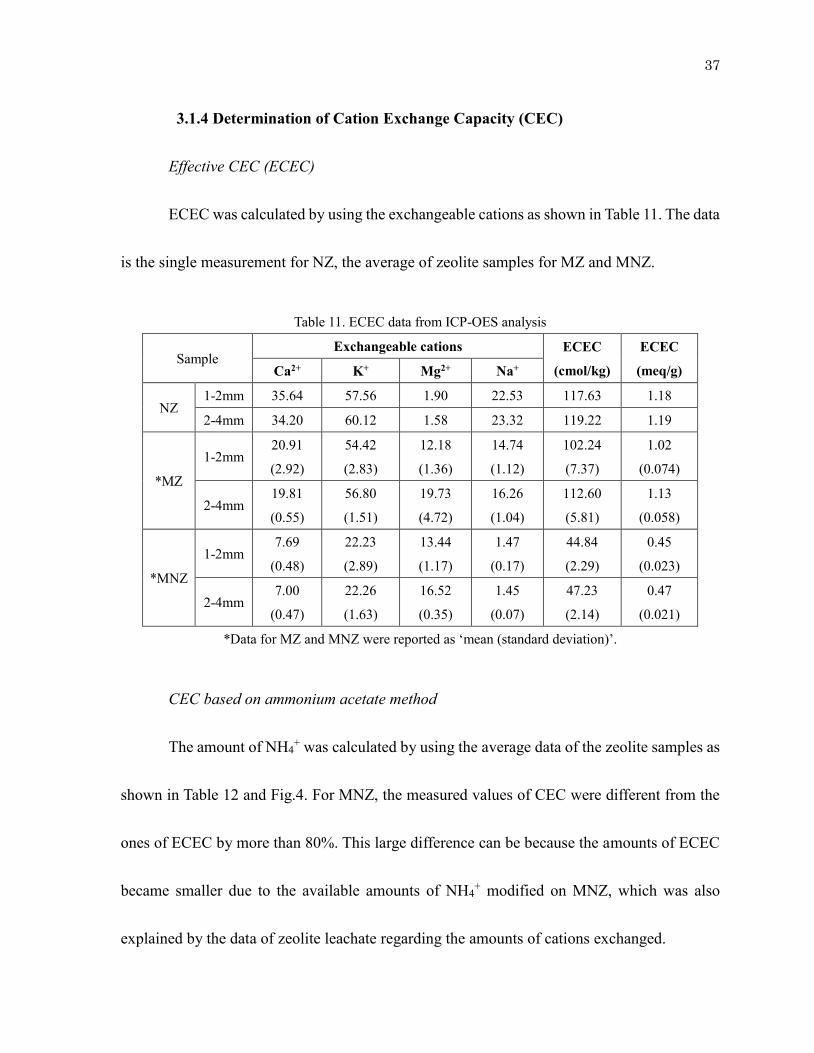
3.1.4 Determination of Cation Exchange Capacity (CEC)
Effective CEC (ECEC)
ECEC was calculated by using the exchangeable cations as shown in Table 11. The data
is the single measurement for NZ, the average of zeolite samples for MZ and MNZ.
Table 11. ECEC data from ICP-OES analysis
Sample Exchangeable cations ECEC
(cmol/kg)
ECEC
(meq/g) Ca2+ K+ Mg2+ Na+
NZ 1-2mm 35.64 57.56 1.90 22.53 117.63 1.18
2-4mm 34.20 60.12 1.58 23.32 119.22 1.19
*MZ
1-2mm 20.91
(2.92)
54.42
(2.83)
12.18
(1.36)
14.74
(1.12)
102.24
(7.37)
1.02
(0.074)
2-4mm 19.81
(0.55)
56.80
(1.51)
19.73
(4.72)
16.26
(1.04)
112.60
(5.81)
1.13
(0.058)
*MNZ
1-2mm 7.69
(0.48)
22.23
(2.89)
13.44
(1.17)
1.47
(0.17)
44.84
(2.29)
0.45
(0.023)
2-4mm 7.00
(0.47)
22.26
(1.63)
16.52
(0.35)
1.45
(0.07)
47.23
(2.14)
0.47
(0.021)
*Data for MZ and MNZ were reported as ‘mean (standard deviation)’.
CEC based on ammonium acetate method
The amount of NH4+ was calculated by using the average data of the zeolite samples as
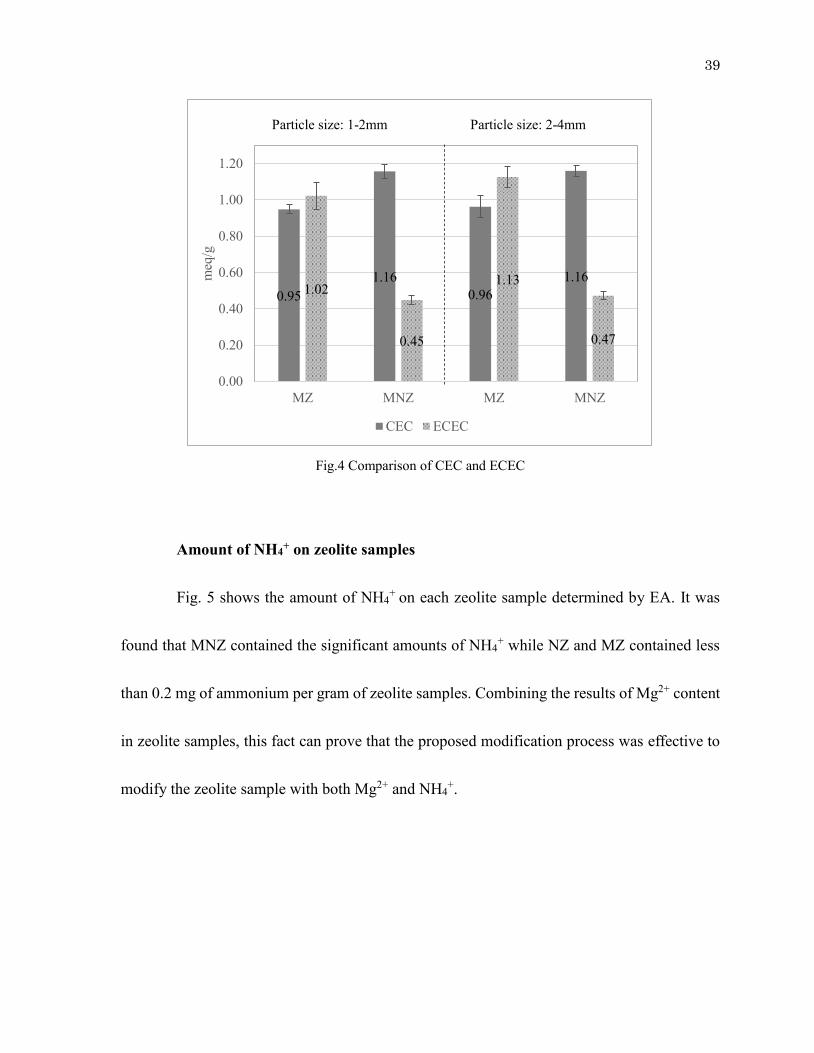
shown in Table 12 and Fig.4. For MNZ, the measured values of CEC were different from the
ones of ECEC by more than 80%. This large difference can be because the amounts of ECEC
became smaller due to the available amounts of NH4+ modified on MNZ, which was also
explained by the data of zeolite leachate regarding the amounts of cations exchanged.
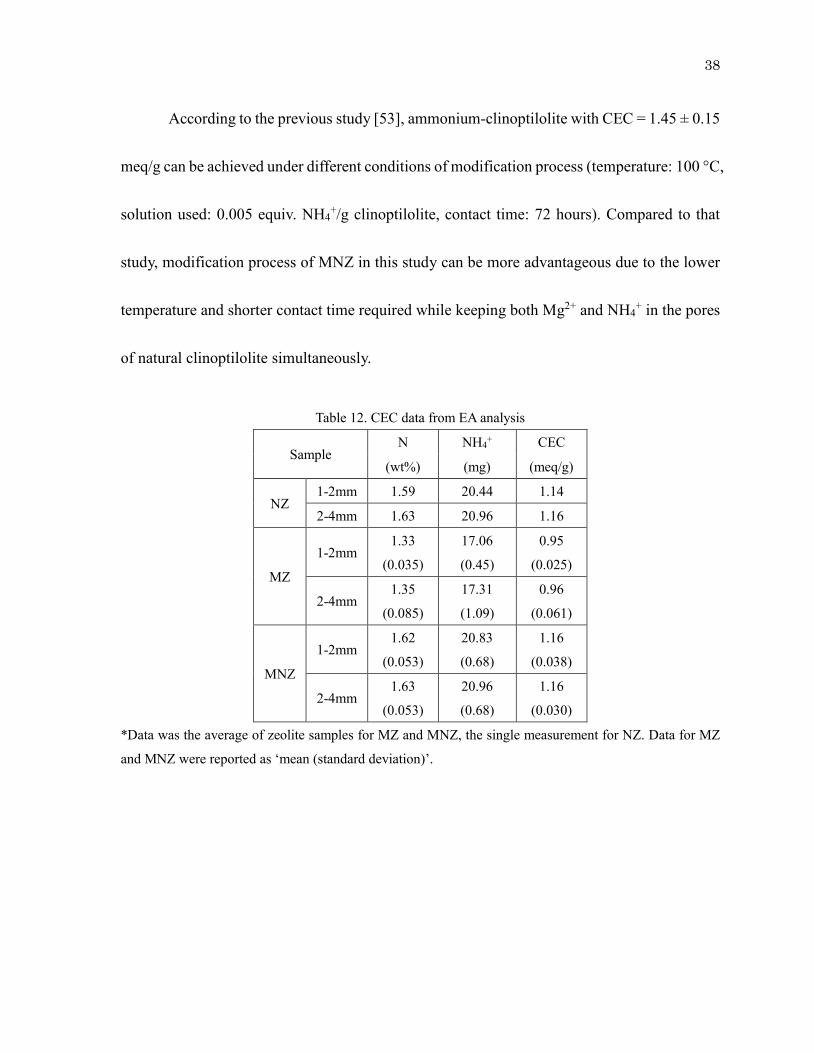
38
According to the previous study [53], ammonium-clinoptilolite with CEC = 1.45 ± 0.15
meq/g can be achieved under different conditions of modification process (temperature: 100 °C,
solution used: 0.005 equiv. NH4+/g clinoptilolite, contact time: 72 hours). Compared to that
study, modification process of MNZ in this study can be more advantageous due to the lower
temperature and shorter contact time required while keeping both Mg2+ and NH4+ in the pores
of natural clinoptilolite simultaneously.
Table 12. CEC data from EA analysis
Sample N NH4+ CEC
(wt%) (mg) (meq/g)
NZ 1-2mm 1.59 20.44 1.14
2-4mm 1.63 20.96 1.16
MZ
1-2mm 1.33
(0.035)
17.06
(0.45)
0.95
(0.025)
2-4mm 1.35
(0.085)
17.31
(1.09)
0.96
(0.061)
MNZ
1-2mm 1.62
(0.053)
20.83
(0.68)
1.16
(0.038)
2-4mm 1.63
(0.053)
20.96
(0.68)
1.16
(0.030)
*Data was the average of zeolite samples for MZ and MNZ, the single measurement for NZ. Data for MZ
and MNZ were reported as ‘mean (standard deviation)’.
39
Fig.4 Comparison of CEC and ECEC
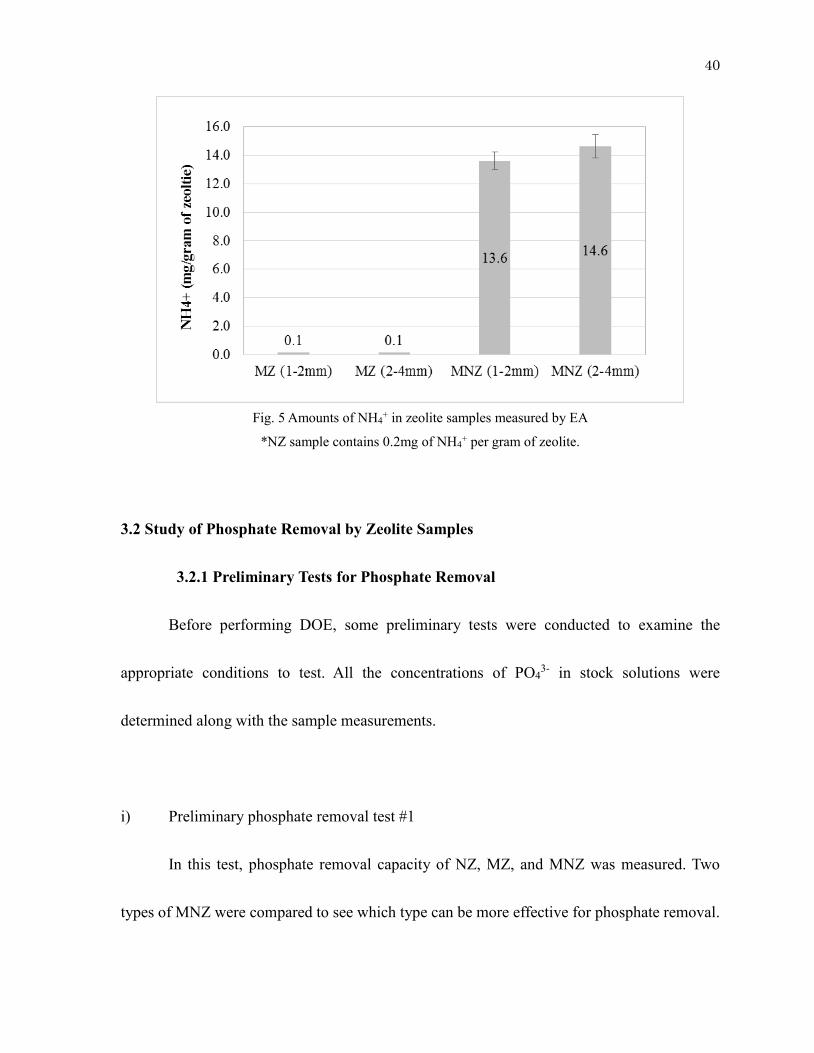
Amount of NH4+ on zeolite samples
Fig. 5 shows the amount of NH4+ on each zeolite sample determined by EA. It was
found that MNZ contained the significant amounts of NH4+ while NZ and MZ contained less
than 0.2 mg of ammonium per gram of zeolite samples. Combining the results of Mg2+ content
in zeolite samples, this fact can prove that the proposed modification process was effective to
modify the zeolite sample with both Mg2+ and NH4+.
0.951.16
0.961.16
1.02
0.45
1.13
0.47
0.00
0.20
0.40
0.60
0.80
1.00
1.20
MZ MNZ MZ MNZ
meq
/g
CEC ECEC
Particle size: 1-2mm Particle size: 2-4mm
40
Fig. 5 Amounts of NH4+ in zeolite samples measured by EA
*NZ sample contains 0.2mg of NH4+ per gram of zeolite.
3.2 Study of Phosphate Removal by Zeolite Samples
3.2.1 Preliminary Tests for Phosphate Removal
Before performing DOE, some preliminary tests were conducted to examine the
appropriate conditions to test. All the concentrations of PO43- in stock solutions were
determined along with the sample measurements.
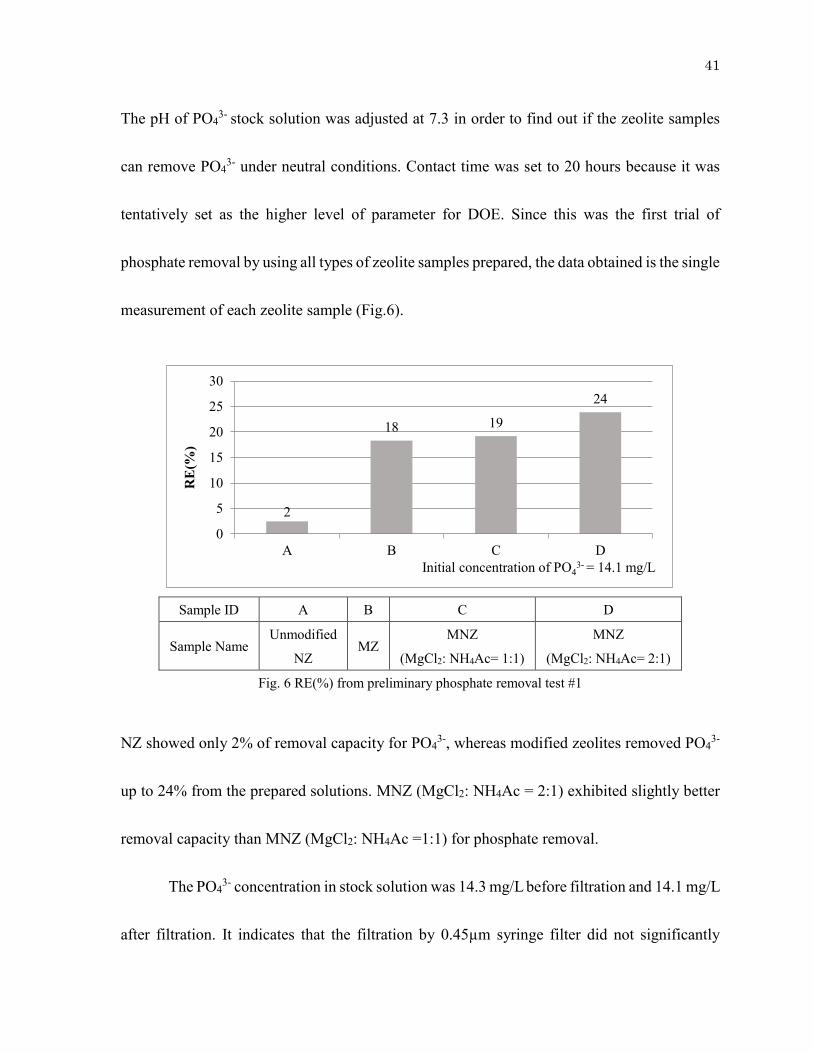
i) Preliminary phosphate removal test #1
In this test, phosphate removal capacity of NZ, MZ, and MNZ was measured. Two
types of MNZ were compared to see which type can be more effective for phosphate removal.
41
The pH of PO43- stock solution was adjusted at 7.3 in order to find out if the zeolite samples
can remove PO43- under neutral conditions. Contact time was set to 20 hours because it was
tentatively set as the higher level of parameter for DOE. Since this was the first trial of
phosphate removal by using all types of zeolite samples prepared, the data obtained is the single
measurement of each zeolite sample (Fig.6).
Sample ID A B C D
Sample Name Unmodified
NZ MZ
MNZ
(MgCl2: NH4Ac= 1:1)
MNZ
(MgCl2: NH4Ac= 2:1)
Fig. 6 RE(%) from preliminary phosphate removal test #1
NZ showed only 2% of removal capacity for PO43-, whereas modified zeolites removed PO4
3-
up to 24% from the prepared solutions. MNZ (MgCl2: NH4Ac = 2:1) exhibited slightly better
removal capacity than MNZ (MgCl2: NH4Ac =1:1) for phosphate removal.
The PO43- concentration in stock solution was 14.3 mg/L before filtration and 14.1 mg/L
after filtration. It indicates that the filtration by 0.45µm syringe filter did not significantly
2
18 19
24
0
5
10
15
20
25
30
A B C D
RE
(%)
Initial concentration of PO43- = 14.1 mg/L
42
reduce the amounts of PO43- in solution.
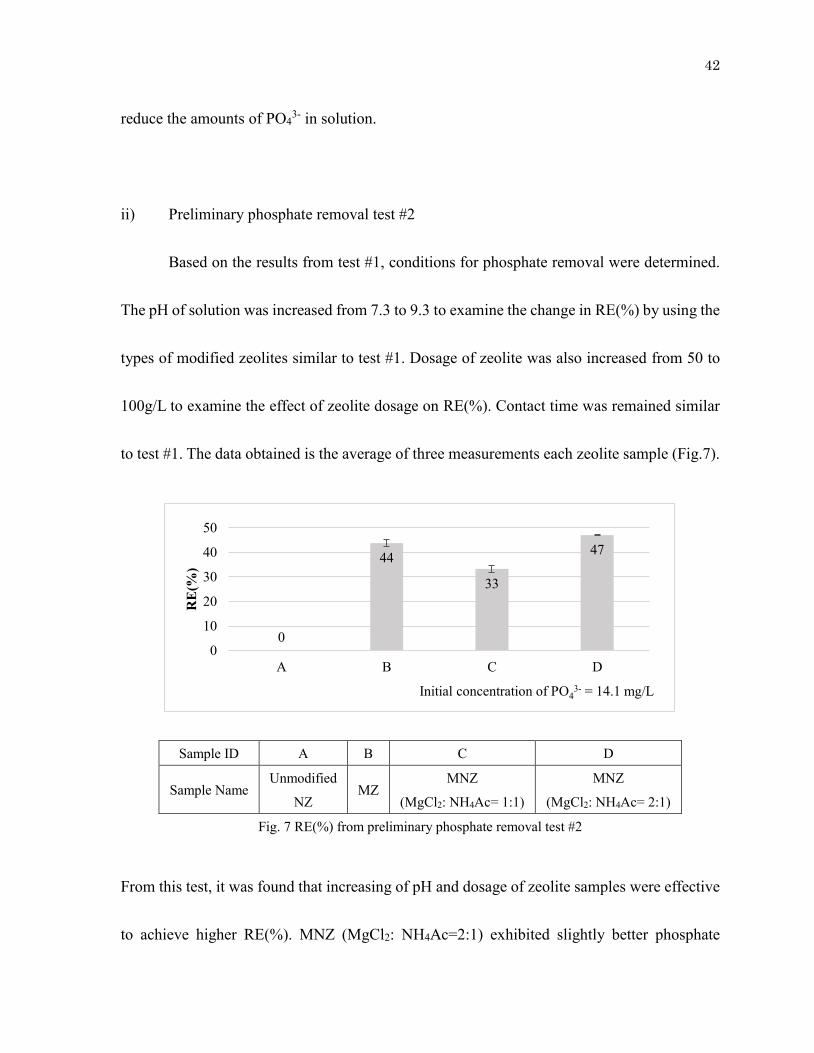
ii) Preliminary phosphate removal test #2
Based on the results from test #1, conditions for phosphate removal were determined.
The pH of solution was increased from 7.3 to 9.3 to examine the change in RE(%) by using the
types of modified zeolites similar to test #1. Dosage of zeolite was also increased from 50 to
100g/L to examine the effect of zeolite dosage on RE(%). Contact time was remained similar
to test #1. The data obtained is the average of three measurements each zeolite sample (Fig.7).
Sample ID A B C D
Sample Name Unmodified
NZ MZ
MNZ
(MgCl2: NH4Ac= 1:1)
MNZ
(MgCl2: NH4Ac= 2:1)
Fig. 7 RE(%) from preliminary phosphate removal test #2
From this test, it was found that increasing of pH and dosage of zeolite samples were effective
to achieve higher RE(%). MNZ (MgCl2: NH4Ac=2:1) exhibited slightly better phosphate
0
44
33
47
0
10
20
30
40
50
A B C D
RE
(%)
Initial concentration of PO43- = 14.1 mg/L
43
removal capacity than MNZ (MgCl2: NH4Ac=1:1), which was the same trend of observations
in test #1.
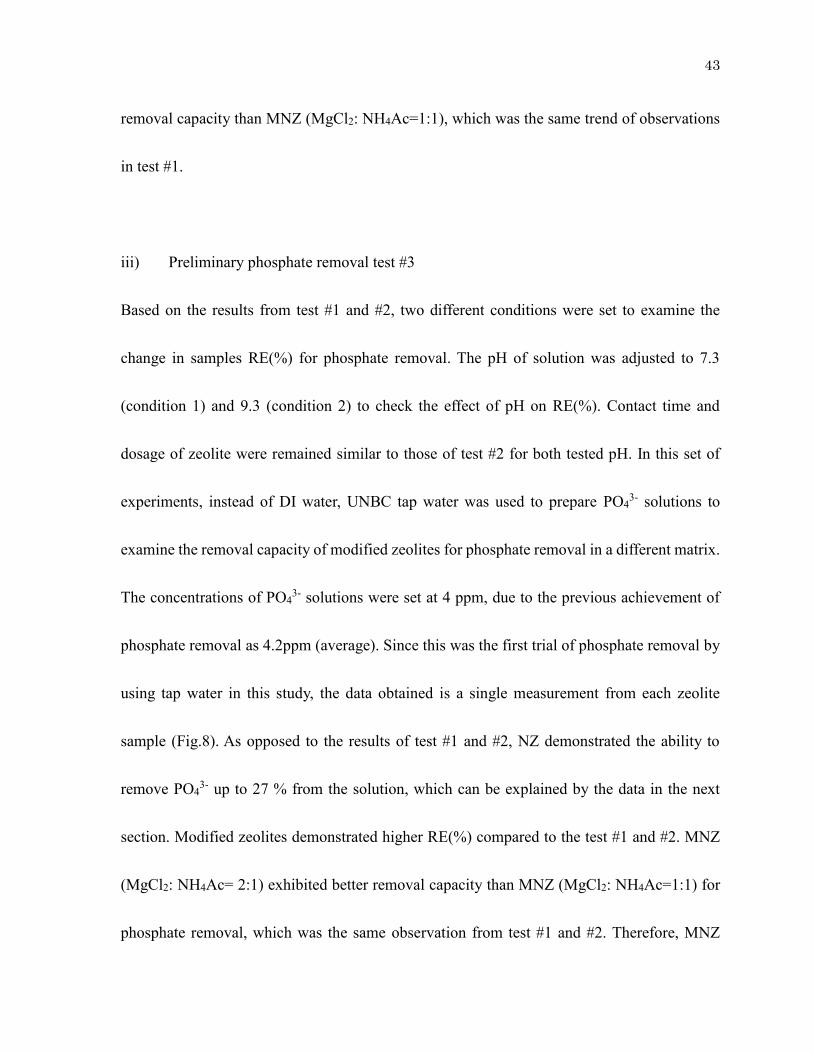
iii) Preliminary phosphate removal test #3
Based on the results from test #1 and #2, two different conditions were set to examine the
change in samples RE(%) for phosphate removal. The pH of solution was adjusted to 7.3
(condition 1) and 9.3 (condition 2) to check the effect of pH on RE(%). Contact time and
dosage of zeolite were remained similar to those of test #2 for both tested pH. In this set of
experiments, instead of DI water, UNBC tap water was used to prepare PO43- solutions to
examine the removal capacity of modified zeolites for phosphate removal in a different matrix.
The concentrations of PO43- solutions were set at 4 ppm, due to the previous achievement of
phosphate removal as 4.2ppm (average). Since this was the first trial of phosphate removal by
using tap water in this study, the data obtained is a single measurement from each zeolite
sample (Fig.8). As opposed to the results of test #1 and #2, NZ demonstrated the ability to
remove PO43- up to 27 % from the solution, which can be explained by the data in the next
section. Modified zeolites demonstrated higher RE(%) compared to the test #1 and #2. MNZ
(MgCl2: NH4Ac= 2:1) exhibited better removal capacity than MNZ (MgCl2: NH4Ac=1:1) for
phosphate removal, which was the same observation from test #1 and #2. Therefore, MNZ
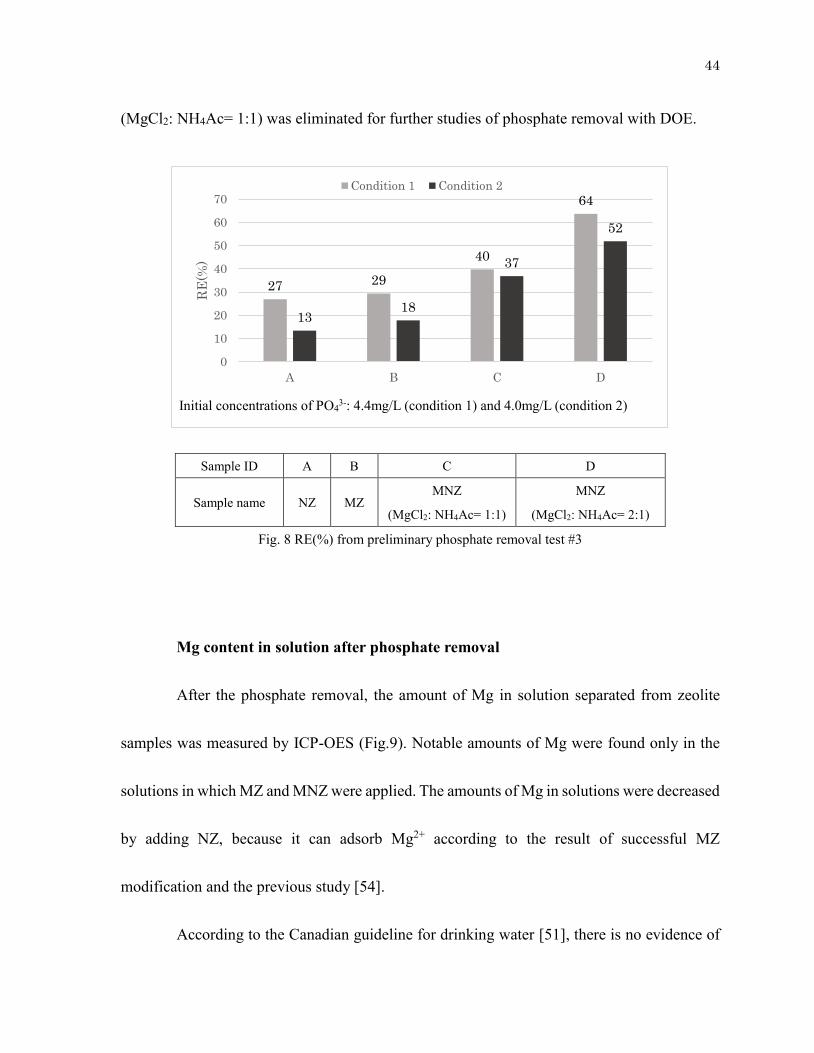
44
(MgCl2: NH4Ac= 1:1) was eliminated for further studies of phosphate removal with DOE.
Sample ID A B C D
Sample name NZ MZ MNZ
(MgCl2: NH4Ac= 1:1)
MNZ
(MgCl2: NH4Ac= 2:1)
Fig. 8 RE(%) from preliminary phosphate removal test #3
Mg content in solution after phosphate removal
After the phosphate removal, the amount of Mg in solution separated from zeolite
samples was measured by ICP-OES (Fig.9). Notable amounts of Mg were found only in the
solutions in which MZ and MNZ were applied. The amounts of Mg in solutions were decreased
by adding NZ, because it can adsorb Mg2+ according to the result of successful MZ
modification and the previous study [54].
According to the Canadian guideline for drinking water [51], there is no evidence of
27 29
40
64
1318
37
52
0
10
20
30
40
50
60
70
A B C D
RE
(%)
Condition 1 Condition 2
Initial concentrations of PO43-: 4.4mg/L (condition 1) and 4.0mg/L (condition 2)
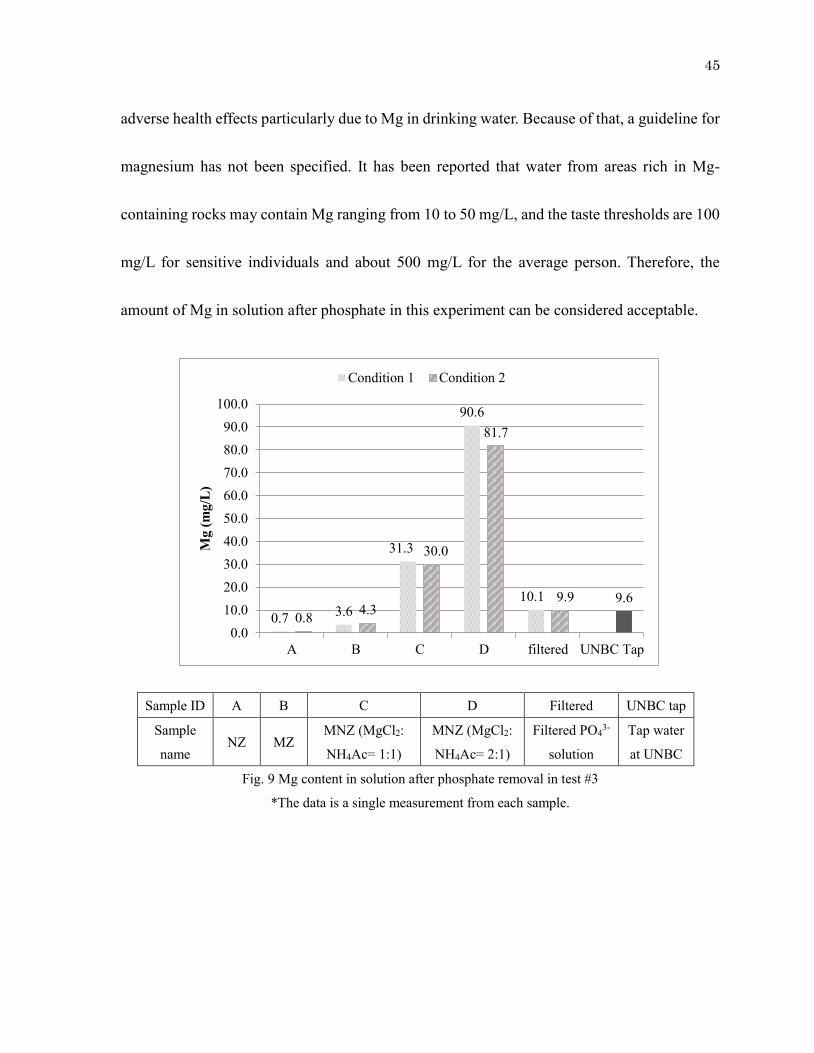
45
adverse health effects particularly due to Mg in drinking water. Because of that, a guideline for
magnesium has not been specified. It has been reported that water from areas rich in Mg-
containing rocks may contain Mg ranging from 10 to 50 mg/L, and the taste thresholds are 100
mg/L for sensitive individuals and about 500 mg/L for the average person. Therefore, the
amount of Mg in solution after phosphate in this experiment can be considered acceptable.
Sample ID A B C D Filtered UNBC tap
Sample
name NZ MZ
MNZ (MgCl2:
NH4Ac= 1:1)
MNZ (MgCl2:
NH4Ac= 2:1)
Filtered PO43-
solution
Tap water
at UNBC
Fig. 9 Mg content in solution after phosphate removal in test #3
*The data is a single measurement from each sample.
0.7 3.6
31.3
90.6
10.10.8 4.3
30.0
81.7
9.9 9.6
0.010.020.030.040.050.060.070.080.090.0
100.0
A B C D filtered UNBC Tap
Mg
(mg/
L)
Condition 1 Condition 2
46
3.2.2 Optimization of Phosphate Removal Process Using DOE and RSM
Statistical Methods
The experiments were designed using statistical software Minitab (version 18,
Minitab, Inc., USA) to find the optimal conditions for phosphate removal on MZ and MNZ as
selected modified zeolites via response surface regression. For each zeolite sample, full
quadratic model was analyzed by analysis of variance (ANOVA). By checking the full
quadratic model and Pareto chart, particle size (P) was found to be an insignificant parameter
to be included in the model and therefore it was eliminated to establish the reduced model. The
reduced model was used to optimize the conditions to maximize RE(%) for each zeolite sample
as well as to predict RE(%) for all the conditions applied to DOE. All the details of statistical
analysis from this section were presented in Appendix B.
Results of Phosphate Removal by MZ
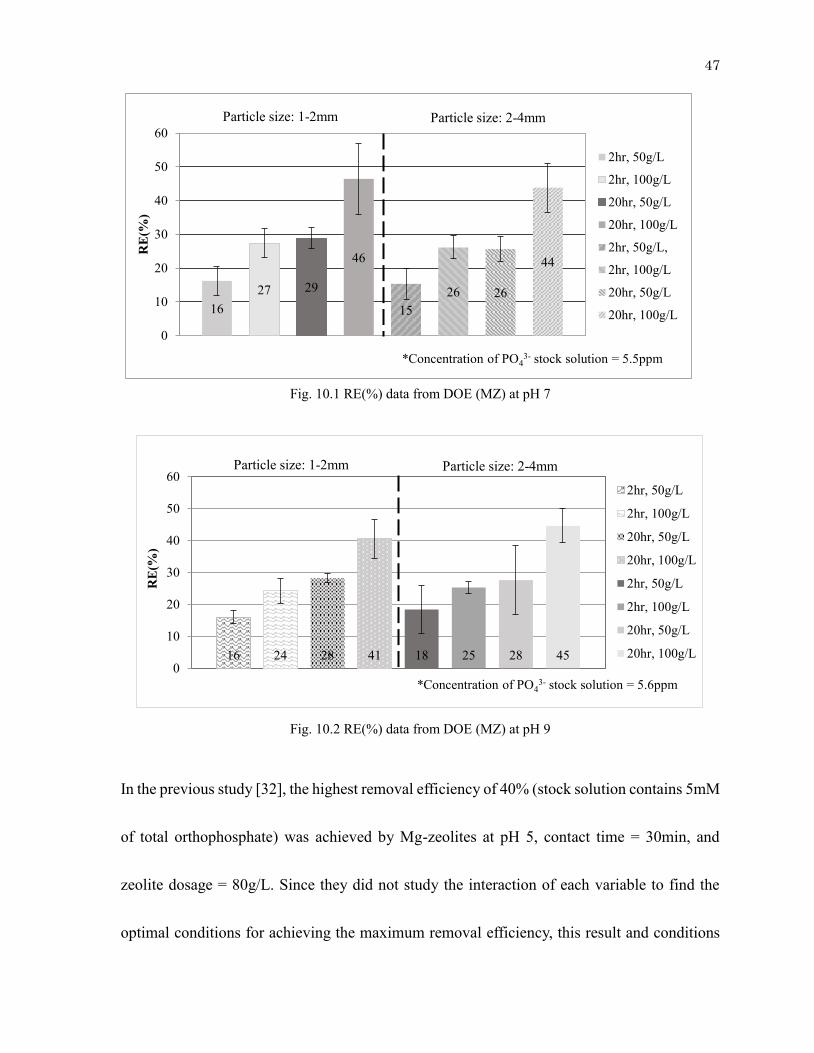
The results of RE(%) from DOE at pH 7 and 9 are depicted in Fig. 10. The data of
each condition represents the average of 3 duplicated runs. From all 54 runs, the highest RE(%)
was found to be 46 % while the lowest was 15 %. All numerical data of RE(%) was presented
in Appendix B.
47
Fig. 10.1 RE(%) data from DOE (MZ) at pH 7
Fig. 10.2 RE(%) data from DOE (MZ) at pH 9
In the previous study [32], the highest removal efficiency of 40% (stock solution contains 5mM
of total orthophosphate) was achieved by Mg-zeolites at pH 5, contact time = 30min, and
zeolite dosage = 80g/L. Since they did not study the interaction of each variable to find the
optimal conditions for achieving the maximum removal efficiency, this result and conditions
16 24 28 41 18 25 28 450
10
20
30
40
50
60
RE
(%)
2hr, 50g/L
2hr, 100g/L
20hr, 50g/L
20hr, 100g/L
2hr, 50g/L
2hr, 100g/L
20hr, 50g/L
20hr, 100g/L
Particle size: 1-2mm Particle size: 2-4mm
*Concentration of PO43- stock solution = 5.6ppm
1627 29
46
1526 26
44
0
10
20
30
40
50
60R
E(%
)2hr, 50g/L
2hr, 100g/L
20hr, 50g/L
20hr, 100g/L
2hr, 50g/L,
2hr, 100g/L
20hr, 50g/L
20hr, 100g/L
Particle size: 1-2mm Particle size: 2-4mm
*Concentration of PO43- stock solution = 5.5ppm
48
might not be comparable with this study. However, it can be concluded that 40-45% of
phosphate removal is the achievable range by Mg-zeolites.
To find the optimal conditions for achieving the highest RE(%) as well as to predict
RE(%) for all the conditions applied to DOE, the following equation was used to develop the
reduced model:
𝑅𝐸(%) = 30.15 − 0.309𝑝𝐻 + 7.304ℎ𝑟 + 6.385𝐷 − 1.73𝑝𝐻2 − 0.178𝑝𝐻 ∙ ℎ𝑟 − 0.818𝑝𝐻 ∙ 𝐷
+ 1.742ℎ𝑟 ∙ 𝐷 (8)
The correlation coefficient (R2) obtained for the model was 75.96% (R2, adjusted).
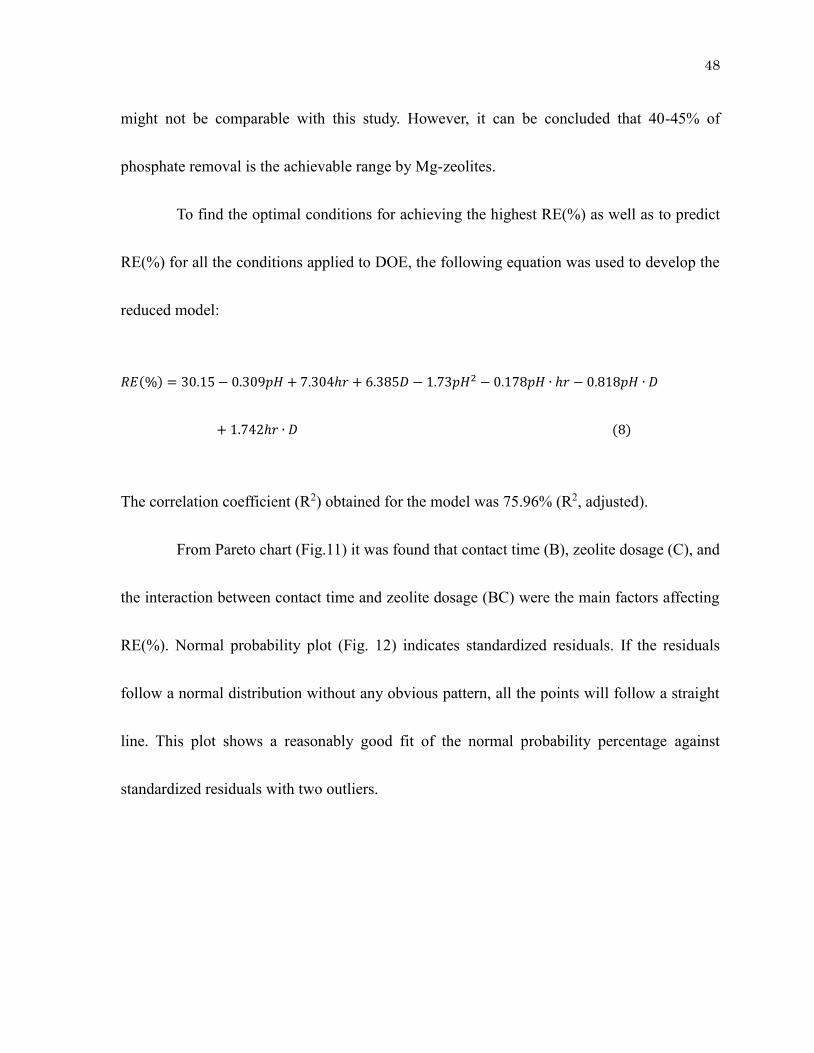
From Pareto chart (Fig.11) it was found that contact time (B), zeolite dosage (C), and
the interaction between contact time and zeolite dosage (BC) were the main factors affecting
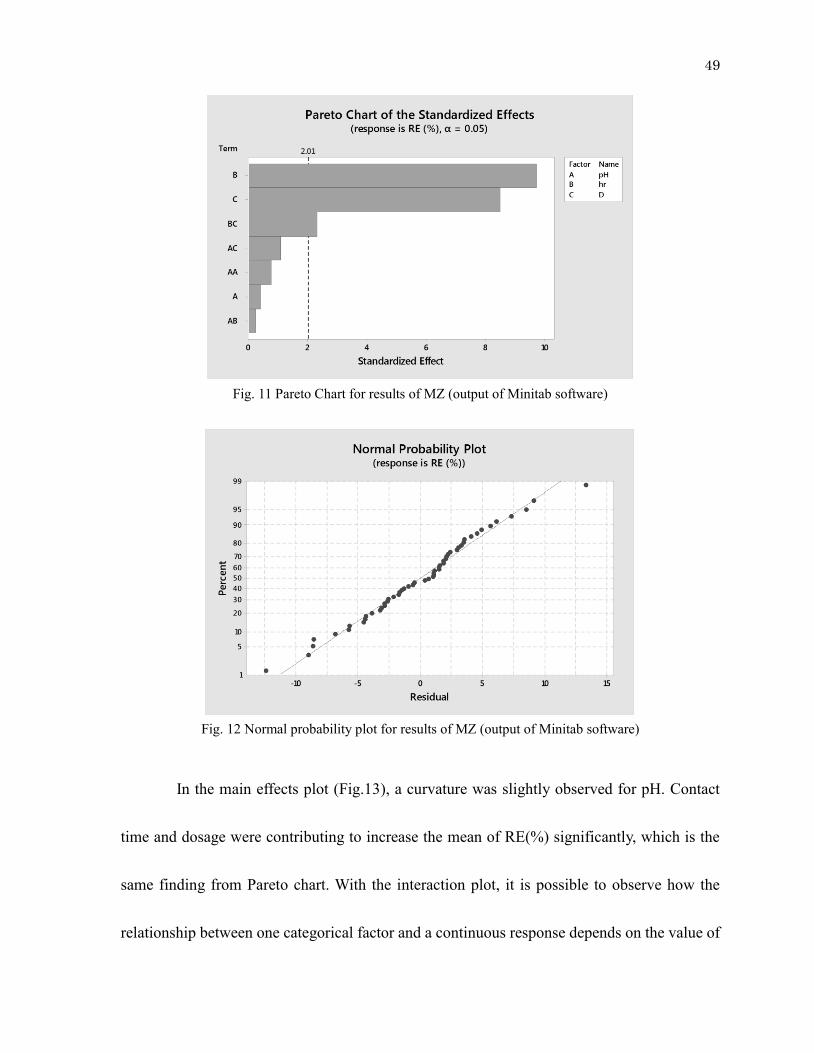
RE(%). Normal probability plot (Fig. 12) indicates standardized residuals. If the residuals
follow a normal distribution without any obvious pattern, all the points will follow a straight
line. This plot shows a reasonably good fit of the normal probability percentage against
standardized residuals with two outliers.
49
Fig. 11 Pareto Chart for results of MZ (output of Minitab software)
Fig. 12 Normal probability plot for results of MZ (output of Minitab software)
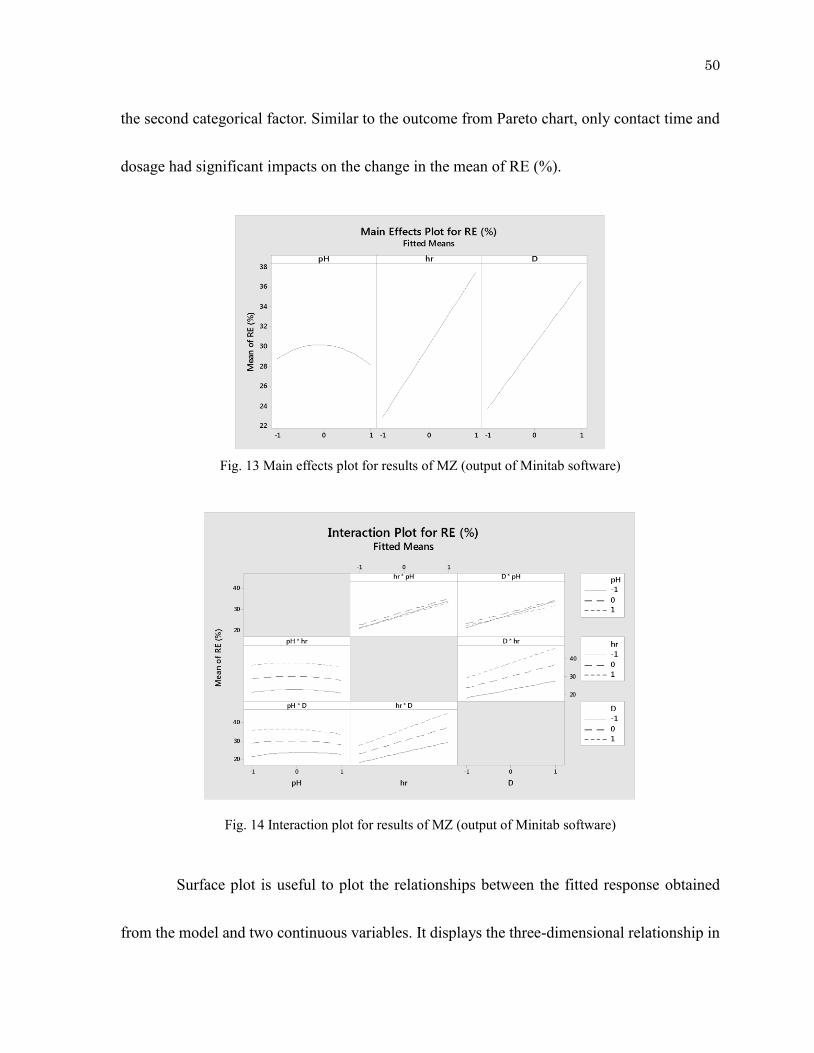
In the main effects plot (Fig.13), a curvature was slightly observed for pH. Contact
time and dosage were contributing to increase the mean of RE(%) significantly, which is the
same finding from Pareto chart. With the interaction plot, it is possible to observe how the
relationship between one categorical factor and a continuous response depends on the value of
50
the second categorical factor. Similar to the outcome from Pareto chart, only contact time and
dosage had significant impacts on the change in the mean of RE (%).
Fig. 13 Main effects plot for results of MZ (output of Minitab software)
Fig. 14 Interaction plot for results of MZ (output of Minitab software)
Surface plot is useful to plot the relationships between the fitted response obtained
from the model and two continuous variables. It displays the three-dimensional relationship in
51
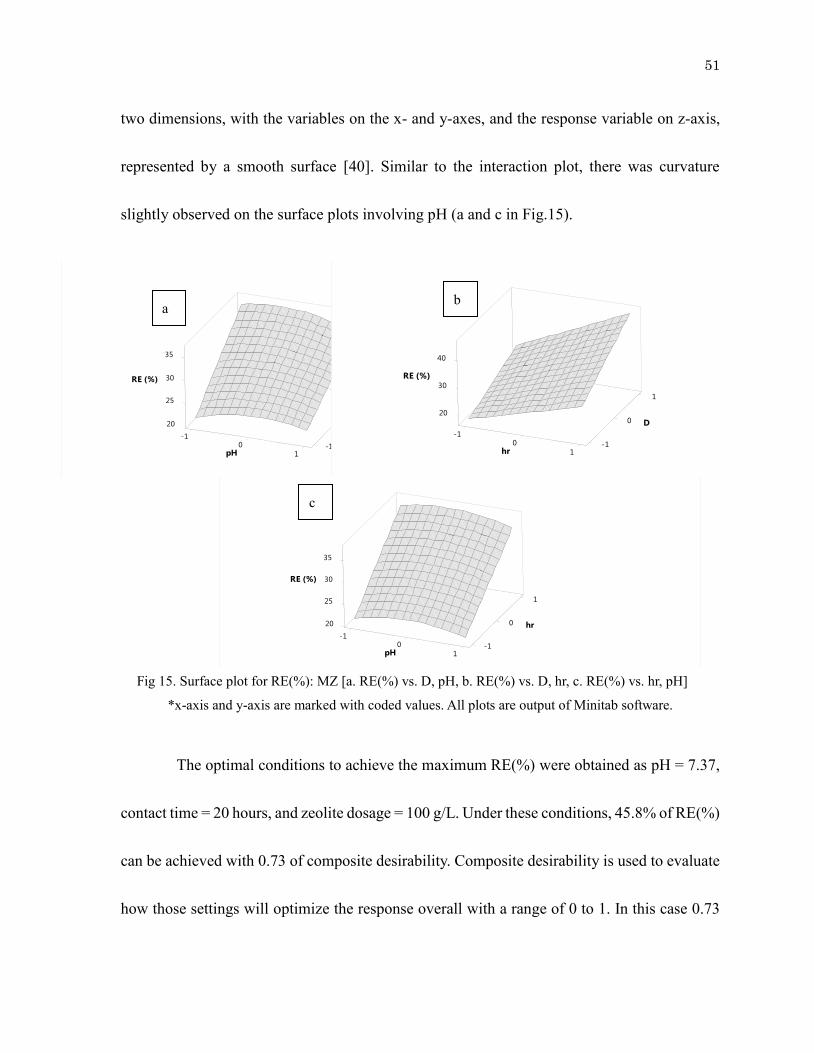
two dimensions, with the variables on the x- and y-axes, and the response variable on z-axis,
represented by a smooth surface [40]. Similar to the interaction plot, there was curvature
slightly observed on the surface plots involving pH (a and c in Fig.15).
Fig 15. Surface plot for RE(%): MZ [a. RE(%) vs. D, pH, b. RE(%) vs. D, hr, c. RE(%) vs. hr, pH]
*x-axis and y-axis are marked with coded values. All plots are output of Minitab software.
The optimal conditions to achieve the maximum RE(%) were obtained as pH = 7.37,
contact time = 20 hours, and zeolite dosage = 100 g/L. Under these conditions, 45.8% of RE(%)
can be achieved with 0.73 of composite desirability. Composite desirability is used to evaluate
how those settings will optimize the response overall with a range of 0 to 1. In this case 0.73
hr 0
Hold Values
-10
20
25
30
-1
-11
0
1
35
)%( ER
D
Hp
Hp ,D sv )%( ER fo tolP ecafruS
pH 0
Hold Values
-10
20
30
-1
-11
0
1
40
)%( ER
D
rh
rh ,D sv )%( ER fo tolP ecafruS
D 0
Hold Values
-10
20
25
30
-1
-11
0
1
35
)%( ER
rh
Hp
Hp ,rh sv )%( ER fo tolP ecafruS
a b
c
52
is fairly close to 1, indicating that the settings seem to achieve the proposed maximum RE(%)
under those conditions.
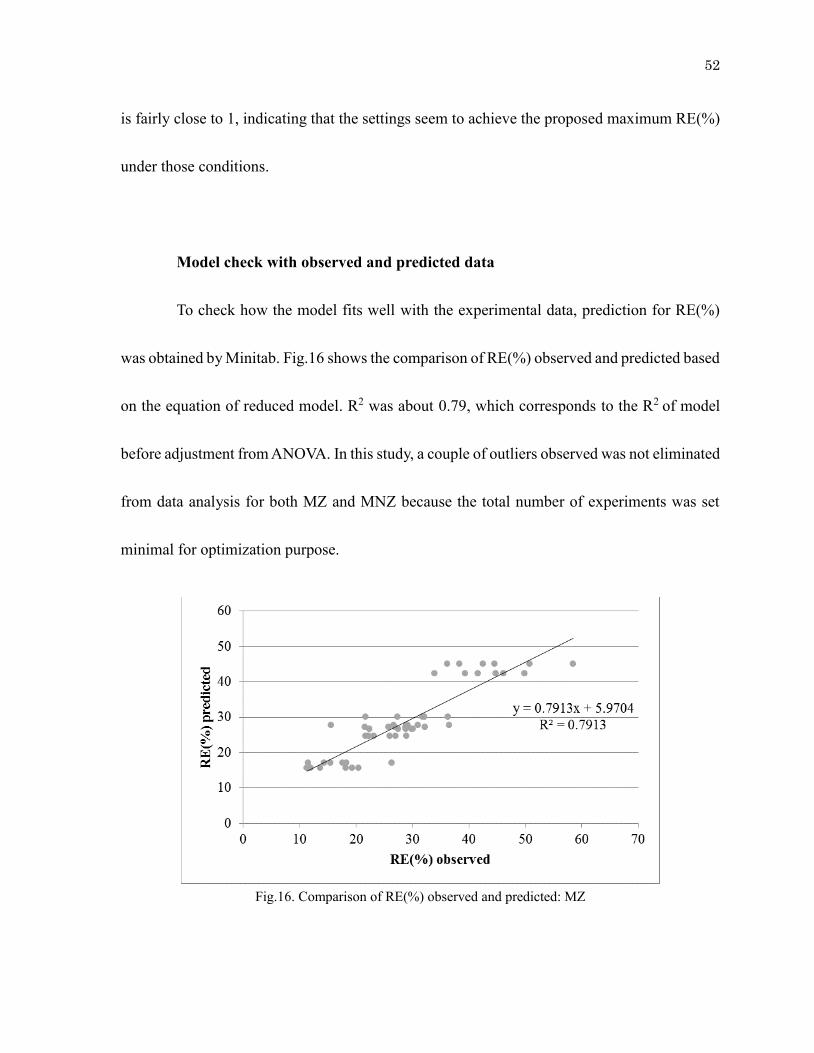
Model check with observed and predicted data
To check how the model fits well with the experimental data, prediction for RE(%)
was obtained by Minitab. Fig.16 shows the comparison of RE(%) observed and predicted based
on the equation of reduced model. R2 was about 0.79, which corresponds to the R2 of model
before adjustment from ANOVA. In this study, a couple of outliers observed was not eliminated
from data analysis for both MZ and MNZ because the total number of experiments was set
minimal for optimization purpose.
Fig.16. Comparison of RE(%) observed and predicted: MZ
53
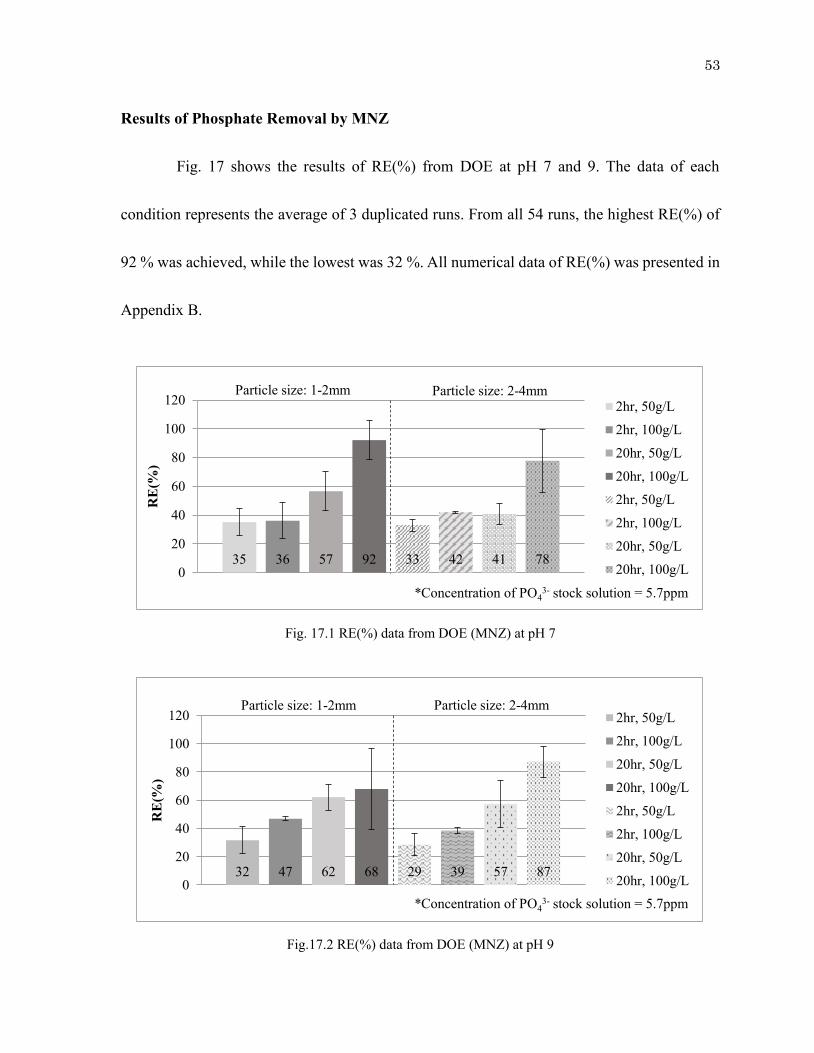
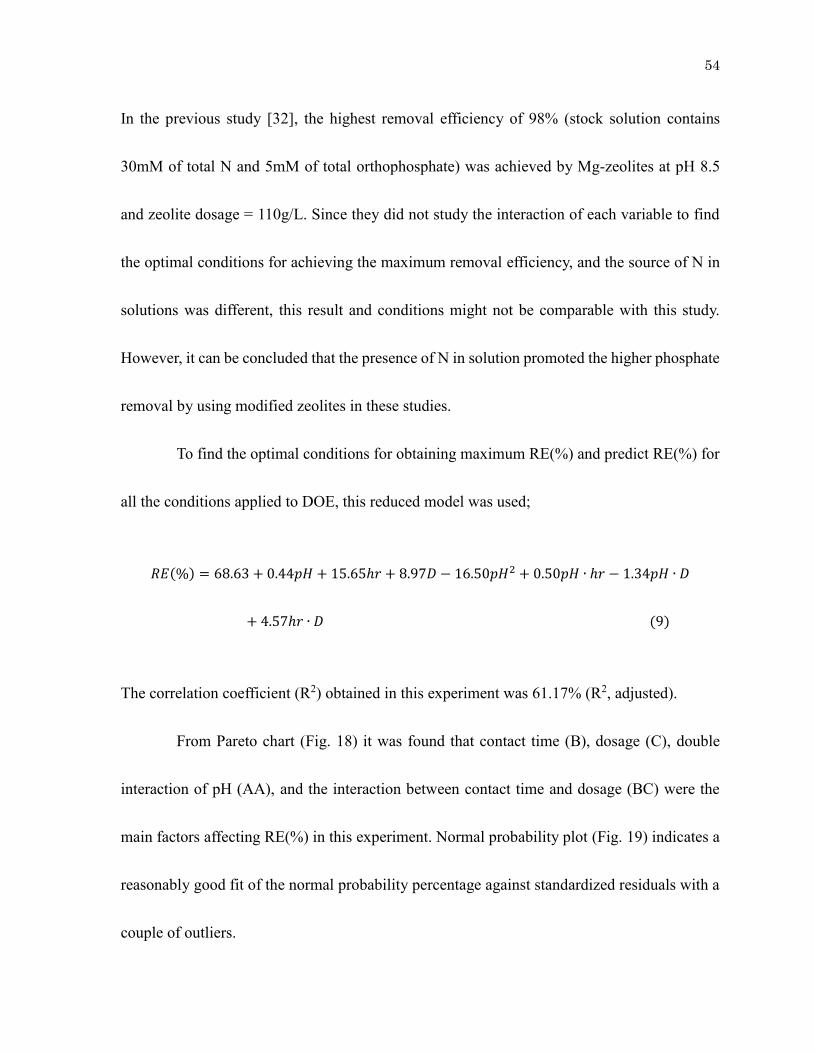
Results of Phosphate Removal by MNZ
Fig. 17 shows the results of RE(%) from DOE at pH 7 and 9. The data of each
condition represents the average of 3 duplicated runs. From all 54 runs, the highest RE(%) of
92 % was achieved, while the lowest was 32 %. All numerical data of RE(%) was presented in
Appendix B.
Fig. 17.1 RE(%) data from DOE (MNZ) at pH 7
Fig.17.2 RE(%) data from DOE (MNZ) at pH 9
35 36 57 92 33 42 41 780
20
40
60
80
100
120
RE
(%)
2hr, 50g/L
2hr, 100g/L
20hr, 50g/L
20hr, 100g/L
2hr, 50g/L
2hr, 100g/L
20hr, 50g/L
20hr, 100g/L
Particle size: 1-2mm Particle size: 2-4mm
*Concentration of PO43- stock solution = 5.7ppm
32 47 62 68 29 39 57 870
20
40
60
80
100
120
RE
(%)
2hr, 50g/L
2hr, 100g/L
20hr, 50g/L
20hr, 100g/L
2hr, 50g/L
2hr, 100g/L
20hr, 50g/L
20hr, 100g/L
Particle size: 1-2mm Particle size: 2-4mm
*Concentration of PO43- stock solution = 5.7ppm
54
In the previous study [32], the highest removal efficiency of 98% (stock solution contains
30mM of total N and 5mM of total orthophosphate) was achieved by Mg-zeolites at pH 8.5
and zeolite dosage = 110g/L. Since they did not study the interaction of each variable to find
the optimal conditions for achieving the maximum removal efficiency, and the source of N in
solutions was different, this result and conditions might not be comparable with this study.
However, it can be concluded that the presence of N in solution promoted the higher phosphate
removal by using modified zeolites in these studies.
To find the optimal conditions for obtaining maximum RE(%) and predict RE(%) for
all the conditions applied to DOE, this reduced model was used;
𝑅𝐸(%) = 68.63 + 0.44𝑝𝐻 + 15.65ℎ𝑟 + 8.97𝐷 − 16.50𝑝𝐻2 + 0.50𝑝𝐻 ∙ ℎ𝑟 − 1.34𝑝𝐻 ∙ 𝐷
+ 4.57ℎ𝑟 ∙ 𝐷 (9)
The correlation coefficient (R2) obtained in this experiment was 61.17% (R2, adjusted).
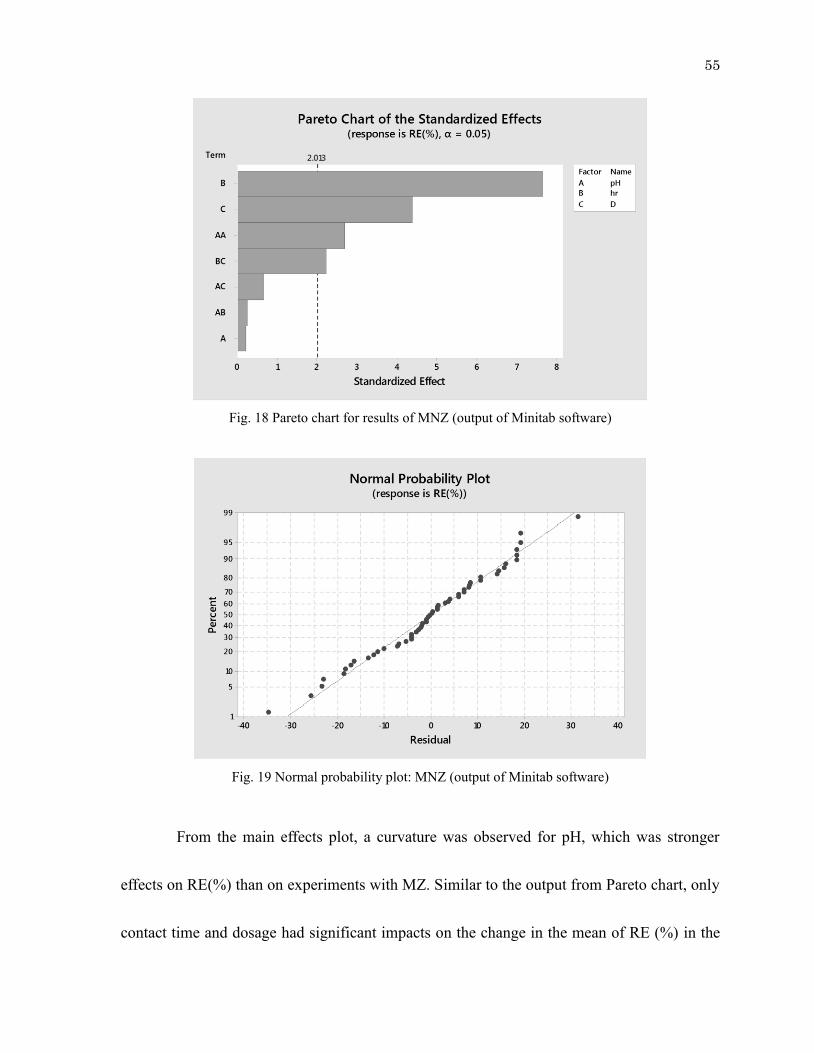
From Pareto chart (Fig. 18) it was found that contact time (B), dosage (C), double
interaction of pH (AA), and the interaction between contact time and dosage (BC) were the
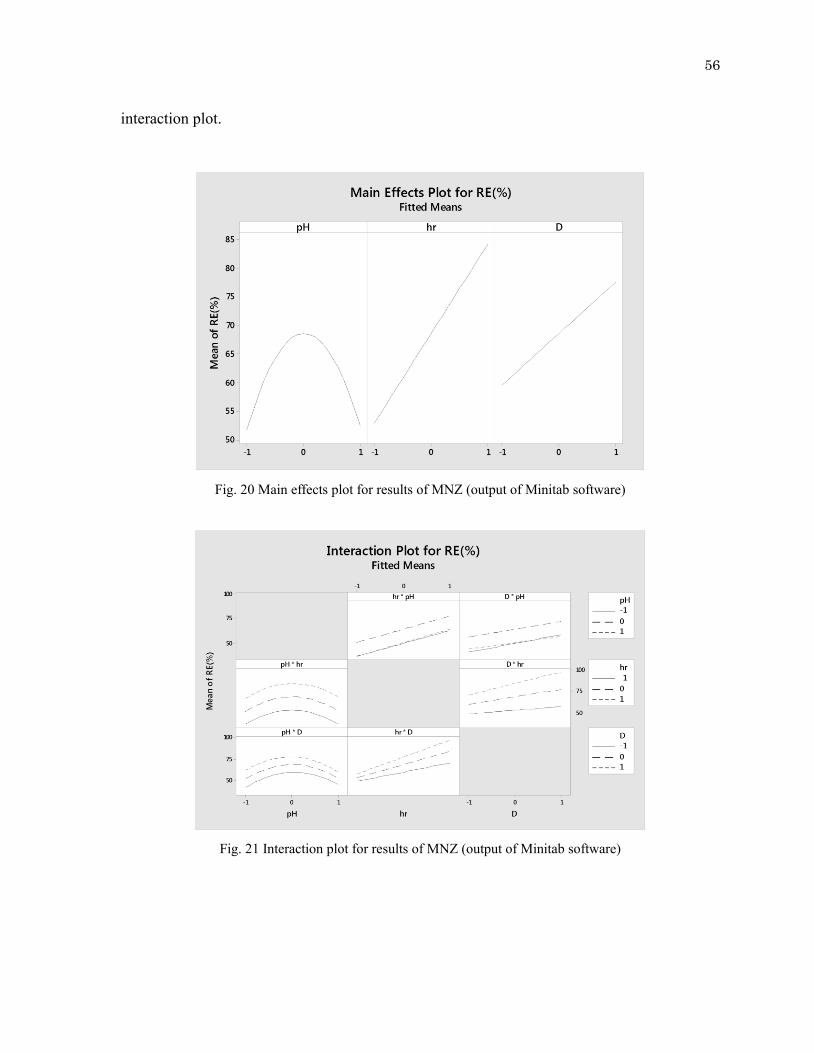
main factors affecting RE(%) in this experiment. Normal probability plot (Fig. 19) indicates a
reasonably good fit of the normal probability percentage against standardized residuals with a
couple of outliers.
55
Fig. 18 Pareto chart for results of MNZ (output of Minitab software)
Fig. 19 Normal probability plot: MNZ (output of Minitab software)
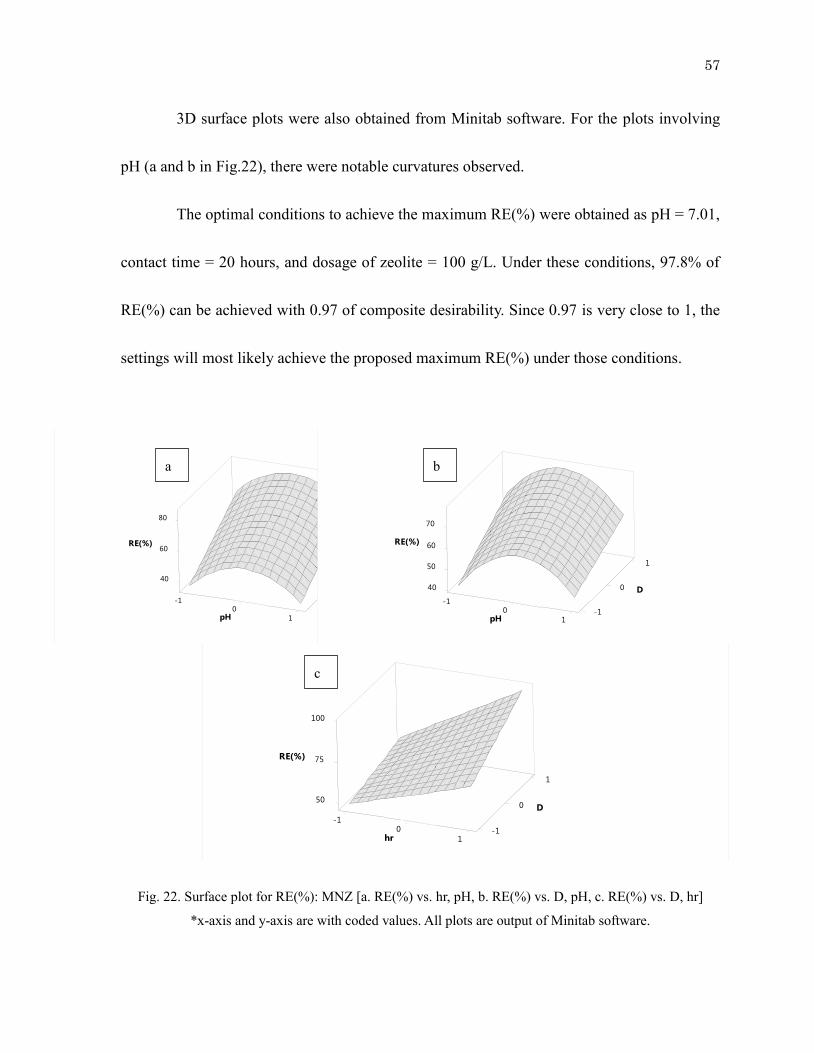
From the main effects plot, a curvature was observed for pH, which was stronger
effects on RE(%) than on experiments with MZ. Similar to the output from Pareto chart, only
contact time and dosage had significant impacts on the change in the mean of RE (%) in the
56
interaction plot.
Fig. 20 Main effects plot for results of MNZ (output of Minitab software)
Fig. 21 Interaction plot for results of MNZ (output of Minitab software)
57
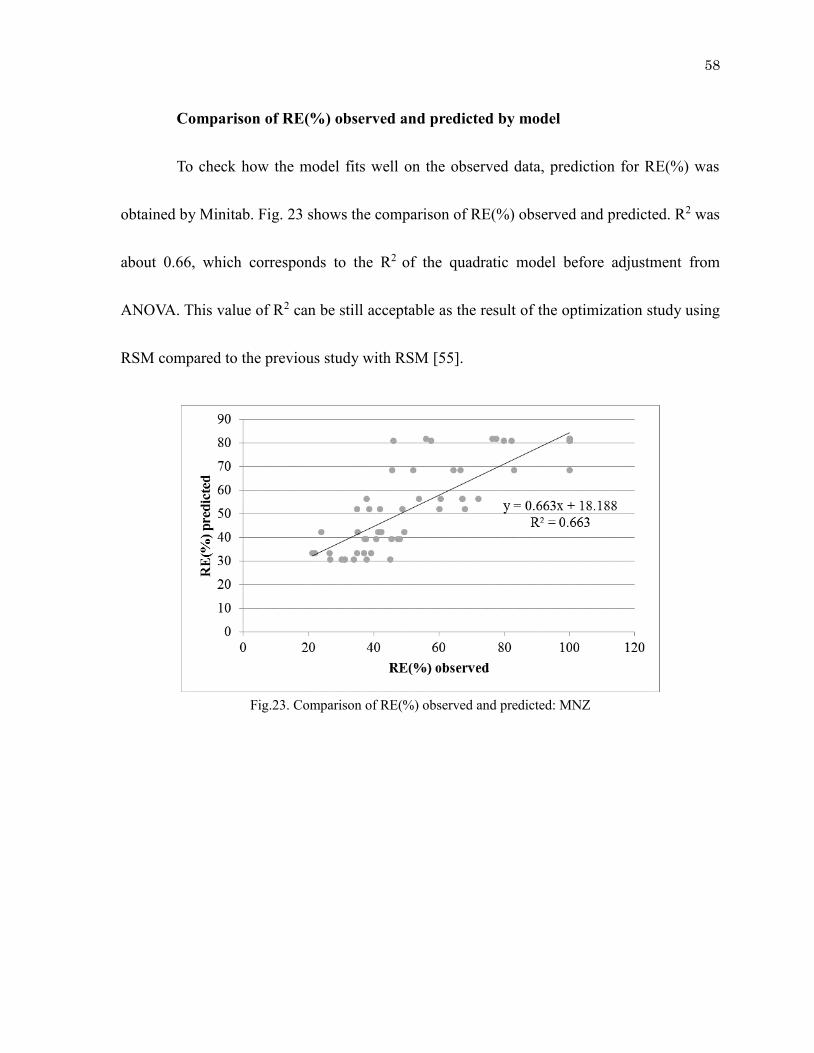
3D surface plots were also obtained from Minitab software. For the plots involving
pH (a and b in Fig.22), there were notable curvatures observed.
The optimal conditions to achieve the maximum RE(%) were obtained as pH = 7.01,
contact time = 20 hours, and dosage of zeolite = 100 g/L. Under these conditions, 97.8% of
RE(%) can be achieved with 0.97 of composite desirability. Since 0.97 is very close to 1, the
settings will most likely achieve the proposed maximum RE(%) under those conditions.
Fig. 22. Surface plot for RE(%): MNZ [a. RE(%) vs. hr, pH, b. RE(%) vs. D, pH, c. RE(%) vs. D, hr]
*x-axis and y-axis are with coded values. All plots are output of Minitab software.
D 0
Hold Values
-10
40
60
-1
-11
0
1
80
)%(ER
rh
Hp
Hp ,rh sv )%(ER fo tolP ecafruS
hr 0
Hold Values
-10
40
50
60
-1
-11
0
1
70
)%(ER
D
Hp
Hp ,D sv )%(ER fo tolP ecafruS
pH 0
Hold Values
-10
50
75
-1
-11
0
1
100
)%(ER
D
rh
rh ,D sv )%(ER fo tolP ecafruS
a b
c
58
Comparison of RE(%) observed and predicted by model
To check how the model fits well on the observed data, prediction for RE(%) was
obtained by Minitab. Fig. 23 shows the comparison of RE(%) observed and predicted. R2 was
about 0.66, which corresponds to the R2 of the quadratic model before adjustment from
ANOVA. This value of R2 can be still acceptable as the result of the optimization study using
RSM compared to the previous study with RSM [55].
Fig.23. Comparison of RE(%) observed and predicted: MNZ
59
3.2.3 Assessment of the Amounts of P on Spent Zeolite Samples
Possible mechanisms of phosphate removal by MZ
According to You et al. [30], the main possible phosphate sorption process by MZ can
be divided into the fastest and the slowest steps:
i) The first (faster) step consisting of Mg2+ fast exchange with other ions present in
solutions (e.g. NH4+, Na+)
ii) The second (slower) step where PO43-, having reached the boundary layer, interact with
dissolved Mg2+
As a result, two-boundary reaction layers can be possibly formed: (i) the exchanged Na+/NH4+
layer and (ii) the formation of magnesium ammonium phosphate. The combination of both
steps could result in higher reaction times to reach equilibrium. This two-step phosphate
sorption process could explain that the longer contact time had greatly influenced on resulting
higher RE(%) in this study.
Possible form of phosphate-based compounds due to phosphate removal by MZ
By adding MZ to the solution containing PO43-, it is possible to form these compounds
containing Mg2+ after phosphate removal: Mg3(PO4)2, MgHPO4, Mg(H2PO4)2 [31]. Due to the
large amounts of Ca2+ contained in natural clinoptilolite, it is also possible to form calcium
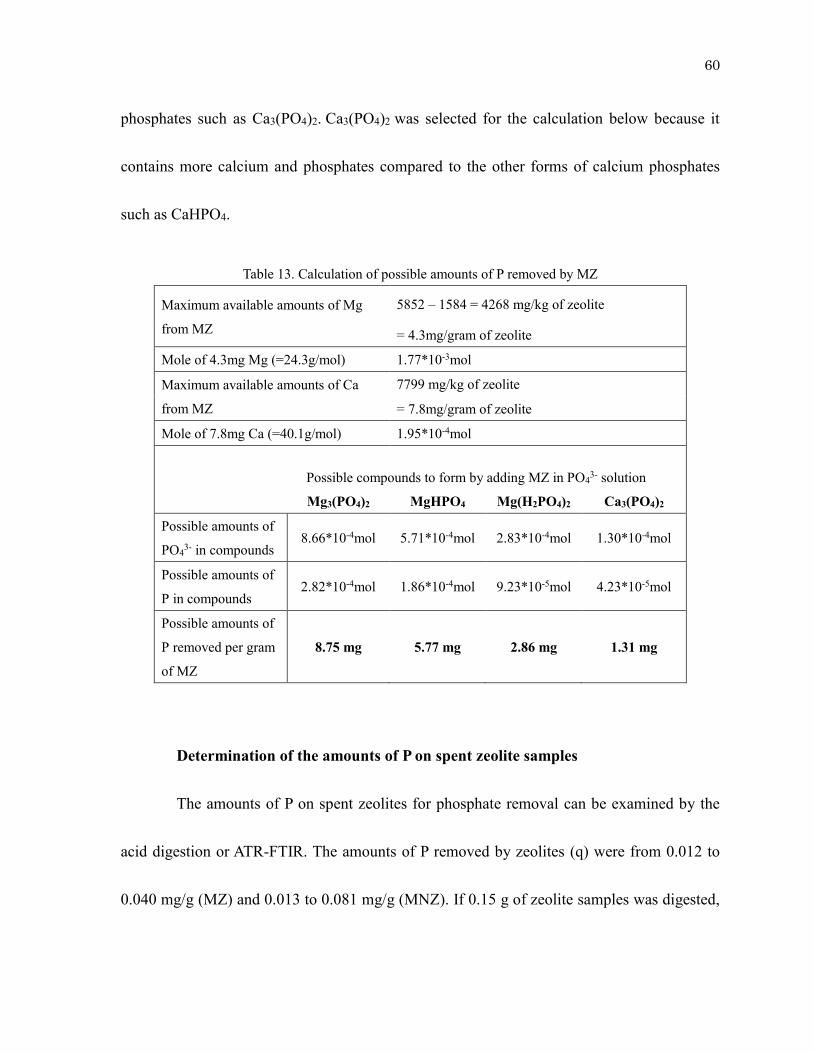
60
phosphates such as Ca3(PO4)2. Ca3(PO4)2 was selected for the calculation below because it
contains more calcium and phosphates compared to the other forms of calcium phosphates
such as CaHPO4.
Table 13. Calculation of possible amounts of P removed by MZ
Maximum available amounts of Mg
from MZ
5852 – 1584 = 4268 mg/kg of zeolite
= 4.3mg/gram of zeolite
Mole of 4.3mg Mg (=24.3g/mol) 1.77*10-3mol
Maximum available amounts of Ca
from MZ
7799 mg/kg of zeolite
= 7.8mg/gram of zeolite
Mole of 7.8mg Ca (=40.1g/mol) 1.95*10-4mol
Possible compounds to form by adding MZ in PO43- solution
Mg3(PO4)2 MgHPO4 Mg(H2PO4)2 Ca3(PO4)2
Possible amounts of
PO43- in compounds 8.66*10-4mol 5.71*10-4mol 2.83*10-4mol 1.30*10-4mol
Possible amounts of
P in compounds 2.82*10-4mol 1.86*10-4mol 9.23*10-5mol 4.23*10-5mol
Possible amounts of
P removed per gram
of MZ
8.75 mg 5.77 mg 2.86 mg 1.31 mg
Determination of the amounts of P on spent zeolite samples
The amounts of P on spent zeolites for phosphate removal can be examined by the
acid digestion or ATR-FTIR. The amounts of P removed by zeolites (q) were from 0.012 to
0.040 mg/g (MZ) and 0.013 to 0.081 mg/g (MNZ). If 0.15 g of zeolite samples was digested,
61
the change of P amounts on the spent zeolites cannot be accurately determined because the
method detection limit of elemental P by ICP-OES is 0.13 mg/kg for digestate.
The spent zeolites were washed with DI water once to remove the excess amounts of
PO43- possibly loaded on the surface of zeolite samples. Because the natural clinoptilolite
cannot strongly retain the molecules of PO43- in the aqueous environment, certain amounts of
PO43- could have been washed away even with a single wash with DI water. In this study,
quantifying the amounts of PO43- was found to be quite difficult.
Below is the calculation of the maximum amounts of possible struvite formed by
adding 1g of MNZ. Since the molar ratio of Mg2+, NH4+, PO4
3-, and struvite are all the same as
mentioned earlier, Mole of Mg2+ available on MNZ was calculated based on the data from the
acid digestion. Then it was converted to the possible maximum amounts of struvite crystal
formed after subtracting the soluble amounts of struvite in 10mL water.
Since there are other possible forms of compounds containing PO43-, such as
Mg3(PO4)2, the actual amount of struvite crystal should be smaller than 13.35mg/g of zeolite.
It might be also too small to determine by the acid digestion or ATR-FTIR, because the amounts
of sample zeolite used for those analyses were about 0.15g. MNZ contained much less amounts
of Ca, so it is unlikely that the significant amounts of Ca3(PO4)2 were formed because of MNZ.
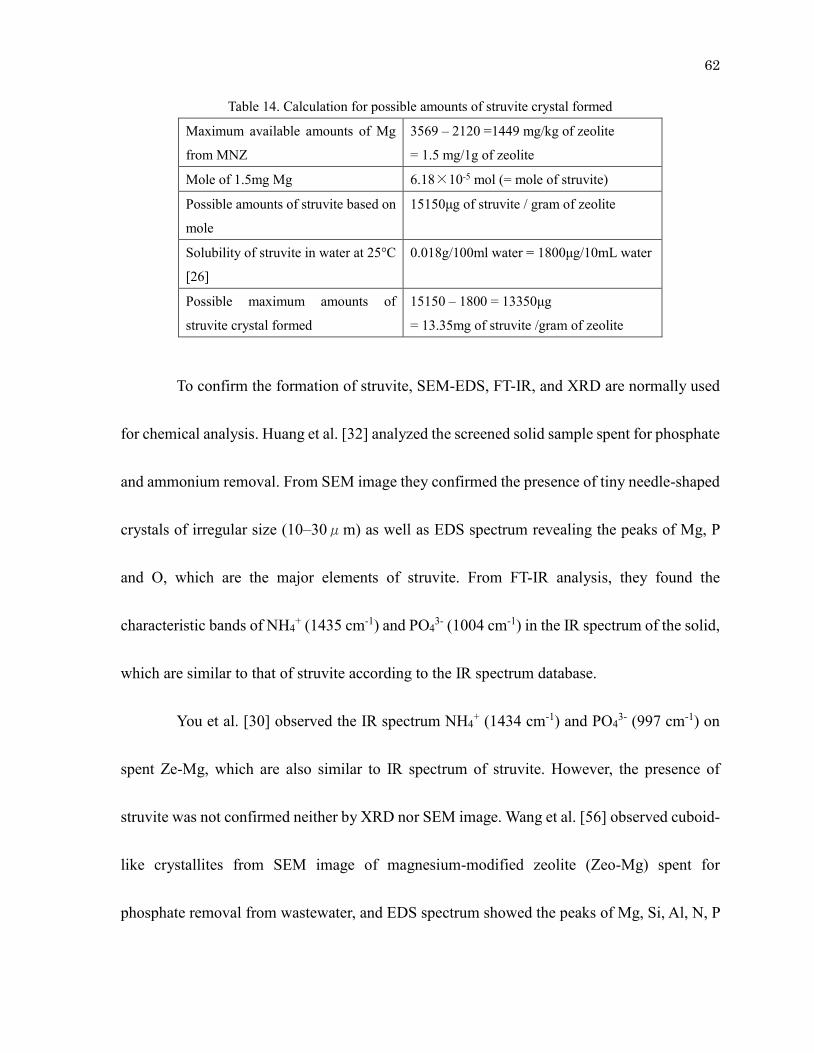
62
Table 14. Calculation for possible amounts of struvite crystal formed
Maximum available amounts of Mg
from MNZ
3569 – 2120 =1449 mg/kg of zeolite
= 1.5 mg/1g of zeolite
Mole of 1.5mg Mg 6.18×10⁻⁵ mol (= mole of struvite)
Possible amounts of struvite based on
mole
15150μg of struvite / gram of zeolite
Solubility of struvite in water at 25°C
[26]
0.018g/100ml water = 1800μg/10mL water
Possible maximum amounts of
struvite crystal formed
15150 – 1800 = 13350μg
= 13.35mg of struvite /gram of zeolite
To confirm the formation of struvite, SEM-EDS, FT-IR, and XRD are normally used
for chemical analysis. Huang et al. [32] analyzed the screened solid sample spent for phosphate
and ammonium removal. From SEM image they confirmed the presence of tiny needle-shaped
crystals of irregular size (10–30μm) as well as EDS spectrum revealing the peaks of Mg, P
and O, which are the major elements of struvite. From FT-IR analysis, they found the
characteristic bands of NH4+ (1435 cm-1) and PO4
3- (1004 cm-1) in the IR spectrum of the solid,
which are similar to that of struvite according to the IR spectrum database.
You et al. [30] observed the IR spectrum NH4+ (1434 cm-1) and PO4
3- (997 cm-1) on
spent Ze-Mg, which are also similar to IR spectrum of struvite. However, the presence of
struvite was not confirmed neither by XRD nor SEM image. Wang et al. [56] observed cuboid-
like crystallites from SEM image of magnesium-modified zeolite (Zeo-Mg) spent for
phosphate removal from wastewater, and EDS spectrum showed the peaks of Mg, Si, Al, N, P
63
and O, which are the major elements of zeolite and struvite. Because of that, they stated that
struvite formation was attributed to the removal of nutrients from wastewater by using Zeo-
Mg. Although chemical analysis by those techniques could provide the information about the
struvite crystal, it seems to be still challenging to accurately quantify the formation of struvite
precipitated directly onto zeolite samples.
64
Chapter 4: Conclusion and Future Work
Conclusion
In this study, NZ can be modified with MgCl2 as well as mixture of MgCl2 and NH4Ac
by following the proposed modification method in this study. With the characterization
methods, it was possible to confirm the chemical compositions of NZ and modified zeolites.
SiO2/Al2O3 ratio from XRF data (calculated as 5.95), XRD peaks, and observation from SEM
image showed that the zeolite samples can be considered as a clinoptilolite. The zeolite samples
showed the typical characteristics of natural clinoptilolite on TGA and ATR-FTIR data. From
leaching test of the zeolite samples, the concentrations of heavy metals and trace elements in
zeolite leachate were found to be either lower than detection limit or considered to be non-
toxic based on Canadian guideline of drinking water.
There was an appreciable increase of Mg2+ as well as decrease of Na+, Ca2+ and K+ in
zeolite digestate, which can be due to the amounts of ions exchanged during modification
process. The trend of increase and decrease of ions was fairly consistent with the previous
studies. For MZ, the increase of Mg2+ was about 4% which is similar to the result of Huang et
al. [29]. For MNZ, the increase of Mg2+ was about 5% and about 14% of NH4+ was retained in
the pores of natural clinoptilolite simultaneously.
65
From preliminary phosphate removal test, NZ was found to be ineffective for
phosphate removal compared to modified zeolites due to its low values of RE(%) (0-2% in DI
water, 13-27% in UNBC tap water). Because of the values of RE(%), modified zeolites were
found to be effective for phosphate removal in DI water as well as UNBC tap water. Overall,
MNZ showed higher RE(%) compared to MZ. MNZ showed up to 47% in DI water and 64%
in UNBC tap water, while MZ showed up to 29% in DI water and 44% in UNBC tap water.
For MNZ, it was found that MNZ (MgCl2: NH4Ac= 2:1) worked better on phosphate removal
than MNZ (MgCl2: NH4Ac= 1:1).
The statistical analysis based on DOE showed that contact time and zeolite dosage
were the significant parameters for phosphate removal while particle size of zeolite was much
less significant. From the results of DOE, it was found that MNZ can achieve 92% of RE(%)
while MZ can achieve to 46% of RE(%). From RSM based on the results of DOE, the optimal
conditions to achieve the maximum RE(%) were obtained. 97.8% of RE(%) can be achieved
with MNZ at pH = 7.01, contact time = 20 hours, and zeolite dosage = 100 g/L, whereas 45.8%
of RE(%) can be achieved with MZ at pH = 7.37, contact time = 20 hours, and zeolite dosage
= 100 g/L. MNZ exhibited higher RE(%) than MZ and it was analogous to the findings in the
preliminary phosphate removal tests.
66
Future work
For achieving the highest RE(%) with optimal conditions given in this study by using
modified zeolites, additional runs must be conducted for phosphate removal to examine the
variance of RE(%) from the predicted values which were determined based on the quadratic
model in this study.
Most studies have been focused on obtaining high removal of PO43- by increasing the
adsorption capacity as much as possible. Although that is desirable, the cost of producing the
adsorbents should also be considered. For instance, the cost for adding Mg2+ is one of the
economic challenges for application of struvite crystallization [57]. Since it was possible to
remove PO43- with relatively smaller amounts of MgCl2 solution, it can be beneficial to study
the minimum amounts of MgCl2 required to modify the natural zeolites to achieve the decent
removal capacity towards phosphate as well as forming struvite.
The proposed method for phosphate removal was conducted mainly with DI water
matrix. It is desirable to perform the same procedure by using different types of water samples,
such as lake water, grey water from household, and so on. Since it was found that contact time
and zeolite dosage are the significant parameters for phosphate removal with the zeolite
samples, it will be beneficial to study if those conditions can be still significant for treating
eutrophic water bodies with modified zeolites in order to assess its effectiveness for real-world
67
applications. While the presence of other cations, which can combine with Mg2+, PO43-, and
NH4+, was not studied, it is important to investigate how the other cations can influence on the
formation of compounds containing those ions as well as struvite, especially within more
complex water matrix. This future study will also provide more useful information on the ion
exchange process and possible mechanisms of phosphate removal by the modified natural
zeolites.
With the available instruments and techniques, it was not possible to confirm the
presence of struvite which can be a part of mechanism of phosphate removal by using MNZ.
Once achieving the higher removal capacity of PO43-, further studies are needed to quantify the
formed struvite without involving wet chemistry to avoid the loss of the struvite crystals during
sample preparation procedures.
For improving the correlation coefficient (R2) for the models obtained from RSM, it
can be helpful to increase the number of runs on DOE. In this study, the experiments were
conducted with minimal number of runs due to the purpose of the optimization. Additional
experiments will be helpful, especially by increasing the levels of each variable, because two-
level full-factorial experiments can only evaluate high, middle (as center points), and low level
of variables. General factorial experiments could be performed to obtain more detailed
information about removal efficiency of modified zeolites at multiple levels of variables.
68
References [1] Scavia D, Allan JD, Arend KK, Bartell S, Beletsky D, Bosch NS, et al. Assessing and
addressing the re-eutrophication of Lake Erie: Central basin hypoxia. J Great Lakes Res 2014;40:226–46. doi:10.1016/j.jglr.2014.02.004.
[2] Wang S, Peng Y. Natural zeolites as effective adsorbents in water and wastewater treatment. Chem Eng J 2010;156:11–24. doi:10.1016/j.cej.2009.10.029.
[3] Doyle JD, Parsons SA. Struvite formation, control and recovery. Water Res 2002;36:3925–40. doi:10.1016/S0043-1354(02)00126-4.
[4] Anderson DM, Glibert PM, Burkholder JM. Harmful algal blooms and eutrophication: Nutrient sources, composition, and consequences. Estuaries 2002;25:704–26. doi:10.1007/BF02804901.
[5] Smith VH, Schindler DW. Eutrophication science: where do we go from here? 2009. doi:10.1016/j.tree.2008.11.009.
[6] Zamparas M, Zacharias I. Restoration of eutrophic freshwater by managing internal nutrient loads. A review. Sci Total Environ 2014;496:551–62. doi:10.1016/j.scitotenv.2014.07.076.
[7] Schindler DW, Carpenter SR, Chapra SC, Hecky RE, Orihel DM. Reducing Phosphorus to Curb Lake Eutrophication is a Success. Environ Sci Technol 2016;50:8923–9. doi:10.1021/acs.est.6b02204.
[8] Lürling M, Frank van Oosterhout. Controlling eutrophication by combined bloom precipitation and sediment phosphorus inactivation. Water Res 2013;47:6527–37. doi:10.1016/j.watres.2013.08.019.
[9] Welch EB. Should nitrogen be reduced to manage eutrophication if it is growth limiting? Evidence from Moses Lake. Lake Reserv Manag 2009;25:401–9. doi:10.1080/07438140903323757.
[10] Canadian Council of Ministers of the Environment. Canadian water quality guidelines for the protection of aquatic life: Phosphorus: Canadian Guidance Framework for the Management of Freshwater Systems (ver. 2004). Can Environ Qual Guidel 2014:1–5.
[11] Correll DL. The Role of Phosphorus in the Eutrophication of Receiving Waters: A Review. J Environ Qual 1998;27:261. doi:10.2134/jeq1998.00472425002700020004x.
[12] The University of Liverpool. Zeolite - Clinoptilolite 2018.
69
http://www.chemtube3d.com/solidstate/SS-Z-Clinoptilolite.htm (accessed January 8, 2019).
[13] Kitsopoulos KP. Cation-Exchange Capacity (CEC) of Zeolitic Volcaniclastic Materials: Applicability of the Ammonium Acetate Saturation (AMAS) Method. Clays Clay Miner 1999;47:688–96. doi:10.1346/CCMN.1999.0470602.
[14] Nakhli SAA, Delkash M, Bakhshayesh BE, Kazemian H. Application of Zeolites for Sustainable Agriculture: a Review on Water and Nutrient Retention. vol. 228. Water, Air, & Soil Pollution; 2017. doi:10.1007/s11270-017-3649-1.
[15] Delkash M, Ebrazi Bakhshayesh B, Kazemian H. Using zeolitic adsorbents to cleanup special wastewater streams: A review. Microporous Mesoporous Mater 2015. doi:10.1016/j.micromeso.2015.04.039.
[16] Faghihian H, Kazemian H, Ghannadi Maragheh M. Iranian clinoptilolite-rich tuffs for radionuclide removal from water. J Radioanal Nucl Chem 1999;242:491–5. doi:10.1007/BF02345582.
[17] Kazemian H, Modarres H, Ghasemi Mobtaker H. Iranian natural clinoptilolite and its synthetic zeolite P for removal of cerium and thorium from nuclear wastewaters. J Radioanal Nucl Chem 2003;258:551–6. doi:10.1023/B:JRNC.0000011751.35443.b3.
[18] Kazemian H, Hosseini M. Evaluation of Some Natural Zeolites and Their Relevant Synthetic Types as Sorbents for Removal of Arsenic from Drinking Water. Iran J Publ Heal 2004;33:36–44.
[19] Menhaje-Bena R, Kazemian H, Shahtaheri SJ, Ghazi-Khansari M. Removal of arsenic species from water by Iranian natural and synthetic zeolites. Sep. Ion. Solutes, 10th Int. Conf. SIS’03, Podbanské, High Tatras, Slovakia: 2003, p. 49–51.
[20] Torabian A, Kazemian H, Seifi L, Bidhendi GN, Azimi AA, Ghadiri SK. Removal of petroleum aromatic hydrocarbons by surfactant-modified natural zeolite: The effect of surfactant. Clean - Soil, Air, Water 2010. doi:10.1002/clen.200900157.
[21] Seifi L, Torabian A, Kazemian H, Bidhendi GN, Azimi AA, Farhadi F, et al. Kinetic study of BTEX removal using granulated surfactant-modified natural zeolites nanoparticles. Water Air Soil Pollut 2011. doi:10.1007/s11270-010-0719-z.
[22] Yang M, Lin J, Zhan Y, Zhang H. Adsorption of phosphate from water on lake sediments amended with zirconium-modified zeolites in batch mode. Ecol Eng
70
2014;71:223–33. doi:10.1016/j.ecoleng.2014.07.035.
[23] Schick J, Caullet P, Paillaud J-L, Patarin J, Freitag S, Mangold-Callarec C. Phosphate uptake from water on a Surfactant-Modified Zeolite and Ca-zeolites. J Porous Mater 2012;19:405–14. doi:10.1007/s10934-011-9488-3.
[24] He Y, Lin H, Dong Y, Liu Q, Wang L. Simultaneous removal of ammonium and phosphate by alkaline-activated and lanthanum-impregnated zeolite. Chemosphere 2016;164:387–95. doi:10.1016/J.CHEMOSPHERE.2016.08.110.
[25] Karapınar N. Application of natural zeolite for phosphorus and ammonium removal from aqueous solutions. J Hazard Mater 2009;170:1186–91. doi:10.1016/j.jhazmat.2009.05.094.
[26] Le Corre KS, Valsami-Jones E, Hobbs P, Parsons SA. Phosphorus recovery from wastewater by struvite crystallization: A review. Crit Rev Environ Sci Technol 2009;39:433–77. doi:10.1017/CBO9781107415324.004.
[27] Peng L, Dai H, Wu Y, Peng Y, Lu X. A comprehensive review of phosphorus recovery from wastewater by crystallization processes. Chemosphere 2018;197:768–81. doi:10.1016/J.CHEMOSPHERE.2018.01.098.
[28] Choi H-J, Yu S-W, Han Kim K. Efficient use of Mg-modified zeolite in the treatment of aqueous solution contaminated with heavy metal toxic ions. J Taiwan Inst Chem Eng 2016;63:82–4. doi:10.1016/j.jtice.2016.03.005.
[29] Barbosa SG, Peixoto L, Meulman B, Alves MM, Pereira MA. A design of experiments to assess phosphorous removal and crystal properties in struvite precipitation of source separated urine using different Mg sources. Chem Eng J 2016;298:146–53. doi:10.1016/j.cej.2016.03.148.
[30] You X, Valderrama C, Cortina JL. Simultaneous recovery of ammonium and phosphate from simulated treated wastewater effluents by activated calcium and magnesium zeolites. J Chem Technol Biotechnol 2017;92:2400–9. doi:10.1002/jctb.5249.
[31] Tansel B, Lunn G, Monje O. Struvite formation and decomposition characteristics for ammonia and phosphorus recovery: A review of magnesium-ammonia-phosphate interactions. Chemosphere 2018;194:504–14. doi:10.1016/j.chemosphere.2017.12.004.
[32] Huang H, Xiao D, Pang R, Han C, Ding L. Simultaneous removal of nutrients from
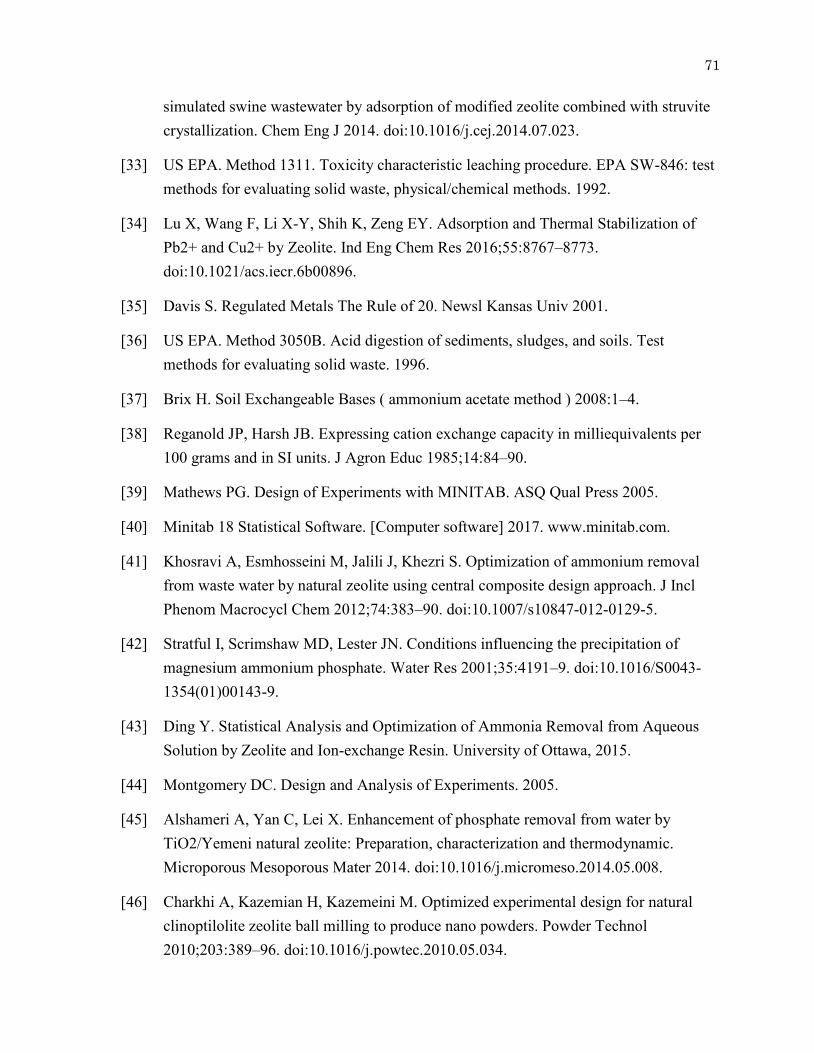
71
simulated swine wastewater by adsorption of modified zeolite combined with struvite crystallization. Chem Eng J 2014. doi:10.1016/j.cej.2014.07.023.
[33] US EPA. Method 1311. Toxicity characteristic leaching procedure. EPA SW-846: test methods for evaluating solid waste, physical/chemical methods. 1992.
[34] Lu X, Wang F, Li X-Y, Shih K, Zeng EY. Adsorption and Thermal Stabilization of Pb2+ and Cu2+ by Zeolite. Ind Eng Chem Res 2016;55:8767–8773. doi:10.1021/acs.iecr.6b00896.
[35] Davis S. Regulated Metals The Rule of 20. Newsl Kansas Univ 2001.
[36] US EPA. Method 3050B. Acid digestion of sediments, sludges, and soils. Test methods for evaluating solid waste. 1996.
[37] Brix H. Soil Exchangeable Bases ( ammonium acetate method ) 2008:1–4.
[38] Reganold JP, Harsh JB. Expressing cation exchange capacity in milliequivalents per 100 grams and in SI units. J Agron Educ 1985;14:84–90.
[39] Mathews PG. Design of Experiments with MINITAB. ASQ Qual Press 2005.
[40] Minitab 18 Statistical Software. [Computer software] 2017. www.minitab.com.
[41] Khosravi A, Esmhosseini M, Jalili J, Khezri S. Optimization of ammonium removal from waste water by natural zeolite using central composite design approach. J Incl Phenom Macrocycl Chem 2012;74:383–90. doi:10.1007/s10847-012-0129-5.
[42] Stratful I, Scrimshaw MD, Lester JN. Conditions influencing the precipitation of magnesium ammonium phosphate. Water Res 2001;35:4191–9. doi:10.1016/S0043-1354(01)00143-9.
[43] Ding Y. Statistical Analysis and Optimization of Ammonia Removal from Aqueous Solution by Zeolite and Ion-exchange Resin. University of Ottawa, 2015.
[44] Montgomery DC. Design and Analysis of Experiments. 2005.
[45] Alshameri A, Yan C, Lei X. Enhancement of phosphate removal from water by TiO2/Yemeni natural zeolite: Preparation, characterization and thermodynamic. Microporous Mesoporous Mater 2014. doi:10.1016/j.micromeso.2014.05.008.
[46] Charkhi A, Kazemian H, Kazemeini M. Optimized experimental design for natural clinoptilolite zeolite ball milling to produce nano powders. Powder Technol 2010;203:389–96. doi:10.1016/j.powtec.2010.05.034.
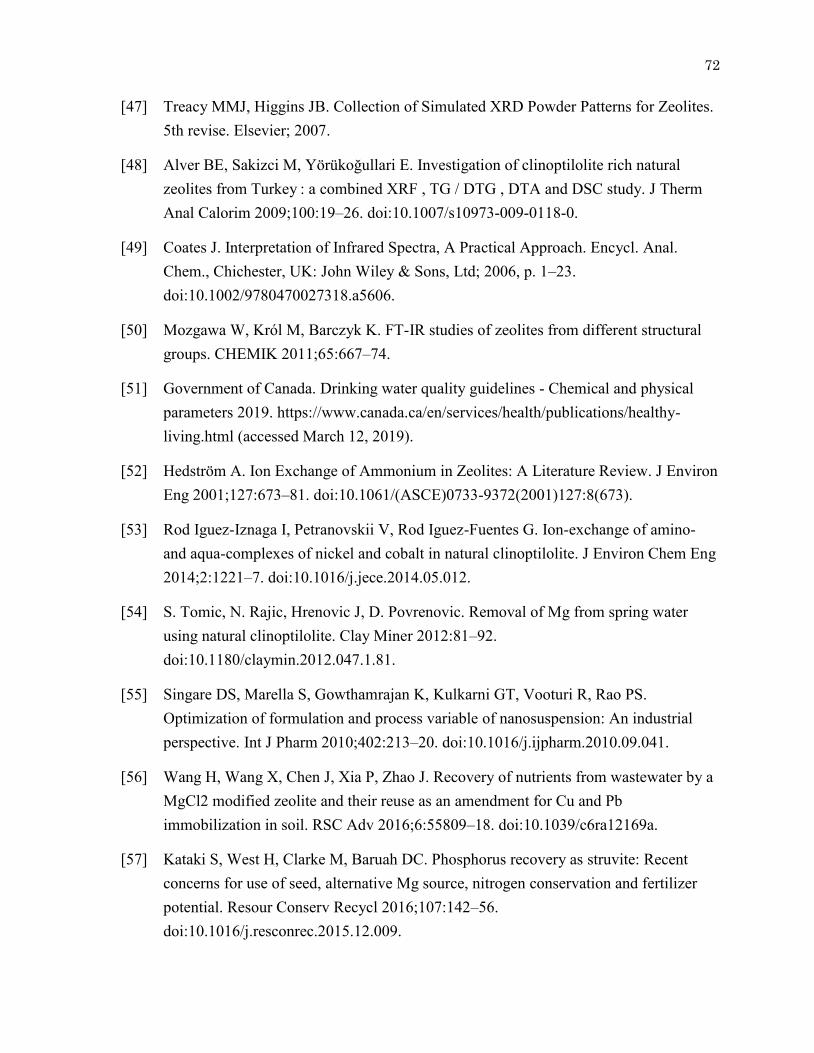
72
[47] Treacy MMJ, Higgins JB. Collection of Simulated XRD Powder Patterns for Zeolites. 5th revise. Elsevier; 2007.
[48] Alver BE, Sakizci M, Yörükoğullari E. Investigation of clinoptilolite rich natural zeolites from Turkey : a combined XRF , TG / DTG , DTA and DSC study. J Therm Anal Calorim 2009;100:19–26. doi:10.1007/s10973-009-0118-0.
[49] Coates J. Interpretation of Infrared Spectra, A Practical Approach. Encycl. Anal. Chem., Chichester, UK: John Wiley & Sons, Ltd; 2006, p. 1–23. doi:10.1002/9780470027318.a5606.
[50] Mozgawa W, Król M, Barczyk K. FT-IR studies of zeolites from different structural groups. CHEMIK 2011;65:667–74.
[51] Government of Canada. Drinking water quality guidelines - Chemical and physical parameters 2019. https://www.canada.ca/en/services/health/publications/healthy-living.html (accessed March 12, 2019).
[52] Hedström A. Ion Exchange of Ammonium in Zeolites: A Literature Review. J Environ Eng 2001;127:673–81. doi:10.1061/(ASCE)0733-9372(2001)127:8(673).
[53] Rod Iguez-Iznaga I, Petranovskii V, Rod Iguez-Fuentes G. Ion-exchange of amino- and aqua-complexes of nickel and cobalt in natural clinoptilolite. J Environ Chem Eng 2014;2:1221–7. doi:10.1016/j.jece.2014.05.012.
[54] S. Tomic, N. Rajic, Hrenovic J, D. Povrenovic. Removal of Mg from spring water using natural clinoptilolite. Clay Miner 2012:81–92. doi:10.1180/claymin.2012.047.1.81.
[55] Singare DS, Marella S, Gowthamrajan K, Kulkarni GT, Vooturi R, Rao PS. Optimization of formulation and process variable of nanosuspension: An industrial perspective. Int J Pharm 2010;402:213–20. doi:10.1016/j.ijpharm.2010.09.041.
[56] Wang H, Wang X, Chen J, Xia P, Zhao J. Recovery of nutrients from wastewater by a MgCl2 modified zeolite and their reuse as an amendment for Cu and Pb immobilization in soil. RSC Adv 2016;6:55809–18. doi:10.1039/c6ra12169a.
[57] Kataki S, West H, Clarke M, Baruah DC. Phosphorus recovery as struvite: Recent concerns for use of seed, alternative Mg source, nitrogen conservation and fertilizer potential. Resour Conserv Recycl 2016;107:142–56. doi:10.1016/j.resconrec.2015.12.009.
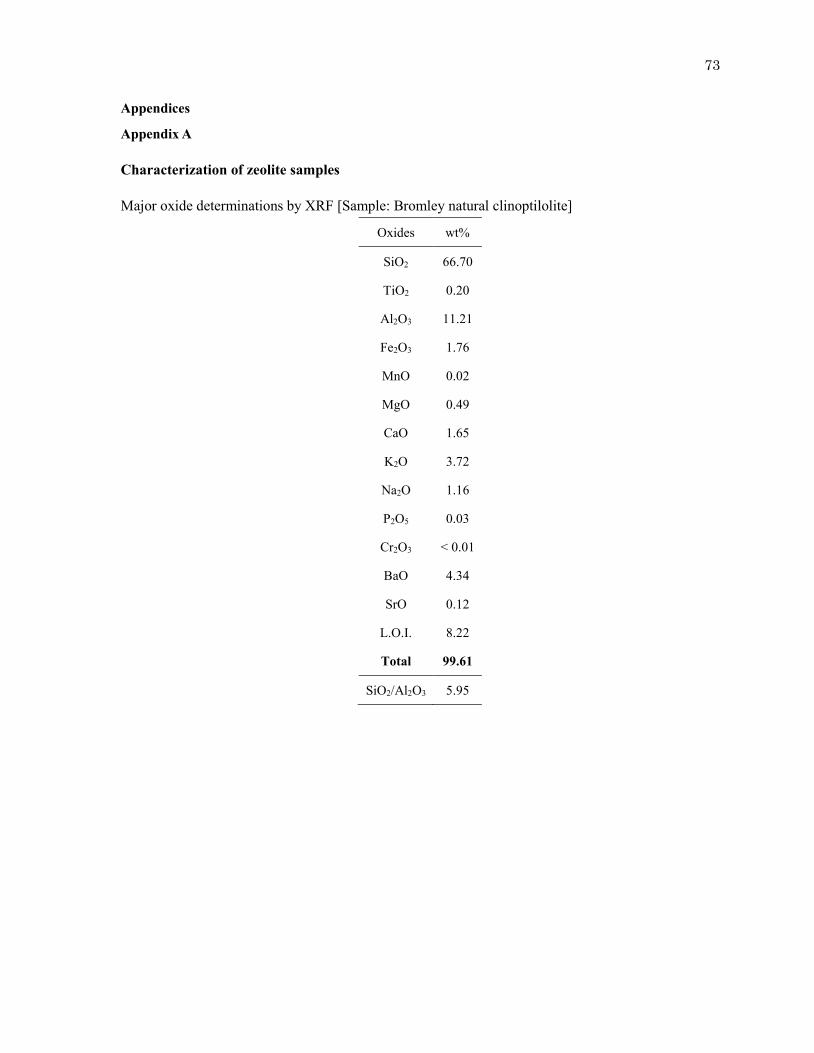
73
Appendices
Appendix A
Characterization of zeolite samples
Major oxide determinations by XRF [Sample: Bromley natural clinoptilolite]
Oxides wt%
SiO2 66.70
TiO2 0.20
Al2O3 11.21
Fe2O3 1.76
MnO 0.02
MgO 0.49
CaO 1.65
K2O 3.72
Na2O 1.16
P2O5 0.03
Cr2O3 < 0.01
BaO 4.34
SrO 0.12
L.O.I. 8.22
Total 99.61
SiO2/Al2O3 5.95
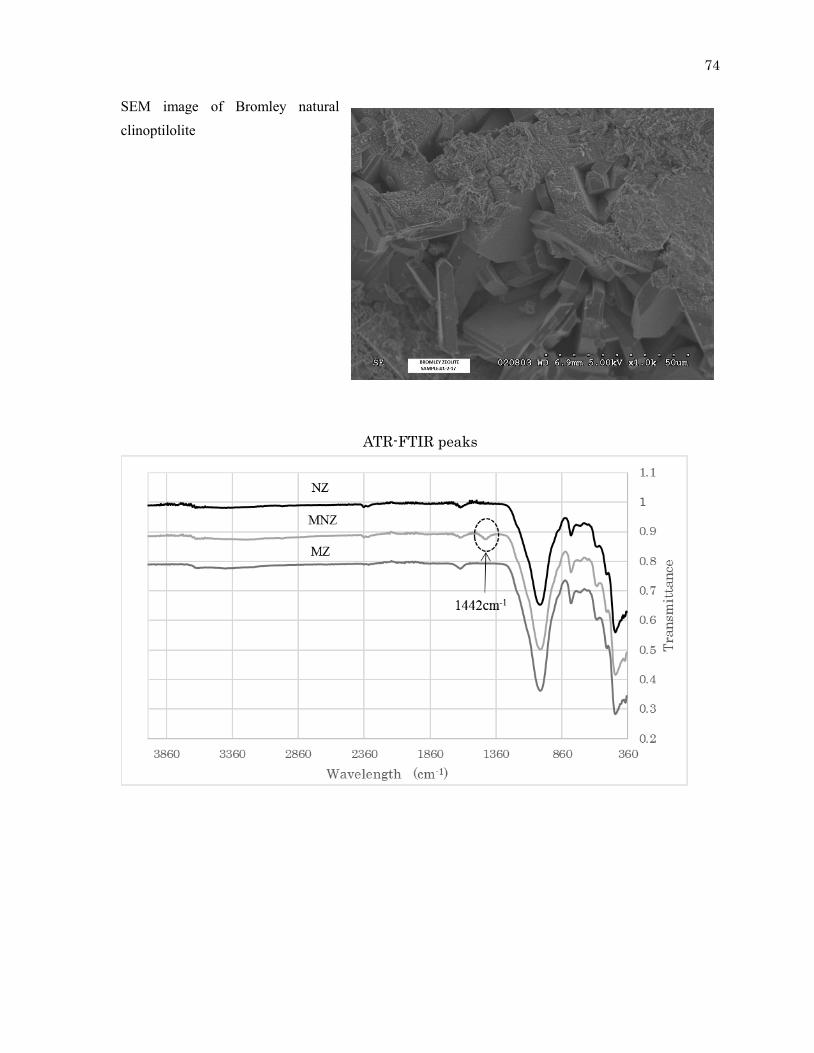
74
SEM image of Bromley natural clinoptilolite
ATR-FTIR peaks
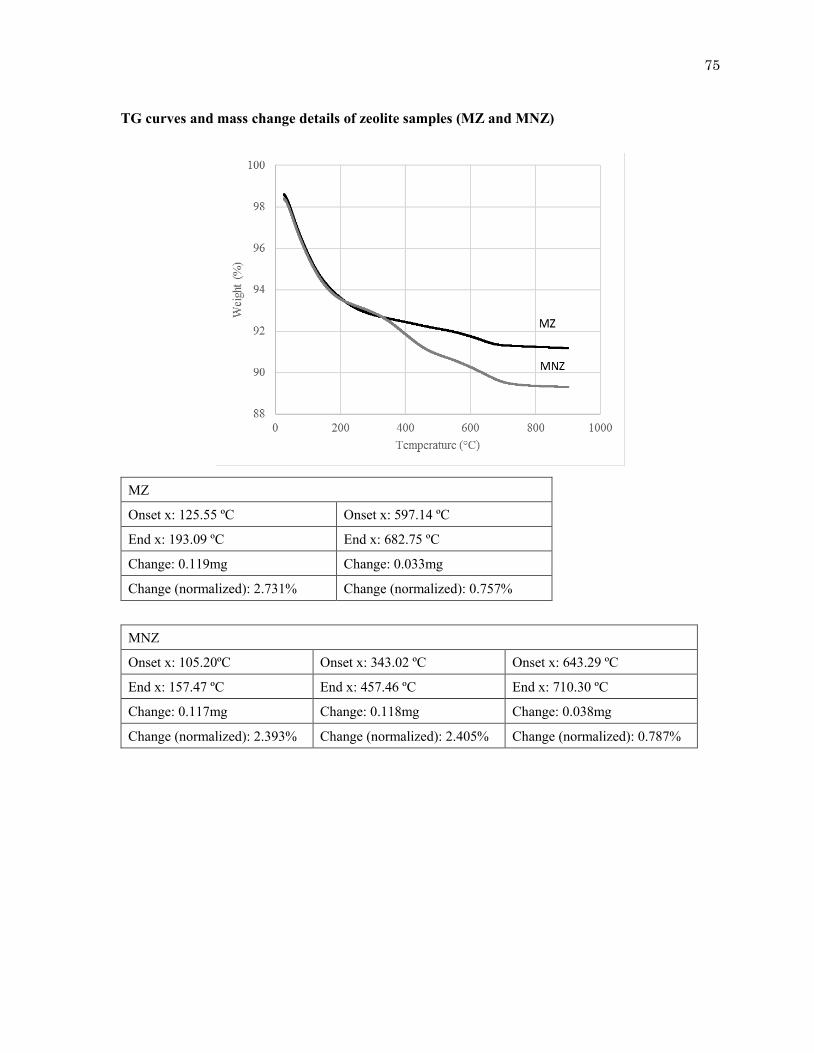
75
TG curves and mass change details of zeolite samples (MZ and MNZ)
MZ
Onset x: 125.55 ºC Onset x: 597.14 ºC
End x: 193.09 ºC End x: 682.75 ºC
Change: 0.119mg Change: 0.033mg
Change (normalized): 2.731% Change (normalized): 0.757%
MNZ
Onset x: 105.20ºC Onset x: 343.02 ºC Onset x: 643.29 ºC
End x: 157.47 ºC End x: 457.46 ºC End x: 710.30 ºC
Change: 0.117mg Change: 0.118mg Change: 0.038mg
Change (normalized): 2.393% Change (normalized): 2.405% Change (normalized): 0.787%
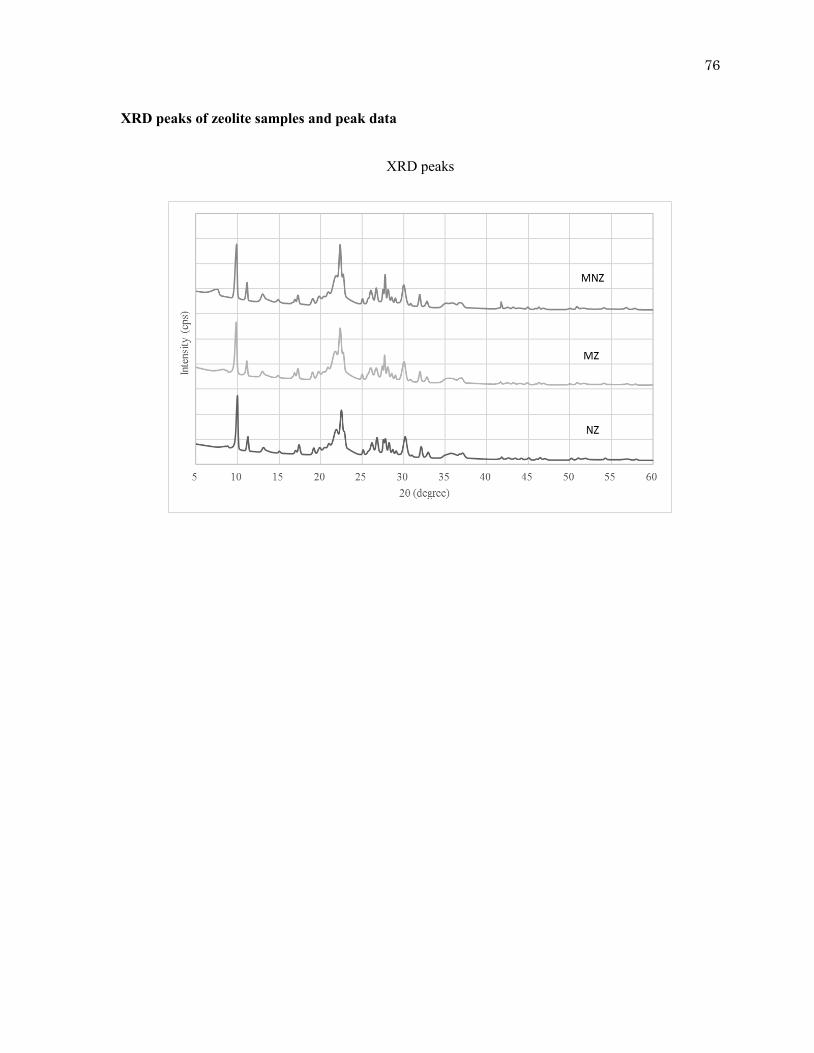
76
XRD peaks of zeolite samples and peak data
XRD peaks
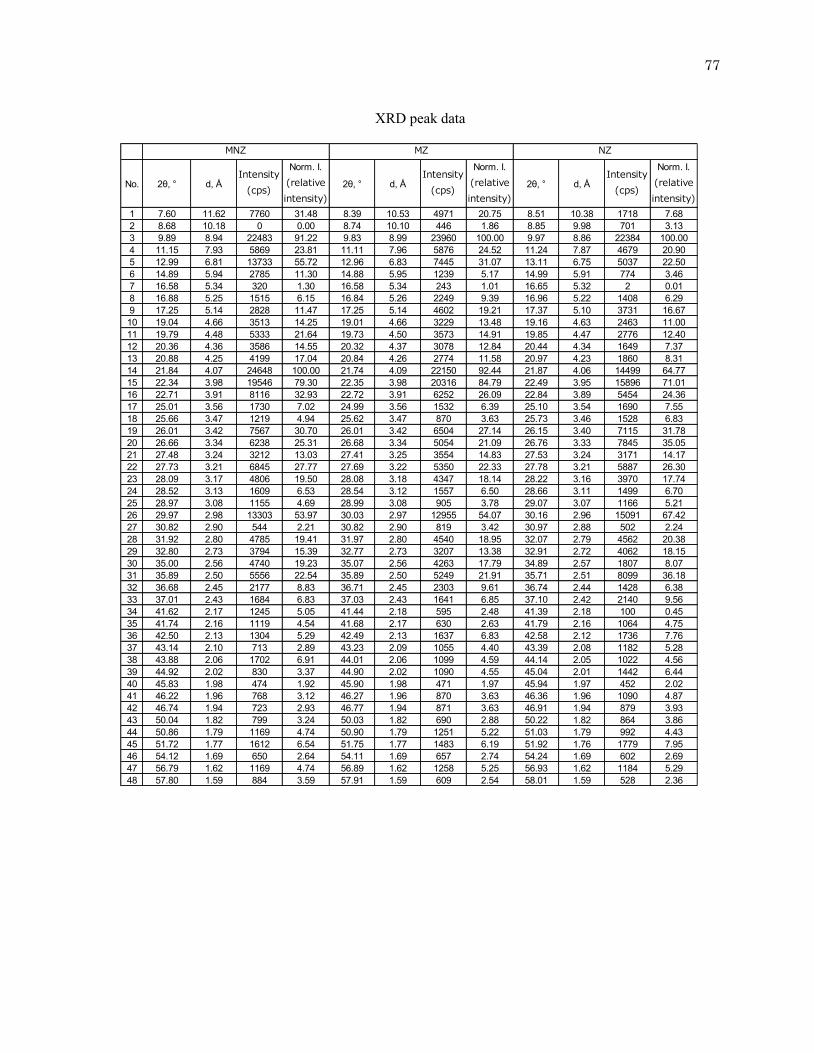
77
XRD peak data
No. 2θ, ° d, ÅIntensity
(cps)
Norm. I.
(relative
intensity)
2θ, ° d, ÅIntensity
(cps)
Norm. I.
(relative
intensity)
2θ, ° d, ÅIntensity
(cps)
Norm. I.
(relative
intensity)
1 7.60 11.62 7760 31.48 8.39 10.53 4971 20.75 8.51 10.38 1718 7.682 8.68 10.18 0 0.00 8.74 10.10 446 1.86 8.85 9.98 701 3.133 9.89 8.94 22483 91.22 9.83 8.99 23960 100.00 9.97 8.86 22384 100.004 11.15 7.93 5869 23.81 11.11 7.96 5876 24.52 11.24 7.87 4679 20.905 12.99 6.81 13733 55.72 12.96 6.83 7445 31.07 13.11 6.75 5037 22.506 14.89 5.94 2785 11.30 14.88 5.95 1239 5.17 14.99 5.91 774 3.467 16.58 5.34 320 1.30 16.58 5.34 243 1.01 16.65 5.32 2 0.018 16.88 5.25 1515 6.15 16.84 5.26 2249 9.39 16.96 5.22 1408 6.299 17.25 5.14 2828 11.47 17.25 5.14 4602 19.21 17.37 5.10 3731 16.6710 19.04 4.66 3513 14.25 19.01 4.66 3229 13.48 19.16 4.63 2463 11.0011 19.79 4.48 5333 21.64 19.73 4.50 3573 14.91 19.85 4.47 2776 12.4012 20.36 4.36 3586 14.55 20.32 4.37 3078 12.84 20.44 4.34 1649 7.3713 20.88 4.25 4199 17.04 20.84 4.26 2774 11.58 20.97 4.23 1860 8.3114 21.84 4.07 24648 100.00 21.74 4.09 22150 92.44 21.87 4.06 14499 64.7715 22.34 3.98 19546 79.30 22.35 3.98 20316 84.79 22.49 3.95 15896 71.0116 22.71 3.91 8116 32.93 22.72 3.91 6252 26.09 22.84 3.89 5454 24.3617 25.01 3.56 1730 7.02 24.99 3.56 1532 6.39 25.10 3.54 1690 7.5518 25.66 3.47 1219 4.94 25.62 3.47 870 3.63 25.73 3.46 1528 6.8319 26.01 3.42 7567 30.70 26.01 3.42 6504 27.14 26.15 3.40 7115 31.7820 26.66 3.34 6238 25.31 26.68 3.34 5054 21.09 26.76 3.33 7845 35.0521 27.48 3.24 3212 13.03 27.41 3.25 3554 14.83 27.53 3.24 3171 14.1722 27.73 3.21 6845 27.77 27.69 3.22 5350 22.33 27.78 3.21 5887 26.3023 28.09 3.17 4806 19.50 28.08 3.18 4347 18.14 28.22 3.16 3970 17.7424 28.52 3.13 1609 6.53 28.54 3.12 1557 6.50 28.66 3.11 1499 6.7025 28.97 3.08 1155 4.69 28.99 3.08 905 3.78 29.07 3.07 1166 5.2126 29.97 2.98 13303 53.97 30.03 2.97 12955 54.07 30.16 2.96 15091 67.4227 30.82 2.90 544 2.21 30.82 2.90 819 3.42 30.97 2.88 502 2.2428 31.92 2.80 4785 19.41 31.97 2.80 4540 18.95 32.07 2.79 4562 20.3829 32.80 2.73 3794 15.39 32.77 2.73 3207 13.38 32.91 2.72 4062 18.1530 35.00 2.56 4740 19.23 35.07 2.56 4263 17.79 34.89 2.57 1807 8.0731 35.89 2.50 5556 22.54 35.89 2.50 5249 21.91 35.71 2.51 8099 36.1832 36.68 2.45 2177 8.83 36.71 2.45 2303 9.61 36.74 2.44 1428 6.3833 37.01 2.43 1684 6.83 37.03 2.43 1641 6.85 37.10 2.42 2140 9.5634 41.62 2.17 1245 5.05 41.44 2.18 595 2.48 41.39 2.18 100 0.4535 41.74 2.16 1119 4.54 41.68 2.17 630 2.63 41.79 2.16 1064 4.7536 42.50 2.13 1304 5.29 42.49 2.13 1637 6.83 42.58 2.12 1736 7.7637 43.14 2.10 713 2.89 43.23 2.09 1055 4.40 43.39 2.08 1182 5.2838 43.88 2.06 1702 6.91 44.01 2.06 1099 4.59 44.14 2.05 1022 4.5639 44.92 2.02 830 3.37 44.90 2.02 1090 4.55 45.04 2.01 1442 6.4440 45.83 1.98 474 1.92 45.90 1.98 471 1.97 45.94 1.97 452 2.0241 46.22 1.96 768 3.12 46.27 1.96 870 3.63 46.36 1.96 1090 4.8742 46.74 1.94 723 2.93 46.77 1.94 871 3.63 46.91 1.94 879 3.9343 50.04 1.82 799 3.24 50.03 1.82 690 2.88 50.22 1.82 864 3.8644 50.86 1.79 1169 4.74 50.90 1.79 1251 5.22 51.03 1.79 992 4.4345 51.72 1.77 1612 6.54 51.75 1.77 1483 6.19 51.92 1.76 1779 7.9546 54.12 1.69 650 2.64 54.11 1.69 657 2.74 54.24 1.69 602 2.6947 56.79 1.62 1169 4.74 56.89 1.62 1258 5.25 56.93 1.62 1184 5.2948 57.80 1.59 884 3.59 57.91 1.59 609 2.54 58.01 1.59 528 2.36
MNZ MZ NZ
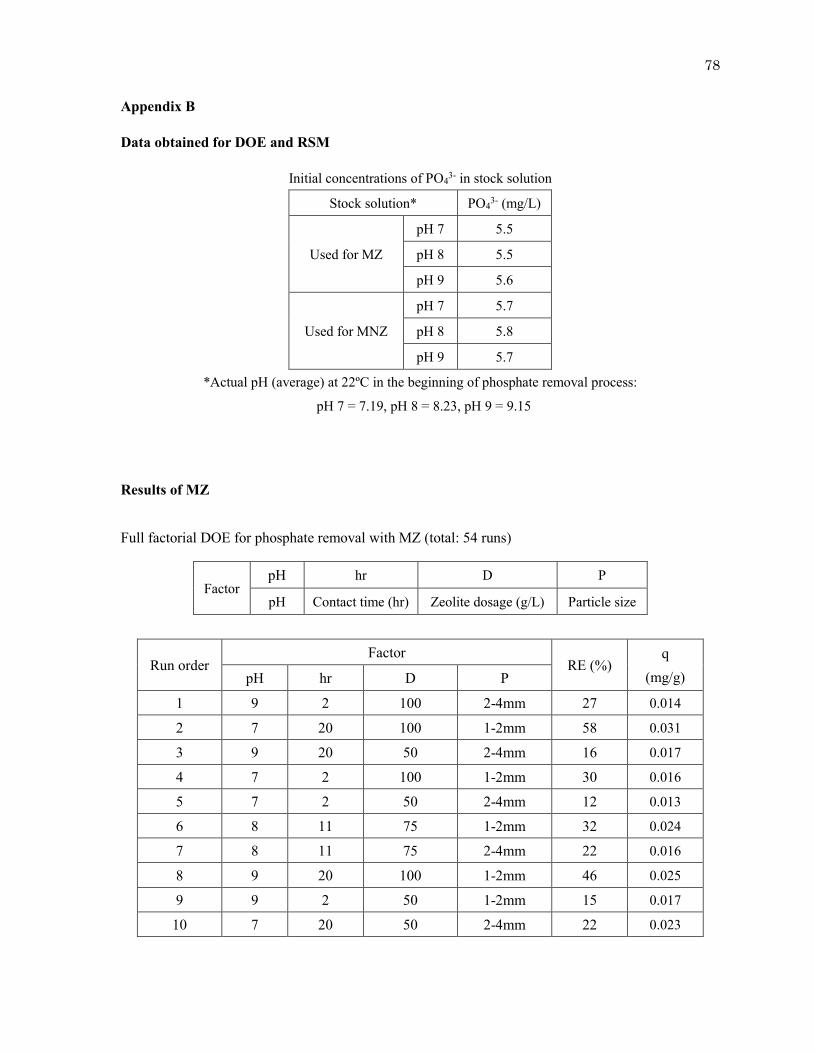
78
Appendix B
Data obtained for DOE and RSM
Initial concentrations of PO43- in stock solution
Stock solution* PO43- (mg/L)
Used for MZ
pH 7 5.5
pH 8 5.5
pH 9 5.6
Used for MNZ
pH 7 5.7
pH 8 5.8
pH 9 5.7
*Actual pH (average) at 22ºC in the beginning of phosphate removal process:
pH 7 = 7.19, pH 8 = 8.23, pH 9 = 9.15
Results of MZ
Full factorial DOE for phosphate removal with MZ (total: 54 runs)
Factor pH hr D P
pH Contact time (hr) Zeolite dosage (g/L) Particle size
Run order Factor
RE (%) q
(mg/g) pH hr D P
1 9 2 100 2-4mm 27 0.014
2 7 20 100 1-2mm 58 0.031
3 9 20 50 2-4mm 16 0.017
4 7 2 100 1-2mm 30 0.016
5 7 2 50 2-4mm 12 0.013
6 8 11 75 1-2mm 32 0.024
7 8 11 75 2-4mm 22 0.016
8 9 20 100 1-2mm 46 0.025
9 9 2 50 1-2mm 15 0.017
10 7 20 50 2-4mm 22 0.023
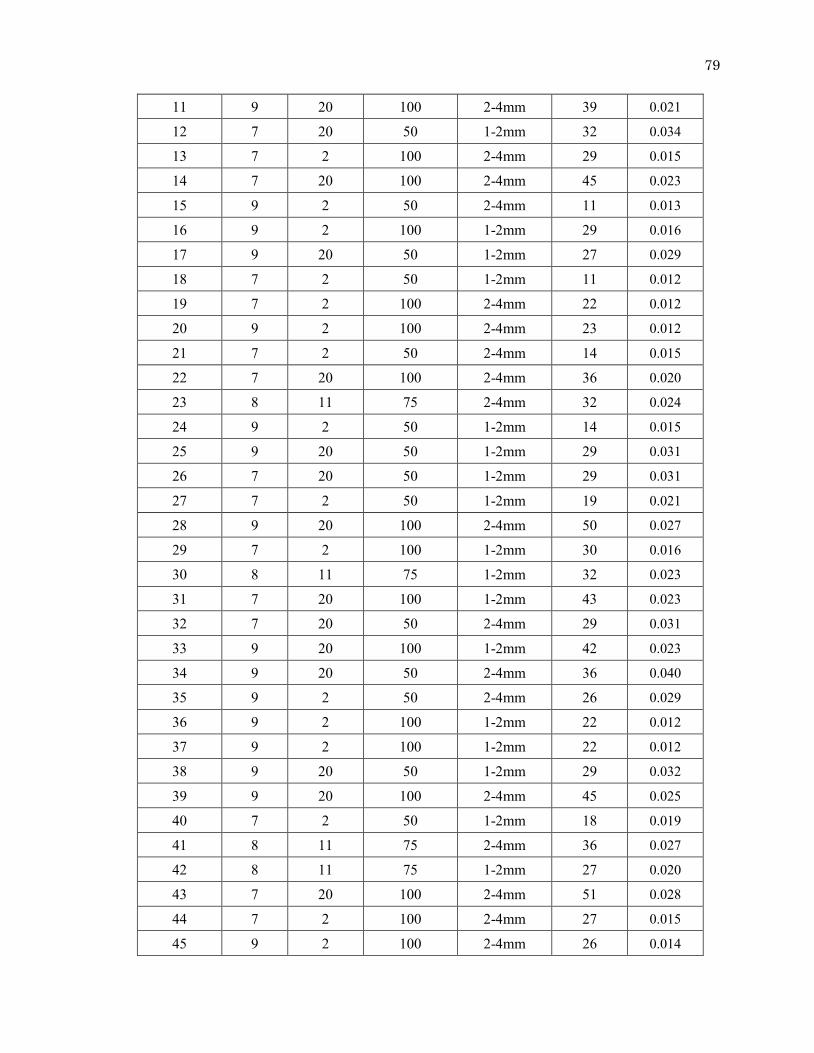
79
11 9 20 100 2-4mm 39 0.021
12 7 20 50 1-2mm 32 0.034
13 7 2 100 2-4mm 29 0.015
14 7 20 100 2-4mm 45 0.023
15 9 2 50 2-4mm 11 0.013
16 9 2 100 1-2mm 29 0.016
17 9 20 50 1-2mm 27 0.029
18 7 2 50 1-2mm 11 0.012
19 7 2 100 2-4mm 22 0.012
20 9 2 100 2-4mm 23 0.012
21 7 2 50 2-4mm 14 0.015
22 7 20 100 2-4mm 36 0.020
23 8 11 75 2-4mm 32 0.024
24 9 2 50 1-2mm 14 0.015
25 9 20 50 1-2mm 29 0.031
26 7 20 50 1-2mm 29 0.031
27 7 2 50 1-2mm 19 0.021
28 9 20 100 2-4mm 50 0.027
29 7 2 100 1-2mm 30 0.016
30 8 11 75 1-2mm 32 0.023
31 7 20 100 1-2mm 43 0.023
32 7 20 50 2-4mm 29 0.031
33 9 20 100 1-2mm 42 0.023
34 9 20 50 2-4mm 36 0.040
35 9 2 50 2-4mm 26 0.029
36 9 2 100 1-2mm 22 0.012
37 9 2 100 1-2mm 22 0.012
38 9 20 50 1-2mm 29 0.032
39 9 20 100 2-4mm 45 0.025
40 7 2 50 1-2mm 18 0.019
41 8 11 75 2-4mm 36 0.027
42 8 11 75 1-2mm 27 0.020
43 7 20 100 2-4mm 51 0.028
44 7 2 100 2-4mm 27 0.015
45 9 2 100 2-4mm 26 0.014
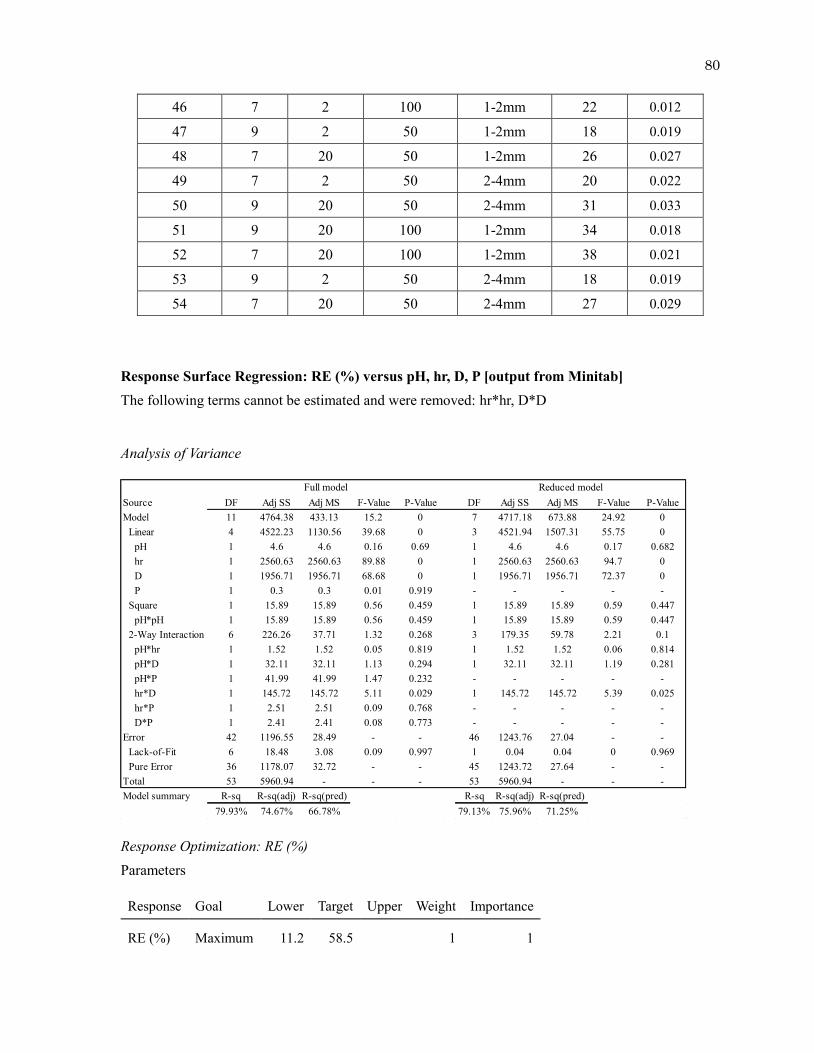
80
46 7 2 100 1-2mm 22 0.012
47 9 2 50 1-2mm 18 0.019
48 7 20 50 1-2mm 26 0.027
49 7 2 50 2-4mm 20 0.022
50 9 20 50 2-4mm 31 0.033
51 9 20 100 1-2mm 34 0.018
52 7 20 100 1-2mm 38 0.021
53 9 2 50 2-4mm 18 0.019
54 7 20 50 2-4mm 27 0.029
Response Surface Regression: RE (%) versus pH, hr, D, P [output from Minitab] The following terms cannot be estimated and were removed: hr*hr, D*D
Analysis of Variance
Response Optimization: RE (%) Parameters
Response Goal Lower Target Upper Weight Importance
RE (%) Maximum 11.2 58.5 1 1
Source DF Adj SS Adj MS F-Value P-Value DF Adj SS Adj MS F-Value P-ValueModel 11 4764.38 433.13 15.2 0 7 4717.18 673.88 24.92 0 Linear 4 4522.23 1130.56 39.68 0 3 4521.94 1507.31 55.75 0 pH 1 4.6 4.6 0.16 0.69 1 4.6 4.6 0.17 0.682 hr 1 2560.63 2560.63 89.88 0 1 2560.63 2560.63 94.7 0 D 1 1956.71 1956.71 68.68 0 1 1956.71 1956.71 72.37 0 P 1 0.3 0.3 0.01 0.919 - - - - - Square 1 15.89 15.89 0.56 0.459 1 15.89 15.89 0.59 0.447 pH*pH 1 15.89 15.89 0.56 0.459 1 15.89 15.89 0.59 0.447 2-Way Interaction 6 226.26 37.71 1.32 0.268 3 179.35 59.78 2.21 0.1 pH*hr 1 1.52 1.52 0.05 0.819 1 1.52 1.52 0.06 0.814 pH*D 1 32.11 32.11 1.13 0.294 1 32.11 32.11 1.19 0.281 pH*P 1 41.99 41.99 1.47 0.232 - - - - - hr*D 1 145.72 145.72 5.11 0.029 1 145.72 145.72 5.39 0.025 hr*P 1 2.51 2.51 0.09 0.768 - - - - - D*P 1 2.41 2.41 0.08 0.773 - - - - -Error 42 1196.55 28.49 - - 46 1243.76 27.04 - - Lack-of-Fit 6 18.48 3.08 0.09 0.997 1 0.04 0.04 0 0.969 Pure Error 36 1178.07 32.72 - - 45 1243.72 27.64 - -Total 53 5960.94 - - - 53 5960.94 - - -Model summary R-sq R-sq(adj) R-sq(pred) R-sq R-sq(adj) R-sq(pred)
79.93% 74.67% 66.78% 79.13% 75.96% 71.25%
Reduced modelFull model
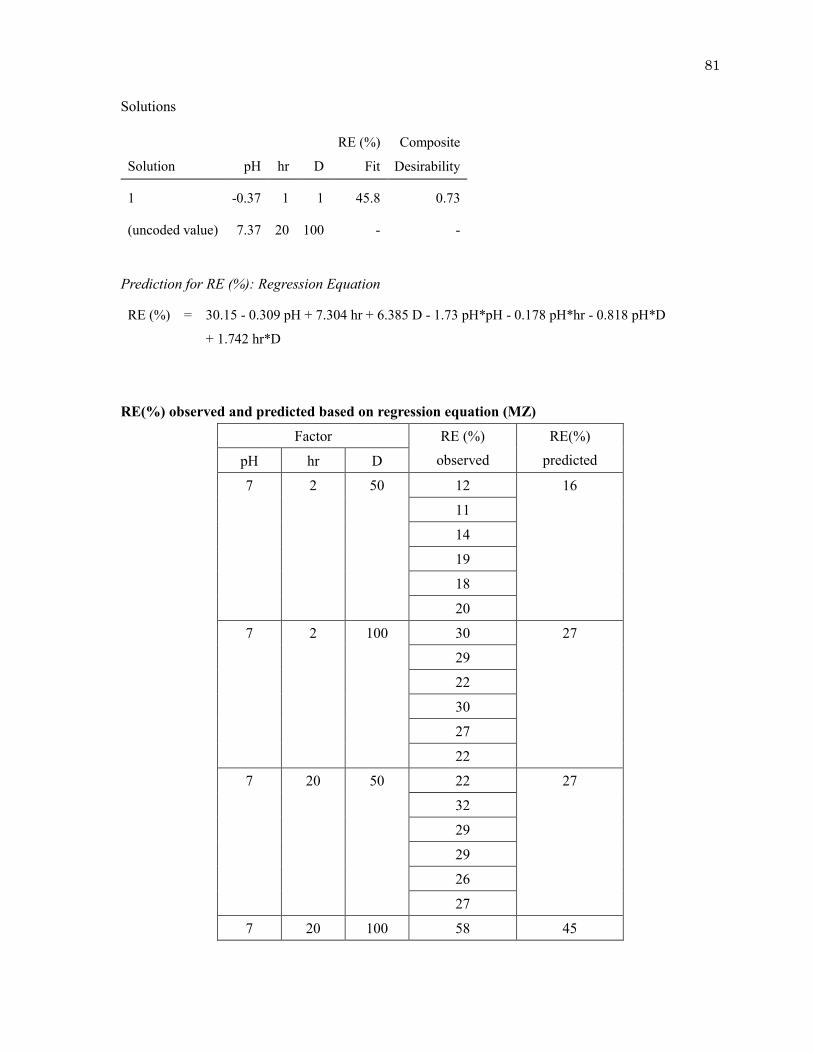
81
Solutions
Solution pH hr D
RE (%)
Fit
Composite
Desirability
1 -0.37 1 1 45.8 0.73
(uncoded value) 7.37 20 100 - -
Prediction for RE (%): Regression Equation
RE (%) = 30.15 - 0.309 pH + 7.304 hr + 6.385 D - 1.73 pH*pH - 0.178 pH*hr - 0.818 pH*D
+ 1.742 hr*D
RE(%) observed and predicted based on regression equation (MZ)
Factor RE (%) observed
RE(%) predicted pH hr D
7 2 50 12 16
11
14
19
18
20
7 2 100 30 27
29
22
30
27
22
7 20 50 22 27
32
29
29
26
27
7 20 100 58 45
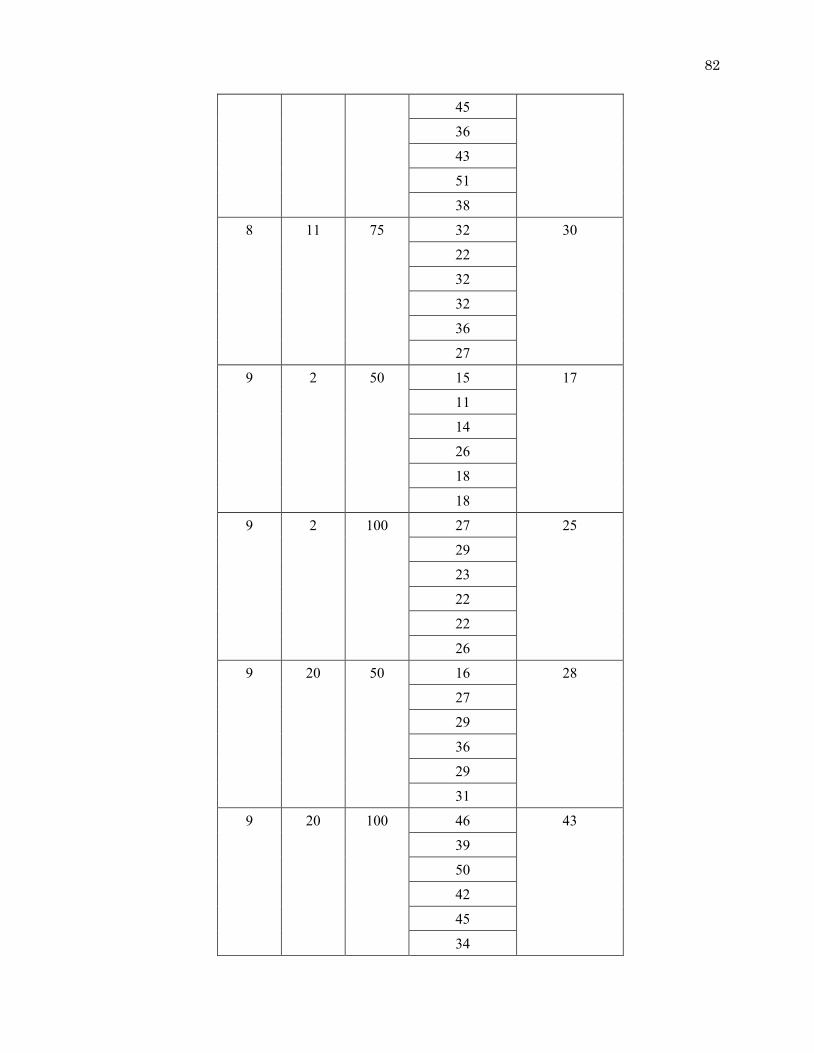
82
45
36
43
51
38
8 11 75 32 30
22
32
32
36
27
9 2 50 15 17
11
14
26
18
18
9 2 100 27 25
29
23
22
22
26
9 20 50 16 28
27
29
36
29
31
9 20 100 46 43
39
50
42
45
34
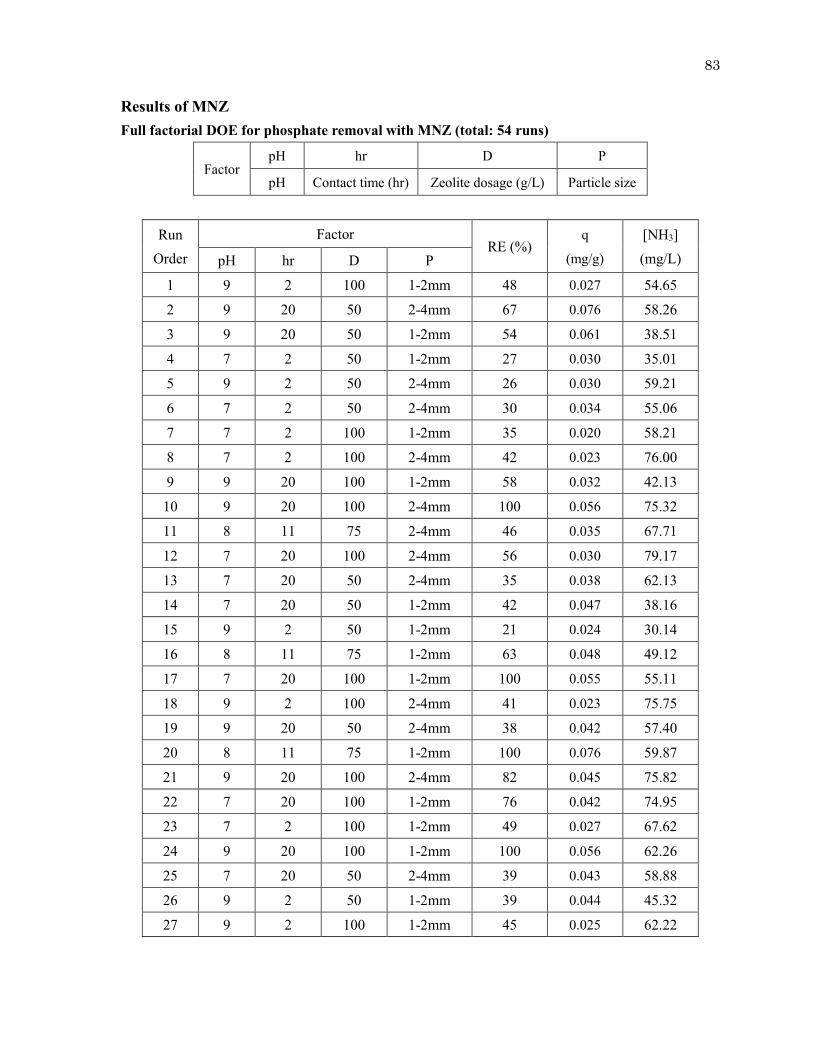
83
Results of MNZ Full factorial DOE for phosphate removal with MNZ (total: 54 runs)
Factor pH hr D P
pH Contact time (hr) Zeolite dosage (g/L) Particle size
Run Order
Factor RE (%)
q
(mg/g)
[NH3] (mg/L) pH hr D P
1 9 2 100 1-2mm 48 0.027 54.65
2 9 20 50 2-4mm 67 0.076 58.26
3 9 20 50 1-2mm 54 0.061 38.51
4 7 2 50 1-2mm 27 0.030 35.01
5 9 2 50 2-4mm 26 0.030 59.21
6 7 2 50 2-4mm 30 0.034 55.06
7 7 2 100 1-2mm 35 0.020 58.21
8 7 2 100 2-4mm 42 0.023 76.00
9 9 20 100 1-2mm 58 0.032 42.13
10 9 20 100 2-4mm 100 0.056 75.32
11 8 11 75 2-4mm 46 0.035 67.71
12 7 20 100 2-4mm 56 0.030 79.17
13 7 20 50 2-4mm 35 0.038 62.13
14 7 20 50 1-2mm 42 0.047 38.16
15 9 2 50 1-2mm 21 0.024 30.14
16 8 11 75 1-2mm 63 0.048 49.12
17 7 20 100 1-2mm 100 0.055 55.11
18 9 2 100 2-4mm 41 0.023 75.75
19 9 20 50 2-4mm 38 0.042 57.40
20 8 11 75 1-2mm 100 0.076 59.87
21 9 20 100 2-4mm 82 0.045 75.82
22 7 20 100 1-2mm 76 0.042 74.95
23 7 2 100 1-2mm 49 0.027 67.62
24 9 20 100 1-2mm 100 0.056 62.26
25 7 20 50 2-4mm 39 0.043 58.88
26 9 2 50 1-2mm 39 0.044 45.32
27 9 2 100 1-2mm 45 0.025 62.22
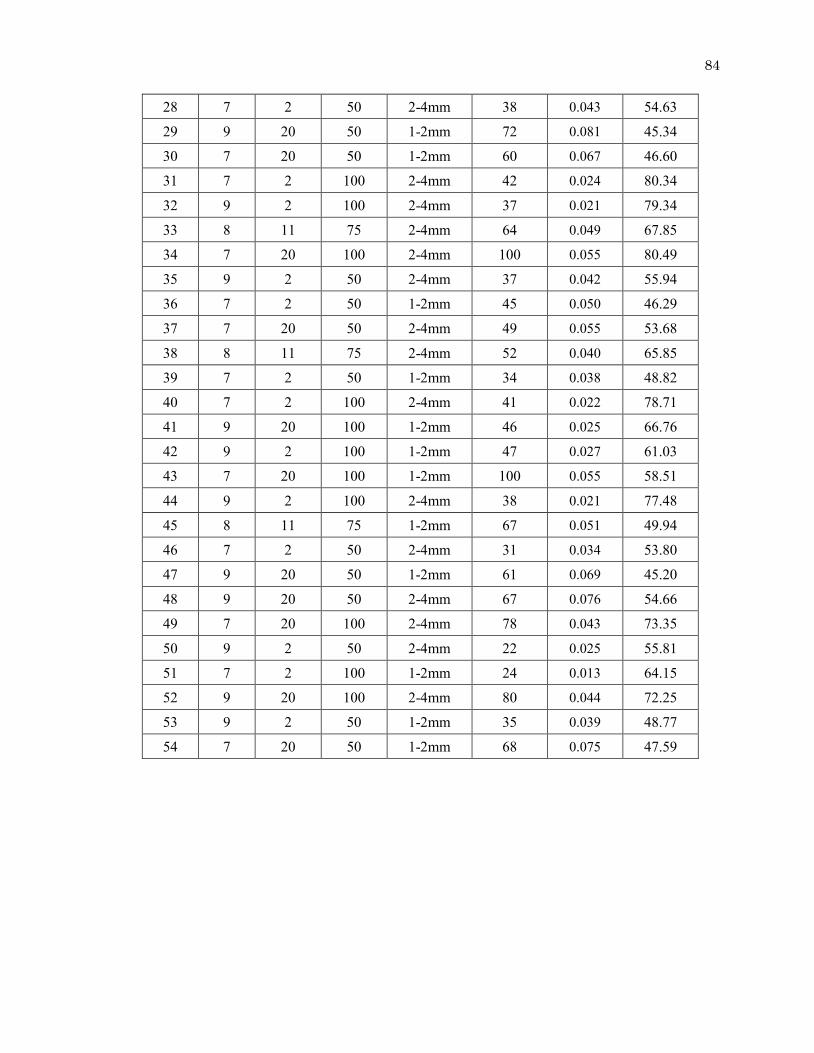
84
28 7 2 50 2-4mm 38 0.043 54.63
29 9 20 50 1-2mm 72 0.081 45.34
30 7 20 50 1-2mm 60 0.067 46.60
31 7 2 100 2-4mm 42 0.024 80.34
32 9 2 100 2-4mm 37 0.021 79.34
33 8 11 75 2-4mm 64 0.049 67.85
34 7 20 100 2-4mm 100 0.055 80.49
35 9 2 50 2-4mm 37 0.042 55.94
36 7 2 50 1-2mm 45 0.050 46.29
37 7 20 50 2-4mm 49 0.055 53.68
38 8 11 75 2-4mm 52 0.040 65.85
39 7 2 50 1-2mm 34 0.038 48.82
40 7 2 100 2-4mm 41 0.022 78.71
41 9 20 100 1-2mm 46 0.025 66.76
42 9 2 100 1-2mm 47 0.027 61.03
43 7 20 100 1-2mm 100 0.055 58.51
44 9 2 100 2-4mm 38 0.021 77.48
45 8 11 75 1-2mm 67 0.051 49.94
46 7 2 50 2-4mm 31 0.034 53.80
47 9 20 50 1-2mm 61 0.069 45.20
48 9 20 50 2-4mm 67 0.076 54.66
49 7 20 100 2-4mm 78 0.043 73.35
50 9 2 50 2-4mm 22 0.025 55.81
51 7 2 100 1-2mm 24 0.013 64.15
52 9 20 100 2-4mm 80 0.044 72.25
53 9 2 50 1-2mm 35 0.039 48.77
54 7 20 50 1-2mm 68 0.075 47.59
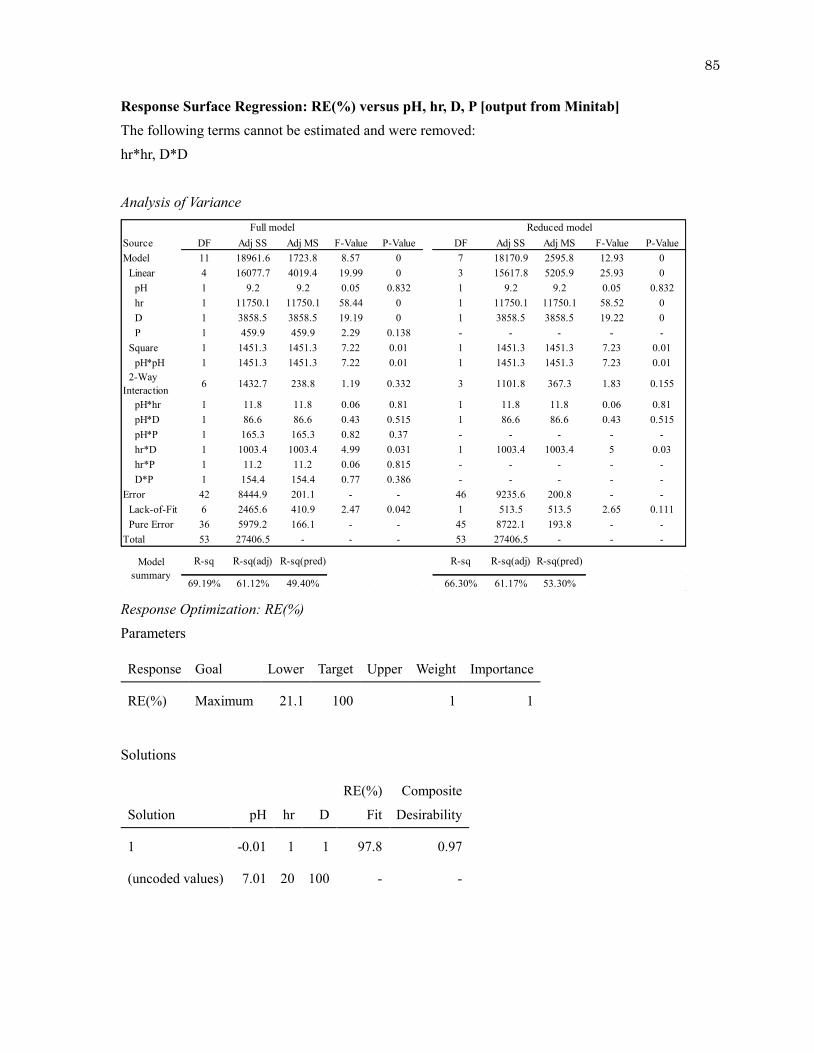
85
Response Surface Regression: RE(%) versus pH, hr, D, P [output from Minitab] The following terms cannot be estimated and were removed: hr*hr, D*D Analysis of Variance
Response Optimization: RE(%) Parameters
Response Goal Lower Target Upper Weight Importance
RE(%) Maximum 21.1 100 1 1
Solutions
Solution pH hr D
RE(%)
Fit
Composite
Desirability
1 -0.01 1 1 97.8 0.97
(uncoded values) 7.01 20 100 - -
Source DF Adj SS Adj MS F-Value P-Value DF Adj SS Adj MS F-Value P-ValueModel 11 18961.6 1723.8 8.57 0 7 18170.9 2595.8 12.93 0 Linear 4 16077.7 4019.4 19.99 0 3 15617.8 5205.9 25.93 0 pH 1 9.2 9.2 0.05 0.832 1 9.2 9.2 0.05 0.832 hr 1 11750.1 11750.1 58.44 0 1 11750.1 11750.1 58.52 0 D 1 3858.5 3858.5 19.19 0 1 3858.5 3858.5 19.22 0 P 1 459.9 459.9 2.29 0.138 - - - - - Square 1 1451.3 1451.3 7.22 0.01 1 1451.3 1451.3 7.23 0.01 pH*pH 1 1451.3 1451.3 7.22 0.01 1 1451.3 1451.3 7.23 0.01 2-Way Interaction 6 1432.7 238.8 1.19 0.332 3 1101.8 367.3 1.83 0.155
pH*hr 1 11.8 11.8 0.06 0.81 1 11.8 11.8 0.06 0.81 pH*D 1 86.6 86.6 0.43 0.515 1 86.6 86.6 0.43 0.515 pH*P 1 165.3 165.3 0.82 0.37 - - - - - hr*D 1 1003.4 1003.4 4.99 0.031 1 1003.4 1003.4 5 0.03 hr*P 1 11.2 11.2 0.06 0.815 - - - - - D*P 1 154.4 154.4 0.77 0.386 - - - - -Error 42 8444.9 201.1 - - 46 9235.6 200.8 - - Lack-of-Fit 6 2465.6 410.9 2.47 0.042 1 513.5 513.5 2.65 0.111 Pure Error 36 5979.2 166.1 - - 45 8722.1 193.8 - -Total 53 27406.5 - - - 53 27406.5 - - -
R-sq R-sq(adj) R-sq(pred) R-sq R-sq(adj) R-sq(pred)
69.19% 61.12% 49.40% 66.30% 61.17% 53.30%
Full model Reduced model
Model summary
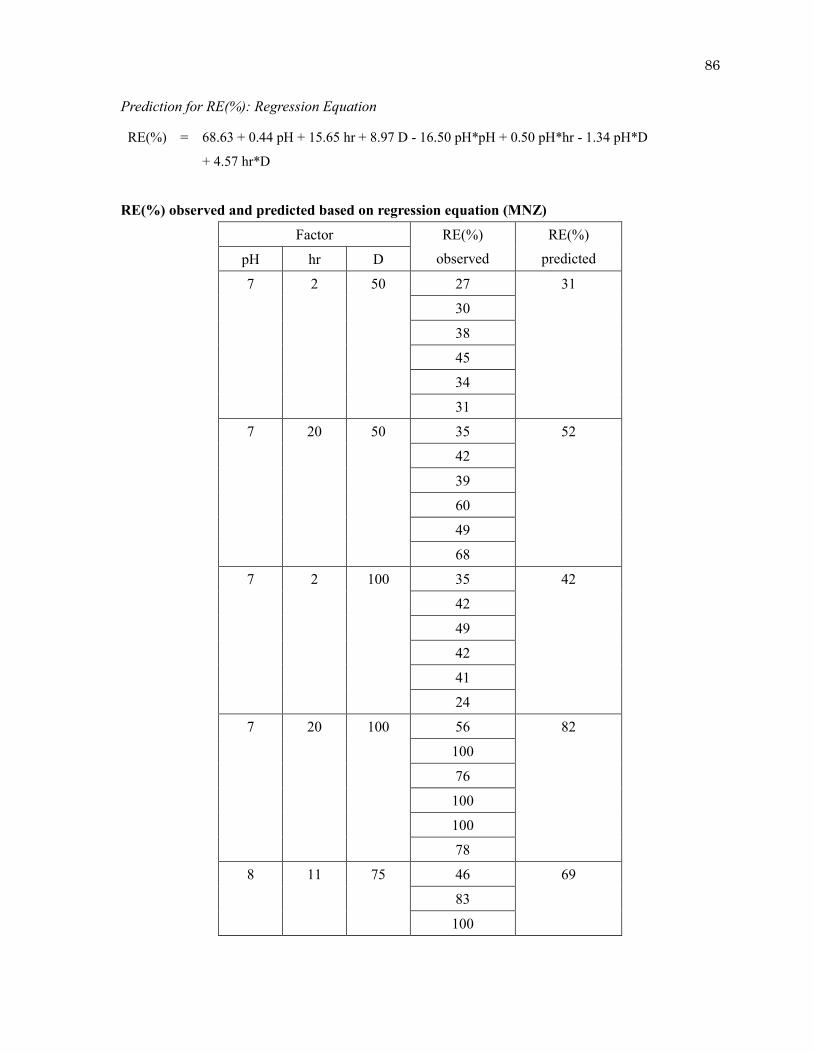
86
Prediction for RE(%): Regression Equation
RE(%) = 68.63 + 0.44 pH + 15.65 hr + 8.97 D - 16.50 pH*pH + 0.50 pH*hr - 1.34 pH*D
+ 4.57 hr*D
RE(%) observed and predicted based on regression equation (MNZ)
Factor RE(%) observed
RE(%) predicted pH hr D
7 2 50 27 31
30
38
45
34
31
7 20 50 35 52
42
39
60
49
68
7 2 100 35 42
42
49
42
41
24
7 20 100 56 82
100
76
100
100
78
8 11 75 46 69
83
100
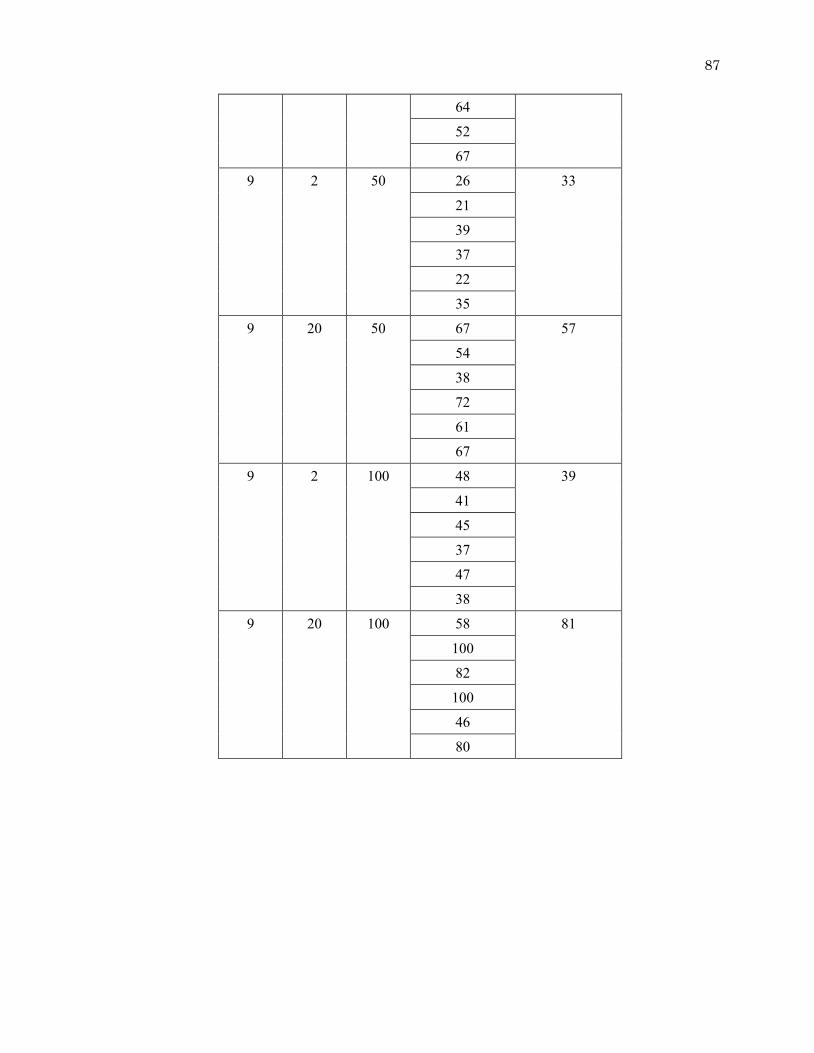
87
64
52
67
9 2 50 26 33
21
39
37
22
35
9 20 50 67 57
54
38
72
61
67
9 2 100 48 39
41
45
37
47
38
9 20 100 58 81
100
82
100
46
80