development of new adsorbent materials for the …
TRANSCRIPT

DEVELOPMENT OF NEW ADSORBENT MATERIALS FOR THE REMOVAL OF ARSENIC (III) AND
CHROMIUM (VI) FROM WATER &
ITS MATHEMATICAL MODELLING
A THESIS SUBMITTED IN FULFILLMENT OF THE REQUIREMENTS
FOR THE DEGREE OF
DOCTOR OF PHILOSOPHY
IN CHEMISTRY
BY
SANDIP MANDAL (510CY305)
UNDER THE GUIDANCE OF
PROF. RAJ KISHORE PATEL
DEPARTMENT OF CHEMISTRY NATIONAL INSTITUTE OF TECHNOLOGY
ROURKELA-769008, ODISHA, INDIA
NOVEMBER, 2014

DEDICATED TO MY PARENTS

NATIONAL INSTITUTE OF TECHNOLOGY ROURKELA
CERTIFICATE This is to certify that the thesis entitled, “Development of new adsorbent materials for the
removal of arsenic (III) and chromium (VI) from water & its mathematical modelling”
being submitted by Sri Sandip Mandal to the National Institute of Technology, Rourkela, India,
for the award of the degree of Doctor of Philosophy in Chemistry, is a record of bonafide
research work carried out by him under my supervision. In my opinion, the work fulfills part of
the requirements for which it is being submitted.
The work incorporated in the thesis has not been submitted elsewhere earlier, in part or in full,
for the award of any other degree or diploma of this or any other Institute or University.
Prof. (Dr.) R.K Patel Supervisor
Department of Chemistry National Institute of Technology, Rourkela-769008, Odisha, India

iv
ACKNOWLEDGEMENTS
I would like to express my sincere gratitude to my supervisor Prof. Raj Kishore Patel,
Department of Chemistry, National Institute of Technology, Rourkela for his continuous guidance,
care, moral support and encouragement throughout my research work.
It is my privilege to express my sincere thanks to Prof. S. S Mahapatra, Mechanical
Engineering, NIT Rourkela, for his helpful discussions and suggestions in mathematical modeling for
my experimental work. I am grateful to Prof. S.K Sarangi, Director, National Institute of Technology,
Rourkela for his inspiration and encouragement throughout the research work.
I acknowledge National Institute of Technology, Rourkela and Department of chemistry for
constant support to carry out the present investigations. I also acknowledge the University Grants
Commission (UGC), and Ministry of Social Justice & Empowerment, Government of India, New
Delhi, for providing financial support under the scheme of Rajiv Gandhi National Fellowship RGNF-
JRF and RGNF-SRF (2010-2015) during my research work. I am also thankful to Prof. Dilip Kumar
Pradhan, Prof. U. Subudhi, DSC members, NIT Rourkela, for their inspirations and encouragement
throughout the research work. I am also thankful to N. Panda, HOD, Prof B.G Mishra, Ex-HOD, Prof
G. Hota, and other faculty members, Department of chemistry for his helpful discussions,
suggestions and encouragement in my research work.
I am also thankful to Prof. Prof. Debasish Sarkar, Dept. of ceramic engineering and Prof. D.
Behera, Dept. of Physics for their inspirations and encouragement throughout the research work. I
would like to thank Dr. S.K Swain, BIT, Meshra, Mr. M.A Devani, BKIT, Bhalki, Karnataka, for their
constant support and providing characterization facilities. I would like to acknowledge Mr. Parindam
Das, Department of MME, Mr. Subhobrato Chakroratoy, Dept. of ceramic Engineering, for providing
SEM, FE-SEM and XRD facilities. I am also grateful to Mr. Hemanta and all other members of the
Library, NIT Rourkela for permitting me to carry out reference work. I heartily thank all my lab
mates, Dr. Anil Giri, Mr. Manoj Kr. Sahu, Mrs. Tapswani Padhi, Mr. Kishore Babu Ragi, Ms. Basanti
Ekka, PhD scholars and Dr. Saswati Dash, Post doc.
I heartily thanks to all my friends, Dr. Sachin Kumar, CUJ- Ranchi, Jharkhand, Mr. Dipto Sen,
Ms. Jaya Chakraborty, Ms. Smita Tapswani, Mr. Prakash Malick, Ms. Purbi Kar, Ms. Subhraseema
Das, Ms. Saswati and Mr. Swayam Bikash Mishra, NIT Rourkela for constant encouragement.
I thanks to all other laboratory colleagues, friends and the supporting staff members of the
Dept. of Chemistry, NIT Rourkela for their help and cooperation at various phases of the
experimental work.
I would also like to warmly acknowledge all those who directly or indirectly supported my research
work.
Finally, I would like to express a special tribute of gratitude and love to my parents and other
family members for their constant encouragement and moral support throughout the research work.
(Sandip Mandal) 510CY305, PhD

v
ABSTRACT
In current civilization, the aggressive development in industries and continuous innovation in
technologies have changed our living surroundings bringing all kind of pollution. Heavy metal
pollution in water is of major concern because of its detrimental effect on human health.
The present work was aimed to develop environment friendly hybrid materials and
composites as novel adsorbents by three standard methods such as sol-gel, microwave assisted
and co-precipitation techniques. Zirconium oxide ethanolamine (ZrO-EA), zirconium polyacrylamide
(ZrPACM-43), lanthanum diethanolamine (La-DEA), cerium oxide hydroxylamine hydrochloride (Ce-
HAHCl) and cerium oxide polyaniline composite (CeO2/PANI) were synthesized for the purpose of
removal of arsenic (III) and chromium (VI) removal from water. The adsorbent materials were
characterized by chemical analysis, specific surface area (BET), XRD, FTIR, TGA, DTA, Fe-
SEM/SEM, EDX etc. Batch and column adsorption experiments were carried out for the removal of
arsenic (III) and chromium (VI) from synthetic contaminated water. In batch experiments, influence
of various important parameters such as, adsorbent dose, solution pH, contact time, temperature,
competing ions and initial concentration were studied for the removal of arsenic (III) and chromium
(VI). In column adsorption experiments, influence of bed depth, flow rate and initial concentration
were varied and studied. Regeneration and reusability studies were carried out to understand the
practical applicability of the adsorbent materials. The materials synthesized were excellent hybrid
materials for removal of arsenic and chromium from water.
The removal of the arsenic (III) from water by using hybrid material zirconium (IV) oxide
ethanolamine for initial concentration 10 mg/L was found to be 98% at pH 7. With specific surface
area of 201.62 m2/g, and highest removal efficiency the hybrid material (ZrO-EA) represents
excellent hybrid material for removal of arsenic (III) from water. Similarly the removal of arsenic (III)
by using hybrid material zirconium polyacrylamide (ZrPACM-43) was 98.22% under optimum
conditions. The maximum adsorption capacity (qo) calculated from Langmuir isotherm was found to
be 41.48 mg/g. The adsorption data are best supported to Freundlich model and D–R model with
maximum adsorption capacity of 0.20 and 0.80 mg/g. The reusability study signifies that the material
can be easily reused up to eight cycles with maximum removal of 60%. Similar study was carried out
for removal of hexavalent chromium by using lanthanum diethanolamine hybrid material (La-DEA),
the maximum removal of Cr(VI) with initial concentration of 10 mg/L is found to be 99.31% at pH-
5.6, dose- 8 g/L and equilibrium time of 50 min. Adsorption kinetics studies reveal that the
adsorption process followed first-order kinetics and intraparticle diffusion model with correlation
coefficients (R2) of 0.96 and 0.97, respectively. The adsorption data were best fitted to linearly
transformed Langmuir isotherm with correlation coefficient (R2) of 0.997. The maximum adsorption
capacity of the material is 357.1 mg/g. Thermodynamic parameters were evaluated to study the
effect of temperature on the removal process. The study shows that the adsorption process is
feasible and endothermic in nature. The value of E (260.6 kJ/mol) indicates the chemisorption
nature of the adsorption process. Column study and breakthrough analysis were also carried out to

vi
know the breakthrough time. The breakthrough time for La-DEA hybrid material at bed depth of 15
cm and flow rate of 2 mL/min was found to be 24 hours and 19 hours respectively.
Artificial neural network modeling studies were carried out by using Ce-HAHCl for arsenic
(III) removal. The experimental studies revealed that maximum removal percentage is 98.85%. The
maximum adsorption capacity of the material is found to be 182.6 mg/g. The adequacy of the model
(BP-ANN) is checked by value of the absolute relative percentage error (0.293) and correlation
coefficient (R2 = 0.975). The model with architecture of 6-7-1 presents good agreements with the
actual experimental and predicted values. Comparison of experimental and predictive model results
show that the model can predict the adsorption efficiency with acceptable accuracy. The
regeneration and reusability studies shows that the hybrid material can be regenerated at alkaline
pH and can be reused upto 5 cycles with removal percentage of more than 60%.
Similar prediction and modeling studies were carried out by central composite design of
response surface methodology (RSM) and artificial neural network for removal of chromium (VI) by
using cerium oxide polyaniline (CeO2/PANI) composite. The experimental design, parametric
appraisal and prediction of the adsorption process are performed using response surface
methodology (RSM-CCD) and artificial neural network (ANN) method, respectively. A second order
predictive quadratic equation relating to removal percentage and important process variables was
developed and adequacy (ANOVA) of the model was checked. Nelder-Mead simplex algorithm was
used for numerical optimization. The result indicates that 93.9% removal can be achieved under
optimuim conditions. The kinetic studies revealed that the adsorption process followed pseudo-
second-order kinetics. The adsorption data was best fitted to Langmuir model. The maximum
adsorption capacity for chromium (VI) ions was 357 mg/g at pH-6. A comparative analysis using
various statistical technique suggested prediction of removal percentage by ANN model has been
found to be best than RSM model with high correlation value (R2) of 0.994.
Key words: Heavy metals, arsenic, chromium, ion exchanger, adsorption, SEM, EDX, FTIR, XRD, BET,
Langmuir isotherm, Freundlich isotherm, Helfferich rate equation, Intraparticle diffusion, Enthalpy,
Entropy, Logit method, Artificial Neural Network (ANN), Back Propagation Neural Network, Central
composite design (CCD), Response surface methodology (RSM), MATLAB, Analysis of
variance (ANOVA), Water treatment

vii
CONTENTS
Chapter Particulars Pages
Title page I Dedication II
Certificate III Acknowledgements IV
Abstract V Contents VII
List of Tables IX List of Figures XII
Abbreviations, Symbols & Nomenclature XVIII
Chapter-1 Introduction 1-6
Chapter-2 Literature review 7-25
2.1 Pollutants 7 2.1.1. Heavy metals 7
2.1.2. Arsenic and chromium 8 2.1.3. Sources of arsenic and chromium 9
2.1.4. Exposure of arsenic and chromium 10 2.1.5. Toxicity and health effects of arsenic and chromium 11 2.1.6. Global scenario 12
2.2. Conventional methods for arsenic and chromium treatment in water
14
2.2.1. Coagulation 14 2.2.2. Chemical oxidation and reduction 14
2.2.3. Solvent extraction 15 2.2.4. Membrane separation 15
2.2.5. Adsorption 16 2.3. Materials for removal of arsenic and chromium 17 2.3.1. Phosphate compounds 17
2.3.2. Activated carbon 18
2.3.3. Iron oxides 19
2.3.4. Layered double hydroxides (LDHs) 19
2.3.5. Hybrid materials and composites 20
2.4. Material synthesis route 21
2.4.1. Co-precipitation method 21
2.4.2. Sol-gel method 22
2.4.3. Hydrothermal method 22
2.4.4. Microwave synthesis 22
2.5. Mathematical modeling of adsorption process 23
2.6 Research gap 24
2.7. Aim and objective of the present research work 25
Chapter-3 Experimental Methods 26-42
3.1. Removal of the arsenic (III) and chromium (VI) from water by hybrid materials
26
3.1.2. Synthesis of hybrid materials and LDHs 26
3.1.3. Characterization Techniques of Hybrid materials 28
3.1.4. Instrumental analysis of arsenic and chromium 30
3.1.5. Batch Experiments 30
3.1.6. Column Study 33
3.2. Mathematical modeling of arsenic (III) and chromium (VI) removal process from water by hybrid materials
35
3.2.1. Response surface methodology (RSM) 35
3.2.2. Artificial Neural Network (ANN) 36
viii
3.3. Data analysis and statistical techniques 38
Chapter-4 Results and Discussion 42-190
4.1. Removal of arsenic (III) by zirconium (IV) oxide ethanolamine (ZrO-EA) hybrid material
42
4.1.1. Characterization of zirconium (IV) oxide ethanolamine (ZrO-EA) hybrid material
42
4.1.2. Removal study of arsenic (III) by batch experiments 46
4.1.3. Removal study of arsenic (III) by column experiments 62
4.1.4. Mechanism of adsorption of arsenic (III) on ZrO-EA hybrid material
65
4.2. Removal of Arsenic (III) by Zirconium polyacrylamide (ZrPACM - 43) hybrid material
67
4.2.1. Characterization of zirconium polyacrylamide (ZrPACM - 43) hybrid material hybrid material
67
4.2.2. Removal study of arsenic (III) by ZrPACM - 43 in batch mode
72
4.2.3. Column study for the removal of arsenic (III) by zirconium polyacrylamide hybrid material
85
4.2.4. Mechanism of adsorption of arsenic (III) on ZrPACM- 43 hybrid material
87
4.3. Removal of chromium (VI) by lanthanum-diethanolamine (La-DEA) hybrid material
89
4.3.1. Characterization of La-DEA 89
4.3.2. Removal of chromium by batch studies 94
4.3.3. Column studies for removal of chromium (VI) by La-DEA hybrid material
108
4.3.4. Mechanism of chromium (VI) removal by La-DEA hybrid material
110
4.4. Removal of Arsenic (III) by cerium oxide hydroxylamine hydrochloride (Ce-HAHCl)
112
4.4.1. Characterization of cerium oxide hydroxylamine hydrochloride (Ce-HAHCl) hybrid material
112
4.4.2. Removal study of arsenic (III) by batch experiments 116
4.4.3. Removal study of arsenic (III) by column experiments 135
4.4.4. Back propagation artificial neural network (BP-ANN) studies
140
4.5. Removal of chromium (VI) by cerium oxide polyaniline (CeO2/PANI) composite
151
4.5.1. Characterization of cerium oxide polyaniline composite (CeO2/PANI) hybrid material
151
4.5.2. Removal study of chromium (VI) by batch experiments 156
4.5.3. Prediction modeling of chromium removal from water 177
4.5.4. Artificial neural network modeling (BP-ANN) 185
4.5.5. Statistical comparison and Performance of models 187
4.5.6. Confirmatory experiments 190
Chapter-5 Summary 191-195
Chapter-6 Future Work 196
Chapter-7 References 197-211
Appendix-Bio data

ix
LIST OF TABLES Table No. Captions Pages
Table - 2.1. Data represents production of chromite in India 14 Table - 2.2. List of various LDHs used for arsenic and chromium removal 20 Table - 2.3. Hybrid materials and composites reported for arsenic and chromium
removal 21
Table - 3.1. Parameter settings for RSM modeling 36 Table - 3.2. Parameter settings for ANN modeling 37 Table - 4.1. Synthesis of various samples of Zirconium (IV) oxide-ethanolamine
(ZrO-EA), hybrid material 42
Table - 4.2. Chemical stability of ZRO-EA hybrid material in various acid, alkali and salt solutions
43
Table - 4.3. Arsenic ion exchange capacity for different eluent concentration and chemical analysis of ZrO-EA hybrid Material
43
Table - 4.4. Change in pH during the removal process 47 Table - 4.5. Rate constants (Kad) obtained from the graph for different initial
concentration of arsenic (III) 49
Table - 4.6. Rate constants (K’) obtained from the graph for different initial concentration of arsenic (III)
50
Table - 4.7. Rate constants (K1 and K2) obtained from the equation, for different concentration of arsenic (III)
50
Table - 4.8: Rate constants (K2) obtained from the graph for different initial concentration of arsenic (III)
52
Table - 4.9. Intraparticle diffusion rate constants obtained from Weber- Morris equation for different initial concentration of arsenic (III)
53
Table - 4.10. Thermodynamic parameters using synthetic arsenic (III) solution of 10 mg/L, 50 mg/L, and 100 mg/L
55
Table - 4.11. Langmuir isotherm parameters for arsenic (III) removal by zirconium (IV) oxide ethanolamine
57
Table - 4.12. Freundlich constant for arsenic (III) removal by zirconium (IV) oxide ethanolamine hybrid material
58
Table - 4.13. Dubinin - Radushkevich isotherm constants for zirconium (IV) oxide ethanolamine hybrid material used for removal of arsenic (III).
60
Table - 4.14. Percentage desorption and regeneration of arsenic of different concentration by hybrid material
60
Table - 4.15. Column adsorption parameters for arsenic (III) removal by zirconium (IV) oxide ethanolamine hybrid material
65
Table - 4.16. Different composition of the hybrid material ZrPACM, surface area and particle size studies
67
Table - 4.17. Chemical stability of ZrPACM-43 hybrid material in various acid, alkali and salt solutions
68
Table - 4.18. Arsenic ion exchange capacity for different eluent concentration and chemical analysis of ZrPACM-43 hybrid Material
68
Table - 4.19. Initial and final pH of arsenic (III) solutions of 10 mg/L, 50 mg/L and 100 mg/L concentration
73
Table - 4.20. Change in pH during the removal of arsenic (III) by ZrPACM – 43 hybrid material
74
Table - 4.21. Lagergren rate constants (Kad) obtained from the graph for different initial concentration of arsenic (III)
76
Table - 4.22. Rate constant (K’) obtained from the graph for different initial concentration of arsenic (III)
77
Table - 4.23. Rate constants (K1 and K2) obtained for different initial concentration of arsenic (III)
77
Table - 4.24. Second order rate constant for arsenic (III) removal by ZrPACM-43 hybrid material
78
Table - 4.25. Intraparticle diffusion rate constant (Weber-Morris equation) for arsenic (III) removal by ZrPACM-43 hybrid material
78

x
Table - 4.26. Thermodynamic parameters using synthetic arsenic (III) solution of 10 mg/L, 50 mg/L, and 100 mg/L
80
Table - 4.27. Langmuir isotherm parameters for arsenic (III) removal by zirconium polyacrylamide hybrid material
81
Table - 4.28. Freundlich isotherm parameters for arsenic (III) removal by ZrPACM-43 hybrid material
82
Table - 4.29: D-R isotherm parameters for arsenic (III) removal by ZrPACM-43 hybrid material
83
Table - 4.30. Percentage desorption and regeneration of arsenic of different concentration by hybrid material
85
Table - 4.31. Column adsorption parameters for arsenic (III) removal by ZrPACM-43 hybrid material
85
Table - 4.32. Removal capacity, particle size and Ion exchange capacity of various samples of La-DEA (W= 1g), IEC in meq/g
89
Table - 4.33. Chemical stability of La-DEA hybrid material in various acid, alkali and salt solutions
89
Table - 4.34. Physical and chemical constituents of hand pump water (Sample water collected from boula-Nauasahi area of Kenojhar district, odisha, India)
94
Table - 4.35. Change in pH during the removal of chromium (VI) by La-DEA hybrid material
96
Table - 4.36. Lagergren rate constants (Kad) obtained from the graph for different initial concentration of chromium (VI)
97
Table - 4.37. Rate constant (K’) obtained from the graph for different initial concentration of chromium (VI)
98
Table - 4.38. Rate constants (K1 and K2) obtained for different initial concentration of chromium (VI)
99
Table - 4.39. Second order rate constant for chromium removal by La-DEA hybrid material
99
Table - 4.40. Intraparticle diffusion rate constants obtained from Weber- Morris equation for different initial concentration of chromium (VI)
100
Table - 4.41. Thermodynamic parameters using synthetic chromium (VI) solution of 10 mg/L, 50 mg/L and 100 mg/L
102
Table - 4.42. Langmuir isotherm parameters for chromium (VI) removal by La-DEA hybrid material
104
Table - 4.43. Freundlich isotherm parameters for chromium (VI) removal by La-DEA hybrid material
104
Table - 4.44. D-R isotherm parameters for chromium (VI) removal by lanthanum diethanolamine (La-DEA) hybrid material
106
Table - 4.45. Percentage desorption and regeneration of chromium of different concentration by hybrid material
107
Table - 4.46. Column adsorption parameters for chromium (VI) removal by lanthanum diethanolamine (La-DEA) hybrid material
110
Table - 4.47. Different composition of the material, ion exchange capacity, surface area and particle size studies.
112
Table - 4.48. Chemical stability of cerium oxide hydroxylamine hydrochloride (Ce-HAHCl) hybrid material
112
Table - 4.49. Lagergren rate constants (Kad) obtained from the graph for different initial concentration of arsenic (III)
122
Table - 4.50. Rate constant (K’) obtained from the graph for different initial concentration of arsenic (III)
124
Table - 4.51. Rate constant (K1 and K2) obtained from the graph for different initial concentration of arsenic (III)
125
Table - 4.52. Second order rate constant for arsenic (III) removal by Ce-HAHCl hybrid material
125
Table - 4.53. Intraparticle diffusion rate constant (Weber-Morris equation) data for arsenic (III) removal by Ce-HAHCl hybrid material
126
Table - 4.54. Thermodynamic parameters using arsenic (III) solution of 10 mg/L, 25 mg/L and 50 mg/L
130

xi
Table - 4.55. Langmuir isotherm parameters for arsenic (III) removal by Ce-HAHCl hybrid material
131
Table - 4.56. Freundlich isotherm parameters for arsenic (III) removal by Ce-HAHCl hybrid material
132
Table - 4.57. D-R adsorption isotherm parameters for arsenic (III) removal by Ce-HAHCl hybrid material
133
Table - 4.58. Percentage desorption and regeneration of arsenic (III) by Ce-HAHCl hybrid material
134
Table - 4.59. Column adsorption parameters for arsenic (III) removal by Ce-HAHCl hybrid material
136
Table - 4.60. Comparison of experimental removal percentage and predicted removal percentage at training and testing (Batch studies)
144
Table - 4.61. Comparison of experimental removal percentage and predicted removal at training (Column studies)
149
Table - 4.62. Listed number of samples of cerium oxide polyaniline composite are prepared and various other property
151
Table - 4.63. Chemical stability of the material 151 Table - 4.64. Change in pH during adsorption of chromium (VI) by CeO2/PANI
composite at dose studies 156
Table - 4.65. Rate constants (kad) obtained from the graph for CeO2/PANI composite
162
Table - 4.66. Rate constant (K’) obtained from the graph for different initial concentration of chromium (VI)
162
Table - 4.67. Rate constants (K1 and K2) obtained for different initial concentration of chromium (VI)
163
Table - 4.68. Rate constants (K2) and maximum adsorption capacity obtained from the graph for different initial concentration of chromium
165
Table - 4.69. Intraparticle diffusion rate constant (Weber-Morris equation) for chromium (VI) removal by CeO2/PANI composite
165
Table - 4.70. Thermodynamic parameters using synthetic chromium (VI) solution of 10 mg/L, 50 mg/L, and 100 mg/L
169
Table - 4.71. Langmuir isotherm parameters for chromium (VI) removal by cerium oxide polyaniline composite
171
Table - 4.72. Freundlich isotherm parameters for CeO2/PANI composite for removal of chromium (VI)
172
Table - 4.73. D-R adsorption isotherm parameters for chromium (VI) removal by CeO2/PANI composite
173
Table - 4.74. Level of independent variables used in CCD-RSM 178 Table - 4.75. Observed experimental and predicted data for chromium removal
prediction by using CCD-RSM 179
Table - 4.76. Analysis of variance (ANOVA) of chromium removal prediction by using RSM-CCD
181
Table - 4.77. Comparison of observed and predicted values for chromium removal by using BP-ANN model
186
Table - 4.78. Model performance and comparison of RSM and ANN model 189

xii
LIST OF FIGURES
Figure No. Captions Pages
Fig. 2.1. Plot summarizes the impact of pH on prevalence of the various inorganic arsenic (III) and arsenic (V) species in solution (Nieto-Delgado et al., 2012; Douglas et al., 1986)
8
Fig. 2.2. Relative distribution summarizes the impact of pH on prevalence of the various chromium species in solution (Anger et al., 2005)
9
Fig. 2.3. Skin diseases due to arsenic poisoning 11 Fig. 2.4. Effect of chromium poisoning in drinking water Source: (U.S. EPA Guidelines
for Carcinogen Risk Assessment, 2005a) 12
Fig. 2.5. Mechanism and influence of chromium in cell (Correia et al., 1994, USEPA, 1997)
12
Fig. 2.6. Global arsenic distribution and poisoning 13 Fig. 2.7. SEM images of (a) activated carbon (AC) (b) AC-Fe (c) AC-Al (d) AC-Mn
(Sun et al., 2014) 18
Fig. 3.1. Laboratory scale column diagram 33 Fig. 3.2. Typical architecture of BP-ANN 36 Fig. 4.1. Particle size of the zirconium (IV) oxide ethanolamine hybrid material 43 Fig. 4.2. TGA-DTA of zirconium (IV) oxide ethanolamine hybrid material 44 Fig. 4.3. SEM and EDX micrographs of zirconium (IV) oxide ethanolamine hybrid
material (a-c) before adsorption (b-d) after adsorption 44
Fig. 4.4. XRD pattern of zirconium (IV) oxide ethanolamine hybrid material 45 Fig. 4.5. FT-IR study of the material zirconium (IV) oxide ethanolamine hybrid material 46 Fig. 4.6. Structure of zirconium (IV) oxide ethanolamine hybrid material 46 Fig. 4.7. Effect of zirconium (IV) oxide ethanolamine hybrid material dose and pH on
removal of arsenic (III) 47
Fig. 4.8. Time versus percentage removal of arsenic (III) by zirconium (IV) oxide ethanolamine hybrid material, with initial concentration of 10 mg/L, 50 mg/L and 100 mg/L
48
Fig. 4.9. Linear plot of Lagergren rate equation using zirconium (IV) oxide ethanolamine hybrid material, time versus Log (qe-q) with initial arsenic (III) concentration of 10 mg/L, 50 mg/L and 100 mg/L
49
Fig. 4.10. Linear plot of Helfferich equation using zirconium (IV) oxide ethanolamine hybrid material, time versus ln [1-U(t)] with initial arsenic (III) concentrations of 10 mg/L, 50 mg/L and 100 mg/L.
51
Fig. 4.11. Linear plot of second order rate equation using zirconium (IV) oxide ethanolamine hybrid material, time ‘t’ versus t/qt with initial arsenic (III) concentration of 10 mg/L, 50 mg/L and 100 mg/L
51
Fig. 4.12. Linear plot of Weber- Morris equation using zirconium (IV) oxide ethanolamine hybrid material, square root of time versus qe with initial arsenic (III) concentration of 10 mg/L, 50 mg/L and 100 mg/L.
52
Fig. 4.13. Temperature versus percentage removal of arsenic (III) with zirconium (IV) oxide ethanolamine hybrid material, initial arsenic (III) concentrations of 10 mg/L, 50 mg/L and 100 mg/L.
53
Fig. 4.14. Van’t Hoff plot, log Kc versus 1/T for zirconium (IV) oxide ethanolamine hybrid material
54
Fig. 4.15. Percentage removal of arsenic (III) by zirconium (IV) oxide ethanolamine hybrid material versus initial concentration
55
Fig. 4.16. Langmuir adsorption isotherm, 1/Ce versus 1/qe for zirconium (IV) oxide ethanolamine hybrid material
57
Fig. 4.17. Freundlich adsorption isotherm, log Ce versus log qe for zirconium (IV) oxide ethanolamine hybrid material
58
Fig. 4.18. D-R adsorption isotherm, ln qe versus ε2 for arsenic (III) removal by zirconium (IV) oxide ethanolamine
59
Fig. 4.19. Percentage removal of arsenic (III) with zirconium (IV) oxide ethanolamine versus initial cation concentration of solution (Initial arsenic (III) concentration of 10, 50 and 100 mg/L)
61

xiii
Fig. 4.20. Percentage removal of arsenic (III) with zirconium (IV) oxide ethanolamine versus initial anion concentration of solution. (Initial arsenic (III) concentration of 10, 50 and 100 mg/L)
62
Fig. 4.21. Reusability studies of zirconium (IV) oxide ethanolamine hybrid material 62 Fig. 4.22. Breakthrough curve at different bed depth for zirconium (IV) oxide
ethanolamine C/C0 versus time (t) in hours, initial arsenic (III) concentration- 5 mg/L
63
Fig. 4.23. Breakthrough curve at different flow rate for zirconium (IV) oxide ethanolamine C/C0 versus time (t) in hours, initial arsenic (III) concentration- 5 mg/L
63
Fig. 4.24. Logit equation for different bed depth for zirconium (IV) oxide ethanolamine ln[Ceff/(Co-Ceff)] versus time ‘t’, initial arsenic (III) concentration- 5 mg/L
64
Fig. 4.25. Logit equation for different flow rate for zirconium (IV) oxide ethanolamine ln[Ceff/(Co-Ceff)] versus time ‘t’, initial arsenic (III) concentration- 5 mg/L
64
Fig. 4.26. Adsorption mechanism for arsenic (III) removal from water by zirconium (IV) oxide ethanolamine hybrid material
66
Fig. 4.27. Particle size analysis of zirconium polyacrylamide hybrid material 67 Fig. 4.28. Thermogravimetric analysis (TGA) and differential thermal analysis (DTA) of
hybrid material ZrPACM-43 69
Fig. 4.29. SEM of hybrid material ZrPACM-43 (a) before adsorption (b) after adsorption 70 Fig. 4.30. EDX of hybrid material ZrPACM-43 (a) EDX micrographs of before adsorption
and (b) EDX micrographs of after adsorption 70
Fig. 4.31. Surface charge density as a function of pH (m = 1 g/L) for hybrid material ZrPACM-43
71
Fig. 4.32. X-Ray diffraction pattern of hybrid Material ZrPACM-43, (a) Before adsorption, (b) After adsorption of arsenic(III)
71
Fig. 4.33. FTIR spectrum of hybrid material ZrPACM-43: (a) Before adsorption, (b) After adsorption of arsenic(III)
72
Fig. 4.34. Variation of adsorbent dose on the percentage removal of arsenic(III) by the ZrPACM – 43 hybrid material
73
Fig. 4.35. Percentage removal of arsenic (III) of initial concentration of 10 mg/L, 50 mg/L and 100 mg/L versus pH of the solution, by ZrPACM – 43 hybrid material
74
Fig. 4.36. Effect of contact time on the removal of arsenic(III) by hybrid material ZrPACM-43
75
Fig. 4.37. Linear plot of Lagergren rate equation using ZrPACM-43, time versus Log (qe-q) with initial arsenic (III) concentration of 10 mg/L, 50 mg/L and 100 mg/L.
75
Fig. 4.38. Linear plot of Helfferich equation using ZrPACM-43, time versus ln[1-U(t)] with initial arsenic (III) concentration of 10 mg/L, 50 mg/L and 100 mg/L.
76
Fig. 4.39. Linear plot of second order rate equation using ZrPACM-43, time versus t/qt with initial arsenic (III) concentration of 10 mg/L, 50 mg/L and 100 mg/L.
77
Fig. 4.40. Linear plot of Weber- Morris equation using zirconium polyacrylamide hybrid material, square root of time versus qe with initial arsenic (III) concentration of 10 mg/L, 50 mg/L and 100 mg/L.
78
Fig. 4.41. Effect of temperature on removal of arsenic (III) by ZrPACM-43 hybrid material
79
Fig. 4.42. Van’t Hoff plot, log Kc versus 1/T for ZrPACM-43 hybrid material 79 Fig. 4.43. Percentage removal of arsenic (III) by Zirconium polyacrylamide hybrid
material 80
Fig. 4.44. Langmuir adsorption isotherm, 1/Ce versus 1/qe for Zirconium polyacrylamide hybrid material
81
Fig. 4.45. Freundlich adsorption isotherm, log Ce versus log qe for Zirconium polyacrylamide hybrid material
82
Fig. 4.46. D-R adsorption isotherm, ln qe versus ε2 for arsenic (III) removal by Zirconium polyacrylamide hybrid material
83
Fig. 4.47. `
Percentage removal of arsenic (III) with zirconium polyacrylamide hybrid material versus initial cation and anion concentration of solution (Initial arsenic concentration 10 mg/L
83

xiv
Fig. 4.48. (a) Regeneration of hybrid material (b) reusability of hybrid material 84 Fig. 4.49. Breakthrough curve of varying initial concentration for zirconium
polyacrylamide hybrid material, Ceff/Co versus time in hours, initial bed height- 2 cm
86
Fig. 4.50. Breakthrough curve of bed height for zirconium polyacrylamide hybrid material, Ceff/Co versus time in hours, initial concentration- 10 mg/L
86
Fig. 4.51. Breakthrough curve of bed height for zirconium polyacrylamide hybrid material, Ceff/Co versus time in hours, initial concentration- 10 mg/L
86
Fig. 4.52 Logit equation for different concentration for zirconium polyacrylamide, ln[Ceff/(Co-Ceff)] versus time ‘t’, initial bed height- 2cm
87
Fig. 4.53. Logit equation for different bed height for zirconium polyacrylamide, ln[Ceff/(Co-Ceff)] versus time ‘t’, initial concentration- 10 mg/L, flow rate 2 mL/min
87
Fig. 4.54. Logit equation for flow rate for zirconium polyacrylamide, ln[Ceff/(Co-Ceff)] versus time ‘t’, initial bed height- 2cm, Initial concentration- 10 mg/L
87
Fig. 4.55. Proposed mechanism for arsenic (III) removal by hybrid material ZrPACM-43 88 Fig. 4.56. TGA and DTA of lanthanum diethanolamine (La-DEA) hybrid material 90 Fig. 4.57. (a) Scanning Electron Micrographs and (b) Energy-dispersive X-ray spectrum
of La-DEA hybrid material 91
Fig. 4.58. XRD pattern of La-DEA hybrid material (a) before adsorption (b) after adsorption
91
Fig. 4.59. FTIR spectra of La-DEA hybrid material, before and after adsorption 92 Fig. 4.60. Surface charge density as a function of pH (m =1.0 g/L) 93 Fig. 4.61. Percentage removal of Cr(VI) by La-DEA of initial concentration hand pump
ground water- 3.052 mg/L, 10 mg/L, 50 mg/L and 100 mg/L versus La-DEA dose.
95
Fig. 4.62. Percentage removal of Cr(VI) by La-DEA of initial concentration hand pump ground water - 3.052 mg/L, 10 mg/L, 50 mg/L and 100 mg/L versus pH of the solution
96
Fig. 4.63. Percentage removal of Cr(VI) by La-DEA of initial concentration hand pump ground water- 3.052 mg/L, 10 mg/L, 50 mg/L and 100 mg/L versus contact time
97
Fig. 4.64. Linear plot of Lagergren rate equation using La-DEA, time versus Log (qe-q) with initial chromium (VI) concentration of 10 mg/L, 50 mg/L and 100 mg/L
97
Fig. 4.65. Linear plot of Helfferich equation using La-DEA, time versus ln[1-U(t)] with initial chromium (VI) concentration of 10 mg/L, 50 mg/L and 100 mg/L
98
Fig. 4.66: Linear plot of second order rate equation using La-DEA, time versus t/qt with initial chromium (VI) concentration of 10 mg/L, 50 mg/L and 100 mg/L
99
Fig. 4.67: Linear plot of Weber- Morris equation using lanthanum diethanolamine hybrid material, square root of time versus qe with initial chromium (VI) concentration of 10 mg/L, 50 mg/L and 100 mg/L
100
Fig. 4.68. Temperature versus percentage removal of chromium (VI) with lanthanum diethanolamine hybrid material, initial chromium (VI) concentrations of 10 mg/L, 50 mg/L, 100 mg/L and 3.052 mg/L field water
101
Fig. 4.69. Van’t Hoff plot, log Kc versus 1/T for La-DEA hybrid material 102 Fig. 4.70 Percentage removal of chromium (VI) by lanthanum diethanolamine hybrid
material at different pH conditions (pH 2, pH 5 and pH 8) 103
Fig. 4.71. Langmuir adsorption isotherm, 1/Ce versus 1/qe for La-DEA hybrid material 104 Fig. 4.72. Freundlich adsorption isotherm, log Ce versus log qe for La-DEA hybrid
material 105
Fig. 4.73. D-R adsorption isotherm, ln qe versus ε2 for chromium (VI) removal by La-DEA hybrid material
105
Fig. 4.74. Percentage removal of chromium (VI) with lanthanum diethanolamine (La-DEA) hybrid material versus initial cation concentration of solution. (Initial chromium (VI) concentration -10, 50 and 100 mg/L)
106
Fig. 4.75. Regeneration of lanthanum diethanolamine hybrid material (La-DEA) 107 Fig. 4.76. Reusability studies of La-DEA hybrid material (Initial chromium (VI)- 100
mg/L) 107
Fig. 4.78. Breakthrough curve at different bed depth for lanthanum diethanolamine (La- 108

xv
DEA) C/C0 versus time (t) in hours, initial chromium (VI) concentration- 10mg/L
Fig. 4.79. Breakthrough curve at different bed depth for lanthanum diethanolamine (La-DEA) C/C0 versus time (t) in hours, initial chromium (VI) concentration- 10mg/L
108
Fig. 4.80. Logit equation for different bed depth for lanthanum diethanolamine (La-DEA) hybrid material ln[Ceff/(Co-Ceff)] versus time ‘t’, initial chromium (VI) concentration- 10mg/L
109
Fig. 4.81. Logit equation for different flow rate for lanthanum diethanolamine (La-DEA) hybrid material ln [Ceff/(Co-Ceff)] versus time ‘t’, initial chromium (VI) concentration- 10mg/L
109
Fig. 4.82. Proposed mechanism of chromium (VI) adsorption by La-DEA hybrid material 111 Fig. 4.83. TGA-DTA of the hybrid material (Ce-HAHCl) before adsorption 113 Fig. 4.84. SEM-EDX of (a) - (b) without loaded As(III) hybrid material and (c) –(c)
loaded As(III) hybrid material 114
Fig. 4.85. X-ray diffractogram of the Ce-HAHCl hybrid material before and after As(III) 115 Fig. 4.86. FTIR spectra of the Ce-HAHCl hybrid material before and after As(III)
adsorption 115
Fig. 4.87. Surface charge density of the Ce-HAHCl hybrid material 116 Fig. 4.88. Experimental data and ANN outputs as a function of adsorbent dose versus
(%) removal of As(III) by Ce-HAHCl hybrid material (a) 10 mg/L, (b) 25 mg/L and (c) 50 mg/L
117
Fig. 4.89. Experimental data and ANN outputs as a function of pH versus (%) removal of As(III) by Ce-HAHCl hybrid material (a) 10 mg/L, (b) 25 mg/L and (c) 50 mg/L.
119
Fig. 4.90. Influence of agitation speed on removal of arsenic (III) from water by Ce-HAHCl hybrid material for initial concentration of 10, 25 and 50 mg/L of arsenic (III).
120
Fig. 4.91. Influence of contact time on removal of arsenic (III) from water by Ce-HAHCl hybrid material for initial arsenic (III) concentration of 10, 25 and 50 mg/L.
122
Fig. 4.92. Linear plot of Lagergren rate equation using Ce-HAHCl, time versus Log (qe-q) with initial arsenic (III) concentration of 10 mg/L, 25 mg/L and 50 mg/L (Experimental and ANN output)
123
Fig. 4.93. Linear plot of Helfferich equation using Ce-HAHCl, time versus ln[1-U(t)], (a) Experimental output, (b) ANN output
124
Fig. 4.94. Linear plot of second order rate equation using Ce-HAHCl, time versus t/qt with initial arsenic(III) concentration of 10 mg/L, 25 mg/L and 50 mg/L. (a) experimental output (b) ANN output
126
Fig. 4.95. Intraparticle diffusion rate constant (Weber-Morris equation) plot of qe versus square root t for arsenic (III) removal by Ce-HAHCl hybrid material. (Initial concentration- 10, 25, and 50 mg/L), (a) ANN output (b) experimental output
127
Fig. 4.96. Influence of temperature on removal of arsenic (III) by Ce-HAHCl hybrid material for initial concentration of (a) 10, (b) 25 and (c) 50 mg/L.
128
Fig. 4.97. Van’t Hoff plot, log Kc versus 1/T for Ce-HAHCl hybrid material for initial arsenic (III) concentration; (a)10, (b) 25 and (c) 50 mg/L.
129
Fig. 4.98. Influence of initial concentration on arsenic (III) removal by Ce-HAHCl hybrid material.
130
Fig. 4.99. Langmuir adsorption isotherm, 1/Ce versus 1/qe for Ce-HAHCl hybrid material 131 Fig. 4.100. Freundlich adsorption isotherm, log Ce versus log qe for Ce-HAHCl hybrid
material 132
Fig. 4.101. D-R adsorption isotherm, ln qe versus ε2 for arsenic (III) removal by Ce-HAHCl hybrid material
133
Fig. 4.102. Percentage removal of arsenic (III) Ce-HAHCl hybrid material versus initial anion concentration of solution. (Initial arsenic (III) concentration (a) 10 mg/L, (b) 25 mg/L and (c) 50 mg/L).
134
Fig. 4.103. (a) Regeneration and (b) reusability of Ce-HAHCl hybrid material (initial concentration- 10 mg/L)
135
Fig. 4.104 Breakthrough curve at different bed depth for Ce-HAHCl, C/C0 versus time (t) in hours, initial arsenic(III) concentration- 10mg/L, (a) 5 cm, (b) 10 cm and (c)
136

xvi
15 cm Fig. 4.105. Breakthrough curve at different flow rate for Ce-HAHCl, C/C0 versus time (t)
in hours, initial arsenic (III) concentration- 10mg/L, (a) 2 mL/min, (b) 5 mL/min and (c) 7 ml/min
137
Fig. 4.106. Logit equation for different bed depth for Ce-HAHCl hybrid material ln[Ceff/(Co-Ceff)] versus time ‘t’, initial arsenic (III) concentration- 10mg/L, (a) 5 cm, (b) 10 cm and (c) 15 cm
138
Fig. 4.107. Logit equation for different flow rate for Ce-HAHCl hybrid material ln[Ceff/(Co-Ceff)] versus time ‘t’, initial arsenic (III) concentration- 10mg/L, (a) 2mL/min, (b) 5 mL/min and (c) 7 mL/min
139
Fig. 4.108. A three layer ANN back propagation model in batch studies 140 Fig. 4.109 Tool box for ANN modeling in MATLAB in batch studies 141 Fig. 4.110. Selection of number of neurons in hidden layer according to mean squared
error (MSE) 141
Fig. 4.111. Distribution of experimental runs at training and testing for arsenic (III) removal prediction by using ANN back propagation model for batch studies
142
Fig. 4.112. Correlation of predicted and actual As(III) removal (training and testing data) at batch studies
142
Fig. 4.113. (a) Experimental runs versus residuals (b) experimental runs versus absolute error % at batch studies
143
Fig. 4.114. A three layer ANN back propagation model in column studies 146 Fig. 4.115. Tool box for ANN modeling in MATLAB for column studies 146 Fig. 4.116. Distribution of experimental runs at training and testing for arsenic (III)
removal prediction by using ANN back propagation model for column studies. 147
Fig. 4.117 Correlation of predicted and actual arsenic (III) removal (training and testing data) at column studies
147
Fig. 4.118. Distribution of experimental runs versus residuals at training and testing for column studies.
148
Fig. 4.119. Experimental runs versus absolute error % at training and testing for column studies.
149
Fig. 4.120. Zero point surface charge density of CeO2/PANI at 0.1 M NaCl 152 Fig. 4.121. TGA-DTA studies of fresh CeO2/PANI composite before adsorption and
CeO2/PANI composite after adsorption of Cr(VI) 152
Fig. 4.122. X-Ray diffraction studies: (a) CeO2/PANI composite and (b) CeO2/PANI composite after adsorption of Cr(VI)
153
Fig. 4.123. Scanning electron micrographs (SEM) (a) Fresh CeO2/PANI Composite (b) chromium (VI)adsorbed CeO2/PANI composite (c) EDX CeO2/PANI composite, (d) EDX of chromium (VI)adsorbed CeO2/PANI composite (Data obtained from EDX before and after adsorption: CeO2 (37.88%), C (54.73%), N (7.10%), Cl (0.29%) and CeO2 (34.21), C (53.47), Cr (11.22%), N (0.98%), Cl (0.12%))
154
Fig. 4.124. FTIR spectra: (a) Fresh CeO2/PANI composite and (b) Chromium (VI)adsorbed CeO2/PANI composite
155
Fig. 4.125. Adsorbent dose versus percentage removal of chromium by CeO2/PANI composite. (a) 10 mg/L, (b) 50 mg/L and (c) 100 mg/L
157
Fig. 4.126. Percentage removal of chromium by CeO2/PANI composite. (a) 10 mg/L, (b) 50 mg/L and (c) 100 mg/L
158
Fig. 4.127. Mechanism of chromium (VI) removal by CeO2/PANI composite material 159 Fig. 4.128. Time versus percentage removal of chromium, CeO2/PANI composite with
initial concentration of (a) 10 mg/L, (b) 50 mg/L and (c) 100 mg/L 160
Fig. 4.129. Linear plot of Lagergren rate equation using CeO2/PANI composite, time versus log (qe-q) with initial chromium concentration (a) 10 mg/L (b) 50 mg/L and (c) 100 mg/L
161
Fig. 4.130. Linear plot of Helfferich equation using CeO2/PANI composite, time versus ln[1-U(t)] with initial chromium (VI) concentration of (a)10 mg/L, (b) 50 mg/L and (c) 100 mg/L.
163
Fig. 4.131. Linear plot of second order rate equation using CeO2/PANI composite, time versus t/qt with initial chromium (VI) concentration of 10 mg/L, 50 mg/L and 100 mg/L.
164

xvii
Fig.4.132. Linear plot of Weber-Morris equation using CeO2/PANI composite, square root of time versus qe with initial concentration of (a), 10 mg/L, (b) 50 mg/L and (c) 100 mg/L
166
Fig. 4.133. Effect of temperature on removal of chromium (VI) by CeO2/PANI composite for initial concentration of (a) 10 mg/L, (b) 50 mg/L and (c) 100 mg/L
167
Fig. 4.134. Van’t Hoff plots, log Kc versus 1/T for CeO2/PANI composite, initial chromium (VI) concentration (a) 10 mg/L, (b) 50 mg/L and (c) 100 mg/L
168
Fig. 4.135. Influence of initial chromium (VI) concentration on removal efficiency versus initial chromium (VI) concentration.
170
Fig. 4.136. Langmuir adsorption isotherm, 1/Ce versus 1/qe for CeO2/PANI composite for different pH (a) pH-3, (b) pH-6 and (c) pH-9
171
Fig. 4.137. Freundlich adsorption isotherm, log Ce versus log qe for CeO2/PANI composite for different pH (a) pH-3, (b) pH-6 and (c) pH-9
172
Fig. 4.138. D-R adsorption isotherm, ln qe versus ε2 for CeO2/PANI composite for different pH (a) pH-3, (b) pH-6 and (c) pH-9
174
Fig. 4.139. Percentage removal of chromium (VI) with CeO2/PANI composite versus initial anion concentration of solution (Initial cation concentration of 10 mg/L).
175
Fig. 4.140. Percentage removal of chromium (VI) with CeO2/PANI composite versus initial anion concentration of solution. (Initial cation concentration of 50 mg/L).
175
Fig. 4.141. Percentage removal of chromium (VI) with CeO2/PANI composite versus initial anion concentration of solution (Initial cation concentration of 100 mg/L).
176
Fig. 4.142. (a) Regeneration of CeO2/PANI composite material at different pH and (b) Reusability of CeO2/PANI composite material
177
Fig. 4.143 Source contribution in removal percentage (adjusted sum of squares versus source)
178
Fig. 4.144. 3D plot represents interdependent interaction of dose and pH in removal percentage (b) 3D plot represents interdependent interaction of pH and time in removal percentage
182
Fig. 4.145. (a) 3D plot represents interdependent influence of pH and temperature in removal percentage is presented (b) 3D plot represents interdependent interaction of concentration and pH in removal percentage
182
Fig. 4.146. (a) 3D plot represents interdependent interaction of concentration and time in removal percentage (b) 3D plot represents interdependent interaction of temperature and time in removal percentage
183
Fig. 4.147. (a) 3D plot represents interdependent interaction of temperature and dose in removal percentage (b) 3D plot represents interdependent interaction of concentration and temperature in removal percentage
184
Fig. 4.148. Optimal parametric values obtained for chromium removal by using RSM-CCD
184
Fig. 4.149. Optimum number of neurons in hidden layer 185 Fig. 4.150. Correlation plot of comparison between experimental and predicted data in
ANN and RSM modeling 188
Fig. 4.151. Plot represents the residuals obtained from prediction of ANN and RSM modeling
188
Fig. 4.152. Plot represents error distribution obtained from prediction of ANN and RSM modeling
189
Fig. 4.153. Statistical comparison based on box plot of relative (%) error of ANN and RSM
189

xviii
ABBREVIATIONS, SYMBOLS & NOMENCLATURE
TRIS Hydroxy methyl amino methane TEMED Tetramethylethylenediamine APS Ammonium per sulfate K2Cr2O7 Anhydrous potassium dichromate
AsO43- Arsenate
As2O3 Arsenic Trioxide As2O3 Arsenite AsFeS Arsenopyrite CrO4
2− Chromate Cr2O7
2- Dichromate [Cr (H2O)6]
3+ Hex aqua chromium (III) ion HCl Hydrochloric acid As2S3 Orpiment H3PO4 Phosphoric acid KH2PO4 Potassium dihydrogen phosphate As4S4 Realgar NaOH Sodium Hydroxide
NaBH4 Sodium tetrahydroborate
Ac Activated carbon
ANFIS Adaptive neuro fuzzy interface system ATSDR Agency for Toxic Substances and Disease Registry ANNOVA Analysis of variance ANN Artificial Neural Network AARE Average absolute relative error BP-ANN Back propagation artificial neural network BET Brunauer Emmett Teller Isotherm BLS Bureau of Labor Statistics
CCD Central Composite Design CCRD Central composite rotatable design
CPCB Central Pollution Control Board
CPCB Central Pollution Control Board CeHAHCl Cerium oxide Hydroxylamine Hydrochloride CHC Coconut husk carbon
CCC-R Cross Correlation Coefficient DTA Differential thermal analysis DMA Dimethyl arsenic acid
EDAX/EDX Energy dispersive spectroscopy EPA Environmental Protection Agency Fe-SEM Field-emission scanning electron microscopy FAAS Flame atomic absorption spectrometric FTIR Fourier transmission infra-red spectroscopy GP Genetic programing GAc Granular activated carbon
HR-TEM High resolution transmission electron microscopy HG-AAS Hydride generation atomic absorption spectrometric HG Hydride generation of atomic adsorption spectroscopy IEC Ion exchange capacity LaDEA Lanthanum Diethanolamine LDH Layered Double Hydroxide
LSSVM Least square support vector machine MTZ Mass transfer zone MATLAB Matrix laboratory MSE Mean square error

xix
MF Microfiltration Traingdm Momentum back propagation MMA Monomethylarsonic acid
NF Nanofiltration nZVI Nanoscale zero-valent iron
NIOSH National Institute for Occupational Safety and Health
OSHA Occupational Safety and Health Administration
ppb Parts per billion ppm Parts per million POP Persistent organic pollutants
PAH Polycyclic aromatic hydrocarbons
PTEF Polytetrafluoroethylene
RO Reverse osmosis rpm Rotation per minute SAED Selected area diffraction SLM Supported liquid membrane
TANSIG Tangent sigmoid transfer TGA Thermo gravimetric analysis TGA-DSC Thermogravimetric analysis- Differential scanning calorimetry TMAO Trimethylarsine
TBP Tri-n-butyl phosphate
UF Ultrafiltration USEPA United States Environmental Protection Agency
VOC Volatile organic compounds
WHO World health organization
WHO World Health Organization XRD X-ray diffraction spectroscopy ZPC Zero point surface charge ZrO-EA Zirconium Ethanolamine ZrPACM Zirconium Polyacrylamide qo Adsorption capacity No Adsorption capacity (mg/L) Q Adsorption capacity obtained from column mode n Adsorption intensity K Adsorption rate constant α Alpha V Approaching velocity K2 Backward rate constant X Bed height β Beta b Binding energy constant ϰ2 Chi square R2 Coefficient of determination Opb Computed output C Constant K Constant related to adsorption energy Δ Delta DR Dubinin isotherm Ceff Effluent concentration ΔH Enthalpy ΔS Entropy ε Epsilon η Eta Yactual, i Experimental value Kad First order adsorption rate constant f Flow rate

xx
K1 Forward rate constant Kf Freundlich adsorption constant γ Gamma ΔG Gibbs Free Energy g Gram K’ Helfferich overall constant h Hour C0 Initial concentration I Input Kp Intraparticle diffusion rate constant K Kelvin Kg Kilogram λ Lambda L Liter m Mass Xmax Maximum qe Maximum adsorption capacity M Mean E Mean free energy µm Micro meter Mg Milligram Mg/g Milligram per gram Mg/Kg Milligram per kilogram Mg/L Milligram per liter
mL Milliliter Xmin Minimum m Molarity µ Mu nm Nano meter Xnorm Normalization ν Nu N Number of experiments O Output EP Pattern ‘p’ ε Polanyi potential Ymodel,i Predicted value SEM Scanning Electron Microscopy K2 (g/mg/min) Second order rate constant ∑ Sigma f Sigmoid transfer function σ Standard deviation Dpb Target output T Temperature θ Theta 3D Three dimensional t Time R Universal gas constant V Volume W Weight

INTRODUCTION 2014
1 | P a g e
CHAPTER –1
1. INTRODUCTION
Throughout the world, the conflict between the demand of fresh water, energy and food are
increasing and their effects on the environment have profound impact on ecology and ultimately on
humanity. There is an urgent requirement to fill the gap between demand and supply of water,
energy and food. The world’s population is increasing in a steady state and is projected to be more
than nine billion but the global economy is expected to be three times larger by 2050 (Francesconi
et al., 2013). It is definite that larger and higher population needs more food & energy for which
consumption of water will be more. Hence, it requires a better management of the demand and
supply of water, food and energy.
The management of food and energy always links to water, which has a multidimensional
uses. The problems become more complex in the places where they are mostly exposed to
climatic change. So it is necessary to develop practically relevant and easy to use frame work and
technology that allows general insights across the globe (Santra et al., 2013). It is obvious that out
of the three important parameters, water is most important as it controls the activity of other two
parameters. Hence, water is the focus of today, tomorrow and future.
There are many water problems in the world today in terms of both quality and quantity.
The overall distribution of water around the world creates more problems.Though two-third of
available water covers the eearth’s surface, only less than 1% of freshwater is present in streams
and lakes and over 97% present in the oceans (Smedley et al., 2002). Water is also present in the
atmosphere in the form of vapor, solids in the form of ice caps and as groundwater in aquifers
(water-bearing rocks) deep underground (Raghunath, 1987). Water has many significant
properties. It is occasionally referred to as ‘the universal solvent”, freely dissolving a broad range of
chemical constituents (USGS, 2014). It also acts as a fluid medium easing the diffusion of un-
dissolved particulate matter. The Leonardo da Vinci quote says, ‘Water is the driving force of all
nature’. This is a fact about the water resources and its properties but the quality of water is
degrading day by day and if these processes continue then water cannot be used any more for the
purpose where it is needed (Daus et al., 2004). So it is important to limit the use, which provides
the basis for deciding the most relevant indicator of quality. Water quality cannot be decided in
isolation to water quantity specially where there is an increase in the water quantity due to flood.
During flood, the ground water is strongly affected and this polluted water is available for drinking
purpose. Similarly at the time of drought, the concentration of all compounds increases and makes
water unsuitable for drinking. There is clear cut criticism in terms of water quality in developed,
developing and underdeveloped countries. There is also criticism in terms of quality in urban and
rural areas (Gessner et al., 2014).
Requirement of fresh water is everybody’s cup of tea for livelihood. The main sources of
water are river, lakes and ground water. Some countries uses sea water as a source of water but

INTRODUCTION 2014
2 | P a g e
converting sea water into usable water is a very costly affair that requires proven technology. It is
because of the indiscriminate release of industrial and other contaminated water to river and lakes,
water from these sources are becoming more polluted and unsuitable for use without any
treatment (Gessner et al., 2014; Hossain et al., 2013). So water is used from these sources
especially in urban areas as they have the advanced facilities of treatment. But, in rural areas there
is no water purification facility, so people living in rural areas either consumes water without
purification or purify water through household treatment process (Iacob et al., 2013). The water
from underground are considered as the purified form water and as results they are being used as
one of the important source.
The world’s ground water abstraction was estimated at approximately 1000 Km3 per year in
2010, out of which irrigation uses 67%, domestic uses 22% and industries uses 11 %. The global
ground water abstraction rate continues to increase at a rate of 1 to 2% per year (Mehta et al.,
2014). Almost 72% of global ground water abstraction takes place in just ten countries, in order
from the largest consumer: India, China, US, Iran, Pakistan, Bangladesh, Saudi Arabia, Mexico,
Indonesia and Italy (Saravanane et al., 2014). The abstraction of ground water is thought to
account for around 26% of total global water withdrawals and around 8% of average aquifer
recharge. Around 2 billion people world-wide depend on ground water supplies, including 1.2 - 1.5
billion rural households in continents like Africa and Asia. In most of the developing countries,
these percentages are reversed. India receives about 1400-1800 mm rain fall annually
(Saravanane et al., 2001). An analysis carried out in the year 2008 revealed that 80% of available
water in India is polluted. In this contrast of the situation, several major steps are being taken to
control water pollution but it is not sufficient in terms of its magnitude (Bassi et al., 2014). It is
expected that increasing population are going to place water under stress. Almost all Indian cities
face chronic water shortage during summer season. Government agencies in India are regularly
failing to meet the demands of rising urban population (Matos et al., 2013). The water table is
falling all the time low due to over extraction from ground water, and rivers and other major sources
of water bodies (Hossain et al., 2014; Ahuja et al., 2014; Gad et al., 2014).
Water in the earth biosphere is used and reused again and again which is called the water
cycle. Continuous flow of water on, above and below the Earth surface is phenomena of water
cycle. In this process, the quantity of water on Earth remains almost constant. The movement of
water from one reservoir to another occurs by some physical routes like evaporation,
condensation, precipitation, runoff, permeation and subsurface flow. During this processes, the
water passes through different phases of solid, liquid and gas. Exchange of energy takes place
during the phase change process that leads to temperature changes. These heat exchanges
influences the climate to a greater extent (Søgaard, 2014).
Water purification and collection of fresh water in the land takes place during the
evaporative phase of the water cycle. Most life system and ecosystems on the planet are properly
maintained by the water cycle (Søgaard, 2014; Bajpai, 2014). The biosphere has used all the
chemical elements on the periodic table to discharge the major biochemical functions at early

INTRODUCTION 2014
3 | P a g e
stages of evolution. As a result, many elements in different doses are required for viability. When
essential elements are insufficient, viability of the organism is in danger, but when it is higher than
the requirement, viability is again in danger because of toxicity (Gomes et al., 2014; Młyniec et al.,
2014). The natural biogeochemical cycles of the metals have been greatly perturbed by human
intervention (Daus et al., 2004). Mining and metallurgy are not new developments; they extend
back to the Bronze Age but the scale of metals extraction has increased enormously since the
industrial revolution (Mohan et al., 2007). The most common heavy metals are iron, maganese,
lead, mercury, arsenic, chromium, zinc, copper and others (Fergusson, 1990). Heavy metals occur
naturally in drinking water sources as well as results from human activities. The knowledge is
incomplete for many heavy metals especially with regards to the impact of high level on human
health when ingested through drinking water.
Among the various heavy metals, Arsenic (III) and Chromium (VI) are well-known toxic
metal that is considered as significant pollutant in drinking water. The effects and chemistry of
these two metals are well studied. Arsenic poisoning in natural drinking water acquire a severe
threat to millions of people in many regions of the world such as India, Bangladesh, Nepal,
Myanmar, Cambodia, China, United States and Thailand (Wang and Mulligan, 2006). The
contamination of ground water by arsenic is a major environmental problem in the state of West
Bengal, Assam and few parts of Odisha in India territory (Kapaj et al., 2006; Garelick et al., 2008).
Arsenic is easily reduced from arsenic (V) to arsenic (III) oxidation state. Arsenic (III)
(arsenite AsO33-) is more toxic than arsenic (V) (arsenate, AsO4
3-), probably because it binds more
readily to sulfhydryl groups of proteins (Aposhian et al., 1989). Indeed, the toxicity of arsenic (V)
probably results from its reduction to arsenic (III) in the body. The mechanism of toxicity is
uncertain, but results suggest that methylation of arsenic (III) processes similar to mercury
methylation and releases products that are highly reactive which damages the DNA, at least in
cultured human cells. As reported, the glucocorticoid receptors are inhibited due to lower level of
arsenic. Arsenic causes to affect the human health in the form of diabetes and cancer (Choong et
al., 2007). The poisonous properties of arsenic compounds have been known and exploited late
since antiquity, but is in the turn of twenty first century that has witnessed inadvertent arsenic
poisoning in mass scale. Ironically the problem grew out of a United Nations sponsored effect,
starting in the late 1960s, to provide clean drinking water by sinking tube wells into the shallow
aquifer that underlies the region. The effort is undertaken to reduce health effects by reducing the
incidence of water borne diseases. However the high arsenic content of the reservoir went
unrecognized for many years. As many as half of the 4 million tube wells draw water that exceed
the Bangladesh arsenic standard 50 ppb (Daus et al., 2004; Polizzotto et al., 2013).
Like arsenic, chromium is also a significant toxic metals which is discharged with effluents
of industries like electronics, electroplating, metallurgical, leather tanning (Tahir et al., 2007) wood
preservatives and others (Vinodhini et al., 2010). Some of diseases like epigastria pain, vomiting,
nausea, severe diarrhea and cancer in the digestive lungs and tract, allergic skin irritations,
dermatitis, irritation etc. (Saçmac et al., 2012) are caused due to the over exposure to chromium.

INTRODUCTION 2014
4 | P a g e
Chromium occurs in a variety of foods in the form of a complex with nicotinic acid and possibly
glycine, glutamic acid and cysteine. Chromium in the complex form is termed ‘glucose tolerance
factor’ is absorbed better than in inorganic form. Both the trivalent and hexavalent chromium forms
are biologically important. Chromium (VI) is far more toxic than chromium (III) (Ashraf et al., 2010).
Chromium concentration in potable water supplies varies from 0.002 to 0.1 ppm and in rain water it
is about 0.003 ppm. The chromium limit is 0.005 ppm for domestic water supply (USEPA, 2011)
due to its high toxicity.
Many methods and techniques have been documented for removal of these toxic metals
from water such as coagulation, oxidation/reduction, precipitation, electrolysis, ion exchange and
reverse osmosis (Nataraj et al., 2009; Kim et al., 2006). Most of these methods are very common
but not very popular due to various limitations (Sharma and Sohn, 2009). Apart from the many
advanced technologies for water purification, adsorption is a fast, cost effective and universal
method. Adsorption processes are widely used for purification and separation process because of
reliability, technical maturity, energy efficiency, design flexibility and having the capacity to
regenerate the exhausted adsorbent. Adsorption is integral to a broad spectrum of physical,
biological, and chemical processes and operations in the environmental field. However adsorbent
is the heart of the adsorption process. Activated carbons have been the most researched
adsorbent material for waste water treatment in 21st century (Valix et al., 2006). However, the
suitability of any adsorbent depends on the: adsorption capacity, selectivity, regeneration ability,
kinetics, compatibility and operation cost. Based on this, the development of adsorbents with low
cost is an interesting research field to explore. There are many materials which can be used as
adsorbent: Inorganic, organic, polymers, hybrid material, composite etc. Thus, in this thesis few
new hybrid materials are synthesized and used for the removal of As (III) and Cr (VI).
Hybrid materials refer to materials consisting of both organic and inorganic components
that are intimately mixed but are not a mere mixture (Sanchez et al., 1999; Larraza et al., 2012).
These materials do not exhibit the individual property but the properties improvement occurs due to
effective interaction between the components forming resultant material. The hybrid material exist
from very old days but the term hybrid materials has come to limelight only after the development
of soft chemistry techniques such as sol- gel chemistry in the 1980s (Romero and Sanchez, 2004).
The most noticeable advantage of inorganic–organic hybrid material is that they can satisfactorily
combine with dissimilar properties and form one material. However every process has some
limitations, the major limitations of adsorption process are (Sanchez, 1991; Schottner, 2001;
Romero and Sanchez, 2004),
• The capacity of adsorbent gradually decreases with increase in number of cycles
• Regeneration of adsorbent requires a special process.
• Relatively high capital cost.
• Prefiltration is essential to remove any particles capable of choking the adsorbent bed.
• Consumed adsorbent may be considered a harmful waste.

INTRODUCTION 2014
5 | P a g e
Since twenty first century, hybrid materials and composites shows a significant role in water
purification and removal of toxic heavy metal ions from contaminated water.
However, the choice of suitable process and material is very important for arsenic and chromium
removal. The most important issue for an environmental process is the parametric appraisal of the
method and subsequently improvement through modelling and optimization without incurring extra
cost (Shanmugaprakash et al., 2013). Mathematical models are perhaps the most important
subject of interest today for optimization and prediction of process behaviour. These models do not
look like their real-life counterparts at all. Basically, mathematical models are designed using
numbers and functions that can be easily transformed into equations and formulas. Further by
utilizing simple techniques such as multiplication, addition, matrix algebra or Gaussian elimination,
the user can solve the mathematical model (search for an optimal solution). Mathematical models
can be categorized based on application type and purpose of use such as optimization,
deterministic and specific (Mitra et al., 2014). Descriptive models are utilized to simply define
somewhat mathematically. For example, a statistical model includes the mean, median, maximum,
minimum, range and standard deviation. Similarly, optimization models are used to find an optimal
solution. Deterministic models are particularly for which the value of their variables is known with
certainty. Models that have values that are not known with certainty are known as probabilistic
models. The term specific models apply to only one condition or model having unique feature. The
advantage and disadvantage of using models are listed below.
Advantages:
1. To show realistic phenomenon adequately and gives flexibility in manipulating wide number
of data to understand the process and system.
2. To solve a particular problem by removing unimportant data to find an accurate solution.
3. Models are easy to use and less costly than dealing with the actual situation.
4. Model indicates areas where additional information is needed to establish and quantify
information.
5. Models improve understanding of the problem with a logical approach.
6. Models provide standardized format after analysis a problem for very specific objectives.
7. Models provide the most effective solution for predicting performance.
Disadvantages:
1. Model development and model solution are not completely separable.
2. A large number of data to establish the accurate relation between the input and output data.
The non-linear behavior and profound impact of these parameters on prediction and optimization of
removal efficiency of arsenic and chromium make researchers to use modelling approaches
(Shojaeimehr et al., 2014). On the basis of above facts it is thought worthwhile to use modelling
approaches to study the removal process. Modelling of such process by artificial neural network
(ANN) and response surface methodology (RSM) has made it easy to understand the influence of
different variables affecting the removal of these ions from water (Daneshvar et al., 2006; Bhatti et
al., 2011; Cho et al., 2011; Geyikçia et al., 2012; Fan et al., 2013; Witek-Krowiak et al., 2014). The

INTRODUCTION 2014
6 | P a g e
data are used to predict the removal efficiency accurately which are verified by actual experimental
results.
An attempt has been made in this study to evaluate the adsorption efficiency of few new
adsorbents by batch and column mode in the laboratory scale for removal of arsenic and chromium
from synthetic and field water samples. The adsorbent materials are characterized before and after
adsorption by SEM, FE-SEM, EDX, FTIR, XRD, TGA-DTA/DSC and BET techniques. The
mechanism of the process is ascertained from the data of kinetic, thermodynamics, isotherm and
adsorption studies in batch mode. The regeneration and reusability of the materials are studied
extensively and adsorption capacities are compared with available materials. Finally the
experimental data are used for testing and predicting by training with artificial neural network and
response surface methodology.

LITERATURE REVIEW
7 | P a g e
2014
CHAPTER-2
2. LITERATURE REVIEW
The scientific development of today is because of research many years ago. The progress
of tomorrow will be the result of research planned today. The knowledge and idea of related
literature of the past research is very much essential for any research today, which is not only the
guiding force but also provides sound knowledge to understand the science during the
development of research. New areas of research can be generated from literature. The review of
literature related to the present research work is organized and presented as follows.
2.1. Pollutant
A pollutant is a material or energy introduced into the environment that adversely affects
the usefulness of a resource. A substance which alters the stability of environment is known as
pollution. Though the division of pollution occurs into different types such as air, water, land etc.
but as preferres by some scientists that every pollutant tends to end up in the water. Pollution due
to presence of heavy metals, volatile organic compounds (VOC), polycyclic aromatic hydrocarbons
(PAH), persistent organic pollutants (POP) and xenobiotic etc. are more on focus. In this chapter,
heavy metals and their effects are presented.
2.1.1. Heavy metals
Heavy metals are the elements having their atomic weights within the range of 63.5 and
200.6 and a specific gravity higher than 5.0 (Srivastava and Majumder, 2008). The common heavy
metals/metalloids such as chromium, cobalt, copper, zinc, selenium, silver, arsenic, cadmium,
mercury, antimony, thallium and lead are the major pollutants of water. They have the potential to
damage human functioning and other biological systems when present in excess (Merrill et al.,
2007). They cannot be degraded or destroyed and enter into the environment by three ways: (1)
deposition of atmospheric particulates, (2) disposal of metal and metalloid enriched sewage
sledges and effluents, and (3) by-product from metal mining and other metal ore processing
industries (Becker et al., 2014). The other sources are from the use of pesticides and fertilizers
(Sengupta et al., 1991; Neeraja et al., 2012). Due to the high stability, non-biodegradability and
perseverance nature, these metals enters to food chain and causes significant threat to all living
organism (Polizzotto et al., 2013; Francesconi et al., 2013).
2.1.2. Arsenic and chromium
2.1.2.1. Arsenic
Arsenic (As) is a crystalline solid metalloid bearing silver-grey color and brittle in nature. It
possesses atomic number 33, atomic weight 74.92 g/mol, specific gravity 5.73 with melting point
817 oC (at 28 atm), boiling point 613 oC and vapour pressure 1mm Hg at 372 °C. Arsenic occupies
20th position in natural abundance list (about 0.00005% of the earth’s crust), 14th in the seawater,
and 12th in the human body. Mostly inorganic arsenic compounds are found in combination with
oxygen, chlorine, and sulfur (Mohan and Pittman Jr. 2007; Mukherjee et al., 2014). Since the
isolation of this element by Albertus Magnus has been a constant centre of dispute. (Mandal and

LITERATURE REVIEW
8 | P a g e
2014
Suzuki, 2002). The USEPA (USEPA, 2011) and WHO (WHO, 2010) have lowered the maximum
permissible level of arsenic to 10 μg/L from 50 ppb because of its toxicity. Arsenic in the range of
0.5 to 2.5 mg/kg is found in rocks (Mandal and Suzuki, 2002) and exist in the oxidation states of
−3, 0, +3 and +5 (Smedley and Kinniburgh, 2002) in the form of arsenious acids, arsenic acids,
arsenites, arsenates, monomethylarsonic acid (MMA), dimethyl arsenic acid (DMA), trimethylarsine
(TMAO), and arsine etc. Arsenic is highly sensitive towards mobilization at pH 3.5 - 8.5 under both
reducing and oxidizing environment (Smedley and Kinniburgh, 2002). Both arsenite (AsO33-) and
arsenate (AsO43-) in their forms As (III) and As (V) are common in natural waters. (Ranjan et al.,
2009). The important inorganic As (III) species are H3AsO3°, H2AsO3-,HAsO3
2-,AsO33-and As(V)
species are H3AsO4°, H2AsO4-, HAsO4
2-, AsO43-. Successive hydrolysis reactions produces these
ions as represented in Fig. 2.1. The pKa1 of 9.22 for this reaction indicates that there would be
approximately equal amounts of H3AsO3° and H2AsO3- in solution at pH 9.22. Therefore, at pH <
9.22, H3AsO3° is the dominant species and H2AsO3- is the dominant species in solution at pH >
9.22. The dominant inorganic As(V) species in solution are H2AsO4- and HAsO3
2- at at pH < 7 and
> 7, respectively.
H3AsO3° → H+ + H2AsO3- (pKa1 = 9.22)
H2AsO3- → H+ + HAsO32- (pKa2 = 12.13)
HAsO32-→ H+ + AsO3
3- (pKa3 = 13.4)
H3AsO4° →H+ + H2AsO4- (pKa4 = 2.2)
H2AsO4-→ H+ + HAsO3
2- (pKa5 = 6.97)
HAsO42- → H+ + AsO3
3- (pKa6 = 11.53)
Fig. 2.1. Plot represents the summary of pH impact on prevalence of the various inorganic arsenic
(III) and arsenic (V) species in solution (Nieto-Delgado et al., 2012; Douglas et al., 1986)
The Fig. 2.1 represents the influence of pH which indicates, As (V) predominate in oxygen rich
aerobic environments but in reducing anaerobic environments arsenites As (III) predomination.
As(III) is more toxic than As(V) as it binds singly but with higher affinity to vicinal sulfhydryl groups
that reacts with a variety of proteins and inhibits their activity (Aposhian et al., 1989). Arsenic (III) is
more stable than arsenic (V) because of electronic configuration.

LITERATURE REVIEW
9 | P a g e
2014
2.1.2.2. Chromium
Chromium (Cr) is a hard crystalline steel-grey metal with lusture. It bears atomic number
24, atomic weight 51.99 g/mol; specific gravity 7.18 to 7.20; melting point 1857 0C and boiling point
2672 0C and earth's 21st most abundant element (0.037% of earth's crust), the 6th most abundant
transition metal (Lay et al., 2014; Saha et al., 2011). The first discovery of chromium was in the
Siberian red lead ore (crocoite) by the French chemist Vauquelin in 1798. The Chromium exhibits a
wide range of oxidation states; the +3 and +6 states are most common, whereas its other states
like +1, +4 and +5 are rarely found. However, Cr(VI) is the most toxic form of chromium, which
exist as chromate (CrO42-) or dichromate (Cr2O7
2-) oxyanions (Kabay et al., 2003). Cr(III) is less
mobile and less toxic with most tracing in organic matter of soil and aquatic environments (Chen et
al., 2011). The hydrolysis behavior of Cr(III) is complicated, which produces mononuclear species
like CrOH2+, Cr(OH)2+, Cr(OH)4
-, and Cr(OH)3 and the poly-nuclear species Cr2(OH)2 and neutral
species Cr3(OH)4. On the other hand, hydrolysis of Cr (VI) only produces neutral and anionic
species. At pH less than 6.5 and high chromium concentration; Cr2O72- predominates, whereas at
pH greater than 6.5, CrO42- predominates (Saçmac et al., 2012). Cr(VI) compounds are powerful
oxidants at low or neutral pH which exist in equilibrium as represented:
2[CrO4]2- + 2H+ → [Cr2O7] + H2O
HCrO4-↔CrO4
2- + H+, (PKa =5.9)
2HCrO4−↔ Cr2O7
2− + H2O (PKa= 2.2)
H2CrO4 ↔ [HCrO4]− + H+ (PKa =1.6)
[HCr2O7]− ↔ [Cr2O7]
2− + H+ (pKa = 1.8)
The compounds of Chromium (VI) are found to be six hundred times toxic than chromium (III)
because of its high solubility and mobility in water (Fig. 2.2).
Fig. 2.2. Relative distribution summarizes the pH impact on prevalence of the various chromium
species in solution (Kotaś and Stasicka, 2000).
2.1.3. Sources of arsenic and chromium
2.1.3.1. Sources of arsenic
About 200 natural minerals are found to contain arsenic. Arsenic is mobilized under natural
conditions like natural weathering reactions, geochemical reactions, volcanic emissions and other
biological anthropogenic activities (Dogan and Dogan, 2007). Inorganic arsenic is of geological

LITERATURE REVIEW
10 | P a g e
2014
origin and is mostly found in groundwater. The compounds like arsenobetaine, arsenocholine,
tetramethylarsonium salts, arsenosugars and arsenic-containing lipids are arsenic containing
organic compounds (Simon et al., 2004). Approximately 612×108 and 2380×108 g/year of arsenic
contribution is from soil erosion and leaching of arsenic respectively. Inorganic arsenic are derived
from rocks like arsenic trioxide (As2O3), orpiment (As2S3), arsenopyrite (AsFeS) and realgar (As4S4)
(Smedley and Kinniburgh, 2002). 70% of arsenic sources are due to extensive mining activities
and smelting of copper, gold, lead and zinc ores. Other sources include fossil fuels combustion,
use of arsenic pesticides, herbicides and crop desiccants and usage of arsenic trioxide in wood
preservative (Smith et al., 2000; Mukherjee et al., 2014). To increase the hardness, metallic
arsenic is processed along with lead or copper alloys. The arsenic gas (AsH3) is widely used in
microchip production. [Cu3(AsO4)2.4H2O] is essential components of pesticide. Other arsenic
compounds are applied in glass processing, chemical industries, semiconductor (Garelick et al.,
2008), pigments (paints, papers, ceramics, etc.), bullets and fireworks.
2.1.3.2. Sources of chromium
Chromium is used as an oxidizing agent, chrome alloys, anti-corrosive agents, in paints
and pigments, fungicides, electroplating, manufacturing of photography plates and other products
of the chemical and steel industries. Chromium is discharged to environment primarily from
naturally occurring element in rocks, volcanic dust, and other living and non living things. The other
sources are mainly from industrial activities such as chrome plating, ferrochrome production,
stainless-steel production, ore refinery, chemical and refractory processes, cement-producing
plants, automobile brake lining and catalytic converters for automobiles, leather tanneries,
contaminated landfill, effluents released from chemical plants, asbestos lining erosion, and chrome
pigments (Rosane Alves et al., 2012). Fuel and oil combustion are reported for emission of
atmospheric chromium. Chrome-plating in the form of chromium (VI) are responsible for release of
Cr(VI) (ATSDR, 1998; WHO 1988; USEPA, 1999; OSHA, 1998).
2.1.4. Exposure of arsenic and chromium
2.1.4.1. Exposure of arsenic
The exposure of arsenic to humans is primarily via drinking water, air, food and beverage
naturally and considered as an essential nutrient for protein and fat metabolism (Ahuja et al., 2014;
ATSDR 1998; USEPA 1999; NIOSH, 1997). In some areas, inorganic arsenic in drinking-water is a
significant cause of arsenic exposure to human health (Amiri et al., 2004). Contaminated soils by
mining are also a possible source of arsenic exposure (Dousova et al., 2003). As reported by
Santra et al. (2013) approximately 25% of the arsenic found in food is in inorganic form. The
amount of inorganic arsenic levels in fish and shellfish are around 1% (Santra et al., 2013; Tao et
al., 2014). Other food items such as cereals, meat, poultry and dairy products have higher levels of
inorganic arsenic (Tao et al., 2014).
2.1.4.2. Exposure of chromium
Industrial exposure to Cr (VI) and Cr (III) is due to inhalation of dusts, mists or fumes,
contaminated drinking water or from eye or skin contact (Tepe et al., 2014). The exposure of skin
to chromium in the workplace has become a significant problem in the US (Abbasi et al., 2012).

LITERATURE REVIEW
11 | P a g e
2014
34,400 cases of skin diseases, 3.4 injuries per 10,000 employees, compared to 19,300 respiratory
illnesses (1.9 illnesses per 10,000 employees) is reported due to chromium in a specific industries
(Abbasi et al., 2012, BLS 2010). For non volatile chemicals, skin becomes the most significant
exposure route than the lungs (Berner et al., 2004).
2.1.5. Toxicity and health effects of arsenic and chromium
Heavy metal ions are the most critical water pollutants due to their toxicity, which depends
on the oxidation states as it controls the physico-chemical and biological activities (Desesso et al.,
1998). The toxicity of arsenic (III) is greater than the toxicity of arsenic (V) (Norwood et al., 2007).
The provisional guideline by WHO presents 10 ppb (0.01 mg/L) as adopted drinking water
standard. Countries including Bangladesh and China have retained 50 ppb (0.05 mg/L) as an
interim target (Desesso et al., 1998). On the other hand, chromium (III) is an essential nutrient
while chromium (VI) is carcinogenic and mutagenic agent (Fergusson, 1990).
2.1.5.1. Toxicity and health effects of arsenic
The acute toxicity and harmful effects of arsenic on health has been well documented
followed by techniques used for speciation analysis. (Vatutsina et al., 2007, Jain et al., 2000 and
WHO, 2010, Jain et al., 2000). Long term ingestion of water containing arsenic causes skin,
cardiovascular diseases, kidney cancer as well as pigmentation changes, skin thickening
(hyperkeratosis), neurological disorders, muscular weakness, and nausea (Mazumder, 2007;
Kapaj et al., 2006; Ruangwises et al., 2014). Fig. 2.3 represents effect of arsenic toxicity. Toxicity
of inorganic arsenic compounds is higher than organic arsenic compounds (Sharma et al., 2009).
Arsenic toxicity is known to inhibit with sulfhydryl groups in cells and hence plants those are not
tolerant to arsenic shows toxic symptoms such as a decrease in plant growth, plasmolysis, wilting
and necrosis of leaf tips, and decrease in photosynthetic capacity. It also causes the risk of other
internal cancers with arsenic exposure (liver, kidney, lung, colon, and bladder) (Liu et al., 2014).
Fig. 2.3. Skin diseases due to arsenic poisoning
2.1.5.2. Toxicity and health effects of chromium
Hexavalent chromium compounds are man-made and is widely used in different industries
and exposure to it occurs through breathing, food or water ingestion and through direct contact
with the skin. The maximum permissible limit for Cr (VI) for discharge into inland surface water is
0.1 mg/L and in potable water it is 0.05 mg/L (USEPA, 2011). The ingestion of excessive chromium
causes vomiting, diarrhoea, haemorrhagic diathesis, blood loss into the gastrointestinal tract
causing cardiovascular shock (Sun et al., 2014; Tao et al., 2014). It also causes primary irritation of

LITERATURE REVIEW
12 | P a g e
2014
the skin and mucous membranes, liver problems (elevated hepatic enzymes), thrombocytopenia
(low blood platelets), renal failure (kidney failure), rhabdomyolysis (breakdown of muscle fibres that
can lead to kidney damage), haemolysis (breakdown of red blood cells), changes in thought
processes, chest pain, gastrointestinal disorders, erythema/flushing/rash, headache, dizziness,
bronchial asthma (ATSDR, 2000). In contrast to Cr (III), which is bound to plasma proteins such as
transferrin but Cr (VI) entering the blood stream is taken up selectively by erythrocytes and bound
predominantly to haemoglobin (Fig. 2.5). Chromium compounds are highly toxic to plants and are
detrimental to their growth and development. (Qiu et al., 2013; Proctor et al., 2014).
Fig. 2.4. Effect of chromium poisoning in drinking water Source: (U.S. EPA Guidelines for
Carcinogen Risk Assessment, 2011)
Fig. 2.5. Mechanism and influence of chromium in cell (Correia et al., 1994, USEPA, 1999)
Chromium toxicity in plants is observed at multiple levels, from reduced yield through
effects on leaf and root growth that also inhibits enzymatic activities and mutagenesis (Obrien et
al., 2000). While some investigators (Gad et al., 2014) have reported that the hexavalent chromium
is a potent teratogen, primarily affecting the bone formation (Choppala et al., 2013). Chromium (VI)
is a strong clastogen (Choppala et al., 2013) and produces chromosome aberrations and DNA
strand breaks, oxidized base damage to DNA-DNA and DNA-protein crosslinks (Choppala et al.,
2013).
2.1.6. Global scenario
More than 100 million people are exposed to heavy metal pollution above the permissible
limit (Vineis et al., 2009) (Fig.2.6). Many nations of the world are facing the ill consequences of
excess arsenic and chromium exposure (USEPA, 1999; Smith et al., 2009). In India, Bangladesh
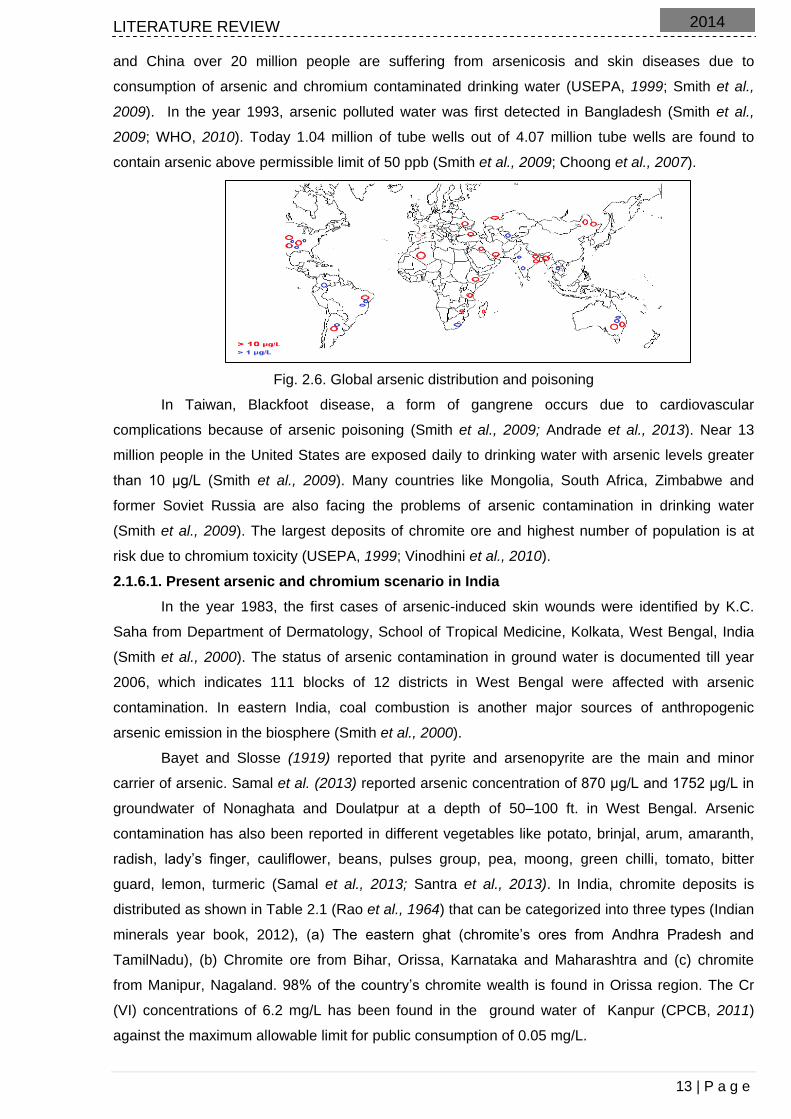
LITERATURE REVIEW
13 | P a g e
2014
and China over 20 million people are suffering from arsenicosis and skin diseases due to
consumption of arsenic and chromium contaminated drinking water (USEPA, 1999; Smith et al.,
2009). In the year 1993, arsenic polluted water was first detected in Bangladesh (Smith et al.,
2009; WHO, 2010). Today 1.04 million of tube wells out of 4.07 million tube wells are found to
contain arsenic above permissible limit of 50 ppb (Smith et al., 2009; Choong et al., 2007).
Fig. 2.6. Global arsenic distribution and poisoning
In Taiwan, Blackfoot disease, a form of gangrene occurs due to cardiovascular
complications because of arsenic poisoning (Smith et al., 2009; Andrade et al., 2013). Near 13
million people in the United States are exposed daily to drinking water with arsenic levels greater
than 10 μg/L (Smith et al., 2009). Many countries like Mongolia, South Africa, Zimbabwe and
former Soviet Russia are also facing the problems of arsenic contamination in drinking water
(Smith et al., 2009). The largest deposits of chromite ore and highest number of population is at
risk due to chromium toxicity (USEPA, 1999; Vinodhini et al., 2010).
2.1.6.1. Present arsenic and chromium scenario in India
In the year 1983, the first cases of arsenic-induced skin wounds were identified by K.C.
Saha from Department of Dermatology, School of Tropical Medicine, Kolkata, West Bengal, India
(Smith et al., 2000). The status of arsenic contamination in ground water is documented till year
2006, which indicates 111 blocks of 12 districts in West Bengal were affected with arsenic
contamination. In eastern India, coal combustion is another major sources of anthropogenic
arsenic emission in the biosphere (Smith et al., 2000).
Bayet and Slosse (1919) reported that pyrite and arsenopyrite are the main and minor
carrier of arsenic. Samal et al. (2013) reported arsenic concentration of 870 μg/L and 1752 μg/L in
groundwater of Nonaghata and Doulatpur at a depth of 50–100 ft. in West Bengal. Arsenic
contamination has also been reported in different vegetables like potato, brinjal, arum, amaranth,
radish, lady’s finger, cauliflower, beans, pulses group, pea, moong, green chilli, tomato, bitter
guard, lemon, turmeric (Samal et al., 2013; Santra et al., 2013). In India, chromite deposits is
distributed as shown in Table 2.1 (Rao et al., 1964) that can be categorized into three types (Indian
minerals year book, 2012), (a) The eastern ghat (chromite’s ores from Andhra Pradesh and
TamilNadu), (b) Chromite ore from Bihar, Orissa, Karnataka and Maharashtra and (c) chromite
from Manipur, Nagaland. 98% of the country’s chromite wealth is found in Orissa region. The Cr
(VI) concentrations of 6.2 mg/L has been found in the ground water of Kanpur (CPCB, 2011)
against the maximum allowable limit for public consumption of 0.05 mg/L.

LITERATURE REVIEW
14 | P a g e
2014
Table - 2.1. Data represents production of chromite in India
Production of chromite in India
State Production in tons Value Rs.
All India 9,26,148 12,24,248
Andhra Pradesh 460 211
Karnataka 48,145 22,173
Maharashtra 86 21
Manipur 92 48
Odisha
Jajpur 6,96,652 10,48,967
Dhenkanal 26,241 24,152
Bhadrak 1,54,472 1,28,676
Total 8,77,365 12,01,795
2.2. Conventional methods for arsenic and chromium treatment in water
It is reported that arsenic and chromium from water can be treated by the processes like
precipitation, ion exchange, reverse osmosis, coagulation, activated alumina, ultra filtration and
adsorption process (García-Vaquero et al., 2014; Rigobello et al., 2013). All this treatment provides
certain advantages over other under some specific conditions but not in all conditions. Methods
and processes are required which can provide better efficiency and performance without
increasing the cost (Ranade and Bhandari, 2014).
2.2.1. Coagulation
Coagulation process is considered to be the most cost effective and documented methods
using FeCl3 and AlCl3 for large scale system (Mondal et al., 2008). In this process, arsenic and
chromium can be controlled through strict control over pH, coagulant type and dosage
(Lakshmanan et al., 2008). The process involves addition of coagulant to the contaminated water
under efficient stirring whereby flocculation occurs. Negatively charged particles and micro
particles are attached to the flocs by electrostatic force of attraction that can be removed by partial
sedimentation and filtration for complete removal of flocs (Qin et al., 2005).
2.2.1.1. Advantage and disadvantage of coagulation technique
Though coagulation is an easy and simple process with handy operation but it also has
some disadvantages (Alexander et al., 2012; Golbaz et al., 2014). The main disadvantages of
coagulation is settling/filtration of the coagulated which require the direct addition of the coagulant
to the water, thus leading to undesirable residual levels of iron or aluminium. Secondly, the process
is highly sensitive to pH therefore appropriate reagents is often added to adjust the pH which
increases the risk of secondary contamination (Fuerstenau et al., 1979).
2.2.2. Chemical oxidation and reduction
In respect of arsenic, most technologies are efficient in removing arsenic (V) in the form of
arsenate but arsenic (III) is found non-charged below pH 9.2. Arsenate is easily precipitated but
arsenite requires conversion via oxidation to arsenate for its effective removal. Under reducing
conditions, arsenite in acid form ionizes according to the equations. (Kartinen and Martin, 1995);
H3AsO
3 → H
+
+ H2AsO
3
-
pKa = 9.22
H2AsO
3
-
→ H+
+ HAsO3
2-
pKa = 12.3

LITERATURE REVIEW
15 | P a g e
2014
Under oxidation, arsenate is strongly dominated over arsenite, based on thermodynamic conditions
(Cullen and Reimer, 1989). Pentavalent arsenic is normally found in water as arsenic acid which
ionizes according to the equations represented below (Kartinen and Martin, 1995):
H3AsO
4 → H
+
+ H2AsO
4
-
pKa = 2.2
H2AsO
4
-
→ H+
+ HAsO4
2-
pKa = 7.08
HAsO4
2-
→ H+
+ AsO4
3-
pKa = 11.5
For arsenite and arsenate, acid-base reactions are assumed to occur rapidly; however, in natural
water, time required for the changes between oxidation states are uncertain. The presence of other
oxidants (manganese oxide, chlorine, permanganate) and in the absence of oxygen, arsenite can
directly transform to arsenate (Onnby et al., 2014). Reduction of hexavalent chromium can be
understood with electrochemical process where iron electrodes and electrical current are used to
generate ferrous ions which react with hexavalent chromium to give trivalent chromium.
3 Fe2+ + CrO42- + 4 H2O → 3 Fe3+ + Cr3+ + 8 OH-
Cr 3+ is precipitated as chromium (III) hydroxide under slightly alkaline conditions .
Cr3+ + 3OH- → Cr (OH)3
Similar oxidation treatment is also done for conversion of chromium (III) to chromium (VI) through
advanced oxidation process such as ozonation and electrocoagulation (Li et al., 2014).
2.2.2.1. Advantage and disadvantage of chemical reduction and oxidation technique
Most of the oxidation is carried atmospherically but the process of oxidation is very slow,
takes several weeks for arsenic oxidation (Bordoloi et al., 2013). On the other hand, Cr(III) is found
less toxic than Cr(VI) but the limitation lies in whether the treated effluent meets the standard
discharging limit. Hence, oxidation of Cr(III) requires high process efficiency. Fast oxidation rate
with strong oxidizing ability is observed in ozonation or electrochemical process with a
disadvantage of energy requirement for the process. (Dittert et al., 2014).
2.2.3. Solvent extraction
The aqueous solution containing the metal of interest is mixed very well with the
appropriate organic solvent and the metal passes into the organic phase (Li et al., 2014). The
extraction efficiency is affected by concentration of heavy metal, initial pH and phase ratio (solvent
to water) (Roh et al., 2000). The extractant used are alcohols, glycols, polyphenols, hydroamic
acids, esters of phosphinic and phosphoric acids, etc. but they are phased out due to high aqueous
solubility. Di-n-pentyl sulphoxide has been evaluated as an extractant for the removal of chromium
(VI), iron (III) and cobalt (II) from aqueous solution (Reddy and Sayi, 1977).
2.2.3.1. Advantage and disadvantage of solvent extraction
This method is simple, convenient and rapid to perform the separation. However, this
method is not as effective for metal separation from dilute solutions due to loss of extractant,
additional phase formation, long separation time, emulsion formation, co-extraction of mineral
acids, and high concentration of extractant requirement and also use of inflammable solvents
(Huang et al., 2009).
2.2.4. Membrane separation

LITERATURE REVIEW
16 | P a g e
2014
A membrane is a thin layer of semi-permeable material that separates substances when a
driving force is applied across the membrane. Membrane filtration processes are progressively
used for removal of bacteria, microorganisms, natural organic material and toxic ions (Guo et al.,
2011). The membrane processes can be classified as (a) microfiltration (MF), (b) ultrafiltration
(UF), (c) nanofiltration (NF) and (d) reverse osmosis (RO). Microfiltration is used with a membrane
having pore size of approximately 0.03 to 10 microns. Similarly, in ultrafiltration membrane has a
pore size of approximately 0.002 to 0.1 microns. Nanofiltration membranes have a nominal pore
size of approximately 0.001 microns. Filtering water through these small membrane pores requires
a higher operation pressure than microfiltration or ultrafiltration technique. The above methods are
suitable for microorganism removal. Reverse osmosis can effectively remove nearly all inorganic
contaminants, heavy metals, toxic ions and natural organic substances from water (Chen et al.,
2012; Nataraj et al., 2009). Reverse osmosis is particularly effective when used in series with
multiple units and successfully demonstrated for the removal of Cr, Pb, Fe, Ni, Cu and Zn from
vehicle wash-rack water (Chakraborty et al., 2014; Guo et al., 2011).
2.2.4.1. Disadvantage of reverse osmosis and other membrane filtration technique
Membrane filtration process is very costly and requires regular maintenance.
High capital and operating costs,
Managing the wastewater is a potential problem,
High level of pretreatment is required in intial cases, and
Membranes are generally prone to fouling.
2.2.5. Adsorption
The attachment of particles to a surface is called adsorption. The substance that adsorbs is
the adsorbate and the underlying material is the adsorbent and desorption is the reverse process
of adsorption. In words of chemical engineering, adsorption is called the separation process during
which specific components of one phase of a fluid are transferred onto the surface of a solid
adsorbent (Deng et al., 2004). The adsorption of various substances on solids is due to the
increased free surface energy of the solids because of their extensive surface area (Brum et al.,
2010). The main advantages of this technique are the reusability of material upto many cycles of
adsorption, low capital cost, selectivity for specific metals of interest, removal of heavy metals from
effluent irrespective of toxicity, short operation time. Molecules and atoms can attach to surfaces in
three different ways.
(a) Physical adsorption (Physisorption): In Physisorption, Vander Waals interaction between the
adsorbate and the substrate takes place for long time but are weak in nature. Moreover, the energy
released during particle physisorption is of the same magnitude as the enthalpy of condensation.
This small enthalpy change is insufficient to lead to bond breaking, so a physisorbed molecule
retains its identity, although it might be disorted by the presence of surface molecules.
(b) Chemical adsorption (Chemisorption): In chemisorption, the molecules stick to the surface by
forming a chemical bond usually a covalent bond, and tend to find sites that maximize their
coordination number with the substrate. The enthalpy of chemisorption is very much higher than

LITERATURE REVIEW
17 | P a g e
2014
that of physisorption, and typical values are in the range of 200 kJ/mol. The distance between the
surface and adsorbate atom is also typically shorter for chemisorption in comparison to
physisorption process.
(c) Electrostatic sorption (Ion exchange): In ion exchange, solid material takes up charged ions
from a solution and release an equivalent amount of other ions into the solution (Inamuddin et al.,
2007). The ability to exchange ions is due to the structural properties of the materials. The
exchanger consists of a matrix, with positive or negative excess charge. This excess charge is
localized in specific locations in the solid structure or in functional groups. The charge of the matrix
is compensated by the counter ions, which can move within the free space of the matrix and can
be replaced by other ions of equal charge sign (Helfferich, 1962). Ion-exchange resins after
saturation can be easily regenerated using acid or alkali. Ion-exchange resins are applicable for
selective ions only. However, in presence of large quantities of competing mono and divalent ions,
efficiency of ion-exchange process decreases. Ion removal by solids could involve more
phenomena like ion exchange and adsorption processes or internal precipitation mechanism
(Inglezakis et al., 2004) simultaneously. Inglezakis et al. (2004) reported the effects of competitive
cations and co-anions on ion exchange of heavy metals Pb 2+, Fe 3+, Cr 3+ and Cu 2+ on clinoptilolite
and found the selectivity of clinoptilolite for heavy metals to be Pb2+> Fe3+ > Cr3+ ≥ Cu2+. Baciocchi
et al. (2005) reported ion exchange equilibrium of arsenic in the presence of high sulphate and
nitrate concentrations.
Studies on the removal of chromium (VI) ions from water are well documented in the
literature. The removal of chromium by adsorption using activated carbon prepared from saw dust,
rice husk, raw rice bran, ethylenediamine-modified rice husk, coconut husk fibres, hazelnut shell
etc are reported. (Huang and Wu, 1977; Tang et al., 2003; Kobya, 2004; Sharma and Forster,
1994; Yu et al., 2003; Wartelle and Marshall, 2005). Similar studies for arsenic removal by
adsorption using various adsorbent are also reported. (Liu et al., 2014; Li et al., 2014; Sigrist et al.,
2014)
2.3. Materials for removal of arsenic and chromium
Removal process of toxic ions from contaminated water and effluent by using various
materials are well documented, however there are always limitations of these process. Few
important materials for As(III) and Cr (VI) removal are presented below.
2.3.1. Phosphate compounds
Synthesis of synthetic phosphate compounds are reported in the last decade for removal of
toxic metal ions (Kowalski et al., 2014; Awual et al., 2011).
Lenoble et al. (2005) reported arsenic (III) and arsenic (V) removal by iron (III) phosphate
(amorphous or crystalline). The oxidation of arsenic (III) takes place by iron (III) and substitution of
phosphate by arsenic (V), that occurs during arsenic adsorption with higher adsorption capacities
for arsenic (III) than arsenic (V).
Zeng et al. (2008) reported arsenic removal from contaminated soil using phosphoric acid
(H3PO4) and potassium dihydrogen phosphate (KH2PO4) in laboratory by batch experiments. The
arsenic toxicity of the soil was reported to reduce by 20% at a concentration of 200 mmol/L.

LITERATURE REVIEW
18 | P a g e
2014
Venkateswaran et al. (2005) reported chromium (VI) ions removal by using flat type supported
liquid membrane (SLM) containing tri-n-butyl phosphate (TBP). The study reported the influence of
pH on the source phase, effect of concentration of the receiving phase, stirring speed, effect of
initial chromium (VI) concentration, feed to strip ratio and the influence of support characteristics.
The permeability of chromium decreases with increase in pH of the source phase and was
maximum at pH 1. Sun et al. (2014) investigated enhanced adsorption of chromium onto activated
carbon (Fig. 2.7) by microwave-assisted H3PO4 mixed with Fe/Al/Mn.
Fig. 2.7. SEM images of (a) activated carbon (AC) (b) AC-Fe (c) AC-Al (d) AC-Mn (Sun et al.,
2014)
The study claimed that with increase in pH the chromium concentration decreases. XPS
analysis result shows that chromium (VI) oxyanion is reduced to chromium (III) at the appropriate
condition.
2.3.2. Activated carbon
The characterization of activated carbon from many carbonaceous sources was first
reported by Allen et al., (1998). Commercially available activated carbons has been extensively
used for arsenic (III), arsenic (V), chromium (III), chromium (VI) and other heavy metals adsorption
from water (Yurum et al., 2014; Babu et al., 2008; Mohan et al., 2006). Coal-derived commercial
activated carbon has shown highest arsenic adsorption capacity of 28.60 mg/g (Hao et al., 2009).
Activated carbon composed with metallic silver/nano silver were also documented in literature for
removal of arsenic and other toxic metal ions from water (Arcibar et al., 2014; Khezami et al.,
2005). Removal of arsenic (III) by using coconut husk carbon (CHC) was reported by Manju et al.
(1998), which was activated with sulfuric acid and copper solution .The resulting copper-
impregnated coconut husk carbon (CuCHC) was used for removal and the maximum adsorption
capacity was found at pH 12. Karnib et al. (2014) reported heavy metals removal (lead, cadmium,
nickel, chromium and zinc) using activated carbon, silica and silica activated carbon composite
from water in batch experiments. The study suggested that highest removal percentages by
activated carbon occured for nickel and decreases as the concentration of heavy metal was
increased.

LITERATURE REVIEW
19 | P a g e
2014
2.3.3. Iron oxides
Němeček et al. (2014) has reported nanoscale zero-valent iron (nZVI) for removal of
hexavalent chromium. Pilot scale remediation study was carried out by using commercially
available nanoscale zero-valent iron (nZVI). Addition of nZVI showed a rapid decrease in the
hexavalent chromium and total chromium concentrations in the groundwater without any
substantial effect on its chemical properties. Sun et al. (2014) reported hexavalent chromium
removal from ground water by using SBA-15-incorporated nanoscale zero-valent iron. The SBA-
15-nanoscale zero-valent iron particles (NZVIs) were prepared by incorporating nZVI inside the
channels of SBA-15 rods by a “two solvents” reduction technique. Chromium (VI) removal takes
place better in lower pH and the removal decreases from 99.7% to 92.8% with the increase in
initial pH of the solution from 5.5 to 9.0.
Graphene based nanoscale zero-valent Iron (nZVI) assembled on magnetic
Fe3O4/graphene was used for chromium (VI) removal (Lv et al., 2014). The study claimed that
these nanocomposites exhibited high Cr(VI) removal efficiency by 83.8% which was found much
higher than individual adsorbents (18.0% for nZVI, 21.6% for Fe3O4 NPs and 23.7% for graphene).
It followed pseudo-second-order adsorption model, suggesting that adsorption is the rate-
controlling step. With decreasing pH from 8.0 to 3.0 at 30 °C, the maximum adsorption capacity of
chromium (VI) varies from 66.2 to 101.0 mg/g. Strong performance of nZVI at magnetic graphene
arises from the formation of micro-nZVI-graphene/nZVI-Fe3O4 batteries and strong adsorption
capability of broad graphene sheet/Fe3O4 surfaces. Electrons are released by nZVI that spreads all
over the surfaces of graphene and Fe3O4, and then the adsorbed Cr(VI) ions on them capture
these floating electrons and reduce to chromium (III). Fe3O4 nanoparticles also serve as protection
shell to prevent nZVI from agglomeration.
2.3.4. Layered double hydroxides (LDHs)
Layered double hydroxides (LDHs) or Hydrotalcite like compounds are lamellar mixed
hydroxides containing positively charged main layers and have been known for over 150 years
since the discovery of the mineral hydrotalcite (Cavani et al., 1991). In current years, many studies
have been carried out in order to understand the ability of LDHs to remove harmful toxic ions such
as arsenate, chromate, phosphate, fluoride etc. from contaminated waters by both surface
adsorption and ion exchange process and other wide range of processes, such as catalysis,
electrochemistry, polymerization, and photochemistry. LDHs can be represented by the common
formula [M1-x2+Mx
3+(OH)2]x+(An-)x/n.mH2O. Where M2+ and M3+ are divalent and trivalent cations,
respectively; the value of x is equal to the molar ratio of M3+/(M2++M3+), whereas A is the interlayer
anion of valence n. The characteristics of M2+, M3+, x, and An- may vary over a wide range,
providing a large number of materials having different physicochemical properties (Duan, 2006).
LDHs can be considered as a class of materials that are simple to synthesize in the laboratory.
In the past few decades, many reports on adsorption thorugh LDHs have been documented (Kang
et al., 1999; Yang et al., 2006) to remove monoatomic anions (Liu et al., 2006; Lv et al., 2006),
cations (Lehmann et al., 1999) and gases (Cantu et al., 2005). A list of various LDHs used for
arsenic and chromium removal are presented in Table. 2.2.

LITERATURE REVIEW
20 | P a g e
2014
Table - 2.2. List of various LDHs used for arsenic and chromium removal
Contaminant Types of LDHs Reference
Arsenic Uncalcined chloride-LDHs, uncalcined carbonate-LDHs
You et al. (2001)
Uncalcined and calcined Mg–Al LDHs Shibata and Murayama (2006)
Ferric-based layered double hydroxide with a-alanine intercalation
Hong et al. (2014)
Mg–Al layered double hydroxides Violante et al. (2009)
Uncalcined and calcined Mg–Fe–Al LDHs Carja et al. (2005)
Calcined Mg–Al LDHs Yang et al. (2006)
Chromium Calcined Mg–Al LDHs Rhee et al. (1997)
Uncalcined and calcined Mg–Al, Ni–Al and Zn–Chromium LDHs
Goswamee et al. (1998)
Uncalcined chloride-Mg–Al, chloride-Zn–Al, and chloride-Zn–Chromium LDHs
Houri et al. (1999)
Uncalcined and calcined Mg–Al LDHs Lazaridis et al. (2001)
2.3.5. Hybrid materials and composites
Demand for novel materials having wide number of functions has been explored through
recent technological discoveries. The organic – inorganic hybrid materials are considered as 21st
generation composite materials that will encompass a wide range of applications in the areas of
energy, environment, biomedical and catalysis (Romero and Sanchez, 2004; Sharp, 1998).
Researchers and scientists investigated that mixtures of these materials can show greater
properties compared with their single counterparts (Schottner, 2001; Sayari, 2001). Inorganic–
organic hybrids materials can be applied in many fields of materials chemistry because they are
simple to process and are easy to design on the molecular scale. According to literature,
(Kickelbick, 2001; Sharp, 1998) the first nanocomposite was developed in the middle of the 19th
century when gold salts were reduced in the presence of gum arabic. The term hybrid material can
be defined as a material that is formed upon combination of two moieties on the molecular level. In
general, the inorganic part and organic part offers mechanical strength through their bonding
(Haas, 2000; Sanchez, 1999). Hybrid materials are classified into two classes, class I and class II.
Class I hybrid materials are those that show weak interactions between the two phases, such as
van der Waals, hydrogen bonding or weak electrostatic interactions. On the other hand, Class II
hybrid materials shows strong chemical interactions between the components. An organic moiety
can act as a network changing compound, which contain functional group that allows the
attachment to an inorganic network for example a trialkoxysilane group, as the final structure of the
inorganic network is modified by the organic group.
The advantages of inorganic–organic hybrids materials are:
(a) The hybrid material can favorably combine with dissimilar properties of organic and inorganic
components in one moiety to form a single material.
(b) Due to difference in properties of the initial components, there is an opportunity to discover
unknown properties of the new material.
(c) Multifunctional materials can be developed.

LITERATURE REVIEW
21 | P a g e
2014
The characteristics of the final hybrid materials are not only specified by the properties of the
inorganic and organic component, but structural, morphological and the interfacial region between
the two units also derives their characteristics. Various hybrid materials were reported and
documented in literature for removal of arsenic, chromium and other contaminant, a list of the
various materials reported in literature has been presented in Table 2.3.
Table - 2.3. Hybrid materials and composites reported for arsenic and chromium removal
Contaminant Materials Reference
Arsenic
Hybrid inorganic/organic polymer type material based on hydrated ferric oxide (HFO)
Iesan et al. (2008)
Nano-hydrated zirconium oxide (HZO)/polystyrene hybrid adsorbent
Pan et al. (2014)
Al-HDTMA-Sericite (AH) and Al-AMBA-Sericite (AA) hybrid materials
Tiwari et al. (2012)
Monolithic Fe2O3/graphene hybrid material Li et al. (2014)
Fibrous ion-exchangers FIBAN in HFO Vatutsina et al. (2007)
Mesoprous hybrid material – Thiol-functionalized silica coated activated alumina
Hao et al. (2009)
Chromium
Magnetite–Polyethylenimine–Montmorillonite Larraza et al. (2012)
RGO-Fe3O4 hybrid composite Zhou et al. (2013)
Novel amine impregnated graphene oxide Kumar et al. (2013)
Sulphonic acid functionalized silica adsorbent Gomez-Gonzalez et al. (2014)
Polypyrrole decorated reduced graphene oxide–Fe3O4 magnetic composites
Wang et al. (2015)
Polyaniline/silica gel composite Rathinam et al. (2014)
2.4. Material synthesis route
2.4.1. Co-precipitation method
It is the synthesis process in which a precipitate of substances normally soluble is carried
down under specific conditions. In analytical chemistry, it is termed as occlusion, inclusion, carrying
down, co-precipitation and adsorption as collective names due to fact that the impurities within the
precipitate is carried down. There are three cases for distinction of different type of phenomena
that accounts for co-precipitation. They are formation of mixed crystals in which they do not change
the regular crystal structure due to incorporation of impurities in the lattice of crystal; adsorption of
impurities during the growth of crystals leading to formation of imperfections in the crystal
(occlusion) and the third is surface adsorption by the precipitate after it has been separated or
formed (Kolthoff et al. 1932). The formation of hybrid materials by this method is highly preferred
due to its easy, simple and large scale production of powders. Recently, a novel hybrid inorganic-
organic modified Sericite has been synthesized for removal of arsenic(III) and arsenic(V) from
aqueous solutions and the material has also been utilized in treatment of waste water (Tiwari et al.
2012). In another process, a magnetic bio-composite is prepared using alginate as a biopolymer
due to its non-toxicity, high selectivity and inexpensive nature. Another hybrid material has been
prepared through combination of magnetite-polyethylenimine-montmorillonite for treatment of water
solution contaminated by Cr(VI) (Larraza et al. 2012).
2.4.2. Sol-gel method

LITERATURE REVIEW
22 | P a g e
2014
Sol-gel process is a wet chemical process that undergoes self-assembly for formation of
material. The network evolution during formation of colloidal suspension i.e., sol and gelation of sol
to form network in a continuous liquid phase is the basic mechanism behind this technique (Brinker
et al., 1990). The hybrid materials synthesized via sol-gel route has been extensively studied for
application in optics, coating processes, glass making and in recent it is also used for separation of
ions from aqueous solutions (Escalante et al., 2009). This method has a backbone of silica that
contains functional groups capable of reacting with other targeting ions. This functionalized silica is
synthesized through homogeneous mixing of a cross linking agent and silicon precursor containing
desired functional group followed by co-condensation to achieve functionalized silica network
(Quintanilla et al., 2007). Recently, sol-gel process has been implemented to synthesize a high
capacity hybrid silica adsorbent for removal of trivalent chromium complex ions chelators from
aqueous solutions (Gonzalez et al., 2014). In another approach, this process is used for synthesis
of zwitter ionic hybrid polymers through ring opening polymerization of pyromellitic acid diahydride
and phenylaminomethyl trimethoxysilane (Liu et al., 2010).
2.4.3. Hydrothermal method
Hydrothermal synthesis is a one-step method to produce crystals from metal salt solutions
by heat treatment of the aqueous solution (Adschiri et al., 2001). The changes in reaction
equilibrium of metal salt aqueous solution with respect to temperature results in formation of
crystals. It is used as batch type autoclave, where an aqueous metal salt solution is heated slowly
to 180-220oC following the aging of several hours or days (Adschiri et al., 2001). The equilibrium
variation with temperature dissolves again for recrystallization at higher temperatures. Since, the
process is one step and easy to handle, many hybrid materials have been synthesized for active
removal of heavy metals using this method. Recently, magnetic carbon nano adsorbents have
been prepared for decontamination of heavy metals using L-cysteine as organic matrix and S-
doped Fe2O3 particle as an inorganic material (Zhao et al., 2014). In another research
hydrothermal assisted grafting method is used for synthesis of sulphur functionalized silica
nanoparticles for removal of Cd(II) and Pb(II) (Fan et al., 2012). Hybrid Thiol-silica spheres has
been constructed by interlacing arrays of sub micrometre-sized blocks through one-pot
hydrothermal approach and was successfully used for capturing of heavy metal ions (Li et al.,
2014). Unlike, Co-precipitation, large scale production of material is a drawback of this method.
2.4.4. Microwave synthesis
This methodology has become one of the best choices for many chemists for a multitude of
reactions due to several advantages that includes less time consumption, better workability, yield
and clean chemistry (Sridhar et al., 2010). This technique is advantageous over other conventional
methods because of rapid heating, fast kinetics, pure phase with high yield and better reliability
and reproducibility (Tompsett et al., 2006). Moreover, it provides an efficient way to control the
distribution of particles and its size, selection of phase and morphology in the synthesis of hybrid
materials (Jhung et al., 2007). This process has been recently used for deposition of porous iron
oxide on activated carbon through microwave heating for effective removal of arsenic(V) from
contaminated water (Yurum et al., 2014). Although, it is the most used technique for synthesis of

LITERATURE REVIEW
23 | P a g e
2014
other nanostructures but synthesis of hybrid materials through this method is very less reported.
An environmental friendly microwave assisted synthesis of hybrid materials from cellulose and
metal halide using ionic liquids has been reported by Dong et al. (2013). Another approach has
been employed to synthesize a hybrid mesoporous membrane of polycarbonate with mesoporous
silica rods embedded in the channels of filtration membrane through assistance of microwave
process (Chen et al., 2012).
2.5. Mathematical modeling of adsorption process
The method of developing a mathematical model is termed as mathematical modeling. A
mathematical model helps to explain a system by using mathematical concepts, language and
allows to make predictions about behaviour for different constituents present in the system
(Camargo et al., 2014). Mathematical models can take many forms, including dynamical systems,
statistical models or differential equations (Montastruc et al., 2011). Since, modeling of devices is
essential in both engineering and sciences, therefore, engineers and scientists have very
significant reasons for doing mathematical modeling. Recent days, mathematical modeling plays a
key role in the field of environmental and industrial applications. Mathematical models are usually
collection of relationships and variables. Relationships can be described by operators, such as
algebraic operators, functions, differential operators, etc. Variables are system parameters of
interest that can be computed or measured. Operators can act with or without variables (Vukčević
et al., 2014; Klett et al., 2014). Models can be categorized in the following ways (Aurelian et al.,
2007):
(a) Linear vs. nonlinear
(b) Static vs. dynamic
(c) Explicit vs. implicit
(d) Discrete vs. continuous
(e) Deterministic vs. probabilistic
(f) Deductive, inductive, or floating
Robust prediction models such as artificial neural networking (ANN) or artificial intelligence,
response surface methodology (RSM), adaptive neuro fuzzy interface system (ANFIS), genetic
programing (GP) and least square support vector machine (LSVM) are utilized for prediction of
system behaviour and experimental design. The most important issue for an environmental
process is the parametric appraisal of the method and subsequently improvement through
modelling and optimization without incurring extra cost. Since 1958, when psychologist Frank
Rosenblatt (Rosenblatt, 1958) proposed the "Perceptron", a pattern recognition device with
learning capabilities, the artificial neural networks was widely studied and utilized in various
applications. Hierarchical architecture is the most popular structure of ANNs. The most important
characteristic of this type of network is its simple dynamics (Aber et al., 2009).
Water treatment and heavy metal removal is a complex chemical process due to interaction
of many parameters during the removal process. Mathematical modelling of such process by
response surface methodology (RSM) and artificial neural network (ANN) can help to study the
influence of individual parameter and predict removal efficiency with fewer experimental runs

LITERATURE REVIEW
24 | P a g e
2014
(Daneshvar et al., 2006; Aleboyeh et al., 2008). Artificial neural network (ANN) can be considered
as a useful tool when the process has high complexity and behaves in a non-linear manner (Saha
et al., 2010). The capability of self-learning and self-adapting of ANN can be successfully exploited
for prediction of arsenic removal under the influence of various operating parameters. ANN
provides a platform for mapping relationships between input and output parameters in an arsenic
and chromium removal process (Aleboyeh et al., 2008; Chu et al., 2003).
In recent years, RSM and ANN are widely used to solve the environmental issues. RSM not
only develops a non-linear predictive equation, but also helps to analyze influence of each
parameter on the removal efficiency. RSM (central composite design (CCD)) can show the
influence of each parameter and interaction between parameters on response, but ANN can
improve and simulate any process performance in any form of non-linearity without any regular
experimental design. ANN also overcomes quadratic non-linear correlation hypothesis of RSM. A
considerable amount of research has been carried utilizing RSM and ANN separately in removal
processes (Shojaeimehr et al., 2014). Roy et al. (2014) reported a statistical approach for removal
of arsenic by using ANN model. The artificial neural network (ANN) model was developed from
batch experimental data sets which provided reasonable predictive performance with R2 = 0.964;
0.963 for arsenic adsorption. For column operation, central composite design (CCD) in response
surface methodology (RSM) was applied to investigate the influence on the breakthrough time for
optimization and evaluation of interacting effects of different operating variables. The data obtained
suggest that the breakthrough time is more sensitive to initial concentration and adsorbent dose
than flow rate.
The performance of batch and column studies of phosphate removal was modeled and
predicted with the help of artificial neural network (ANN) and response surface methodology (RSM)
model (Zhang et al., 2014),. Various parameters such as pH, sulfate concentration, temperature
and adsorbent dosage were considered as input, while the removal efficiency was considered as
the output. The central composite design (CCD) with 33 sets of batch experiments were analysed
and a RSM model was developed to compare with the ANN model. The influence of both models
were estimated by correlation coefficient and mean squared error (MSE) values. The study claimed
that temperature showed least influence, whereas the other remaining variables were considered
significant to the output. The study also claimed that predictions made by the developed models
were reasonably good in agreement with the test runs. This study suggested that ANN and RSM
be considered as effective tools to model and predict trace pollutants removal by using various
adsorbents. Similar studies were carried out by various researchers (Witek-Krowiak et al., 2014;
Violante et al., 2009; Daneshvar et al., 2006; Shanmugaprakash et al., 2013; Bhatti et al., 2011)
suggesting the wide applicability of mathematical models in the area of predicting heavy metal
removal and water treatment.
2.6. Research Gap
The literature related to the topic has been extensively reviewed and presented. Many
methods using different hybrid material and composites are also represented. It is understood that
the process are feasible in term of scientific knowledge but no scale up studies are reported. As
LITERATURE REVIEW
25 | P a g e
2014
per the requirement, the material should be capable of removing the targeted ions and should have
the capacity for regeneration. In view of the above, there exist a requirement to develop materials
possessing the properties suitable for the removal of hazardous ions from water. There is a
research gap which is required to be filled up.
1. To develop materials which are environmental friendly at the time of use and after use also.
2. The materials should be more efficient and less costly in water treatment.
3. The material should not leach under oxidizing and reducing environment.
4. The material can work at ambient condition to remove the targeted ions.
5. The materials can be regenerated by simple and cost effective methods .
6. After adsorption, the adsorbate should be recovered with an easy process.
7. The mechanism of the process should be understood with all supporting evidences.
8. The modelling can be applied by existing data to find the optimal condition which can be
verified by experimental run.
9. The concept of modelling should be applied to any other similar processes.
10. The finding of the results should be extended to pilot scale.
2.7. Aim and objective of the present research work
Water is vital and one of the most important resources of nature for the sustenability of
living organism. The water is called elixir of life because of its multiple/versatile uses.
Indiscriminate use and misuse of water is making it unfit for human consumption. A wide literature
review suggested that more research are required to develop efficient and environmental friendly
adsorbrnt. Hence, an attempt has been made in the present study to remove two toxic pollutants
under the topic “Development of new adsorbent materials for the removal of arsenic (III) and
chromium (VI) from water and its mathematical modelling”.
Keeping the above facts in mind, the present work has been undertaken with the following
objectives:
1. To prepare and characterize environment friendly hybrid materials which are used as
adsorbents for the removal of arsenic and chromium from water.
2. To find the removal efficiency of these hybrid materials for the selective removal of As (III)
and Cr (VI) separately and to explore the possible regeneration of hybrid materials for
reuse in batch mode.
3. To evaluate the mechanism of adsorption process based on the results of kinetics,
thermodynamics and isotherm studies.
4. To study the influence of bed depth, flow rate and sorbate concentration in As (III) and Cr
(VI) adsorption to know adsorption capacity and breakthrough point in column mode.
5. To optimize a response (output variable) which is influenced by several independent
variables (input variables) by Response Surface Methodology (RSM).
6. To predict and compare the removal efficiency of arsenic (III) and chromium (VI) through
mathematical modelling using artificial neural network and response surface methodology.

EXPERIMENTAL 2014
26 | P a g e
CHAPTER-3
3. EXPERIMENTAL METHODS
3.1. Removal of the arsenic (III) and chromium (VI) from water by hybrid materials
3.1.1. Preparation of standards and reagents
All the chemicals used in these studies are of Analytical grade. The chemicals are
obtained from Merck (Merck chemicals, Germany) and Aldrich (Sigma-Aldrich, USA) which are
used without any further purification. The glassware used is of Borosil and Tarson make.
Deionized (Milli-Q Millipore 18.2 MΩ cm-1 conductivity) and double distilled water are used for the
preparation, dilution and analytical purposes of solutions.
1000 mg/L stock solution of arsenic (III) is prepared by dissolving 1.320 g arsenic trioxide
(As2O3; Merck- HC622890, Chemicals, Germany) in water containing 4 g sodium hydroxide
(NaOH) and diluted to 1 L of deionized water (Cullen et al., 1989; Duncan et al., 2013; APHA,
1912); 1.00 ml = 1.00 mg arsenic (III). The 1000 mg/L stock solution of chromium (VI) is prepared
by dissolving 2.828g of anhydrous potassium dichromate (K2Cr2O7; MG7M571737) in 1000 mL of
deionized water by adding 1.5 mL of 1M HNO3. The standard solution of arsenic (III) and
chromium (VI) are prepared by proper dilution as when required. The stock solutions are
preserved with 1% trace metal grade nitric acid for one month in 20C. For the analysis of arsenic
(III), 500 mL Sodium tetrahydroborate (NaBH4) solution is prepared by dissolving 2.5 g NaOH and
2.0 g NaBH4, in deionized water. The NaBH4 reagent is always prepared instantly before use.
Sodium tetrahydroborate solution is disbursed into the acidic test sample solution. The reaction of
sodium tetrahydroborate in acidic solution and the simultaneous reaction of the hydride forming
element is represented below.
3.1.2. Synthesis of hybrid materials
3.1.2.1. Synthesis of the zirconium (IV) oxide ethanolamine (ZrO-EA) hybrid material
The synthesis of Zirconium (IV) oxide ethanolamine (ZrO-EA) hybrid material is prepared
by using a 0.1 M aqueous solution of zirconium oxychloride, which is mixed with a 0.1 M aqueous
solution of ethanolamine in different volume ratios (v/v) at pH 3-10. The pH of the solution is
adjusted using 0.1 M HCl/NaOH solution. The white coloured gel so obtained is kept undisturbed
for 24 h at room temperature for complete precipitation. The gel is separated from the mother
liquor by decantation and washed with de-ionized water several times to ensure a pH 7 of the
effluent wash. The material is then dried at 50 °C in an oven for 24 h and it is collected in
powdered form.
3.1.2.2. Synthesis of lanthanum-diethanolamine (La-DEA) hybrid material

EXPERIMENTAL 2014
27 | P a g e
The synthesis of lanthanum-diethanolamine (La-DEA) is carried out by co-precipitation
method at pH = 9.1 M aqueous solution of hexahydrate lanthanum nitrate (La (NO3)3.6H2O) are
added drop wise from a burette to 2.0M aqueous solution of diethanolamine taken in a round
bottomed-flask with constant stirring at a speed of 200 RPM by using a magnetic stirrer at a
temperature around 60 0C for 3 h. The pH of the solution is maintained by the addition of required
amount of 0.1M HCl or NaOH solution to maintain the pH. The white coloured gel so obtained is
kept undisturbed for 24 h to ensure the complete formation of gel at room temperature. The gel is
removed from the mother liquor by decantation and subsequently washed well with de-ionized
water till it attains pH = 7 of the washing. A number of materials are synthesized with the variation
of molar ratio of precursor. The material are then dried at 100 0C in an oven for 24h and collected
as powder. Subsequently the material is activated by using 1M HCl.
3.1.2.3. Synthesis of zirconium polyacrylamide (Zr-PACM-43)
Zirconium polyacrylamide (Zr-PACM-43) is synthesized in the laboratory by sol-gel
method with water as a solvent by the following procedure. 52.8 mL of distilled water with 20 mL
of 30% acrylamide mixture (acrylamide + Bis-acrylamide) is taken in a 250 mL round bottom
flask. To this 15 mL of 1.5M TRIS ((hydroxymethyl) aminomethane) is added to maintain the pH -
8.8 and after that 10 mL of 10% zirconium oxychloride was added to the above solution with
constant stirring. To this mixture, 1 mL of 10% ammonium Persulphate and 0.2 mL of TEMED as
a catalyst and reaction initiator is added drop wise sequentially with vigorous stirring to make a
net volume of 100 mL, a white coloured gel was formed, which is allowed for ageing at room
temperature for 12 h. Then it is filtered and washed several times with distilled water to remove
excess reagent. The material is dried at 50 0C for 2 h in a hot air oven till it forms white granules.
Finally the materials are kept in an air tight bottles until used.
3.1.2.4. Synthesis of cerium oxide hydroxylamine hydrochloride (Ce-HAHCl)
A series of hybrid material cerium oxide hydroxylamine hydrochloride (Ce-HAHCl) is
prepared by taking different molar ratio of the cerium nitrate hexahydrate and hydroxylamine
hydrochloride by the sol-gel method. Aqueous solution of 0.1M cerium nitrate hexahydrate
[Ce(NO)3.6H2O] and 0.3M aqueous solution of hydroxylamine hydrochloride (HONH2.HCl)
solution is taken into a 500 mL beaker. After mixing both the solutions in required molar ratio, the
mixture is stirred at 100 RPM for 4 h at 65 0C in a 500 mL round bottom flask at pH= 8.0 by
adding required amount of ammonium hydroxide (NH4OH) solution from time to time. A pinkish-
white colour gel is formed which is separated by a separating funnel. The gel is washed first with
ethanol and then in distilled water for several times to ensure the removal of excess reagent. The
gel obtained is kept in hot air oven at 80 0C for 24 h to obtain a yellowish white powder. Then, the
material is kept in suspension with 2M HCl at least for two hours for activation. After activation,
the material is washed with NH4OH to remove excess acid. Subsequently, it is washed with

EXPERIMENTAL 2014
28 | P a g e
distilled water several times. The material is dried in hot air oven at 80 0C for 24 h to obtain the
activated material, which is kept in an airtight container until uses.
3.1.2.5. Synthesis of cerium oxide polyaniline (CeO2/PANI) composite
In a 250 mL round bottom flask, 3.5 mL of aniline is added drop wise under ultrasonic
condition to a dispersion of CeO2 in a 100 ml (1 M) HCl solution. The ultrasonic medium is used
to reduce the agglomeration of CeO2 particles. The above dispersion is kept at 50 oC for 1h with
constant stirring. Than 4.5 g of APS (Ammonium persulfate) dissolved in 50 ml de-ionized water
is dropped into above mixture with constant stirring for 20 minutes. The resulting mixture is
allowed to react for 8 h at room temperature. A dark green colour precipitate is obtained which is
separated by centrifugation and filtration. The precipitate is washed with HCl and double distilled
water to remove the unreacted aniline and others. Afterward the material is dried at 70 0C in an
oven until green powder material is obtained. A series of composites are prepared by variation of
molar concentration of aniline and cerium oxide. The surface area, ion exchange capacity and
particle size of all the materials are analysed and the best performing material is used for further
batch adsorption experiments. The synthesis method follows the procedure and technique as
reported by Kumar et al. 2012.
3.1.3. Characterization techniques of hybrid materials
3.1.3.1. FTIR Study
The Fourier-transform infrared spectra (FT-IR) of the samples were obtained using Perkin
Elmer FT-IR spectrophotometer SPECTRUM RX-I (USA) with 64 scans and over the wave
number range 400-4000 cm-1 by following the standard procedure. The data was plotted using
standard software provided with the instrument. FTIR spectroscopy plays an important analytical
tool to understand structure of compound and mechanism involved in reaction process.
3.1.3.2. X-ray diffraction study
The powder X-ray diffraction (XRD) of sample was determined by using Philips
(Netherlands) PAN analytical X’Pert X-ray diffractometer with a Cu Kα radiations source
generated at 35 kV and 30 mA and Rigaku (Japan) Ultima IV with a Cu Kα radiations source
generated at 60 kV and 30 mA respectively. Scattering angle 2θ was ranged from 10 to 900 at a
scanning rate of 3 degree per minute and was analyzed using standard software provided with
the instrument (X’pert High score). The samples were oven-dried at a temperature of 40 0C in
closed container for 1 h before the analyses. The X-Ray pattern of the material and mineral
composition of different phases were determined by using XRD.
3.1.3.3. Scanning electron microscopy (SEM)-Energy dispersive X-ray (EDX)
Scanning electron microscopy (SEM) micrographs-Energy dispersive X-ray (EDX) of the
sample was obtained by JOEL model JSM-6480LV (Japan). The sample was coated with

EXPERIMENTAL 2014
29 | P a g e
platinum for 30 to 90 seconds as required at current of 50 mA at vacuum before obtaining the
SEM micrograph.
3.1.3.4. Field emission scanning electron microscopy (Fe-SEM)
Field emission scanning electron micrographs (Fe-SEM) coupled with EDX of the sample was
obtained by Nova Nano SEM FEI-450 system (USA). The sample was dried at 50 0C at hot air
oven and coated with gold or gold -palladium thin layer of 1.5-3.0 nm and kept in high vacuum to
remove external water before taking micrographs.
3.1.3.5. Thermal analysis (TG-DSC/DTA)
The thermo gravimetric analysis and differential scanning calorimetry or differential
thermal analysis was carried out using NETZSCH STA449C (Germany) or Shimadzu/ DTG-60H.
20 to 30 mg of sample was used and alumina supplied by the manufacture was used as
reference. TGA and DSC/DTA curve was obtained from 30 0C to 800 0C at a rate of 10 0 C/min.
3.1.3.6. Surface area analysis
BET surface area and isotherm of the sample was measured using QUANTACHROME
Autosorb I and QUANTACHROME Autosorb IQ. The sample was initially degassed at 100-180 0C
as required in vacuum. Helium is used as carrier gas and the surface area is measured by
nitrogen-desorption method at liquid nitrogen temperature. Various parameters such as T-plot,
pore size, pore volume, D-R isotherm and BJH isotherm were obtained.
3.1.3.7. Elemental analysis
Percentage of carbon, hydrogen, nitrogen and sulphur was analyzed by using Elementar
analyzer (CHNSO-Elementar Vario El, Germany). Approximately 6 to 9 mg of sample of was
taken in silver boats by accurate measurement of weight and placed at sample chamber which
dropped to combustion chamber at 1150 0C. Oxygen was used as fuel for combustion and helium
was used as carrier gas.
3.1.3.8. Particle size analysis
Particle size of the synthesized materials was determined by using Malvern nano zeta
seizer (Malvern Nano, UK). The 1 mg of sample is dissolved in solvent (ethanol, deionized water
and acetone) and diluted to 100 mL in volumetric flask. The 10 mL of sample was taken in quartz
cube for analysis.
3.1.3.9. Ion exchange capacity
One gram of the activated material (H+ form) is taken in a glass column of diameter 1 cm
and height of 20 cm. 250 mL of 1M solution of the nitrate or chloride salt of Na+, Ca++ and K+ ion
is used as eluent with a flow rate of 0.5 mL/min by using a peristaltic pump. The eluent is

EXPERIMENTAL 2014
30 | P a g e
collected and titrated against a standard alkali solution to define the total amount of H+ released
which was equivalent to the ion possessed by the material know the ion exchange capacity. The
ion exchange capacity in meq/g is calculated using the relation,
Where ‘m’ is the molarity, ‘V’ is the volume of alkali and ‘W’ is the weight of the material taken.
3.1.3.10. Surface charge density and isoelectric point (pHzpc)
The surface charge density (σ) of sorbent was determined by a potentiometric titration
method. The following equation 3.4 was used to determine the surface charge density
Where Ca and Cb were the molar concentrations of acid and base needed to reach a point on the
titration curve, [H+] and [OH-] were the concentrations of H+ and OH-, F was the Faraday constant
(96,490 C/mol), m (g/L) was the concentration of the sorbent. The isoelectric point (pHzpc) is
determined using electrophoretic mobility in a solution of ionic strength of 0.01 M NaNO3 and
0.01M NaCl
3.1.3.11. Chemical stability
The chemical stability of materials before and after adsorption was studied by adding 0.5
g to 25 mL of the various mineral acid, bases, and salt solution of different concentration for 36 h
each, with stirring. The filtrate was analyzed for the starting contents and adsorbed contents.
3.1.4. Instrumental analysis of arsenic and chromium
3.1.4.1. Arsenic (III) and chromium (VI) analysis using atomic absorption spectrometry
(AAS)
Atomic adsorption spectroscopy is one of the best instrumental techniques to analyze the
concentration of metals and metalloids. But due to limitation like interferences, poor generation,
and poor detection limits , an alternate method known as Hydride generation atomic absorption
spectroscopy for detection of metalloids ( arsenic, antimony, bismuth and selenium ) has been
developed (HG-AAS, Elico Sl-146, India). This technique is used to estimate arsenic (III) and
chromium (VI) in the present study by using standard methods given in user’s manual. Three
standards were prepared for both arsenic (III) and chromium (VI) in the required concentration
range of sample. The analyses of each sample were carried for 3 to 5 times and the concordant
reading was taken. All the samples and standards were kept in closed vessels at constant
temperature to avoid conflict due to change in temperature and concentration gradient due to
absorption of atmospheric carbon dioxide.
3.1.5. Batch Experiments
The arsenic (III) adsorption experiments from its aqueous solutions on hybrid materials
were carried out using standard 1 mg/L, 5 mg/L, 10 mg/L, 50 mg/L and 100 mg/L As(III) solution

EXPERIMENTAL 2014
31 | P a g e
in absence of other competing ions. The adsorption experiments were carried out at ambient
temperature (25 ± 5 0C) in series of 250 mL Borosil conical flask with stopper by adding 0.1-1.5 g
of the adsorbent material in 100 mL of synthetic arsenic (III) solution. Stoppers were provided to
avoid change in concentration and concentration gradient due to evaporation. Optimal adsorption
parameters are determined as a function of dose, pH, contact time, temperature, initial arsenic
(III) concentration in the batch removal process. The solutions were kept in laboratory shaker at
150 rpm for a predetermined time period, after that the solution was filtered by using separation
technique (using separating funnel, Whatman -42 filter paper (Pore Size: 2.5 µm), by centrifuging
at 4500 r/min) and the residual arsenic (III) concentration was determined in the filtrate by HG-
AAS. Similar adsorption experiments for the chromium (VI) are conducted.
The adsorption capacity and removal % of arsenic (III) and chromium (VI) were calculated using
the following equations.
Where qe is the equilibrium adsorption capacity (mg/g), Co and Ce is the initial and equilibrium
concentration of arsenic (III) and chromium (VI) in solution (mg/L) respectively, m is the
adsorbent weight (g) and V is the volume of solution taken.
3.1.5.1. Effect of adsorbent dose
The effect of adsorbent dose on adsorption was studied by using 100 mL of arsenic (III)
solution with initial concentration of 100 mg/L, 50 mg/L, 10 mg/L and 1 mg/L prepared by serial
dilution of stock solution (1000 mg/L). The solution were taken separately in a series of conical
flask (Borosil 250 mL with stopper) containing 0.1g, 0.2g, 0.3g, 0.4g, 0.5g, 0.6g, 0.7g, 0.8g, 0.9g,
1.0g, 1.2g, 1.3g, 1.4g and 1.5g of adsorbent and shacked in the laboratory shaker at 150 rpm at
ambient temperature (25±5 0C) for a predetermined time interval without any pH adjustments .
The solid was separated by filtration or by centrifugation and the residual metal concentration
was estimated by HG-AAS. The effects of adsorbent dose on adsorption of chromium (VI) were
studied by the similar procedure. From this studies the optimum dose is obtained where the
percentage removal is maximum.
3.1.5.2. Effect of pH
The effect of pH on adsorption was studied by varying pH from 2 to 12 (2, 3, 4, 5, 6, 7, 8,
9, 10, 11 and 12) keeping all other solution parameter constant by the similar procedure followed
in section 3.1.5.1. The pH measurements were done using pH meter (Elico, India) after
standardizing the pH electrode.
3.1.5.3. Effect of contact time
The effect of contact time on adsorption was studied at ambient temperature (25±5 0C)
without any adjustment in pH , after an interval of 5min, 10 min, 15min, 20 min, 25 min, 30 min,

EXPERIMENTAL 2014
32 | P a g e
40 min, 45 min, 45 min, 50 min, 55 min, 60 min, 65 min, 70 min, 80 min, 90 min, 100 min, 110
min, 120 min, 130 min and 140 min. 100 mL, of arsenic (III) solution of initial concentration of 100
mg/L, 50 mg/L, 10 mg/L and 1 mg/L was taken in a series of 250 ml conical flask containing
optimum adsorbent dose obtained from Section 3.1.5.1. After different time interval as mentioned
above, the residual arsenic (III) was measured by using HG-AAS. The influence of contact time
on adsorption of chromium (VI) were studied by the similar procedure
3.1.5.4. Effect of temperature
The effect of temperature on adsorption on the material was studied at different
temperatures (20 0C, 30 0C, 40 0C, 50 0C, 60 0C, 70 0C and 80 0C) by taking optimum adsorbent
doses but keeping all other parameters constant following the same procedure as in section
3.1.5.1. The solid are separated by filtration or centrifugation and the residual metal ion
concentration were analyzed by using HG-AAS.
3.1.5.5. Effect of Initial concentration
Batch mode experiments were carried out with optimum amount of adsorbent dose and
varying initial concentration from 10 mg/L to 100 mg/L to know the adsorption efficiency of the
material at different initial metal ion concentration. The experiments were conducted with
variation of initial concentration but keeping all other factors constant following the same
procedure as in Section 3.1.5.1.
3.1.5.6. Effect of competitive ions
Drinking water and polluted water consist of many common ions, which may compete for
adsorption site along with arsenic and chromium ions and affect the adsorption capacity. The
effect of competitive ions such as chloride, nitrate, sulphate, carbonate, bicarbonate, phosphate,
sodium, potassium, calcium and magnesium on the adsorption of arsenic, and chromium by
hybrid materials were studied in batch adsorption experiments. To study the influence of
competitive anions and cations on adsorption, 100 mL 10 mg/L of arsenic solution was taken in
Borosil conical flask of 250 mL capacity containing optimum adsorbent dose with stopper at
ambient temperature (25 ± 5 0C) and required weight of salts of different cations and anions was
added separately. After shaking for a period of predetermined time interval with a laboratory
shaker at 150 rpm the solid were separated by same procedure and the residual metal ion
concentration were analyzed by using Hydride generation atomic absorption spectrometric (HG-
AAS). No pH adjustments were made and the study was conducted at its natural pH.
3.1.5.7. Desorption and regeneration studies
For the application of hybrid materials in water treatment process, the adsorbents should
have better desorption and regeneration capacity. The regeneration of the materials mainly
depends on the ease with which arsenic (III) and chromium (VI) ions get desorbed from loaded

EXPERIMENTAL 2014
33 | P a g e
hybrid materials. 100 mL of 10 mg/L, 50 mg/L and 100 mg/L arsenic (III) and chromium (VI)
solution was taken separately in a 250 mL beaker containing 0.5 g of hybrid materials was
shacked in a laboratory shaker for predetermined time period (12 h, 24 h, 36 h, 48 h, 60 h and
72h) ambient temperature (25±2 0C) and solid was removed by filtration with Whatman-42 filter
paper. The adsorbent material was retreated with 100 mL of de-ionized water. The pH of solution
was adjusted to different pH by adding 1M HCl and 1M NH4Cl. It was stirred for 24 h and then the
residual solution was analyzed for arsenic and chromium respectively by instrumental techniques.
3.1.5.8. Reusability studies
The ease of reusability of the material helps for the practical application in water
treatment. Reusability depends on good regeneration of the material. 0.5 g of regenerated hybrid
materials were added to 100 mL of 10 mg/L, 50 mg/L and 100 mg/L arsenic (III) and chromium
(VI) solution separately in a series of 250 mL beaker. The containers were shacked with
laboratory shaker for predetermined time period of 1-4 h. The solid were separated by filtration or
centrifugation and the residual solution was analyzed for arsenic and chromium by instrumental
techniques. The above studies were carried out ambient temperature (25 ± 2 0C).
3.1.6. Column Study
To know the practical relevance of hybrid materials in large scale water treatment, column
study by up flow mode was studied. The study was carried out in a laboratory designed column
as represented in Fig. 3.1 using a column of 25 cm length and 1.5 cm diameter. The details of the
column are described as follows. Column was packed with different hybrid material synthesized
in laboratory between the two supporting layer of cotton wools. The above and bottom section
was filled up with glass beads. Water sample containing 5 mg/L to 50 mg/L synthetic arsenic (III)
and chromium (VI) solution were allowed to pass through the column by up flow, with different
bed height and at different flow rates.
Fig. 3.1. Laboratory scale column diagram
EXPERIMENTAL 2014
34 | P a g e
The flow rate was maintained by using peristaltic pump. Samples were collected at a
predetermined time interval and collected in sample bottles of 50 mL capacity. The treated water
sample was analyzed for arsenic (III), chromium (VI) by HG-AAS, FAAS respectively.
3.1.6.1. Effect of bed height
To study the effect of bed height, 100 mL of arsenic (III) solution of initial concentration
5mg/L and 10 mg/L prepared by serial dilution of stock solution was passed in up flow mode
using peristaltic pump at a constant flow rate of 2 mL/min. The bed heights of hybrid materials
are maintained at 2 cm, 5 cm, and 10 cm respectively. After a predetermined time interval the
solution was taken out and analyzed immediately for residual arsenic (III) concentration by HG-
AAS. The above experiment was carried out at ambient temperature (25 ± 5 0C). Similar
experiments were carried out for chromium (VI) ion.
3.1.6.2. Effect of flow rate
To study the effect of flow rate, 100 mL of arsenic (III) solution of initial concentration
5mg/L and 10 mg/L prepared by serial dilution of stock solution was passed in up flow mode
using peristaltic pump at a different flow rate starting from 2 mL/min to 10 mL/min. The constant
bed heights of hybrid materials are maintained at 5 cm. After a predetermined time interval the
solution was taken out and analyzed immediately for residual arsenic (III) concentration by HG-
AAS. The above experiment was carried out at ambient temperature (25 ± 5 0C). Similar
experiments were carried out for chromium (VI) and fluoride ion.
3.1.6.3 Mathematical analysis
The loading behavior of arsenic (III) removal by a fixed bed column using hybrid material
media is shown by breakthrough plots (Discussed in chapter - 4). The breakthrough plot are
stated using standardized concentrations and defined ratio of inlet As(III) concentration (C/Co) to
the effluent arsenic (III) concentration and as a function of time (t).
The column performance for total removal of arsenic (III) by hybrid materials was calculated by
using the following equation:
The fixed bed column designed parameters were determined by logit method and the equation is
represented as;
[
]
Where,
Ceff = effluent concentration of solute at any time t,
C0= initial solute concentration,
V= approaching velocity (210 cm/h)
X= bed height

EXPERIMENTAL 2014
35 | P a g e
K= adsorption rate constant (Lmg/hr)
N0= adsorption capacity (mg/L)
m is the weight of adsorbent (g)
Similar experiments were carried out for chromium (VI) removal by hybrid materials. All the
experiment is carried out at ambient temperature (25 ± 50C).
3.2. Mathematical modeling of arsenic (III) and chromium (VI) removal process from water
by hybrid materials
Heavy metal removal by hybrid material is a complex chemical, time consuming and
tedious process, which requires a robust methodology for prediction. Removal of heavy metal
from water with respect to various parameters can be simulated through various modelling.
Mathematical and computational modelling of adsorption process by response surface
methodology (RSM) and artificial neural network (ANN) was made it easy to understand the
influence of different variables influencing the removal of hazardous heavy metal ions from water.
In the current study, prediction of removal efficiency and understanding the influence process
parameter was studied by different models. The modeling of the adsorption process were carried
out in Dell OPTIPLEX 980 (core i5, RAM 4GB, Windows 7) computer and by using MATLAB
(Version R2008, 2013a), Design expert (Version 8.0) and Minitab statistical software 16.0.
3.2.1. Response surface methodology (RSM)
Response surface methodology (RSM) is an assembly of statistical and mathematical
techniques for experimental model building. By careful design of experiments (DOE), the
response (output variable) which is determined by several independent parameters (input
variables) can be optimized. The role of RSM modelling is to reduce the cost of expensive
experimental methods. RSM can show the influence of each parameter and interaction between
parameters on response. In the current study CCD (central composite design) based on the
principle of fitting the quadratic equation by multiple regressions with the required minimum
number of experiments is applied in the present study. RSM involves two parts:
To fit a linear regression model to some initial data points in the search space (through
repetitions of the simulation model). It is to be appraisal, an elevated gradient direction
from the linear regressions model, and a step size to find a new and superior solution in
the search space. This process will be constant until the linear regression model
becomes inadequate, indicated by when the slope of the linear response surface is
approximately 0; i.e., when the interaction effects become larger than the main effects.
To fit a nonlinear quadratic regression equation to this new area of the search space.
Then find the optimum of this equation.
A quadratic equation has been developed for expressing the correlation between response and
the selected variables by using the second order multivariate model, which is represented as;
∑ ∑
∑

EXPERIMENTAL 2014
36 | P a g e
Where, Y is the corresponding response of input variables, Xi, Xi2 and XiXj are the square and
interaction terms of factors, respectively. β0, βi, βii and βij are the unknown regression coefficients
and ε is statistical error.
The parametric levels are coded using the following relation.
(
)
Where, Z is coded value (-1, 0, 1), Xmax and Xmin is maximum and minimum value of actual
variable and X is the actual value of the equivalent variable. The parameter settings for RSM
modeling is represented in Table 3.1.
Table - 3.1. Parameter settings for RSM modeling
RSM
Parameters Values
Study Type Response Surface
Initial Design Central Composite
Design Model Quadratic
Runs (N) 86
Input Variables 5
Output 1
Blocks No blocks
3.2.2. Artificial Neural Network (ANN)
The artificial neural network (ANN) has the ability to relate the input parameters with
output variable efficiently in complex reaction conditions. Back propagation is an approximate
algorithm in which the accuracy index is the mean square error. The architecture of back
propagation artificial neural (BP-ANN) network design consists of three network layers;
(a) Input layer (I), (b) Hidden layer (H) and (c) Output layer (O). A typical architecture of BP-ANN
is presented in Fig. 3.2:
Fig. 3.2. Typical architecture of BP-ANN
Information shared from the input layer to the output layer through the hidden layer. The input
layer (I) receive data from the experimental sources and transfer this data to the network for
handling. Hidden layer (H) does data handling; output layer receives all data from the network
and sends predicted results to a peripheral receiver. A layer of neurons is determined by its

EXPERIMENTAL 2014
37 | P a g e
weight matrix, a bias vector and a transfer function. The actual number of hidden neurons has to
be estimated by trial and error based on minimum value of mean squared error (Mean Squared
Error (See Eq. 3.19)) (Gorashi et al., 2012). The input signals interconnected and modified as a
weight factor (Wab) which signifies the interconnection of ath node of the first layer to bth node of
the second layer. The activation of signals is modified by a sigmoid transfer function (f). Similarly,
outputs signals of hidden layer are modified by interconnection weight (Wbc) of cth node of output
layer to bth node of the hidden layer. The activation of signals is modified by a sigmoid transfer
function (f).
There are various transfer function used in the ANN model such as hard linear (hardlim),
symmetrical hard linear (hardlim), linear (purelin), saturately linear (satlin), log sigmoid (log Sid),
and hyperbolic tangent sigmoid (tansig). In the present study, a sigmoid transfer function shown
in Eq. 3.1.4 is used.
f = 1/ 1+ e –x
Let Ip = (Ip1, Ip2, Ip3, Ip4….Ipn), P =1, 2, 3….n, is the pth pattern among n input types, Wab and Wbc
are connection weights between bth input neuron to ath hidden neuron, and bth hidden neuron to
cth output neuron, respectively.
Output from a neuron in the input layer is:
Opb = Ipb, b=1, 2…, I
(∑ )
Output from a neuron in the output layer is:
(∑ )
The sigmoid transfer function is used for initiation from input and hidden layer neurons whereas
linear function (purelin) is used to get the same at output layer neurons.
In the present study, adsorbent dose, pH, contact time, initial concentration and temperature are
used as inputs to ANN model. Removal percentage is the desired output from the ANN network.
The complete experimental parameter settings are represented in Table 3.2.
Table - 3.2. Parameter settings for ANN modeling
ANN
Parameters values
Data sets Training- 60%, Testing- 40%
Runs 86
Number of input nodes 5
Number of output nodes 1
Number of Hidden neurons 7
Learning rule Back propagation
Number of epochs 300000
Error goal 0.000001
Learning parameter 0.025
Momentum parameter 0.020
The data is normalized to avoid the scaling effect in the range of 0.1 to 0.9. Normalization of data
is done by using the following relation,

EXPERIMENTAL 2014
38 | P a g e
(
)
where Xb is bth input or variable X, Xmin and Xmax are minimum and maximum value of variable X.
Connection weights are created randomly in the range of −1 to +1. The learning supervision is
done by batch mode where interconnection weights are adjusted by sending the 60% training
data to the network using delta rule algorithm. The desired output is compared with predicted
output by calculating mean square error value. If the mean square error value is higher than a
suggested value, it is propagated back from the output layer to the input layer and the connection
weights are improved accordingly until the number of iterations or errors is achieved under
suggested value. Mean square error, EP for pattern p is defined as (Saha et al., 2010; Gorashi et
al., 2012; Aber et al., 2009):
∑
( )
Where, Dpb is the target output and Opb is the calculated output of the bth pattern.
pΔW(t) = -βE (t) + α × ΔW(t-1)
Where, = learning rate, i.e. 0 < < 1 and = momentum parameter, i.e. 0 < < 1
3.3. Data analysis and statistical techniques
Experimental measurements and mathematical modeling always have some random and
discreet error, so no conclusions can be drawn with complete accuracy. However, some
statistical techniques give us opportunity to capture the error and provide high probability of being
accurate.
Matlab, R2008 2013a, Design Expert 8.0, Origin 8, and Excel 2010 proved to very beneficial for
calculating the various constants, plotting graph, calculating ANOVA and other errors as listed
below with mathematical expressions.
3.3.1. Slope
Slope or gradient is often used to describe both the direction and the steepness of the
line. Slope is calculated by finding the ratio of the horizontal change to vertical change the
between any two distinct points on a line. It can be positive, negative or zero.
Lines with positive gradient slope upwards, from left to right, lines with negative gradient slope
downwards from left to right and lines with a zero gradient are horizontal.
The slope of a line in the plane containing the x and y axes is defined as the change in the y
coordinate divided by the corresponding x coordinate, between two distinct points on the line. The
slope is the vertical distance divided by the horizontal distance between any two points on the
line, which is the frequency of change along the regression line.
Syntax
)
Known y’s is an array or cell range of numeric secondary data points.
Known x’s is the set of independent data points.

EXPERIMENTAL 2014
39 | P a g e
The equation for the slope of the regression line is:
∑
∑
Where ‘x’ and ‘y’ are the sample means AVERAGE (known x’s) and AVERAGE (known y’s).
3.3.2. Intercept
Intercept of a straight line is the point at which a line will intersect the y-axis by using
existing x-values and y-values. The intercept is the expected mean value of Y when all X=0.
Syntax
Known y’s is the dependent set of observation or data.
Known x’s is the independent set of observations or data.
The equation for the intercept of the regression line, z, is
Where the slope, b, is calculated according to Equation represented in section 3.3.1.
3.3.3 Mean
For a series of data set, mean is the sum of the observations divided by the number of
observations. It is also known as average. The mean is calculated using the following formula.
∑
Where ∑= sum of, X =Individuals data points and N= sample size (number of data points)
3.3.4 Variance
Variance is measures of data set how far a set of numbers is distributed. A variance of
value zero suggests that all the values are identical in nature. The value of variance is always
non-negative.
The value of small variance demonstrate that the data is nearby to the mean of predictable value,
while a high variance shows that the data is highly distributed around the mean and from each
other.
∑
3.3.5. Standard deviation (σ)
In general statistics and probability theory, the standard deviation ( ), measures the
amount of variation or distribution from the average. A low value of standard deviation suggest
that the data points be likely to be very close to the mean, a high value of standard deviation
suggest that the data points are disperse out a large variety of values.
The equation of standard deviation is presented as,
√∑
[|
| ]

EXPERIMENTAL 2014
40 | P a g e
Where Yactual, i is experimental value of removal %, Ymodel, i is predicted removal % by the model
and N is number of experimental runs.
3.3.6. Chi square (ϰ2)
Chi square is a numerical hypothesis test, in which the sampling distribution of the test
statistic is a chi-squared distribution when the null hypothesis is true.
A chi square (X2) statistic is used to examine whether allocations of categorical variables differ
from one another.
The equation of chi square is presented as,
∑( )
Where Yactual, i is experimental value of removal %, Ymodel, i is predicted removal % by the model
and N is number of experimental runs.
3.3.7. Coefficient of determination (R2) or Correlation coefficient
In data set measurements, the coefficient of determination, denoted as R2 or r2, shows
how well data fit a model. The higher theR2, the more useful the model, R2 values generally lies
between 0 and 1.
The equation of Coefficient of determination (R2) is presented as,
∑ ( )
∑ ( )
∑ ( )
Where Yactual, i is experimental value of removal %, Ymodel, i is predicted removal % by the model,
Ymodel, mean is average value of model removal % prediction and N is number of experimental runs.
3.3.8. Mean square error (MSE)
In general statistics and probability theory, this function processes the total deviation of
the response values from the fit to the response values. It is also called the summed square of
residuals and is commonly categorized as SSE.
The equation of MSE is presented as,
∑ ( )
Where Yactual, i is experimental value of removal %, Ymodel, i is predicted removal % by the model
and N is number of experimental runs.
3.3.9. Root mean square error (RMSE)
In statistics and probability theory, this function is also recognized as the standard error of
fitness and the standard error of the regression. It is an approximation of the standard deviation
of the random factor in the data set.
The equation of RMSE is presented as,
√
∑ ( )

EXPERIMENTAL 2014
41 | P a g e
Where Yactual, i is experimental value of removal %, Ymodel, i is predicted removal % by the model
and N is number of experimental runs.
3.3.10. Mean absolute percentage error (MAPE)
The mean absolute percentage error is also known as mean absolute percentage
deviation (MAPD) is a measure of accuracy of a method.
The equation of MAPE is presented as,
∑ |
|
Where Yactual, i is experimental value of removal %, Ymodel, i is predicted removal % by the model
and N is number of experimental runs.
3.3.11. Average absolute relative error (AARE)
The average absolute relative error (AARE) is a magnitude used to measure how close
predictions are to the final outcomes
The equation of AARE is presented as,
∑ |
|
Where Yactual, i is experimental value of removal %, Ymodel, i is predicted removal % by the model
and N is number of experimental runs.
3.3.12. Normalized bias (NB)
The Normalized bias (NB) can be calculated using the following relation
∑( )
Where Yactual, i is experimental value of removal %, Ymodel, i is predicted removal % by the model
and N is number of experimental runs.
3.3.13. Relative error (%)
It is defined as the ratio of average absolute error to the average value of the measured
quantity measured in percentage. Relative error gives a suggestion of how good a measurement
is relative to the size of the thing being measured.
The equation of relative error (%) is presented as,
| |

RESULTS & DISCUSSION 2014
42 | P a g e
CHAPTER-4 4. RESULTS AND DISCUSSION
4.1. Removal of arsenic (III) by zirconium (IV) oxide ethanolamine (ZrO-EA) hybrid material
The synthesis, characterization and removal of arsenic (III) by zirconium (IV) oxide
ethanolamine (ZrO-EA) hybrid material by adsorption process is presented in this chapter. The
batch mode adsorption experiments are performed to know the optimum condition for better
removal efficiency. The solution parameter like initial arsenic (III) concentration, pH, adsorbent
dose, contact time and temperature are widely varied to find the optimum condition of removal
effectiveness. Reusability, regeneration and effect of other competing ions on arsenic (III)
adsorption are also presented.
4.1.1. Characterization of zirconium (IV) oxide ethanolamine (ZrO-EA) hybrid material
The synthesis of Zirconium (IV) oxide ethanolamine hybrid material is done by
coprecipitation method. A number of samples of Zirconium (IV) oxide ethanolamine are prepared
by taking different molar ratio of Ethanolamine (0.1-1.0 M) and Zirconium (IV) oxide as presented
in chapter 3.The ion exchange capacity of arsenic (III) by the material is studied by batch
experiments and the results are presented in Table 4.1. It is evident from the results that the anion
exchange capacity of the hybrid material depends on the concentration of ethanolamine which is
found to be maximum when the material is prepared with 0.8M solution of ethanolamine. The
material is obtained in the form of granule with shiny appearance. Hence the said material is used
for the batch adsorption experiment. Ethanolamine is toxic in nature but not carcinogenic
(Retimeier et al., 1940). However the leaching experiments indicate that there is no leaching of
ethanolamine in water.
Table - 4.1. Synthesis of various samples of Zirconium (IV) oxide-ethanolamine (ZrO-EA), hybrid
material
The chemical stability of the material is presented in Table 4.2. From the data, it is clear
that the material is quite stable in presence of most of the mineral acids, alkali and salt solutions.
The particle size of the ZrO-EA hybrid material is analyzed and it is found to be 160 nm. Arsenic
ion exchange capacity for different eluent concentration is studied at 25±2 0C and presented in
Table 4.3. The optimal concentration of the eluent is found to be 1.0 M for arsenic (III) ion. The
amount of elution is found to depend on the concentration of eluent. The minimum volume
required to complete the elution is found to be 120 mL. On the basis of the chemical analysis and
Sample Composition
Zirconium oxychloride Solution (M)
Ethanolamine Solution (M)
Composition 1 0.1 0.2
Composition 2 0.3 0.6
Composition 3 0.4 0.8
Composition 4 0.5 1.0
Composition 5 0.6 1.2

RESULTS & DISCUSSION 2014
43 | P a g e
elemental analysis (Table 4.3) of ZrO-EA hybrid material, the number of moles of Zirconium, and
Ethanolamine are found to be 0.866 10-3, 1.2702 10-3, respectively.
Table - 4.2. Chemical stability of zirconium (IV) oxide ethanolamine hybrid material in several
acid, alkali and salt solutions.
Solvent(20 ML) Amount Dissolved(mg)
Solvent(20 ML) Amount Dissolved(mg)
1M HCL 0.21 2M NaOH 0.84
2 M HCL 0.38 4M NaOH 1.23
4 M HCL 0.86 1M KOH 1.23
1 M HNO3 0.65 2M KOH 1.48
2M HNO3 1.21 4M KOH 1.86
4M HNO3 1.49 1M NH4OH 1.24
1M H2SO4 completely 2 MNH4OH completely
2M H2SO4 completely 4M NH4OH completely
4M H2SO4 completely 2M NaNO3 0.04
1 M NaOH 0.45 2M KNO3 0.09
Fig. 4.1. Particle size of the zirconium (IV) oxide ethanolamine hybrid material
The molar ratio of Zirconium and Ethanolamine is estimated to be in 1:3 ratio.So from the above
data, the tentative empirical formula for the material is sugested as [(ZrOCl2) (C2H7NO) 3]. nH2O.
The value of n in the empirical formula is found to be 6.414 by using Alberti equation (Alberti et
al., 1966, Jayshree et al., 2006)
Table - 4.3. Arsenic ion exchange capacity for different eluent concentration and chemical
analysis of zirconium (IV) oxide ethanolamine hybrid material
Ion exchange capacity Chemical analysis
Concentration of eluent (M)
Arsenic ion exchange capacity
Compounds Weight (g)
Number of moles
Molar ratio
0.2 0.98 ZrOCl2.8H2O 0.1277 0.87 10-3 1
0.4 1.67 C2H7NO 0.3225 1.27 10-3 3
0.6 2.34
0.8 3.41
1.0 4.23
1.2 4.23
1.4 4.23

RESULTS & DISCUSSION 2014
44 | P a g e
Fig. 4.2. TGA-DTA of zirconium (IV) oxide ethanolamine hybrid material
Fig. 4.3. SEM and EDX micrographs of zirconium (IV) oxide ethanolamine hybrid material (a-c)
before adsorption (b-d) after adsorption
7000 6000 5000 4000 3000 2000 1000 0
-70
-60
-50
-40
-30
-20
-10
0
0 100 200 300 400 500 600
16
18
20
22
24
26
28
ENDO
DT
A (
uV
)
DTA
Time (seconds)
We
igh
t lo
ss (
mg
)
Temperature (0C)
TG
EXO

RESULTS & DISCUSSION 2014
45 | P a g e
The thermal strength of the material is found to be very high as supported by TGA-DTA
studies. The thermogravimetric analysis (TGA) curve shows rapid weight loss up to a temperature
550 0C. However, on increasing the temperature, a sharp deflection in the TGA curve is observed
at 200–280 0C, which is due to the decomposition of organic molecule present in the matrix.
Correlating the data with differential thermal analysis (DTA), an exotherm is also noticed at 158
0C, which further supported the stability. An endothermic peak observed at 100 0C in the DTA
curve specifies the loss of water molecules present as free or bonded form in the basic matrix of
the material. From the TGA and DTA study it is confirmed that the material is stable even after
550 0C. The Scanning electron micrograph of the sample is represented in Fig. 4.3. It is observed
from the SEM micrograph of the material (a) before adsorption and (b) after adsorption, that the
material is slight porous in nature. After adsorption, the material is found to contain shine particles
covering the surface may be due to adsorption of arsenic (III) ion. The corresponding EDX of the
material clearly indicate the adsorption of arsenic on the surface of the material.
The XRD pattern of the sample is represented in Fig. 4.4. No specific peaks are obtained
indicating that the material is poorly crystalline in nature. XRD is analyzed using software as
provided by the instrument, but a very low intensity peak of zirconium oxide is found. The XRD
structure shows that the crystal system is anorthic, two theta peak obtained at 10.15o with d-
spacing 8.7 (density: 2.95 and volume of the cell is 338.5, the h, k, l values are 0,0,1) the study is
supported by the JCPDES file number 24-14 94.
Fig. 4.4. XRD pattern of zirconium (IV) oxide ethanolamine hybrid material
BET surface area is obtained to know the specific surface area and it is found to be 201.6
m2/g. In order to know the presence of different functional groups and possible structures of the
material. FT-IR study of the material is carried out and is represented in Fig. 4.5.
10 20 30 40 50 60 70
100
200
300
400
500
600
700
800
Inte
nsity (
a.u
)
2(Degree)
ZrO-EA

RESULTS & DISCUSSION 2014
46 | P a g e
4000.0 3600 3200 2800 2400 2000 1800 1600 1400 1200 1000 800 600 400.0 0.0
5
10
15
20
25
30
35
40
45
50 52.1
cm-1
%T
3293.40 1612.96 753.58
Fig. 4.5. FT-IR study of the material zirconium (IV) oxide ethanolamine hybrid material recorded in
KBr Pellet.
The presence of band at ~3293.40 cm–1 is due to –OH group, which specifies the
presence of water of crystallization. Further, the presence of a peak at ~1612.96 cm–1 in ZrO-EA
is due to the –NH bending vibration which is shifted with slight broadening after adsorption, which
is an indication of bonding between the protonated nitrogen and the arsenite. The peak at
~753.58 cm-1 in finger print region of ZrO-EA is given to metal - oxygen bonding. After adsorption,
the shift of this peak is observed with decreased intensity shows the arsenic adsorption. From the
FT-IR spectra and other studies, a probable structure is proposed in the Fig. 4.6.
Fig. 4.6. Structure of zirconium (IV) oxide ethanolamine hybrid material
4.1.2. Removal study of arsenic (III) by batch experiments
All the experiments carried out at batch mode, according to experimental methods
discussed in chapter-3, section.
4.1.2.1. Effect of adsorbent dose and pH
The effect of adsorbent dose on the removal of arsenic (III) is studied at pH 7 in ambient
temperature (25±2 oC) and contact time of 30 min with an initial arsenic (III) concentration of
10mg/L, 50mg/L and 100mg/L. The results are represented in Fig. 4.7 (a). It is evident from the

RESULTS & DISCUSSION 2014
47 | P a g e
figure that the removal of arsenic (III) increases from 88.89% to 99.90%, 88.22% to 98.25% and
87.12% to 98.16% for 0.1 – 1.0 g/100 mL of the material for the initial arsenic (III) concentration of
10mg/L, 50mg/L and 100mg/L respectively. It is observed that after dosage of 0.7g/100 mL, there
is no significant change in percentage removal of arsenic (III), it may be due to the overlapping of
active sites at higher dosage which reduces the effective surface area because of the
conglomeration of exchanger particles. So, 0.7 g/100mL is considered the optimum dose and is
used for further study. The maximum removal of arsenic (III) is found to be 98% and reduces the
arsenic level to permissible limit (WHO permissible limit is 200 ppb). Percentage removal of
arsenic (III) at different pH is studied in batch experiments using 0.7g of adsorbent in 100 mL
arsenic solution keeping all other parameter constant as in the previous studies. The results are
represented in Fig. 4.7 (b). The pH of the solution after adsorption is found to increase or
decrease slightly without any regular trend (Table 4.4). It is evident from the graph that there is no
removal at pH lower than 2 and almost 98.98 % removal at pH higher than 7 but below 10. The
similar results are reported in the removal of mercury ions from synthetic aqueous solutions by
novel magnetic p(GMA-MMA-EGDMA) beads (Bayramo˘glu et al., 2007), chromium removal by
aluminium magnesium mixed hydroxide (Li et al., 2009) and arsenic, iron and manganese
removal from simulated ground water by Fe3+ impregnated activated carbon (Mondal et al., 2008).
Fig. 4.7. Effect of zirconium (IV) oxide ethanolamine hybrid material dose and pH on % removal of
arsenic (III)
Table - 4.4. Change in pH during the removal process
Initial concentration (10 mg/L)
Initial concentration (50 mg/L)
Initial concentration (100 mg/L)
Initial pH Final pH Initial pH Final pH Initial pH Final pH
2.0 2.0 2.4 2.4 1.8 1.8
3.8 3.21 2.7 3.8 2.2 2.6
4.52 5.63 3.5 4.8 4.8 5.2
6.5 7.2 5.6 7.1 6.8 8.2
8.2 9.4 7.8 9.12 8.9 10.2
10.12 11.23 10.6 11.5 10.6 11.4
4.1.2.2. Effect of contact time and adsorption kinetics
0.0 0.2 0.4 0.6 0.8 1.0 1.2
86
88
90
92
94
96
98
100
% R
em
ov
al o
f a
rse
nic
(III)
dose (g)
10 mg/L
50 mg/L
100 mg/L
(a)
0 2 4 6 8 10 12
0
20
40
60
80
100
% R
em
ov
al o
f a
rse
nic
(III)
--------pH-------
10 mg/L
50 mg/L
100 mg/L
(b)

RESULTS & DISCUSSION 2014
48 | P a g e
The effect of contact time on adsorption of arsenic (III) is studied for initial arsenic (III)
concentration of 10mg/L, 50mg/L and 100mg/L at pH 7 keeping all other parameters constant for
different time interval. The result is represented in Fig.4.8. It is clear from the Fig. 4.8, that more
than 95 % removal occurs in first 10 min and equilibrium is reached after 50 min. This trend may
be attributed due to the fact that initially all adsorbent sites are vacant and also the solute
concentration gradient is high. In the later part, the arsenic (III) uptake rate by adsorbent
decreases significantly, due to the decrease in the number of adsorption sites as well as arsenic
(III) concentration. The rate of removal of arsenic (III) towards the end of experiments indicates
the possible monolayer formation of arsenic (III) ion on the outer surface. Several researchers
have reported similar results (Mondal et al., 2008).
The adsorption rate gives important information for designing batch adsorption systems. The
experimental data are applied to pseudo-first-order, pseudo-second-order and Intraparticle
diffusion rate constant (Weber-Morris equation) models to clarify the sorption kinetics of arsenic
(III) ions onto adsorption media.
Fig. 4.8. Time versus percentage removal of arsenic (III) by zirconium (IV) oxide ethanolamine
hybrid material, with initial concentration of 10 mg/L, 50 mg/L and 100 mg/L.
4.1.2.2.1. Lagrgren’s rate equation
To understand the efficiency of adsorption process requires a sound observation on the
kinetics of uptake of adsorbate by adsorbent or the time dependency of the concentration
distribution of the solute in both bulk solution and solid adsorbent and identification of the rate
determining step. The study of kinetics of adsorption process describes the solute uptake rate.
The rate constant Kad for sorption of arsenic (III) is studied by Lagergren rate equation (Lagergren,
1898; Zhang et al., 2007), for initial concentration of 10 mg/L, 50mg/L and 100 mg/L by the
following equation.
(
)
Where qe and q (both in mg/g) are the amounts of arsenic (III) adsorbed at equilibrium and at
time‘t’, respectively. The plots of Log (qe – q) versus t at different time interval is almost linear,
which indicates the validity of Lagergren rate equation of first order kinetics. The adsorption rate
0 10 20 30 40 50 60 70 80 90
95
96
97
98
99
100
% R
em
ov
al o
f a
rse
nic
(III)
Contact time (Minutes)
10 mg/L
50 mg/L
100 mg/L

RESULTS & DISCUSSION 2014
49 | P a g e
constant (kad), is calculated from the slope and shown in the Fig 4.9. The adsorption rate constant
(kad), calculated from the slope of the above plot is presented in Table 4.5. The activation energy
of the reaction is calculated by using arrhenius equation and it is found to be 23.5 kJ/mol, 26.3
kJ/mol and 34.3 kJ/mol respectiviely for initial As(III) concentration of 10 mg/L, 50 mg/L and 100
mg/L. The data suggest chemisorption nature of the adsorption process. Similar results are
reported in the adsorption of Zn(II), Cd(II) and Hg(II) from aqueous solution using zinc oxide
nanoparticles (Sheela et al., 2012), adsorption of Hg(II) and Cr(VI) by polyaniline/humic acid
composite (Li et al., 2011), and chromium ions removal by modified magnesia cement (Gasser et
al., 2007).
Table - 4.5. Rate constants (kad) obtained from the graph for different initial concentration of
arsenic (III)
Fig. 4.9. Linear plot of Lagergren rate equation using zirconium (IV) oxide ethanolamine hybrid
material, time versus Log (qe-q) with initial arsenic (III) concentration of 10 mg/L, 50 mg/L and 100
mg/L.
4.1.2.2.2 Helfferich rate equation
It is a well-developed fact that the adsorption of ions or molecules in aqueous solution
follows reversible first order kinetics, when a single species is considered on a heterogeneous
surface. Kinetics of adsorption describing the solute uptake rate is one of the important
characteristics defining the efficiency of adsorption. Hence in the present study, the kinetics of
arsenic (III) adsorption using Helfferich equation has been carried out to understand the behaviour
of adsorbents used in this study. The adsorption of arsenic (III) from a liquid phase to solid phase
may be expressed as (Helfferich, 1962)
10 20 30 40 50
-0.7
-0.6
-0.5
-0.4
-0.3
-0.2
-0.1
0.0
0.1
0.2
0.3
0.4
0.5
0.6
0.7
log
(q
e-q
)
Time (Minutes)
10 mg/L
50 mg/L
100 mg/L
1st Order
Adsorbent used Initial concentration (mg/L) kad (min-1) R2
ZrO-EA
10 0.02386 0.981
50 0.02845 0.972
100 0.01456 0.976

RESULTS & DISCUSSION 2014
50 | P a g e
←
→
Where k1 is the forward rate constant and k2 is the backward rate constant. ‘A’ represents arsenic
(III) remaining in the aqueous solution and ‘B’ represents arsenic (III) adsorbed sites on the
surface of adsorbent. Since the reaction in both directions is of first order, the resultant rate
expression for the reaction, given by Helfferich is (Helfferich, 1962)
[ ]
Where C0, Ct and Ce are the initial arsenic (III) concentration, concentration at time‘t’ and
concentration at equilibrium. U (t) is called as fractional completion of equilibrium of arsenic (III).
The rate constant K’ using Helfferich equation for the adsorption of arsenic (III) at 25±2 0C and at
neutral pH was determined by batch mode experiments for the ZrO-EA used in this study. The
data obtained from Helfferich equation are presented in Table 4.6. The straight line plots of ln [1-U
(t)] versus time‘t’ indicate that the adsorption of arsenic (III) from aqueous solution follows first
order kinetics with respect to adsorbent as shown in Fig. 4.10. The slope of the straight line plots
give the overall rate constant k’ for arsenic (III) adsorption process. The forward (k1) and
backward rate constant (k2) were calculated using the following equation:
[
] [
]
Where Kc is the equilibrium constant. The data obtained are presented in Table 4.7.
Table - 4.6. Rate constants (k’) obtained from the graph for different initial concentration of arsenic
(III)
Adsorbent used Initial concentration (mg/L)
Rate constants in min-1 (k’)
R2
ZrO-EA
10 0.040 0.906
50 0.051 0.945
100 0.075 0.804
Table - 4.7. Rate constants (k1 and k2) obtained from the equation, for different concentration of
arsenic (III)
Adsorbent used
Initial concentration (mg/L)
Overall rate constant (k’) (min -1)
Forward rate constant k1 (min -1)
Backward rate constant k2
(min -1)
ZrO-EA 10 0.040 0.037 0.0032
50 0.051 0.047 0.0046
100 0.075 0.068 0.0066
It is well evident that, the forward rate constants are higher than the backward rate
constants suggesting that the rate of reaction is clearly dominant. Similar results have been
reported in the removal of chromium (VI) by activated ground nut husk carbon (Periasamy et al.,
1995), adsorption of copper (II) on iron oxide modified sepiolites (Eren et al., 2010) and heavy
metal adsorption in nitrogen-doped magnetic carbon nanoparticles (Shin et al., 2011).

RESULTS & DISCUSSION 2014
51 | P a g e
Fig. 4.10. Linear plot of Helfferich equation using zirconium (IV) oxide ethanolamine hybrid
material, time versus ln [1-U (t)] with initial arsenic (III) concentrations of 10 mg/L, 50 mg/L and
100 mg/L.
4.1.2.2.3. Second order rate equation
The data of experiments are tested with second order rate equation. The second order
rate equation can be expressed as (Gasser et al., 2007),
Where K2 is the rate constant of second order equation (g/mg/min). qt is the amount of arsenic
adsorbed per unit gram of adsorbent (in mg/g) at time ‘t’ and qo is the maximum adsorption
capacity (mg/g) for the second order adsorption.
Fig. 4.11. Linear plot of second order rate equation using zirconium (IV) oxide ethanolamine
hybrid material, time ‘t’ versus t/qt with initial arsenic (III) concentration of 10 mg/L, 50 mg/L and
100 mg/L.
The kinetic plot of t/qt versus t is represented in Fig 4.11.The kinetic data for the
adsorption of arsenic (III) onto ZrO-EA are calculated from the related plots and are presented in
10 20 30 40 50
-9
-8
-7
-6
-5
-4
-3
ln [1
-U(t
)]
Time in minutes
10 mg/L
50 mg/L
100 mg/L
10 20 30 40 50
-0.5
0.0
0.5
1.0
1.5
2.0
2.5
3.0
3.5
4.0
4.5
t/q
t
Time (Minutes)
10 mg/L
50 mg/L
100 mg/L

RESULTS & DISCUSSION 2014
52 | P a g e
Table 4.8. The coefficient of determination (R2) for second order is less than that of Lagrgren’s
first order rate equation, which indicates that, first order rate equation is best fitted model. The
study suggests that the adsorption process followed the first order kinetics.
Table - 4.8. Rate constants (k2) obtained from the graph for different initial concentration of arsenic (III)
4.1.2.2.4. Intraparticle diffusion rate constant (Weber-Morris equation)
In order to understand the diffusion process, batch adsorption experiments are carried out
with ZrO-EA at 25±2 0C keeping all other parameters same as in the previous studies. Due to
excessive stirring in batch adsorption process, there is a possibility of transport of arsenic (III) ions
from the bulk into pores of the adsorbent as well as adsorption at outer surface of the adsorbent.
The rate-limiting step may be either adsorption or intraparticle diffusion. To understand the
diffusion of arsenic (III) ions into the sites of the adsorbents is tested with Weber-Morris equation
as represented below: (Weber and Morris, 1963)
Fig. 4.12. Linear plot of Weber- Morris equation using zirconium (IV) oxide ethanolamine hybrid
material, square root of time versus qe with initial arsenic (III) concentration of 10 mg/L, 50 mg/L
and 100 mg/L.
Where qe is the amount of arsenic (III) adsorbed in mg, kp is the intraparticle diffusion rate
constant and ‘t’ is the time in minutes. The results obtained from the plot were presented in Table
4.9 and graphically represented in the Fig. 4.12. The rate constants (kp) for intraparticle diffusion
for various initial concentration of arsenic (III) solution, for the adsorbents are determined from the
slope of respective plots. It is clear from the figure that the straight lines is not passing through the
origin suggesting that intraparticle diffusion is not the sole rate-limiting step for the adsorption of
1 2 3 4 5 6 7
0
1
2
3
4
5
6
7
qe
t
10 mg/L
50 mg/L
100 mg/L
2nd order
Adsorbent Used Initial concentration (mg/L) k2 (g/mg/min) qo(mg/g) R2
ZrO-EA 10 0.00878 10.47 0.967
50 0.00702 10.95 0.904
100 0.00558 11.91 0.753

RESULTS & DISCUSSION 2014
53 | P a g e
arsenic (III). The study by Zhang et al. (2007), Badruzzaman et al. (2004) and Huang et al.
(2009), has shown the similar results.
Table - 4.9. Intraparticle diffusion rate constants obtained from Weber- Morris equation for
different initial concentration of arsenic (III)
Weber Morris
Adsorbent used
Initial concentration (mg/L)
kp C R2
ZrO-EA
10 1.049 2.85 0.797
50 1.401 3.87 0.882
100 1.597 3.77 0.884
4.1.2.3. Effect of temperature
The effect of temperature on the adsorption of arsenic (III) with initial concentration
10mg/L, 50 mg/L and 100 mg/L is studied keeping all parameters constant at different
temperature. The results are represented in Fig. 4.13.
Fig. 4.13. Percentage removal of arsenic (III) versus Temperature for zirconium (IV) oxide
ethanolamine hybrid material, initial arsenic (III) concentrations of 10 mg/L, 50 mg/L and 100
mg/L.
The percentage removal of arsenic (III) increases from 84.99% to 99.83%, 88.56% to
99.90% and 89.90% to 99.92% for initial arsenic (III) concentration of 10mg/L, 50 mg/L and 100
mg/L respectively for an increase in temperature from 25 to 45 C. It can be clearly seen from the
figure that the percentage removal increase slowly and reached almost 99.82 % with the increase
in temperature from 25 C to 45 C which indicates the endothermic nature of the adsorption
process. Although the increase in adsorption with the increase in temperature is difficult to
explain, many researchers have reported it and this may be probably due to decrease in the
escaping tendency of the adsorbate species from the surface of the adsorbent. The enhanced
adsorption of arsenic (III) may also be due to change in pore size and enhanced rate of
intraparticle diffusion. The same trend was reported by Rengaraj et al. (2001), in removal of
chromium from water using ion exchange resins. The increase in arsenic adsorption with increase
in temperature could be dissociation of some compounds present in the adsorbent, which may
10 20 30 40 50 60 70
84
86
88
90
92
94
96
98
100
% R
em
ov
al o
f a
rse
nic
(III)
Temperature (0C)
10 m/L
50 mg/L
100 mg/L

RESULTS & DISCUSSION 2014
54 | P a g e
offer more adsorption sites for adsorption of arsenic (III). The H+ adsorbent bond is significant
because adsorption of arsenic (III) involves movement of H+ ions from the adsorbent surface.
Therefore it may be concluded that at higher temperatures, the increase in removal efficiency
could be due to the waning of H+ adsorbent bond which subsequently increases the percentage
removal.
4.1.2.4. Thermodynamic parameters
Further, it is supported by the value of thermodynamic parameters. The change in free
energy (G), enthalpy (H) and entropy (S) of adsorption are calculated by using the following
equations, (Chen et al., 2011; Argun et al., 2007; Raji et al., 1998):
Where S and H are the changes in entropy and enthalpy of adsorption respectively.
A plot of logs Kc versus 1/T for initial arsenic (III) concentration of 10mg/L, 50mg/L and 100mg/L is
found to be linear (Fig. 4.14).
The CK Value is calculated by using the following equation, (Manuj et al., 1988).
Where C1 is the amount of arsenic (III) ion adsorbed per unit mass of adsorbent and C2 is the
concentration in aqueous phase. Values of H and S are evaluated from slope and intercept of
Van’t Hoff Plot presented in Table 4.10.
Fig. 4.14. Van’t Hoff plot, log Kc versus 1/T for zirconium (IV) oxide ethanolamine hybrid material
The positive value of entropy (S) indicates the increase in randomness of the ongoing
process and hence good affinity of arsenic with the hybrid material. Negative value of G at each
temperature indicates the feasibility and spontaneity of ongoing adsorption (Malik et al., 2005). A
decrease in values of G with increase in temperature suggests more adsorption of arsenic (III) at
higher temperature which indicates the endothermic nature of the process.

RESULTS & DISCUSSION 2014
55 | P a g e
It is once again confirmed by the positive value of enthalpy (H). Positive value of enthalpy (H)
suggests that entropy is responsible for making G value negative. So, the adsorption process is
spontaneous since the entropy contribution is much larger than that of enthalpy. The value of G
also suggest the chemisorption nature of the adsorption process. Similar results were reported by
Yildiz et al. (2010) for removal of heavy metal ions from aqueous solutions by novel pH-sensitive
hydrogels and by Sarkar et al. (2010) for hexavalent chromium adsorption by bentonite based
Arquad® 2HT-75 organoclays.
Table - 4.10. Thermodynamic parameters using synthetic arsenic (III) solution of 10 mg/L, 50
mg/L, and 100 mg/L
Initial Conc (mg/L)
H (kJ/mol)
S (kJ/(K mol)
G (kJ/mol) R2
283 K 293 K 303 K 313 K 323 K
10 0.0536 7.264 -17.759 -17.869 -17.975 -18.077 -18.176 0.9993
50 0.0430 7.405 -18.264 -18.264 -18.330 -18.510 -19.268 0.9357
100 0.0404 7.705 -19.014 -19.084 -19.158 -19.266 -19.345 0.9943
4.1.2.5. Effect of initial arsenic (III) concentration and adsorption Isotherm
The adsorption of arsenic (III) onto hybrid material is studied by varying initial arsenic (III)
concentration keeping all other parameter constant for a contact time of 30 min. The results are
represented in graphical form in Fig. 4.15. The removal percentage gradually increases from
99.52 % to 99.92 % with increase in initial arsenic (III) concentration from 10mg/L to 100 mg/L.
Fig. 4.15. Percentage removal of arsenic (III) by zirconium (IV) oxide ethanolamine hybrid material
versus initial concentration
It is cleared from the figure that, there is an appreciable increase in removal percentage
with increase in initial arsenic (III) concentration due to the fact that at higher adsorbate
concentration, the free sites available approaches saturation. From the above data it is clear that
the removal method can be implemented to remove arsenic (III) from water present in any
concentration.
4.1.2.6. Adsorption Isotherm
0 10 20 30 40 50 60 70 80
99.5
99.6
99.7
99.8
99.9
100.0
% R
em
ov
al o
f a
rse
nic
(III)
Initial concentration of arsenic (III)
Arsenic (III)

RESULTS & DISCUSSION 2014
56 | P a g e
It is important to have a satisfactory description of the equilibrium state between the two
phases in order to successfully represent the dynamic behavior of any adsorbate from solution to
the solid (adsorbent) phase. Adsorption isotherm can be defined as a functional expression for the
variation in adsorption of the adsorbate by the adsorbent in the bulk solution at constant
temperature. The capacity of ZrO-EA hybrid material can be described by equilibrium adsorption
isotherm, which is characterized by certain constants whose values express the surface
properties and affinity of the adsorbent (Shin et al., 2011; Dantas et al., 2001). The analysis of the
isotherm data is important to develop an equation which accurately represents the results and
could be used for design purpose. An analysis of the adsorption isotherm is important to develop
and represent the results accurately for design purpose. Batch mode adsorptions are carried out
at room temperature by varying the concentration of arsenic (III).
4.1.2.6.1. Langmuir Isotherm
The Langmuir isotherm was developed by Irving Langmuir in 1916. The Langmuir
adsorption isotherm states significant build-up of a layer of molecules on an adsorbent surface as
a function of the concentration of the adsorbed material in the aqueous medium in which it is in
contact. Langmuir assumed that a surface consists of a given number of equivalent sites where a
species can physically or chemically attach. Physical adsorption through Van der Waals
interactions is called Physisorption, whereas chemical adsorption through the formation of a
covalent bond is called chemisorption. It is important to realize that the processes of adsorption
and desorption is dynamic. The Langmuir isotherm is the simplest of all mechanistic models and it
is based on the following inference:
(a) Adsorption cannot continue beyond monolayer coverage onto a surface containing
predetermined number of adsorption sites.
(b) All adsorption sites are equal (with constant energies of adsorption) and can
accommodate, at the most, one molecular or atomic species of the adsorbate.
(c) Adsorbate species on different sites do not relate with each other and there is no
movement of adsorbate on the plane of the surface.
When the entire surface of the adsorbent is covered by a unimolecular layer of the adsorbate,
further adsorption is not possible and it specifies a saturation of adsorption process. The
Langmuir equation relates the amount of adsorbate adsorbed with the equilibrium aqueous
concentration. The adsorption data are fitted to linearly transformed Langmuir isotherm. The
linearized Langmuir equation, which is valid for monolayer sorption onto a surface with finite
number of identical sites, is given by (Langmuir, 1918; Namasivayam et al., 1995; Messina et al.,
2006) the following equation,
oeoe qbCqq
111
Where qo is the maximum amount of the arsenic (III) ion adsorbed to the hybrid material to form a
complete monolayer on the surface, (adsorption capacity), Ce denotes equilibrium adsorbate
concentration in solution, and qe is the amount adsorbed per unit mass of adsorbent, and b is the
binding energy constant. The linear plot of 1/ Ce versus 1/ qe (Fig. 4.16) with R2 = 0.972 indicates

RESULTS & DISCUSSION 2014
57 | P a g e
the applicability of Langmuir adsorption isotherm. The values obtained are presented in Table
4.11. In order to predict the adsorption efficiency of the adsorption process, the dimensionless
equilibrium parameter is determined by using the following equation (Namasivayam et al., 1995;
Raji et al.,1998).
obCr
1
1
Where Co is the initial concentration, Values of r<1 represent favorable adsorption, r>1 represents
unfavourable adsorption, r=1 represents linear adsorption and r=0 represents irreversible
adsorption. In the present work obtained r values indicates a favorable system.
Fig. 4.16. Langmuir adsorption isotherm, 1/Ce versus 1/qe for zirconium (IV) oxide ethanolamine
hybrid material
Table - 4.11. Langmuir isotherm parameters for arsenic (III) removal by zirconium (IV) oxide ethanolamine
Langmuir Isotherm
ZrO-EA qo b R2
0.25002 mg/g 0.03572 L/mg 0.972
(r) dimensionless equilibrium parameter
10 mg/L 0.9655
50 mg/L 0.8715
100 mg/L 0.7212
4.1.2.6.2. Freundlich Isotherm
Herbert Max Finley Freundlich, a German physical chemist, presented an empirical
adsorption isotherm for non-ideal systems in 1906. The Freundlich isotherm is the earliest known
relationship relating the adsorption equation. The Freundlich equation is used for determining the
applicability of heterogeneous surface energy in the adsorption process. The empirical Freundlich
equation (Freundlich, 1906) is,
0.0000 0.0002 0.0004 0.0006 0.0008 0.0010
0.000
0.001
0.002
0.003
0.004
0.005
0.006
0.007
0.008
1/q
e in
g/m
g
1/Ce in L/mg
arsenic(III)

RESULTS & DISCUSSION 2014
58 | P a g e
This empirical equation when expressed in logarithmic form becomes a straight line equation with
a slope of 1/n and y-intercept of log Kf. The linear form of Freundlich equation (Camargo et al.,
2014) is represented as,
Where qe is the amount adsorbed per unit mass of adsorbent (mg/g), Ce is the equilibrium
adsorbate concentration in solution (mg/L), Kf and ‘n’ are Freundlich constants related to the
adsorption capacity and adsorption intensity respectively. Freundlich adsorption data for arsenic
(III) onto ZrO-EA hybrid material is given in Table 4.12 and graphically represnted in Fig. 4.17.
Table - 4.12. Freundlich constant for arsenic (III) removal by zirconium (IV) oxide ethanolamine hybrid material
Freundlich isotherm
ZrO-EA Kf n R2
0.1337 0.9652 0.954
Fig. 4.17. Freundlich adsorption isotherm, log Ce versus log qe for zirconium (IV) oxide
ethanolamine hybrid material
It is clear that Langmuir isotherm fits better than Freundlich isotherm on the basis of
correlation coefficient values. The values of 1/n (>1) indicates unfavourable nature of the
isotherm for arsenic (III) onto ZrO-EA hybrid material. The value of Kf (Freundlich
constant=0.1337) indicates affinity of As (III) species (Messiana et al., 2006). The value of
Freundlich parameters also reflects the numbers of sorptive sites (Manju et al., 1998). The values
of n (intensity of adsorption) between 1 and 10 (i.e., 1/n less than represents a favorable
adsorption). For the present study the value of n represented the same trend of a beneficial
adsorption (Manju et al., 1998).
4.1.2.6.3. Dubinin-Radushkevich (D-R) Isotherm
The development of Dubinin-Radushkevich equation was prompted by the failure to
extend the theories governing adsorption on non-porous solids to that on real, porous solids such
1.0 1.5 2.0 2.5 3.0 3.5 4.0 4.5 5.0
2.0
2.5
3.0
3.5
4.0
log
qe
log Ce
arsenic (III)

RESULTS & DISCUSSION 2014
59 | P a g e
as activated carbon, synthetic zeolites and dehydrated inorganic gels (Dubinin, 1966, 1975). This
lack of success led Dubinin and co-workers to focus their investigation on the problem of physical
adsorption on porous materials and resulted in the Dubinin-Polanyi theory of micropore filling
(also known as the theory of volume filling of micropores (TVFM)). This theory is based on the
postulate that the mechanism for adsorption in micropores is that of pore filling rather than a layer-
by layer formation of a film on the walls of the pores. The D-R equation is an adaptation of the
earlier Polanyi potential theory of adsorption (Dubinin and Stoeckli, 1980; Gregg and Sing, 1982).
The D-R equation has been effectively used to describe adsorption by microporous solids
(Stoeckli et al., 1980). The D-R equation seems to be particularly useful in describing adsorption
by microporous sorbents (Dubinin and Stoeckli, 1980). The linearized Dubinin Radushkevich
equation can be written as,
2lnln Kqq me
Where ε is Polanyi potential, and is equal to RT ln (1 + 1/ Ce), where qe is the amount of arsenic
(III) adsorbed per unit mass of adsorbent, qm is the theoretical adsorption capacity, Ce is the
equilibrium concentration of arsenic (III), K is the constant related to adsorption energy, R is the
universal gas constant and T is the temperature in Kelvin. The data obtained from D-R isotherm
(Fig. 4.18) is presented in Table 4.13.
Fig. 4.18. D-R adsorption isotherm, ln qe versus ε2 for arsenic (III) removal by zirconium (IV) oxide
ethanolamine
The mean free energy of adsorption (E) was calculated from the constant K using the relation
(Namasivayam et al., 1995)
21)2( kE
It is defined as the free energy change when one mole of ion is transferred to the surface
of the solid from infinity in the solution. The value of E is very useful in predicting the type of
adsorption and if the value is less than 8 kJ/mol then the adsorption is physical in nature and if it
is in between 8 and 16 kJ/mol, then the adsorption is chemisorption’s or due to exchange of ions
2000 3000 4000 5000 6000 7000 8000
-9.0
-8.5
-8.0
-7.5
-7.0
-6.5
-6.0
-5.5
-5.0
ln q
e
arsenic(III)
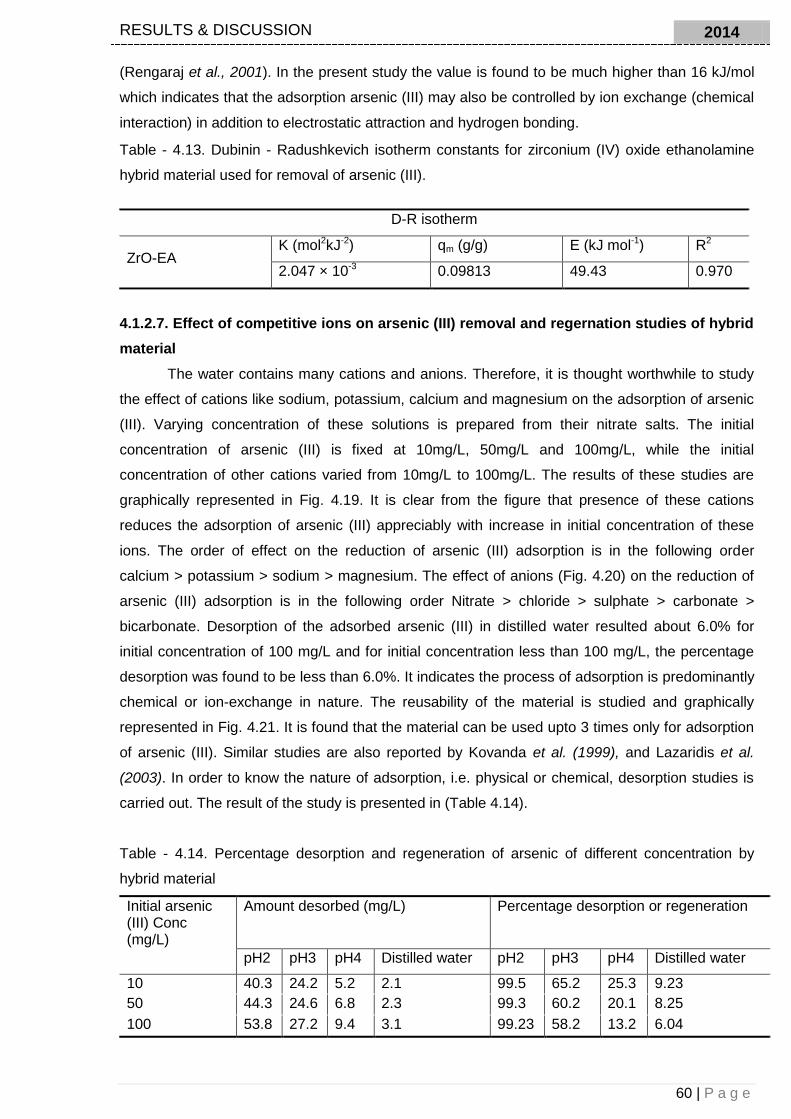
RESULTS & DISCUSSION 2014
60 | P a g e
(Rengaraj et al., 2001). In the present study the value is found to be much higher than 16 kJ/mol
which indicates that the adsorption arsenic (III) may also be controlled by ion exchange (chemical
interaction) in addition to electrostatic attraction and hydrogen bonding.
Table - 4.13. Dubinin - Radushkevich isotherm constants for zirconium (IV) oxide ethanolamine
hybrid material used for removal of arsenic (III).
D-R isotherm
ZrO-EA K (mol2kJ-2) qm (g/g) E (kJ mol-1) R2
2.047 × 10⁻³ 0.09813 49.43 0.970
4.1.2.7. Effect of competitive ions on arsenic (III) removal and regernation studies of hybrid
material
The water contains many cations and anions. Therefore, it is thought worthwhile to study
the effect of cations like sodium, potassium, calcium and magnesium on the adsorption of arsenic
(III). Varying concentration of these solutions is prepared from their nitrate salts. The initial
concentration of arsenic (III) is fixed at 10mg/L, 50mg/L and 100mg/L, while the initial
concentration of other cations varied from 10mg/L to 100mg/L. The results of these studies are
graphically represented in Fig. 4.19. It is clear from the figure that presence of these cations
reduces the adsorption of arsenic (III) appreciably with increase in initial concentration of these
ions. The order of effect on the reduction of arsenic (III) adsorption is in the following order
calcium > potassium > sodium > magnesium. The effect of anions (Fig. 4.20) on the reduction of
arsenic (III) adsorption is in the following order Nitrate > chloride > sulphate > carbonate >
bicarbonate. Desorption of the adsorbed arsenic (III) in distilled water resulted about 6.0% for
initial concentration of 100 mg/L and for initial concentration less than 100 mg/L, the percentage
desorption was found to be less than 6.0%. It indicates the process of adsorption is predominantly
chemical or ion-exchange in nature. The reusability of the material is studied and graphically
represented in Fig. 4.21. It is found that the material can be used upto 3 times only for adsorption
of arsenic (III). Similar studies are also reported by Kovanda et al. (1999), and Lazaridis et al.
(2003). In order to know the nature of adsorption, i.e. physical or chemical, desorption studies is
carried out. The result of the study is presented in (Table 4.14).
Table - 4.14. Percentage desorption and regeneration of arsenic of different concentration by
hybrid material
Initial arsenic (III) Conc (mg/L)
Amount desorbed (mg/L) Percentage desorption or regeneration
pH2 pH3 pH4 Distilled water pH2 pH3 pH4 Distilled water
10 40.3 24.2 5.2 2.1 99.5 65.2 25.3 9.23
50 44.3 24.6 6.8 2.3 99.3 60.2 20.1 8.25
100 53.8 27.2 9.4 3.1 99.23 58.2 13.2 6.04

RESULTS & DISCUSSION 2014
61 | P a g e
Fig. 4.19. Percentage removal of arsenic (III) with zirconium (IV) oxide ethanolamine versus initial cation concentration of solution (Initial arsenic (III) concentration of 10, 50 and 100 mg/L).
0 20 40 60 80 100
10
15
20
25
30
35
40
45
50
% r
em
ova
l o
f a
rse
nic
(III)
Initial cation concentration (mg/L)
Sodium
Calcium
Potassium
Magnesium
arsenic (III)- (50 mg/L)
0 20 40 60 80 100
25
30
35
40
45
50
55
60
% r
em
ova
l o
f a
rse
nic
(III)
Initial cation concentration (mg/L)
Sodium
Calcium
Potassium
Magnesium
arsenic (III)- 10 mg/L
0 20 40 60 80 100
20
25
30
35
40
45
50
55
60
65
70
% r
em
ova
l o
f a
rse
nic
(III)
Initial cation concentration (mg/L)
Sodium
Calcium
Magnesium
Potassium
arsenic (III)-(100 mg/L)

RESULTS & DISCUSSION 2014
62 | P a g e
Fig. 4.20. Percentage removal of arsenic (III) with zirconium (IV) oxide ethanolamine versus initial
anion concentration of solution (Initial arsenic (III) concentration of 10, 50 and 100 mg/L).
Fig. 4.21. Reusability studies of zirconium (IV) oxide ethanolamine hybrid material
4.1.3. Removal study of arsenic (III) by column experiments
The efficiency of removal technique depends on the concentration of arsenic (III) in a
source of water. Fixed bed column study is carried out with a column as discussed in Chapter-3,
section 3.16, at different flow rate. The method reported by Korte and Fernado 1991, can be
employed to design the column. In the present study the column is charged with synthetic arsenic
(III) water in up-flow mode with an approach velocity of 210 cm/h, the breakthrough curve for
synthetic sample at different bed depth and flow rate is represented in Fig. 4.22 and Fig. 4.23. It is
important to mention that breakthrough means the permissible concentration of the pollutant in
effluent water of the column. In the present study the maximum permissible limit is 0.005 mg/L.
the breakthrough time (corresponding to Ceff/C0= 0.002, where Ceff= effluent arsenic (III)
concentration = 0.005 mg/L, and C0 = initial arsenic (III) concentration = 5 mg/L) and exhaust time
Absence of Salt Chloride Sulphate Nitrate Carbonate Bicarbonate
0
20
40
60
80
100
% R
em
ova
l of a
rse
nic
(III)
anion concentration
10 mg/L
50 mg/L
100 mg/L
0 5 10 15 20
0
10
20
30
40
50
60
70
80
90
100
% R
em
ova
l o
f a
rse
nic
(III)
---- dose (mg/L)----
Fresh adsorbent
First use
Second use
Third use
arsenic (III) -10 mg/L

RESULTS & DISCUSSION 2014
63 | P a g e
zirconium (IV) oxide ethanolamine hybrid material were found to be 12 h. The data obtained from
the plot by carrying out mathematical analysis as discussed in Section 3.1.6.3, is presented in
Table 4.15. The fixed bed column is designed by logit method (Vieira et al., 2008), the equation is
represented as,
[
]
Where, Ceff = effluent concentration of solute at any time t, C0= initial solute concentration, V =
approaching velocity (210 cm/h), X = bed height, K = adsorption rate constant (Lmg/h), N0 =
adsorption capacity (mg/L). Plot of ln [Ceff/C0-Ceff] versus time ‘t’ gives a straight line with slope
KC0 and intercept –XKN0/V from which, K and N0 were calculated (Fig. 4.24 and Fig. 4.25).
Fig. 4.22. Breakthrough curve at different bed depth for zirconium (IV) oxide ethanolamine C/C0
versus time (t) in hours, initial arsenic (III) concentration- 5mg/L
Fig. 4.23. Breakthrough curve at different flow rate for zirconium (IV) oxide ethanolamine C/C0
versus time (t) in hours, initial arsenic (III) concentration- 5mg/L
0 5 10 15 20 25 30
0.0
0.1
0.2
0.3
0.4
0.5
0.6
0.7
0.8
0.9
Ce
ff/C
o
Time in Hours
5 cm
10 cm
15 cm
0 5 10 15 20 25 30
0.0
0.2
0.4
0.6
0.8
1.0
Ce
ff/C
o
Time in Hours
2.5 mL/min
5.5 mL/min
7.5 mL/min

RESULTS & DISCUSSION 2014
64 | P a g e
Fig. 4.24. Logit equation for different bed depth for zirconium (IV) oxide ethanolamine ln[Ceff/(Co-
Ceff)] versus time ‘t’, initial arsenic (III) concentration- 5mg/L
Fig. 4.25. Logit equation for different flow rate for zirconium (IV) oxide ethanolamine ln [Ceff/ (Co-
Ceff)] versus time‘t’, initial arsenic (III) concentration- 5mg/L
The fixed bed column adsorption capacity (Q) is calculated by following equation,
Q = (Bt x Co x f)/ (mass of the adsorbent (g))
Where Q is adsorption capacity theoretically, Bt is the breakthrough time and f is the flow rate.
The study shows that with bed height of 5 cm, the removal percentage and adsorption efficiency
decreases, however with increase in bed height upto 10 cm the removal efficiency and adsorption
capacity increases, but with bed height of 15 cm the removal efficiency increases initially, but
adsorption efficiency decreases after predetermined time. The reason may be due to the fact that,
with increase in bed depth the effective flow rate decreases and overlapping of adsorbate to
adsorbent sites which result decrease in removal and adsorption efficiency. The data presented in
Table 4.15 suggest that with bed depth of 10 cm and flow rate 5.5 mL/min, the effective removal
of arsenic (III) can be achieved through column mode. A study by Amiri et al. (2004) and Chen et
al. (2012), shows similar results.
0 5 10 15 20 25 30
-4.0
-3.5
-3.0
-2.5
-2.0
-1.5
-1.0
-0.5
0.0
0.5
1.0
1.5
2.0
ln(C
eff/(
Co
-Ce
ff)
Time in hours
5 cm
10 cm
15 cm
0 5 10 15 20 25 30
-4.0
-3.5
-3.0
-2.5
-2.0
-1.5
-1.0
-0.5
0.0
0.5
1.0
1.5
2.0
2.5
3.0
3.5
4.0
4.5
5.0
ln [C
eff/(
C0-C
eff)]
Time in hours
2.5 mL/min
5.5 mL/min
7.5 mL/min

RESULTS & DISCUSSION 2014
65 | P a g e
Table – 4.15. Column adsorption parameters for arsenic (III) removal by zirconium (IV) oxide
ethanolamine hybrid material
Arsenic (III) Conc (Co)
Be
d d
ep
th (
D)
cm
Flo
w r
ate
(f)
Approach velocity in cm/hr
Bt
(h) Et
(h)
Q
(mg/g
)
Re
mo
va
l %
Logit Method
N0
mg
/l
Adsorption rate constant k (Lmg/h)
R2
5 mg/L
5 2.5 210 12 24 150 95 2.68 0.111 0.976
10 2.5 210 16 24 200 96.2 3.14 0.178 0.975
15 2.5 210 7 25 87.5 97.2 3.47 0.120 0.979
5 2.5 210 7 26 87.5 97.8 3.99 0.102 0.976
5 5.5 210 8 22 220 96.8 4.62 0.320 0.950
5 7.5 210 4 16 150 95 3.10 0.300 0.934
4.1.4. Mechanism of adsorption of arsenic (III) on ZrO-EA hybrid material
The mechanism of adsorption process is an important constituent in understanding the
process as well as to understand the characteristics of the adsorbent material which help to
design a new adsorbent for future applications. A mechanism for the adsorption of arsenic (III) by
hybrid material Zirconium (IV) oxide-ethanolamine (ZrO-EA) has been proposed by taking the
results obtained from the experimental investigations and computing the results using
mathematical/theoretical models. The uptake of arsenite by ZrO-EA may be due to a proton
shifting mechanism, which occurs from the acidic site of the material to the adsorbed organic
molecule to form a protonated amine (Scheme 1). At lower pH of the medium, surface sites are
positively charged and, therefore, attract negatively charged arsenite by an electrostatic attraction
process. The materials under hydration, the zirconium surface completes the coordination shells
with the available OH group. On the variation of pH, these surface active OH groups may further
bind or release H+ where the surface remains positive due to the reaction,
MOH + H3O+ -------- MOH2
+ + H2O
Thus, when pH < 7.00, the overall arsenite adsorption mechanism can be represented in three
different forms:
1. Electrostatic attraction between positively charged center (nitrogen) and negatively
charged arsenite molecule in solution
2. Eelectrostatic attraction between positively charged surface hydroxyl group and arsenite
(Electrostatic attraction)
MOH + H3O+ + AsO3
-- --------------- MOH2 +-- AsO3
-- + H2O
3. Ion-exchange reaction between positively charged metal center and arsenite
MOH + H3O+ + AsO3
-- ------ M+--- AsO3-- + 2H2O
Further, when the pH of the medium remains relatively in a neutral range, (pH 7.00), the Arsenic
(III) adsorption onto the neutral solid surface can be described by a ligand or ion exchange
reaction mechanism, which is represented as:
MOH + AsO3-- --------- M+ --- AsO3
-- + OH-

RESULTS & DISCUSSION 2014
66 | P a g e
The above proposed mechanism is supported by notable increase of pH in equilibrium
solution. In light of the above-mentioned mechanism of adsorption, it may be further noted that
ZrO-EA showed adsorption capacity at a wide pH range, which could be useful for commercial
exploitation purpose. The role of ethanolamine in the material is 2-fold.
Fig. 4.26. Adsorption mechanism for arsenic (III) removal from water by zirconium (IV) oxide
ethanolamine hybrid material
First, the attachment of ethanolamine to the structure develops nucleophilicity. Second,
the attachment of the ethanolamine could be responsible for the development of porosity in the
structure and for imparting a large specific surface area after the process of drying. Further, the
ethanolamine may also combine with the zirconium to form a layer where the neighbouring
particles could be interconnected.

RESULTS & DISCUSSION 2014
67 | P a g e
4.2. Removal of Arsenic (III) by Zirconium polyacrylamide (ZrPACM - 43) hybrid material
The synthesis, characterization and removal of arsenic (III) by using zirconium
polyacrylamide (ZrPACM - 43) hybrid material by adsorption process are reported in this section.
The effects of various parameters on adsorption by batch and column mode experiments are also
reported. Reusability, regeneration and effect of other competing ions on arsenic (III) adsorption
are also reported.
4.2.1. Characterization of zirconium polyacrylamide (ZrPACM - 43) hybrid material hybrid
material
A series of samples of zirconium polyacrylamide hybrid material are prepared with the
variation of the precursor’s molar concentration. The particle size and surface area of the material
are presented in Table 4.16. From the table, material represented as ZrPACM – 43 is having the
lowest particle size (Fig. 4.27) and highest surface area and hence is taken for removal studies
(Table 4.16).
Fig. 4.27. Particle size analysis of zirconium polyacrylamide hybrid material
Table - 4.16. Different composition of the hybrid material ZrPACM, surface area and particle size
studies.
Material Composition Molar Ratio Particle size (nm)
Surface area m2/g
ZrPACM-78 1:1 78.33 178.71 ZrPACM-82 1:3 82.64 158.13 ZrPACM-43 2:1 43.67 341 ZrPACM-66 2:3 66.27 194.02
ZrPACM-62 3:1 62.78 223 ZrPACM-53 3:3 53.20 278.33
The material is chemically stable (Table 4.17) as it is not soluble up to 2M solution of most of the
mineral acids (H2SO4, HNO3 and HCl), alkali (NaOH and NH4OH) and salt solution (NaNO3 and

RESULTS & DISCUSSION 2014
68 | P a g e
KNO3). Arsenic ion exchange capacity for different eluent concentration is presented in Table
4.18.
Table - 4.17. Chemical stability of ZrPACM - 43 hybrid material in various acid, alkali and salt
solutions
Solvent(20 ML) Amount Dissolved(mg) Solvent(20 ML) Amount Dissolved(mg)
1M HCL 0.21 1M NH4OH 0.11
2M HCL 0.38 2M NH4OH 0.17
3M HCL 0.86 3M NH4OH 0.21
4M HCL 0.92 4M NH4OH 0.33
1M HNO3 1.21 1M NaNO3 0.14
2M HNO3 1.49 2M NaNO3 0.18
3M HNO3 1.98 3M NaNO3 0.21
4M HNO3 completely 4M NaNO3 0.26
1M H2SO4 1.77 1M KNO3 0.19
2M H2SO4 completely 2M KNO3 0.28
3M H2SO4 completely 3M KNO3 0.36
4M H2SO4 completely 4M KNO3 0.44
1M NaOH 0.45
2M NaOH 0.61
3M NaOH 0.87
4M NaOH 1.43
Table - 4.18. Arsenic ion exchange capacity for different eluent concentration and chemical
analysis of ZrPACM - 43 hybrid Material
Ion exchange capacity Chemical analysis
Concentration of eluent (M)
Arsenic ion exchange capacity
Compounds Weight (g)
Number of moles Molar ratio
0.1 0.61 ZrOCl2.8H2O 1.4124 1.451 10-4 2
0.2 0.94 (C3H5NO)n 0.6841 0.912 10-4 1
0.3 1.24
0.4 1.32
0.5 1.38
0.6 1.41
0.7 1.48
0.8 1.61
0.9 1.64
1.0 1.63
The optimum concentration of the eluent was found to be 0.8 M for arsenic (III) ion. The
minimum volume required to complete the elution is found to be 150 mL. On the basis of the
chemical analysis and elemental analysis (Table 4.18) of ZrPACM - 43, the number of moles of
Zirconium, and polyacrylamide are found to be 1.451 10-4, 0.912 10-4 respectively. The molar
ratio of Zirconium and polyacrylamide is found to be 2:1 ratio so, from the above results, the
tentative empirical formula for the material is suggested as [(ZrOCl2) (C3H5NO) n]. nH2O. The
value of n is found to be 2.40 using Alberti equation (Alberti et al., 1966) as discussed in section
4.1.1 of chapter 4.

RESULTS & DISCUSSION 2014
69 | P a g e
The thermogravimetric analysis (TGA) and differential thermal analysis (DTA) of the
material is represented in Fig. 4.28. The weight loss occurred in the following three steps: (1) in
the temperature range of 30 0C - 250 0C (21.37%) is due to loss of physical adsorbed water; (2)
53.74 % in the temperature range of 250 0C to 580 0C is attributed mainly to the loss of lattice
water and NH2 groups; (3) 50.77 % at higher temperature (580 0C to 700 0C) might be due to
structural deformation. The analysis of DTA curve of the material revealed that the process is
endothermic up to temperature of 550 °C may be due to loss of external water and the other
major endothermic peaks corresponds to loss of –CO, -NH2 functional groups which supports the
above finding.
Fig. 4.28. Thermogravimetric analysis (TGA) and differential thermal analysis (DTA) of hybrid
material ZrPACM - 43
The SEM with corresponding EDX of the fresh and arsenic loaded materials is
represented in Fig. 4.29 and Fig. 4.30 respectively. There is a significant change in the
morphology and structure of the material when loaded with arsenic. The vergin material have
plain surface with some rounded groove uniformly distributed in the matrix of the material. It is
clearly observed those grooves are embedded with the adsorbate in the surface of the material
after loaded with arsenic. The micrograph shows surface heterogeneity resulted from the
adsorption of arsenic (III) on the surface. The corresponding EDX spectrum indicates the
presence of C, O, and Zr and As after the material is loaded with adsorbent. The fresh adsorbent
was analysed to obtain its elemental composition by CHNS Elementar. The results indicate the
elemental composition as Zr-16.82%, O-28.08%, C-14.80%, H-3.11%, and N-2.88%, and others
34.31% respectively. The zero point surface charge density of the hybrid material as a function of
pH is represented in Fig. 4.31. The study shows that the surface holds positive charge in lower
pH, the surface charge density decreases with the increase in the solution pH. The pH of zero
point surface charge density (pHzpc) is recorded around 4.8.

RESULTS & DISCUSSION 2014
70 | P a g e
Fig. 4.29. SEM of ZrPACM - 43 hybrid material (a) before adsorption (b) after adsorption
Fig. 4.30. EDX of hybrid material ZrPACM - 43 (a) EDX micrographs of before adsorption and (b)
EDX micrographs of after adsorption
The value of pHzpc is positive as solution pH is less than 5, however the surface acquires
negative charge as the solution pH is higher than 5. The powdered XRD diffractogram of the
ZrPACM-43 is represented in Fig. 4.32.

RESULTS & DISCUSSION 2014
71 | P a g e
Fig. 4.31. Surface charge density as a function of pH (m =1 g/L) for hybrid material ZrPACM - 43
The XRD diffractogram is analysed for the phases of fresh material and arsenic adsorbed
materials with PCPDFWIN and Philips X’pert high score software. Few sharp and broad peaks
are observed before and after indicating the sample is crystalline in nature. The normal crystallite
sizes of material were calculated using Debye Scherrer equation (Holzwarth and Gibson, 2011),
D (0 1 1) (2 2 0) = 0.9 / (2θ.COSθmax)
Where D (Plane of reflection at before adsorption (0 1 1) and after adsorption (2 2 0)) is the
average crystal size in nm, is the specific wavelength of X-ray used, is the diffraction angle
and 2 is the angular width in radians at intensity equal to half of the maximum peak intensity.
Fig. 4.32. X-Ray diffraction pattern of hybrid Material ZrPACM - 43, (a) before adsorption, (b) after
adsorption of arsenic (III)
The crystallite size is found to be 53.60 nm and 238.00 nm before and after adsorption
respectively. The exact composition are drawn and compared by ICCD Database (Klug et al.,
20
40
60
80
100
10 20 30 40 50 60 70 80
10
20
30
40
50
60
CE
AD
AD
D
D
Inte
ns
ity
(a
.u)
A= ZrO2
B=(NH4
)6
Zr2
(OH)2
(CO3
)6
(H2
O)3
C=C3
H5
NO
D=ZrAs2
O7
E=Zr(NH4
AsO4
)(HAsO4
).H2
O
E
(b)
A
A
ABC
ABC
AB
Inte
ns
ity
(a
.u)
2 (Degree)
B
AB
A
C(a)

RESULTS & DISCUSSION 2014
72 | P a g e
1974). There is an increment in the crystallite size, may be due to increment in space charge
polarization and crystal defects after adsorption.
The FTIR spectra before and after adsorption is represented in Fig. 4.33(a) and Fig.
4.33(b). The presence of band at ~3414.58 cm-1 is due to bonded OH groups, which indicates the
presence of water of crystallization. The NH2 stretching is overlapped with the above band with
the formation of a spike which is shifted to ~3439.28 cm -1 after adsorption may be due to
coordination of arsenic (III) with NH groups. The next band at ~2882.01 cm-1 in the material is due
to presence of amide group. After adsorption, a new peak appears at ~2994.19 cm-1 along with
the above band. The band is slight broadening after adsorption. The peak at ~2818.95 cm-1 is due
to combined stretching of N-H and O-H groups, which is shifted to ~2808.15 cm-1 after adsorption.
The peak at ~1612.42 cm-1 is due to C=O stretching present in the virgin material is shifted to
~1634.78 cm-1 after adsorption may be due to interaction of this group with arsenic. The peak at
~1200.00 cm-1 in the material is assigned to C-H and C-C stretching ,shifted to the presence of
peak at finger print region ~798.06 cm-1 and ~618.35 cm-1 is due to C-N stretching and metal -
oxygen bonding which is shifted to ~745.88 cm-1, ~618.73 cm-1 and ~521.73 cm-1after adsorption
indicates the adsorption of arsenic. A detailed and similar study by Ma et al., (2011), Hu et al.,
(2010), Kumar et al., (2012), suggests the possibility of above FTIR observation.
Fig. 4.33. FTIR spectrum of hybrid material ZrPACM-43: (a) before adsorption, (b) after
adsorption of arsenic (III) in KBr pellet method.
4.2.2. Removal study of arsenic (III) by ZrPACM – 43 in batch mode
All the experiments are carried out in batch mode, as discussed in Chapter-3.
4.2.2.1. Influence of adsorbent (ZrPACM – 43) dose
The results of the effect of adsorbent dose are represented in Fig. 4.34. The removal of
arsenic(III) increases from 47% to 98.22%, 43.25% to 96.87% and 41.79% to 93.56% with
4000 3500 3000 2500 2000 1500 1000 500
80
90
100
521.7
3
618.7
3
745.8
8
989.3
7
1108.1
1
1184.5
4
1634.7
8
2808.5
1
2882.0
1
2994.1
9
3439.2
8
618.3
5
798.0
6
1107.2
4
1200.0
0
1379.7
1
1612.4
2
2352.0
3
2818.9
5
2882.0
1
Tra
nsm
itan
ce (
a.u
)
Wave Number (cm-1)
(b)
(a)
3414.5
8

RESULTS & DISCUSSION 2014
73 | P a g e
increase in adsorbent dose from 0.1 – 1.5 g/100 mL with initial solute concentration of 10 mg/L,
50 mg/L and 100 mg/L respectively. It is found that there is no significant change in percentage
removal of arsenic after dosage of 13 g/L and hence considered as the optimum dose and is used
for further study. (Yang et al., 2013). The increase in percentage removal could be attributed to
the availability of more number of adsorption sites at the initial stage and overlapping of active
sites at higher dosage as well as the decrease in the effective surface area resulting in the
accumulation of exchanger particles (Yang et al., 2013). There is slight decrease in pH of the
solution after adsorption due to exchange of H+ ion by arsenic ion, which increases the H+ ion
concentration in the solution thereby decreasing the pH (Table - 4.19)
Fig. 4.34. Variation of adsorbent dose on the percentage removal of arsenic (III) by the ZrPACM –
43 hybrid material.
Table – 4.19. Initial and final pH of arsenic (III) solutions of 10 mg/L, 50 mg/L and 100 mg/L
concentration.
Initial concentration (mg/L) ZrPACM – 43 hybrid material
Initial pH Final pH
10 5 4.8
50 5.1 4.7
100 5.2 4.7
4.2.2.2. Effect of pH on removal of arsenic (III)
The results of the effect of pH are represented in Fig. 4.35. There is no change in the
solution pH after addition of adsorbent and solution remains at pH 7. It is evident from the Fig.
4.35, that the highest removal is 97.06% for 10 mg/L, 94.84% for 50 mg/L and 87.62% for 100
mg/L respectively at pH 5. The pH of the solution after adsorption is found to decrease slightly
(Table - 4.20). The removal of arsenic decreases with increase in pH may be due to the following
reasons. (1) When the concentration of H+ ions is more in solution, then the magnitude of positive
charge over amino group is more in the adsorbent (2) Competition for active sites by excessive
0.0 0.2 0.4 0.6 0.8 1.0 1.2 1.4
40
50
60
70
80
90
100
% R
em
ova
l o
f ars
en
ic(I
II)
Dose (g)
10 mg/L
50 mg/L
100 mg/L
pH: 5
Temp: 26oC
Contact Time: 60 minutes
Stirring Speed: 20 rpm

RESULTS & DISCUSSION 2014
74 | P a g e
amount of hydroxyl ions present in the water in alkaline pH (Amiri et al., 2004).The results is in
good agreement with zero point surface charge (pHzpc).
Table – 4.20. Change in pH during the removal of arsenic (III) by ZrPACM – 43 hybrid material
Initial concentration of 10 mg/L
Initial concentration of 50 mg/L
Initial concentration of 100 mg/L
Initial pH Final pH Initial pH Final pH Initial pH Final pH
2.0 2.0 2.0 1.8 2.0 1.9
3.0 2.7 3.0 2.9 3.0 3.0
5.0 4.8 5.0 4.6 5.0 4.8
8.0 7.8 8.0 7.9 8.0 7.9
11.0 10.7 11.0 11.1 11.0 10.6
Fig. 4.35. Percentage removal of arsenic (III) of initial concentration of 10 mg/L, 50 mg/L and 100
mg/L versus pH of the solution, by ZrPACM – 43 hybrid material
4.2.2.3. Effect of contact time and adsorption kinetics
The results of the effect of contact time on the removal of arsenic (III) are represented in
Fig. 4.36. The removal efficiency is 98.67%, 96.32% and 92.67% for initial concentration of 10
mg/L, 50 mg/L and 100 mg/L respectively and the effective removal occurred in first 120 min and
hence considered as the effective equilibrium time for adsorption. Initially all sorbent sites are
vacant and also the solute concentration gradient is high but with time the number of sites are
filled and the rate of adsorption and desorption is equal which is the equilibrium time. At higher
concentrations, metal ion diffuse to the sorbent by intraparticle diffusion but usually highly
hydrolysed ions will diffuse at a slower rate. This indicates the possible monolayer formation of
arsenic (III) on the outer surface of the adsorbent. (Ma et al., 2011; Hu et al., 2010; Ahmad et al.,
2005). In order to examine the controlling mechanisms of adsorption process such as mass
transfer and chemical reaction, several kinetic models are used to test the experimental data.
2 4 6 8 10 12
30
40
50
60
70
80
90
100
Dose: 13 g/L
Temp: 26oC
Contact Time: 60 minutes
Stirring Speed: 20 rpm
% R
em
ov
al o
f a
rse
nic
(III)
pH
10 mg/L
50 mg/L
100 mg/L

RESULTS & DISCUSSION 2014
75 | P a g e
Fig. 4.36. Effect of contact time on the removal of arsenic (III) by hybrid material ZrPACM-43.
4.2.2.3.1. Lagrgren’s first order rate equation
The rate constant (kad) of adsorption was determined from first order rate expression given
by Lagergren rate equation, which is explained in Section 4.1.2.2.1. The linear plot of log (qe –q)
versus time is represented in Fig. 4.37. The data obtained from the slope and intercept of the plot
is presented in Table 4.21.
Fig. 4.37. Linear plot of Lagergren rate equation using ZrPACM-43, time versus Log (qe-q) with
initial arsenic (III) concentration of 10 mg/L, 50 mg/L and 100 mg/L.
The obtained value of Kad and R2 represents the applicability of the first order model. The
apparaent activation energy was calculated using Arrhenius equation and it is found to be 28.9
kJ/mol, 42.2 kJ/mol and 31.4 kJ/mol respectively for initial As(III) concentration of 10 mg/L, 50
mg/L and 100 mg/L. The data suggest chemisorption nature of adsorption process. The results of
0 20 40 60 80 100 120 140
40
50
60
70
80
90
100
% R
em
oval o
f ars
en
ic(I
II)
Contact Time (Minutes)
10 mg/L
50 mg/L
100 mg/L
Dose:(13 g/L)
Temp: 26o
C
pH: 5
Stirring Speed: 20 rpm
10 20 30 40 50
-1.6
-1.4
-1.2
-1.0
-0.8
-0.6
-0.4
-0.2
log (
qe-q
)
Time (Minutes)
10 mg/L
50 mg/L
100 mg/L

RESULTS & DISCUSSION 2014
76 | P a g e
investigation are supported by the following references (Yanyang et al., 2014; Arcibar et al., 2014;
Chon et al., 2006; Deng et al., 2004).
Table - 4.21. Lagergren rate constants (kad) obtained from the graph for different initial
concentration of arsenic (III)
ZrPACM-43 Hybrid Material
Initial
concentration
kad R2 Standard Deviation (SD)
10 mg /L 0.04 0.990 0.03
50 mg/L 0.04 0.897 0.08
100 mg /L 0.05 0.92 0.11
4.2.2.3.2. Helfferich rate equation
Adsorption of ions or molecules in aqueous solution follows reversible first order kinetics.
Hence in the present study, the kinetics of arsenic (III) adsorption using Helfferich equation
(Helfferich, 1962) (Explained in Section 4.1.2.2.2.) has been tested to understand the behaviour of
ZrPACM-43. The straight line plots of ln [1-U (t)] vs time‘t’ indicates that the adsorption of arsenic
(III) from aqueous solution follows first order kinetics with respect to adsorbents is shown in the
Fig. 4.38.
Fig. 4.38. Linear plot of Helfferich equation using ZrPACM-43, time versus ln[1-U(t)] with initial
arsenic (III) concentration of 10 mg/L, 50 mg/L and 100 mg/L.
The slope of the straight line plots gives the overall rate constant k’ for arsenic (III)
adsorption process. The data obtained from the graphs are presented in Table 4.22. The forward
(k1) and backward (k2) rate constants are calculated using the equation discussed in Section
4.1.2.2.2 and is presented in Table 4.23. It is well evident from the data presented in the Table
4.23, the forward rate constants were higher than the backward rate constants suggesting that the
rate of forward reaction (adsorption)were higher than the rate of backward process (desorption)
up to the time of equilibrium and the equilibrium was toward product side.
10 20 30 40 50
-5.2
-5.0
-4.8
-4.6
-4.4
-4.2
-4.0
-3.8
-3.6
-3.4
-3.2
-3.0
-2.8
-2.6
ln[1
-u(t
)]
Time (Minutes)
10 mg/L
50 mg/L
100 mg/L

RESULTS & DISCUSSION 2014
77 | P a g e
Table - 4.22. Rate constant (k’) obtained from the graph for different initial concentration of
arsenic (III)
ZrPACM-43 Hybrid Material
Initial concentration (mg/L)
Rate constants in min-1 (k’)
R2 SD
10 0.0404 0.993 0.35677
50 0.0353 0.923 1.04971
100 0.0471 0.924 1.31139
Table - 4.23. Rate constants (k1 and k2) obtained for different initial concentration of arsenic (III)
ZrPACM-43 Hybrid Material
Initial concentration (mg/L)
Overall rate constant (k’) (min -1)
Forward rate constant k1 (min -1)
Backward rate constant k2
(min -1)
10 0.0404 0.0378 0.0026
50 0.0353 0.0327 0.0025
100 0.0471 0.0433 0.0038
Similar studies and observation are reported by the following researcher (Vatutsina et al., 2007;
Gupta et al., 2009; Eren et al., 2010; Awual et al., 2011; Shin et al., 2011; Golbaz et al., 2014).
4.2.2.3.3. Second order rate equation
The integrated second order rate equation is studied and used in the present study; the
integrated second order rate equation is discussed in Section 4.1.2.2.3. The linear graph obtained
for second order equation is represented in Fig. 4.39. The data obtained from the plot t/qt versus
time for removal of arsenic (III) by ZrPACM-43 is presented in Table 4.24. On the basis of
standard deviation (SD) and correlation coefficient (R) value, the second order kinetic model
(Table 4.24), is the best fit model in describing the arsenic (III) adsorption process in comparison
to first order rate equation.
Fig. 4.39. Linear plot of second order rate equation using ZrPACM-43, time versus t/qt with initial
arsenic (III) concentration of 10 mg/L, 50 mg/L and 100 mg/L.
0 10 20 30 40 50 60 70 80 90
0
10
20
30
40
50
60
t/q
t
Time (Minutes)
10 mg/L
50 mg/L
100 mg/L

RESULTS & DISCUSSION 2014
78 | P a g e
Table - 4.24. Second order rate constant for arsenic (III) removal by ZrPACM-43
ZrPACM-43 Hybrid Material
Initial concentration
k2 qo R2 SD
10 mg/L 1.57 1.57 0.999 0.01
50 mg/L 0.12 7.79 0.999 0.03
100 mg/L 0.07 15.37 0.999 0.15
4.2.2.3.4. Intraparticle diffusion rate constant (Weber-Morris equation)
To understand the diffusion of arsenic (III) ions into the sites of the adsorbents, the
experimental data was tested with Weber-Morris equation (Badruzzaman et al., 2004). The
equation is directly used as discussed in section 4.1.2.2.4., and used for evaluating the data. The
results obtained from the plot (Fig. 4.40) are presented in Table 4.25.
Fig. 4.40. Linear plot of Weber- Morris equation using zirconium polyacrylamide hybrid material,
square root of time versus qe with initial arsenic (III) concentration of 10 mg/L, 50 mg/L and 100
mg/L.
The rate constants (Kp) for intraparticle diffusion for various initial concentration of arsenic
(III) solution, determined from the slope of respective plots. It is clear from the figure that the
straight lines is not passing through the origin suggesting that Intraparticle diffusion is not the sole
rate-limiting step for the adsorption of arsenic (III). The study by Ranjan et al. (2009), Sundaram
et al., (2008), Huang et al. (2009), Tezuka et al. (2004), has shown the similar results.
Table - 4.25. Intraparticle diffusion rate constant (Weber-Morris equation)
Adsorbent used
Initial concentration (mg/L) kp C R2 SD
ZrPACM-43
10 0.021 1.385 0.941 0.08725
50 0.098 6.929 0.904 0.14546
100 0.159 13.938 0.946 0.12169
4.2.2.4. Effect of temperature
The effect of temperature on the adsorption of arsenic (III) in the range of 20 to 90 °C is
represented in Fig. 4.41. The percentage removal of arsenic (III) increases from 65.44 % to
3 4 5 6 7 8 9
1
2
3
4
5
6
7
8
9
10
11
12
13
14
15
qe
t
10 mg/L
50 mg/L
100 mg/L

RESULTS & DISCUSSION 2014
79 | P a g e
96.33%, 62.33 % to 92.33 % ,58.66% to 90.22% for initial concentration of 10 mg/L, 50 mg/L, 100
mg/L respectively with increase in temperature from 20 to 90 °C. This trend suggests the
endothermic nature of the adsorption.
Fig. 4.41. Effect of temperature on removal of arsenic (III) by ZrPACM-43 hybrid material
This may be probably due to decrease in the escaping tendency of the adsorbent species
from the surface of the adsorbent and also due to change in pore size and enhanced rate of
intraparticle diffusion (Badruzzaman et al. 2004; Hristovski et al. 2007; Ranjan et al. 2009; Malana
et al. 2011)
4.2.2.5. Thermodynamic parameters
Further, the temperature and thermodynamic study is supported by the value obtained for
thermodynamic parameters. The thermodynamic equation as represented in Section 4.1.2.4, is
used for the calculation of different thermodynamic parameters in the present study. The plot of
logs Kc versus 1/T for initial arsenic (III) concentration of 10mg/L, 50mg/L and 100mg/L is found to
be linear and represented in Fig. 4.42.
Fig. 4.42. Van’t Hoff plot, log Kc versus 1/T for ZrPACM-34 hybrid material
The Values of H and S are evaluated from slope and intercept of Van’t Hoff Plot and are
presented in Table 4.26.
10 20 30 40 50 60 70 80 90
55
60
65
70
75
80
85
90
95
100
% R
em
ov
al o
f a
rse
nic
(III)
Temperature (0C)
10 mg/L
50 mg/L
100 mg/L
0.00305 0.00310 0.00315 0.00320 0.00325 0.00330 0.00335 0.00340 0.00345
0.81
0.82
0.83
0.84
0.85
0.86
0.87
0.88
Lo
g (
Kc)
1/T
10 mg/L
50 mg/L
100 mg/L

RESULTS & DISCUSSION 2014
80 | P a g e
Table - 4.26. Thermodynamic parameters using synthetic arsenic (III) solution of 10 mg/L, 50
mg/L, and 100 mg/L
The positive value of entropy (S) indicates the increase in randomness of the ongoing
process and hence a good affinity of arsenic by the hybrid material. Decreasing negative value of
G with increase in temperature indicates the feasibility, spontaneity and endothermic nature of
the ongoing adsorption process. Positive value of enthalpy (H) suggests that entropy is
responsible for making G value negative (Vatutsina et al., 2007; Gupta et al., 2009; Malana et
al., 2011). The value of G also suggest the chemisorption nature of the adsorption process.
4.2.2.6. Effect of initial arsenic (III) concentration and adsorption isotherm
The effect of initial concentration of arsenic (III) on adsorption of arsenic (III) by hybrid
material Zr-PACM-43, with the variation of initial arsenic (III) concentration in the range of 1mg/L
to 270 mg/L is represented in Fig. 4.43. It is observed that with the increase in initial arsenic (III)
concentration from 1mg/L to 270 mg/L there is a sharp decrease in removal percentage from
98.66 % to 11.21 %. The reason may be ascertained to the fact that (a) due to saturation of
available free sites in the adsorbent and (b) overlapping of arsenic species at higher
concentration.
Fig. 4.43. Percentage removal of arsenic (III) by zirconium polyacrylamide hybrid material
4.2.2.7. Adsorption isotherm
4.2.2.7.1. Langmuir isotherm
0 50 100 150 200 250 300
0
20
40
60
80
100
arsenic (III)
% R
em
ova
l o
f a
rse
nic
(III)
Initial Concentration (mg/L)
Initia
l C
onc
(mg/L
)
ΔH
(kJ/m
ol)
ΔS
(kJ/ K
mol)
ΔG (kJ/mol)
R2 283 K 288 K 293 K 298 K 303 K 308 K 313 K
10 140 0.38 -136.2 -134.3 -132.3 -130.4 -128.5 -126.6 -124.7 0.972
50 144 0.26 -141.7 -140.4 -139.1 -137.8 -136.5 -135.2 -133.9 0.996
100 149 0.36 -145.4 -143.5 -141.7 -139.9 -138.1 -136.2 -134.4 0.976

RESULTS & DISCUSSION 2014
81 | P a g e
The adsorption data are fitted to linearly transformed Langmuir isotherm (Langmuir, 1918).
This has been already discussed in section 4.1.2.6.1. The linear plot of 1/ Ce versus 1/ qe is
represented in Fig. 4.44. The Langmuir isotherm parameters are presented in Table 4.27. In order
to predict the adsorption efficiency of the adsorption process, the dimensionless equilibrium
parameter is determined by using the equation discussed in Section 4.1.2.6.1.
Table - 4.27. Langmuir isotherm parameters for arsenic (III) removal by zirconium polyacrylamide
hybrid material
Langmuir Isotherm
ZrPACM-43 qo b R2 Sd
2
41.49 mg/g 1.40 L/mg 0.951 2.09 5.28
(r) dimensionless equilibrium parameter
10 mg/L 0.07
50 mg/L 0.01
100 mg/L 0.01
Fig. 4.44. Langmuir adsorption isotherm, 1/Ce versus 1/qe for Zirconium polyacrylamide hybrid
material
The correlation coefficient value from Langmuir isotherm suggest inadequate fit of the
actual experimental data into Langmuir isotherm model but the value of dimensionless equilibrium
parameter in present adsorption study represents a favorable adsorption system.
4.2.2.7.2. Freundlich Isotherm
The Freundlich equation is used for determining the applicability of heterogeneous surface
energy in the adsorption process. The empirical Freundlich equation (Freundlich, 1906) is studied
according to discussion in Section 4.1.2.6.2. Freundlich isotherm data are presented in Table 4.28
and graphically shown in Fig. 4.45. On the basis of the correlation coefficient values, it is clear
that, Freundlich adsorption isotherm fits better than Langmuir adsorption isotherm. In the present
study the ‘n’ has a value of 1.24 and hence 1/n value is more than 0.5 which indicates that the
intraparticle diffusion is not effectively slow to the rate determining step and represents strongest
0.0 0.2 0.4 0.6 0.8 1.0
0.0
0.1
0.2
0.3
0.4
0.5
0.6
0.7
arsenic (III)
1/q
e
1/Ce
Equation y = (a*b*x^(1-c))/(1 + b*x^(1-c))
Adj. R-S 0.89837
Value Standard
B a 3018.2 8.91759E
B b 2.1924 0.6479
B c 0.1591 0.19462

RESULTS & DISCUSSION 2014
82 | P a g e
bond between adsorbate and adsorbent. The ‘n’ in Freundlich isotherm represents a correlation
factor for the interactive interaction among the adsorbed species. When n ≥ 1 interaction is
attractive, n≤ 1 interaction is repulsive (Shin et al., 2011; Pokhrel et al., 2007; Kim et al., 2006;
Golbaz et al., 2014).
Table - 4.28. Freundlich isotherm parameters for arsenic (III) removal by ZrPACM-43 hybrid material
Freundlich isotherm
ZrPACM-43 Hybrid Material 1/n Kf n R2 SD
2
0.804 0.20 1.24 0.989 1.43 1.16
Fig. 4.45. Freundlich adsorption isotherm, log Ce versus log qe for Zirconium polyacrylamide
hybrid material
In present case ‘n’ is greater than unity, suggesting existence of attractive force between
adsorbent and adsorbate. Similar results are reported by Wei-Guang et al., (2014); Deng et al.,
(2004); Kim et al., (2006). The value of Kf (Freundlich constant=0.20) indicates affinity of As (III)
species (Messiana et al., 2006). The value of Freundlich parameters also reveals the number of
adsorption sites (Jobstmann and Singh, 2001).
4.2.2.7.3. Dubinin-Radushkevich (D-R) Isotherm
In order to understand the adsorption type, equilibrium data were tested with Dubinin-
Radushkevich isotherm, (Dubinin, 1966, 1975; Dubinin and Stoeckli, 1980). The linearized D. R.
equation is studied according to equation represented in Section 4.1.2.6.3. The plot obtained is
represented in Fig. 4.46 and the corresponding data were presented in Table 4.29. The mean free
energy of adsorption (E) was calculated from the constant K as per the discussion in previous
Section 4.1.2.6.3. In the present study the value of E is much higher than 16 kJ/mol which
indicates the chemisorption nature of the adsorption process. Similar results are reported by
(Goswamee et al., 1998; Hong et al., 2011; Shinde et al., 2013; Li et al., 2014).
0.0 0.2 0.4 0.6 0.8 1.0 1.2 1.4
0.0
0.2
0.4
0.6
0.8
1.0
1.2
Log q
e
Log Ce
arsenic (III)

RESULTS & DISCUSSION 2014
83 | P a g e
Table - 4.29. D-R isotherm parameters for arsenic (III) removal by ZrPACM-43
D-R isotherm
ZrPACM-43 Hybrid Material
K (mol2kJ-2) qm (g/g) E (kJ/mol) R2 SD 2
8.07 X 10 -7 0.80 780.71 0.903 4.26 0.42
Fig. 4.46. D-R adsorption isotherm, ln qe versus ε2 for arsenic (III) removal by Zirconium
polyacrylamide hybrid material
4.2.2.8. Effect of competitive anions on arsenic (III) removal
Arsenic (III) adsorption by taking 10 mg/L, 50 mg/L and 100 mg/L of solution, in the
presence of competing ions (including chloride, carbonate, bicarbonate, nitrate, sulphate, calcium,
sodium and magnesium) was investigated with initial concentration of 10 mg/L to 270 mg/L.
Fig. 4.47. Percentage removal of arsenic (III) with zirconium polyacrylamide hybrid material
versus initial cation and anion concentration of solution (Initial arsenic concentration,10 mg/L)
The obtained results are represented in Fig. 4.47. It is clear from the figure that the
reduction on adsorption follows the following order: sulfate > chloride > calcium> carbonate >
0 500000 1000000 1500000 2000000 2500000
0.0
0.5
1.0
1.5
2.0
2.5
Ln
qe
arsenic (III)
0 50 100 150 200
55
60
65
70
75
80
85
90
% R
em
ova
l o
f a
rse
nic
(III)
Initial anion and cation concentration in mg/L
Sulphate
Nitrate
Chloride
Carbonate
Bicarbonate
Calcium
Sodium
Magnesium
Arsenic (III)- 10mg/L

RESULTS & DISCUSSION 2014
84 | P a g e
bicarbonate > sodium> nitrate > magnesium. These ions may be competing for the active sorption
sites along with the arsenic during adsorption process due to their affinity towards the adsorbent
material.
4.2.2.9. Regernation and reusability studies of hybrid material
Regeneration studies were carried out in order to know the reusability of the hybrid
material and the results are represented in Fig. 4.48 (a) and Fig. 4.48 (b). The percentages
desorption and regeneration data are presented in Table 4.30. Percentage regeneration of the
adsorbed arsenic (III) in aqueous solution resulted about 99.78 %, 94.51 % and 90.12% at pH -10
for initial concentration of 10 mg/L , 50 mg/L and 100 mg/L respectively, which indicate that the
material can be easily regenerated by alkali and can be used for several cycles at least up to 8
cycles (60% removal).
Fig. 4.48. (a) Regeneration of hybrid material (b) reusability of hybrid material
(a)
(b)

RESULTS & DISCUSSION 2014
85 | P a g e
Table - 4.30. Percentage desorption and regeneration of arsenic of different concentration by
hybrid material
Initial arsenic (III) concentration (mg/L)
Amount desorbed (mg/L) Percentage desorption or regeneration
pH 2
pH 4
pH 6
pH 8
pH 10
pH 2
pH 4
pH 6
pH 8
pH 10
10 2.8 4.8 6.9 7.6 8.4 36.9 48 41.2 98.5 99.8
50 18.4 27.4 34.9 41.3 41.6 28.4 69.9 65.4 90.1 94.5
100 37.8 53.7 80.4 85.4 87.6 20.1 34.7 51.2 79.6 90.1
4.2.3. Column study for the removal of arsenic (III) by zirconium polyacrylamide hybrid
material
Fixed bed column study was carried out with a column as discussed in Chapter-3, Section
3.16. with different flow rate (Korte and Fernado 1991). In the present study the column was
charged with synthetic arsenic (III) water in up-flow mode with an approach velocity of 210 cm/h,
the breakthrough curve for synthetic sample at different initial concentration, bed depth and flow
rate is represented in Fig. 4.49 - 4.51. In the present study the maximum permissible limit is 0.005
mg/L. The breakthrough time (corresponding to Ceff/C0= 0.002, where Ceff= effluent arsenic (III)
concentration = 0.005 mg/L, and C0 = initial arsenic (III) concentration = 10 mg/L (Except
concentration variation) and exhaust time of zirconium polyacrylamide hybrid material was found
to be 26 h for 6 cm of bed height. The data obtained from the plot by carrying out mathematical
analysis as discussed in Section 3.1.6.3 is presented in Table 4.31. The plot of ln [Ceff/C0-Ceff]
versus time‘t’ gives a straight line with slope KC0 and intercept –XKN0/V from which K and N0 was
calculated (Fig. 4.52 - 4.53).
Table – 4.31. Column adsorption parameters for arsenic (III) removal by ZrPACM-43 hybrid material
Adsorbent Approach velocity (cm/hr)
Bt
(h) Et
(h) Q
(mg/g)
Re
mo
va
l
%
Logit Method
N0
(mg/l) Adsorption rate
constant k (Lmg/h)
R2
Arsenic (III) Conc
(mg/L)
10 210 8 21 12.3 63.9 1.266 0.083 0.965
50 210 4 13 30.7 41.8 0.687 0.066 0.881
100 210 3 16 46.1 51.8 1.291 0.043 0.935
Bed depth (cm)
2 210 10 23 15.4 56.0 1.257 0.064 0.986
6 210 12 26 18.5 64.1 1.483 0.056 0.982
10 210 12 25 18.5 69.5 1.647 0.050 0.991
Flow rate (mL/min)
2 210 14 19 21.5 71.8 1.690 0.046 0.940
6 210 6 19 27.6 74.0 1.885 0.050 0.922
10 210 5 18 38.4 65.5 1.508 0.053 0.940
Similar studies by following researchers (Amiri et al., 2004; Malkoc et al., 2006; Sarin et al., 2006;
Chen et al., 2012; Kumar et al., 2009; Calero et al., 2009, Tang et al., 2011, Montastruc et al.,
2011) suggest the applicability of the above studies on the removal of arsenic (III) by zirconium
polyacrylamide hybrid material in column mode.

RESULTS & DISCUSSION 2014
86 | P a g e
Fig. 4.49. Breakthrough curve of varying initial concentration for zirconium polyacrylamide hybrid
material, Ceff/Co versus time in hours, initial bed height- 2 cm
Fig. 4.50. Breakthrough curve of bed height for zirconium polyacrylamide hybrid material, Ceff/Co
versus time in hours, initial concentration- 10 mg/L
Fig. 4.51. Breakthrough curve of bed height for zirconium polyacrylamide hybrid material, Ceff/Co
versus time in hours, initial concentration- 10 mg/L
0 10 20 30
0.2
0.4
0.6
0.8
Ce
ff/C
o
Time in Hours
10 mg/L
50 mg/L
100 mg/L
Bed Height- 2 cm
0 5 10 15 20 25 30
0.2
0.3
0.4
0.5
0.6
0.7
Ce
ff/C
o
Time in Hours (h)
2 Cm
6 Cm
10 Cm
Arsenic (III)- 10 mg/L
0 5 10 15 20 25 30
0.10
0.15
0.20
0.25
0.30
0.35
0.40
0.45
0.50
Ce
ff/C
o
Time in Hours (h)
2 mL/min
4 mL/min
6 mL/min
Arsenic (III)- 10 mg/L

RESULTS & DISCUSSION 2014
87 | P a g e
Fig. 4.52. Logit equation for different concentration for zirconium polyacrylamide, ln [Ceff/ (Co-Ceff)]
versus time ‘t’, initial bed height- 2cm
Fig. 4.53. Logit equation for different bed height for zirconium polyacrylamide, ln [Ceff/ (Co-Ceff)]
versus time ‘t’, initial concentration- 10 mg/L, flow rate 2 mL/min
Fig. 4.54. Logit equation for flow rate for zirconium polyacrylamide, ln [Ceff/(Co-Ceff)] versus time
‘t’, initial bed height- 2cm, Initial concentration- 10 mg/L
4.2.4. Mechanism of adsorption of arsenic (III) on ZrPACM-43 hybrid material
0 5 10 15 20 25 30
-1.5
-1.0
-0.5
0.0
0.5
1.0
ln[C
eff/(
Co-C
eff)]
Time in Hours (h)
10 mg/L
50 mg/L
100 mg/L
0 5 10 15 20 25 30
-1.5
-1.0
-0.5
0.0
0.5
1.0
ln[C
eff/(
Co-C
eff)]
Time in hours (h)
2 cm
6 cm
10 cm
0 5 10 15 20 25 30
-2.0
-1.8
-1.6
-1.4
-1.2
-1.0
-0.8
-0.6
-0.4
-0.2
0.0
ln[C
eff/(
Co-C
eff)]
Time in hours (h)
2 mL/min
4 mL/min
6 mL/min

RESULTS & DISCUSSION 2014
88 | P a g e
A mechanism for the adsorption of arsenic (III) by hybrid material has been proposed based on
results of the experiment and computing the results using mathematical/theoretical models. The
mechanism of arsenic removal by the hybrid material was governed by electrostatic adsorption
and complexation for which a mechanism is proposed as represented in Fig. 4.55.
Fig. 4.55. Proposed mechanism for arsenic (III) removal by hybrid material ZrPACM-43
At acidic pH, the material gets positively charged due to the protonation of amino groups which
remove hydrogen arsenite ion by means of acidic solution which demonstrates a positive redox
potential (+ 0.6V), on the variation of pH, these surface active OH groups may further bind or
release H+ where the surface remains positive due to the reaction:
MOH + H3O+ → MOH2 + H2O
The above reaction indicates that the removal efficiency of the material is more at low pH. Thus,
when pH ≤ 5.00, the overall arsenite adsorption mechanism can be represented in two different
forms:
(a) Electrostatic attraction between positively charged centre (nitrogen) and negatively charged
arsenite molecule in solution (b) Electrostatic attraction and complexation between positively
charged surface hydroxyl group and arsenite,
MNH2+ + HAsO3
3- → MNH2+---HAsO3
3-
MOH + H3O+ + HAsO3
3- → MOH2+---HAsO3
3- + H2 O
This information was supported by the formation of arsenic (III) complexes which is colourless.
The presence of arsenic peak in the EDX and XRD spectra of arsenic adsorbed hybrid material
confirms the occurrence of arsenic adsorption onto the hybrid materials (Deng et al., 2004; Li et
al., 2009). The material showed adsorption capacity at a wide acidic pH range, which could be
useful for commercial exploitation purpose

RESULTS & DISCUSSION 2014
89 | P a g e
4.3. Removal of chromium (VI) by lanthanum-diethanolamine (La-DEA) hybrid material
The present section elaborates the synthesis, characterization and removal of chromium
by lanthanum-diethanolamine (La-DEA) hybrid material. Various samples of hybrid material are
synthesized and characterized using different techniques like particle size analysis, BET surface
area analysis, TGA, DTA, XRD, FTIR, SEM, EDX and chemical analysis. Removal efficiency of
chromium was evaluated using hybrid material by conducting batch and column mode
experiments with the variation of relevant parameters. Effects of other competing anions and
cations on adsorption are also represented. Field studies were also carried out with hand pump
water sample to understand the practical applicability of the material in large scale water
treatment.
4.3.1. Characterization of La-DEA
A number of La-DEA materials are synthesized with the variation of molar ratio of
precursor and were tested for the removal efficiency of chromium as per the procedure adopted in
the previous section. The results of the study are presented in Table 4.32.
Table - 4.32. Removal capacity, particle size and Ion exchange capacity of various samples of La-
DEA (W= 1g), IEC in meq/g
Materials Molar ratio
Particle size (nm)
Chromium removal (%)
IEC KCl
IEC Ca(NO3)2
IEC NaNO3
IEC NaCl
IEC Mg(NO3)2
La-DEA-124 1:1 124 85.2 0.87 0.61 0.68 0.84 0.72
La-DEA-117 1:2 117 93.1 2.12 1.81 1.91 1.87 2.01
La-DEA-68 1:3 68 84.1 1.54 1.04 0.92 1.35 1.27
La-DEA-86 1:4 86 87.6 1.20 1.32 1.18 1.32 1.11
La-DEA-132 1:5 132 88.3 0.60 0.57 0.68 0.77 0.63
It is evident from the Table 4.32 that La-DEA-117 exhibited maximum removal of chromium (VI)
from synthetic chromium solution and was used for further studies. The chemical stability of the
material is presented in Table 4.33.
Table - 4.33. Chemical stability of La-DEA hybrid material in various acid, alkali and salt solutions
Solvent(10 mL) Amount Dissolved(mg)
Solvent (10 mL) Amount Dissolved(mg)
1M HCL 0.13 2M NaOH 0.16
2 M HCL 0.17 4M NaOH 0.33
4 M HCL 0.39 1M KOH 0.21
1 M HNO3 0.22 2M KOH 0.67
2M HNO3 0.28 4M KOH Dissolved
4M HNO3 0.61 1M NH4OH 0.03
1M H2SO4 0.34 2 MNH4OH 0.11
2M H2SO4 0.78 4M NH4OH 0.31
4M H2SO4 Dissolved 2M NaNO3 0.11
1 M NaOH 0.08 2M KNO3 0.24

RESULTS & DISCUSSION 2014
90 | P a g e
From the above studies, it was found that the material was chemically stable. The material is
obtained in the form of granular particles of ununiformed shape with a specific surface area of
398.42 m2/g. The TGA and DTA curve of the material is represented in Fig. 4.56. The weight loss
with increase in temperature can be described in the following three steps: (1) in the range of 50-
150 °C (weight loss of 9.84%) is due to loss of physical adsorbed water; (2) The weight loss (9.09
%) in the range of 150 to 250 °C is attributed to the loss of “lattice water” and CO groups present
in material; (3) the biggest weight loss (25.5%) in the range of 250°C to 500°C to the
decomposition of organic molecule present in the matrix at higher temperature. Correlating the
data with differential thermal analysis (DTA), an exotherm is also noticed at a temperature, of 224
°C, which supports the TGA. Four endothermic peaks at 100 °C, 160 °C, 300 °C and two
exothermic peaks 125 °C and 224°C respectively in DTA support the TGA analysis.
Fig. 4.56. TGA and DTA of lanthanum diethanolamine (La-DEA) hybrid material
Scanning electron micrographs (SEM) and corresponding EDX Spectrum of adsorbent before and
after adsorptions is represented in Fig. 4.57(a) and (b) respectively. It can be clearly observed
that small granules are embedded in flat surface before adsorption but there are shiny
appearances above the small granules after adsorption, which clearly manifests the adsorption of
chromium in the material. The EDX of material after adsorption confirms the presence of
chromium in the material. Similar studies for chromium removal was reported by, Boparai et al.
(2011) and Kumar et al. (2013). Powdered XRD diffractogram of the material are represented in
Fig. 4.58, which was analyzed by using Philips X’pert High Score software and compared with
International Center for Diffraction Data (ICDD-PDF-2) and JCPDS database to search the
phases of starting materials and adsorbed materials. The material is found to be crystalline in
nature. The diffraction peaks for the material before adsorption were observed at 2θ =11.20°,
50 100 150 200 250 300 350 400 450 500 550 600
14
16
18
20
22
24
26
0 500 1000 1500 2000 2500 3000
-70
-60
-50
-40
-30
-20
-10
0
En4
En3
En2
Exo
Temperature (OC)
Endo
Wei
gh
t lo
ss (
mg)
-TGA
- - -DTA
-H2O
-H2O
-NH2, OH
En1
Ex1
Ex2
Ex3
DT
A
Time (Second)

RESULTS & DISCUSSION 2014
91 | P a g e
17.23°, 19.80°, 27°, 28°, 30°, 33°, 35.5°, 36°, 43° where the peak at 2θ = 11.20°, 17.23°, 19.80°,
27°, 28°, 33°, 36° and 19.80°, 27° are characteristic peak of lanthanum nitrate and
diethanolamine having monoclinic and anorthic phases. According to JCPDS database peak at 2θ
= 28° is a common peak for lanthanum nitrate, lanthanum hydroxide and lanthanum oxide
(JCPDS#800748, JCPDS#401279).
(a) SEM micrographs (b) EDX images
Fig.4.57. (a) Scanning Electron Micrographs and (b) Energy-dispersive X-ray spectrum of La-DEA
hybrid material
Fig. 4.58. XRD pattern of La-DEA hybrid material (a) before adsorption (b) after adsorption

RESULTS & DISCUSSION 2014
92 | P a g e
The diffraction peaks for the material after adsorption are observed at 20.78°, 24°, 26.22°, 28.78°,
30°, 32°, 36°, 44.57° and 49.37°, where the peak at 2θ =30°, 32.50°, 36° and 49.37° are
prominent peaks for lanthanum chromium oxide (JCPDS#83-0256) having orthorhombic phase.
The crystallite size of both fresh (for plane 111, at 2θ = 26.3°) and loaded material (for plane 110,
at 2θ = 36.7°) is found to be 17.39 nm and 23.74 nm respectively: the increment in the crystallite
size is may be due to increment in space charge polarization and crystal defects after adsorption.
The crystallite size was calculated using Debye Scherrer equation (Gubicza et al. 2000; Junaid et
al. 2009; Shirasawa et al., 2014), as discussed in section 4.2.1. The peak intensity is represented
in Fig. 4.58 which confirms the fresh material and chromium adsorbed material.
Fig. 4.59. FTIR spectra using KBr pellet for La-DEA hybrid material, before and after adsorption
The FTIR spectrum of the material is presented in Fig. 4.59. The broad and strong absorption
band of fresh material is represented in Fig. 4.59(a) at ~3881.27 cm−1 corresponds to the
symmetric and asymmetric O–H stretching vibration, indicating the presence of the hydroxyl group
in the material. Another broad peak at ~3537.28 cm−1 indicates overlapping of O–H with N–H
groups. The band from ~2033.54 to ~2522.28 cm−1 is mainly because of combination stretching of
C–H, N–H and O–H groups. The band at ~1474.40 cm−1 may be due to C–N stretching and CH2
groups present in the material. The presence of bands at finger print region (centered at ~1048.77
4000 3500 3000 2500 2000 1500 1000 500
0
20
40
60
80
100
811.04
1048.77
1474.40
2033.54
2354.86
2522.28
3537.28
3881
.27
Wave Number (cm-1)
La-DEA
% T
rans
mita
nce
4000 3500 3000 2500 2000 1500 1000 500
20
40
60
80
100
851.
841057
.36
1316
.02
1510
.9517
67.0
6
2346
.30
2522
.20
2812
.12
3028.71
3628.66
3855
.49
% T
rans
mita
nce
Wave Number (cm-1)
La-DEA (adsorbed chromium (VI)

RESULTS & DISCUSSION 2014
93 | P a g e
cm−1) corresponds to C–C and C–O groups. The band at ~811.04 cm−1 indicates the stretching
vibration of La=O groups. The FTIR spectrum of the Cr(VI) loaded material is presented in Fig.
4.59(b). There are many shifts in the bands present in fresh adsorbent but few important
characteristics peaks are presented. The band at ~2354.86 cm−1 of adsorbent has been shifted to
~2346.30 cm−1 (blue shift) after it is loaded with chromium indicate the coordination of nitrogen to
metal ion. The band at ~811.04 cm−1 is shifted to ~851.84 cm−1 may be due to stretching
frequencies of Cr–O in Cr2O72− groups. This spectrum clearly indicates the loading of the
chromium to the adsorbent. There are many shifts in the bands present in fresh adsorbent but few
important characteristics peaks are presented. Kumar et al. (2013), Zhou et al. (2013) and Kumar
et al. (2012) has reported similar studies on the removal of chromium by amine impregnated
graphene oxide adsorbent, RGO-Fe3O4 hybrid composite, dodecylamine modified sodium
montmorillonite and polyaniline/silica gel composite respectively. The similar observation for FTIR
spectra suggests the possibility of adsorption mechanism in the present study.
The results of elemental analysis indicate that there is no sulphur content in the material. And the
material contains C = 10.75%, H = 2.48%, N = 3.13%, and others = 83.64%. Based on the studies
of FTIR, TGA-DTA and the elemental composition, the molecular formula of the adsorbent is
deduced by using Alberti equation (Jayashree et al., 2006) as discussed in Section 4.1.1. The
value of ‘n’ is found to be 5.419 and the tentative empirical formula for the material can be
suggested as [(LaNO3) (C4H11NO2)].nH2O. The surface charge density of the material as a
function of pH is represented in Fig. 4.60. The surface holds positive charge in lower pH and the
surface charge density decreases when the solution pH increases. The pH of zero point surface
charge density (ZPC) is 5.9 (pHzpc). When the pH of the solution is less than 5.9 the material
acquires positive charge and when the solution pH is higher than 5.9 than the material acquires
negative charge. Other researchers have also reported similar observations (De et al., 2005;
Islam et al., 2007; Zodi et al., 2010; Ma et al., 2011).
Fig. 4.60. Surface charge density as a function of pH (m =1.0 g/L)

RESULTS & DISCUSSION 2014
94 | P a g e
4.3.2. Removal of chromium by batch studies
The experiments were conducted in batches in 250 mL conical flask with stopper at room
temperature and the normal pH without any adjustment except the study to know the effect of
temperatures. The chromium removal from synthetic water is compared with hand pump water
obtained from boula-Nauasahi area of Kenojhar district (21oN΄ N: 86o 20΄E) which is a well-known
mining area for chromite. The samples are collected in duplicate following the standard procedure
(Bordoloi et a., 2006). The existence of Cr(VI) depends on the pH of the water. The pH of water
ranges from 7.6 to 8.1, which is higher than the pH of the normal ground water, the total
concentration of chromium, is found to contain 3.052 mg/L (recorded in 11-12-2012) and other
physico-chemical parameters are presented in Table 4.34.
Table - 4.34. Physical and chemical constituents of hand pump water (Sample water collected
from boula-Nauasahi area of Kenojhar district, odisha, India)
Sample (Hand pump water)
Values/ Concentration
pH 7.6
Temperature 26 ± 2 0C
Conductivity 328 µs/cm
Total Dissolved solids 119.76 mg /L
Total Chromium 3.052 mg /L
Total Arsenic 0.0028 mg /L
Lead 0.00014 mg /L
Chloride 68 mg /L
Residual Chlorine 0.68 mg /L
Total Hardness 64 mg /L
Fluoride 1.8 mg /L
Nitrate 5.38 mg /L
Sulfate 24 mg /L
Manganese 0.006 mg /L
Iron 0.027 mg /L
Carbonate 35 mg /L
Bicarbonate 26 mg /L
4.3.2.1. Effect of La-DEA dose on chromium (VI) removal
The effect of La-DEA dose in removal of chromium (VI) is studied by varying adsorbent dose from
0.1 g to 1.6 g. The result obtained is represented in Fig. 4.61.
The removal efficiency increases from “78.43% to 99.3%, 70.31% to 96.7%, 65.58 % to 98.59 %
and 73.26% to 99.96 %” with a variation of adsorbent dose form 0.1 to 1.5 g/100 ml with initial
Cr(VI) concentration of 10 mg/L, 50 mg/L, 100 mg/L of synthetic solution and 3.052 mg/L for hand
pump water respectively. The increase in percentage removal could be attributed to the
availability of more number of adsorption sites at the solid phase and availability of specific
surface area of adsorbent. In present study after a dose of 8 g/L, the removal efficiency remains
almost constant indicating the saturation of available adsorption sites and the overlapping of
active sites at higher dosage as well as the decrease in the effective surface area resulting in the
increase of exchanger particles (Meyn et al., 1990; Shibata et al., 2006; Mukhopadhyay et al.,

RESULTS & DISCUSSION 2014
95 | P a g e
2007). So, 8 g/L is considered as the optimum dose and is used for further study. Several
researchers have reported similar results (Zhang et al., 2008; Shi et al., 2011; Gandhi et al., 2012;
Yang et al., 2013).
Fig. 4.61. Percentage removal of Cr(VI) by La-DEA of initial concentration hand pump water-
3.052 mg/L, 10 mg/L, 50 mg/L and 100 mg/L versus La-DEA dose.
4.3.2.2. Effect of pH on removal of chromium (VI)
Removal efficiency of the material as a function of pH is represented in Fig. 4.62, for both
synthetic solution and contaminated water. The percentage removal increases from 65.58% to
98.58%, 75.58% to 94.24%, 64.15% to 86.75% and 66.78 % to 96.76% respectively for 10 mg/L,
50 mg/L, 100 mg/L and 3.052 mg/L of Cr (VI) with increasing the pH from 2 to 6 than decreases.
The highest adsorption is at a pH 5.9 as the surface charge density is highest at this point and
attracted the negatively charged Cr (VI) species. When the pH is 7 and above, the concentration
of hydrogen ion in solution decreases and the extent of protonation of amino groups became
smaller and adsorption decreases with increase in pH. At a higher pH, there is a competition of
the hydroxyl ions with Cr (VI) ions for adsorption which reduces the removal percentages
(Chakraborty et al., 2014; Golbaz et al., 2014; Linsha et al., 2013). The chromate and dichromate
anions simultaneously exist in equilibrium in water in acidic solution and the equilibrium towards
the dichromate ion (pH < 6).When the pH > 6, only CrO42- is stable, and equilibrium shifts towards
chromate ion. The equilibrium between chromate and dichromate with change in pH is presented
as;
H2O + Cr2O72- = 2CrO4
2- + 2H+ [pH> 6]
2CrO4 2- + 2H+ Cr2O7
2- + H2O [pH 6]
CrO42- + H+ HCrO4
- [pH 6]
2HCrO4- Cr2O7
2- + H2O [pH 6]
La-DEA + 2CrO42- + 2H+→ La-DEA---Cr2 O7
2- +H2 O [PH<6]
0.1 0.2 0.3 0.4 0.5 0.6 0.7 0.8 0.9 1.0 1.1 1.2 1.3 1.4 1.5 1.6
60
70
80
90
100
% R
em
ov
al o
f c
hro
miu
m(V
I)
Dose (g)
Hand pump water
10 mg/L
50 mg/L
100 mg/L

RESULTS & DISCUSSION 2014
96 | P a g e
The dominant species are HCrO4- and Cr2O7
2- depending on the pH of the solution. It is also be
noted that there is no possibility arises of chemical oxidation or reduction as no oxidizing or
reducing agent are added during the studies and the solution only contain hexavalent chromium
with three species(i.e. (HCrO4-, Cr2O7
2− < 6) and (CrO 42->6)) depending on pH. The pH of the
solution after adsorption is also measured and was found to decrease slightly (Table - 4.35).
Fig 4.62. Percentage removal of Cr(VI) by La-DEA of initial concentration hand pump water- 3.052
mg/L, 10 mg/L, 50 mg/L and 100 mg/L versus pH of the solution.
Table – 4.35. Change in pH during the removal of chromium (VI) by La-DEA hybrid material
Initial concentration of 10 mg/L
Initial concentration of 50 mg/L
Initial concentration of 100 mg/L
Hand pump water
Initial pH Final pH Initial pH Final pH Initial pH Final pH Initial pH
Final pH
2.0 2.1 2.0 2.2 2.0 2.0 2.0 2.2
3.0 2.9 3.0 3.0 3.0 3.1 3.0 2.9
4.0 4.2 4.0 4.1 4.0 3.9 4.0 4.1
5.0 5.8 5.0 5.4 5.0 4.8 5.0 4.7
6.0 6.4 6.0 5.8 6.0 5.6 6.0 6.2
7.0 7.3 7.0 7.1 7.0 6.9 7.0 6.9
8.0 7.8 8.0 7.9 8.0 8.2 8.0 8.2
9.0 8.6 9.0 9.2 9.0 8.9 9.0 8.9
10.0 9.9 10.0 9.8 10.0 10.0 10.0 10.0
4.3.2.3. Effect of contact time
The effect of contact time on chromium (VI) removal is represented in Fig. 4.63. The removal
efficiency increases from 61.2% to 98.8%, 48.5% to 84.71%, 59.85% to 87.91% and 58.85% to
96.37% with increase in time from 10 to 50 minutes for 10 mg/L, 50 mg/L, 100 mg/L synthetic
chromium solution and hand pump water sample respectively. The equilibrium time is 50 minutes
as no noticeable removal takes place after this time. Initially the rate of removal is higher, which
may be due to more vacant sites in the adsorbent with a high solute concentration gradient.
2 4 6 8 10 12
40
50
60
70
80
90
100
% R
em
ova
l o
f ch
rom
ium
(VI)
---- pH ----
10 mg/L
50 mg/L
100 mg/L
Handpump water
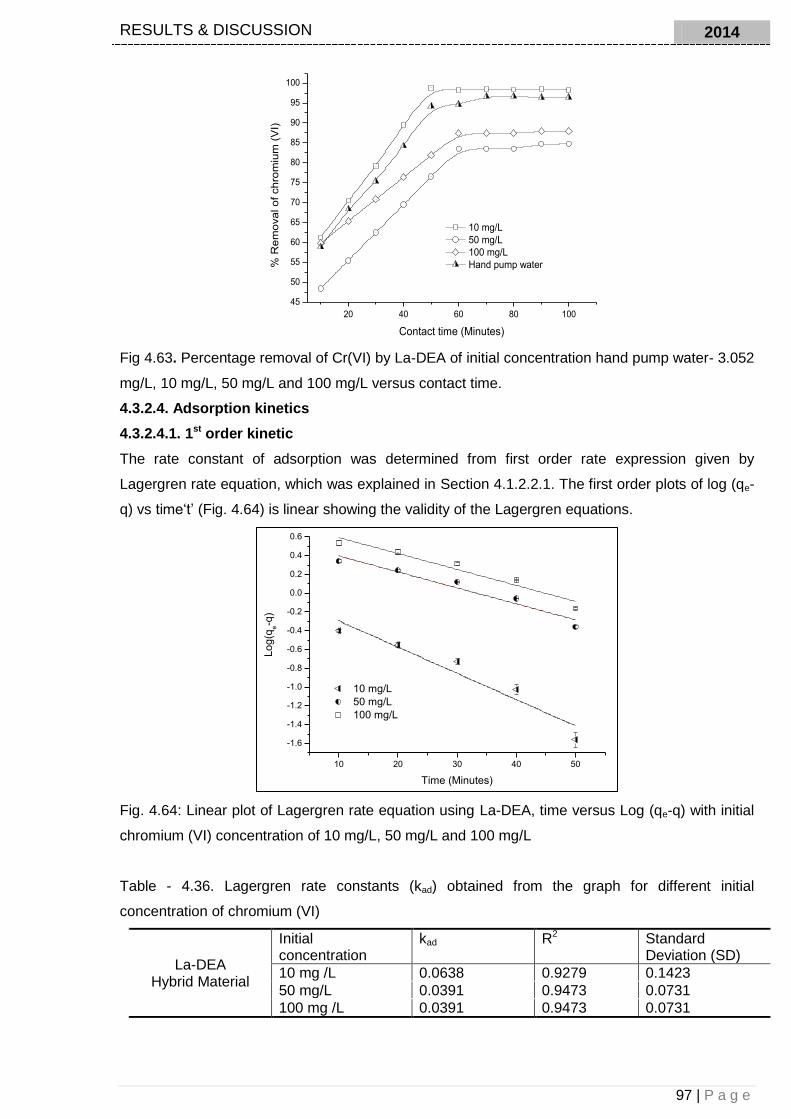
RESULTS & DISCUSSION 2014
97 | P a g e
Fig 4.63. Percentage removal of Cr(VI) by La-DEA of initial concentration hand pump water- 3.052
mg/L, 10 mg/L, 50 mg/L and 100 mg/L versus contact time.
4.3.2.4. Adsorption kinetics
4.3.2.4.1. 1st order kinetic
The rate constant of adsorption was determined from first order rate expression given by
Lagergren rate equation, which was explained in Section 4.1.2.2.1. The first order plots of log (qe-
q) vs time‘t’ (Fig. 4.64) is linear showing the validity of the Lagergren equations.
Fig. 4.64: Linear plot of Lagergren rate equation using La-DEA, time versus Log (qe-q) with initial
chromium (VI) concentration of 10 mg/L, 50 mg/L and 100 mg/L
Table - 4.36. Lagergren rate constants (kad) obtained from the graph for different initial
concentration of chromium (VI)
La-DEA Hybrid Material
Initial concentration
kad R2 Standard Deviation (SD)
10 mg /L 0.0638 0.9279 0.1423
50 mg/L 0.0391 0.9473 0.0731
100 mg /L 0.0391 0.9473 0.0731
20 40 60 80 100
45
50
55
60
65
70
75
80
85
90
95
100
% R
em
ova
l o
f ch
rom
ium
(V
I)
Contact time (Minutes)
10 mg/L
50 mg/L
100 mg/L
Hand pump water
10 20 30 40 50
-1.6
-1.4
-1.2
-1.0
-0.8
-0.6
-0.4
-0.2
0.0
0.2
0.4
0.6
Lo
g(q
e-q
)
Time (Minutes)
10 mg/L
50 mg/L
100 mg/L

RESULTS & DISCUSSION 2014
98 | P a g e
The relevant data from the plot is presented in Table 4.36. The activiation energy was calculated
using Arrhenius equation and it was found to be 27.8 kJ/mol, 34.8 kJ/mol and 35.0 kJ/mol
respectively for initial Cr(VI) of 10 mg/L, 50 mg/L and 100 mg/L. The data obtained suggest
chemisorption nature of the adsorption process. The values of R2 show good correlation. The
results of the present kinetic study lie well with the results obtained in the adsorption of chromium
(VI) by lanthanum diethanolamine (La-DEA) hybrid material.
4.3.2.4.2. Helfferich equation
Adsorption of ions in aqueous solution follows reversible first order kinetics. Hence in the present
study, the kinetics of chromium (VI) adsorption using Helfferich equation (Discussed in Section
4.1.2.2.2) has been carried out to understand the adsorption behaviour of La-DEA hybrid material.
Fig. 4.65. Linear plot of Helfferich equation using La-DEA, time versus ln[1-U(t)] with initial
chromium (VI) concentration of 10 mg/L, 50 mg/L and 100 mg/L.
The rate constant k’ using Helfferich equation for the adsorption of chromium (VI) at room
temperature was determined by batch mode. The straight line plots of ln [1-U (t)] vs time ‘t’
indicate that the adsorption of chromium (VI) from aqueous solution follows first order kinetics with
respect to adsorbents which is represented in the Fig. 4.65. The data obtained from the graphs
are presented in Table 4.37.
Table - 4.37. Rate constant (k’) obtained from the graph for different initial concentration of
chromium (VI)
La-DEA Hybrid Material
Initial concentration (mg/L)
Rate constant in min -1 (k’) SD R2
10 0.06375 0.32774 0.9565
50 0.03912 0.16842 0.9473
100 0.03912 0.16842 0.9473
The forward (k1) and backward (k2) rate constants are calculated according to equation presented
in Section and is presented in Table 4.38. It is well evident from the data in the tables that, the
10 20 30 40 50
-4.0
-3.5
-3.0
-2.5
-2.0
-1.5
-1.0
-0.5
ln[1
-U(t
)]
Time (Minutes)
10 mg/L
50 mg/L
100 mg/L

RESULTS & DISCUSSION 2014
99 | P a g e
forward rate constants are higher than the backward rate constants suggesting that the rate of
forward process (adsorption) are higher than the rate of backward process (desorption) up to
completion of equilibrium and the equilibrium was towards the product side. Similar results have
been reported by Gasser et al. (2007), Awual et al. (2011), Qiu et al. (2013), Gomez-Gonzalez et
al. (2014), and Gonzalez et al. (2014).
Table - 4.38. Rate constants (k1 and k2) obtained for different initial concentration of chromium
(VI)
La-DEA Hybrid Material
Initial concentration (mg/L)
Overall rate constant k’ (min -1)
Forward rate constant k1
(min -1)
Backward rate constant k2
(min -1)
10 0.06375 0.0590 0.0047
50 0.03912 0.0336 0.0055
100 0.03912 0.03473 0.0044
4.3.2.4.3. 2nd order kinetic study
The second order rate equation is studied according to equation represented in Section 4.1.2.2.3.
The data obtained from contact time study is fitted to second order kinetic model and the result is
represented in the graphical form in Fig. 4.66. The second order constant and adsorption capacity
is calculated from the equation as represented and discussed in section 4.1.2.2.3. The value
obtained from the plot is presented in Table 4.39.
Table - 4.39. Second order rate constant for chromium (VI) removal by La-DEA hybrid material
La-DEA Hybrid
Material
Initial Conc k2 qc R2 SD
10 mg/L 1.57 1.57 0.999 0.0160
50 mg/L 0.12 7.79 0.999 0.0261
100 mg/L 0.07 15.37 0.999 0.0219
On the basis of standard deviation (SD) and correlation coefficient (R2) values the second order
kinetic model (Table 4.39), is the best fit model in describing the chromium (VI) adsorption
process by La-DEA hybrid material. The maximum adsorption capacity of 15.37 mg/g is obtained
for initial Cr (VI) solution of 100 mg/L.
Fig. 4.66. Linear plot of second order rate equation using La-DEA, time versus t/qt with initial
chromium (VI) concentration of 10 mg/L, 50 mg/L and 100 mg/L.
0 10 20 30 40 50 60 70 80 90
0
10
20
30
40
50
60
70
t/q
t
Time (minutes)
10 mg/L
50 mg/L
100 mg/L

RESULTS & DISCUSSION 2014
100 | P a g e
4.3.2.4.4. Intraparticle diffusion (Weber Morissis equation)
To understand the diffusion of chromium (VI) ions into the sites of the adsorbents the contact time
data was tested with Weber-Morris equation as represented in the Section 4.1.2.2.4. The plot
obtained from the study is represented in Fig. 4.67.
Fig. 4.67. Linear plot of Weber- Morris equation using lanthanum diethanolamine hybrid material,
square root of time versus qe with initial chromium (VI) concentration of 10 mg/L, 50 mg/L and 100
mg/L.
The value of kp (intraparticle diffusion constant) is calculated from the plot by using the equation
as represented and discussed in Section 4.1.2.2.4. The values obtained are presented in Table
4.40.
Table - 4.40. Intraparticle diffusion rate constants obtained from Weber- Morris equation for
different initial concentration of chromium (VI)
It is understood from Fig. 4.67, that there is a deviation of line from the origin which indicates that
the intraparticle transport is not the only rate limiting step but, the transport of adsorbate through
the pores of the adsorbent and adsorption on the surface of the material are also responsible.
Subsequently adsorption process is accelerated indicate that the diffusion is not consecutive due
to pore size (Lorenzen et al. 1995; Erhan et al. 2004). At the final phase of adsorption process,
the rate of diffusion remains constant due to exhaustion of pores in the material. When kp value is
larger, the rate of adsorption is more but, when C value is larger, the adsorption is better due to
better bonding between sorbet and sorbent. The concentration gradient decides the flow of
particles into the pores of material. With the increase in the concentration of Cr (VI) the kp value
increases suggesting the intraparticle diffusion is considered as the concentration diffusion (Erhan
et al. 2004). In the present study the high value of C suggest effective removal of Cr (VI) from
3 4 5 6 7 8
1
2
3
4
5
qe
t
10mgL
50mgL
100mgL
Equation
Adj. R-Square
50mgL
50mgL
Equation
Adj. R-Square
100mgL
100mgL
Equation
Adj. R-Square
10mgL
10mgL
Adsorbent Initial concentration (mg/L)
kp C R2 SD
La-DEA
10 0.0804 0.517 0.9675 0.02198
50 0.4777 1.398 0.9847 0.11325
100 0.7507 1.336 0.9847 0.17796

RESULTS & DISCUSSION 2014
101 | P a g e
water. Similar studies by other researchers (Erhan et al., 2004; Badruzzaman et al. 2004; Zubair
et al., 2008; Montastruc et al., 2011)) suggest the applicability of above mechanism.
4.3.2.5. Effect of temperature
The result of the effect of temperature on the adsorption of chromium (VI) is represented in (Fig.
4.68.). The percentage removal of chromium (VI) increases from 70.54% to 98.77% for initial
concentration of 10 mg/L, from 66.7% to 87.62% for 50 mg/L, from 61.01% to 88.37% for 100
mg/L and from 68.7% to 97.52% for total chromium concentration of 3.052 g/L for hand pump
water with an increase in temperature from 20 to 70 °C. The continuous increase in percentage
removal indicates the endothermic nature of adsorption process. This may be probably due to
decrease in the escaping tendency of the adsorbent species from the surface of the adsorbent,
change in effective pore size and enhanced rate of intraparticle diffusion. The same trend was
reported by Rengaraj et al. (2001) and Kumar et al. (2007). The H+ adsorbent bond is significant
because adsorption of chromium (VI) involves movement of H+ ions from the adsorbent surface.
Therefore it may be concluded that at higher temperatures, the increase in adsorption could be
due to the waning of H+ adsorbent bond.
Fig. 4.68. Temperature versus percentage removal of chromium (VI) with lanthanum
diethanolamine hybrid material, initial chromium (VI) concentrations of 10 mg/L, 50 mg/L, 100
mg/L and 3.052 mg/L hand pump water.
4.3.2.6. Adsorption thermodynamics
The thermodynamic parameters (change in free energy (G), enthalpy (H) and entropy (S)) of
adsorption process are evaluated by similar process as in the previous Section 4.1.2.4. A plot of
logs Kc versus 1/T for initial chromium (VI) concentration of 10 mg/L, 50 mg/L and 100 mg/L is
found to be linear as in (Fig. 4.69). Values of H and S are evaluated from slope and intercept of
Van’t Hoff Plot and are presented in (Table 4.41).
20 30 40 50 60 70 80
60
65
70
75
80
85
90
95
100
% R
em
ova
l o
f ch
rom
ium
(V
I)
Temperature (C)
10 mg/L
50 mg/L
100 mg/L
Hand pump water

RESULTS & DISCUSSION 2014
102 | P a g e
Fig. 4.69. Van’t Hoff plot, log Kc versus 1/T for La-DEA hybrid material
The positive value of entropy (S) indicates the increase in randomness of the ongoing process
and hence good affinity of chromium (VI) with the hybrid material. Negative value of G at each
temperature indicates the feasibility and spontaneity of ongoing adsorption process. A decrease in
values of G with increase in temperature suggests more adsorption of chromium (VI) at higher
temperature which indicates the endothermic nature of the adsorption process which is confirmed
by the positive value of enthalpy (H). The value of G also suggest the chemisorption nature of
the adsorption process. The same observation was reported by Fan et al. (2003), Chon et al.
(2006), Argun et al. (2007), Babu et al. (2008), Boparai et al. (2011), and Chen et al. (2011).
Table - 4.41. Thermodynamic parameters using synthetic chromium (VI) solution of 10 mg/L, 50
mg/L and 100 mg/L
4.3.2.7. Effect of initial concentration
The results of the effect of initial concentration of adsorbate are represented in graphical form in
(Fig. 4.70). The removal percentage of chromium (VI) decreases from 42% to 3.77%, 88% to
58.77% and 39% to 7.63% at pH 2, pH 5 and pH 8 respectively for 1 to 100 mg/L of chromium
(VI) concentration. At pH 2, the effective removal decreases because the surface is highly
protonated and excess of H+ ion concentration accumulated in the surface makes the adsorbent
less attractive to adsorbate. However at pH 8 the excess of OH groups competes with the
adsorbate species resulting in decreased adsorption. Due to high concentration gradient at higher
concentration the removal is less effective. But at pH 5, the effective removal is more because of
0.01 0.02 0.03 0.04 0.05
0.90
0.95
1.00
1.05
1.10
1.15
log
Kc
1/T
10 mg/L
50 mg/L
100 mg/LEquation y = a + b*x
Adj. R-Square 0.87083
10mgL Intercept
10mgL Slope
Equation y = a + b*x
Adj. R-Square 0.82607
Value
50mgL Intercept 0.99905
50mgL Slope -1.98229
Equation y = a + b*x
Adj. R-Square 0.80105
100mgL Intercept
100mgL Slope
Initial Conc (mg/L)
ΔH (kJ/mol) ΔS (kJ/ K mol)
ΔG (kJ/mol) R2
293K 303K 313K 323K
10 11.7 0.942 -7.125 -16.548 -25.971 -35.394 0.8708
50 10.7 0.924 -7.731 -16.968 -27.025 -36.261 0.8260
100 10.0 0.578 -1.492 -7.273 -7.273 -13.053 0.8010

RESULTS & DISCUSSION 2014
103 | P a g e
balanced conditions. However with increasing the concentration the removal decreases, which
may be due to overlapping of adsorbate species and high concentration gradient.
Fig. 4.70. Percentage removal of chromium (VI) by lanthanum diethanolamine hybrid material at
different pH conditions (pH 2, pH 5 and pH 8)
4.3.2.8. Adsorption isotherm
It is important to have an acceptable description of the equilibrium sate between the two
phases in order to effectively represent the dynamic behavior of any adsorbate from solution to
the solid (adsorbent) phase (Islam et al., 2007). The capacity of the material can be described by
equilibrium adsorption isotherm, which is characterized by certain constants whose values
express the surface properties and affinity of the adsorbent (Pokhrel et al., 2007; Shin et al., 2011;
Maghsoudi et al., 2015). The study of the isotherm data is significant to develop an equation
which exactly represents the results and could be used for design purpose. Batch mode
adsorptions were carried out at room temperature by varying the concentration of chromium (VI).
4.3.2.8.1. Langmuir isotherm
The adsorption data are tested with the linearly transformed Langmuir isotherm (Langmuir,
1918). This is valid for monolayer sorption onto a surface with finite number of identical sites
(Namasivayam and Yamuna, 1995; Messina et al., 2006; Vinodhini et al., 2010; Cantu et al.,
2014). The linear plot of 1/ Ce versus 1/ qe (Fig. 4.71) with R2 = 0.972 indicates the applicability of
Langmuir adsorption isotherm. The values obtained from the figure are presented in Table 4.42.
0 20 40 60 80 100
0
5
10
15
20
25
30
35
40
45
pH 2
% R
em
oval
of
ch
rom
ium
(V
I)
Intial chromium (VI) concentration
0 20 40 60 80 100
60
70
80
90
pH 5
% R
em
oval
of
ch
rom
ium
(V
I)
Intial chromium (VI) concentration
0 20 40 60 80 100
10
20
30
40
pH 8
% R
em
oval
of
ch
rom
ium
(V
I)
Intial chromium (VI) concentration

RESULTS & DISCUSSION 2014
104 | P a g e
Table - 4.42. Langmuir isotherm parameters for chromium (VI) removal by La-DEA hybrid material
La-DEA
Langmuir Isotherm
pH qo (mg/g) B (L/mg) R2 SD
2 53.2 0.05 0.73262 0.00435
5 357.1 0.35 0.99807 0.00013
8 8.41 0.01 0.81133 0.00258
(r) dimensionless equilibrium parameter
10 mg/L 0.65
50 mg/L 0.22
100 mg/L 0.92
Fig. 4.71. Langmuir adsorption isotherm, 1/Ce versus 1/qe for La-DEA hybrid material
On the basis of dimensionless equilibrium parameter the adsorption process is favorable. The
maximum adsorption capacity of 357.1 mg/g for this material suggests the effective removal of
chromium (VI) and can be utilized for removal of chromium (VI) from water.
4.3.2.8.2. Freundlich isotherm
The Freundlich equation is used for defining the applicability of heterogeneous surface energy in
the adsorption process. The Freundlich isotherm plot for the hybrid material is represented in Fig.
4.72 and the respective data of the plots are presented in Table 4.43.
Table - 4.43. Freundlich isotherm parameters for chromium (VI) removal by La-DEA hybrid material
Freundlich adsorption isotherm
La-DEA hybrid material
pH Kf n R2 SD
2 0.9441 1.9654 0.8452 0.15028
5 1.6852 0.9627 0.9984 0.00349
8 0.3461 0.9627 0.8388 0.17478
On the basis of correlation coefficient values it is evident that the Langmuir isotherm fits better
than Freundlich isotherm. (Manju et al., 1998; Messiana et al., 2006; Duranoğlu et al., 2012).
0.00 0.05 0.10 0.15 0.20 0.25 0.30 0.35
0.000
0.005
0.010
0.015
0.020
0.025
0.030
0.035
0.040
1/q
e
1/Ce
pH-2
pH-5
pH-8

RESULTS & DISCUSSION 2014
105 | P a g e
Fig. 4.72. Freundlich adsorption isotherm, log Ce versus log qe for La-DEA hybrid material
4.3.2.8.3. Dubinin-Radushkevich (D-R) Isotherm
In order to understand the adsorption type, equilibrium data were tested with Dubinin-
Radushkevich isotherm, (Dubinin, 1966, 1975; Dubinin and Stoeckli, 1980).
Fig. 4.73. D-R adsorption isotherm, ln qe versus ε2 for chromium (VI) removal by La-DEA hybrid
material.
The data obtained from D-R isotherm plot (Fig. 4.73) is presented in Table 4.44. In the present
study the value of E is 260.6 kJ/mol at pH 5 lies in the range 200 - 400 kJ/mol and the adsorption
0.2 0.4 0.6 0.8 1.0 1.2 1.4 1.6 1.8 2.0 2.2
1.5
2.0
2.5
3.0
log
qe
log Ce
pH-2
pH-5
pH-8
Equation y = a + b*x
Adj. R-Square 0.3653
pH2 Intercept
pH2 Slope
Equation y = a + b*x
Adj. R-Square 0.99461
pH5 Intercept
pH5 Slope
Equation y = a + b*x
Adj. R-Square 0.34756
pH8 Intercept
pH8 Slope
0 5000 10000 15000 20000
3.6
3.8
4.0
4.2
4.4
4.6
pH 2
ln q
e
2
0 20000 40000 60000 80000 100000 120000 140000 160000
5.0
5.2
5.4
5.6
5.8
6.0
6.2
6.4
pH 5
ln q
e
2
0 5000 10000 15000 20000 25000 30000 35000
4.4
4.5
4.6
4.7
4.8
4.9
5.0
5.1
pH 8
ln q
e
2

RESULTS & DISCUSSION 2014
106 | P a g e
can be best explained as chemisorption. (Gregg and Sing, 1982; Sarkar et al., 2010). Similar
results were reported by (Swain et al., 2010; Hong et al., 2014; Li et al., 2014).
Table - 4.44. D-R isotherm parameters for chromium (VI) removal by lanthanum diethanolamine
(La-DEA) hybrid material
D-R isotherm
La-DEA
pH K (mol2kJ-2) qm (g/g) E (kJ/mol) R2 SD
2 -4.42 X 10⁻⁵
1.41 106.3 0.9260 4.31289
5 -7.36 X 10⁻⁶
1.77 260.6 0.8167 0.18048
8 -1.88 X 10⁻⁵
1.55 162.9 0.8804 0.07731
4.3.2.9. Effect of competitive anions on chromium (VI) removal
The result of adsorption in presence of other anions present in the water is represented in Fig.
4.74. With the increase in concentration of these anions the adsorption of Cr(VI) reduces
significantly. The anions reduced the Cr (VI) adsorption in the order of carbonate > bicarbonate >
nitrate > phosphate > chloride > fluoride > sulfate, for initial concentration of 10 mg/L. From the
above observation it is clear that presence of these ions reduced the adsorption of chromium
effectively upto 60 %.
Fig. 4.74. Percentage removal of chromium (VI) with lanthanum diethanolamine (La-DEA) hybrid
material versus initial anion concentration of solution. (Initial chromium (VI) concentration -10
mg/L)
4.3.2.10. Regeneration and reusability studies
In order to understand the type of adsorption, i.e. physical or chemical, desorption studies is
necessary to carried out. The result of the desorption studies is presented in Table 4.45.
Desorption of the adsorbed arsenic (III) in distilled water resulted about 6.0% for initial
concentration of 100 mg/L and less than 6.0 %, for initial concentration less than 100 mg/L. It
indicates the chemical or ion- exchange in nature of the adsorption process.
0 50 100 150 200
40
45
50
55
60
65
70
75
80
85
90
% R
em
ova
l o
f ch
rom
ium
(V
I)
Initial anion concentration (mg/L)
Carbonate
Bicarbonate
Nitrate
Phosphate
Chloride
Fluoride
Sulphate
Chromium - 10 mg/L

RESULTS & DISCUSSION 2014
107 | P a g e
Fig. 4.75. Regeneration of lanthanum diethanolamine hybrid material (La-DEA)
Table – 4.45. Percentage desorption and regeneration of chromium of different concentration by
hybrid material
Initial chromium (VI) concentration (mg/L)
Amount desorbed (mg/L) Percentage desorption or regeneration
pH5 pH8 pH11 Distilled water
pH5 pH8 pH11 Distilled water
10 8.2 8.7 78.95 1.2 82 87 91.2 1.04
50 39.79 42.15 48.67 2.8 79.58 84.3 90.24 3.33
100 78.95 45.12 89.36 6.37 78.95 84.67 89.36 9.05
Fig. 4.76. Reusability studies of La-DEA hybrid material (Initial chromium (VI) - 100 mg/L)
Regeneration studies are carried out for 10 mg/L in the range of pH 7.5 to 11 and the results are
represented in Fig. 4.75. The maximum regeneration occurs at pH 11. Desorption of the adsorbed

RESULTS & DISCUSSION 2014
108 | P a g e
Cr (VI) in distilled water represented in Fig. 4.76 and the maximum desorption is about 9.05%.
The results indicate the poor desorption capacity of the material because of chemisorption, which
is in good agreement from free energy study.
4.3.3. Column studies for removal of chromium (VI) by La-DEA hybrid material
Fixed bed column study is carried out with a column as discussed in Chapter-3, Section 3.16 and
4.1.3, at different flow rate. The breakthrough curve for synthetic sample at different bed depth
and flow rate is represented in Fig. 4.78 and Fig. 4.79.
Fig. 4.78. Breakthrough curve at different bed depth for lanthanum diethanolamine (La-DEA) C/C0
versus time (t) in hours, initial chromium (VI) concentration- 10mg/L
Fig. 4.79. Breakthrough curve at different flow rate for lanthanum diethanolamine (La-DEA) C/C0
versus time (t) in hours, initial chromium (VI) concentration- 10mg/L
0 10 20 30 40 50 60 70
0.0
0.1
0.2
0.3
0.4
0.5
Ce
ff/C
o
Time in hours (h)
5 cm
10 cm
15 cm
0 10 20 30 40 50 60
0.0
0.1
0.2
0.3
0.4
0.5
Ce
ff/C
o
Time in hours (h)
2 mL/min
5 mL/min
7 mL/min

RESULTS & DISCUSSION 2014
109 | P a g e
Fig. 4.80. Logit equation for different bed depth for lanthanum diethanolamine (La-DEA) hybrid
material ln[Ceff/(Co-Ceff)] versus time ‘t’, initial chromium (VI) concentration- 10mg/L
Fig. 4.81. Logit equation for different flow rate for lanthanum diethanolamine (La-DEA) hybrid
material ln [Ceff/ (Co-Ceff)] versus time ‘t’, initial chromium (VI) concentration- 10mg/L
In the present study the maximum permissible limit is 0.005 mg/L the breakthrough time
(corresponding to Ceff/C0 = 0.005, where Ceff = effluent chromium concentration = 0.05 mg/L, and
C0 = initial chromium (VI) concentration = 10 mg/L) and exhaust time of the material are found to
be 16, 18 and 24 h respectively for bed depth of 5 cm, 10 cm and 15 cm. The data obtained from
the plot by carrying out mathematical analysis as discussed in Section 3.1.6.3 is presented in
Table 4.46. The fixed bed column is designed by logit method (Jain et al., 2009; Maji et al., 2012).
Plot of ln [Ceff/C0-Ceff] versus time ‘t’ gives a straight line with slope KC0 and intercept –XKN0/V
from which K and N0 was calculated (Fig. 4.80 and Fig. 4.81). The data from the plot is presented
in Table 4.46. From the data it is understood that removal efficiency is better in batch studies. At a
bed depth of 15 cm with a flow rate of 5 mL/min the removal of chromium (VI) is maximum in fixed
0 10 20 30 40 50 60
-6
-5
-4
-3
-2
-1
0
ln(C
eff/(
C0-C
eff))
Time in hours (h)
5 cm
10 cm
15 cm
0 10 20 30 40 50 60
-3.0
-2.5
-2.0
-1.5
-1.0
-0.5
0.0
ln(C
eff/(
C0-C
eff))
Time in hours (h)
2 mL/min
5 mL/min
7 mL/min
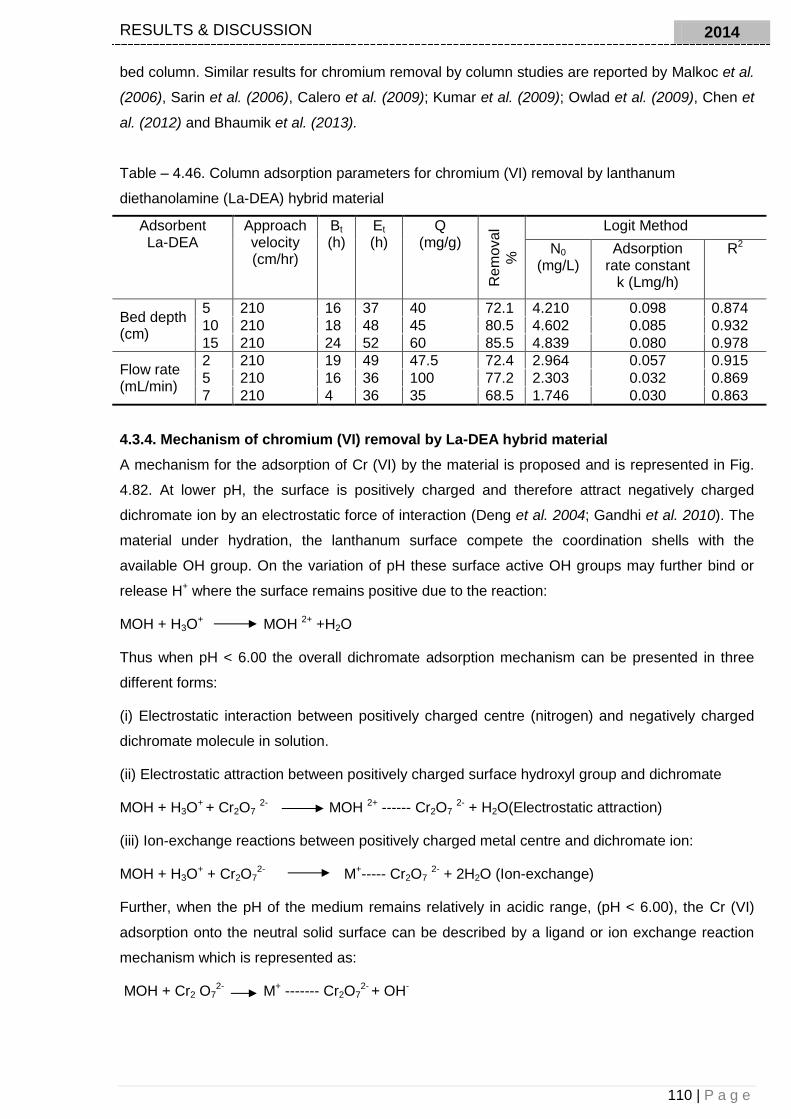
RESULTS & DISCUSSION 2014
110 | P a g e
bed column. Similar results for chromium removal by column studies are reported by Malkoc et al.
(2006), Sarin et al. (2006), Calero et al. (2009); Kumar et al. (2009); Owlad et al. (2009), Chen et
al. (2012) and Bhaumik et al. (2013).
Table – 4.46. Column adsorption parameters for chromium (VI) removal by lanthanum
diethanolamine (La-DEA) hybrid material
Adsorbent La-DEA
Approach velocity (cm/hr)
Bt
(h) Et
(h) Q
(mg/g)
Re
mo
va
l
%
Logit Method
N0
(mg/L) Adsorption
rate constant k (Lmg/h)
R2
Bed depth (cm)
5 210 16 37 40 72.1 4.210 0.098 0.874
10 210 18 48 45 80.5 4.602 0.085 0.932
15 210 24 52 60 85.5 4.839 0.080 0.978
Flow rate (mL/min)
2 210 19 49 47.5 72.4 2.964 0.057 0.915
5 210 16 36 100 77.2 2.303 0.032 0.869
7 210 4 36 35 68.5 1.746 0.030 0.863
4.3.4. Mechanism of chromium (VI) removal by La-DEA hybrid material
A mechanism for the adsorption of Cr (VI) by the material is proposed and is represented in Fig.
4.82. At lower pH, the surface is positively charged and therefore attract negatively charged
dichromate ion by an electrostatic force of interaction (Deng et al. 2004; Gandhi et al. 2010). The
material under hydration, the lanthanum surface compete the coordination shells with the
available OH group. On the variation of pH these surface active OH groups may further bind or
release H+ where the surface remains positive due to the reaction:
MOH + H3O+ MOH 2+ +H2O
Thus when pH < 6.00 the overall dichromate adsorption mechanism can be presented in three
different forms:
(i) Electrostatic interaction between positively charged centre (nitrogen) and negatively charged
dichromate molecule in solution.
(ii) Electrostatic attraction between positively charged surface hydroxyl group and dichromate
MOH + H3O+ + Cr2O7
2- MOH 2+ ------ Cr2O7 2- + H2O(Electrostatic attraction)
(iii) Ion-exchange reactions between positively charged metal centre and dichromate ion:
MOH + H3O+ + Cr2O7
2- M+----- Cr2O7 2- + 2H2O (Ion-exchange)
Further, when the pH of the medium remains relatively in acidic range, (pH < 6.00), the Cr (VI)
adsorption onto the neutral solid surface can be described by a ligand or ion exchange reaction
mechanism which is represented as:
MOH + Cr2 O72- M+ ------- Cr2O7
2- + OH-

RESULTS & DISCUSSION 2014
111 | P a g e
Fig. 4.82. Proposed mechanism of chromium (VI) adsorption by La-DEA hybrid material
The modeling of the specific adsorption of Cr2O72- on any material surface depends on a number
of external factors such as temperature, pH, initial Cr2O72- concentration as well as the density of
surface functional groups available for coordination. The role of diethanolamine in the material is
twofold. First, the attachment of diethanolamine to the structure develops nucleophilicity. Second,
the attachment of the diethanolamine could be responsible for the development of porosity in the
structure for imparting a large specific surface area after drying. Further, the diethanolamine may
also combine with the lanthanum to form a layer where the neighbouring particles could be
interconnected. The mechanism presented above is supported by the following references, Kim et
al. (2006), Hu et al. (2007), Li et al. (2009), Linsha et al. (2013), Golbaz et al. (2014). In light of the
above mechanism; adsorption capacity is valid at a wide pH range which could be useful for
commercial purpose

RESULTS & DISCUSSION 2014
112 | P a g e
4.4. Removal of Arsenic (III) by cerium oxide hydroxylamine hydrochloride (Ce-HAHCl)
The removal of arsenic (III) from water solution by a cerium oxide hydroxylamine
hydrochloride (Ce-HAHCl) hybrid material is presented in this section. The hybrid material was
synthesized by sol-gel method. XRD, FTIR, SEM-EDX and TGA-DTA are used to characterize the
material. The results of batch and column adsorption experiments as a function of different
variables like adsorbent dose, pH, contact time, agitation speed, initial concentration,
temperature, and bed height and flow rate are presented. Subsequently, the experimental results
are used for developing a valid model based on back propagation (BP) learning algorithm with
artificial neural networking (BP-ANN) for prediction of removal efficiency. The adequacy of the
model (BP-ANN) is checked by value of the absolute relative percentage error and correlation
coefficient. Comparison of experimental and predictive model is carried out to understand the
non-linear behaviour and practical application in high scale water treatment.
4.4.1. Characterization of cerium oxide hydroxylamine hydrochloride (Ce-HAHCl) hybrid
material
A number of samples of Ce-HAHCl are prepared by adding different molar solution of
hydroxylamine hydrochloride (1.0-3.0 M) and their arsenic (III) ion exchange capacity is studied by
batch experiments (See Table 4.47).
Table - 4.47. Different composition of the material, ion exchange capacity, surface area and
particle size studies.
Material Composition
Molar Ratio
Particle size (nm)
Surface area m2 g-1
Ion exchange capacity (IEC) in meq g-1 (W=1g)
Size KCl Ca(NO3)2 NaNO3 NaCl
Ce-HAHCl-1 1:1 250 239 1.41 1.28 0.98 1.33 Ce-HAHCl-2 1:3 258 215 1.03 1.11 0.64 1.00 Ce-HAHCl-3 2:1 220 267 1.22 1.15 1.04 1.11
Ce-HAHCl-4 2:3 183 410 1.94 1.76 1.52 1.83
Ce-HAHCl-5 3:1 207 348 1.50 1.51 1.25 1.37
Ce-HAHCl-6 3:3 203 367 1.63 1.58 1.41 1.55
Table - 4.48. Chemical stability of cerium oxide hydroxylamine hydrochloride (Ce-HAHCl) hybrid
material
Solvent(10 mL) Amount Dissolved(mg) Solvent(10 mL) Amount Dissolved(mg)
1M HCl 0.12 1M H2SO4 0.34
2M HCl 0.22 2M H2SO4 0.86
3M HCl 0.64 3M H2SO4 Dissolved
4M HCl 0.94 4M H2SO4 Dissolved
1M HNO3 0.16 1M NH4OH 0.11
2M HNO3 0.39 2M NH4OH 0.26
3M HNO3 0.91 3M NH4OH 0.59
4M HNO3 Dissolved 4M NH4OH 0.78
Hydroxylamine hydrochloride with cerium oxide forms a stable polymeric matrix, which
was supported by the study of chemical stability as presented in Table 4.48. From the stability
studies, it was found that the material was quite stable in most of the mineral acids and salt

RESULTS & DISCUSSION 2014
113 | P a g e
solutions. The material is chemically stable, as it is insoluble in 2M solutions of most of the
mineral acids (H2SO4, HNO3 and HCl) and alkali (NH4OH). Table 4.48 represents the best
composition (Ce-HAHCl-4) having high ion exchange capacity with particle size of 183 nm and
surface area of 410 m2/g.
The thermal analysis of the material is represented in Figure 4.83. The weight loss in the
material is presented in two steps: (1) there is a rapid weight loss (3.581%) up to 200 0C attributed
to the loss due to physically adsorbed water molecules present in the material. (2) The second
weight loss from 200 0C to 700 0C (2.449%) due to loosely bounded water and dehydroxylation of
lattice – OH groups. The DTA curves of the material indicate that there are several endothermic
peaks, which support the above observation. Thermo gravimetric analysis of the material strongly
indicates the presence of hydroxylamine hydrochloride in the moiety either in bonded form or in
the adsorbed form on the surface of the hydrous cerium oxide gel.
Fig. 4.83. TGA-DTA of the hybrid material (Ce-HAHCl) before adsorption SEM images with the corresponding EDX spectrum of material before and after As (III) adsorption
are represented in Figure 4.84. The figures indicate that the material contains a flat surface with
non-uniform pores of different dimension. The corresponding EDX spectra indicate the presence
of C, O, Ce and N. After arsenic adsorption, it is found that the pores are closed and
agglomerated. The corresponding EDX spectrum provides evidence for the presence of arsenic in
the material. The X-ray diffractogram of the material before and after adsorption are represented
in Fig. 4.85. The X-ray diffractogram is analyzed by using Expert High Score Plus software and
compared with JCPDS-ICDD database. Few sharp and broad peaks are obtained indicating the
crystalline nature of the material. The phases corresponding to each peak are represented in the
Fig. 4.85 (JCPDS#78-0694, JCPDS#19-0284). After adsorption the phase corresponds to As (III)
peaks (JCPDS# 75-2110, JCPDS# 01-0775, JCPDS# 76-1366, JCPDS# 22-1050 and JCPDS#
15-0772).
100 200 300 400 500 600 700
8.50
8.55
8.60
8.65
8.70
8.75
8.80
0 200 400 600 800 1000 1200 1400 1600 1800 2000
-70
-60
-50
-40
-30
-20
-10
0
Weig
ht
loss (
mg
)
Temperature ( C)
TGA
DT
A
Time (seconds)
DTA
Endo
EXO

RESULTS & DISCUSSION 2014
114 | P a g e
Fig. 4.84. SEM-EDX of (a) - (b) without loaded As(III) hybrid material and (c) –(c) loaded As(III)
hybrid material
a
c
b
d

RESULTS & DISCUSSION 2014
115 | P a g e
Fig. 4.85. X-ray diffractogram of the Ce HAHCl hybrid material before and after As (III) adsorption The normal crystallite size of material before and after adsorption were calculated using the
Debye Scherer equation as discussed in Section 4.2.1. The average crystallite size of the material
is found to be 55.32 nm and 123.18 nm before and after adsorption respectively. Similar studies
are also reported by Weckhuysen et al. (1996), Laine et al. (2005), Ingham and Toney, (2014)
and Junaid et al. (2009). These observations conclude that there is adsorption of As (III) in the
material. The FTIR spectrum of the material before and after adsorption is represented in Fig.
4.86.
Fig. 4.86. FTIR spectra of the Ce-HAHCl hybrid material by using KBr pellet before and after As (III) adsorption
20 30 40 50 60 70 80
0
20
40
60
80
100
120
140
11
1,2
1,2
1,3
1,2
6,76,7
1,3,5,6
In
ten
sit
y (
a.u
)
2 (Degree)
As (III) Loaded Material
Fresh Material
1.CeO2
2.Ce(OH)3
3.HONH2CH
3.Cl
4.N H4ClAs
2O
3
5.(NH4)H
2AsO
4
6.CeAsO4
7.As3HO
6
1,2,3,6,7
1,2,4,5,6,7
2,5,61,2,6,7
1,2
4000 3500 3000 2500 2000 1500 1000 500
20
30
40
50
60
70
671
498
837
1379
856
1517
3366
513
1382
1581
%T
Wave number (Cm-1
)
Fresh Material
As (III) Loaded Material
3395
66
5

RESULTS & DISCUSSION 2014
116 | P a g e
The presence of peak at ~3395 cm-1 is due to water of crystallization (O-H). Another important
peak appears at ~1581 cm-1 is due to the N-H bending vibration of NH2 groups and characteristic
peak of C=O. The peak at ~1382 cm-1, ~856 cm-1 and ~671 cm-1 are due to C-N stretching, C-C
stretching and O-H bending respectively. The peak at ~513 cm-1 is due to Ce-O stretching
frequencies. This analysis clearly manifests the presence of hydroxylamine moiety in the material.
In the FTIR spectra of the material after adsorption, few shifts of the above peaks are observed.
The peak at ~3395 cm-1 is shifted to ~3366 cm-1 due to the symmetric stretching vibration of O-H-
O group, overlapping of H-N-H groups and grafting of arsenic to H-N-H group after adsorption.
These peaks can be attributed to weak Vander-Wall interaction between nitrogen and arsenic
(Kumar et al., 2013; Mahmoodi et al., 2011). The bands appears at ~1517 cm-1, ~1379 cm-1 and
~837 cm-1 due to C=O, C-O and O-H stretching. The band at ~665 cm-1 and ~498 cm-1 due to Ce-
O and As-O stretching.
Fig. 4.87. Surface charge density of the Ce-HAHCl hybrid material
A similar trend of observation is reported in literature (Asli et al., 2013; Gandhi et al., 2010). From
the FTIR data it is evident that the participation of both nitrogen and hydroxyl groups are the
possible coordinating sites for bonding with As (III). The surface charge density of the material is
4.9 (pHzpc) (Fig. 4.87). When the solution pH increases, the surface charge density decreases.
The value of pHzpc is positive, as the solution pH is less than 4.9; however, the surface starts
acquiring negative charge as the solution pH goes higher than 5.0 (Islam et al., 2007).
4.4.2. Removal study of arsenic (III) by batch experiments
All the experiments carried out at batch mode by taking initial arsenic concentration of 10
mg/L, 25 mg/L and 50 mg/L according to experimental methods discussed in Chapter-3. The
batch studies were compared with ANN output results and presented separately in the present
study.
4.4.2.1. Influence of adsorbent dose
The results of the influence of adsorbent dose on the removal of As (III) and predicted
results of ANN model is represented in Figure 4.88.
0 2 4 6 8 10
-100
-50
0
50
100
Ze
ta p
ote
ntia
l (m
V)
---- pH----
0.1 M NaCl
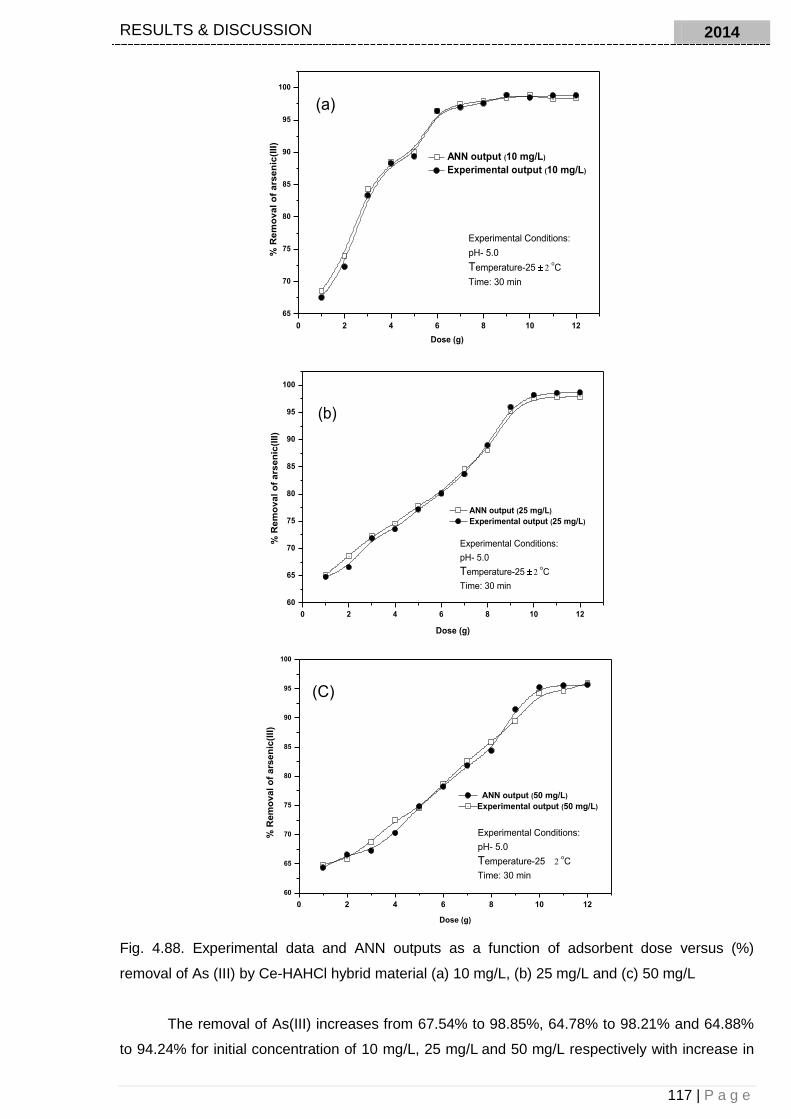
RESULTS & DISCUSSION 2014
117 | P a g e
Fig. 4.88. Experimental data and ANN outputs as a function of adsorbent dose versus (%)
removal of As (III) by Ce-HAHCl hybrid material (a) 10 mg/L, (b) 25 mg/L and (c) 50 mg/L
The removal of As(III) increases from 67.54% to 98.85%, 64.78% to 98.21% and 64.88%
to 94.24% for initial concentration of 10 mg/L, 25 mg/L and 50 mg/L respectively with increase in
0 2 4 6 8 10 12
65
70
75
80
85
90
95
100
% R
em
ov
al
of
ars
en
ic(I
II)
Dose (g)
ANN output (10 mg/L)
Experimental output (10 mg/L)
Experimental Conditions:
pH- 5.0
Temperature-25 oC
Time: 30 min
(a)
0 2 4 6 8 10 12
60
65
70
75
80
85
90
95
100
% R
em
ova
l o
f ars
en
ic(I
II)
Dose (g)
ANN output (25 mg/L)
Experimental output (25 mg/L)
(b)
Experimental Conditions:
pH- 5.0
Temperature-25 oC
Time: 30 min
0 2 4 6 8 10 12
60
65
70
75
80
85
90
95
100
% R
em
oval o
f ars
en
ic(I
II)
Dose (g)
ANN output (50 mg/L)
Experimental output (50 mg/L)
Experimental Conditions:
pH- 5.0
Temperature-25 oC
Time: 30 min
(C)

RESULTS & DISCUSSION 2014
118 | P a g e
the adsorption dose from 1 g/L to 12 g/L. There is no further increase in the adsorption after a
dose of 9 g/L and 10 g/L for initial concentration of 10 mg/L and 25 mg/L (or 50 mg/L) respectively.
The different equilibrium dose is due to fact that increasing in the concentration gradient requires
higher doses for adsorption. After the equilibrium dose, the removal capacity becomes constant
possibly due to collapsing or overlapping of available free sites for adsorption. Hence, 9 g/L (10
mg/L) and 10 g/L (25 mg/L and 50 mg/L) are considered as optimum dose and used for further
studies. The experimental data obtained are trained and predicted by ANN model. It is found that
the ANN model satisfactorily predicts the observation of the experimental data. Similar studies are
also reported by Samal et al. (2013), Shibata et al. (2006), Saha et al. (2010) and Roy et al.
(2014).
4.4.2.2. Influence of pH and mechanism of arsenic (III) removal by Ce HAHCl hybrid
material
The uptake of As (III) ions as a function of solution value is studied over a pH range of 2.0-
12.0 keeping all other parameters constant for initial As (III) concentration of 10 mg/L, 25 mg/L
and 50 mg/L. The results of the influence of pH are represented in Fig. 4.60. The maximum
removal of 98.2%, 94.3% and 92.2% occurs at pH 5.0 with initial concentration of 10 mg/L, 25
mg/L and 50 mg/L respectively. It clearly indicates from Fig.4.60, that maximum removal occurs at
lower pH. The pH-based adsorption could be better explained by an electrostatic attraction
mechanism between positive charged adsorbent and anionic As (III) species (HAsO3-, H2AsO3-,
HAsO42-) in the pH range of 2.0-7.0. At lower pH, the amine group in the adsorbent is highly
protonated, which makes strong electrostatic force of attraction between anion and positively
charged surface of the adsorbent resulting in higher adsorption at lower pH. As the pH of the
solution increases more than > 7.5 (alkaline medium), the primary amine group present in the
adsorbent undergoes deprotonation and the adsorption capacity decreases (Islam et al., 2007).
The adsorption mechanism can be described in three steps: (1) the decrease may be due to the
negatively charged adsorbate by adsorbing hydroxyl ions on the surface, (2) may be due to
ionization of very weak acidic functional groups of the adsorbent. (3) A repulsive force may occur
between the negatively charged surface of the adsorbent and the arsenite anions. Arsenic exists
in various oxidation states and the stability of these ionic species depends upon the pH of the
aqueous system. The adsorption process can be represented by the following equation (Hering et
al., 2000; Jain et al., 2010; Shinde et al., 2013, Isosaari et al., 2012).
H3AsO3 (aq) = H+ + H2AsO3- (pK1 = 9.22)
H2AsO3- = H+ + HAsO32- (pK2 = 12.13)
HAsO32- = H+ + AsO3
3- (pK3 =13.3)
MOH+H3O+ →MOH2
+ + H2O
MNH2+ + HAsO3
3- →MNH2+---HAsO3
3- [Scheme-I]
MOH+H3O+ + HAsO3
3- →MOH2+---HAsO33- + H2O [Scheme-II]
The data obtained from experimental studies are incorporated into the ANN model and predicted
with reasonable accuracy, which supports the trend of experimental observation (Fig.4.89).

RESULTS & DISCUSSION 2014
119 | P a g e
Similar observation were reported by many researchers, such as Muniz et al. (2008), Onnby et al.
(2014), Maji et al. (2008).
Fig. 4.89. Experimental data and ANN outputs as a function of pH versus (%) removal of As (III)
by Ce-HAHCl hybrid material (a) 10 mg/L, (b) 25 mg/L and (c) 50 mg/L.
2 4 6 8 10 12
50
55
60
65
70
75
80
85
90
95
100
% R
em
ova
l o
f a
rse
nic
(III
)
pH
Experimental output (10 mg/L)
ANN output (10 mg/L)(a)
Experimental Conditions:
Dose- 9 g/L
Temperature-25 oC
Time: 30 min
2 4 6 8 10 12
50
60
70
80
90
100
% R
em
ov
al o
f a
rse
nic
(III)
pH
Experimental output (25 mg/L)
ANN output (25 mg/L)(b)
Experimental Conditions:
Dose- 10 g/L
Temperature-25 oC
Time: 30 min
2 4 6 8 10 12
50
60
70
80
90
100
% R
em
ov
al o
f a
rse
nic
(III)
pH
Experimental output (50 mg/L)
ANN output (50 mg/L)
(c)
Experimental Conditions:
Dose- 10 g/L
Temperature-25 oC
Time: 30 min

RESULTS & DISCUSSION 2014
120 | P a g e
4.4.2.3. Influence of agitation speed
The influence of agitation speed was studied for arsenic removal; the agitation speed was varied
from 10 rpm to 330 rpm. The result obtained is represented in Fig. 4.90.
Fig. 4.90. Influence of agitation speed on removal of arsenic (III) from water by Ce-HAHCl hybrid
material for initial concentration of 10, 25 and 50 mg/L of arsenic (III).
0 50 100 150 200 250 300 350
50
60
70
80
90
100
% R
em
ov
al
of
ars
en
ic(I
II)
Agitation speed (rpm)
Experimental output (10mg/L)
ANN output (10 mg/L)
Experimental Conditions:
Dose- 9 g/L
pH- 5.0
Temperature-25 oC
Time: 30 min
(a)
0 50 100 150 200 250 300 350
50
60
70
80
90
100
% R
em
oval
of
ars
en
ic(I
II)
Agitation Speed (rpm)
Experimental output (25 mg/L)
ANN output (25 mg/L)
(b)
Experimental Conditions:
Dose- 10 g/L
pH- 5.0
Temperature-25 oC
Time: 30 min
0 50 100 150 200 250 300 350
40
50
60
70
80
90
% R
em
ov
al o
f a
rse
nic
(III)
Agitation speed (rpm)
Experimental output (50 mg/L)
ANN output (50 mg/L)
Experimental Conditions:
Dose- 10 g/L
pH- 5.0
Temperature-25 oC
Time: 30 min
(C)

RESULTS & DISCUSSION 2014
121 | P a g e
It is found that the removal efficiency increases with increase in agitation speed from
54.9% to 96.8%, 50.7% to 95.3% and 48.2% to 91.4% for 10 mg/L, 25 mg/L and 50 mg/L of As
(III) concentration respectively. As (III) removal gradually increases with increase in agitation
speed from 50 rpm to 180 rpm and then decreases. This trend may be attributed to (a) higher
agitation increases the collision of particles present in the solution which increases contacts with
available active free sites on the surface of adsorbent. (b) Higher speed decreases the boundary
layer thickness nearby the adsorbent particles resulting in increase in the degree of mixing (Gupta
et al., 2011; Khezami et al., 2005). The removal decreases after 180 rpm due to inadequate
interaction between the free active sites available for adsorption at higher velocity, hence 180 rpm
is considered as the optimum agitation speed. It can be observed that the ANN model also
satisfactorily predicts the trend of experimental observations (Fig. 4.90). Similar studies by Saha
et al. (2010), Shanmugaprakash et al. (2013), suggest possibility of above trend observed for
influence of agitation speed.
4.4.2.4. Influence of contact time
The influence of contact time on adsorption of arsenic (III) is studied for initial arsenic (III)
concentration of 10 mg/L, 25 mg/L and 50 mg/L at pH 5.0, keeping all other parameter constant.
The result of influence of contact time on removal efficiency is represented in Fig. 4.91. It is clear
from the figure that 90% removal takes place in first 80 minutes because of the available vacant
sites and high concentration gradient of solute. At a higher concentration gradient, arsenic
species diffuse to the surface by intraparticle diffusion and highly hydrolyzed species diffuses at a
slower rate. The initial concentration gradient of arsenic ions provides a dynamic force to
overwhelm mass transfer resistance of arsenic ions between the aqueous media and solid media
(Gupta et al., 2011). This indicates the possible monolayer of arsenic ions on the surface towards
the end of the experiments. Fig. 4.91 shows the comparison between experimental data as a
function of contact time. The ANN model predicts satisfactorily the trend of experimental data.
Many researchers have reported similar observation Daneshvar et al. (2006), Aber et al. (2009)
and Aleboyeh et al. (2008).
0 20 40 60 80 100 120
30
40
50
60
70
80
90
100
% R
em
ov
al o
f a
rse
nic
(III)
Contact Time (Minutes)
Experimental output (10 mg/L)
ANN output (10 mg/L)
Experimental Conditions:
Dose- 9 g/L
pH- 5.0
Temperature-25 oC
Agitation speed: 180 rpm
(a)

RESULTS & DISCUSSION 2014
122 | P a g e
Fig. 4.91. Influence of contact time on removal of arsenic (III) from water by Ce-HAHCl hybrid material for initial arsenic (III) concentration of 10, 25 and 50 mg/L.
4.4.2.5. Adsorption kinetics
4.4.2.5.1. 1st order kinetic
The rate constant of adsorption was determined from first order rate expression given by
Lagergren rate equation, which is explained in Section 4.1.2.2.1. The plot of log (qe –q) versus
time is represented in Fig. 4.92, and the relevant data from the plot is presented in Table 4.49.
The rate constant data satisfied the first order rate equation.
Table - 4.49. Lagergren rate constants (kad) obtained from the graph for different initial concentration of arsenic (III)
Studies Initial concentration
1st order
kad R2 SD
Experimental
10 mg/L 0.0479 0.921 0.555
25 mg/L 0.0523 0.956 0.637
50 mg/L 0.0607 0.936 0.645
ANN
10 mg/L 0.0263 0.901 0.516
25 mg/L 0.0408 0.918 0.606
50 mg/L 0.0396 0.951 0.676
0 20 40 60 80 100 120
30
40
50
60
70
80
90
100
Experimental Conditions:
Dose- 10 g/L
pH- 5.0
Temperature-25 oC
Agitation speed: 180 rpm
% R
em
ov
al o
f a
rse
nic
(III)
Contact Time (Minutes)
Experimental output (25 mg/L)
ANN output (25 mg/L)
(b)
0 20 40 60 80 100 120
30
40
50
60
70
80
90
100
Experimental Conditions:
Dose- 10 g/L
pH- 5.0
Temperature-25 oC
Agitation speed: 180 rpm
% R
em
ov
al o
f a
rse
nic
(III)
Contact Time (Minutes)
Experimental output (50 mg/L)
ANN output (50 mg/L)
(C)

RESULTS & DISCUSSION 2014
123 | P a g e
Fig. 4.92. Linear plot of Lagergren rate equation using Ce-HAHCl, time versus Log (qe-q) with
initial arsenic (III) concentration of (a) 10 mg/L, (b) 25 mg/L and (c) 50 mg/L (Experimental and
ANN output). The activiation energy of the reaction are found to be 33.3 kJ/mol, 29.4 kJ/mol, 39.4
kJ/mol respectiviely for initial As(III) concentration of 10 mg/L, 50 mg/L and 100 mg/L. The studies
suggest chemisorption nature of the adsorption process. Similar studies were carried out by
Sundaram et al. (2008), and Saha et al. (2010).
0 20 40 60 80 100
0.0
0.2
0.4
0.6
0.8
1.0
1.2
1.4
1.6
1.8
2.0
log
(q
e-q
)
Time (Minutes)
Experimental (arsenic(III) 25 mg/L)
ANN (arsenic(III) 25 mg/L)
0 20 40 60 80 100
-0.2
0.0
0.2
0.4
0.6
0.8
1.0
1.2
1.4
1.6
log
(q
e-q
)
Time (Minutes)
Experimental (Arsenic (III) 10 mg/L)
ANN output (Arsenic (III) 10 mg/L)
a
0 20 40 60 80 100
0.2
0.4
0.6
0.8
1.0
1.2
1.4
1.6
1.8
2.0
2.2
2.4
log
(q
e-q
)
Time (Minutes)
Experimental (50 mg/L arsenic (III))
ANN output (50 mg/L arsenic (III))
c
b

RESULTS & DISCUSSION 2014
124 | P a g e
4.4.2.5.2. Helfferich rate equation
In the present study, the kinetics of arsenic (III) adsorption using Helfferich equation
(explained in Section 4.1.2.2.2) has been carried out to understand the behaviour of Ce-HAHCl.
Fig 4.93. Linear plot of Helfferich equation using Ce-HAHCl, time versus ln [1-U (t)], (a) Experimental output, (b) ANN output
The straight line plots of ln [1-U (t)] versus time ‘t’ is shown in the Fig. 4.93, which indicate
the first order kinetics with respect to adsorbents. The data obtained from the graphs are
presented in Table 4.50.
Table - 4.50. Rate constant (k’) obtained from the graph for different initial concentration of
arsenic (III)
The forward (K1) and backward (K2) rate constants are calculated according to equation
discussed in Section 4.1.2.2.2 and the data are presented in Table 4.51. The data indicate that
Experimental
Initial concentration k’ R2 SD
10 mg/L 0.051 0.840 1.36
25 mg/L 0.048 0.887 1.26
50 mg/L 0.053 0.881 1.39
ANN
10 mg/L 0.043 0.834 1.15
25 mg/L 0.058 0.846 1.55
50 mg/L 0.058 0.922 1.48
0 10 20 30 40 50 60 70 80 90
-5
-4
-3
-2
-1
0
ln[1
-U(t
)]
Time (minutes)
Experimental
10 mg/L
25 mg/L
50 mg/L
a
0 10 20 30 40 50 60 70 80 90
-5.0
-4.5
-4.0
-3.5
-3.0
-2.5
-2.0
-1.5
-1.0
-0.5
0.0
ln[1
-U(t
)]
Time (Minutes)
ANN output
10 mg/L
25 mg/L
50 mg/L
b

RESULTS & DISCUSSION 2014
125 | P a g e
the rate of adsorption is higher than desorption till equilibrium and the equilibrium is towards
product side. Similar results have been reported by Vatutsina et al. (2007) and Maji et al. (2008).
Table - 4.51. Rate constant (k1 and k2) obtained from the graph for different initial concentration of arsenic (III)
Experimental
Initial concentration
Overall rate constant
Forward rate constant (k1)
Backward rate constant (k2)
10 mg/L 0.051 0.0116 0.0391
25 mg/L 0.048 0.0212 0.0271
50 mg/L 0.053 0.0439 0.0095
ANN
10 mg/L 0.0430 0.0118 0.0312
25 mg/L 0.0583 0.0310 0.0273
50 mg/L 0.0580 0.0488 0.0092
4.4.2.5.3. Second order rate equation
Second order rate equation is studied according to equation discussed in Section
4.1.2.2.3. The plot of t/qt versus time is represented in Fig. 4.94 and the data obtained from the
plot is presented in Table 4.52.
On the basis of lowest value of standard deviation and high correlation value it is
concluded that the second order rate equation fit better to the experimental data and significant in
describing the arsenic (III) adsorption process. ANN model also suggest the accuracy of the
above studies. Similar results are reported by Muniz et al. (2008) and Zeng et al. (2008).
Table - 4.52. Second order rate constant for arsenic (III) removal by Ce-HAHCl hybrid material
Experimental
Initial Concentration k2 qc R2 SD
10 mg/L 0.440 7.07 0.999 0.083
25mg/L 0.209 7.43 0.999 0.043
50 mg/L 0.106 6.87 0.999 0.023
ANN
10 mg/L 0.558 7.58 0.966 0.108
25 mg/L 0.227 7.65 0.945 0.052
50 mg/L 0.109 6.88 0.956 0.024
0 20 40 60 80 100
0.0
0.2
0.4
0.6
0.8
1.0
1.2
1.4
1.6
1.8
t/q
t
Time (Minutes)
Experimental
10 mg/L
25 mg/L
50 mg/L
a

RESULTS & DISCUSSION 2014
126 | P a g e
Fig. 4.94. Linear plot of second order rate equation using Ce-HAHCl, time versus t/qt with initial
arsenic(III) concentration of 10 mg/L, 25 mg/L and 50 mg/L. (a) experimental output (b) ANN
output
4.4.2.5.4. Intraparticle diffusion rate constant (Weber-Morris equation)
In order to understand the diffusion process, batch adsorption experiments are carried out
with Ce-HAHCl at room temperature keeping all other parameters same as in the previous studies
(Discussed in Section 4.1.2.2.4). Due to excessive stirring in batch adsorption process, there is a
possibility of transport of arsenic (III) ions from the bulk into pores of the adsorbent as well as
adsorption at outer surface of the adsorbent. To understand the diffusion of arsenic (III) ions to the
adsorbents, the experimental data are tested with Weber-Morris equation (Weber, 1963) as
discussed in Section 4.1.2.2.4. The data obtained from the plot (Fig. 4.95) is presented in Table
4.5.
Table - 4.53. Intraparticle diffusion rate constant (Weber-Morris equation) data for arsenic (III)
removal by Ce-HAHCl hybrid material.
Initial concentration kP C R2 SD
Experimental 10 mg/L 4.73 7.46 0.956 1.59
25 mg/L 12.86 7.67 0.930 6.41
50 mg/L 23.71 20.16 0.910 14.50
ANN output 10 mg/L 5.18 2.18 0.982 1.90
25 mg/L 13.14 4.29 0.962 7.96
50 mg/L 23.86 16.96 0.951 15.36
It is understood from Fig. 4.95, that there is a deviation of line from the origin which shows that the
intraparticle transport is not sole rate limiting step but, the transport of adsorbate through the
pores of the adsorbent is also responsible. Consequently, adsorption process is accelerated,
which shows that the diffusion is not consecutive due to pore size (Erhan et al. 2004;
Badruzzaman et al. 2004). At the final phase of adsorption process, the rate of diffusion remains
constant due to exhaustion of pores in the material. When kp value is larger, the rate of adsorption
0 20 40 60 80 100
0.0
0.2
0.4
0.6
0.8
1.0
1.2
1.4
1.6
1.8
t/q
t
Time (Minutes)
ANN output
10 mg/L
25 mg/L
50 mg/L
b

RESULTS & DISCUSSION 2014
127 | P a g e
is more but, when C value is larger, the adsorption is better due to better bonding between
adsorbet and adsorbent. The concentration gradient decides the movement of particles into the
pores of material, with the increase in the concentration of arsenic (III) the kp value increases
suggesting the intraparticle diffusion is considered as the concentration diffusion (Erhan et al.
2004). In the present study the high value of C suggest effective removal of arsenic (III) from
water. The ANN output also presents similar observation suggesting the accuracy of the
experimental studies.
Fig. 4.95. Intraparticle diffusion rate constant (Weber-Morris equation) plot of qe versus square
root t for arsenic (III) removal by Ce-HAHCl hybrid material. (Initial concentration- 10, 25, and 50
mg/L), (a) ANN output (b) experimental output
4.4.2.6. Influence of Temperature
The results of the effect of temperature on the adsorption of arsenic (III) are represented in
Fig. 4.96. The percentage removal of As(III) increases from 65.41% to 96.32%, 62.37% to
92.37% and 53.27% to 91.28% for initial concentration of 10 mg/L, 25 mg/L and 50 mg/L
respectively when the temperature increases from 20 ºC to 80 ºC. Hence the adsorption process
is endothermic in nature. The experimental data are incorporated into the ANN model and a
comparison between predicted values and experimental values carried out. From the plot (Fig.
4.96), it is observed that predicted data sets good agreement with experimental values.
3 4 5 6 7 8 9 10
20
40
60
80
100
120
140
160
180
200
220
240
260
qe
t
ANN output
10 mg/L
25 mg/L
50 mg/L
a
3 4 5 6 7 8 9 10
20
40
60
80
100
120
140
160
180
200
220
240
260
qe
t
Experimental
10 mg/L
25 mg/L
50 mg/L
b

RESULTS & DISCUSSION 2014
128 | P a g e
Fig. 4.96. Influence of temperature on removal of arsenic (III) by Ce-HAHCl hybrid material for initial concentration of (a) 10, (b) 25 and (c) 50 mg/L.
20 40 60 80
60
70
80
90
100
% R
em
oval o
f ars
en
ic (
III)
Temperature (0C)
Experimental output (10 mg/L)
ANN output (10 mg/L)
a
20 40 60 80
60
70
80
90
100
% R
em
ova
l o
f a
rse
nic
(III
)
Temperature (0C)
Experimental output (25 mg/L)
ANN output (25 mg/L)
b
20 40 60 80
30
40
50
60
70
80
90
100
% R
em
oval o
f ars
en
ic(I
II)
Temperature (0C)
Experimental output (50 mg/L)
ANN output (50 mg/L)
c

RESULTS & DISCUSSION 2014
129 | P a g e
4.4.2.7. Thermodynamic parameters
The thermodynamic parameters (change in free energy (G), enthalpy (H) and entropy
(S)) of adsorption process are evaluated according to discussion in 4.3.2.6. (Manju et al., 1998;
Argun et al., 2007), A plot of logs Kc versus 1/T are represented in (Fig. 4.97).
Fig. 4.97. Van’t Hoff plot, log Kc versus 1/T for Ce-HAHCl hybrid material for initial arsenic (III) concentration; (a) 10, (b) 25 and (c) 50 mg/L.
0.00 0.02 0.04 0.06 0.08 0.10
0.40
0.45
0.50
0.55
0.60
0.65
0.70
0.75
log
Kc
1/T
Experimental (arsenic (III) 10 mg/L)
ANN output (arsenic (III) 10 mg/L)
a
0.00 0.02 0.04 0.06 0.08 0.10
0.30
0.35
0.40
0.45
0.50
0.55
0.60
0.65
0.70
0.75
log
Kc
1/T
Experimental (arsenic 25 mg/L)
ANN output (arsenic 25mg/L)
b
0.00 0.02 0.04 0.06 0.08 0.10
0.30
0.35
0.40
0.45
0.50
0.55
0.60
0.65
0.70
0.75
log
Kc
1/T
Experimental (arsenic (III) 50 mg/L)
ANN output (arsenic (III) 50 mg/L)
c

RESULTS & DISCUSSION 2014
130 | P a g e
The data obtained from the plot is presented in Table 4.54. The positive value of entropy (S)
shows randomness of the ongoing adsorption process and hence good affinity of arsenic (III) with
the hybrid material. Negative value of G at each temperature indicates the feasibility and
spontaneity of ongoing adsorption process. A decrease in values of G with increase in
temperature suggests endothermic nature of the adsorption process which is confirmed by the
positive value of enthalpy (H). The value of G also suggest the chemisorption nature of the
adsorption process. The same observation was reported by Neupane et al. (2013), Muniz et al.
(2008), and Tao et al. (2014). Observation received from ANN modeiling presents similar
behaviour (Table 4.54).
Table - 4.54. Thermodynamic parameters using arsenic (III) solution of 10 mg/L, 25 mg/L and 50 mg/L
4.4.2.8. Effect of initial arsenic (III) concentration
The results of the effect of initial concentration on adsorption are represented in graphical form in
(Fig. 4.98). It is evident from the graph that the removal percentage decreases from 97.23% to
33.85% for initial arsenic (III) concentration of 1 mg/L to 200 mg/L. The reduction in arsenic (III)
adsorption is due to the lack of available active sites required for the high initial concentration of
arsenic (III).
0 50 100 150 200
30
40
50
60
70
80
90
100
% R
em
oval o
f ars
en
ic(I
II)
Initial Concentration ( mg/L)
Experimental output
ANN output
Studies
Initia
l
Co
nc
ΔH
(kJ/m
ol)
ΔS
(kJ/ K
mo
l)
ΔG (kJ/mol)
R2
Experimental 2
83
K
293
K
303
K
313
K
323
K
10 -3.834 0.777 -11.6 -19.4 -27.1 -34.9 -42.7 0.989
25 -4.362 0.747 -11.8 -19.3 -26.8 -34.3 -41.7 0.914
50 -4.273 0.685 -11.8 -19.3 -26.8 -34.3 -41.7 0.766
ANNN
10 -3.533 0.775 -11.3 -19.0 -26.8 -34.5 -42.3 0.991
25 -4.324 0.748 -11.8 -19.3 -26.8 -34.3 -41.7 0.902
50 -4.202 0.683 -11.0 -17.9 -24.7 -31.5 -38.4 0.754

RESULTS & DISCUSSION 2014
131 | P a g e
Fig. 4.98. Influence of initial concentration of arsenic (III) on arsenic (III) removal by Ce-HAHCl
hybrid material.
4.4.2.9. Adsorption isotherm
4.4.2.9.1. Langmuir isotherm
The adsorption data are fitted to linearly transformed Langmuir isotherm (Discussed in
Section 4.12.6). The linear plot of 1/ Ce versus 1/ qe is represented in Fig. 4.99. The data obtained
from the plot is presented in Table 4.55.
Table - 4.55. Langmuir isotherm parameters for arsenic (III) removal by Ce-HAHCl hybrid material
Ce-HAHCl
Langmuir Isotherm
qo (mg/g) B (L/mg) R2 SD
Experimental 183 0.003 0.9996 0.00018
ANN 169 0.003 0.9994 0.00025
(r) dimensionless equilibrium parameter
10 mg/L 25 mg/L 50 mg/L
Experimental 0.970 0.928 0.866
ANN 0.967 0.921 0.854
The value of ‘r’ indicates a favorable adsorption system. The correlation coefficient value (R2) for
experimental data suggests the feasibility and adequacy of the adsorption process. The maximum
adsorption capacity of 183 mg/g suggests the effective removal and can be utilized for removal of
arsenic (III) from water at higher scale. The ANN studies also supports the above observations,
however the ANN study suggest a maximum of 169 mg/g of adsorption capacity of the adsorbent.
Fig. 4.99. Langmuir adsorption isotherm, 1/Ce versus 1/qe for Ce-HAHCl hybrid material
Mondal et al. (2006), Awual et al. (2011), Polizzotto et al, (2013) and Zhang et al, (2014) have
reported similar observations.
4.4.2.9.2. Freundlich isotherm
The Freundlich equation is used for determining the applicability of heterogeneous surface
energy in the adsorption process. (Freundlich, 1906). The equation is directly used as discussed
0 5 10 15 20 25 30 35
0.00
0.05
0.10
0.15
0.20
1/q
e
1/Ce
Experimental Data
ANN Data
Equation
Adj. R-Square
ANN
ANN
Equation
Adj. R-Square
Experimental
Experimental
ANN
ANN

RESULTS & DISCUSSION 2014
132 | P a g e
in Section 4.1.2.6.2. The Freundlich isotherm plot for adsorption of arsenic (III) is represented in
Fig. 4.100, and respective data obtained from plots are presented in Table 4.56.
Table - 4.56. Freundlich isotherm parameters for arsenic (III) removal by Ce-HAHCl hybrid material
Freundlich isotherm
Ce-HAHCl
Studies Kf 1/n n R2 SD
Experimental 1.85 0.406 2.4 0.824 0.427
ANN 1.82 0.418 2.3 0.820 0.427
Fig. 4.100. Freundlich adsorption isotherm, log Ce versus log qe for Ce-HAHCl hybrid material
From the correlation coefficient values it is clear that Langmuir isotherm fits better than Freundlich
isotherm. The values of 1/n – 0.406 indicates favorable nature of the isotherm for arsenic (III) onto
Ce-HAHCl hybrid material. The value of Kf (Freundlich constant=1.85) indicates affinity of arsenic
(III) species (Meena et al., 2008; Duranoğlu et al., 2012; Linsha et al., 2013). The value of
Freundlich parameters also reflects the numbers of sorptive sites (Manju et al., 2007). The values
of ‘n’ (intensity of adsorption) between 1 and 10 (i.e., 1/n less than 1) represents a favorable
adsorption process. The obtained ANN data validates the experimental results and accuracy of
the experimental studies. For the present study the value of ‘n’ represents favorable adsorption
system (Raji et al., 1998).
4.4.2.9.3. Dubinin-Radushkevich (D-R) isotherm
In order to understand the adsorption type, equilibrium data were tested with Dubinin-
Radushkevich isotherm, (Dubinin, 1966; Dubinin, 1975; Dubinin and Stoeckli, 1980; Argun et al.,
2007; Lazaridis et al., 2004). The data obtained from D-R isotherm is represented in Table 4.54.
-2.0 -1.5 -1.0 -0.5 0.0 0.5 1.0 1.5 2.0 2.5
0.5
1.0
1.5
2.0
2.5
log
qe
log Ce
Experimental
ANN output

RESULTS & DISCUSSION 2014
133 | P a g e
The mean free energy of adsorption (E) was calculated from the constant K (Lazaridis et al.,
2004; Islam et al., 2007)
Fig. 4.101. D-R adsorption isotherm, ln qe versus ε2 for arsenic (III) removal by Ce-HAHCl hybrid
material
The value of E is found to be 10.68 kJ/mol and the adsorption is due to chemisorption’s or
exchange of ions. Similar reports by other researchers (Mondal et al., 2006; Argun et al., 2007;
Zeng et al., 2007; Meena et al., 2008; Awual et al., 2011; Neupane et al., 2013) support the above
observations.
Table - 4.57. D-R adsorption isotherm parameters for arsenic (III) removal by Ce-HAHCl hybrid
material
D-R isotherm
Ce-HAHCl
Studies K (mol2kJ-2) qm (g/g) E (kJ mol-1) R2 SD
Experimental 4.38 x 10⁻⁶ 5.70 10.68 0.416 0.985
ANN 4.34 x 10⁻⁶ 5.68 10.73 0.375 0.985
4.4.2.10. Effect of competitive anions on arsenic (III) removal
The results of the effect of various concentrations of anions, including sulphate (SO42-), nitrate
(NO3-), chloride (Cl-), carbonate (CO3
2-) and bicarbonate (HCO3-) on As (III) adsorption is
represented in Fig. 4.102. From the Fig. 4.102, it is observed that there is no significant influence
of chloride on the As (III) adsorption. However, the uptake of As (III) is considerably reduced in
presence of sulphate and other anions due to formation of inner surface complex. It is concluded
that the adsorption rate influence in the following order: sulphate > bicarbonate > carbonate >
nitrate > chloride. The highest removal in the presence of chlorine is 86.2%, 79.9% and 79.8%
0 20,000,000 40,000,000 60,000,000 80,000,000
1
2
3
4
5
6
ln q
e
Experimental
ANN output

RESULTS & DISCUSSION 2014
134 | P a g e
respectively for arsenic (III) concentration of 10 mg/L, 25 mg/L and 50 mg/L. Many researchers
have reported similar results (Islam et al., 2007; Jain et al., 2009).
Fig. 4.102. Percentage removal of arsenic (III) Ce-HAHCl hybrid material versus initial anion
concentration of solution. (Initial arsenic (III) concentration – (a) 10 mg/L, (b) 25 mg/L and (c) 50
mg/L).
4.4.2.11. Regernation and reusability studies of Ce-HAHCl hybrid material
The results of regeneration and reusability of the material is represented in Fig. 4.103 (a) and Fig.
4.103 (b). It is observed that the material can be regenerated (>90) at alkaline pH. The
percentages desorption and regeneration data obtained are presented in Table 4.58.
The reusability studies shows that the adsorption and desorption efficiency decreases with
number of cycles. The material could be used upto 5 cycles (>60%) after that the material is
required to be regenerated.
Table – 4.58. Percentage desorption and regeneration of arsenic (III) by Ce-HAHCl hybrid
material
Initial arsenic (III) concentration (mg/L)
Amount desorbed (mg/L) Percentage desorption or regeneration
pH3
pH5 pH8 pH11 Distilled water
pH3 pH5 pH8 pH11 Distilled water
10 3.0 5.2 7.8 9.8 0.3 30.2 52.5 78.9 98.1 3.1
25 10 12.3 15.8 23.5 0.6 40.5 49.3 63.5 94.3 2.6
Bicarbonate
55.7
Carbonate
59.35
Nitrate
69.92Chloride
86.22
Sulphate
59.68
absence of anions
88.68
% Removal of arsenic (III)
a
Bicarbonate
57.53
Carbonate
58.4
Nitrate
78.89Chloride
79.94
Sulphate
56.86
absence of anions
81.11
% Removal of arsenic (III)
b
Bicarbonate
52.06
Carbonate
60.7
Nitrate
68.44Chloride
79.86
Sulphate
58.45
absence of anions
79.65
Removal % of arsenic (III)
c

RESULTS & DISCUSSION 2014
135 | P a g e
50 7.8 23.5 35.8 40.26 1.35 15.7 47.0 94.3 80.5 2.7
Fig. 4.103. (a) Regeneration and (b) reusability of Ce-HAHCl hybrid material (initial concentration-
10 mg/L)
4.4.3. Removal study of arsenic (III) by column experiments
The efficiency of removal technique depends on the concentration of arsenic (III) in a
source of water. Fixed bed column study is carried out with a column as discussed in Chapter-3
Section 3.16 at different flow rate (Korte and Fernado, 1991; Park et al., 2006). The breakthrough
curve for synthetic sample at different bed depth and flow rate is presented in Fig. 4.104 and Fig.
4.105. The data obtained from the plot by carrying out mathematical analysis as discussed in
Section 3.1.6.3 is presented in Table 4.59. Plot of ln [Ceff/C0-Ceff] versus time ‘t’ gives a straight
line with slope KC0 and intercept –XKN0/V from which K and N0 was calculated (Fig. 4.106 and
Fig. 4.107). The fixed bed column adsorption capacity (Q) is calculated by equation (Malkoc et al.,
2006; Mahadevaiah et al., 2008) as discussed in Section 4.1.3. The highest adsorption capacity of
157 mg/g and 288 mg/g is obtained for bed depth of 10 cm and flow rate of 5 mL/min respectively
for column study. Prediction study by using ANN, suggest the maximum adsorption capacity of
153 mg/g and 305 mg/g for bed depth of 10 cm and 5 mL/min flow rate respectively. Similar
1 2 3 4 5 6 7 8 9 10 11
0
10
20
30
40
50
60
70
80
90
100
% R
eg
en
era
tio
n
pH
10 mg/L
(a)

RESULTS & DISCUSSION 2014
136 | P a g e
observation are also reported by (Vinodhini et al., 2010; Maji et al., 2012; Bhaumik et al., 2013;
Sepehr et al., 2014)
Fig. 4.104. Breakthrough curve at different bed depth for Ce-HAHCl, C/C0 versus time (t) in hours,
initial arsenic (III) concentration- 10mg/L, (a) 5 cm, (b) 10 cm and (c) 15 cm
Table - 4.59. Column adsorption parameters for arsenic (III) removal by Ce-HAHCl hybrid material
Approach velocity (cm/hr)
Bt
(h) Et
(h) Q
(mg/g) Removal
% Logit Method
N0
(mg/l) Adsorption
rate constant k (Lmg/h)
R2
Experimental studies
Bed depth (cm)
5 210 26 84 57.7 69.3 5.00 0.0281 0.943
10 210 71 110 157.7 79.0 2.57 0.0185 0.934
15 210 19 90 42.2 88.7 3.55 0.0212 0.886
Flow rate (mL/min)
2 210 50 109 111.1 85.1 4.41 0.0354 0.940
5 210 52 103 288.8 81.2 2.51 0.0158 0.959
7 210 18 95 140 85.6 2.34 0.0087 0.973
ANN studies
Bed depth (cm)
5 210 25 81 55.5 66.2 3.14 0.0367 0.959
10 210 69 110 153.3 85.6 2.64 0.0129 0.948
15 210 24 105 53.3 89.8 4.02 0.0257 0.973
0 20 40 60 80 100 120
0.00
0.02
0.04
0.06
0.08
0.10
0.12
0.14
0.16
0.18
0.20
Ce
ff/C
o
Time in hours (h)
Experiemental output
ANN output
Bed depth - 15 cm, Initial concentration- 10 mg/L (arsenic (III))
0 20 40 60 80 100 120
0.0
0.1
0.2
0.3
0.4
0.5
0.6
0.7
0.8C
eff/C
o
Time in hours (h)
Experimental Output
ANN Output
Bed Depth - 5 cm, Initial conc- 10 mg/L (arsenic (III))
0 20 40 60 80 100 120
0.05
0.10
0.15
0.20
0.25
0.30
0.35
0.40
0.45
Ce
ff/C
o
Time in hours (h)
Experimental output
ANN output
Bed depth - 10 cm, Initial conc- 10mg/L (arsenic (III))
(a) (b)
(c)

RESULTS & DISCUSSION 2014
137 | P a g e
Flow rate (mL/min)
2 210 53 111 117.7 90.6 4.25 0.0266 0.887
5 210 55 100 305.5 82.1 3.16 0.0235 0.940
7 210 17 96 132.2 82.9 2.32 0.0115 0.924
0 20 40 60 80 100 120
0.0
0.1
0.2
0.3
0.4
0.5
Ce
ff/C
o
Time in hours (h)
Experimental output
ANN output
Flow rate - 2 mL/min, arsenic (III) - 10 mg/L
0 20 40 60 80 100 120
0.05
0.10
0.15
0.20
0.25
0.30
0.35
0.40
Ce
ff/C
o
Time in hours (h)
Experimental output
ANN output
Flow rate- 5 mL/min, Initial concentration- 10 mg/L (arsenic (III))
0 20 40 60 80 100 120
0.08
0.10
0.12
0.14
0.16
0.18
0.20
0.22
0.24
0.26
Ce
ff/C
o
Time in hours (h)
Experimental output
ANN output
Flow rate - 7 mL/min, arsenic (III) concentration- 10 mg/L
(a)
(b)
(c)

RESULTS & DISCUSSION 2014
138 | P a g e
Fig. 4.105. Breakthrough curve at different flow rate for Ce-HAHCl, C/C0 versus time (t) in hours,
initial arsenic (III) concentration- 10mg/L, (a) 2 mL/min, (b) 5 mL/min and (c) 7 ml/min
0 20 40 60 80 100 120
-4.5
-4.0
-3.5
-3.0
-2.5
-2.0
-1.5
-1.0
-0.5
0.0
0.5
1.0
1.5
Ln
[Ce
ff/(C
o-C
eff)]
Time in hours (h)
Experimental output
ANN output
Bed depth- 5 cm, Initial concentration - 10 mg/L (arsenic (III))
0 20 40 60 80 100 120
-3.0
-2.5
-2.0
-1.5
-1.0
-0.5
0.0
Ln
[Ce
ff/(
Co-C
eff)]
Time in hours (h)
Experimental output
ANN output
Bed depth -10 cm, Initial concentration -10 mg/L (arsenic (III))
0 20 40 60 80 100 120
-4.5
-4.0
-3.5
-3.0
-2.5
-2.0
-1.5
Ln
[Ce
ff/(
Co-C
eff)]
Time in hours (h)
Experimental output
ANN output
Bed depth- 15 cm, Initial concentration- 10 mg/L (arsenic (III))
(c)
(b)
(a)
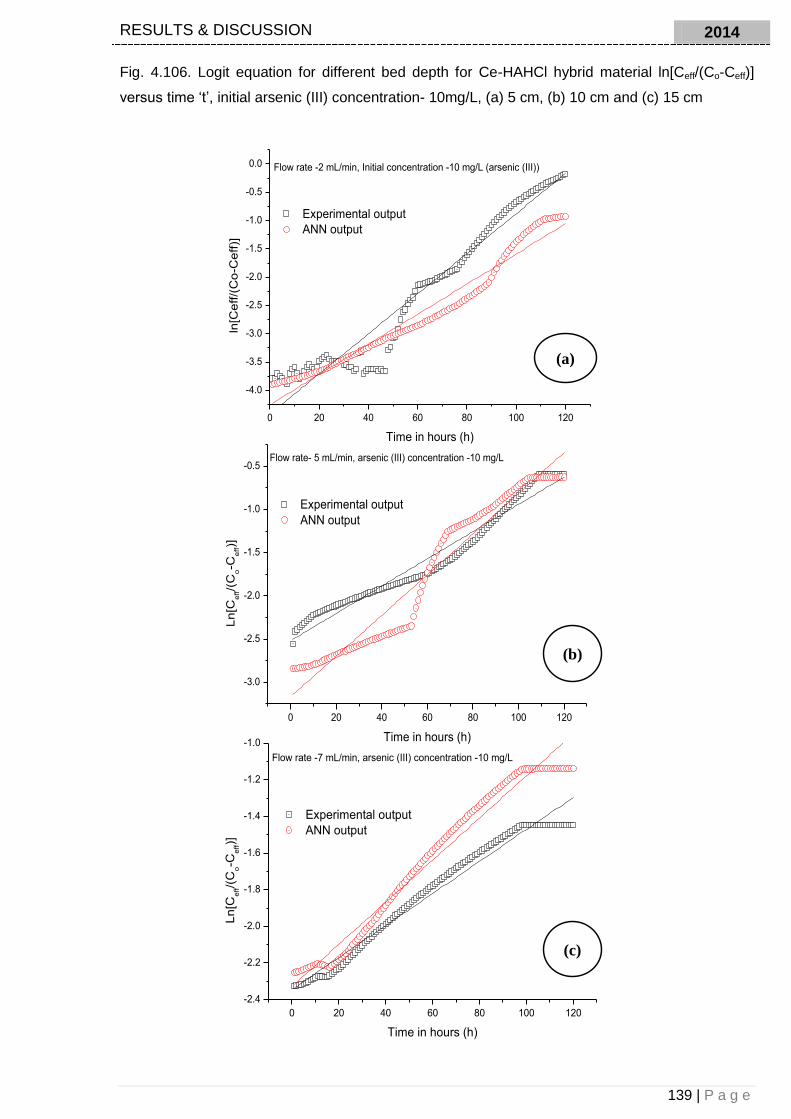
RESULTS & DISCUSSION 2014
139 | P a g e
Fig. 4.106. Logit equation for different bed depth for Ce-HAHCl hybrid material ln[Ceff/(Co-Ceff)]
versus time ‘t’, initial arsenic (III) concentration- 10mg/L, (a) 5 cm, (b) 10 cm and (c) 15 cm
0 20 40 60 80 100 120
-4.0
-3.5
-3.0
-2.5
-2.0
-1.5
-1.0
-0.5
0.0
ln[C
eff/(
Co
-Ce
ff)]
Time in hours (h)
Experimental output
ANN output
Flow rate -2 mL/min, Initial concentration -10 mg/L (arsenic (III))
0 20 40 60 80 100 120
-3.0
-2.5
-2.0
-1.5
-1.0
-0.5
Ln
[Ce
ff/(
Co-C
eff)]
Time in hours (h)
Experimental output
ANN output
Flow rate- 5 mL/min, arsenic (III) concentration -10 mg/L
0 20 40 60 80 100 120
-2.4
-2.2
-2.0
-1.8
-1.6
-1.4
-1.2
-1.0
Ln
[Ce
ff/(
Co-C
eff)]
Time in hours (h)
Experimental output
ANN output
Flow rate -7 mL/min, arsenic (III) concentration -10 mg/L
(c)
(b)
(a)

RESULTS & DISCUSSION 2014
140 | P a g e
Fig. 4.107. Logit equation for different flow rate for Ce-HAHCl hybrid material ln [Ceff/(Co-Ceff)]
versus time ‘t’, initial arsenic (III) concentration- 10mg/L, (a) 2mL/min, (b) 5 mL/min and (c) 7
mL/min
4.4.4. Back propagation artificial neural network (BP-ANN) studies
4.4.4.1 BP-ANN studies for the prediction of arsenic (III) removal at batch mode
Back propagation artificial neural network (BP-ANN) tool is used to predict the removal
percentage efficiency of arsenic (III) by the hybrid material. The studies were carried out for the
factor of concentration (10 mg/L, 25 mg/L, 50 mg/L), dose ( 6 g/L, 9 g/L, 10 g/L), time (30 minutes,
60 minutes, 90 minutes), pH (4, 6, 8,10), temperature (20 ºC, 40 ºC, 60 ºC) and agitation speeds
(120 rpm, 160 rpm, 180 rpm). One hundred and five combinations are divided into training and
testing groups: 60% of data are taken for training of the neural network and 40% of data for
testing. The program was executed by using software MATLAB 7.6 (Version-R2008a). A three-
layer network design was used (Fig. 4.108).
Fig. 4.108. A three layer ANN back propagation model in batch studies
The tangent sigmoid transfer function (tansig) was used at input layer and hidden layer and a
linear transfer function (purelin) was used in the output layer. Gradient descent with momentum
back propagation (traingdm) function was used to updates weight and bias values according to
momentum (Roy et al., 2014). The number of nodes in the hidden layer is defined by the relation
presented below
Where I is the number of nodes in the input layer, the back propagation algorithm model is
represented in Fig 4.109, which represents a neural network training tool (nntraintool) used for
training of the network.

RESULTS & DISCUSSION 2014
141 | P a g e
Fig. 4.109.Tool box for ANN modeling in MATLAB in batch studies
The neural network is trained and tested with different numbers of neurons at the hidden layer by
observing the mean squared error (MSE) (Fig. 4.110).
Fig. 4.110. Selection of number of neurons in hidden layer according to mean squared error
(MSE)
0 2 4 6 8 10 12 14 16 18
6.0x10⁻⁵
8.0x10⁻⁵
1.0x10⁻⁴
1.2x10⁻⁴
1.4x10⁻⁴
1.6x10⁻⁴
1.8x10⁻⁴
2.0x10⁻⁴
2.2x10⁻⁴
2.4x10⁻⁴
MS
E
Number of neurons in hidden layer
Neurons

RESULTS & DISCUSSION 2014
142 | P a g e
Fig. 4.111. Distribution of experimental runs at training and testing for arsenic (III) removal
prediction by using ANN back propagation model for batch studies.
Fig.4.112. Correlation of predicted and actual As (III) removal (training and testing data) at batch studies The performance of the network depends on weight (traingdm), net input and transfer (tansig)
functions. Training stops when any of these following conditions are occurring,
(i) The maximum number of epochs is reached
(ii) The maximum amount of training time is exceeded
(iii) Performance is minimized to the target
(iv) Validation time exceeds more than maximum fails
Learning and momentum parameters are varied time to time in the experiment to achieve the best
mean squared error. In the present study learning parameter and the momentum parameter were
set to 0.35 and 0.30 respectively, during the training phase. Several iterations (400000 epochs)
were done to achieve the minimum root mean square error; a root mean square error of 0.96 was
observed at epoch 19709 epochs. The distribution of the experimental runs at input and prediction
for training and testing is represented in Fig 4.111. A correlation coefficient (R2) of 0.980 (Fig.
0 10 20 30 40 50 60 70 80 90 100 110
50
60
70
80
90
100
% R
emo
val
Experimental Runs
Training Input
Training Predicted
Testing Input
Testing Predicted
45 50 55 60 65 70 75 80 85 90 95 100
50
60
70
80
90
100 Testing Data (R2= 0.975)
Traning Data (R2= 0.980)
Y=X
Pre
dic
ted
Actual

RESULTS & DISCUSSION 2014
143 | P a g e
4.112) obtained at training, and training at this point is stopped and the network is used for the
testing phase. The best fit is achieved with the high correlation coefficient (R2) of 0.975 in the
testing phase. It presents a good agreement of actual experimental data with predicted values.
Fig. 4.113. (a) Experimental runs versus residuals (b) experimental runs versus absolute error %
at batch studies
The best performance of prediction depends on the training of the neural network. The correlation
plot obtained for training and testing data are represented in Fig. 4.112. Where Y=X indicating the
best-fit data. The residuals and mean absolute relative percentage errors distribution of training
and testing data is represented in Fig. 4.113 (a) and (b). The absolute relative percentage errors
were found to be 0.129 and 0.292 at training and testing respectively signifies the adequacy of the
model. The values of actual experimental data and predicted data for training and testing are
presented in Table 4.60. It is observed that the ANN prediction having architecture of 6-7-1 is in
good agreement with the predicted values. The current study is an effort to get the benefit of
mathematical approach in real time experiments. The development of ANN techniques has
overcome the challenges and issues in real time experiments. Similar studies are also reported by
0 10 20 30 40 50 60
-6
-4
-2
0
2
4
6
8
Res
idua
ls
Experimental runs
Training residuals
Testing residuals
50 60 70 80 90 100
-8
-6
-4
-2
0
2
4
6
8
10
12
Training error distribution
Testing error distribution
% e
rror
Predicted data
(a)
(b)

RESULTS & DISCUSSION 2014
144 | P a g e
many researchers (Yetilmezsoy et al., 2009; Bhatti et al., 2009; Natale et al., 2007; Mitra et al.,
2014; Chakraborty et al., 2015; Maghsoudi et al., 2015)
Table - 4.60. Comparison of experimental removal percentage and predicted removal percentage at training and testing (Batch studies)
Training data
Exp
No.
Co
nc.
(mg/L
)
Do
se
(g)
Tem
p.
(oC
)
Tim
e
(min
ute
s)
pH
Agitation speed (RPM)
Exp. Removal Testing data (%)
Predicted Removal testing
data (%) Diffe
ren
ce
Err
or%
1 10 6 20 60 10.0 180 60.3 58.3 -2.0 -3.4 2 25 6 80 30 10.0 180 64.2 63.8 -0.5 -0.7 3 10 9 20 30 10.0 180 54.4 54.1 -0.2 -0.4 4 10 9 80 60 8.0 180 76.8 75.5 -1.3 -1.6 5 10 6 40 90 10.0 120 57.0 58.8 1.8 3.2 6 50 6 40 90 8.0 180 84.0 84.7 0.7 0.9 7 25 6 20 90 10.0 160 55.0 55.4 0.4 0.8 8 10 10 40 30 10.0 160 56.0 53.4 -2.6 -4.6 9 50 9 20 60 4.0 180 96.9 97.4 0.5 0.5 10 25 6 20 90 10.0 120 50.0 51.1 1.1 2.3 11 10 6 20 90 10.0 120 57.0 57.5 0.5 0.9 12 50 10 20 60 6.0 180 89.6 92.5 3.0 3.3 13 25 10 20 90 4.0 180 87.6 88.9 1.2 1.4 14 10 9 80 90 8.0 180 86.7 85.0 -1.7 -1.9 15 25 6 60 60 8.0 180 64.2 65.9 1.7 2.6 16 10 6 40 90 10.0 160 59.6 60.4 0.8 1.3 17 10 6 60 90 8.0 180 70.6 70.7 0.1 0.1 18 10 9 60 30 8.0 180 71.0 73.0 2.0 2.8 19 25 9 20 30 8.0 180 73.0 70.0 -3.0 -4.1 20 50 9 20 60 6.0 180 83.1 82.0 -1.1 -1.3 21 25 6 40 60 10.0 120 53.1 51.6 -1.5 -2.8 22 10 9 20 60 10.0 180 53.1 50.5 -2.6 -4.9 23 10 6 40 60 10.0 160 64.8 62.3 -2.5 -3.8 24 10 10 40 60 10.0 120 54.6 57.1 2.5 4.5 25 10 6 60 60 10.0 160 58.5 58.8 0.3 0.5 26 10 10 60 30 10.0 120 51.6 52.9 1.3 2.5 27 50 6 60 60 8.0 180 62.5 63.1 0.6 1.0 28 50 9 20 90 4.0 180 93.7 94.0 0.3 0.3 29 25 9 20 90 8.0 180 77.6 75.9 -1.8 -2.3 30 10 6 20 60 10.0 160 63.6 64.8 1.2 1.9 31 10 6 20 90 10.0 160 73.6 73.5 0.0 0.0 32 10 10 60 60 10.0 180 77.6 72.8 -4.8 -6.2 33 10 9 20 90 4.0 180 86.7 87.3 0.6 0.7 34 25 6 60 30 8.0 180 76.9 78.2 1.4 1.8 35 25 6 20 30 10.0 180 53.0 51.4 -1.5 -2.9 36 10 10 60 90 6.0 180 86.3 87.4 1.1 1.3 37 50 9 80 60 4.0 180 91.3 87.8 -3.6 -3.9 38 25 10 20 30 4.0 180 83.8 88.2 4.4 5.3 39 10 10 40 60 10.0 160 65.4 66.1 0.8 1.2 40 10 6 40 30 8.0 180 63.1 61.5 -1.7 -2.6 41 50 9 20 90 6.0 180 88.1 89.1 1.0 1.1 42 10 10 40 90 10.0 160 63.6 65.7 2.1 3.4 43 50 10 20 90 6.0 180 93.6 96.4 2.9 3.1 44 25 9 20 60 6.0 180 53.0 53.6 0.7 1.2 45 25 6 40 60 8.0 120 61.3 62.9 1.6 2.7 46 25 6 60 60 4.0 180 68.5 69.4 0.8 1.2 47 50 6 40 60 6.0 180 76.9 78.3 1.4 1.9

RESULTS & DISCUSSION 2014
145 | P a g e
1 10 10 60 90 4.0 180 96.0 96.2 0.20 0.21 2 10 6 40 60 4.0 180 80.3 82.3 2.00 2.48 3 10 9 60 30 4.0 180 98.9 98.4 -0.49 -0.49 4 10 6 20 30 8.0 180 78.9 82.0 3.13 3.97 5 10 6 40 60 8.0 180 74.4 72.1 -2.22 -2.99 6 10 10 60 90 8.0 180 65.7 64.9 -0.87 -1.32 7 25 6 20 30 8.0 180 76.3 74.1 -2.23 -2.92
8 25 9 40 60 8.0 180 70.3 70.3 0.05 0.07 9 25 10 60 90 4.0 180 96.4 96.8 0.40 0.41
10 50 6 20 30 4.0 180 97.6 96.8 -0.81 -0.83 11 50 6 40 60 10.0 180 66.7 66.3 -0.37 -0.55 12 50 6 60 90 6.0 180 64.2 64.2 -0.05 -0.08 13 50 6 20 30 6.0 180 79.6 80.2 0.56 0.70
14 25 9 40 30 8.0 120 70.7 70.2 -0.51 -0.72 15 25 6 60 60 10.0 120 71.2 79.0 7.76 10.90 16 10 9 20 90 8.0 120 81.9 81.9 -0.03 -0.04 17 10 6 40 60 4.0 120 93.1 92.2 -0.90 -0.97 18 10 6 60 30 4.0 120 93.1 93.1 0.01 0.01 19 10 6 20 60 8.0 120 65.8 66.2 0.41 0.63 20 25 6 40 30 8.0 160 84.6 84.1 -0.57 -0.68
21 25 6 60 60 6.0 160 88.5 88.9 0.38 0.42
22 25 9 20 90 10.0 160 61.6 65.3 3.74 6.07 23 50 9 40 60 6.0 160 92.5 92.9 0.32 0.35 24 50 9 60 30 8.0 160 93.7 93.9 0.23 0.24 25 50 9 20 60 4.0 160 93.6 94.2 0.52 0.55 26 50 10 20 90 10.0 160 63.6 59.2 -4.41 -6.94 27 50 6 20 60 10.0 160 73.6 74.3 0.73 0.99
28 25 6 40 30 10.0 160 77.6 77.1 -0.53 -0.68 29 25 6 40 90 10.0 160 78.7 78.8 0.11 0.14 30 25 6 40 60 10.0 160 76.9 76.8 -0.10 -0.12 31 10 6 20 90 8.0 180 79.0 79.5 0.52 0.65 32 10 9 20 60 8.0 180 82.3 83.0 0.68 0.83
33 10 6 60 30 10.0 180 73.8 73.9 0.16 0.22 34 10 9 60 30 4.0 120 93.7 93.0 -0.70 -0.75 35 10 9 60 60 4.0 120 93.6 94.2 0.59 0.63 36 1 6 60 90 4.0 120 93.6 94.5 0.92 0.99 37 1 10 60 90 4.0 120 93.6 93.3 -0.30 -0.32 38 10 6 40 30 6.0 120 89.0 89.2 0.24 0.27 39 10 6 40 60 6.0 160 86.3 87.1 0.83 0.96 40 10 6 40 90 6.0 160 86.9 86.3 -0.55 -0.63 41 25 6 40 90 4.0 160 95.9 95.8 -0.08 -0.09 42 10 6 40 30 10.0 160 77.6 78.2 0.57 0.73
48 10 10 80 60 10.0 120 65.9 66.8 0.9 1.4 49 25 9 40 30 8.0 180 68.2 69.7 1.5 2.2 50 10 10 60 60 10.0 120 97.6 93.9 -3.7 -3.8 51 25 10 20 60 4.0 180 97.8 95.1 -2.7 -2.7 52 50 9 40 60 6.0 180 97.9 95.9 -2.0 -2.1 53 50 6 40 90 6.0 180 84.2 82.9 -1.3 -1.6 54 25 9 60 90 4.0 180 92.9 90.8 -2.1 -2.3 55 50 10 40 30 6.0 180 84.6 82.3 -2.3 -2.7 56 10 10 20 90 10.0 160 88.5 87.2 -1.3 -1.5 57 50 9 40 90 4.0 180 87.6 86.5 -1.1 -1.3 58 25 6 20 60 10.0 120 86.5 85.5 -1.0 -1.2 59 10 10 20 60 4.0 180 86.7 88.1 1.4 1.6 60 25 6 40 90 10.0 120 68.5 69.0 0.5 0.7 61 10 10 40 30 6.0 180 62.9 61.5 -1.4 -2.2 62 10 6 20 30 10.0 120 62.3 66.3 4.0 6.4 63 10 9 20 90 10.0 180 62.4 68.1 5.7 9.2
Testing Data

RESULTS & DISCUSSION 2014
146 | P a g e
4.4.4.2. BP-ANN studies for the prediction of arsenic (III) removal at column mode
Back propagation artificial neural network (BP-ANN) tool is used to predict the removal
percentage efficiency of arsenic (III) by the hybrid material in column mode. The studies were
carried out for the factor of bed depth (5 cm, 10 cm and 15 cm), flow rate (2 mL/min, 5mL/min and
7 mL/min) and time (1 h to 120 h) keeping temperature at 25 oC and pH-7. Seven hundred and
twenty one combinations are divided into training and testing phase: 60% of data are taken for
training of the neural network and 40 % data were taken for testing phase. The program was
executed by using MATLAB 7.6 (Version R2008a). A three layer network design was used and
represented in Fig. 4.114. The program was trained as discussed in section 4.4.4.1 of chapter 4.
The backpropagation algortnim user interface tool used for column studies is represented in Fig.
4.115.
Fig. 4.114. A three layer ANN back propagation model in column studies
Fig. 4.115. Tool box for ANN modeling in MATLAB for column studies

RESULTS & DISCUSSION 2014
147 | P a g e
Fig. 4.116. Distribution of experimental runs at training and testing for arsenic (III) removal prediction by using ANN back propagation model for column studies.
Fig. 4.117. Correlation of predicted and actual arsenic (III) removal (training and testing data) at column studies
0 100 200 300 400
40
50
60
70
80
90
100
% R
em
ova
l
Experimental runs
Training Input
Training output
40 50 60 70 80 90 100
40
50
60
70
80
90
100
Training data
Testing data
Pre
dic
ted
Actual
---- Y=X Best Fit

RESULTS & DISCUSSION 2014
148 | P a g e
Fig. 4.118. Distribution of experimental runs versus residuals at training and testing for column studies.
Fig. 4.119. Experimental runs versus absolute error % at training and testing for column studies. In the present column study, learning and the momentum parameter were set to 0.45 and 0.35
respectively, during the training phase. A number of iterations were carried out to achieve best fit
and minimum root mean square error. The distribution of the experimental runs at input and
prediction for training and testing is represented in Fig. 4.116. The correlation plot of training and
testing is also represented in Fig. 4.117. The best fit is achieved with the high correlation
coefficient (R2) of 0.976 and 0.973 at training and testing phase respectively. The correlation
obtained presents a good agreement of actual experimental data with predicted values. The best
performance of prediction depends on the training of the neural network. The residuals and mean
absolute relative percentage errors distribution of training and testing data is represented in Fig.
4.119. The absolute relative percentage errors were found to be 0.00087 and 0.0263 at training
and testing respectively, signifies the accuracy of the predictive model having ANN architecture 4-
7-1. The values of actual experimental data and obtained prediction data from ANN model for
0 100 200 300 400
-6
-4
-2
0
2
4
6
8
Res
idua
ls
Experimental runs
Training data
Testing data
0 100 200 300 400
-6
-4
-2
0
2
4
6
8
Training error %
Testing error %
Err
or
%
Experimental runs

RESULTS & DISCUSSION 2014
149 | P a g e
column studies are presented in Table 4.61. Similar studies are also reported by Malkoc et al.
(2006), Saha et al. (2010), Mitra et al. (2014), and Zhang et al. (2014).
Table – 4.61. Comparison of experimental removal percentage and predicted removal at training (Column studies)
Training Data
Exp. Runs
Time (h)
Bed depth (Cm)
Flow rate (mL/min)
Initial Conc. (mg/L)
Exp. Removal (Training data) %
Predicted Removal training data (%)
Difference Error%
1 50 10 5 50 86.2 86.5 -0.3 -0.39
2 96 10 2 10 69.4 67.4 2.0 3.04
3 15 15 2 25 97.2 96.9 0.3 0.31
4 2 10 2 10 92.1 95.5 -3.4 -3.57
5 108 10 5 50 65.1 67.0 -1.9 -2.87
6 41 5 2 25 86.6 87.0 -0.4 -0.51
7 58 10 5 25 85.4 85.5 -0.1 -0.16
8 4 10 2 10 97.7 95.4 2.3 2.42
9 67 10 2 10 88.5 86.4 2.1 2.43
10 23 10 5 50 88.9 89.2 -0.3 -0.39
11 112 10 7 25 81.0 80.8 0.2 0.26
12 81 15 2 10 84.0 83.2 0.9 1.05
13 23 10 7 25 90.0 89.9 0.1 0.12
14 66 10 5 10 83.9 84.0 -0.2 -0.20
15 15 10 2 25 97.3 94.5 2.8 2.93
16 109 5 2 50 42.9 42.4 0.6 1.37
17 11 10 2 10 90.2 94.9 -4.7 -4.93
18 29 10 7 50 89.3 89.2 0.1 0.06
19 35 10 2 10 97.4 92.0 5.4 5.82
20 96 10 7 25 81.2 81.6 -0.4 -0.50
21 65 10 2 10 84.4 87.0 -2.6 -2.99
22 58 10 2 50 84.9 88.6 -3.7 -4.21
23 95 10 2 10 70.2 68.2 2.1 3.04
24 66 5 2 10 70.3 70.2 0.2 0.25
25 35 10 7 50 88.5 88.4 0.1 0.11
26 14 10 5 10 89.8 89.8 0.0 -0.05
27 26 5 2 10 89.4 89.0 0.4 0.43
28 78 10 7 50 83.4 83.4 -0.1 -0.06
29 53 10 7 10 86.4 86.3 0.1 0.12
30 48 5 2 25 84.5 84.6 -0.1 -0.11
31 73 5 2 10 63.3 62.6 0.7 1.17
32 74 10 2 50 86.9 83.6 3.4 4.02
33 71 5 2 10 65.4 64.8 0.6 0.99
34 55 10 2 10 85.1 89.1 -4.0 -4.53
35 20 5 2 50 89.5 89.4 0.1 0.08
36 95 15 2 10 82.7 83.1 -0.4 -0.47
37 83 10 2 10 81.0 77.9 3.2 4.06
38 13 15 2 25 97.4 97.3 0.1 0.14
39 62 10 5 50 84.8 84.9 -0.1 -0.14
40 89 15 2 50 83.2 82.8 0.4 0.47
41 52 10 2 50 85.3 89.6 -4.3 -4.78
42 4 10 7 10 91.0 91.3 -0.2 -0.27
43 50 10 7 25 86.7 86.6 0.2 0.18
44 67 10 7 10 84.7 84.9 -0.2 -0.22
45 33 15 2 50 94.3 93.8 0.5 0.52

RESULTS & DISCUSSION 2014
150 | P a g e
Testing Data
1 45 10 5 10 86.7 87.2 -0.5 -0.55 2 117 10 2 50 56.0 57.0 -1.0 -1.72 3 62 15 2 10 86.9 87.6 -0.8 -0.86 4 56 10 5 25 85.6 85.9 -0.3 -0.35 5 114 10 2 10 58.2 57.6 0.6 1.03 6 87 10 5 50 76.6 76.0 0.6 0.75 7 72 10 2 10 82.5 84.6 -2.1 -2.51 8 10 10 5 10 90.2 90.2 0.0 0.06 9 55 10 2 50 92.9 89.2 3.7 4.10 10 115 15 2 50 82.1 81.9 0.2 0.22 11 81 10 2 10 77.0 79.4 -2.4 -2.97 12 51 10 5 50 86.1 86.5 -0.4 -0.47 13 3 15 2 25 97.8 98.8 -1.0 -1.05 14 86 15 2 50 83.4 82.9 0.5 0.64 15 90 10 5 10 75.2 74.6 0.5 0.69 16 33 10 7 50 88.8 88.8 0.0 -0.01 17 76 5 2 25 60.0 59.4 0.6 1.00 18 29 5 2 25 89.2 88.8 0.4 0.46 19 50 10 2 50 85.5 90.0 -4.5 -5.01 20 3 10 5 10 91.6 90.5 1.1 1.25 21 8 10 7 10 90.8 91.2 -0.3 -0.35 22 105 15 2 25 82.3 83.4 -1.2 -1.39 23 57 10 2 50 91.7 88.9 2.8 3.15 24 31 15 2 50 94.7 94.3 0.5 0.48 25 16 10 7 50 90.6 90.6 0.0 0.01 26 95 5 2 25 43.4 44.5 -1.2 -2.65 27 63 10 7 25 85.2 85.4 -0.2 -0.28 28 101 15 2 50 82.4 83.5 -1.0 -1.25 29 64 10 2 25 84.5 87.4 -2.9 -3.32 30 56 5 2 50 79.3 79.7 -0.4 -0.47 31 110 10 7 10 81.0 81.0 0.0 -0.01 32 120 5 2 10 42.6 44.8 -2.2 -4.92 33 47 5 2 10 84.8 85.1 -0.3 -0.34 34 21 15 2 10 96.5 96.0 0.5 0.51 35 22 10 5 10 89.0 89.4 -0.4 -0.46 36 17 15 2 25 97.0 96.7 0.3 0.30 37 107 10 2 25 59.6 60.2 -0.6 -1.00 38 2 5 2 25 90.2 90.0 0.1 0.14 39 111 15 2 25 82.1 82.8 -0.7 -0.79 40 75 10 2 25 86.7 83.1 3.6 4.30 41 104 10 5 50 67.5 68.6 -1.1 -1.66 42 27 5 2 50 89.3 89.0 0.3 0.37 43 37 10 5 50 87.5 88.1 -0.6 -0.63 44 61 5 2 50 75.1 75.3 -0.2 -0.28 45 38 10 7 25 88.2 88.1 0.0 0.06

RESULTS & DISCUSSION 2014
151 | P a g e
4.5. Removal of chromium (VI) by cerium oxide polyaniline (CeO2/PANI) composite Cerium oxide polyaniline (CeO2/PANI) composite has been prepared to investigate the removal
efficiency of chromium (VI) from water. The experimental design, parametric appraisal and
prediction of the adsorption process are performed using response surface methodology (RSM-
CCD) and artificial neural network (ANN) method, respectively. Adsorption studies with respect to
various process variables such as dose, time, pH, temperature and initial concentration is carried.
The characterization of CeO2/PANI composite has been done by various physicochemical
techniques followed by mechanistic explanation of Chromium (VI) adsorption. A second order
predictive quadratic equation relating to removal percentage and important process variables was
developed and adequacy (ANOVA) of the model was checked. Nelder-Mead simplex algorithm
was used for numerical optimization.
4.5.1. Characterization of cerium oxide polyaniline composite (CeO2/PANI) hybrid material
A number of samples of cerium oxide polyaniline composite are prepared by adding different
molar solution of polyaniline (1.0-3.0 M) and their chromium (VI) removal capacity is studied by
batch experiments (See Table 4.62).
Table - 4.62. Listed number of samples of cerium oxide polyaniline composite are prepared and
various other property
Material Composition
Molar ratio (Cerium oxide: aniline)
Particle size (nm)
Surface area m2/g
Ion exchange capacity (IEC) in meq/g W=1g
Cr(VI) removal capacity(%)
Size KCl Ca(NO3)2 NaNO3 NaCl
Sample-1 1:1 250 55 1.41 1.28 0.98 1.33 85.1
Sample-2 1:3 258 64 1.03 1.11 0.64 1.00 89.6
Sample-3 2:3 183 110 1.94 1.76 1.52 1.83 90.32
Sample-4 2:1 220 62 1.22 1.15 1.04 1.11 88.1
Sample-5 3:1 273 71 0.83 0.97 1.06 1.12 87.1
Table- 4.63. Chemical stability of the material
Solvent (10 mL) Amount Dissolved (mg)
Solvent (10 mL) Amount Dissolved (mg)
1M HCl Not dissolved 1M H2SO4 Partly Dissolved 2M HCl Not dissolved 2M H2SO4 Dissolved
3M HCl Partly dissolved 1M NH4OH Not dissolved 1M HNO3 Undissolved 2M NH4OH Not dissolved
2M HNO3 Dissolved 3M NH4OH Not dissolved 3M HNO3 Dissolved 4M NH4OH Not dissolved
The chemical stability of the material is presented in Table 4.63. The electrophoretic studies are
important in view to understand the behaviour of adsorbent material in electrolytic medium. The
point zero charge (Fig-4.120) is found to be ~5.2 (pHzpc). At this value of pH the surface holds
positive charge, however the surface starts acquiring negative charges, when solution pH is
higher than 6. The material prepared with molar ratio of 2:3 (cerium oxide: polyaniline) is found to
have the highest ion exchange capacity, surface area and lower particle size as represented in
Table - 4.62. Thus, the (CeO2/PANI-3) is selected for all the batch adsorption studies.

RESULTS & DISCUSSION 2014
152 | P a g e
Fig. 4.120. Zero point surface charge density of CeO2/PANI at 0.1 M NaCl
Fig. 4.121. TGA-DTA studies of CeO2/PANI composite before adsorption and CeO2/PANI
composite after adsorption of Cr (VI)
The TGA-DTA of the composite material is investigated before and after adsorption and the
results are represented in Fig. 4.121. There is a 33.3% weight loss upto 350 °C, which is due to
the elimination of adsorbed water, surface-attached H2O and organic components. The second
weight loss of 34.0% is observed, may be due to dehydration of secondary water molecules
present in the material. This weight loss is correlated with one strong exothermic peak in the DTA
at 400 °C, as can be seen in the inset of Fig. 4.121. The red colored line indicates the TGA for
chromium adsorbed material. This TGA curve shows weight loss of 24.2% upto 350 ºC attributing
to the loss of water from both the oxide and polymer surface. Besides a well-differentiated
behavior marked by a strong weight loss of 67.2% up to 500 ºC, may be due to the degradation of
0 2 4 6 8 10
-100
-80
-60
-40
-20
0
20
40
60
80
100
Ze
ta p
ote
ntia
l (m
V)
-------pH-------
0.1M NaCl
pHzpc
=5.6
0 200 400 600 800 1000 1200 1400 1600 1800 2000
-100
-50
0
50
100
150
200
250
300
50 100 150 200 250 300 350 400 450 500 550 600 650 700
1.0
1.5
2.0
2.5
3.0
3.5
4.0
4.5
5.0
5.5
6.0
6.5
ENDO
CeO2/PANI (DTA)
Cr/PANI/CeO2(DTA)
EXO
Time (Seconds)
Temperature (OC)
We
igh
t lo
ss
(m
g)
CeO2/PANI (TGA)
Cr/PANI/CeO2(TGA)

RESULTS & DISCUSSION 2014
153 | P a g e
the skeletal polyaniline chain structure. This weight loss is correlated with two strong exothermic
peaks in the DTA of the composite samples, at 280 and 380 °C. This observation concludes
adsorption of chromium. Similar studies are reported by Kumar et al. (2012) and Islam et al.
(2007).
Fig. 4.122. X-Ray diffraction studies: (a) CeO2/PANI composite and (b) CeO2/PANI composite
after adsorption of Cr (VI)
The XRD of CeO2/PANI composite is represented in Fig. 4.122(a), which indicates the partial
crystalline nature of the material. The crystallinity decreases with higher 2-theta values, which
indicate that CeO2 particles are successfully embedded in polyaniline matrix. The prominent
peaks of material are at 28.54º, 33.02º, 47.42º, 56.33º and 69.29º, which correspond to standard
files of JCPDS database, (JCPDS# 75-0567, 78-0694, 64-057). The XRD of chromium-adsorbed
material is presented in Fig. 4.122(b). Similar observation of partial crystallinity is seen with
prominent peaks at 22.85º, 28.47º, 36.98º and 46.69º, that suggest possible adsorption of
chromium ions. The average crystallite size of the material is found to be 97.2 nm and 187.2 nm
before and after adsorption, respectively. The increase in the average crystallite size after
adsorption is possibly due to increase in space charge polarization and crystal defects. The SEM
of CeO2/PANI before and after adsorption is presented in Fig. 4.123(a) and Fig.4.123 (b). It is
observed from the figure that before adsorption, the composite material has a spherical and
granular structure with average particle size in the range of <100 nm, that is approximately similar
to values reported by Kumar et al. (2012).

RESULTS & DISCUSSION 2014
154 | P a g e
Fig. 4.123. Scanning electron micrographs (SEM) (a) Fresh CeO2/PANI composite (b) chromium
(VI) adsorbed CeO2/PANI composite (c) EDX CeO2/PANI composite, (d) EDX of chromium (VI)
adsorbed CeO2/PANI composite (Data obtained from EDX before and after adsorption: CeO2
(37.88%), C (54.73%), N (7.10%), Cl (0.29%) and CeO2 (34.21), C (53.47), Cr (11.22%), N
(0.98%), Cl (0.12%))
It is also observed that CeO2 particles are well distributed on the surface and to the interior zone.
It can also be observed that PANI has average particle size < 1µm and typically seems to be
(a) (b)

RESULTS & DISCUSSION 2014
155 | P a g e
structure of agglomerated mesh. This may be due to rapid polymerization and transformation of
composite. After adsorption, the low modification occurred in the structures, with formation of
aggregates suggesting interaction of chromium species through possible adsorption. The
corresponding EDX data is presented in Fig. 4.123(c) and Fig. 4.123(d) for before and after
adsorption, respectively. It supports the adsorption of chromium ions onto the surface of
CeO2/PANI composite, but the actual concentration was determined by using AAS studies.
Similar results are reported by Kumar et al. (2013).
By the analysis of FTIR spectra before and after adsorption (Fig. 4.124 (a) and 4.124 (b));
the adsorption mechanism of chromium (VI) onto CeO2/PANI composite could be explained. The
broad band at ~3356.10 cm-1 indicates the presence of overlapped O-H group of CeO2 with N-H
stretching group of PANI. The presence of band at ~2934 and 1562 cm-1 is due to sp2 C-H and
C=N functional groups respectively. Probably the bands at ~1383 and 1302 cm-1 is due to
carbonate anion which may be due to absorption of atmospheric CO2 gas. The band at ~1126 cm-
1 is due to C-N functional group.
Fig. 4.124. FTIR spectra using KBr pellet: (a) Fresh CeO2/PANI composite and (b) Chromium (VI)
adsorbed CeO2/PANI composite
The presence of band at finger print region (818 and 510 cm-1) is due to metal oxygen
bonds. After adsorption the shifts of bands are observed suggesting interaction of chromium
species with the material. In specific, the presence of band at ~3250 cm-1 and ~1298 cm-1 could
be linked to the interaction of chromium (VI) species with the N-H group after adsorption (Kumar
et al., 2013; Weckhuysen et al., 1996; Laine et al., 2005) and the presence of band with formation

RESULTS & DISCUSSION 2014
156 | P a g e
of new peak at ~1578 and ~1493.99 cm-1 after adsorption is due to quarterisation (Kumar et al.,
2013). The studies suggest that possibly M-NH+ groups play an important role in adsorption
process.
According to FTIR studies, there is opportunity of electrostatic attraction and complexation
between negatively charged chromium (VI) species and positive surface of the adsorbent (NH+),
which enhanced the adsorption of Cr (VI). A similar study by Yang et al. (2005), suggests the
possibility of the above mechanism.
4.5.2. Removal study of chromium (VI) by batch experiments
In this study, the face centered central composite design (FCCD).is used to develop a correlation
between five independent variables and one output. Accordingly eighty-six runs are determined.
4.5.2.1. Influence of adsorbent dose
The influence of variation of adsorbent dose on percentage removal of chromium (VI) from
aqueous solution with CeO2/PANI is graphically shown in Fig.4.125. It is evident from the figure
that the removal of chromium increased from 58 % to 97.1%, 45.7% to 95.92% and 43.7% to
93.1% for 0.1 to 1.0g of CeO2/PANI composite in 100 mL of synthetic chromium solution of 10
mg/L, 50 mg/L and 100 mg/L respectively. The ANN and RSM prediction studies also represents
similar trend, suggesting the accuracy of the experimental studies. The increase in percentage
removal with increase in adsorbent dose because same reason as in the previous studies.
Several researchers have reported similar results (Lazaridis et al., 2005; Yang et al., 2005;
Shanmugaprakash et al., 2013; Islam et al., 2007). However it is observed that after 0.8g of
CeO2/PANI composite, there was no change in percentage removal of chromium (VI). This may
be due to the overlapping of active sites at higher dosage. So, there wasn’t any appreciable
increase in the effective surface area resulting due to accumulation of exchanger or adsorbate
particles. So, 0.8g of CeO2/PANI composite in 100 mL of chromium solution was considered as
optimum dose and were used for further study.
Table - 4.64. Change in pH during adsorption of chromium (VI) by CeO2/PANI composite at dose
studies
Adsorbent Initial pH Final pH
10 mg/L 7.0 6.8
50 mg/L 7.1 6.8
100 mg/L 6.9 6.7
There is a difference in the initial and final pH of the solution after adsorption (Table 4.64)
because the adsorption of chromium occurs by the NH groups present in the composite.

RESULTS & DISCUSSION 2014
157 | P a g e
Fig. 4.125. Adsorbent dose versus percentage removal of chromium by CeO2/PANI composite (a)
10 mg/L, (b) 50 mg/L and (c) 100 mg/L
4.5.2.2. Influence of pH
The results of the effect of pH on adsorption are presented in Fig. 4.126. The pH study
was carried out at lower pH considering the stability of material at acidic pH. The percentage
removal of chromium by CeO2/PANI composite increases from 2 to 6 and then decrease. The
highest percentage removal of 97.1%, 96.0% and 91.2% for 10 mg/L, 50 mg/L and 100 mg/L
obtained at pH 6 respectively. The reason of this trend may be ascertained to the fact that at
(a)
(b)
(c)

RESULTS & DISCUSSION 2014
158 | P a g e
lower pH the amine group’s presents in the adsorbent are highly protonated, which makes strong
electrostatic force of attraction between chromate anion and positively charged CeO2/PANI
composite surface resulting in higher adsorption. At higher pH the removal percentage decreases
(10% to 30%), because OH- concentration in the solution increases which competes with
chromate ion. A detailed mechanism is drawn based on the above observations and presented in
Fig. 4.127.
Fig. 4.126. Percentage removal of chromium by CeO2/PANI composite. (a) 10 mg/L, (b) 50 mg/L and (c) 100 mg/L
2 4 6 8 10 12
55
60
65
70
75
80
85
90
95
100
% R
em
ova
l o
f ch
rom
ium
(V
I)
----pH----
50 mg/L
ANN predicted (50 mg/L)
RSM predicted (50 mg/L)
2 4 6 8 10 12
55
60
65
70
75
80
85
90
95
100
% R
em
ova
l o
f ch
rom
ium
(V
I)
----pH----
10 mg/L
ANN predicted (10 mg/L)
RSM predicted (10 mg/L)
2 4 6 8 10 12
55
60
65
70
75
80
85
90
95
% R
em
ova
l o
f ch
rom
ium
(V
I)
----pH----
100 mg/L
ANN predicted (100 mg/L)
RSM predicted (100 mg/L)
(a)
(b)
(c)

RESULTS & DISCUSSION 2014
159 | P a g e
Fig. 4.127. Mechanism of chromium (VI) removal by CeO2/PANI composite material
The ANN and RSM studies also reported similar trend of behaviour indicating the
adequacy of prediction model and experimental studies. The above data suggest that the
optimum pH for removal of chromium as 6. Similar studies by Qin et al. (2003), Preetha et al.
(2007), Linsha et al. (2013), supports the above observation.
4.5.2.3. Influence of contact time
The influence of contact time on adsorption is represented in Fig. 4.128. It is evident from the
figure that almost 45% removal took place with first 20 minutes and equilibrium was established
after 70 minutes. The percentage removal of adsorbent CeO2/PANI composite was found to
increase from 61.8% to 98.2%, 52.98% to 92.76% and 48.32% to 91.65 % for initial chromium
concentration of 10 mg/L, 50 mg/L and 100 mg/L respectively for a contact time from 10 to 70
minute. This trend is because of same reason as discussed in previous chapter. The prediction of
experimental data by ANN and RSM studies shows similar trend suggesting adequacy of
experimental studies and model. Roy et al. (2014), reported similar observation.

RESULTS & DISCUSSION 2014
160 | P a g e
Fig. 4.128. Time versus percentage removal of chromium, CeO2/PANI composite with initial
concentration of (a) 10 mg/L, (b) 50 mg/L and (c) 100 mg/L
4.5.2.4. Adsorption kinetics
Adsorption characteristics determined from the above study suggest the diverse nature of the
sites with respect to the energy of adsorption. Moreover, to understand the mechanism and
determination of rate controlling step of adsorption processes such as mass transfer and chemical
interference, the three kinetic models are used to test the experimental data.
4.5.2.4.1. Lagergren rate equation
0 20 40 60 80 100
55
60
65
70
75
80
85
90
95
100
% R
em
ova
l o
f ch
rom
ium
(VI)
Time (Minutes)
10 mg/L
ANN predicted (10 mg/L)
RSM predicted (10 mg/L)
0 20 40 60 80 100
40
50
60
70
80
90
100
% R
em
ova
l o
f ch
rom
ium
(V
I)
Time (Minutes)
100 mg/L
ANN predicted (100 mg/L)
RSM predicted (100 mg/L)
0 20 40 60 80 100
50
60
70
80
90
100
% R
em
ova
l o
f ch
rom
ium
(VI)
Time (Minutes)
50 mg/L
ANN predicted (50 mg/L)
RSM predicted (50 mg/L)
(a)
(b)
(c)

RESULTS & DISCUSSION 2014
161 | P a g e
The rate constant of adsorption was determined from the Following first order rate expression
given by Lagergren (Lagergren, 1898), rate equation, which was explained in section 4.1.2.2.1
The Lagergren plots of log (qe-q) versus time ‘t’ (Fig. 4.129) are linear showing the validity of the
equation and consequently the first order nature of the adsorption of chromium from aqueous
solution onto CeO2/PANI composite.
Fig. 4.129. Linear plot of Lagergren rate equation using CeO2/PANI composite, time versus log
(qe-q) with initial chromium concentration (a) 10 mg/L (b) 50 mg/L and (c) 100 mg/L
10 20 30 40 50
-0.6
-0.4
-0.2
0.0
0.2
0.4
0.6
0.8
log
(q
e-q
)
Time(Minutes)
10 mg/L
ANN predicted (10 mg/L)
RSM predicted (10 mg/L)
10 15 20 25 30 35 40
0.7
0.8
0.9
1.0
1.1
1.2
1.3
1.4
1.5
log
(q
e-q
)
Time (Minutes)
Experimental (50 mg/L)
ANN output (50 mg/L)
RSM output (50 mg/L)
5 10 15 20 25 30 35 40 45 50 55
0.8
0.9
1.0
1.1
1.2
1.3
1.4
1.5
1.6
1.7
1.8
log
(q
e-q
)
Time (Minutes)
Experimental output (100 mg/L)
ANN output (100 mg/L)
RSM output (100 mg/L)
(c)
(b)
(a)

RESULTS & DISCUSSION 2014
162 | P a g e
The values of correlation coefficient of determination (R2) show good correlation. The adsorption
rate constant in min -1 (kad), calculated from the slope of the plot and presented in Table 4.65.
The nature of adsorption was studied by calculating the activation energy and it was found to be
33.1 kJ/mol, 33.0 kJ/mol, 43.8 kJ/mol respectively for initial chromium concentration of 10 mg/L,
50 mg/L and 100 mg/L. The value suggest the chemisorption nature of adsorption.
Table - 4.65. Rate constants (kad) obtained from the graph for CeO2/PANI composite.
CeO2/PANI composite
Concentration (mg/L)
kad R2 Standard Deviation (SD)
Experimental
10 0.064 0.899 0.16916
50 0.043 0.958 0.06211
100 0.044 0.988 0.03266
ANN predicted
10 0.059 0.900 0.15657
50 0.046 0.953 0.06957
100 0.044 0.943 0.07495
RSM predicted
10 0.052 0.917 0.12303
50 0.047 0.952 0.07297
100 0.049 0.955 0.0855
The results observed in this study are also similar to the results reported by (Kumar et al., 2013;
Yang et al., 2013).
4.5.2.4.2. Helfferich equation
Adsorption of ions or molecules in aqueous solution follows reversible first order kinetics. Hence
in the present study, the kinetics of chromium (VI) adsorption using Helfferich equation (explained
in Section 4.1.2.2.2) is presented. The straight line plots of ln [1-U(t)] vs time ‘t’ indicate that the
adsorption of chromium (VI) from aqueous solution follows first order kinetics with respect to
adsorbents as shown in the Fig. 4.130. The slope of the straight line plots gives the overall rate
constant k’ for chromium (VI) adsorption process. The data obtained from the graphs are
represented in Table 4.66. The forward (k1) and backward (k2) rate constants are calculated and
is presented in Table 4.67.
Table- 4.66. Rate constant (k’) obtained from the graph for different initial concentration of
chromium (VI)
Studies Initial concentration Rate constant in min -1 (K’) SD R2
Experimental 10 0.0562 0.44049 0.845
50 0.0495 0.29484 0.904
100 0.0437 0.21205 0.934
ANN 10 0.0675 0.28466 0.949
50 0.0459 0.23352 0.928
100 0.0407 0.19727 0.934
RSM 10 0.0622 0.19643 0.869
50 0.0390 0.15878 0.922
100 0.0298 0.06162 0.899

RESULTS & DISCUSSION 2014
163 | P a g e
10 20 30 40 50
-4.0
-3.5
-3.0
-2.5
-2.0
-1.5
-1.0
ln[1
-U(t
)]
Time (minutes)
Experimental output (10 mg/L)
ANN output ( 10 mg/L)
RSM output (10 mg/L)
10 20 30 40 50
-3.0
-2.5
-2.0
-1.5
-1.0
-0.5
ln[1
-U(t
)]
Time (minutes)
Experimental output (50 mg/L)
ANN output (50 mg/L)
RSM output (50 mg/L)
(c)
(b) (a)
Table- 4.67. Rate constants (K1 and K2) obtained for different initial concentration of chromium (VI)
Studies Initial concentration
Overall rate constant k’ (min -1)
Forward rate constant k1
(min -1)
Backward rate constant k2
(min -1)
Experimental 10 0.0562 0.0284 0.0278
50 0.0495 0.0388 0.0107
100 0.0437 0.0391 0.0047
ANN 10 0.0675 0.0344 0.0332
50 0.0459 0.0547 0.0128
100 0.0407 0.0611 0.0064
RSM 10 0.0622 0.0320 0.0302
50 0.0390 0.0529 0.0093
100 0.0298 0.0584 0.0038
Fig. 4.130. Linear plot of Helfferich equation using CeO2/PANI composite, time versus ln[1-U(t)]
with initial chromium (VI) concentration of (a) 10 mg/L, (b) 50 mg/L and (c) 100 mg/L.
It is well evident from the data in tables that , the rate of forward process (adsorption) are higher
than the rate of backward process (desorption) up to completion of equilibrium and the equilibrium
is towards product side. Similar results have been reported by (Zhang et al., 2008; Shi et al.,
2011).

RESULTS & DISCUSSION 2014
164 | P a g e
4.5.2.4.3. Second order (2nd) rate equation
It is well evident from above discussion, that the adsorption process simply followed first order
kinetics but still the data are tested for the second order second order rate equation. A detailed
description of second order rate equation is presented in Section 4.1.2.2.3.
Fig. 4.131. Linear plot of second order rate equation using CeO2/PANI composite, time versus t/qt
with initial chromium (VI) concentration of 10 mg/L, 50 mg/L and 100 mg/L.
The plot of t/qt versus contact time ‘t’ for initial concentration 10 mg/L, 50 mg/L and 100 mg/L is
represented in Fig. 4.131. The value of maximum adsorption capacity (qc) and second order rate
constant (k2) are calculated from plot t/qt versus time and presented in Table 4.68. On the basis of
10 20 30 40 50
0.15
0.20
0.25
0.30
0.35
0.40
0.45
0.50
t/q
t
Time (minutes)
Experimental output (100 mg/L)
ANN output (100 mg/L)
RSM output (100 mg/L)
10 20 30 40 50
0.3
0.4
0.5
0.6
0.7
0.8
0.9
t/q
t
Time (minutes)
Experimental output (50 mg/L)
ANN output (50 mg/L)
RSM output (50 mg/L)
10 20 30 40 50
1.0
1.5
2.0
2.5
3.0
3.5
4.0
4.5
t/q
t
Time (minutes)
Experimental output (10 mg/L)
ANN output (10 mg/L)
RSM output (10 mg/L)
(c)
(b)
(a)

RESULTS & DISCUSSION 2014
165 | P a g e
correlation coefficient (R2) values the second order rate equation is better fitted than first order
rate equation (Sundaram et al., 2008).
Table – 4.68. Rate constants (k2) and maximum adsorption capacity obtained from the graph for
different initial concentration of chromium
Experimental
k2 qc R2 SD
10 mg/L 0.00525 13.80 0.987 0.16916
50 mg/L 0.00019 71.74 0.970 0.15657
100 mg/L 0.00005 143.26 0.987 0.12303
ANN 10 mg/L 0.00513 13.97 0.989 0.06211
50 mg/L 0.00020 71.54 0.972 0.06957
100 mg/L 0.00005 141.32 0.985 0.07297
RSM 10 mg/L 0.00531 13.72 0.990 0.03266
50 mg/L 0.00021 69.27 0.974 0.07495
100 mg/L 0.00005 135.17 0.989 0.0855
4.5.2.4.4. Intraparticle diffusion (Weber Morris equation)
In order to understand the existence of intraparticle diffusion in the adsorption process, the
experimental data are tested with Weber Morris equation (Weber and Morris, 1963). A detailed
description of Weber Morris is presented in Section 4.1.2.2.4. The amount of chromium adsorbed
per unit mass of adsorbents, qe at any time ‘t’, was plotted as a function of square root of time
(t1/2). The rate constant for intraparticle diffusion was calculated using Weber-Morris equation
(Manju et al., 1998)
Table 4.69. Intraparticle diffusion rate constant (Weber-Morris equation) for chromium (VI)
removal by CeO2/PANI composite
Initial concentration kp C SD R2
Experimental 10 mg/L 1.045 4.537 0.35773 0.964
50 mg/L 6.272 12.152 1.46187 0.983
100 mg/L 13.135 20.614 3.12119 0.982
ANN output 10 mg/L 1.095 4.220 0.32094 0.974
50 mg/L 6.348 11.076 1.27335 0.987
100 mg/L 13.028 20.353 4.1536 0.969
RSM output 10 mg/L 1.093 3.907 0.1501 0.994
50 mg/L 6.110 11.189 1.18955 0.988
100 mg/L 12.436 17.474 0.72894 0.999
The results of diffusion process in batch adsorption experiments represented graphically in
Fig.4.132 and the corresponding data are presented in Table 4.69. The rate constants (kp) for
intraparticle diffusion for various initial concentration of chromium are determined from the slope
of plots. It is understood from the graph that Y-intercept of the plots were not passing through the
origin, thus indicating that intraparticle diffusion is not sole rate limiting factor for the adsorption of
chromium onto the composite. The values of Kp are presented in Table 4.66 and it is found that
values increases with the increase in chromium concentration. The higher value of kp suggest an

RESULTS & DISCUSSION 2014
166 | P a g e
enhancement rate of adsorption, whereas larger kp values suggest better adsorption which is
related to improved bonding between sorbate and sorbent particles (Boparai et al. 2011).
Fig.4.132. Linear plot of Weber-Morris equation using CeO2/PANI composite, square root of time
versus qe with initial concentration of (a), 10 mg/L, (b) 50 mg/L and (c) 100 mg/L
In the present study the value of kp indicate that external surface is more prominent to adsorption
and not a sole rate limiting factor for the adsorption of chromium (VI) onto the composite. The
value of C provides information related to the thickness of the boundary layer. Larger values of C
suggest that surface diffusion has a larger role as the rate-limiting step (Badruzzaman et al.,
3 4 5 6 7
7
8
9
10
11
12
qe
t
Experimental output (10 mg/L)
ANN output (10 mg/L)
RSM output (10 mg/L)
3 4 5 6 7
30
35
40
45
50
55
60
qe
t
Experimental output (50 mg/L)
ANN output (50 mg/L)
RSM output (50 mg/L)
3 4 5 6 7
50
60
70
80
90
100
110
120
qt
t
Experimental output (100 mg/L)
ANN output (100 mg/L)
RSM output (100 mg/L)
(c)
(b)
(a)

RESULTS & DISCUSSION 2014
167 | P a g e
2004). In the present study, the C values are found to be lower with the increase in temperature
which suggests that the surface diffusion became less prominent at higher temperatures because
of the higher collision at high thermal energy. Similar report is proposed by Lorenzen et al.,
(1995), Badruzzaman et al. (2004), Boparai et al. (2011).
4.5.2.5. Influence of Temperature
Temperature influences the adsorption rate by varying the molecular interactions and the
solubility potential of the adsorbate (Tezuka et al., 2004; Shi et al., 2011; Pontic et al., 2003). The
plot obtained from the study is represented in Fig. 4.133. The percentage removal of chromium
increased from 65.5% to 92.2%, 85.5% to 96.2% and 55.8% to 77.5% for initial concentration of
chromium of 10 mg/L, 50 mg/L and 100 mg/L respectively from 25 oC to 40 oC than decreases
with increase in temperature from 40 0C to 75oC. The continuous increases at lower temperature
indicate the endothermic nature of adsorption process (Islam et al., 2007). The similar trend of
studies was also supported by ANN and RSM prediction suggesting the accuracy of the
experimental studies and the prediction model.
Fig. 4.133. Effect of temperature on removal of chromium (VI) by CeO2/PANI composite for initial
concentration of (a) 10 mg/L, (b) 50 mg/L and (c) 100 mg/L
20 30 40 50 60 70 80
50
60
70
80
90
100
% R
em
ov
al o
f c
hro
miu
m(V
I)
Temperature ( 0C)
Experimental output (10 mg/L)
ANN output (10 mg/L)
RSM output (10 mg/L)
20 30 40 50 60 70 80
65
70
75
80
85
90
95
100%
Re
mo
va
l o
f ch
rom
ium
(V
I)
Temperature ( 0C)
Experimental output (50 mg/L)
ANN output (50 mg/L)
RSM output (50 mg/L)
20 30 40 50 60 70 80
30
40
50
60
70
80
% R
em
ova
l o
f ch
rom
ium
(V
I)
Temperature ( 0C)
Experimental output (100 mg/L)
ANN output (100 mg/L)
RSM output (100 mg/L)
(c)
(b) (a)

RESULTS & DISCUSSION 2014
168 | P a g e
However it is very difficult to describe the adsorption behaviour with increased in
temperature, many researchers and study suggested that this may be probably due to a decrease
in the escaping tendency of the adsorbate species from the surface of the adsorbent (Zodi et al.,
2010; Verbych et al., 2005; Tezuka et al., 2004). The enhanced adsorption of chromium may also
be due to change in pore diameter and rate of diffusion. The same trend of observation was noted
by Islam et al. (2007). Therefore it may be concluded that at higher temperature the extent of
mass transfer is very high and possibility arises for bond break or weakening, resulting decrease
in removal efficiency.
4.5.2.6. Thermodynamic parameters
In the present study, various thermodynamic parameters were calculated in order to
understand the heat change, spontaneity, feasibility and mass transfer etc. of the adsorption
process. It is a fundamental idea that any chemical reactions tends to attain a state of equilibrium.
A detailed description is presented in Section 4.1.2.4.
Fig. 4.134. Van’t Hoff plots, log Kc versus 1/T for CeO2/PANI composite, initial chromium (VI)
concentration (a) 10 mg/L, (b) 50 mg/L and (c) 100 mg/L
0.00318 0.00321 0.00324 0.00327 0.00330 0.00333 0.00336
2.32
2.34
2.36
2.38
2.40
2.42
2.44
2.46
2.48
2.50
2.52ln
Kc
1/T
Experimental output (50 mg/L)
ANN output (50 mg/L)
RSM output (50 mg/L)
0.00318 0.00321 0.00324 0.00327 0.00330 0.00333 0.00336
2.05
2.10
2.15
2.20
2.25
2.30
2.35
2.40
2.45
lnK
c
1/T
Experimental output (10 mg/L)
ANN output (10 mg/L)
RSM output (10 mg/L)
0.00318 0.00321 0.00324 0.00327 0.00330 0.00333 0.00336
1.85
1.90
1.95
2.00
2.05
2.10
2.15
2.20
2.25
2.30
ln K
c
1/T
Experimental output (100 mg/L)
ANN output (100 mg/L)
RSM output (100 mg/L)
(a) (b
)
(c)

RESULTS & DISCUSSION 2014
169 | P a g e
The thermodynamic parameters, which characterize the equilibrium of a system, are Gibbs
free energy change (ΔG), the enthalpy (H) and entropy (S) of adsorption. These parameters
are calculated by thermodynamic equations, (Raji et al., 1998; Shibata et al., 2006). A plot of logs
Kc versus 1/T for initial chromium (VI) concentration of 10mg/L, 50mg/L and 100mg/L is found to
be linear (Fig. 4.134). The values of H and S were calculated from the slope and intercept of
Van’t Hoff plot. The results of the analysis were represented in Table 4.70. The negative values of
ΔG at all temperature confirm the spontaneous nature of adsorption. The negative values of ΔH
confirm the feasibility of the ongoing adsorption process and indicate the exothermic nature of
adsorption. The positive value of ∆S suggests the structural modification and increase in affinity in
adsorbent towards chromium (VI) species during the adsorption process. Further, the increasing
absolute value of ∆G with increasing temperature obtained at different pH indicates that initially
physical adsorption is predominant mechanism but at the end chemical adsorption
(chemisorption) is predominant mechanism. Meyn et al. (1990), Raji et al. (1998), Shibata et al.
(2006), Mukhopadhyay et al. (2007), presents a similar study.
Table - 4.70. Thermodynamic parameters using synthetic chromium (VI) solution of 10 mg/L, 50
mg/L, and 100 mg/L
4.5.2.7. Influence of initial chromium (VI) concentration and adsorption isotherm
It is important to have a satisfactory description of the equilibrium state between the two
phases in order to successfully represent the dynamic behavior of any adsorbate from solution to
the solid (adsorbent) phase. Adsorption isotherm can be defined as a functional expression for the
variation in adsorption of the adsorbate by the adsorbent in the bulk solution at constant
temperature. Adsorption of adsorbate onto adsorbent depends on initial adsorbate concentration.
In the present study the influence of initial concentration is studied in the range of 1 mg/L
to 250 mg/L for different pH conditions (pH 3, pH 6 and pH 9). The results of the influence of initial
chromium (VI) concentration on chromium (VI) adsorption are graphically represented in Fig.
4.135. It is obvious from the graph that the removal percentage decreases from 67.6% to 29.6%,
for pH 3, 91.1% to 57.1%, for pH 6, and 32.6% to 0.78%, for pH-9 respectively. The result shows
that there is a decrease in chromium adsorption at pH 3 and pH 9. The major reason for reduction
Exp
erim
enta
l
Initial Conc (mg/L)
ΔH
(kJ/mol)
ΔS (kJ/ K mol
ΔG (kJ/mol) SD R2
298 K 303 K 308 K 313 K
10 -2.21 0.009 -5.045 -5.093 -5.140 -5.188 0.04403 0.948
50 -0.74 0.005 -2.190 -2.215 -2.239 -2.263 0.01333 0.976
100 -1.94 0.009 -4.483 -4.526 -4.569 -4.611 0.06416 0.868
AN
N 10 -2.20 0.009 -2.155 -2.155 -2.154 -2.154 0.02945 0.976
50 -0.86 0.005 -0.835 -0.834 -0.834 -0.834 0.03645 0.800
100 -1.94 0.008 -1.894 -1.894 -1.893 -1.893 0.05232 0.908
RS
M
10 -2.15 0.009 -2.135 -2.135 -2.135 -2.15 0.02891 0.976
50 -0.78 0.005 -0.767 -0.767 -0.767 -0.78 0.01702 0.937
100 -2.04 0.009 -2.022 -2.022 -2.022 -2.04 0.07786 0.832

RESULTS & DISCUSSION 2014
170 | P a g e
of chromium (VI) adsorption is due to non-availability of active adsorption sites and electrostatic
repulsion at alkaline pH. However in excess acidic condition the surface is unstable resulting low
% removal (Li et al. 2014). The prediction studies by ANN and RSM supports the observation of
the present study. The results obtained by Roy et al. (2014), Miretzky et al. (2010), Bhatti et al.
(2009), Jain et al. (2009); Islam et al. (2007), were similar with the results of the present work.
Fig. 4.135. Influence of initial chromium (VI) concentration on removal efficiency versus initial
chromium (VI) concentration.
4.5.2.7.1. Langmuir adsorption isotherm
The adsorption data are fitted to linearly transformed Langmuir isotherm (Langmuir, 1918). A
detailed description of Langmuir isotherm is presented in Section 4.1.2.6.1. The linear plot of 1/Ce
versus 1/qe is represented in Fig. 4.136. The Langmuir adsorption data for chromium (VI)
adsorption onto CeO2/PANI composite are presented in Table 4.71. The values of qo and b were
calculated from intercept and slope of the plot (1/Ce versus 1/qe). The values of qo and b were
calculated from intercept and slope of the graph (1/Ce versus 1/qe) respectively. It is found that at
pH 6 the adsorption capacity of CeO2/PANI composite was found to be highest. This may be
0 50 100 150 200 250
25
30
35
40
45
50
55
60
65
70
% R
em
ova
l o
f ch
rom
ium
(V
I)
Initial concentration (mg/L)
pH-3
Experimental output
ANN output
RSM output
0 50 100 150 200 250
50
55
60
65
70
75
80
85
90
95
% R
em
ova
l o
f ch
rom
ium
(V
I)Initial concentration (mg/L)
( pH-6 )
Experimental output
ANN output
RSM output
0 50 100 150 200 250
0
5
10
15
20
25
30
35
% R
em
ova
l o
f ch
rom
ium
(V
I)
Initial concentration (mg/L)
pH-9
Experimental output
ANN output
RSM output
(a) (b)
(c)

RESULTS & DISCUSSION 2014
171 | P a g e
helpful to explain the maximum removal efficiency of CeO2/PANI composite. The values obtained
of the dimensionless parameter are presented in Table 4.71. The values of the dimensionless
equilibrium parameter ‘r’ justify the favorable process.
Fig. 4.136. Langmuir adsorption isotherm, 1/Ce versus 1/qe for CeO2/PANI composite for different
pH (a) pH-3, (b) pH-6 and (c) pH-9
Table - 4.71. Langmuir isotherm parameters for chromium (VI) removal by cerium oxide
polyaniline composite
CeO2/PANI composite qo (mg/g) b (L/mg) SD R2
pH-3 Experimental 115.0 2.4 0.00235 0.986
ANN 116.5 2.3 0.00233 0.987
RSM 109.1 2.0 0.00271 0.989
pH-6 Experimental 212.6 11.7 0.00138 0.999
ANN 202.3 11.2 0.00134 0.999
RSM 229.3 9.2 0.00179 0.999
pH-9 Experimental 11.0 0.6 0.1172 0.950
ANN 14.8 0.5 0.07712 0.980
RSM 13.1 0.5 0.08689 0.978
r
Conc Experimental ANN RSM
10 0.08 0.29 0.63
50 0.08 0.31 0.65
100 0.10 0.33 0.67
0.0 0.5 1.0 1.5 2.0 2.5 3.0 3.5
0.0
0.2
0.4
0.6
0.8
1.0
1.2
1.4
1/q
e
1/Ce
pH-3
Experimental output
ANN output
RSM output
0 2 4 6 8 10 12
0.0
0.2
0.4
0.6
0.8
1.0
1/q
e
1/Ce
pH-6
Experimental output
ANN output
RSM output
-0.2 0.0 0.2 0.4 0.6 0.8 1.0 1.2 1.4 1.6
0.0
0.5
1.0
1.5
2.0
2.5
3.0
3.5
1/q
e
1/Ce
pH-9
Experimental output
ANN output
RSM output
(a) (b)
(c)

RESULTS & DISCUSSION 2014
172 | P a g e
4.5.2.7.2. Freundlich isotherm
The Freundlich equation is used for determining the suitability of heterogeneous surface energy in
the adsorption process (Freundlich, 1906). The equation is used directly from the discussion in
Section 4.1.2.6.2. A plot of log Ce against log qe was represented in Fig. 4.137. The data obtained
were presented in Table 4.72.
Table - 4.72. Freundlich isotherm parameters for CeO2/PANI composite for removal of chromium
(VI).
Cerium oxide polyaniline composite
Kf n SD R2
pH-3 Experimental 0.539 1.486 0.11588 0.9332
ANN 0.519 1.475 0.11651 0.9326
RSM 0.495 1.496 0.12636 0.9187
pH-6 Experimental 1.13 1.67 0.16713 0.883
ANN 1.11 1.66 0.16175 0.890
RSM 1.08 1.64 0.17213 0.875
pH-9 Experimental 0.384 3.226 0.37002 0.1971
ANN 0.279 2.532 0.33317 0.3259
RSM 0.233 2.540 0.33326 0.3213
Fig. 4.137. Freundlich adsorption isotherm, log Ce versus log qe for CeO2/PANI composite for
different pH (a) pH-3, (b) pH-6 and (c) pH-9
-0.5 0.0 0.5 1.0 1.5 2.0 2.5
-0.5
0.0
0.5
1.0
1.5
2.0
log
qe
log Ce
pH-3
Experimental output
ANN output
RSM output
-1.5 -1.0 -0.5 0.0 0.5 1.0 1.5 2.0 2.5
0.0
0.5
1.0
1.5
2.0
2.5
log
qe
log Ce
pH-6
Experimental output
ANN output
RSM output
-0.5 0.0 0.5 1.0 1.5 2.0 2.5
-0.6
-0.4
-0.2
0.0
0.2
0.4
0.6
0.8
1.0
1.2
1.4
1.6
Lo
g q
e
Log Ce
pH-9
Experimental output
ANN output
RSM output
(a) (b)
(c)

RESULTS & DISCUSSION 2014
173 | P a g e
The value of Kf (Freundlich constant) (Freundlich, 1906) indicates affinity of chromium (VI)
species (Cantu et al., 2005). The value of the Freundlich parameters also justifies the numbers of
adsorption sites (Shi et al., 2011). The value of 1/n presents a conclusion with respect to the rate
determining step in adsorption process. The magnitude of 1/n is 0.5 for intraparticle diffusion to be
the late limiting step (Weber and Morris, 1963). It may be justified from the present study that the
intraparticle diffusion is not enough slow to be the rate determining step as disclosed by the
values of 1/n. The correlation value obtained from both the adsorption isotherm (Langmuir and
Freundlich) justifies that Langmuir isotherm is best fitted to experimental data than Freundlich
isotherm. The prediction model used (ANN and RSM) also supports the studies and presented the
similar observation. The present modeling and prediction suggest the accuracy of the observation
and applicability of chromium (VI) removal. However both the adsorption signifies type of
adsorption nature, for better understanding the Dubinin-Radushkevich isotherm is studied. Similar
researches were represented by many scientist and research workers validate the possibility of
above observation (Hamadi et al., 2001; Park et al., 2008).
4.5.2.7.3. Dubinin-Radushkevich (D-R) isotherm
In order to understand the adsorption behaviour, nature of adsorption process, whether chemical
or physical, experimental equilibrium data were tested with Dubinin- Radushkevich isotherm
(Dubinin, 1966, Dubinin, 1975, Dubnin and Stockeli, 1980), according to discussion in Section
4.1.2.6.3. (Argun et al., 2007; Muniz et al., 2013). The D-R isotherm plot is represented in Fig.
4.138, and the data obtained is presented in Table 4.73. The mean free energy of adsorption (E)
was calculated from the constant K (Muniz et al., 2013; Cantu et al., 2014; Camargo et al., 2014).
In the present studies the value of E is some extent higher than 16 kJ/mol at pH 6, indicates
chemisorption and ion exchange nature of the adsorption process. This may be due to different
chemical process, such as formation of chromium oxide, chromium hydroxide and ammonium
dichromate, accompying the ion exchange process. The formation of chromium oxide, chromium
hydroxide and ammonium dichromate were discovered by taking XRD (Fig. 4.122) of the
adsorbent obtained after adsorption process.
Table - 4.73. D-R adsorption isotherm parameters for chromium (VI) removal by CeO2/PANI
composite
D-R isotherm
pH-3
K (mol2kJ-2) qm (g/g) E (kJ mol-1) R2 SD
Experimental 7.56 × 10-08 1.49 81.29 0.56 0.62723
ANN 7.84 × 10-08 1.49 79.81 0.57 0.62367
RSM 1.42 × 10-07 1.49 59.15 0.60 0.62978
pH-6
Experimental 3.09 × 10-07 1.38 40.18 0.63 0.5749
ANN 3.20 × 10-07 1.37 39.50 0.63 0.57616
RSM 3.34 × 10-07 1.36 38.66 0.63 0.56284
pH-9
Experimental 2.70 × 10-07 0.85 43.00 0.14 0.67666
ANN 2.95 × 10-07 0.90 41.10 0.19 0.61603
RSM 2.70 × 10-07 0.86 42.99 0.15 0.61962

RESULTS & DISCUSSION 2014
174 | P a g e
The modeling and prediction of nonlinear data by ANN and RSM prediction model also support
the above study. The data obtained from both the modeling validate the experimental data. So,
the adsorption process can be better inferred as ion exchange and chemisorption considering the
above observations. Similar studies were reported by many researchers (Park et al., 2006; Argun
et al., 2007; Shi et al., 2011; Lazaridis et al., 2004; Shanmugaprakash et al., 2013)
Fig. 4.138. D-R adsorption isotherm, ln qe versus ε2 for CeO2/PANI composite for different pH (a)
pH-3, (b) pH-6 and (c) pH-9
4.5.2.8. Effect of competitive anions on chromium (VI) removal
The influence of co-anions upon adsorption of chromium (VI) is studied and graphically
represented in Fig. 4.139 - Fig. 4.141. The concentration of chromium (VI) were fixed at 10 mg/L,
50 mg/L and 100 mg/L by varying the initial concentration of anions from 1 mg/L to 150 mg/L
keeping other parameters constant. It is observed that the presence of this co-anions present in
aqueous solution reduces the adsorption efficiency. The maximum removal percentage of 96.4%,
92.3% and 87.3% was achieved in the absence of common anions for initial chromium
concentration of 10 mg/L, 50 mg/L and 100 mg/L respectively; however, the removal percentage
decreases in the presence of common anions in the following descending order nitrate >
0 8000000 16000000 24000000 32000000 40000000
0
1
2
3
4
5
ln q
e
2
pH-3
Experimental output
ANN output
RSM output
0 2000000 4000000 6000000 8000000 10000000 12000000 14000000
0
1
2
3
4
5
ln q
e
pH-6
Experimental output
ANN output
RSM output
0 1000000 2000000 3000000 4000000 5000000 6000000
0.5
1.0
1.5
2.0
2.5
3.0
3.5
ln q
e
pH-9
Experimental output
ANN output
RSM output
(a) (b)
(c)

RESULTS & DISCUSSION 2014
175 | P a g e
bicarbonate > sulphate > carbonate > fluoride > chloride respectively for initial concentration of
chromium, 10 mg/L, 50 mg/L and 100 mg/L. The reduction in adsorption efficiency due to these
following anions may be due to the competition for the present active sites along with chromium
(VI) species during the adsorption process and to the fact that these ions have higher affinity
towards the adsorbent material (Preetha et al., 2007; Dong et al., 2011; Shi et al., 2009). Wang et
al., (2011), also carried out similar study. They reported the effect of different cations on
competitive adsorption on surface and anions exchange of chromium (VI). In this study Wang et
al. (2014), examined the effect of competitive anions CO32−, HCO3
−, SO42−, H2PO4
−, Cl− and NO3−
on ion exchange of chromium by using LDH. The presence of anions significantly reduced the
adsorption capacity.
Fig. 4.139. Percentage removal of chromium (VI) with CeO2/PANI composite versus initial anion
concentration of solution. (Initial cation concentration of 10 mg/L).
Fig. 4.140. Percentage removal of chromium (VI) with CeO2/PANI composite versus initial anion
concentration of solution. (Initial cation concentration of 50 mg/L).
0 10 20 30 40 50 60 70 80 90 100 110 120 130 140 150
0
20
40
60
80
100
% R
em
ova
l
Intial concentration of anions
Without anions
chloride
sulphate
Fluoride
Carbonate
Bicarbonate
Nitrate
20 40 60 80 100 120 140
0
20
40
60
80
100
% R
em
ova
l o
f ch
rom
ium
(V
I)
Initial concentration of anions
Without ions
Chlorine
Sulphate
Fluoride
Carbonate
Bicarbonate
Nitrate
Chromium (VI) concentration-50 mg/L

RESULTS & DISCUSSION 2014
176 | P a g e
Fig. 4.141. Percentage removal of chromium (VI) with CeO2/PANI composite versus initial anion
concentration of solution. (Initial cation concentration of 100 mg/L).
4.5.2.9. Regernation and reusability studies cerium oxide polyaniline composite Desorption and regeneration studies were carried out in order to understand the reusability and
nature of adsorption type whether the reaction is of physical or chemical nature. In the present
study, the regeneration and reusability of the material was studied in the range of pH-2 to pH-11.
The graphical plots were represented in Fig. 4.142 (a) and Fig. 4.142 (b).
20 40 60 80 100 120 140
0
20
40
60
80
100
% R
em
ova
l o
f ch
rom
ium
(V
I)
Initial anion concentration in mg/L
Without ions
Chloride
Sulphate
Fluoride
Carbonate
Bicarbonate
Nitrate
Chromium (VI) concentration-100 mg/L
(a)

RESULTS & DISCUSSION 2014
177 | P a g e
Fig. 4.142 (a) Regeneration of CeO2/PANI composite material at different pH and (b) Reusability
of CeO2/PANI composite material.
In the present study, the material is unstable at alkali and at extreme acidic conditions. The
observation suggest that the material exhibits poor desorption (<20%). Due to poor desorption
property, the material can be reused upto two cycles (> 60 percentage removal).
Similar studies was also reported by Mohan et al. (2007), Nataraj et al. (2009), Rosane et al.
(2012), Qafoku et al. (2009), Nemr et al. (2008), and Rigobello et al. (2013).
4.5.3. Prediction modeling of chromium removal from water
The most important issue for an environmental process is the parametric appraisal of the
method and subsequently improvement through modelling and optimization without incurring extra
cost. However, the removal of chromium (VI) by this method depends on a number of variables.
The non-linear behavior and profound impact of these parameters for removal process make
researchers to profoundly use modelling approaches (Jaafarzadeh et al., 2012; Roy et al., 2014).
Modelling of such process by response surface methodology (RSM) and artificial neural network
(ANN) can make it easy to understand the influence of different variables affecting the removal of
chromium (VI) from water. RSM not only develops a non-linear predictive equation, but also helps
to analyze influence of each parameter on removal efficiency. On the other hand, neural networks
can map non-linear relationship between inputs and outputs using the data structure. In this study,
two different predictive models namely RSM and ANN and compared to gain insight into the
prediction capability of each model. However, both the models have their own advantages and
disadvantages. RSM can show the influence of each parameter and interaction between
parameters on response, but ANN can improve and simulate any process performance in any
form of non-linearity without any regular experimental design. ANN also overcomes quadratic
non-linear correlation hypothesis of RSM.
(b)
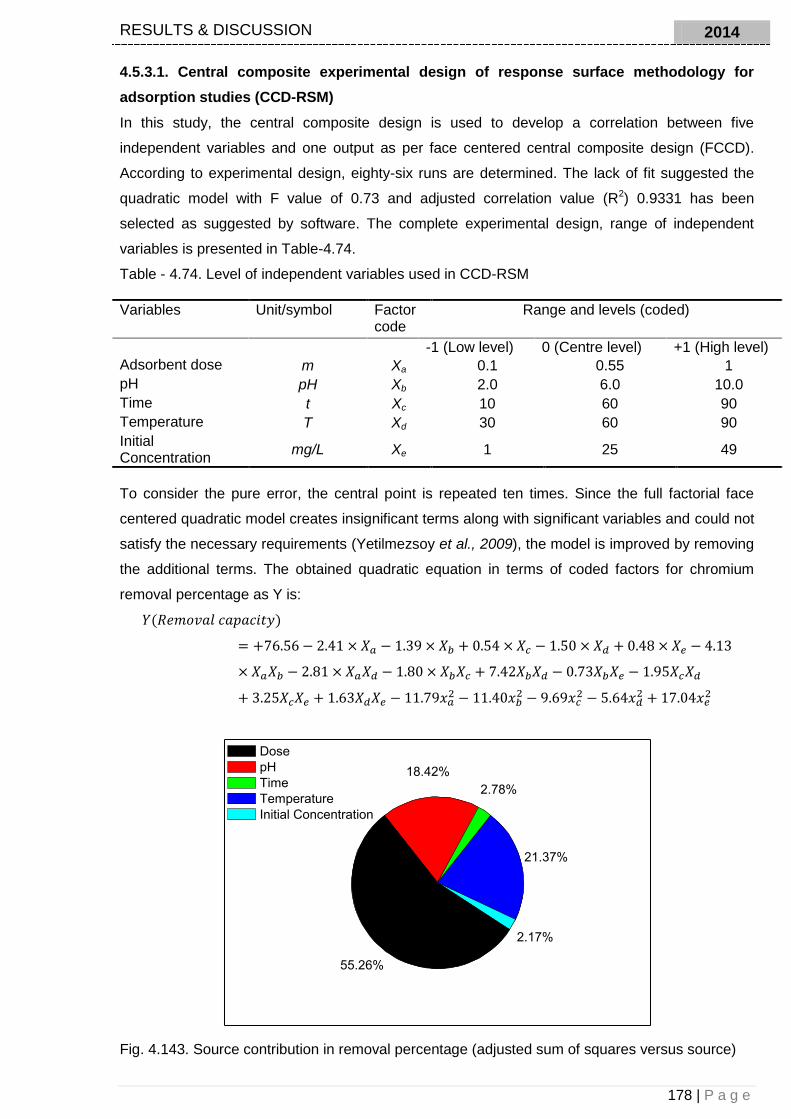
RESULTS & DISCUSSION 2014
178 | P a g e
4.5.3.1. Central composite experimental design of response surface methodology for
adsorption studies (CCD-RSM)
In this study, the central composite design is used to develop a correlation between five
independent variables and one output as per face centered central composite design (FCCD).
According to experimental design, eighty-six runs are determined. The lack of fit suggested the
quadratic model with F value of 0.73 and adjusted correlation value (R2) 0.9331 has been
selected as suggested by software. The complete experimental design, range of independent
variables is presented in Table-4.74.
Table - 4.74. Level of independent variables used in CCD-RSM
Variables Unit/symbol Factor code
Range and levels (coded)
-1 (Low level) 0 (Centre level) +1 (High level)
Adsorbent dose m Xa 0.1 0.55 1
pH pH Xb 2.0 6.0 10.0
Time t Xc 10 60 90
Temperature T Xd 30 60 90
Initial Concentration
mg/L Xe 1 25 49
To consider the pure error, the central point is repeated ten times. Since the full factorial face
centered quadratic model creates insignificant terms along with significant variables and could not
satisfy the necessary requirements (Yetilmezsoy et al., 2009), the model is improved by removing
the additional terms. The obtained quadratic equation in terms of coded factors for chromium
removal percentage as Y is:
Fig. 4.143. Source contribution in removal percentage (adjusted sum of squares versus source)
2.17%
21.37%
2.78%
18.42%
55.26%
Dose
pH
Time
Temperature
Initial Concentration

RESULTS & DISCUSSION 2014
179 | P a g e
The equation presented above makes a good understanding of the effects of each factor and their
interaction on the response. The positive sign in the equation indicates synergistic effect whereas
negative sign indicates the antagonistic effect. The comparison between the observed and
predicted values of chromium (VI) removal expressed a high correlation coefficient determined
(R2) as 0.948. The data were presented in Table 4.75. Which presents a reasonable agreement
with the adjusted (R2adj) of 0.915. Analysis of variance (ANOVA) is presented in Table 4.76. The
low probability (<0.05) with model F value (68.26) proposes the model is significant and accurate.
The ‘lack of fit F- value’ of 0.69 implies that the lack of fit is not significant relative to pure error
and non-significant lack of fit is good for fitting the model (Vukčević et al., 2014; Yetilmezsoy et
al., 2009; Geyikçia et al., 2012). According to probability values, all the main effects, excluding
variable Xc and Xe are significant in nature. The insignificant nature of variable time and
concentration makes it more senstive variables than the other variables in removal of chromium
(VI) from water. The source contribution in removal percentage is evaluated based on adjusted
sum of square and the plot is presented in Fig. 4.143, suggesting that dose, pH and temperature
contributes more than 90 % towards influencing removal percentage but, variable time and
concentration have less contribution in influencing removal percentage making the later variables
insignificant in nature (Geyikçia et al., 2012). To get better evidence on adsorption process, the
three dimensional response surface plots are obtained and studied. In each plot, the interaction of
any two variables on adsorption process is studied keeping the other variables constant.
Table - 4.75. Observed experimental and predicted data for chromium removal prediction by using
CCD-RSM
Run
Coded Levels Observed Exp values
RSM Predicted Values
Difference %Error Xa Xb Xc Xd Xe
1 -1 -1 -1 -1 -1 59.0 60.2 -1.3 2.2
2 1 -1 -1 -1 -1 73.6 69.3 4.3 -5.9
3 -1 1 -1 -1 -1 57.2 55.9 1.2 -2.2
4 1 1 -1 -1 -1 49.6 48.5 1.1 -2.2
5 -1 -1 1 -1 -1 63.1 62.3 0.8 -1.2
6 1 -1 1 -1 -1 70.3 71.4 -1.1 1.5
7 -1 1 1 -1 -1 52.9 50.8 2.1 -3.9
8 1 1 1 -1 -1 42.8 43.3 -0.5 1.3
9 -1 -1 -1 1 -1 48.8 48.7 0.1 -0.2
10 1 -1 -1 1 -1 46.6 46.5 0.1 -0.3
11 -1 1 -1 1 -1 75.2 74.0 1.2 -1.5
12 1 1 -1 1 -1 54.7 55.3 -0.6 1.1
13 -1 -1 1 1 -1 45.2 43.0 2.3 -5.0
14 1 -1 1 1 -1 40.6 40.8 -0.2 0.5
15 -1 1 1 1 -1 59.2 61.1 -1.9 3.3
16 1 1 1 1 -1 43.2 42.4 0.8 -1.9
17 -1 -1 -1 -1 -1 58.0 60.2 -2.3 3.9
18 1 -1 -1 -1 -1 68.6 69.3 -0.7 1.0
19 -1 1 -1 -1 -1 55.2 55.9 -0.8 1.4
20 1 1 -1 -1 -1 47.6 48.5 -0.9 1.9
21 -1 -1 1 -1 -1 62.3 62.3 0.0 0.0
22 1 -1 1 -1 -1 70.3 71.4 -1.1 1.5
23 -1 1 1 -1 -1 50.8 50.8 0.0 0.1

RESULTS & DISCUSSION 2014
180 | P a g e
24 1 1 1 -1 -1 43.8 43.3 0.5 -1.0
25 -1 -1 -1 1 -1 46.8 48.7 -1.9 4.0
26 1 -1 -1 1 -1 45.8 46.5 -0.6 1.4
27 -1 1 -1 1 -1 73.7 74.0 -0.3 0.5
28 1 1 -1 1 -1 55.4 55.3 0.0 -0.1
29 -1 -1 1 1 -1 42.1 43.0 -0.8 2.0
30 1 -1 1 1 -1 39.5 40.8 -1.3 3.2
31 -1 1 1 1 -1 61.4 61.1 0.3 -0.5
32 1 1 1 1 -1 41.4 42.4 -1.0 2.3
33 -1 -1 -1 -1 1 52.5 52.9 -0.3 0.6
34 1 -1 -1 -1 1 61.4 61.9 -0.5 0.8
35 -1 1 -1 -1 1 46.3 45.7 0.7 -1.4
36 1 1 -1 -1 1 38.6 38.2 0.4 -1.0
37 -1 -1 1 -1 1 68.7 68.0 0.8 -1.1
38 1 -1 1 -1 1 76.7 77.0 -0.4 0.5
39 -1 1 1 -1 1 54.4 53.5 0.9 -1.6
40 1 1 1 -1 1 45.8 46.1 -0.3 0.6
41 -1 -1 -1 1 1 47.7 47.8 -0.1 0.3
42 1 -1 -1 1 1 45.6 45.6 -0.1 0.2
43 -1 1 -1 1 1 70.1 70.3 -0.2 0.2
44 1 1 -1 1 1 51.1 51.6 -0.5 1.0
45 -1 -1 1 1 1 54.3 55.1 -0.9 1.6 46 1 -1 1 1 1 50.6 52.9 -2.3 4.6
47 -1 1 1 1 1 70.4 70.4 0.0 0.0
48 1 1 1 1 1 52.8 51.7 1.2 -2.2
49 -1 -1 -1 -1 1 54.0 52.9 1.1 -2.0
50 1 -1 -1 -1 1 61.7 61.9 -0.2 0.3
51 -1 1 -1 -1 1 45.2 45.7 -0.5 1.1
52 1 1 -1 -1 1 38.6 38.2 0.3 -0.9
53 -1 -1 1 -1 1 69.0 68.0 1.0 -1.5
54 1 -1 1 -1 1 76.2 77.0 -0.8 1.1
55 -1 1 1 -1 1 54.3 53.5 0.8 -1.4
56 1 1 1 -1 1 45.2 46.1 -0.8 1.9
57 -1 -1 -1 1 1 47.4 47.8 -0.5 1.0
58 1 -1 -1 1 1 45.2 45.6 -0.5 1.0
59 -1 1 -1 1 1 70.3 70.3 0.0 -0.1
60 1 1 -1 1 1 51.9 51.6 0.3 -0.5
61 -1 -1 1 1 1 56.3 55.1 1.1 -2.0
62 1 -1 1 1 1 52.6 52.9 -0.3 0.6
63 -1 1 1 1 1 70.8 70.4 0.4 -0.6
64 1 1 1 1 1 50.8 51.7 -0.8 1.6
65 -1 0 0 0 0 64.4 67.2 -2.8 4.3
66 1 0 0 0 0 68.8 62.4 6.4 -9.3
67 0 -1 0 0 0 73.1 66.6 6.6 -9.0
68 0 1 0 0 0 60.8 63.8 -2.9 4.8
69 0 0 -1 0 0 68.1 66.3 1.8 -2.7
70 0 0 1 0 0 69.2 67.4 1.8 -2.6
71 0 0 0 -1 0 69.1 72.4 -3.3 4.8
72 0 0 0 1 0 76.3 69.4 6.9 -9.1
73 0 0 0 0 0 83.7 76.6 7.1 -8.5
74 0 0 0 0 0 93.7 76.6 17.1 -18.3
75 0 0 0 0 -1 95.7 93.1 2.5 -2.6
76 0 0 0 0 1 95.2 94.1 1.1 -1.1
77 0 0 0 0 0 70.7 76.6 -5.9 8.4
78 0 0 0 0 0 72.1 76.6 -4.4 6.1
79 0 0 0 0 0 78.4 76.6 1.8 -2.3
80 0 0 0 0 0 70.3 76.6 -6.3 9.0
81 0 0 0 0 0 71.5 76.6 -5.1 7.1

RESULTS & DISCUSSION 2014
181 | P a g e
82 0 0 0 0 0 73.9 76.6 -2.7 3.6
83 0 0 0 0 0 70.8 76.6 -5.8 8.2
84 0 0 0 0 0 71.1 76.6 -5.5 7.7
85 0 0 0 0 0 72.6 76.6 -4.0 5.5
86 0 0 0 0 0 75.8 76.6 -0.8 1.0
In the present study, specially considering the ANOVA and the senstivity nature of variables (pH,
time and concentration) the surface plots are explained. However, for better understanding the
panel plots of all interdependent variables are represented in Fig. 4.144-4.147. Fig. 4.144(a)
represents the interdependent influence of pH and dose on percentage removal of Cr(VI)
Table - 4.76. Analysis of variance (ANOVA) of chromium removal prediction by using RSM-CCD
Sum of
Mean F p-value
Source Squares DF Square Value Prob > F
Model 14682.96 18 815.72 68.26 < 0.0001 significant
Xa-Dose 384.78 1 384.78 32.20 < 0.0001
Xb-pH 128.29 1 128.29 10.74 0.0017
Xc-Time 19.34 1 19.34 1.62 0.2077
Xd-Temperature 148.82 1 148.82 12.45 0.0008
Xe-Initial Conc 15.13 1 15.13 1.27 0.2645
Xa Xb 1092.45 1 1092.45 91.41 < 0.0001
Xa Xd 506.62 1 506.62 42.39 < 0.0001
Xb Xc 208.50 1 208.50 17.45 < 0.0001
Xb Xd 3522.50 1 3522.50 294.76 < 0.0001
Xb Xe 33.83 1 33.83 2.83 0.0971
Xc Xd 242.91 1 242.91 20.33 < 0.0001
Xc Xe 676.37 1 676.37 56.60 < 0.0001
Xd Xe 170.67 1 170.67 14.28 0.0003
Xa2 345.29 1 345.29 28.89 < 0.0001
Xb2 322.27 1 322.27 26.97 < 0.0001
Xc2 233.29 1 233.29 19.52 < 0.0001
Xd2 79.09 1 79.09 6.62 0.0123
Xe2 721.05 1 721.05 60.34 < 0.0001
Residual 800.69 67 11.95
Lack of Fit 223.18 24 9.30 0.69 0.8311 Not significant
Pure Error 577.51 43 13.43
Cor Total 15483.65 85
From the study, it is understood that the removal percentage increases with increase of dose
values and reaches a maximum value and finally decreases at lower values of pH. Similar trend
is observed at higher values of pH. For a fixed value of dose, removal percentage marginally
increases with increase in pH and reaches maximum value approximately at pH = 6.0 and then
decreases. The same trend is observed when dose is maintained at a high level. The highest
removal in the pH range of < 6.0 is because of the electrostatic force of attraction between
positively charged adsorbent and negative charged chromium (VI) species (HCrO4-, HCrO4
2-,
Cr2O72-). According to the study of surface charge density (Section-3), it is found that surface of
the composite hold postive charge in acidic range, so in this pH range, the amine group present in
the adsorbent are highly protonated, which makes the surface of the adsorbent positively

RESULTS & DISCUSSION 2014
182 | P a g e
charged. When the pH of the solution goes higher than > 6.0, the protonated amine group present
in the adsorbent undergoes deprotonation and the adsorption capacity gradually decreases. The
decrease of adsorption capacity at higher pH may be due to the following proposed reasons (1)
the surface acquired negative charged due to adsorption of hydroxyl ions, (2) repulsion between
the negatively charged surface of the adsorbent and the chromate anions. The interdependent
influence of pH and time in removal percentage is presented in Fig. 4.144(b). It is observed that
with increasing time, the removal percentage remains almost constant for any value of pH.
However, removal percentage marginally increases at lower pH for lower value of contact time
and remains constant at higher value of contact time. The possible reason is that at lower pH, the
quarterisation of amine group takes place and initially the adsorption rate is rapid because of
available adsorption sites, but with increase in contact time, removal percentage remains constant
may be due to overlapping of chromium ions at the same active sites, causing no change in
removal percentage.
Fig. 4.144. 3D plot represents interdependent interaction of dose and pH in removal percentage
(b) 3D plot represents interdependent interaction of pH and time in removal percentage
Fig. 4.145. (a) 3D plot represents interdependent influence of pH and temperature in removal
percentage is presented (b) 3D plot represents interdependent interaction of concentration and
pH in removal percentage.
(a) (b)
(a)
(b)

RESULTS & DISCUSSION 2014
183 | P a g e
The interdependent influence of pH and temperature in removal percentage is presented in Fig.
4.145(a). It is seen that percentage removal monotonically decreases with increasing temperature
for any value of pH. However, removal percentage initially increases, reaches a maximum value
and then decreases marginally as pH increases for any level of maintained temperature. The
reason ascertained to the following fact is that the magnitude of positive charges decreases with
increase in pH resulting in repulsion of the surface ions leading to decrease in removal capacity.
Fig. 4.146. (a) 3D plot represents interdependent interaction of concentration and time in removal
percentage (b) 3D plot represents interdependent interaction of temperature and time in removal
percentage
The interdependent interaction of concentration and pH in removal percentage is presented in Fig.
4.145(b). It is observed that for any value of pH the removal percentage marginally decreases at
higher and lower value of concentration. However, for any value of concentration the removal
percentage increases and then decreases for higher value of pH. The reason ascertained to the
fact that at lower pH, the affinity of adsorbent is higher for chromium species and due to high
concentration, the availability of species provides higher removal percentage (Bhatti et al., 2009).
The interdependent interaction of concentration and time in removal percentage is represented in
Fig. 4.146(a). It is observed that for any value of time the removal percentage increases at higher
and lower value of concentration. However, for any value of concentration the removal percentage
marginally decreases at higher and lower value of contact time. This may happen, because at
lower value of time, the interaction between adsorbate and adsorbent is limited and at higher
value of time, possibility of overlapping arises because of high concentration (Tir et al., 2008). The
interdependent interaction of temperature and time is represented in Fig. 4.146 (b). It is observed
that for any value of time the removal percentage increases at higher and decreases at lower
value of temperature. However, for any centric value of temperature the removal percentage
remains at higher and at higher and lower value of temperature the removal percentage
decreases. This may happen, because at lower value of time without optimum temperature the
collision between the surface and adsorbate materials couldn’t takes place effectively, however
with increase in time and temperature the collision and interaction between surface and adsorbate
particles increases the removal efficiency (Vaughan Jr. et al., 2005).
(a)
(b)

RESULTS & DISCUSSION 2014
184 | P a g e
The interdependent interaction of temperature and dose is represented in Fig. 4.147 (a); it is
observed that at higher value of dose for any value of temperature the removal percentage
decreases, similarly for centric value of dose at any temperature the removal percentage
increases. The reason may be ascertained to the fact that at any value of temperature, with
increase in the amount of dose, the overlapping of adsorbing particles increases resulting less
removal percentage. The interdependent interaction of temperature and concentration is
represented in Fig. 4.147 (b).
Fig. 4.147. (a) 3D plot represents interdependent interaction of temperature and dose in removal
percentage (b) 3D plot represents interdependent interaction of concentration and temperature in
removal percentage
Fig. 4.148. Optimal parametric values obtained for chromium removal by using RSM-CCD. It can be observed from the figure that at higher value of temperature and higher value of
concentration the removal percentage increases. This may happen because with increasing
(a)
(b
)

RESULTS & DISCUSSION 2014
185 | P a g e
temperature, particles interaction increases because of high concentration gradient resulting high
removal efficiency. Bhatti et al. (2009), Natale et al. (2007), and Roy et al. (2014), also carried out
similar study. Kalavathy et al. (2009), have reported the effective parameters by using central
composite rotatable design (CCRD) was used to obtain the experimental design matrix and their
effect on adsorption capacity of Cu2+ on to H3PO4 by using activated rubber wood sawdust.
Sharma et al. (2009), has also reported the application of response surface methodology (RSM)
for optimization of nutrient supplementation for chromium (VI) removal by aspergillums lentils
AMLO5. In the present study, Nelder-Mead simplex algorithm (Olmez et al., 2009) of design
expert software is used to obtain the optimal parametric values. The optimum removal of 93.9%
(Fig. 4.148) is achieved with a dose = 0.82 g/L, pH = 6, time = 60 minutes, temperature = 40 ºC
and initial concentration = 49 mg/L. The study shows that with this optimized values the maximum
removal can be achieved.
4.5.4. Artificial neural network modeling (B-P-ANN)
Back propagation artificial neural network tool is used to predict the removal percentage using
input parameters such as dose, pH, time, temperature and initial concentration. The experimental
data obtained from RSM design were divided into testing and training categories (Table 4.77).
The optimization of network is very important step in network training (Olmez et al., 2009;
Korbahti et al., 2008; Korbahti et al., 2007; Korbahti et al., 2007a). Therefore, the number of
neurons in hidden layer should be optimized. For this purpose, the different number of neurons in
the range of 1-14 was tested in hidden layer. According to Fig. 4.149, the optimum number of
neurons in hidden layer is equal to seven as the minimum value of MSE (0.0000133) was
obtained. As a result, in this present study three layered back propagation neural network (5:7:1)
was used for modeling of adsorption process.
Fig. 4.149. Optimum number of neurons in hidden layer. The performance of the network depends on (a) net input, (b) transfer (Tansig) functions and (c)
weight (Traingdm) (Shanmugaprakasha et al., 2013; Jaafarzadegh et al., 2012). Training stops
0 2 4 6 8 10 12 14
0.0000132
0.0000134
0.0000136
0.0000138
0.0000140
0.0000142
0.0000144
0.0000146
MS
E
Number of neurons in hidden layer
Neurons

RESULTS & DISCUSSION 2014
186 | P a g e
when any of these conditions are arises: (a) the maximum number of epochs is reached (b) the
maximum amount of training time is attained (c) performance is decreased to the target and (d)
validation time surpasses more than maximum fails. Learning parameter and momentum
parameter are set to 0.25 and 0.20 respectively during a training phase. Learning and momentum
parameters are improved time to time in the test to achieve the best mean squared error. The
best performance of prediction at testing depends on the training of the neural network
Table - 4.77. Comparison of observed and predicted values for chromium removal by using BP-ANN model
Run Observed Exp values ANN Predicted Values Difference %Error
1 59.0 59.7 -0.7 1.3
2 73.6 72.9 0.7 -1.0
3 57.2 57.3 -0.1 0.2
4 49.6 49.2 0.4 -0.7
5 63.1 62.8 0.3 -0.5
6 70.3 69.8 0.5 -0.7
7 52.9 52.4 0.5 -0.9
8 42.8 42.4 0.4 -0.9
9 48.8 48.2 0.6 -1.2
10 46.6 46.1 0.5 -1.0
11 75.2 74.8 0.4 -0.5
12 54.7 55.0 -0.3 0.5
13 45.2 45.8 -0.6 1.3
14 40.6 40.7 -0.1 0.4
15 59.2 59.1 0.1 -0.1
16 43.2 43.6 -0.4 0.9
17 58.0 58.0 0.0 0.1
18 68.6 68.2 0.4 -0.6
19 55.2 55.3 -0.1 0.2
20 47.6 46.8 0.8 -1.6
21 62.3 61.0 1.3 -2.1
22 70.3 68.0 2.3 -3.3
23 50.8 51.2 -0.4 0.8
24 43.8 44.4 -0.6 1.4
25 46.8 47.0 -0.2 0.5
26 45.8 46.3 -0.5 1.0
27 73.7 70.8 2.9 -3.9
28 55.4 53.2 2.2 -3.9
29 42.1 42.0 0.1 -0.3
30 39.5 39.6 -0.1 0.3
31 61.4 61.3 0.1 -0.2
32 41.4 41.3 0.1 -0.3
33 52.5 53.2 -0.7 1.2
34 61.4 62.6 -1.2 1.9
35 46.3 44.3 2.0 -4.4
36 38.6 39.5 -0.9 2.3
37 68.7 67.5 1.2 -1.8
38 76.7 75.8 0.9 -1.2
39 54.4 55.8 -1.4 2.5
40 45.8 46.3 -0.5 1.0
41 47.7 48.0 -0.3 0.6
42 45.6 46.4 -0.8 1.8
43 70.1 69.4 0.7 -1.1

RESULTS & DISCUSSION 2014
187 | P a g e
4.5.5. Statistical comparison and Performance of models
The correlation plot of comparison between experimental and predicted data in ANN and RSM
modeling is presented in Fig. 4.150. This plot consists of one dashed line called a best-fit line (y =
x, i.e. predicted = experimental data). Correlation values (R2) of ANN and RSM model was found
to be 0.994 and 0.947, respectively. The residuals and error distribution obtained from prediction
of ANN and RSM modeling were presented in Fig. 4.151 and Fig. 4.152. However, both the
models have their own respective advantages. RSM can show the interaction effect between
independent parameters as compared to ANN. Meanwhile, ANN can predict and simulate any
process behavior and overcome RSM limitation without any standard experimental designs. The
44 51.1 52.3 -1.2 2.4
45 54.3 55.4 -1.1 2.1
46 50.6 51.2 -0.6 1.2
47 70.4 69.8 0.6 -0.8
48 52.8 53.7 -0.9 1.6
49 54.0 55.0 -1.0 1.9
50 61.7 61.2 0.5 -0.9
51 45.2 44.5 0.7 -1.5
52 38.6 40.5 -1.9 5.0
53 69.0 70.8 -1.8 2.6
54 76.2 77.3 -1.1 1.4
55 54.3 56.3 -2.0 3.7
56 45.2 44.8 0.4 -1.0
57 47.4 48.2 -0.8 1.7
58 45.2 44.7 0.5 -1.1
59 70.3 69.8 0.5 -0.8
60 51.9 52.4 -0.6 1.1
61 56.3 57.8 -1.5 2.7
62 52.6 53.4 -0.8 1.5
63 70.8 71.2 -0.4 0.6
64 50.8 49.8 1.0 -2.0
65 64.4 65.7 -1.3 2.0
66 68.8 69.4 -0.6 0.9
67 73.1 74.7 -1.6 2.1
68 60.8 61.3 -0.5 0.8
69 68.1 69.0 -0.9 1.3
70 69.2 70.3 -1.1 1.6
71 69.1 69.4 -0.3 0.4
72 76.3 75.8 0.5 -0.7
73 83.7 81.2 2.4 -2.9
74 93.7 94.7 -1.0 1.1
75 95.7 96.0 -0.3 0.4
76 95.2 95.4 -0.2 0.2
77 70.7 72.3 -1.7 2.4
78 72.1 74.6 -2.4 3.4
79 78.4 79.6 -1.2 1.6
80 70.3 69.8 0.5 -0.6
81 71.5 72.3 -0.8 1.2
82 73.9 73.4 0.5 -0.6
83 70.8 70.2 0.6 -0.8
84 71.1 70.4 0.7 -1.0
85 72.6 73.2 -0.6 0.9
86 75.8 75.1 0.7 -0.9

RESULTS & DISCUSSION 2014
188 | P a g e
comparison of best performing model is studied by using few statistical methods (See chapter 3).
These methods are mean square error (MSE), root mean square (RMSE), mean absolute
percentage error (MAPE), average absolute relative error (AARE) and correlation coefficient (R2)
(Natale et al., 2007, Mohammad et al., 2014). The data obtained were presented in Table 4.78.
The lower values of MSE, RMSE, MAPE and AARE suggest that ANN model have notably well
learned the non-linear relationship between the input and output variables than RSM models.
Fig. 4.150. Correlation plot of comparison between experimental and predicted data in ANN and
RSM modeling.
Fig. 4.151. Plot represents the residuals obtained from prediction of ANN and RSM modeling.
40 50 60 70 80 90 100
40
50
60
70
80
90
100
RSM Prediction (R2=0.947)
ANN Prediction (R2=0.994)
------ Y=X (Best Fit)
Actu
al re
mo
va
l %
Predicted removal %
0 20 40 60 80
-10
-5
0
5
10
15
20
RSM residuals
ANN residuals
Re
sid
ua
ls
Experimental runs
(a)

RESULTS & DISCUSSION 2014
189 | P a g e
Fig. 4.152. Plot represents error distribution obtained from prediction of ANN and RSM modeling.
Fig. 4.153. Statistical comparison based on box plot of relative (%) error of ANN and RSM. Table - 4.78. Model performance and comparison of RSM and ANN model.
0 20 40 60 80 100
-20
-15
-10
-5
0
5
10
RSM % error distribution
ANN % error distribution
% E
rror
Experimental runs
(b)
RSM ANN
0
5
10
15
20
Re
lativ
e e
rro
r (%
)
Error parameters Models
RSM ANN
MSE 0.108 0.012
RMSE 0.021 0.009
MAPE 0.031 0.016
AARE 0.027 0.013
R2 0.9483 0.9943
Relative error%
Statistical
comparison Count
Mea
n Median Variance
Standard
Error
Standard
Deviation
LCI
95%
UCI
95% Max Min
RSM 86 2.680 1.533 9.158 0.326 3.026 2.030 3.329 18.25 0.017
ANN 86 1.374 1.068 1.043 0.110 1.021 1.55 1.593 5.028 0.077

RESULTS & DISCUSSION 2014
190 | P a g e
A statistical comparison based on box plot of relative (%) error (Fig. 4. 153), standard error and
standard deviation (Table 4.78) also suggest that ANN model have notably capture the
relationship very well than RSM modeling. Thus from the statistical comparison study, it could be
concluded that ANN model is best fitted than RSM model.
4.5.6. Confirmatory experiments A confirmation experiment with a sample size of ten has been conducted to confirm the predictive
relationship. The 75% confidence interval of confirmation experiments (CICE) is calculated by
using the equation represented below (Ross, 1988; Roy et al., 1990; Krishnaiah and
Shahabudeen, 2012).
R
1
effn
1eV)ef,1(FCECI
Where, Fα (1, Fe) = F ratio at the confidence level of (1-α) against degrees of freedom (DOF) 1
and error degree of freedom, Fe, R = sample size for confirmation experiments, Ve = error
variance, n = total number of trials, and DOF = total degrees of freedom associated in the
estimate of mean response.
CICE is estimated as 29.85. Therefore, the predicated confidence interval for confirmatory
experiments is:
29.26 < µ < 88.96
The actual average of ten adsorption efficiency values of confirmation test is found to be 87.97.
Since the overall average values of the response characteristic in the confirmation test fall well
within the 75% CICE, it is confirmed that predictive equation obtained by adopting RSM procedure
can be used for prediction of response for any parametric combination.

SUMMARY 2014
191 | P a g e
CHAPTER-5 5. SUMMARY
Water is vital natural resources for any living organism; therefore clean water for drinking purpose
is a major challenge for the human society. The pollution due to heavy metals in all segments of
environment especially in water environment is known fact as water sources are the last
destination for any waste. Among the various heavy metals, arsenic and chromium are priority
water pollutants which have direct impact on human health. Considering the above facts in mind an
attempt has been made to synthesize five new hybrid material and composite and used as an
adsorbent to remove these ions separately from water. The mathematical modelling has been
utilized for optimization and prediction.
The selection of starting material for synthesis of adsorbent was ascertained from extensive
literature review. A series of hybrid materials were prepared by using different molar concentration
of the starting material with co-precipitation, sol gel and microwave assisted techniques, but one
material was chosen based on the ion exchange capacity, particle size and high surface area to be
used as an adsorbent in batch mode of experiment. The batch experiments were conducted as
function of adsorbent dose, pH, temperature, initial concentration and contact time to find the
optimum condition for the removal of arsenic (III) and chromium (VI) by the materials.
Five samples of zirconium (IV) oxide ethanolamine (ZrO-EA) hybrid material are prepared by using
different molar concentration of ethanolamine and zirconium oxychloride but the material
synthesized with 0.8 M and 0.4 M has been used. The particle size of the material is 160 nm and
exhibits surface area of 201.6 m2/g. The number of moles of zirconium and ethanolamine are
0.866×10⁻³ and 1.2702×10⁻³ respectively in the material. The thermal stability and presence of
organic moiety is confirmed from TG-DTA studies. The XRD studies confirmed the poor crystalline
nature of the material. The SEM and corresponding EDX studies before and after adsorption
clearly indicates the adsorption of arsenic on the surface of the material. From FTIR studies it is
concluded that NH2+ group play an important role in adsorption process. Batch adsorption
experiments for removal of arsenic (III) using initial arsenic concentration of 10 mg/L, 50 mg/L and
100 mg/L was carried out by changing solution parameters. The removal of arsenic (III) increases
with increase in adsorbent dose but 0.7g/100 mL is found to be the optimum dose. It is found that
there is no removal at pH lower than 2 and almost 98.98 % removal at pH 7. It was found that 95 %
arsenic (III) removal occurs in first 10 min with an equilibrium time of 50 min of removal process. In
order to examine the order of arsenic (III) adsorption process, experimental data are used in
various kinetics models. Based on the correlation value, it was found that arsenic (III) adsorption
follows first order rate equation. The Weber-Morris equation is used to understand the existence of
Intraparticle diffusion. The higher value of Kp suggest that Intraparticle diffusion is not the sole rate-
limiting step for the adsorption of arsenic (III). The arsenic (III) removal is found to increase and

SUMMARY 2014
192 | P a g e
reaches 99.82 % with increase in temperature from 25 to 45 oC, suggesting endothermic nature of
the adsorption process. On the basis of the thermodynamic parameters, the adsorption process is
found to be spontaneous and feasible in nature. Langmuir adsorption isotherm is best fitted with
correlation value (R2) of 0.972, with a maximum adsorption capacity of 0.25002 mg/g. DR isotherm
study suggests Ion exchange (chemical interaction) process. The equilibrium dimensionless
parameter also suggests favorable nature of adsorption process. The presence of co-existing ions
reduced the arsenic (III) adsorption in the following order of calcium > potassium > sodium >
magnesium for cations and nitrate > chloride > sulphate > carbonate > bicarbonate for anions. The
regeneration studies suggest 100% desorption and the easy regeneration takes place in the pH 2.
The reusability study indicates that the material can be used up to 3 cycles.
The hybrid material, zirconium polyacrylamide (ZrPACM-43) is synthesized by modified sol gel
technique and used for the removal of arsenic (III) from water. Based on the particle size, specific
surface area, the ZrPACM-43 out of six materials is selected for adsorption studies. The specific
surface area of the material is 341 m2/g and a particle size of 43.67 nm. The material is chemically
stable in all acids and alkali. The TGA/DTA analysis revealed that the presence of organic
compound in the material. The zero point surface charge density is recorded around 4.8 (pHzpc).
Hence, it is concluded that surface exhibits positive charge below pH 5 and acquires negative
charge above pH 5. XRD analysis confirms the crystalline natures of the material both before and
after adsorption of arsenic (III) with normal crystallite sizes of 53.60 nm and 238.00 nm. FTIR
studies revealed that the presence of metal oxygen bond at finger print region and formation of a
spike at ~3439.28 cm -1 after adsorption indicates the coordination of arsenic (III) with NH groups.
Heterogeneity of the surface after adsorption in SEM study indicates the adsorption of arsenic (III).
Batch adsorption experiments are carried out to know the optimum condition for the removal of
arsenic (III). The optimum dose is 13 g/L with a maximum removal of 98.2% and the pH is found to
decrease slightly after adsorption. The removal efficiency decreases with increase in solution pH
and the highest removal of 97.06% occours at pH 5. It is found that 98.67% arsenic (III) removal
occurs in first 60 minutes with an equilibrium time of 120 minutes. The second order kinetic model
is best fit model to describe the adsorption process. The Intraparticle diffusion studies suggest that
Intraparticle diffusion is not the sole rate-limiting step for the adsorption of arsenic (III). The effect
of temperature on adsorption studies indicates endothermic nature. The thermodynamic parameter
data indicates the spontaneous nature of the adsorption process. The mean free energy (E) of
787.01kJ/mol supports the above studies. The experimental data are best fitted to Freundlich
isotherm with a correlation value (R2) of 0.989 and standard deviation value of 1.43. The
favourable nature of adsorption process is confirmed from the 1/n (0.804) and Freundlich constant
value (0.20). DR isotherm concludes the chemisorption nature of the adsorption process. The co-
existing ions reduced the arsenic (III) adsorption in the order of sulphate > chloride > calcium >
carbonate > bicarbonate > sodium> nitrate > magnesium. The regeneration of 99.78% occurs at
pH 10 for initial concentration of 10 mg/L. The reusability study indicates that the material can be
used up to 8 cycles. Column studies indicate that the removal efficiency is exhausted after 21h,
SUMMARY 2014
193 | P a g e
26h and 19h for initial concentration 10 mg/L with a bed depth of 15 cm and flow rate of 2 mL/min
respectively. As per the logit method for column studies, the adsorption capacity is 74.0 mg/g. So
the above study concludes that arsenic removal is governed by electrostatic attraction and
complexation process.
The lanthanum-diethanolamine (La-DEA) hybrid material is synthesized by co-precipitation method
by varying different molar concentration of starting precursor. Out of five samples the sample
synthesized by using lanthanum and diethanolamine in the ratio of 1:2 is selected for this study.
The specific surface area of the material is found to be 398.42 m2/g. The TGA and DTA study
indicate the presence of organic moiety in the hybrid material. The SEM-EDX of material after
adsorption confirms the adsorption of chromium onto the material. XRD analysis confirmed the
crystalline nature of the hybrid material and having common composition of lanthanum nitrate,
lanthanum hydroxide and lanthanum oxide. From the FTIR study it is found that, the band at ~
851.84 cm-1 after adsorption is due to Cr-O and Cr2O72- groups present in the material. The zero
point surface density charge (ZPC), indicate the acquiring of positive charge at lower pH and the
surface charge density decreases with increases in the solution pH. Batch adsorption experiments
are carried out to know the optimum condition for chromium (VI) removal by using synthetic and
hand pump water. The highest removal of 99.3% and 99.6% occurs with a optimum dose of 8 g/L
for initial concentration of chromium (VI) 10 mg/L and 3.052 mg/L for synthetic water and water
collected from field (Hand pump water) respectively. The removal efficiency of the material shows
highest removal of 98.58% and 96.76% at pH 5.9. The equilibrium time is 50 minutes. The
adsorption of chromium (VI) by La-DEA hybrid material follows second order kinetic model with a
correlation value (R2) of 0.999. The intraparticle diffusion study indicates that chromium (VI)
adsorption by the intraparticle transport is not the only rate limiting step but, the transport of
adsorbate through the pores of the adsorbent and adsorption on the surface of the material are
also responsible. The highest removal of 98.77% occurs with an initial concentration of 10 mg/L of
chromium (VI) at a temperature of 50 oC. The effect of temperature on adsorption process
indicates the endothermic nature of the process. The adsorption data were best fitted to Langmuir
adsorption isotherm with correlation coefficient value of 0.998 at pH 5. DR isotherm studies
suggest chemisorption nature of the adsorption process. The co-existing anions reduced the
chromium (VI) adsorption in the order of carbonate > bicarbonate > nitrate > phosphate > chloride
> fluoride > sulfate for 10 mg/L. The reusability studies suggest that the material can be utilized
upto four cycles only. Breakthrough studies suggest that the removal efficiency exhausted at 24h
and 19h for a bed depth of 15 cm and flow rate of 2 mL/min respectively for removal of chromium
(VI).
Two mathematical modeling techniques (BP-ANN and CCD-RSM) are utilized for prediction and
optimization of the arsenic and chromium removal from water. Six Ce-HAHCl hybrid materials are
synthesized by sol gel method by using different molar concentration of the precursor. Based on
the specific surface area, ion exchange capacity, the material synthesized with the molar ratio of
2:3 is used in adsorption studies. The TGA/DTA analysis suggests the presence of organic

SUMMARY 2014
194 | P a g e
molecule in the matrix. The SEM studies indicate the porous nature of the material and the
corresponding EDX indicate the adsorption of arsenic on the material after adsorption. The XRD
study of the adsorbent material indicates the crystalline nature of the material with the average
crystallite size of 55.32 nm and 123.18 nm before and after adsorption respectively. FTIR analysis
concluded the major transformation after adsorption of arsenic (III). The zero point surface charge
density of the material is 4.9, which suggest positive charge below pH 4.9 of the material surface.
The highest removal of 98.85% occurs at optimum dose of 9 g/L for initial concentration of 10 mg/L
and at pH 5 the removal percentage is 98.2. The removal percentage increases with increase in
agitation speed and reaches 96.8% at 180 rpm. At equilibrium time of 80 minutes the maximum
removal is 96.4%. The second order kinetic equation with correlation value of (R2) of 0.999
describes the kinetics of the adsorption process. The thermodynamic study indicates the
endothermic nature of adsorption with a maximum removal of 96.32% at 60 0C. The
thermodynamic parameters indicate the spontaneous and feasible nature of adsorption process.
The Langmuir adsorption isotherm is the best fit model to describe the adsorption process with
maximum adsorption capacity of 183 mg/g. The ANN model satisfactorily predicts the trend of
experimental observations. In presence of other ions, the removal percentage decreases in the
order of chloride < nitrate < carbonate < bicarbonate < sulphate. The material can be used upto 5
cycles (>60%) after that the material is required to be regenerated. Column adsorption
experiments suggest the maximum breakthrough of 71h and 52h for bed depth of 10 cm and flow
rate of 5 ml/min, respectively. Artificial neural network modelling indicates that 6-7-1 and 4-7-1
ANN architecture presents good agreement with the predicted values for both batch and column
studies. The absolute relative percentage errors are found to be 0.129 for training and 0.292 for
testing in batch studies. Similarly in column studies, the absolute relative percentage errors are
found to be 0.00087 and 0.0263 for training and testing respectively. This value signifies the
adequacy of the ANN model.
The chromium (VI) removal by using cerium oxide polyaniline composite (CeO2/PANI) is
undertaken and the results are tested by RSM-CCD and BP-ANN. The experimental design was
performed by using central composite design of response surface methodology. Five numbers of
composites are synthesized by using different composition of starting material. Based on chromium
(VI) exchange capacity the material synthesized with molar concentration of 2:3 is used in batch
and column studies. The material exhibits specific surface area of 110 m2/g and particle size of 183
nm. From TG-DTA studies, it was found that strong weight loss of 67.2% up to 500 ºC attributes to
the degradation of the skeletal polyaniline chain structure. The XRD studies confirmed the partial
crystalline nature of the composite material; it is also observed that crystallinity decreases with
higher 2-theta values, which indicate that CeO2 particles are successfully embedded in polyaniline
matrix. The average crystallite size of the material was found to be 97.2 nm before and 187.2 after
adsorption. The SEM and corresponding EDX studies clearly indicates that the composite material
has a spherical and granular structure before adsorption and formation of aggregates after
adsorption suggest chromium adsorption on the surface of composite material. FTIR studies

SUMMARY 2014
195 | P a g e
indicate the interaction of chromium (VI) species with the functional groups of the material. Batch
studies are carried out according to central composite design which is used to develop a
correlation between five independent variables (dose, pH, time, temperature and initial
concentration) and one output (% removal) as per face centered central composite design (FCCD).
As per the FCCD, eighty-six numbers of experimental runs are conducted. Batch adsorption
studies as per the previous procedure are conducted to know the optimum condition. The
maximum removal of 92.2% occurs at optimum condition: pH 6, dose: 8 g/L, contact time: 60
minutes, temperature: 40 oC and initial concentration: 49 mg/L. The above results are supported by
both ANN and RSM studies. The thermodynamic study concludes the endothermic nature of
adsorption. The second order rate equation is best fitted model to describe the kinetics of the
adsorption process. The thermodynamic parameters indicate the spontaneous and feasible
adsorption process. The positive value of entropy indicates structural modification and increase
affinity in adsorbent towards chromium (VI) species. Negative value of enthalpy and positive value
of entropy suggest that both enthalpy and entropy are responsible for making the ΔG value
negative. The results of RSM and ANN prediction support the experimental results. The Langmuir
isotherm is best fitted model to describe the adsorption process. D-R isotherm studies conclude
chemisorption nature of the adsorption process. Presence of other ions reduces the % removal in
the order nitrate > bicarbonate > sulphate > carbonate > fluoride > chloride. The material shows
poor desorption property and can be reused up to two cycles only. In the RSM modelling, the lack
of fit suggested the quadratic model with F - 0.73 which has been selected as suggested by
software based on correlation value of (R2) 0.9331. Low probability (< 0.05) with model F value
(68.26) proposes the model is significant and accurate according to analysis of variance (ANOVA).
The source contribution in % removal concluded that dose, pH and temperature contributes more
than 90 % but variable time and concentration have less contribution in influencing removal making
the variables insignificant. On the basis of model, the optimum removal of 93.9% is possible with a
dose = 8.2 g/L, pH = 6, time = 60 minutes, temperature = 40 ºC and initial concentration = 49 mg/L.
On the basis of minimum value of MSE (0.0000133), the optimum number of neurons in hidden
layer is seven which is used for ANN modelling. Hence, the three layered back propagation neural
network with architecture of 5-7-1 is used for modelling. When the results of both the model is
compared, it is concluded that ANN model predict better than RSM model based on high
correlation value. On the basis of statistical comparison based on box plot of relative (%) error,
standard error and standard deviation also suggest that ANN model work better than RSM. Ten
confirmatory experiments are carried out keeping the above optimum conditions and it is found that
response characteristic in the confirmation test fall well within the 75% CICE.
From the above discussion, it is clear that the hybrid materials and composite are excellent
adsorbent for the removal of arsenic and chromium from water by batch and column mode. Hence
these materials have commercial potential and can be used for removal of chromium (VI) and
arsenic (III) irrespective of the concentration.

FUTURE WORK 2014
196 | P a g e
CHAPTER-6
FUTURE WORK
1. To develop novel environment friendly adsorption media for the purpose of water
treatment.
2. To develop the mechanism of removal process.
3. To carry out biosorption study using different microbial organism in removal of heavy
metal ions and other toxic ions from water.
4. To develop a working product for efficient removal of heavy metals and other toxic ions
from water.
5. To use, design and study other mathematical algorithms and predictive models for
prediction and optimization of removal efficiency.
6. To develop engineering prototype for the home water purification system.

REFERENCES 2014
197 | P a g e
CHAPTER-7
7. REFERENCES Abbasi, S., Bahiraei, A., 2012. Ultra trace quantification of chromium(VI) in food and water
samples by highly sensitive catalytic adsorptive stripping voltammetry with rubeanic acid, Food Chemistry, 133, 3, 1075-1080
Aber S., Amani-Ghadim A.R., Mirzajani V., 2009. Removal of Cr (VI) from polluted solutions by electrocoagulation: modeling of experimental results using artificial neural network, J. Hazardous Mater., 171, 484–490.
Adschiri, Y. Hakuta, K. Sue, K. Arai, 2001. Hydrothermal synthesis of metal oxide nanoparticles at supercritical conditions, J. Nanoparticle Research, 3, 227–235.
Agency for Toxic Substances and Disease Registry (ATSDR). 1998. Toxicological Profile for Chromium. U.S. Public Health Service, U.S. Department of Health and Human Services, Atlanta, GA.
Ahmad, R., 2005. Sawdust: cost effective scavenger for the removal of chromium (III) ions from aqueous solutions, Water Air Soil Pollu., 163, 169–183.
Ahuja, Satinder, 2014. Chapter 1 - Overview: Water Reclamation and Sustainability, In Water Reclamation and Sustainability, edited by Satinder Ahuja, Elsevier, Boston, 1-18
Alberti, E. Torracca, A. Conte, 1966. Stoichiometry of ion exchange materials containing zirconium and phosphate, J. Inorganic and nuclear chemistry, 28 (2), 607–613.
Aleboyeh A., Kasiri M.B., Olya M.E., Aleboyeh H., 2008. Prediction of azo dye decolorization by UV/H2O2 using artificial neural networks, Dyes Pigments 77, 288–294.
Aleboyeh, N. Daneshvar, M.B. Kasiri, 2008. Optimization of C.I. Acid Red 14 dye removal by electrocoagulation batch process with response surface methodology, Chemical eng. pro., 47, 827–832.
Alexander, T., Hai, F.I., Al-aboud, T. M., 2012. Chemical coagulation-based processes for trace organic contaminant removal: current state and future potential, J. Environ. Manage., 111, 2012, 195-207.
Allen, S. J., Whitten, L., McKay, G., 1998. Production and characterization of activated carbons a review. Develop.Chem.Eng.Miner.Process.6:231-261
Americal Publich Health Association (APHA), 1912, Standard Methods of Water Analysis in 1912 (Second Edition).
Amiri, M.M. Rahman, H. Bornick, E. Worch, 2004. Sorption behaviour of phenols on natural sandy aquifer material during flow-through column experiments: the effect of pH, Acta Hydroch Hydrob, 32(3), 214 – 224.
Andrade, A., Stigter, T., 2013. The distribution of arsenic in shallow alluvial groundwater under agricultural land in central Portugal: insights from multivariate geostatistical modeling. Sci Total Environ, 449, 37-59
Aposhian, H.V., Maiorino, R.M., Dart, R.C., Perry, D.F, 1989. "Urinary excretion of meso-2, 3-dimercaptosuccinic acid in human subjects". Clinical pharmacology and therapeutics,. 45 (5), 520 – 6.
Arcibar-Orozco, Javier A., Josue, Delgado-Balbuena, Rios-Hurtado, Jorge C., Rangel-Mendez, J. Rene, 2014. Influence of iron content, surface area and charge distribution in the arsenic removal by activated carbons, Chemical Engineering J., 249, 201-209
Argun, M.E., Dursun, S., Ozdemir, C., Karatas, M., 2007. Heavy metal adsorption by modified oak sawdust: thermodynamics and kinetics, J. Hazard. Material, 141, 77–85.
Ashraf, M. M., Hala, A. M. A., 2010 Ultrastructure changes in hepatocytes of catfish clarias gariepinus from lake Mariut, Egypt, J. Environ. Biol. 31, 715-720.
Asli, T.H. O., Ercan, O., Esra, B., Ulker, C., 2013. Removal of As(V) from aqueous solution by activated carbon-based hybrid adsorbents: Impact of experimental conditions, Chemical Eng. J., 223, 116 – 128.
ATSDR, 1993. Toxicological profile for chromium. U.S. Department of Health & Human Services, Public Health Service, Agency for Toxic Substances and Disease Registry.
ATSDR, 2000. Toxicological profile for chromium. U.S. Department of Health & Human Services, Public Health Service, Agency for Toxic Substances and Disease Registry.
Aurelian, F., 2007. Mathematical modeling of uranium adsorption on zeolite from liquid phase, In: Ruren Xu, Zi Gao, Jiesheng Chen and Wenfu Yan, Editor(s), Studies in Surface Sci. and Catalysis, 170, 1693-1698

REFERENCES 2014
198 | P a g e
Awual, M. R., El-Safty, S.A., Jyo, A., 2011. Removal of trace arsenic(V) and phosphate from water by a highly selective ligand exchange adsorbent, J. Environmental Sciences, 23, 12, 1947-1954
Babu, B.V., Gupta, S., 2008. Removal of Cr (VI) from wastewater using activated tamarind seeds as an adsorbent, J. of Environment Engineering Sci., 7, 553–557.
Baciocchi, R., Chiavola, A., Gavasci, R., 2005. Ion exchange equilibrium of arsenic in the presence of high sulphate and nitrate concentrations. Water Science Technology: Water Supply, 5 (5), 67-74
Badruzzaman, P. Westerhoff, D. R.U. Knappe, 2004. Intraparticle diffusion and desorption of arsenate onto granular ferric hydroxide (GFH), Water Research, 38, 4002-4012.
Bajpai, P., 2014. Chapter 14 - Water Reuse, Wastewater Treatment and Closed-Cycle Operation, In Recycling and Deinking of Recovered Paper, edited by Pratima Bajpai, Elsevier, Oxford, 251-269
Bassi, Nitin, Kumar, M. D., Sharma, A., Pardha-S., P., 2014. Status of wetlands in India: A review of extent, ecosystem benefits, threats and management strategies, J. Hydrology: Regional Studies, 2, 1-19
Bayet A, Slosse A., 1919. L’intoxication arsenicale dans les indusries de la houille et de sesderives (intoxication houillere arsenicale). Comptes Rendus de science, (Paris), 168:704–6.
Bayramoğlu, G., Arica, M. Y., 2007. Kinetics of mercury ions removal from synthetic aqueous solutions using by novel magnetic p(GMA-MMA-EGDMA) beads, Journal of Hazardous Materials, 144, 1–2, 449-457
Becker, P., 2014. Chapter 3 - Our Sustainability Challenges, In Sustainability Science, edited by Per Becker, Elsevier, 2014, 29-56
Berner, T.O., Murphy, M.M., Slesinski, R., 2004. Determining the safety of chromium tripicolinate for addition to foods as a nutrient supplement, Food and Chemical Toxi., 42, 6, 1029-1042
Bhatti, M. S., Kapoor, D., Kalia, R. K., Reddy, A. S., Thukral, A. K., 2011. RSM and ANN modeling for electrocoagulation of copper from simulated wastewater: Multi objective optimization using genetic algorithm approach, Desalination, 274, 1–3, 74-80
Bhatti, M.S., Reddy, A.S., Thukral, A.K., 2009. Electrocoagulation removal of Cr(VI) from simulated wastewater using response surface methodology, J. Hazard. Mater. 172 (2009) 839–845.
Bhaumik, M., Setshedi, K., Maity, A., Onyango, M. S., 2013. Chromium(VI) removal from water using fixed bed column of polypyrrole/Fe3O4 nanocomposite, Separation and Purification Tech., 110, 11-19
BIS, (Bureau of Indian Standards) 10500, 1991. Indian standard drinking water specification; First revision. Bureau of Indian Standard publication (1-8), New Delhi, India.
Boparai, H. K., Joseph, M., Carroll, D.M. O’., 2011. Kinetics and thermodynamics of cadmium ion removal by adsorption onto nano zerovalent iron particles, J. Hazardous Materials, 186 (1), 458-465.
Bordoloi, S. K. N., Gogoi, S., Dutta, R. K., 2013. Arsenic and iron removal from ground water by oxidation-coagulation at optimized pH: Laboratory and field studies, J. Hazardous Material, 260, 618-626.
Brinker, C. J., Scherer, G. W., 1990. Sol-Gel Science - the physics and chemistry of sol-gel processing, Academic Press, Boston
Brum, C., Capitaneo, J.L. and Oliveira, J.F., 2010. Removal of hexavalent chromium from water by adsorption onto surfactant modified montmorillonite. Minerals Eng., 23(3) 270-270-272.
Calero, M., Hernáinz, F., Blázquez, G., Tenorio, G., Martín-Lara, M.A., 2009. Study of Cr (III) biosorption in a fixed-bed column, J. Hazardous Materials, 171, 1–3, 886-893
Camargo, C.L.M., Resende, N. S. d., Oliveira, A. G. d., Salim, V. M. M., Tavares, F. W., 2014. Investigation of adsorption-enhanced reaction process of mercury removal from simulated natural gas by mathematical modeling, Fuel, 129, 129-137.
Cantu, M., Lopez-Salinas, E., Valente, J.S., 2005. SOx removal by calcined Mg-AIFe hydrotalcite-like materials: effect of the chemical composition and the cerium incorporation method. Environment Science Tech., 39 (24), 9715–9720.
Carja, G., Nakamura, R., Niiyama, H., 2005. Tailoring the porous properties of iron containing mixed oxides for As(V) removal from aqueous solutions. Micropor. Mesopor. Mater. 83 (1–3), 94–100.

REFERENCES 2014
199 | P a g e
Cavani, F., Trifiro, F., Vaccari, A., 1991. Hydrotalcite-type anionic clays: preparation, properties and applications. Catalysis Today, 11/2, 173-301.
Central Pollution Control Board, (CPCB), 2011. India central pollution control board (CPCB), New Delhi, India, Annual Report.
Chakraborty, S., Dasgupta, J., Farooq, U.,Sikder, J., Drioli, E., Curcio, S., 2014. Experimental analysis, modeling and optimization of chromium (VI) removal from aqueous solutions by polymer-enhanced ultrafiltration, J. Membrane Science, 456, 139-154
Chen, S., Yue, Q., Gao, B., Li, Q. and Xu, X., 2011. Removal of Cr (VI) from solution using modified corn stalks: Characteristic, equilibrium, kinetic and thermodynamic study. Chemical Engineering J., 168 (3), 1055-1063.
Chen, S., Yue, Q., Gao, B., Li, Q., Xu, X., Fu., 2012. Adsorption of hexavalent chromium from aqueous solution by modified corn stalk: A fixed-bed column study, Bioresource Tech.,113,114-120
Chen, Y., Wu, H., Gan, S., Wang, Y., Sun, X., 2012. A hybrid mesoporous membrane synthesized by microwave-assitance:preparation and characterization, J. Membrane Science, 403, 94-100.
Cho, K.H., Sthiannopkao, S., Pachepsky, Y. A., Kim, Kyoung-W., Kim, Joon H., 2011. Prediction of contamination potential of groundwater arsenic in Cambodia, Laos, and Thailand using artificial neural network, Water Res., 45, 17, 5535-5544
Chon, C. M., Kim, J. G.; Moon, H. S., 2006. Kinetics of Chromate Reduction by Pyrite and Biotite under Acidic Conditions. Applied. Geochemistry, 21, 1469-1481.
Choong, Y.S.T., Chuah, G.T., Robia, H.Y, Koay, L. F. G., Azni, I., 2007. Arsenic toxicity, health hazards and removal techniques from water: an overview. Desalination 217, 139 - 166.
Choppala, G., Bolan, N., Park, Jin H., 2013. Chapter Two - Chromium Contamination and Its Risk Management in Complex Environmental Settings, In: Donald L. Sparks, Editor(s), Advances in Agronomy, Academic Press, 120, 129-172.
Chu, K.H., 2003. Prediction of two-metal biosorption equilibria using a neural network, European J. of Mineral Processing and Environmental Prot. 3, 119–127.
Coope, I.D., Price, C.J., 2002. “Positive bases in numerical optimization”, Computational Optimization & Applic., 21 (2), 169–176
Correia, V.M., Stephenson, T., Judd, S.J., 1994. “Characterisation of Textile Wastewaters – A Review.” Environmental Tech., 15(10), 917-929.
Daneshvar, A.R. Khataee, Djafarzadeh, N., 2006. The use of artificial neural network (ANN) for modeling of discoloration of textile dye solution containing C.I. basic yellow 28 by electrocoagulation process, J. Hazardous Mat., 137, 1788–1795.
Dantas, T.N. D. C., Neto, A.A. D., Moura, M.C.P. De A., Neto, E.L. B., Paiva, E.D. T., 2001. Chromium adsorption by chitosan impregnated with micro emulsion, Langmuir. 17, 4256–4260.
Daus B., Wennrich R., Weiss H., 2004. Geochemical occurrence of arsenic in groundwater of Bangladesh: sources and mobilization processes. J. Geochemical Exploration, 77, 109–131.
De, A.K., Chakraborty, P., 2005. Synthetic inorganic ion exchangers. Electrochromatographic separations of metal ions on lanthanum antimonite-impregnated paper, Electrophoresis 2 (5- 6), 330–332.
Deng, S., Bai, R., 2004. Removal of trivalent and hexavalent chromium with aminated polyacrylonitrile fibres: performance and mechanisms. Water Res., 38, 2424-2432
Desesso J.M., Jacobson C.F., Scialli A.R., Farr C.H., Holson J.F., 1998. An assessment of the developmental toxicity of inorganic arsenic, Reproductive Toxic., 12, 385– 433.
Dittert, I.M., Vilar, Brandão, H. de L., Pina, F., da Silva, E. A.B., de Souza, S.M.A. G.U. , de Souza, A. A. U., Botelho C.M.S., Boaventura, R.A.R., Vilar, V. J. P., 2014. Integrated reduction/oxidation reactions and sorption processes for Cr(VI) removal from aqueous solutions using Laminaria digitata macro-algae, Chemical Engineering J., 237, 1, 443-454
Dogan, M., Dogan, A.U., 2007. Arsenic mineralization, source, distribution, and abundance in the Kutahya region of the Westren Anatolia, Turkey. Environmental. Geochem. Health, 29(2), 119-129.
Dong, Y. Y., He, J., Sun, S. L., Ma, M. G., Fu, L. H., Sun, R. C., 2013. Environmentally friendly microwave ionic liquids synthesis of hybrids from cellulose and AgX (X=Cl, Br), Carbohydrate Poly., 98, 168-173.
Douglas G., Brookins, 1986. Geochemical behavior of antimony, arsenic, cadmium and thallium: Eh-pH diagrams for 25°C, 1-bar pressure, Chemical Geology, 54, 3–4, 271-278

REFERENCES 2014
200 | P a g e
Dousova´, B., Machovcˇ, V., Kolousˇek, D., Kovanda, F., Dornicˇa´ k, V., 2003. Sorption of As(V) species from aqueous systems. Water Air Soil Pollu., 149 (1–4), 251–267.
Duan, E., 2006, Layered double hydroxides, in: X. Duan, D.G. Evans (Eds.), Structure and Bonding,119, 1–234
Dubinin, M. M. and Stoeckli, H. E., 1980. Homogenous and Heterogenous Micropore Structures in Carbonaceous Adsorbents. J. Colloid and Interface Sci., 75:34-42.
Dubinin, M. M., 1975. Progress in Surface and Membrane Science, D. A. Cadenhead et al. (Eds.), academic Press, New York, 1-70.
Dubinin, M.M., 1966. Chemistry and physics of Carbon, P.L. Walker, Jr. (Ed.), Marcel Dekker, New York, 2:51-120.
Duranoğlu, D., Kaya, İsmet Gül B., Beker, U., Şenkal, Bahire F., 2012. Synthesis and adsorption properties of polymeric and polymer-based hybrid adsorbent for hexavalent chromium removal, Chemical Engineering J., 181– 182, 103– 112.
Eren, E., Gumus, H., Ozbay, N., 2010. Equilibrium and thermodynamic studies of Cu(II) removal by iron oxide modified sepiolite, Desalination, 262, 43-49
Erhan, D., Kobya, M., Elif, S., Ozkan, T., 2004. Adsorption kinetics for Cr (VI) removal from aqueous solution on activated carbon prepared from Agro wastes. Water SA, 30 (4), 533-541.
Escalante, C. A. Q., Soto, V., Cruz, W. De la, Porras, G. R., Manriquez, R., Salazar, S. G.,2009. Synthesis of hybrid adsorbents combining sol-gel processing and molecular imprinting applied to lead removal from aqueous streams, Chemistry of Mater., 21,1439-1450.
Fan, H. T., Wu, J. B., Fan, X. L., Zhang, D. S., Su, Z. J., Yan, F., Sun, T., 2012. Removal of cadmium (II) and lead(II) from aqueous solution using sulphur-functionalized silica prepared by hydrothermal assisted grafting method, Chemical Engineering J., 198, 355-363.
Fan, L., L., Sun, M., Qiu, H., Xiangjun, L., Huimin, D., Chuannan, L., 2013. Adsorbent for chromium removal based on graphene oxide functionalized with magnetic cyclodextrin–chitosan, Collo. & Surfaces B: Bio interfaces. 107, 76–83.
Fergusson, J.E., 1990. The Heavy Elements: Environmental Impact and Health Effects. Pergamon Press, Oxford.
Ficicilar, B., Dogu, T., 2006. Breakthrough Analysis for CO2 Removal by Activated Hydrotalcite and Soda Ash. Catalysis Today, 115, 274– 278.
Forster, C.F., Sharma, D.C., 1995. Column studies into the adsorption of chromium(VI) using sphagnum moss peat, Bioresource tech., 52, 261-267.
Francesconi, K.A., Raber, G., 2013. 17 - Arsenic in foods: current issues related to analysis, toxicity and metabolism, In Woodhead Publishing Series in Food Science, Technology and Nutrition, edited by Martin Rose and Alwyn Fernandes, Woodhead Publishing, 414-429, Persistent Organic Pollutants and Toxic Metals in Foods
Freundlich H., 1906. About the adsorption in solutions, Z. Phys. Chem. 57,384 – 470. Fuerstenau, D.W., Chander, S., Abouzeid, A.M., 1979, The recovery of fine particles by physical
separation methods, Beneficiation of Mineral Fines—Problems and Research Needs, AIME, New York, 3–59.
Gad, S.C., 2014. Chromium, In Encyclopedia of Toxicology (Third Edition), edited by Philip Wexler, Academic Press, Oxford, 952-954
Gandhi, R. M., Viswanathan, N., Meenakshi, S., 2010. Adsorption mechanism of hexavalent chromium removal using Amberlite IRA 743 resin, Ion exchange let., 3, 25-35.
García-Vaquero, N., Lee, E., Castañeda, R. J., Cho, J., López-Ramírez, J.A., 2014. Comparison of drinking water pollutant removal using a nanofiltration pilot plant powered by renewable energy and a conventional treatment facility, Desalination, 347, 94-102
Garelick, H., Jones, H., Dybowska, A., Valsami-Jones, E., 2008. Arsenic pollution sources. In Reviews of Environmental Cont.,197,17-60.
Gasser, M.S., Morad, GH.A., Aly, H.F., 2007. Batch kinetics and thermodynamics of chromium ions removal from waste solutions using synthetic adsorbents, J. Hazardous Materials, 142(1–2), 118-129
Gessner, M.O., Hinkelmann, R., Nützmann, G., Jekel, M., Singer, G., Lewandowski, J., Nehls, T., Barjenbruch, M., 2014. Urban water interfaces, Journal of Hydrology, 514, 226-232
Geyikçia, F., Kılıçb, E., Çoruhc, S., Elevli, S., 2012. Modelling of lead adsorption from industrial sludge leachate on red mud by using RSM and ANN, Chemical Engineering J., 183, 53–59

REFERENCES 2014
201 | P a g e
Golbaz, A. J. Jafari, M. Rafiee, R. R. Kalantary, 2014. Separate and simultaneous removal of phenol, chromium, and cyanide from aqueous solution by coagulation/precipitation, Mechanisms and Theory, 253, 251-257.
Gomes, M. P., Carneiro, M. M. L.C., Garcia, Q. S., 2014. , Chapter 17 - Trace Elements Tolerance Modulated by Antioxidant System in Plants, In Oxidative Damage to Plants, edited by Parvaiz Ahmad, Academic Press, San Diego, 2014, 523-540
Gomez-Gonzalez, S. E., Carbajal-Arizaga, G. G., Manriquez-Gonzalez, R., Hernandez, W. D. l. C., Gomez-Salazar, S., 2014. Trivalent chromium removal from aqueous solutions by a sol–gel synthesized silica adsorbent functionalized with sulphonic acid groups, Materials Research Bulle., 59, 394-404
Gonzalez, S. E. G., Arizaga, G. G. C., Gonzalez, R. M., Hernandez, W. D. C., Salazar, S. G., 2014. Trivalent chromium removal from aqueous solutions by a sol-gel synthesized silica adsorbent functionalized with sulphonic acid groups, Material Research Bullet., 59, 393-404.
Gorashi Faris, Abdullah Alias, 2012. Prediction of water quality index using back propagation network algorithm case study: Gombak River, Journal of Engineering Science and Technology 7(4), 447 - 461.
Goswamee, R. L., Sengupta, P., Bhattacharyya, K. G., Dutta, D. K. 1998. Adsorption of Cr(VI) in Layered Double Hydroxides. Applied Clay Science,13, 21–34.
Gregg, S.J. and Sing, K.S.W., 1982. Adsorption, Surface Area and Porosity, 2nd Ed., Academic Press, London
Gubicza, J., Szépvölgyi, J., Mohai, I., Zsoldos, L., Ungár, T., 2000. Particle size distribution and dislocation density determined by high resolution X-ray diffraction in nanocrystalline silicon nitride powders, Mater. Science and Eng., A, 280, 2, 263-269
Guha Mazumder, D.N., 2007. Arsenic and non-malignant lung diseases. J. Environ. Sci. Health Part A, 42,1859-1867.
Guo, F.Z. Zhang, Peng, Q., Xu, S.L., Lei, X.D., Evans, D.G., Duan, X., 2011. Layered double hydroxide/egg shell membrane: an inorganic bio composite membrane as an efficient adsorbent for Cr(VI) removal, Chemical Engineering J., 166, 81–87.
Gupta, M., Sharma, P., Sarin, N.B., Sinha, A.K., 2009. “Differential response of arsenic stress in two varieties of Brassica juncea L. Chemosphere, 74(9), 1201-1208.
Gupta, V.K., Agarwal, S., Saleh, A. Tawfik., 2011. Chromium removal by combining the magnetic properties of iron oxide with adsorption properties of carbon nanotubes, Water Res., 45, 2207-2212
Güven, A. P., Tanyolaç. A., 2008. Electrochemical treatment of deprotonated whey wastewater and optimization of treatment conditions with response surface methodology, J. of Hazardous Mat., 157, 69–78.
Haas, K.-H., 2000. Hybrid inorganic-organic polymers based on organically modified Si-alkoxides. Advanced Eng. Mater., 2, 571–582.
Hamadi, N.K., Chen, X.D., Farid, M.M., Lu, M.G.Q., 2001. Adsorption kinetics for the removal of chromium(VI) from aqueous solution by adsorbents derived from used tyres and sawdust, Chem. Eng. J., 84 (2001) 95–105.
Hao, J., Han, Mei-Juan, Wang, Chao, Meng, X., 2009. Enhanced removal of arsenite from water by a mesoporous hybrid material – Thiol-functionalized silica coated activated alumina, Micro. and Mesoporous Mater., 124, 1–3, 1-7
Helfferich, F., 1962. Ion Exchange, Dover Publications, New York Hering, J.G., Chiu, V.C., 2000. Arsenic Occurrence and Speciation in a Municipal Ground water
Based Supply System, J. of Environmental Eng. ASCE, 126, 471- 474. Holzwarth, U., Gibson, N., 2011, The Scherrer equation versus the 'Debye-Scherrer equation,
Nature Nanotech. 6, 534 Hong, Jun, Zhu, Zhiliang, Lu, Hongtao, Qiu, Yanling, 2014. Synthesis and arsenic adsorption
performances of ferric-based layered double hydroxide with α-alanine intercalation, Chemical Engineering J., 252, 267-274
Hossain, M. A., Rahman, M. M., Murrill, M., Das, B., Roy, B., Dey, S., Maity, D., Chakraborti, D., 2013. Water consumption patterns and factors contributing to water consumption in arsenic affected population of rural West Bengal, India, Sci. of The Total Env., 463–464
Houri, B., Legrouri, A., Barroug, A., Forano, C., Besse, J.P., 1999. Removal of chromate ions from water by anionic clays. J. Chim. Phys. PCB 96 (3), 455–463.
Hristovski, K., Westerhoff, P., Möller, T., Sylvester, P., Condit, W., Mash, H., 2008. Simultaneous removal of perchlorate and arsenate by ion-exchange media modified with nanostructured iron hydroxide, J. Hazardous Mater., 152, 1, 397-406
REFERENCES 2014
202 | P a g e
Hu, J., Lo, I. M. C., Chen, G. H. 2007. Performance and Mechanism of Chromate(VI) Adsorption by δ-FeOOH-Coated Maghemite (γ-Fe2O3) Nanoparticles. Separation and Purification Tech., 58, 76–82.
Hu, Y.C., Lo, S.L., Liou, Y.H., Hsu, Y.W., Shih, K., Lin C.J., 2010. Hexavalent chromium removal from near natural water by copper –iron bimetallic particles, Water Res. 44, 3101-3108.
Huang, C.P., Wu, M.H., 1977. The removal chromium (VI) from dilute aqueous solution by activated carbon. Water Res., 11, 673-679.
Huang, G., Shi, J. X., Langrish, T.A.G., 2009. Removal of Cr(VI) from aqueous solution using activated carbon modified with nitric acid. Chemical Engineering J., 152(2-3), 434-439.
Iacob, Vlăduţ-S., 2013. The Wastewater – A Problem of Integrated Urban Water Management, Procedia Economics and Finance, 6, 2013, 436-443
IARC, 1990. IARC Monographs on the evaluation of the carcinogenic risk of chemicals in human, 49, Chromium, Nickel and Welding, Environmental and Experimental Data, Lyon.
IARC, 1998. Overall evaluation of carcinogenicity to humans. As evaluated in IARC monographs volume 1-73. http://www.iarc.htm (updated November 30, 1998).
Iesan, C.M., Capat, C., Ruta, F., Udrea, I., 2008. Evaluation of a novel hybrid inorganic/organic polymer type material in the Arsenic removal process from drinking water, Water Res., 42, 16, 4327-4333.
Inamuddin, Khan S.A., Suiddiqwi, W.A., Khan A.A., 2007. Synthesis, characterization and ion exchange properties of a new and novel organic inorganic hybrid cation exchanger: Nylon 6-6, Zr(IV) phosphate. Talanta 71, 841–847.
Indian minerals year book, 2012, 51st edition, chromite, 1-21 (http://ibm.nic.in/IMYB_2012_Chromite.pdf)
Ingham, B., Toney, M.F., 2014. 1 - X-ray diffraction for characterizing metallic films, In Metallic Films for Electronic, Optical and Magnetic Applications, edited by Katayun Barmak and Kevin Coffey, Woodhead Publishing, 3-38
Inglezakis, V.J., Loizidou, M.D. and Grigoropoulou, H.P., 2004. Ion exchange studies on natural and modified zeolites and the concept of exchange site accessibility. J. of Colloid and Interface Sci., 275(2), 570-576.
IPCS, 1988, Environmental Health Criteria 61 Chromium, WHO, Geneva. Islam, M., Patel, R.K., 2007. Evaluation of removal efficiency of fluoride from aqueous solution
using quick lime, J. Hazard. Mater. 143, 303-310. Isosaari, P., Sillanpää, M., 2012. Effects of oxalate and phosphate on electrokinetic removal of
arsenic from mine tailings, Separation and Purification Tech., 86, 26-34 Jaafarzadeh, N., Ahmadi, M., Amiri, H., Yassin, M.H., Martinez, S. S, 2012. Predicting Fenton
modification of solid waste vegetable oil industry for arsenic removal using artificial neural networks, J. of the Taiwan Institute of Chemical Eng., 43, 6, 873-878
Jain C.K., Ali I., 2000. Arsenic: occurrence, toxicity and speciation techniques, Water Res. 34, 4304–4312.
Jain, M., Garg, V.K., Kadirvelu, K., 2009. Chromium(VI) removal from aqueous system using Helianthus annuus (sunflower) stem waste, J. Hazard. Mater. 162, 365–372.
Jayshree, R.S., Pillai, V.P. M., Nayar, V.U., Odnevall, I., Keresztury, G., 2006. Raman and infrared spectral analysis of corrosion products on zinc NaZn4Cl(OH)6SO4•6H2O and Zn4Cl2(OH)4SO4•5H2O, Mater. Chem. Phys. 99, 474–478.
Jhung, S.H., Jin, T., Hwang, Y. K., Chang, J. S., 2007. Microwave effect in the fast synthesis of microporous materials: which stage between nucleation and crystal growth is accelerated by microwave irradiation, Chemistry - A European J., 13, 4410-4417.
Junaid, S., Qazi, S., Rennie, Adrian R., Cockcroft, Jeremy K., Vickers, M., 2009. Use of wide-angle X-ray diffraction to measure shape and size of dispersed colloidal particles, J.of Colloid and Interface Sci., 338, 1, 105-110
Kabay, N., Arda, M., Saha, B. and Streat, M., 2003. Removal of Cr(VI) by solvent impregnated resins (SIR) containing aliquat 336. Reactive and Functional polym., 54(1),103-115.
Kalavathy, H.M., Regupathi, l., Miranda, L.R., 2009. Modelling, analysis and optimization of adsorption parameters for H3PO4 activated rubber wood sawdust using response surface methodology (RSM), Collo. and surfaces B: Biointer., 70(1),35-45.
Kang, M.J., Chun, K.S., Rhee, S.W., Do, Y., 1999. Comparison of sorption behavior of I– and TcO4 – on Mg/Al layered double hydroxide. Radiochimica Acta, 85 (1–2), 57–63.
Kapaj, S., Petrerson, H., Liber, K., Bhattacharya, P., 2006. Human health effects from chronic arsenic poisoning – A review. J. Environment Science Health Part A, 41:2399-2428.
Karnib, M., Kabbani, A.,Holail, H., Olama, Z., 2014. Heavy Metals Removal Using Activated Carbon, Silica and Silica Activated Carbon Composite, Energy Proc., 50, 113-120

REFERENCES 2014
203 | P a g e
Kartinen, E. O., Martin, C.J., 1995. An overview of arsenic removal processes. Desalination 103, 79–88.
Khezami L., Capart R., 2005. Removal of chromium (VI) from aqueous solution by activated carbons: kinetic and equilibrium studies, J. of Hazard. Material B123, 223–231.
Kickelbick, G., Schubert, U., 2001. Inorganic Clusters in Organic Polymers and the Use of Polyfunctional Inorganic Compounds as Polymerization Initiators, Monatshefte für Chemie,132, 13.
Kim, D.H., Kim, K.W. and Cho, J., 2006. Removal and transport mechanisms of arsenics in UF and NF membrane processes, J. Water Health, 4 (2), 215-223.
Klett, C., Barry, A., Balti, I., Lelli, P., Schoenstein, F., Jouini, N., 2014. Nickel doped Zinc oxide as a potential sorbent for decolorization of specific dyes, methylorange and tartrazine by adsorption process, J. of Environmental Chemical Eng., 2, 2.
Klug, Harold P., Alexander, Leroy E., 1974, X-Ray Diffraction Procedures: For Polycrystalline and Amorphous Materials, Wiley-VCH
Kobya, M., 2004. Removal of Cr (VI) from aqueous solutions by adsorption onto hazelnut shell activated carbon: kinetic and equilibrium studies. Bioresource Techno., 91, 317-321
Kolthoff, I. M., 1932. Theory of Co-precipitation - The formation and properties of crystalline precipitates, The J. Physical Chem., 36, 860-881.
Korbahti, B.K., 2007. Response surface optimization of electrochemical treatment of textile dye wastewater, J. Hazardous Material, 145, 277–286.
Korbahti, B.K., Aktas, N., Tanyolaç, A., 2007a. Optimization of electrochemical treatment of industrial paint wastewater with response surface methodology, J. of Hazardous Mate.. 148, 83–90.
Korbahti, B.K., Tanyolac, A., 2008. Electrochemical treatment of simulated textile wastewater with industrial components and Levafix Blue CA reactive dye: Optimization through response surface methodology, J. Hazardous Material, 151, 422–431.
Korte, N.E. and Fernando, Q., 1991. A review of arsenic (III) in ground water. Critical review. Environmental contribution, 21, 1-39.
Kotas, J., Stasicka, Z., 2000. Chromium occurrence in the environment and methods of its speciation. Environment Pollut., 107, 263-283
Kovanda, F., Kovacsova, E., Kolousek, D., 1999. Removal of Anions from Solution by Calcined Hydrotalcite and Regeneration of Used Sorbent in Repeated Calcination-Rehydration-Anion Exchange Processes. Collection of Czechoslovak Chemical Comm. 1999, 64, 1517–1528.
Kowalski, Krzysztof P., 2014. Chapter 8 - Advanced Arsenic Removal Technologies Review, In Chemistry of Advanced Environmental Purification Processes of Water, edited by Erik G. Søgaard, Elsevier, Amsterdam, 285-337
Krishnaiah, K., Shahabudeen, P., 2012. Applied design of experiments and taguchi methods, PHI Learning, Business & Economics
Kumar, A. S. K., Ramachandran, R., Kalidhasan, S., Rajesh, V., Rajesh, N., 2012. Potential application of dodecylamine modified sodium montmorillonite as an effective adsorbent for hexavalent chromium, Chemical Engineering J., 211–212, 396–405.
Kumar, P. A., Chakraborty, S., 2009. Fixed-bed column study for hexavalent chromium removal and recovery by short-chain polyaniline synthesized on jute fiber, J. Hazardous Mater., 162, 2–3, 1086-1098.
Kumar, P. A., Ray, M., Chakraborty, S., 2007. Hexavalent chromium removal from wastewater using aniline formaldehyde condensate coated silica gel, J. Hazardous Mat., 143, 24–32.
Kumar, S. K., Kakan, S. S., Rajesh, N., 2013. A novel amine impregnated graphene oxide adsorbent for the removal of hexavalent chromium, Chemical Eng. J., 230, 328-337
Lagergren, 1898. About the theory of so called adsorption of soluble substances, kungliga Svenska Vetenskapsakademiens, Handlingar Band, 24 (04), 1–39.
Lagergren, S., 2007. To the theory of so-called adsorption of dissolved substances. The Royal Swedish Academy of Sciences documents, 24, 1 - 39.
Laine, M., 2005. Nanobuilding blocks based on the [OSiO1.5] x (x= 6, 8, 10) octasilsesquioxanes, Journal of Mater. Chem. 15, 3725–3744.
Lakshmanan, D. Clifford, G. Samanta, 2008. Arsenic removal by coagulation – with aluminium, iron, titanium, and zirconium, Journal - American Water Works Association, 100, 2008, 76–88.
Langmuir, 1918. The adsorption of gases on plane surfaces of glass, mica, and platinum, J. American Chemical Soc. 40 (9), 1361 - 1403.

REFERENCES 2014
204 | P a g e
Larraza, I., Gonzalez, M. L., Corrales, T., Marcelo, G., 2012. Hybrid materials: Z Magnetite-polyethylenimine-montmorillonite, as magnetic adsorbents for Cr(VI) water treatment, J. Colloid & Interface Sci., 385, 24-33.
Lay, P.A., Levina, A., 2014. Coordination Chemistry of Chromium, In Reference Module in Chemistry, Molecular Sciences and Chemical Eng., doi:10.1016/B978-0-12-409547-2.11126-6
Lazaridis, N. K., Pandi, T. A., Matis, K. A., 2004. Chromium(VI) Removal from Aqueous Solutions by Mg-Al-CO3 Hydrotalcite: Sorption-Desorption Kinetic and Equilibrium Studies. Ind. Eng. Chem. Res. 2004, 43, 2209– 2215.
Lazaridis, N.K., Asouhidou, D.D., 2003. Kinetics of sorptive removal of chromium(VI) from aqueous solutions by calcined Mg–Al–CO3 hydrotalcite. Water Res. 37 (12), 2875–2882.
Lazaridis, N.K., Matis, K.A., Webb, M., 2001. Flotation of metal loaded clay anion exchangers. Part I: The case of chromates. Chemosphere, 42, 4, 373–378.
Lehmann, M., Zouboulis, A.I., Matis, K.A., 1999. Removal of metal ions from dilute aqueous solutions: a comparative study of inorganic sorbent materials. Chemosphere, 39 (6), 881–892.
Lenoble, V., Laclautre, C., Deluchat, V., Serpaud, B., Bollinger, Jean-C., 2005. Arsenic removal by adsorption on iron (III) phosphate, J. Hazardous Materials, 123, 1–3, 31, 262-268
Li, L., Zhou, G., Weng, Z., Shan, Xu-Y., Li, F., Cheng, Hui-M., 2014. Monolithic Fe2O3/graphene hybrid for highly efficient lithium storage and arsenic removal, Carbon, 67, 500-507
Li, Q. L., Zhang, X., Yan, Y., 2009. Kinetic parameters and mechanisms of the batch biosorption of Cr(VI) and Cr (III) onto Leersia hexandra Swartz biomass, J. Colloid Interface Sci. 333 , 71–77.
Li, Q., Sun, L., Zhang, Y., Qian, Y., Zhai, J., 2011. Characteristics of equilibrium, kinetics studies for adsorption of Hg(II) and Cr(VI) by polyaniline/humic acid composite, Desalination, 266 (1–3), 188-194
Li, Y., Wang, X. P., Luo, Z. Y., Xue, Y. W., Shi, Z. G., 2014. Hierarchically macro/mesoporous hybrid silica spheres for fast capture of heavy metal ions, Mater. Lett., 128, 2014, 140-143.
Linsha V., Suchithra P.S., Mohamed A. P., Ananthakumar S., 2013. Amine-grafted alumino-siloxane hybrid porous granular media: A potential sol–gel sorbent for treating hazardous Cr(VI) in aqueous environment, Chemical Engineering J., 220, 244–253.
Liu, J., Ma, Y., Xu, T., Shao, G., 2010. Preparation of zwitter ionic hybrid polymer and its application for the removal of heavy metal ions from water, J. Hazardous Mat., 178, 1021-1029.
Liu, M., Yang, J.J., Wu, G.Q., Wang, L.Y., 2006. Performance and mechanism of Mg, Al layered double hydroxides and layered double oxides for sulfide anion (S2–) removal. Chin. J. Inorg. Chem. 22, 10, 1771–1777
Liu, Zhong-G., Huang, Xing-J., 2014. Voltammetric determination of inorganic arsenic, TrAC Trends in Analytical Chem., 60, 25-35
Lorenzen, L., Van Deventer, J.S.J., Landi, M. W., 1995. Factors affecting the mechanism of the adsorption of arsenic species on activated carbon, Niner.Eng. 8(4), 557 - 569.
Lv, X. Xue, X., Jiang, G., Wu, D., Sheng, T., Zhou, H., Xu, X., 2014. Nanoscale Zero-Valent Iron (nZVI) assembled on magnetic Fe3O4/graphene for Chromium (VI) removal from aqueous solution, J. Colloid and Interface Sci., 417, 51–59
Ma, Y., Zheng, Yu-Ming, Chen, J.P., 2011. A zirconium based nanoparticle for significantly enhanced adsorption of arsenate: Synthesis, characterization and performance, J. Colloid and Interface Sci.. 354, 785-792.
Maghsoudi, M., Ghaedi, M., Zinali, A., Ghaedi, A.M., Habibi, M.H., 2015. Artificial neural network (ANN) method for modeling of sunset yellow dye adsorption using zinc oxide nanorods loaded on activated carbon: Kinetic and isotherm study, Spec. Acta Part A: Mole. and Biom. Spect., 134, 1-9
Mahadevaiah, N., Venkataramani, B., Jai Prakash, S. B., 2008. Interacation of Chromate on Surfactant Modified Montmorillonite: Breakthrough Curve Study in Fixed Bed Columns. Ind. Eng. Chem. Res., 47, 1755–1759.
Mahmoodi, N. M., Khorramfar, S., Najafi, F., 2011. Amine-functionalized silica nanoparticle: Preparation, characterization and anionic dye removal ability, Desalination, 279, 1–3, 61-68
Maji, S. K., Pal, A., Pal, T., 2008. Arsenic removal from real-life groundwater by adsorption on laterite soil, J. Hazardous Mater. 151(2 – 3), 811- 820.

REFERENCES 2014
205 | P a g e
Malana, M.A, Khosa, M.A., 2011. Ground water pollution with special focus on arsenic, Dera Ghazi Khan-Pakistan. J. Saudi Chem. Soc.,15, 39-47
Malik, U.R., Hasany, S.M., Subhani, M.S., 2005. Sorptive potential of sunflower stem for Cr (III) ions from aqueous solutions and its kinetic and thermodynamic profile, Talanta, 66, 166–173.
Malkoc, E., Nuhoglu, Y., Abali, Y., 2006. Cr(VI) Adsorption by Waste Acorn of Quercus Ithaburensis in Fixed Beds: Prediction of Breakthrough Curves. Chem. Eng. J., 119, 61–68.
Mandal, B.K., Suzuki, K.T., 2002. Arsenic round the world: a review, Talanta, 58, 201–235. Mandal, S., Padhi, T., Patel, R.K., 2011. Studies on the removal of arsenic (III) from water by a
novel hybrid material, J. Hazard. Mater. 192, 899-908. Manju, G.N., Raji, C., Anirudhan, T.S.,1998. Evaluation of coconut husk carbon for the removal
of arsenic from water, Water Res., 32 (10), 3062–3070. Matos, C., Teixeira, C. A., Duarte, A.A.L.S., Bentes, I., 2013. Domestic water uses:
Characterization of daily cycles in the north region of Portugal, Science of The Total Env., 458–460, 444-450.
Maushkar, M.J., 2007. Guidelines for water quality monitoring, central pollution control board (A Government of India organisation), Delhi, India.
Meena, A.K., Kadirvelu, K., Mishra, G.K., Rajagopal, C., Nagar, P.N., 2008. Adsorptive removal of heavy metals from aqueous solution by treated sawdust (Acacia arabica), J. Hazard. Mater. 150, 604–611.
Mehta, L., Allouche, J., Nicol, A., Walnycki ,A., 2014. Global environmental justice and the right to water: The case of peri-urban Cochabamba and Delhi, Geoforum, 54, 158-166
Merrill, J.C., Morton, J.J.P. and Soileau, S.D., 2007. Metals. In A. W. Hayes. Principles and methods of toxicology, 5th edition. CRC Press.
Messina, V., Schulz, P. C., 2006. Adsorption of reactive dyes on titania–silica mesoprous materials, J. Colloid Interface Science, 299, 305 – 320.
Meyn, M., Beneke, K., Lagaly, G., 1990. Anion-Exchange Reactions of Layered Double Hydroxides. Inorg. Chem. 29, 5201–5207.
Miretzky, P., Cirelli, A. F., 2010. Cr(VI) and Cr(III) removal from aqueous solution by raw and modified lingo cellulosic materials: A review, J. Hazardous Materials 180, 1–19.
Mitra, T., Singha, B., Bar, N., Das, S. K., 2014. Removal of Pb(II) ions from aqueous solution using water hyacinth root by fixed-bed column and ANN modeling, J. Hazardous Materials, 273, 94-103
Młyniec, K., Davies, C. L., Sánchez, I. G. d. A., Pytka, K., Budziszewska, B., Nowak, G., Essential elements in depression and anxiety. Part I, Pharmacological Reports, Volume 66, 4, 534-544
Mohammad S. S., Daud, W. M. A. W., Shamiri, A., 2014. A review of mathematical modeling of fixed-bed columns for carbon dioxide adsorption, Chemical Engineering Research and Design, 92, 5, 961-988
Mohammad, A. R., Mohammad, M. R., Naidu, R., 2014. Chapter 28 - Arsenic in Rice: Sources and Human Health Risk, In Wheat and Rice in Disease Prevention and Health, edited by Ronald Ross WatsonVictor R. PreedySherma Zibadi, Academic Press, San Diego, 365-375
Mohan, D., Pittman Jr., C. U., 2007. Arsenic removal from water/wastewater using adsorbents—A critical review, J. Hazardous Materials, 142, 1–2, 1-53
Mohan, D., Singh, Kunwar P., Singh, Vinod K., 2006. Trivalent chromium removal from wastewater using low cost activated carbon derived from agricultural waste material and activated carbon fabric cloth, J. Hazardous Materials, 135, .1–3, 280-295
Mondal P., Majumder C.B., Mohanty B., 2006. Laboratory based approaches for arsenic remediation from contaminated water: recent developments, J. Hazardous Material 13, 464–479.
Mondal, P., Majumder, C.B., Mohanty, B., 2008. Effects of adsorbent dose, its particle size and initial arsenic concentration on the removal of arsenic, iron and manganese from simulated ground water by Fe3+ impregnated activated carbon, Journal of Hazardous Materials, 150, 3, 695-702
Montastruc, L., Liu, T., Nikov, I., Floquet, P., Domenech, S., 2011., Integrated Process for Production of Surfactin (III) Modeling of Adsorption Column, Chinese J. of Chemical Engineering, 19, 3, 357-364

REFERENCES 2014
206 | P a g e
Mukherjee, A., Verma, S., Gupta, S., Henke, K.R., Bhattacharya, P., 2014. Influence of tectonics, sedimentation and aqueous flow cycles on the origin of global groundwater arsenic: Paradigms from three continents, J. Hydrology, 518, Part C, 284-299
Mukhopadhyay, B., Sundquist, J., White, E., 2007. Hydro-geochemical Controls on Removal of Cr(VI) from Contaminated Groundwater by Anion Exchange. Appl. Geochem. 2007, 22, 370-387.
Muniz G., Fierro V., Celzard A., Furdin G., Gonzalez-Sanchez G., Ballinas M.L., 2008. Synthesis, characterization and performance in arsenic removal of iron-doped activated carbons prepared by impregnation with Fe(III) and Fe(II), J. Hazardous Mate., 165, 893–902.
Namasivayam, C., Yamuna, R.T., 1995. Adsorption of chromium (VI) by a low-cost adsorbent: biogas residual slurry, Chemosphere, 30, 561–578.
Natale, Di., Erto, A., Lancia, A., Musmarra, D., 2007. Experimental and modelling analysis of As(V) ions adsorption on granular activated carbon. Water Res. 42, 2007 - 2016.
Nataraj, S. K., Hosamani, K. M., Aminabhavi, T. M., 2009. Nanofiltration and reverse osmosis thin film composite membrane module for the removal of dye and salts from the simulated mixtures, Desalination. 249, 12 – 17.
National Institute for Occupational Safety and Health (NIOSH), 1997. Pocket Guide to Chemical Hazards. U.S. Department of Health and Human Services, Public Health Service, Centers for Disease Control and Prevention. Cincinnati, OH. 1997.
Neeraja K. E., Robert L. S. J., Valdez-Flores, C., Grant, Roberta L., 2012. An updated inhalation unit risk factor for arsenic and inorganic arsenic compounds based on a combined analysis of epidemiology studies, Regulatory Toxicology and Pharm., 64, 2, 329-341.
Němeček, J., Lhotský, O., Cajthaml, T., 2014. Nanoscale zero-valent iron application for in situ reduction of hexavalent chromium and its effects on indigenous microorganism populations, Science of The Total Env., 85–486, 739-747.
Nemr, A. E., Khaled, A., Abdelwahab, O. El-S., 2008. A. Treatment of Wastewater Containing Toxic Chromium Using New Activated Carbon Developed from Date Palm Seed. J. Hazard. Mater., 152, 263–275.
Neupane, G., Donahoe, Rona J., 2013. Calcium–phosphate treatment of contaminated soil for arsenic immobilization, Applied Geoc., 28, 145-154,
Nieto-Delgado, C., Rangel-Mendez, Rene, J., 2012. Anchorage of iron hydro(oxide) nanoparticles onto activated carbon to remove As(V) from water, Water Res., 46, 9, 2973-2982.
Norwood, W.P., Borgmann, U., Dixon, D.G., 2007. Chronic toxicity of arsenic, cobalt, chromium and manganese to Hyalella azteca in relation to exposure and bioaccumulation, Environmental Pollution, 147, 1, 262-272
Obrien, T.J., Ceryak, S.,. Patierno, S.R., 2000. Complexities of chromium carcinogenesis: role of cellular response, repair and recovery mechanisms. Mutat. Res. 533, 3-36.
Occupational Safety and Health Administration (OSHA), 1998. Occupational Safety and Health Standards, Toxic and Hazardous Substances. Code of Federal Regulations. 29 CFR 1910.1000.
Olmez, T., 2009. The optimization of Cr(VI) reduction and removal by electrocoagulation using response surface methodology, J. Hazard. Mater. 162, 1371–1378.
Onnby, P., Kumar, S., Sigfridsson ,K. G. V., Wendt, O. F., Carlson, S., Kirsebom, H., 2014. Improved arsenic(III) adsorption by Al2O3 nanoparticles and H2O2: Evidence of oxidation to arsenic(V) from X-ray absorption spectroscopy, Chemosphere, 113, 151-157.
Owlad, M., Aroua, M. K., Daud, W. A. W., Baroutian, S., 2009. Removal of Hexavalent Chromium-contaminated Water and Wastewater: A Review. Water Air Soil Pollut. 200, 59–77.
Pan, B., Li, Z., Zhang, Y., Xu, J., Chen, L., Dong, H., Zhang, W., 2014. Acid and organic resistant nano-hydrated zirconium oxide (HZO)/polystyrene hybrid adsorbent for arsenic removal from water, Chemical Engineering J., 248, 290-296
Park, D., Yun, Y., Lee, S., Lim, S., Park, J. M., 2006. Column study on Cr(VI)-reduction using the brown seaweed ecklonia biomass, J. of Hazardous Materials, B137, 1377-1384
Park, H. J., Tavlarides, L. L., 2008. Adsorption of Chromium(VI) from Aqueous Solutions Using an Imidazole Functionalized Adsorbent. Ind. Eng. Chem. Res., 47, 3401–3409.
Periasamy, K., Srinivasan, K., Murugan, P.R., 1995. Removal of chromium (VI) by activated ground nut husk carbon, Waste Management, 15, 256.
Pokhrel, D. and Viraraghavan, T., 2007. Arsenic removal from an aqueous solution by modified A. niger biomass: batch kinetic and isotherm studies. J. Hazard. Mater., 150, 818-825.

REFERENCES 2014
207 | P a g e
Polizzotto, M. L., Lineberger, E. M., Matteson, A.R., Neumann, R. B., Borhan, A., Badruzzaman, M., Ali, M. A., 2013. Arsenic transport in irrigation water across rice-field soils in Bangladesh, Environmental Poll., 179, 210-217
Preetha, B., Viruthatgiri, T., 2007; Batch and Continuous Biosorption of Chromium(VI) by Rhizopus Arrizus. Sep. Purif. Technol. 57, 126– 133.
Proctor, D. M., Suh, M., Campleman, S. L., Thompson, C, M., 2014. Assessment of the mode of action for hexavalent chromium-induced lung cancer following inhalation exposures, Toxicology, 325, 160-179.
Qafoku, N. P., Dresel, P. E., McKinley, J. P., Liu, C., Heald, S. M., 2009. Ainsworth, C. C; Phillips, J. L.; Fruchter, J. S. Pathways of Aqueous Cr(VI) Attenuation in a Slightly Alkaline Oxic Subsurface. EnViron. Sci. Technol. 43, 1071–1077.
Qin, C.; Du, Y.; Zhang, Z.; Liu, y.; Xiao, L.; Shi, X., 2003. Adsorption of Chromium(VI) on a Novel Quaternized Chitosan Resin. J. Appl. Polym. Sci. 90, 505–510.
Qin, G., McGuire, M. J., Blute, N. K., Seidel, C., Fong, L., 2005. Hexavalent Chromium Removal by Reduction with Ferrous Sulfate, Coagulation, and Filtration: A Pilot-Scale Study, Environ. Sci. Technol., 39 (16), 6321–6327.
Qiu, X., Fang, Z., Yan, X., Cheng, W., Lin, K., 2013. Chemical stability and toxicity of nanoscale zero-valent iron in the remediation of chromium-contaminated watershed, Chemical Engineering J., 220, 61-66
Quintanilla, D. P., Hierro, I., Fajardo, M., 2007. Cr(VI) adsorption on functionalized amorphous and mesoporous silica from aqueous and non-aqueous media, Material Research Bull., 42, 1518-1530.
Raghunath, H. M., 1987, Ground Water: Hydrogeology, Ground Water Survey and Pumping Tests, Rural Water Supply and Irrigation Systems, New Age International
Raji, C., Anirudhan, T.S., 1998. Batch Cr(VI) removal by polyacrylamide grafted sawdust: kinetics and thermodynamics, Water Res., 32 (12), 3772-3780.
Ranade, V. V., Bhandari, V.M., 2014. Chapter 1 - Industrial Wastewater Treatment, Recycling, and Reuse: An Overview, In Industrial Wastewater Treatment, Recycling and Reuse, edited by Vivek V. RanadeVinay M. Bhandari, Butterworth-Heinemann, Oxford, 1-80
Ranjan, D., Talat, M.H., Hasan, S.H., 2009. Biosorption of arsenic from aqueous solution using agricultural residue ‘rice polish’. J. Hazardous Material, 166,1050-1059.
Rao, P., G.H.S.V., Murty, Deekshitulu, M.N., 1964. Stratigraphic relations of Precambrian iron formations and associated sedimentary sequences in parts of Keonjhar, Cuttack, Dhenkanal and Sundergarh districts of Orissa, India. Proc. 22ndIntl. Geol. Cong. India, Sec.X, pp. 72-87.
Rathinam K., Sankaran M., 2014. Removal of hexavalent chromium ions using polyaniline/silica gel composite, J. Water Process Engineering, 1, 37-45
Reddy, A. S. and Sayi, Y. S., (1977). Solvent extraction of chromium (VI), iron (III), cobalt (II) and nickel (II) with di-n-pentyl sulfoxide. Sep. Sci., 12:645-648.
Rengaraj, S., Yeon, K.H., Moon, S.H., 2001. Removal of chromium from water and wastewater by ion exchange resins. J. Hazardous Mater., 87 (1-3), 273-287.
Retimeier, E., Sivertz, V., Tartar, H. V., 1940. Some properties of monoethanolamine and its aqueous solutions. J. of the American Chemical Soc., 62 1943-4.
Rhee, S.W., Kang, M.J., Kim, H., Moon, C.H., 1997. Removal of aquatic chromate ion involving rehydration reaction of calcined layered double hydroxide (Mg–Al–CO3). Environ. Technol. 18 (2), 231–236.
Rigobello, E. S., Dantas, Angela Di B., Bernardo, Luiz D., Vieira, Eny M., 2013. Removal of diclofenac by conventional drinking water treatment processes and granular activated carbon filtration, Chemosphere, 92, 2, 184-191
Roh, S., Lee, Y., Elless, M.P., Foss, J.E., 2000. Incorporation of radioactive contaminants into pyroaurite-like phases by electrochemical synthesis, Clays Clay Miner, 48.
Romero, G., P., Sanchez, C., 2004. (Eds.) Functional Hybrid Materials, Wiley-VCH, Weinheim, 2004.
Rosane Alves, P.J., Walburga Keglevich de Buzin, N., Cezar H., I.A. Schneider, H., 2012. Utilization of ashes obtained from leather shaving incineration as a source of chromium for the production of HC-FeCr alloy. Minerals Eng., 29, 124-126.
Rosenblatt, F., 1958, The perceptron: a probabilistic model for information storage and organization in the brain: psychological rev., 65, 386-408
Ross, P. J., 1988. Taguchi techniques for quality engineering”, McGraw-Hill Book Company, New York

REFERENCES 2014
208 | P a g e
Roy, P., Mondal, N.K., Das K., 2014. Modeling of the adsorptive removal of arsenic: A statistical approach, J. of Environmental Chemical Eng., 2, 1, 585-597.
Roy, R. K., 1990. “A primer on Taguchi method”, Van Nostrand Reinhold, New York. Ruangwises, S., Saipan, P., Ruangwises, N., 2014. Chapter 30 - Inorganic Arsenic in Rice and
Rice Bran: Health Implications, In Wheat and Rice in Disease Prevention and Health, edited by Ronald Ross WatsonVictor R. PreedySherma Zibadi, Academic Press, San Diego, 393-399.
Saçmac, S., Kartal, S., Yilmaz, Y., Saçmac, M. and Soykan, C., 2012. A new chelating resin: Synthesis, characterization and application for speciation of chromium (III)/ (VI) species. Chemical Engineering J., 181-182, 746-753.
Saha D., Bhowal A., Dutta S., 2010. Artificial neural network modeling of fixed bed biosorption using radial basis approach, Heat Mass Transfer, 46, 431–436.
Saha, R., Nandi, R. and Saha, B., 2011. Sources and toxicity of hexavalent chromium. J. Coordination Chemistry, 64(10), 1782-1806.
Samal, A. C., Kar, S., Maity, J.P., Santra, S.C., 2013. Arsenicosis and its relationship with nutritional status in two arsenic affected areas of West Bengal, India, J. Asian Earth Sci., 77, 303-310,
Sanchez, C., Ribot, F., Lebeau, B., 1999. Molecular design of hybrid organic-inorganic nanocomposites synthesized via sol-gel chemistry. J. Mater. Chem., 9, 35–44.
Santra, S. C., Samal, A.C., Bhattacharya, P., Banerjee, S., Biswas, A., Majumdar, J., 2013. Arsenic in Foodchain and Community Health Risk: A Study in Gangetic West Bengal, Procedia Environmental Sci., 2-13.
Saravanane, R., Ranade, V.V., Bhandari, V. M., Rao, A. S., 2014. Chapter 7 - Urban Wastewater Treatment for Recycling and Reuse in Industrial Applications: Indian Scenario, In Industrial Wastewater Treatment, Recycling and Reuse, edited by Vivek V. RanadeVinay M. Bhandari, Butterworth-Heinemann, 283-322.
Sarin, V., Singh, T.S., Pant, K.K., 2006. Thermodynamic and breakthrough column studies for the selective sorption of chromium from industrial effluent on activated eucalyptus bark, Bioresource Techn., 97, 16, 2006, 1986-1993.
Sarkar, B., Xi, Y., Megharaj, M., Gummuluru, S.R. K., Rajarathnam, D., Naidu, R., 2010. Remediation of hexavalent chromium through adsorption by bentonite based Arquad® 2HT-75 organoclays, J. of Hazardous Mater., 183 (1–3), 87-97.
Sayari, A., Hamoudi, S., (2001). Periodic Mesoporous Silica-Based Organic-Inorganic Nanocomposite Materials. Chem. Mater., 13, 3151–3168.
Schottner, G., Hybrid Sol-Gel-Derived Polymers: Applications of Multifunctional Materials. Chem. Mater. 2001, 13, 3422–3435.
Sengupta, S., Paul, D.K., Laeter, J.R. d., McNaughton, N.J., Bandopadhyay, P.K., Smeth, J.B. d., 1991. Mid-Archaean evolution of the Eastern Indian Craton: geochemical and isotopic evidence from the Bonai pluton, Precambrian Res.49, 1–2, 23-37.
Sepehr, M.N., Amrane, A., Karimaian, K.A., Zarrabi, M., Ghaffari, H. R., 2014. Potential of waste pumice and surface modified pumice for hexavalent chromium removal: Characterization, equilibrium, thermodynamic and kinetic study, Journal of the Taiwan Institute of Chemical Eng., 45, 2, 635-647.
Shanmugaprakash, M., Sivakumar, V., 2013. Development of experimental design approach and ANN-based models for determination of Cr(VI) ions uptake rate from aqueous solution onto the solid biodiesel waste residue, Bioresource Techn., 148, 550-559
Sharma V.K., Sohn M., 2009. Aquatic arsenic: toxicity, speciation, transformations, and remediation, Environment Inter. 35, 743–759.
Sharma, D.C. and Forster, C.F., 1994. A preliminary examination into the adsorption of hexavalent chromium using low-cost adsorbents. Bioresour. Technol., 47 (3):257-264.
Sharma, Y. C., Srivastava, V., Singh, V. K., Kaul, S. N., Weng, C. H., 2009. Nano-Adsorbents for the Removal of Metallic Pollutants from Water and Wastewater. Environ. Technol., 30, 583–609.
Sharp, K. G.,1998. Inorganic/organic hybrid materials. Advanced Mater., 10, 1243–1248. Sheela,T., Nayaka, Y. A., Viswanatha, R., Basavanna, S., Venkatesha, T.G., 2012. Kinetics and
thermodynamics studies on the adsorption of Zn(II), Cd(II) and Hg(II) from aqueous solution using zinc oxide nanoparticles, Powder Technology, 217, 163-170
Shi, Li-n., Lin, Yu-M., Zhang, X., Chen, Zu-l., 2011. Synthesis, characterization and kinetics of bentonite supported nZVI for the removal of Cr(VI) from aqueous solution, Chemical Eng. Journal. 171, 612-617.

REFERENCES 2014
209 | P a g e
Shibata, J., Murayama, N., 2006. Engineering aspect on the removal of As(V), As(III), Cr(VI), B(III) and Se(IV) with functional inorganic ion exchanger. In: Proceedings of the 2006 TMS Fall Extraction and Processing Division, Sohn International Symposium, San Diego, CA, USA, 339–346.
Shin, Keun-Y., Hong, Jin-Y., Jang, J., 2011. Heavy metal ion adsorption behavior in nitrogen-doped magnetic carbon nanoparticles: Isotherms and kinetic study, J. Hazardous Materials, 190 (1–3), 36-44.
Shinde, R.N., Pandey, A.K., Acharya, R., Guin, R., Das, S.K., Rajurkar, N.S., Pujari, P.K., 2013. Chitosan-transition metal ions complexes for selective arsenic(V) preconcentration, Water Res., 47, 3497-3506.
Shirasawa, T., Takahashi, T., 2014. Surface X-ray Diffraction, In Reference Module in Chemistry, Molecular Sciences and Chemical Eng., Elsevier.
Shojaeimehr, T., Rahimpour, F., Khadivi, M. A., Sadeghi, M., 2014. A modeling study by response surface methodology (RSM) and artificial neural network (ANN) on Cu2+ adsorption optimization using light expended clay aggregate (LECA), J. Industrial and Engineering Chem., 20, 3, 870-880.
Sigrist, Mirna E., Brusa, L., Beldomenico, H.R., Dosso, L., Tsendra, O. M., González, M. B., Pieck, Carlos L., Vera, C. R., 2014. Influence of the iron content on the arsenic adsorption capacity of Fe/GAC adsorbents, J. Environmental Chemical Eng., 2, 2, 927-934.
Simon, S.,Tran, H., 2004. Florence Pannier, Martine Potin-Gautier, Simultaneous determination of twelve inorganic and organic arsenic compounds by liquid chromatography–ultraviolet irradiation–hydride generation atomic fluorescence spectrometry, Journal of Chromatography A, 1024,1–2, 105-113.
Smedley P.L., Kinniburgh D.G., 2002. A review of the source, behaviour and distribution of arsenic in natural waters, Applied Geo. 17, 517–568.
Smith, A., Steinmaus, C., 2009. “Health Effects of Arsenic and Chromium in Drinking Water: Recent Human Findings.” Annual Rev Public Health, 30,107–122
Smith, A.H., Lingas, Elena O., Rahman, M., 2000. Contamination of drinking-water by arsenic in Bangladesh: a public health emergency, Bulletin of the World Health Org., 78(9)
Søgaard, Erik G., 2014. Chapter 1 - Water and Water Cycle, In Chemistry of Advanced Environmental Purification Processes of Water, edited by Erik G. Søgaard, Elsevier, Amsterdam, 1-12
Sridhar, V., Jeon, J. H., Oh, I. K., 2010. Synthesis of graphene nanosheets using ecofriendly chemicals and microwave radiation, Carbon, 48, 2953-2957.
Srivastava, N.K. and C.B. Majumder, 2008. Novel biofiltration methods for the treatment of heavy metals from industrial wastewater. J. Hazard. Mater., 151: 1-8.
Sun, H., Wang, L., Zhang, R., Sui, J., Xu, G., 2006. Treatment of groundwater polluted by arsenic compounds by zero valent iron, J. Hazardous Materials, 129, 1–3, 297-303
Sun, X., Yan, Y., Li, J., Han, W., Wang, L., 2014. SBA-15-incorporated nanoscale zero-valent iron particles for chromium(VI) removal from groundwater: Mechanism, effect of pH, humic acid and sustained reactivity, J. Hazardous Materials, 266, 26– 33.
Sun, Y.,Yue, Q., Mao, Y., Gao, B., Gao, Y., Huang, L., 2014. Enhanced adsorption of chromium onto activated carbon by microwave-assisted H3PO4 mixed with Fe/Al/Mn activation, J. Hazardous Materials, 265, 191-200,
Sundaram, S., Viswanathan, N., Meenakshi, S., 2008. Defluoridation chemistry of synthetic hydroxyapatite at nano scale: Equilibrium and kinetic studies, J. Hazard. Mat., 155, 206–215.
Swain S. K., Mishra Sulagna, Sharma Prachi, Patnaik Tanushree, Singh V. K., Jha Usha, Patel R. K., and Dey R. K., 2010. Development of a New Inorganic-Organic Hybrid Ion-Exchanger of Zirconium(IV)-Propanolamine for Efficient Removal of Fluoride from Drinking Water, I. Eng. Chemistry Res., 49, 9846–9856.
Tahir, S.S., Naseem, R., 2007. Removal of Cr (III) from tannery wastewater by adsorption onto bentonite clay, Sep. Purif. Technol, 53, 312–321.
Tang, P.L., Lee, C.K., Low, K.S., Zainal, Z., 2003. Sorption of Cr(VI) and Cu(II) in aqueous solution by ethylenediamine modified rice hull. Environ. Technol., 24, 1243-1251.
Tang, S.C.N., Yin, K., Lo, I.M.C., 2011. Column study of Cr(VI) removal by cationic hydrogel for in-situ remediation of contaminated groundwater and soil, Journal of Contaminant Hydrology, 125,1–4, 39-46
Tao, S.S.-H., Bolger, P.M., 2014. Toxic Metals: Arsenic, In Encyclopedia of Food Safety, edited by Yasmine Motarjemi, Academic Press, Waltham, 2014, 342-345

REFERENCES 2014
210 | P a g e
Tepe, A. Y., 2014. Toxic Metals: Trace Metals – Chromium, Nickel, Copper, and Aluminum, In Encyclopedia of Food Safety, edited by Yasmine Motarjemi, Academic Press, Waltham, 356-362
Tezuka, S., Chitrakar, R., Sakane, K., Sonoda, A., Ooi, K., Tomida, T., 2004. The Synthesis and Phosphate Adsorptive Properties of Mg (II)–Mn (III) Layered Double Hydroxides and Their Heat-Treated Materials, Bull. Chem. Soc. Jpn, 77, 2101-2107.
Tir, M., Moulai-Mostefa, N., 2008. Optimization of oil removal from oily wastewater by electrocoagulation using response surface method, J. Hazard. Mater. 158,107–115.
Tiwari, D., Lee, S. M., 2012. Novel hybrid materials in the remediation of ground waters contaminated with As(III) and As(V), Chem. Engg. J., 204, 23-31.
Tompsett, G. A., Conner, W. C., Yngvesson, K. S., 2006. Microwave synthesis of Nano porous materials, Chem. Phys. Chem., 7, 296-319.
U.S. Department of Health and Human Services. ((USDHHS), 1993. Registry of Toxic Effects of Chemical Substances (RTECS, online database). National Toxicology Information Program, National Library of Medicine, Bethesda, MD.
U.S. Environmental Protection Agency (USEPA), 1999. “Integrated Risk Information System (IRIS) on hexavalent chromium”, National Centre for Environmental Assessment, Office of Research and Development, Washington, DC,
U.S. Environmental Protection Agency (USEPA), 2011, EPA issues guidance for enhanced monitoring of Cr(VI) in drinking Water, USA,
U.S. Geological Survey's (USGS), 2014, Water, the Universal Solvent, URL: http://water.usgs.gov/edu/solvent.html
Valix, M., Cheung, W.H., Zhang, K., 2006. Role of heteroatoms in activated carbon for removal of hexavalent chromium from wastewaters, J. Hazardous Mate., 135, 1–3, 395-405
Vatutsina O.M., Soldatov V.S., Sokolova V.I., Johann J., Bissen M., Weissenbacher A., 2007. A new hybrid (polymer/inorganic) fibrous sorbent for arsenic removal from drinking water, Reac. & Functional Poly., 67, 184–201.
Vaughan Jr. R. L., Reed, Brian E., 2005. Modeling As(V) removal by a iron oxide impregnated activated carbon using the surface complexation approach, Water Research, 39, 6, 1005-1014
Venkateswaran, K. P., 2005. Studies on recovery of hexavalent chromium from plating wastewater by supported liquid membrane using tri-n-butyl phosphate as carrier, Hydrometallurgy, 78, 1–2, 107-115
Verbych, S., Bryk, M., Alpatova, A., Chornokur, G., 2005. Ground water treatment by enhanced ultrafiltration, Desalination 179, 237–244.
Vieira, M. G. A.; Oisiovici, R. M.; Gimenes, M. L.; Silva, M. G. C. 2008 Biosorption of Chromium(VI) Using a Sargassum sp. Packed-bed Column. Bioresource Technol., 99, 3094–3099.
Vineis, P., Xun, W., 2009. “The emerging epidemic of environmental cancers in developing countries.” Annals of Oncology 20, 205–212, 2009
Vinodhini, V., Das, N., 2010. Packed bed column studies on Cr (VI) removal from tannery wastewater by neem sawdust, Desalination, 264, 1–2, 9-14
Violante, A., Pucci, M., Cozzolino V., Zhu, J., Pigna, M., 2009. Sorption/desorption of arsenate on/from Mg–Al layered double hydroxides: Influence of phosphate, Journal of Colloid and Interface Science, 333, 1, 63-70,
Vukčević, M., Pejić, B., Kalijadis, A., Pajić-Lijaković, I., Kostić, M., Laušević, Z., Laušević, M., 2014. Carbon materials from waste short hemp fibers as a sorbent for heavy metal ions – Mathematical modeling of sorbent structure and ions transport, Chemical Engineering J., 235, 284-292
Wang S., Mulligan C.N., 2006. Occurrence of arsenic contamination in Canada: sources, behaviour and distribution, Science of the Total Env., 366, 701–721.
Wang, H., Yuan, X., Wu, Y., Chen, X., Leng, L., Wang, H., Li, H., Zeng, G., 2015. Facile synthesis of polypyrrole decorated reduced graphene oxide–Fe3O4 magnetic composites and its application for the Cr(VI) removal, Chemical Engineering J., 262, 597-606
Wang, J., Lv, X., Zhao, L., Li, J., 2011. Removal of chromium from a real electroplating wastewater by aminated polyacrylonitrile fibres. Env. Eng. Science, 28, 585-589
Wartelle, L.H., Marshall, W.E., 2005. Chromate ion adsorption by agricultural by-products modified with dimethyloldihydroxyethylene urea and choline chloride. Water Res., 39 (13), 2869-2876
Weber, W.J., Morris, J.C., 1963. Kinetics of adsorption on carbon from solution, J. Sanit. Eng. Div. Am. Soc. Civ. Eng., 89, 31–60.

REFERENCES 2014
211 | P a g e
Weckhuysen, M., Wachs, I. E., Shoonheydt, R.A., 1996. Surface chemistry and spectroscopy of chromium in inorganic oxides, Chem. Rev., 96, 3327- 3349.
Wei-Guang, L, Xu-Jin, G., Ke, W., Xin-Ran, Z., Wen-Biao, F., 2014. Adsorption characteristics of arsenic from micro-polluted water by an innovative coal-based mesoporous activated carbon, Bioresource Techn., 165,166-173.
Witek-Krowiak, Anna, Chojnacka, K., Podstawczyk, D., Anna Dawiec, Pokomeda, K., 2014. Application of response surface methodology and artificial neural network methods in modelling and optimization of biosorption process, Bioresource Tech., 160, 150-160
World Health Organization (WHO), 1988. “Chromium, Environmental Health Criteria 61”, Geneva, Switzerland, 1988.
World Health Organization (WHO), 2010. Exposure to arsenic: A major public health concern, WHO Document Production Services, Geneva, Switzerland, 2010.
Yang, L., Dadwhal, M., Shahrivari, Z., Ostwal, M., Liu, P.K.T., Sahimi, M., Tsotsis, T.T., 2006. Adsorption of arsenic on layered double hydroxides: effect of the particle size. Ind. Eng. Chem. Res., 45 (13), 4742–4751.
Yang, L., Shahrivari, Z., Liu, P.K.T., Sahimi, M., Tsotsis, T.T., 2005. Removal of trace levels of arsenic and selenium from aqueous solutions by calcined and uncalcined layered double hydroxides (LDH). Ind. Eng. Chem. Res., 44 (17), 6804–6815.
Yang, Z., Ji, S., Gao, W., Zhang, C., Ren, L., Tjiu, W. W., Zhang, Z., Pan, J., Liu, T., 2013. Magnetic nanomaterial derived from graphene oxide/layered double hydroxide hybrid for efficient removal of methyl orange from aqueous solution, J. of Colloid and Interface Science, 408, 25-32
Yanyang, Z., Bingcai, P., 2014. Modeling batch and column phosphate removal by hydrated ferric oxide-based nanocomposite using response surface methodology and artificial neural network, Chemical Engineering J., 249, 111-120
Yetilmezsoy K., S., Demirel, R.J. V., 2009. Response surface modeling of Pb(II) removal from aqueous solution by Pistacia vera L.: Box-Behnken experimental design, J. of Hazardous Materials, 71, 551–562.
Yildiz, U., Kemik, Ömer F., Hazer, B., 2010. The removal of heavy metal ions from aqueous solutions by novel pH-sensitive hydrogels, J. of Hazardous Materials, 183, 1–3, 521-532.
You, Y.W., Zhao, H.T., Vance, G.F., 2001. Removal of arsenite from aqueous solutions by anionic clays. Environ. Technol., 22, 12, 1447–1457.
Yu, L.J., Shukla, S.S., Dorris, K.L., Shukla, A. and Margrave, J.L., 2003. Adsorption of chromium from aqueous solutions by maple sawdust. J. Hazard. Mater., 100 (1-3):53-63.
Yurum, A., Atakli, Z. O. K., Sezen, M., Semiat, R., Yurum, Y., 2014. Fast deposition of porous iron oxide on activated carbon by microwave heating and arsenic (V) removal for water, Chemical Engineering J., 242, 321-332.
Zeng, M., Liao, B., Lei, M., Zhang, Y., Zeng, Q., Ouyang, B., 2008. Arsenic removal from contaminated soil using phosphoric acid and phosphate, J. of Environmental Sciences, 20, 75-79.
Zhang Q.L., Gao N.Y., Lin Y.C., Xu B., Le L.S., 2007. Removal of arsenic(V) from aqueous solutions using iron-oxide-coated modified activated carbon, Water Environment Research, 79 (8), 931–936.
Zhang, Q., Zhang S., Chen, S., Li p., Qin, T., Yuan, S., 2008, Preparation and characterization of a strong basic anion exchanger by radiation-induced grafting of styrene onto poly(tetrafluoroethylene) fiber. J. colloid interface sci. 322, 421-428.
Zhang, Y., Pan, B., 2014. Modeling batch and column phosphate removal by hydrated ferric oxide-based nanocomposite using response surface methodology and artificial neural network, Chemical Engineering J., 249, 111-120
Zhao, X. C., Liao, R., Zhang, X., Xie, J., Yua, B., Wua, R., Wanga, R., Yanga, S. T., 2014. Facile hydrothermal preparation of S-doped Fe3O4@C nanoparticles for Cu2+ removal, Material Lett., 135, 154-157.
Zhou, Li, Deng, H., Wan, J., Shi, J., Su, T. 2013. A solvothermal method to produce RGO-Fe3O4
hybrid composite for fast chromium removal from aqueous solution, Applied Surface Sc., 283, 1024-1031
Zodi, S., Potier, O., Lapicque, F., Leclerc, J.P., 2010. Treatment of the industrial wastewaters by electrocoagulation: Optimization of coupled electrochemical and sedimentation processes, Desalination, 261, 186–190.
Zubair, H.N. B., Hanif, M.A., Shafqat, F., 2008. Kinetic and equilibrium modeling for Cr(III) and Cr(VI) removal from aqueous solutions by Citrus reticulate waste biomass, Water Air Soil Pollut. 191, 305–318.

RESEARCH PUBLICATIONS PEER REVIEWED INTERNATIONAL JOURNAL PUBLICATION:
1. S. Mandal, S. S. Mahapatra, R. K. Patel, An Neuro Fuzzy approach for
removal of As(III) and Cr(VI) from aqueous solution using fibrous ZEDA hybrid material, Water Process Engineering (2015), 5, 58-75.
2. S. Mandal, S. S. Mahapatra, R. K. Patel, Enhanced removal of Cr(VI) by cerium oxide polyaniline composite: Optimization and modeling approach using response surface methodology and artificial neural networks, Journal of Environmental chemical engineering, (2015), Article in Press, doi:10.1016/j.jece.2015.03.028.
3. S. Mandal, S. S. Mahapatra, R.K. Patel, Removal of As(III) by hybrid material and its modeling studies: An LSVM and GP approach (accepted), Environmental Process, (2015), 2, 145-172.
4. S. Mandal, M. K. Sahu, A. K. Giri, R. K. Patel, Adsorption studies of chromium (VI) removal from water by lanthanum diethanolamine hybrid material, Environmental Technology 35, 817-832 (2014), 7.
5. S. Mandal, S. S. Mahapatra, M. K. Sahu, R. K. Patel, Artificial neural network modelling of As(III) removal from water by novel hybrid material, Process Safety and Environmental Protection (2014), 93, 249-264.
6. M. K. Sahu, S. Mandal, S. S. Dash, P. Badhai, R. K. Patel, Removal of Pb(II) from aqueous solution by acid activated red mud, Journal of Environmental Chemical Engineering 1(4) (2013) 1315-1324.
7. S. Mandal, M. K. Sahu, R. K. Patel, Adsorption studies of arsenic(III) removal from water by zirconium polyacrylamide hybrid material (ZrPACM-43), Water Resources and Industry 4 (2013) 51-67.
8. S. Mandal, S. Sahu, M. K. Sahu, T. Padhi, R. K. Patel, Removal efficiency of fluoride by novel Mg-Cr-Cl layer double hydroxide (LDH) by batch process from water, Journal of Environmental Science 25 (5) (2013) 993-1000.
9. A. K. Giri, R. K. Patel, S. Mandal, Removal of Cr (VI) from aqueous solution by Eichhornia crassipes root biomass-derived activated carbon, Chemical Engineering Journal 185–186 (2012) 71-81.
10. S. Mandal, T. Padhi, R. K Patel, Studies on the removal of arsenic (III) from water by a novel hybrid material, Journal of hazardous materials: 192(2) (2011) 899-908.
JOURNAL UNDER REVIEW/COMMUNICATED:
11. M. K. Sahu, S. Mandal, L. S. Yadav, S. S. Dash, R. K. Patel, Removal of
Cd(II) ion from aqueous solution by adsorption onto acid activated red mud (Communicated) Desalination
PATENT FILED/GRANTED:
12. Sandip Mandal, Raj Kishore Patel, Siba Shankar Mahapatra, Swayam
Bikash Mishra, Gravity flow portable water bottle with filtration system -961/Kol/2014 (Product Patent)
13. Sandip Mandal, Raj Kishore Patel, Siba Shankar Mahapatra, Swayam Bikash Mishra, Gravity flow portable water bottle with filtration system -265832/Kol/2014 (Design Patent)
INTERNATIONAL CONFERENCE/SYMPOSIA PROCEEDINGS:
14. S. Mandal, R. K. Patel, Removal of Chromium (VI) by (ZrO-HAHCl) Hybrid
Material from Contaminated Water, ICMAT13-A-2258, Material research society, Seventh International conference on Materials for Advanced Technologies 2013, Suntec, Singapore
15. conference on Materials for Advanced Technologies 2013, Suntec, Singapore

16. S. Mandal, R. K. Patel, Cerium hydroxylamine (Ce-HA), as a novel hybrid material, kinetic and batch studies towards efficient removal of trivalent arsenic from water, ISCA-ISC-2012-8EVS-47, International Science Congress Association, 2nd International Science Congress (ISC-2012), 8 - 9 December 2012, Bon Maharaj Engineering College, Vrindavan, Mathura, UP, India
17. S. Mandal, R. K. Patel, Removal of trivalent arsenic from contaminated water by synthesized novel zirconium polyacrylyte hybrid material, Chemical Constellation Cheminar – 2012(CCC-2012), An International Conference, September 10-12, 2012, NIT Jalandhar, Punjab
18. S. Mandal, R. K. Patel, The Role of Chemistry in Environmental Protection, UGC, sponsored national seminar on, Environmental Management: The need of the Hour, January 2012, Kendrapara, Odisha, India
19. S. Mandal, R. K. Patel, Oral presentation in the Silver Jubilee Annual Conference of Orissa Chemical Society & a National Conference on “Molecule” to be held during December 24-26, 2011, Studies on the Removal of Arsenic (III) from Drinking Water through Synthesized Zirconium (IV) Oxide Hydroxylamine Hydrochloride Based Hybrid Material
20. S. Mandal, R. K. Patel, DAE-BRNS national workshop on materials chemistry(functional materials),NWMC – 2011 (fun-mat), December 7-8, 2011, Studies on the removal efficiency of novel environment friendly adsorbent for hazardous ions from contaminated water and its mathematical modelling, BARC, Mumbai, INDIA
21. S. Mandal, R. K. Patel, AICTE Sponsored National Seminar on “ management of industrial pollution (MIP-2011) on 23-24 September 2011, PIET, Rourkela, INDIA
22. S. Mandal, R. K. Patel, International Conference on Emerging green Technologies, Removal of Cr (VI) from aqueous solution by a synthesized La-hybrid material as adsorbent, ICEGT-2011, July 27-30, Thanjavur, Tamil Nadu, INDIA

BIO DATA
Name: Sandip Mandal
Date of Birth: 21-09-1988
Educational Qualification: PhD. (Chemistry), National Institute of Technology, Rourkela, India in 2015. Post Graduated (M.Sc- Chemistry) from National Institute of Technology, Rourkela, India in 2010. Graduated from Government Autonoums College Rourkela in chemistry (Honors) (Affiliated to Sambalpur University), Odisha, India in 2008. Class XIIth from Kendriya Vidyalya, AICBSE-India in 2005. Class Xth from Kendriya Vidyalya, AICBSE-India in 2003.
Research Experience: Published 10 papers and communicated three papers in international Journals and applied for two indian patents
Awards & Achievements: Awarded Bhaswati Paul Memorial Award in 2010 for best project in Environmental Pollution, by National Institute of Technology, Rourkela. Awarded UGC-RGNF scholarship from Government of India, University grants commission, New Delhi in 2010 Received young scientist award (Best Paper) in CCC-2012 (International Conference) by National Institute of Technology, Jalandhar, Government of India. Awarded UGC-SRF Fellowship from Government of India, University grants commission, New Delhi in 2012. Young Scientist Award (Best Paper) ISCA-2013 (International Science Congress), Karunya University, Coimbatore, Tamilnadu, India.
Permanent home address: At-Birshinghapur, Po-Bikarampur, Ps-Simlapal, Dist-Bankura, West Bengal, Pin-722151 Phone: +91-9778212090, 0661-246-2652 Email: [email protected]