development of prediction models for skid resistance of ... · development of prediction models for...
TRANSCRIPT

Development of Prediction Models for Skid Resistance of Asphalt Pavements
Emad Kassem, Ph.D.Sanad AldagariMohammad Al-Assi
Arif Chowdhury, Ph.D.Eyad Masad, Ph.D.
The 56th Annual Idaho Asphalt Conference, Moscow, IDOctober 27, 2016

Introduction Pavement surface friction is a key
component of road safety
Approximately 14 percent of fatal crashes and 15 to 18 percent of all crashes occur on wet pavements [Smith, 1976; Davis et al., 2002; Chelliah et al., 2003].
Providing acceptable level of friction leads to 50% to 60% decrease in wet weather accidents [Miller & Johnson, 1973; Kamel & Gartshore,1982]

Crash Injuries Fatalities Related to roadcondition
64
00
30
00
4213
National Crash Statistics between 1993 and 2003 (thousands)
The cost of crashes is about $231 billion

Introductiono Friction: The force that resists the relative
motion between a vehicle tire and pavement surface.

Microtexture: irregularities in the surface of rock; dependent on aggregate petrography; smooth or rough when touch
Noyce et al. (2005)
Macrotexture: larger irregularities in the road surface, dependent on aggregate gradation
0.075 0.3 1.18 4.75 9.5 12.5 19Sieve Size, mm
Percent Passing, %

Objectives
Validate and revise a prediction model for Skid Number of asphalt pavements as function of traffic level, aggregate characteristics, and aggregate gradation
Develop a prediction model for Skid Number of seal coat surfaces
Use the developed models to classify road sections based on their skid resistance

Field Experiments
Mix Designs Traffic Levels Aggregate Sources

o Locked-wheel Modeo Skid trailer with one or
two wheels are towed o Water is applied in front
of the wheelo The test wheel is locked o The friction force is
recoded for a given distance
o The results is reported as Skid Number (SN)
Field Friction Measurement
Skid Trailer
SN = 100 x friction factor
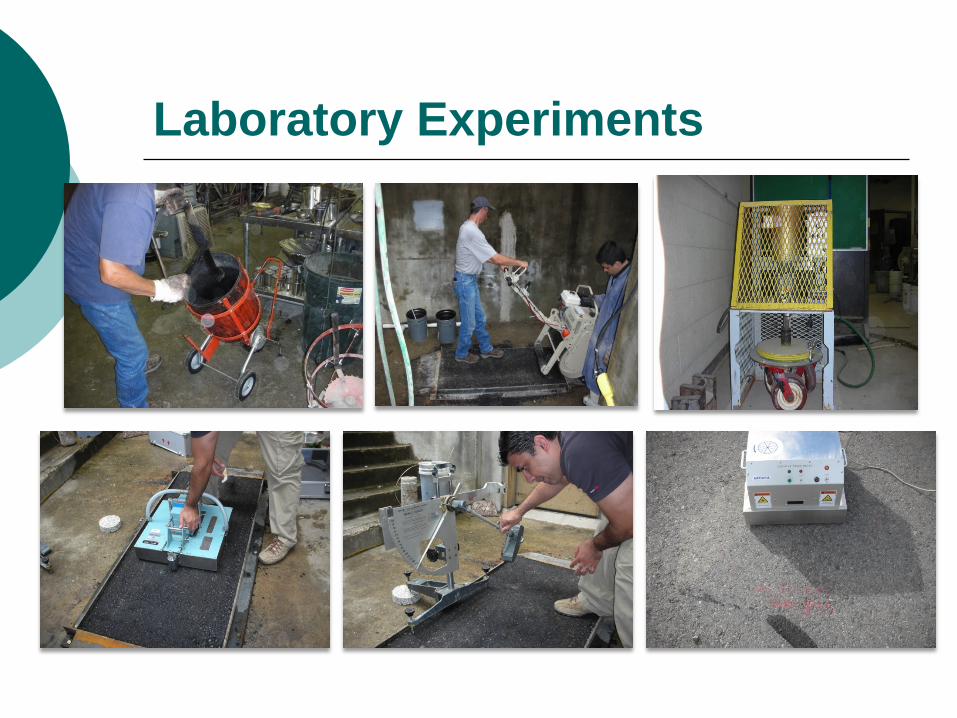
Laboratory Experiments
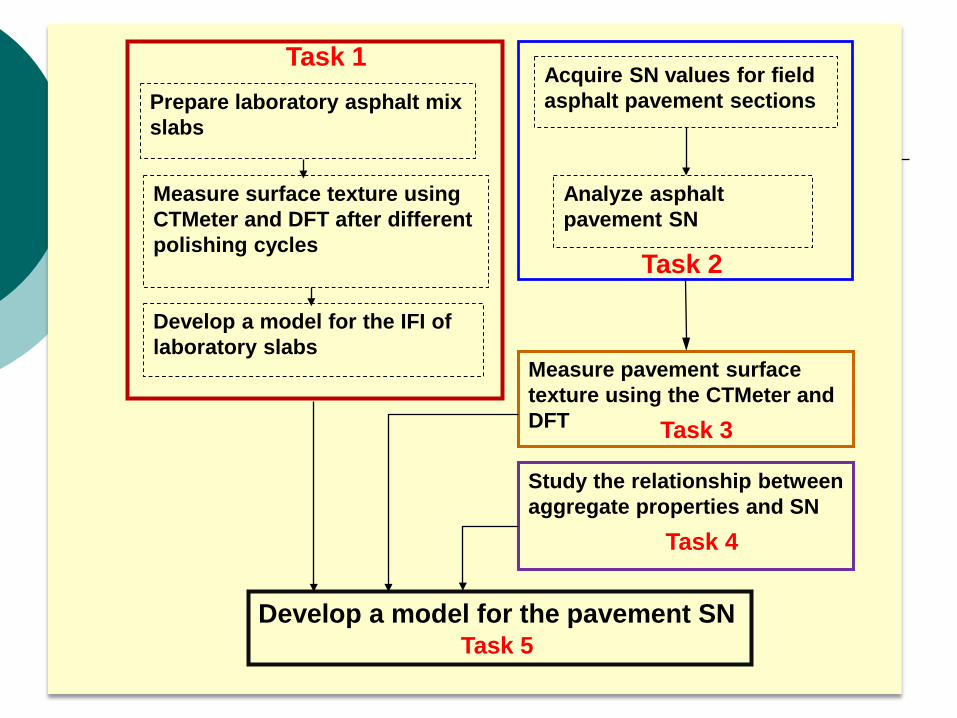
Prepare laboratory asphalt mix slabs
Measure surface texture using CTMeter and DFT after different polishing cycles
Develop a model for the IFI of laboratory slabs
Acquire SN values for field asphalt pavement sections
Analyze asphalt pavement SN
Measure pavement surface texture using the CTMeter and DFT
Study the relationship between aggregate properties and SN
Develop a model for the pavement SN
Task 1
Task 2
Task 3
Task 4
Task 5

International Friction Index
MPD is Mean Profile Depth Measured by CTMeter
DFT20 is Dynamic Friction at 20 km/h Measured by DFT
SN(50) is measured skid number at 50mph using skid trailer
PSeDFTIFI40
20732.0081.0−
+=
MPDS P 7.892.14 +=
PSeSNIFI20
)50(01.0925.0045.0 ××+=
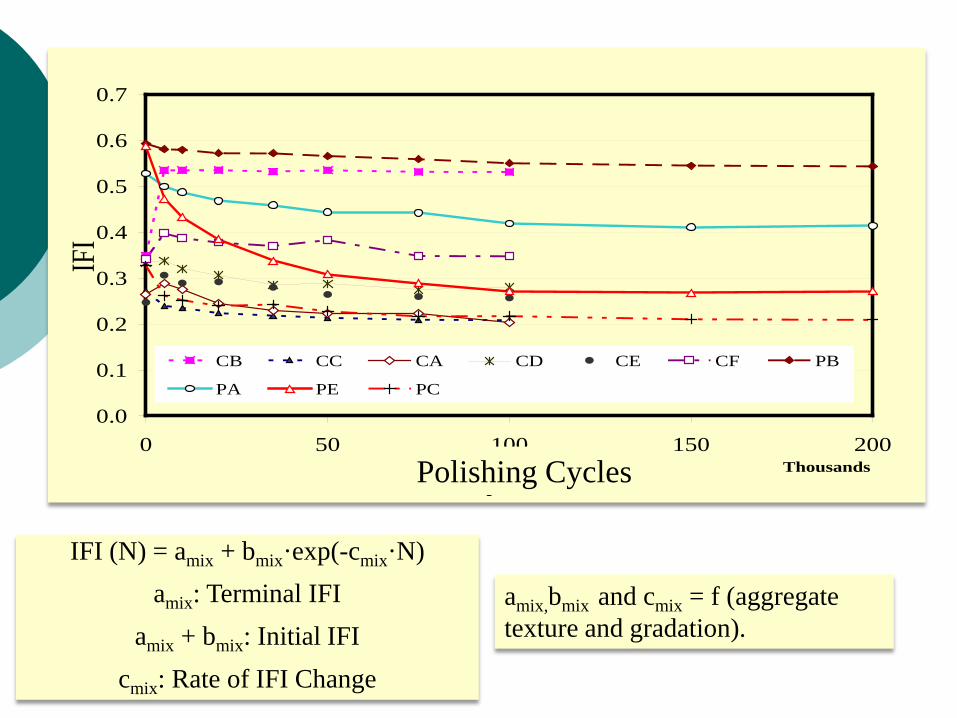
IFI (N) = amix + bmix·exp(-cmix·N)amix: Terminal IFI
amix + bmix: Initial IFIcmix: Rate of IFI Change
0.0
0.1
0.2
0.3
0.4
0.5
0.6
0.7
0 50 100 150 200Thousands
Cycles
IFI
CB CC CA CD CE CF PB
PA PE PC
Polishing Cycles
amix,bmix and cmix = f (aggregate texture and gradation).

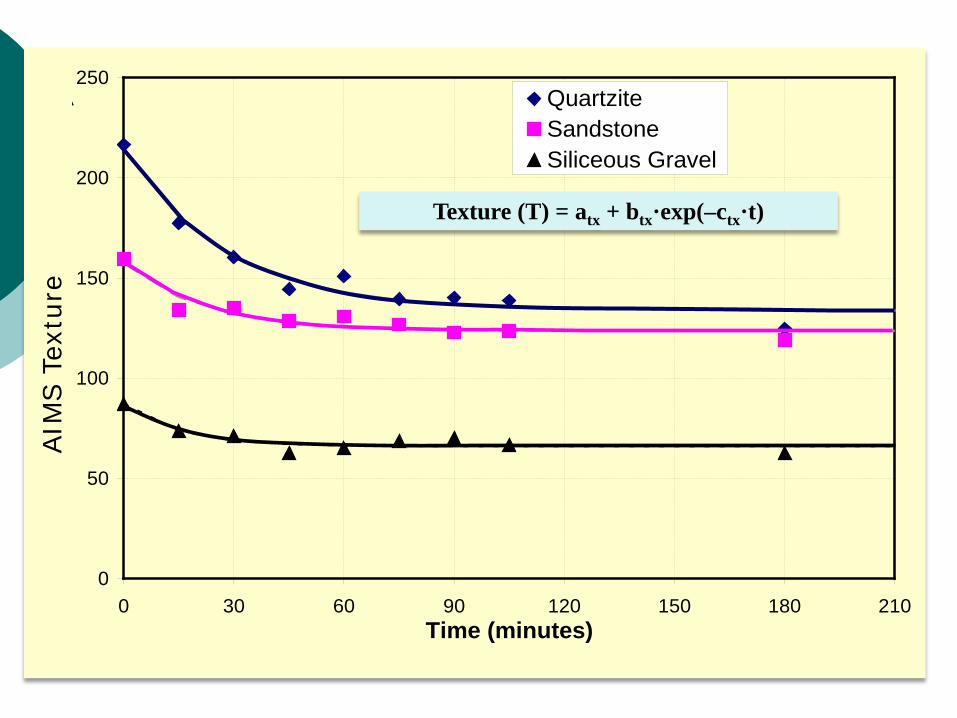
Measure Texture and Angularity before and after Micro-Deval Polishing
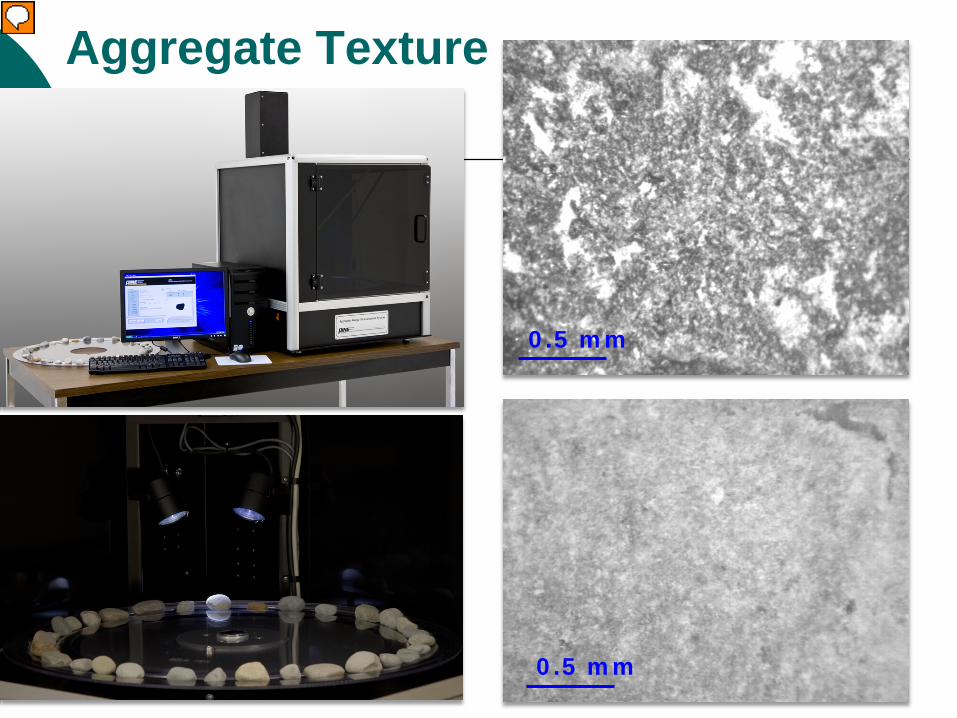
Aggregate Texture
0.5 mm
0.5 mm

Before Micro-Deval
After Micro-Deval
0
50
100
150
200
250
0 30 60 90 120 150 180 210Time (minutes)
QuartziteSandstoneSiliceous Gravel
AAIM
S T
extu
re
Texture (T) = atx + btx·exp(–ctx·t)

Locations: ATL, BMT, ODA, SAT, YKM, HOU, LRD, PHR, LFK
Mix types: SMA-D, SMA-F, CMHB-F, Type C, Type D, TOM, PFC, CMHB-C, CAM
Year of Construction: 2006 to 2013
Aggregate Types: Limestone, Gravel, Granite, Sandstone, Dolomite, Rhyolite, Traprock, Quartzite
List of HMA Test Sections

Locations: ATL, BMT, ODA, SAT, YKM, LRD, PHR, LFK, BRY
Grade: Grade 3, Grade 4, Grade 5 Year of Construction: 2006 to 2013 Aggregate Types: Limestone, Gravel,
Traprock, Sandstone, Dolomite, Rhyolite, LRA, Lightweight
Coating: Pre-coated and Virgin
List of Seal Coat Test Sections
200
250
300
350
400
0 20 40 60 80 100 120 140 160 180 200
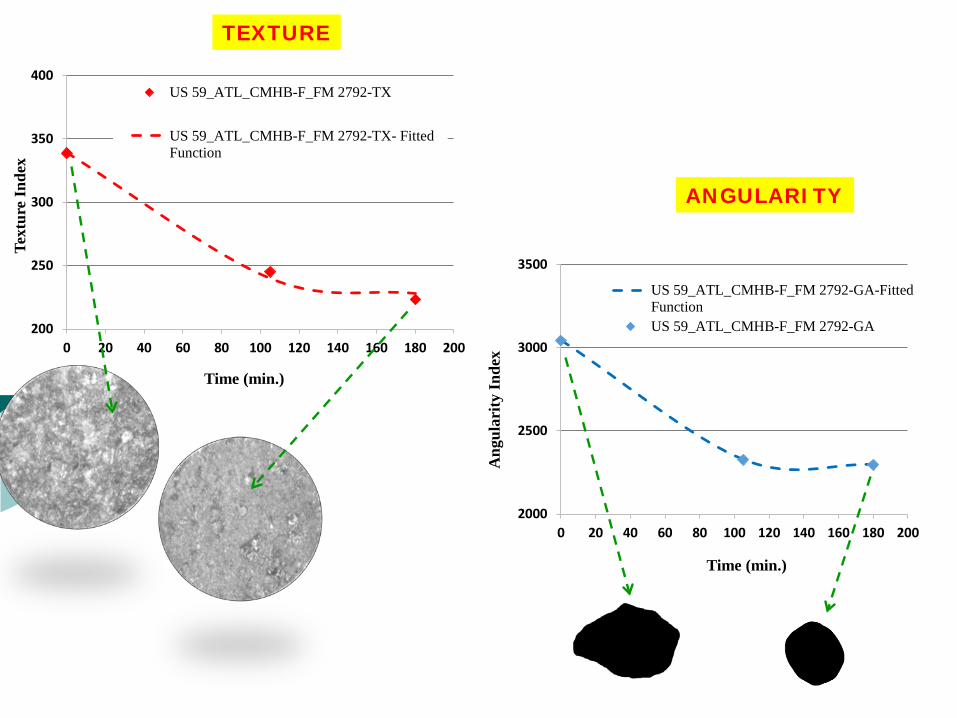
Text
ure
Inde
x
Time (min.)
US 59_ATL_CMHB-F_FM 2792-TX
US 59_ATL_CMHB-F_FM 2792-TX- FittedFunction
2000
2500
3000
3500
0 20 40 60 80 100 120 140 160 180 200
Ang
ular
ity In
dex
Time (min.)
US 59_ATL_CMHB-F_FM 2792-GA-FittedFunctionUS 59_ATL_CMHB-F_FM 2792-GA
TEXTURE
ANGULARITY
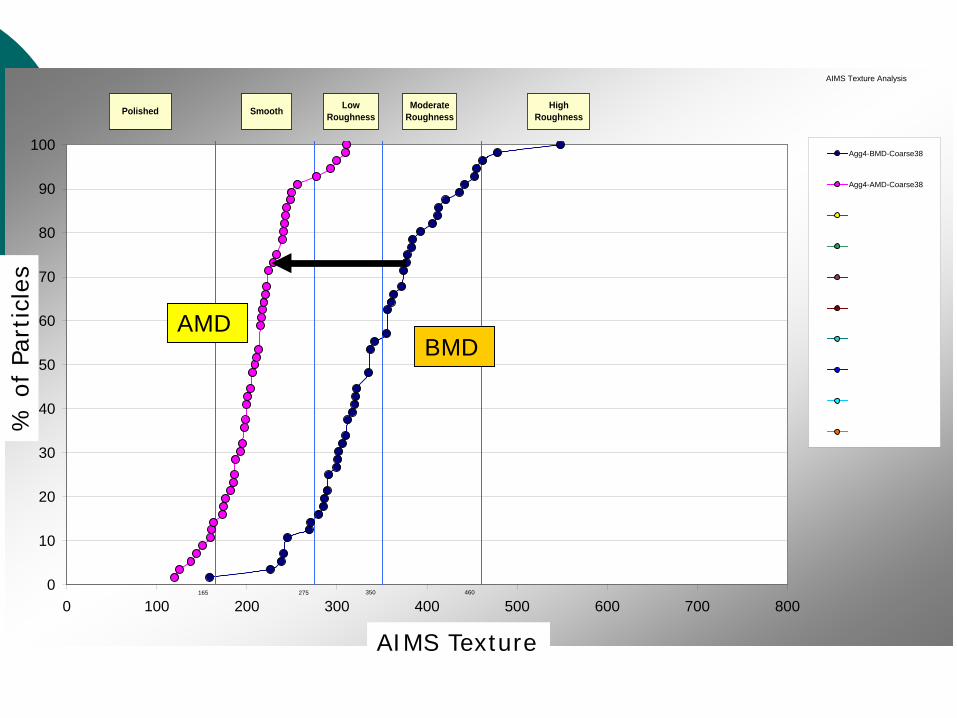
AIMS Texture Analysis
165 275 350 4600
10
20
30
40
50
60
70
80
90
100
0 100 200 300 400 500 600 700 800AIMS Texture Index
% o
f Par
ticle
s
Agg4-BMD-Coarse38
Agg4-AMD-Coarse38
Polished Smooth LowRoughness
Moderate Roughness
HighRoughness
BMDAMD
AIMS Texture
% o
f Pa
rtic
les

Aggregate Gradation for HMA(Weibull Distribution Function)
F(x;κ,λ) = 1- exp[(-x/λ)κ
]
F(x)

Aggregate Gradation for Sealcoat(Weibull Distribution Function)
F(x;κ,λ) = 1- exp[(-x/λ)κ
]
F(x)

Aggregate gradation
(cumulative Weibull distribution function)
F(x;κ,λ) = 1- exp[(-x/λ)κ
]
aagg,bagg and cagg λ and κ
IFI (N) = amix + bmix·exp(-cmix·N)
Calculate amix, bmix, cmix from predictive models
Aggregate texture and angularity
Texture (T) = atx + btx·exp(–ctx·t)
Angularity (T) = aga + bga·exp(–cga·t)
Friction Model
PSeSNIFI20
)50(01.0925.0045.0 ××+=
atx, btx, ctx, aga, bga, and cga

R² = 0.6297
10
15
20
25
30
35
40
45
50
55
60
10 15 20 25 30 35 40 45 50 55 60
SN (p
redi
cted
)
SN (measured)
Skid Number for HMA
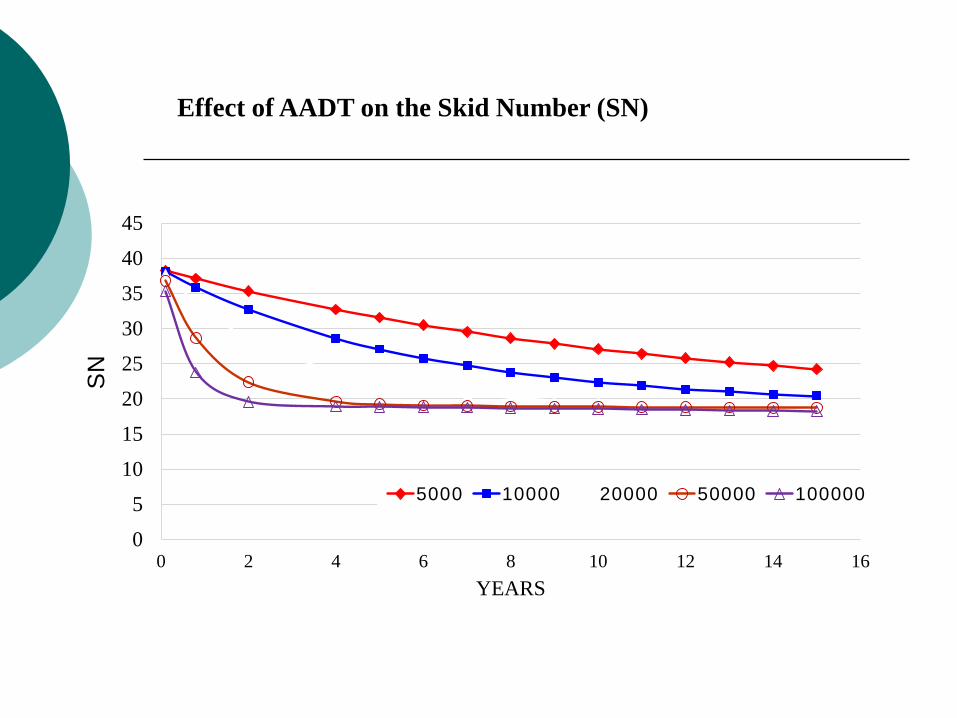
Effect of AADT on the Skid Number (SN)
0
5
10
15
20
25
30
35
40
45
0 2 4 6 8 10 12 14 16YEARS
5000 10000 20000 50000 100000
SN
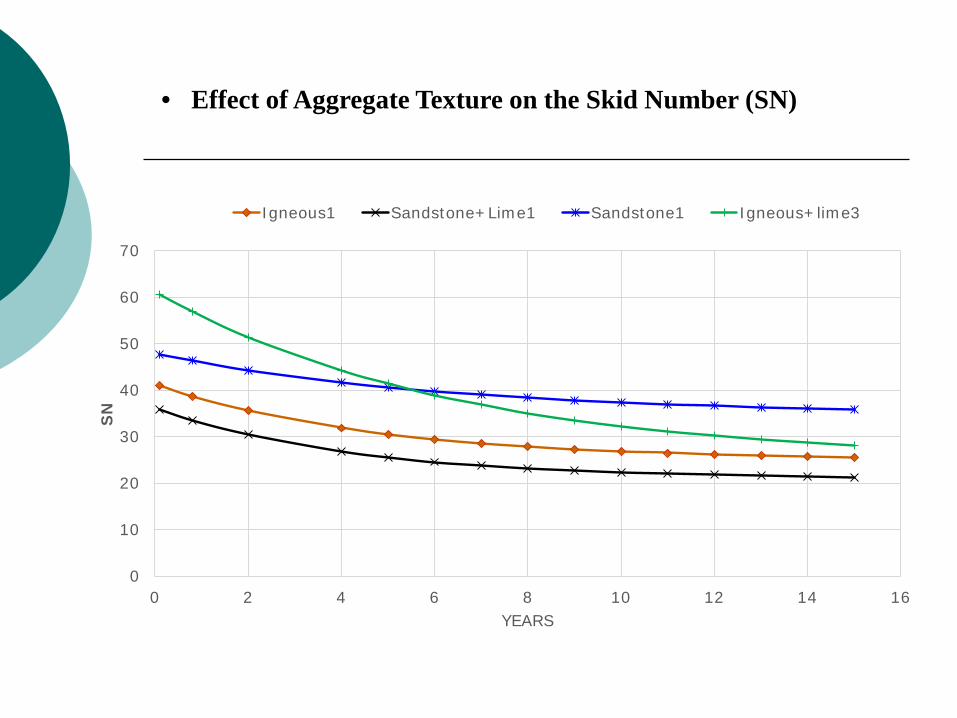
• Effect of Aggregate Texture on the Skid Number (SN)
0
10
20
30
40
50
60
70
0 2 4 6 8 10 12 14 16
SN
YEARS
Igneous1 Sandstone+Lime1 Sandstone1 Igneous+lime3

Effect of Mixture Gradation on the Skid Number (SN)
15
20
25
30
35
40
45
0 2 4 6 8 10 12 14 16
SN
YEARS
Type C Type D
PFC SMA_D
SMA_C

R² = 0.5869
0
10
20
30
40
50
60
70
0 10 20 30 40 50 60 70
SN (p
redi
cted
)
SN (measured)
Skid Number for Seal coat
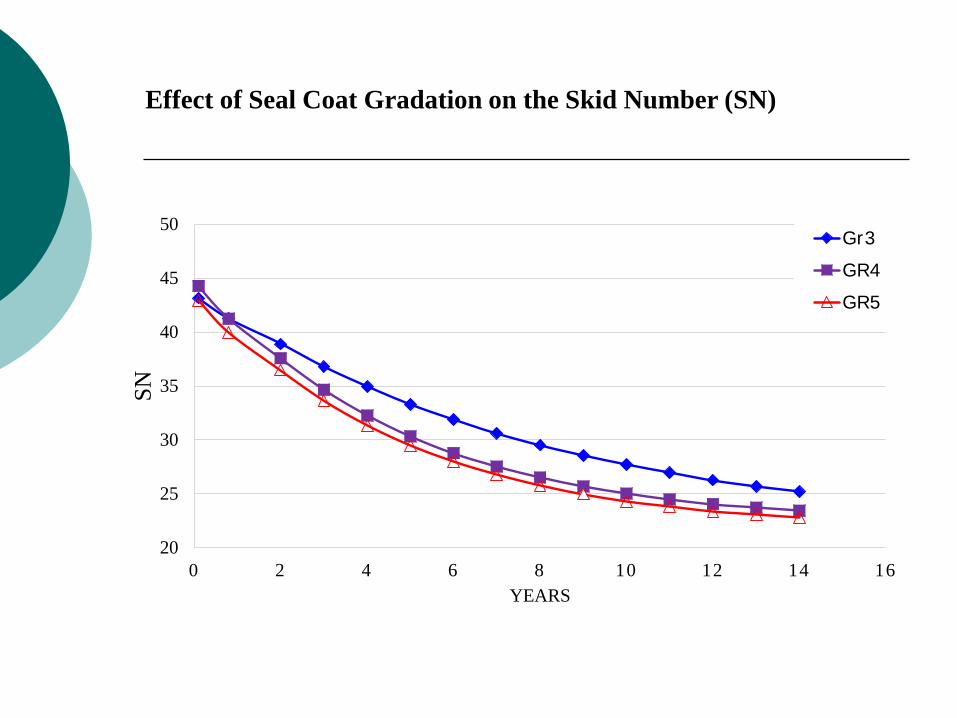
Effect of Seal Coat Gradation on the Skid Number (SN)
20
25
30
35
40
45
50
0 2 4 6 8 10 12 14 16
SN
YEARS
Gr3
GR4
GR5

Effect of AADT on the Skid Number (SN)
0
10
20
30
40
50
60
70
0 2 4 6 8 10 12 14 16
SN
YEARS
5000100002000050000

Effect of Aggregate Texture on the Skid Number (SN)
0
10
20
30
40
50
60
70
0 2 4 6 8 10 12 14 16
SN
YEARS
Sandstone Basalt Limestone1 Limestone2

Example of Influence of Aggregate and Gradation on Skid Resistance
Interstate US Highway State HighwayAADT 64500 5700 34000 550 16800 150Type C 21 29 23 31 26 31Type D 12 15 12 15 12 15
PFC 29 47 34 51 40 51SMA-D 29 54 36 60 45 60SMA-C 29 57 37 63 47 63
CMHB-C 29 57 37 63 47 63CMHB-F 7 11 7 11 7 11

Benefits
0.075 0.3 1.18 4.75 9.5 12.5 19Sieve Size, mm
Percent Passing, %
Years in Service
Ski
d N
umbe
r

Benefits
Replace the current time consuming methods Polishing of aggregate coupons for 9 hours. Measure the friction value of the specimens using the
British pendulum tester.

AIMS Draft AASHTO Test Procedures
AASHTO Designation TP81
AASHTO Designation PP64

AIMS Draft AASHTO Specifications

Thank You….
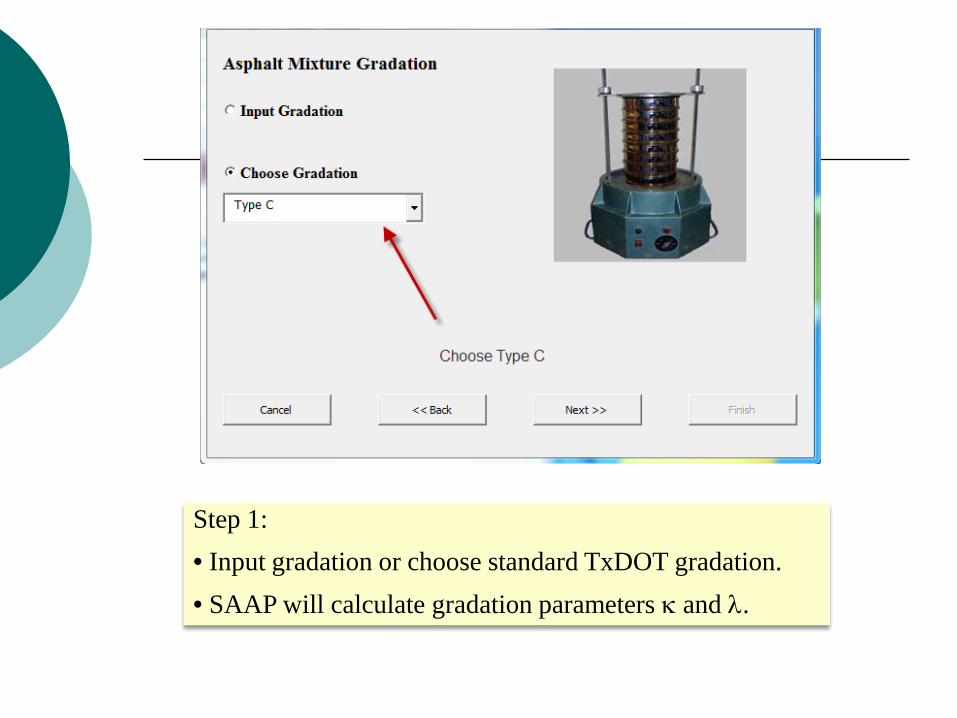
Step 1:• Input gradation or choose standard TxDOT gradation.• SAAP will calculate gradation parameters κ and λ.
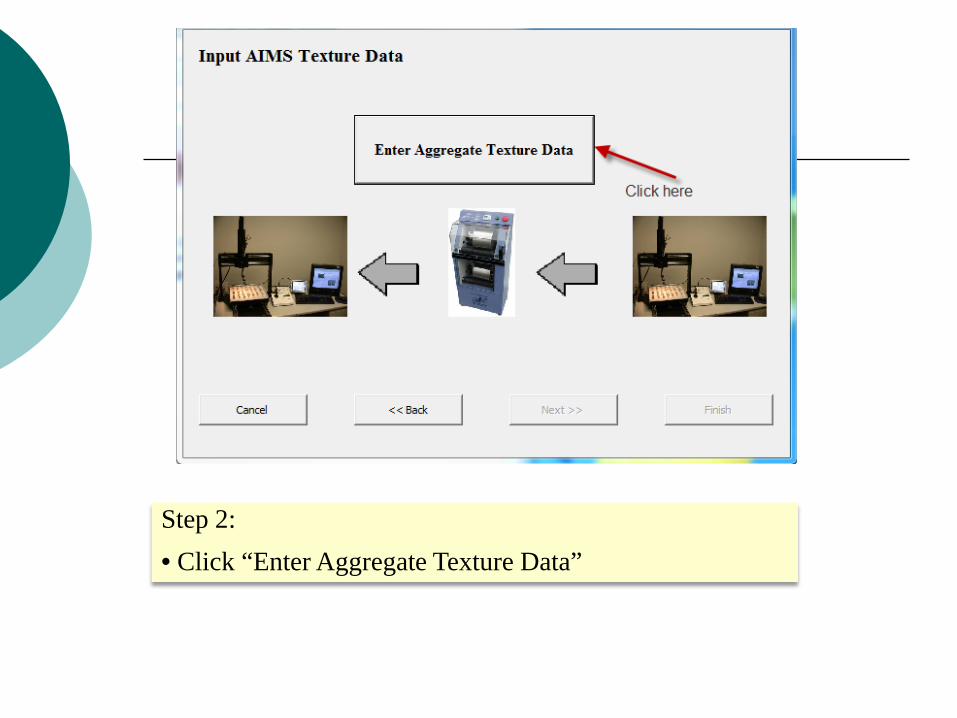
Step 2:• Click “Enter Aggregate Texture Data”

Step 3:• Choose AIMS texture data at two points:
•Before Micro-Deval Polishing.•After 105 minutes of Micro-Deval Polishing.
Or• AIMS texture data at three points (Note: more accurate than two points)
•Before Micro-Deval Polishing•After 105 minutes of Micro-Deval Polishing.•After 180 minutes of Micro-Deval Polishing.

Step 4:• Choose number of aggregate sources used in preparing the mixture.•Enter the proportion of each aggregate course in the mix.• Percent Passing Sieve 4 for each source.•Enter texture before and after Micro-Devel (Note: typical texture is from 50 (low) to 600 (high)).
Agg. #2Agg. #1Blend
Material
%Passing
%Passing
% Used
U.S. Sieve %Batch
%Batch
No. 4No. 8No. 16No. 30No. 50
No. 100No. 200
3/8 “279
2.10.90.300
1007070
61.632.922.416.8
7
70
70 %30 %
903073100
309779
63.733.822.716.8
7
1001001008847322410
100
Example:Number of Aggregate Sources = 2.Proportion of Aggregate in the Mix (Aggregate 1) = 30%Percent Passing Sieve 4 (Aggregate 1) = 90%Proportion of Aggregate in the Mix (Aggregate 2) = 70%Percent Passing Sieve 4 (Aggregate 1) = 100%

Step 5:• Enter the MPD of a new road right after construction Or•Use SAAP to estimate MPD based on gradation.

Step 5:• Enter road information and traffic data. • SAAP will use this data to calculate Traffic Multiplication Factor (TMF).
3651000
AADT Years in ServiceTMF × ×=
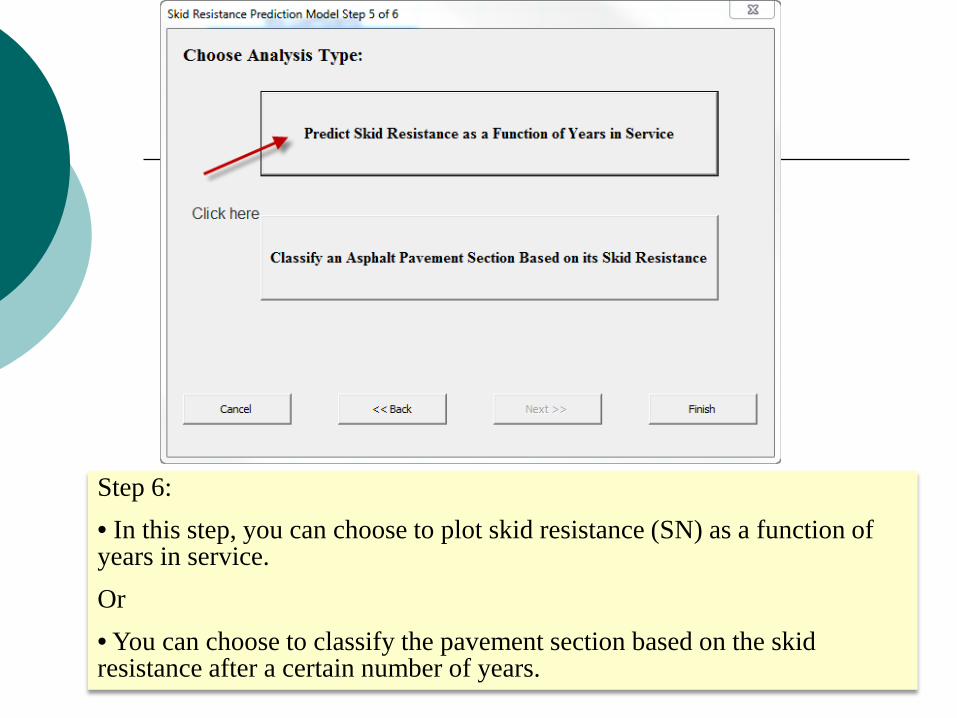
Step 6:• In this step, you can choose to plot skid resistance (SN) as a function of years in service.Or• You can choose to classify the pavement section based on the skid resistance after a certain number of years.

Step 7a:• If you choose to predict skid resistance, the above chart will be plotted.
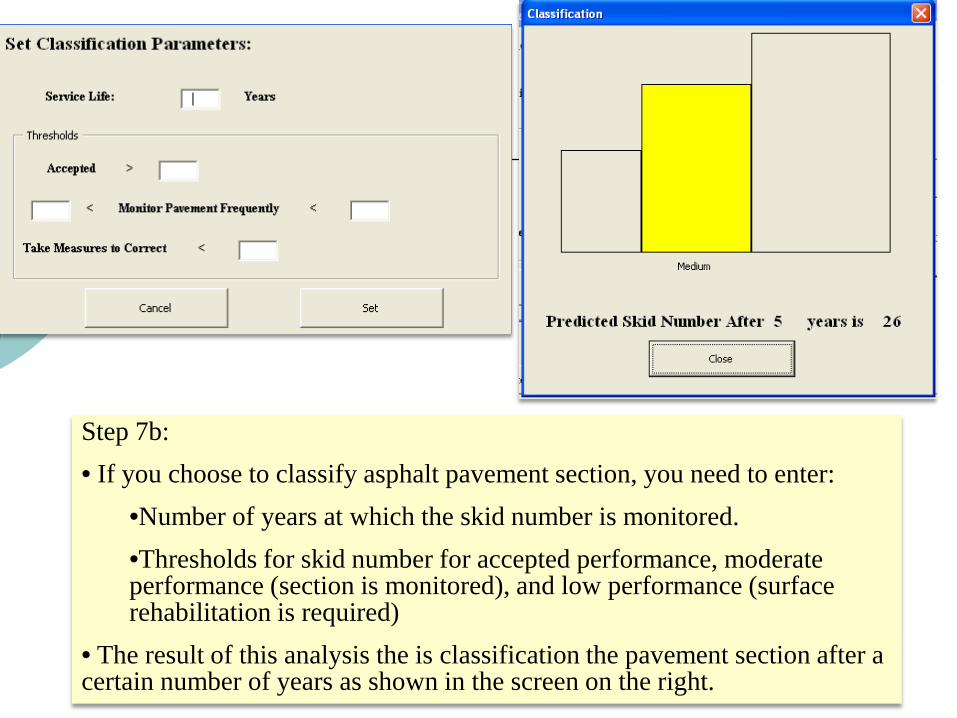
Step 7b:• If you choose to classify asphalt pavement section, you need to enter:
•Number of years at which the skid number is monitored.•Thresholds for skid number for accepted performance, moderate performance (section is monitored), and low performance (surface rehabilitation is required)
• The result of this analysis the is classification the pavement section after a certain number of years as shown in the screen on the right.