development of renewable energy in ukraine : … of renewable energy in ukraine : current status and...
TRANSCRIPT

Development of Renewable Energy in Ukraine :
Current Status and Prospects
Workshop“EBRD-USELF: Development and financing of renewable energy projects in Ukraine -
example for local banks?”
Kiev
29.05.2013
Aleksey Romanov, USELF Senior Commercial Expert,
IMEPOWER Consulting

Contents
Why is it necessary to encourage investments in the development of the renewable energy source power plants
What incentive mechanisms for investment in the development of the renewable energy source power plants are used in Ukraine
What is the current state of the development of the renewable energy source power plants in Ukraine
What problems are there that preventing the development of the renewable energy source power plants in Ukraine
What are the prospects for the development of the renewable energy source power plants in Ukraine
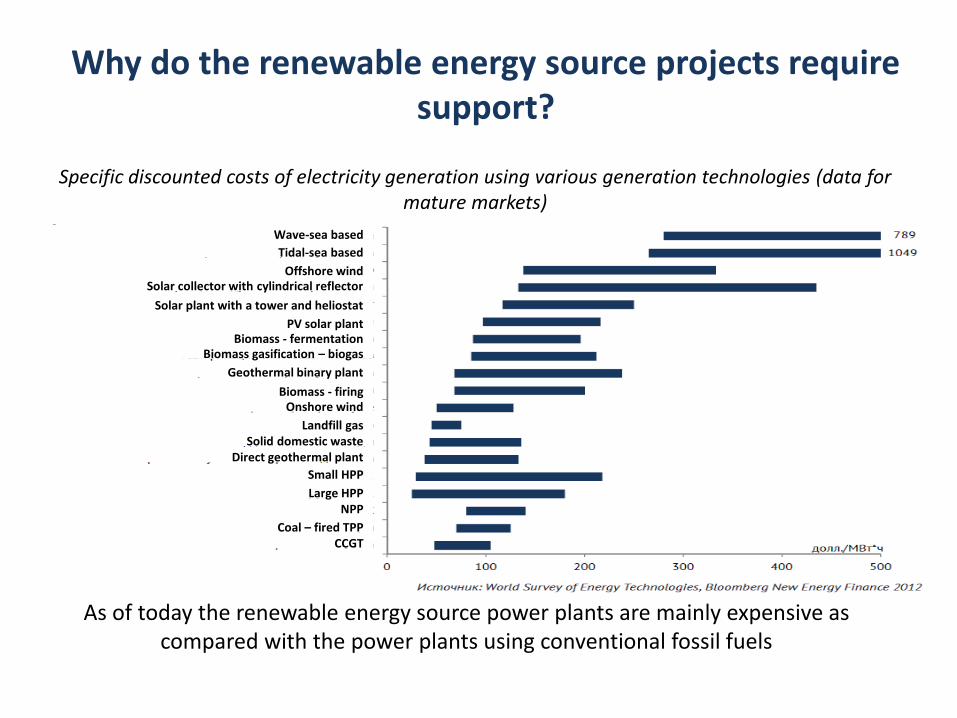
Why do the renewable energy source projects require support?
Specific discounted costs of electricity generation using various generation technologies (data for mature markets)
As of today the renewable energy source power plants are mainly expensive as compared with the power plants using conventional fossil fuels
Wave-sea based
Tidal-sea based
Offshore wind Solar collector with cylindrical reflector
Solar plant with a tower and heliostat
PV solar plant Biomass - fermentation
Biomass gasification – biogas
Geothermal binary plant
Biomass - firing
Onshore wind
Landfill gas
Solid domestic waste
Direct geothermal plant
Small HPP
Large HPP
NPP
Coal – fired TPP CCGT

Forecast of Grid Parity for Solar Power Plants
• Due to reduction of the cost of technologies the cost of “renewable” electricity is gradually coming down.
• In some countries the cost of electricity generated with the use of renewable energy sources became and in other countries can become comparable in the short term to the cost of electricity for the ultimate customers (having reached the so-called Grid Parity).
• In case of further reduction the costs of “renewable” electricity generation can become comparable to the costs of electricity generated by conventional power plants.

What kind of mechanisms of support of investments in the renewable energy source power plants are used in Europe
Support mechanisms
Power purchase on special tenders
Special tariffs or premium over market price
Green certificates, with minimum guaranteed price of purchase
Liberation from payment or special conditions of payment of imbalance
Priority dispatching
Priority connection and access to electric grids
Reduced grid connection charge
Refund or reduction of tax payments
Sources of financing
Tax payments
Special fees
Electricity tariffs for ultimate customers
Wholesale prices of electricity
With the use of support mechanisms 19 EU countries produced 9% of electricity in 2010 (at the peak of promotion of RES), while Ukraine produced less than 0.5% in 2012.

Role of renewable energy source power plants in IPS of Ukraine before introducing the support mechanisms
Installed capacity of
power plants as of
1.01.2010
Installed capacity of
power plants as of
1.01.2013
Electricity
generation in 2009
Electricity generation
in 2012
TPP 63.5 % 63 % 45.3 % 48.6 %
NPP 26.1 % 25.7 % 47.9 % 45.5 %
HPP 10.2 % 10.1 % 6.7 % 5.5 %
including small HPP
(up to 10 MW)
0.1 % 0.1 % 0.1 % 0.1 %
WPP 0.2 % 0.5 % 0 % 0.1 %
SPP 0 % 0.6 % 0 % 0.2 %
Biomass 0.00 % 0.01 % 0.00 % 0.01 %
Biogas 0 % 0 % 0 % 0 %
Total 52 958 MW
53 778 MW
173 103 million
kW●h
198 120 million kW●h
including
“green” ones
0.2 % 1.2 % 0.2 % 0.4 %
Over 3 years of operation of incentive mechanisms in Ukraine the installed capacity of “green” power plants has increased more than 5 times, and electricity generation has grown almost 3 times as much.

Legislation and mechanisms of support of renewable energy source power plants in Ukraine Basic Legislative and Other Acts
• Law of Ukraine “On Power Sector”
• Tax Code of Ukraine
• Rules for the Wholesale Electricity Market of Ukraine
Support Mechanisms In process of construction
• Reimbursement of expenses for connection of renewable energy source power plants to electric grids*
• Relief from VAT and import levy while importing equipment into the customs territory of Ukraine for the renewable energy source power plants having no counterparts in Ukraine *
In process of operation
• Special “green” tariff”
• Mandatory purchase by the wholesale market of the total amount of electricity supplied by the renewable energy source power plants (priority dispatching)
• Guaranteed access to electric grids
• Payment for electricity supplied to the wholesale market in full and on a priority basis by cash
• Income tax exemption on revenues from sales of electricity generated by renewable energy source power plants till 2011
In process of construction and operation
• Tax exemptions for the tax on the land plots for arrangement of renewable energy source power plants (only 25% of the standard tax rate are paid)
Legal guarantee of invariability of promotion conditions
• Maintenance of promotion regime applicable at the date of facility commissioning in case of changes in legislation.
* Practical application is limited due to imperfect implementation mechanism.

“Green tariff” for renewable energy source power plants
WPP Small HPP Biomass and biogas SPP
Green tariff is guaranteed till 31 December 2029
Electricity supply tariffs for different power plants using the renewable energy sources (minimum guaranteed rates) as compared with conventional power plants (for the power plants put into operation from 1 April 2013 through 31
December 2014), EUR/MW·h
Forecasted wholesale
price for May 2013
Conventional power plants

Planned reduction of the green tariff for the power plants put into operation starting from 2015 as compared to the tariff for customers
Solar Small HPP Biomass and biogas Wind Retail rate for customers
0
50
100
150
200
250
300
350
400
2013 2014 2015 2016 2017 2018 2019 2020 2021 2022 2023 2024 2025 2026 2027 2028 2029
EUR
/MW
·h
SPP SHPP Biomass and
biogas
WPP

Is the renewable energy expensive?
The 2012 results: renewable energy source power plants in the wholesale market
No. Groups of power plants
Amount of electricity supplied Cost of electricity supplied Average price of
electricity,
UAH/MW·h million kW●h % million UAH (including
VAT) %
1. All power plants 180 513 100.0 98 018 100.0 543
2. Renewable energy source
power plants
833 0.5 2 652 2.7 3 183
3. (1) - (2) 179 679 99.5 95 367 97.3 531
Cost of electricity supplied by RES power plants at green tariffs 2.7 billion UAH
Cost of electricity supplied by RES power plants at average tariff 0.5 billion UAH
Difference (1) 2.2 billion UAH
Net profit of operators of RES power plants at a 30 % rate of return (2) 0.8 billion UAH
(1) + (2) 3.0 billion UAH
Evaluation of benefits collected by renewable energy sources (RES) power plant in 2012:

Is the renewable energy expensive?
Expenses on support of RES power plants in Ukraine as compared to EU countries
Countries (2010) Expenses on support,
million EUR
Amount of electricity produced with the
use of support mechanisms, million kW·h
Gross energy
consumption, million
kW·h
Share of renewable energy
obtained support in gross
energy consumption
Ukraine (2012) 285 833 188.436 0.4%
France 1.511 17.528 444.100 3.9%
Germany 9.512 82.285 529.000 15.6%
Hungary 247 2.428 42.566 5.7%
Italy 3.427 30.552 330.000 9.3%
Luxemburg 14 139 6.600 2.1%
The Netherlands 690 8.999 106.900 8.4%
Norway 15 1.610 120.556 1.3%
Portugal 752 13.465 49.900 27.0%
Romania 37 677 41.300 1.6%
Slovenia 36 718 12.000 6.0%
Spain 5.371 61.044 260.600 23.4%
Sweden 483 17.260 131.200 13.2%
Great Britain 1.438 21.913 328.300 6.7%

Current ratio between different renewable energy source power plants
Groups of power plants
Installed capacity at the beginning of
2013 Electricity production in 2012
MW
% as per
group
% as
per
result million kW·h
% as per
group
% as per
result
SPP Activ Solar 348.583 93.8 53.7 329.073 98.6 42.0
Other ground SPP 22.817 6.1 3.5 4.477 1.3 0.6
Roof-top and facade SPP 0.163 0.0 0.0 0.04 0.0 0.0
Total for SPP 371.563 100.0 57.3 333.59 100.0 42.5
“New" WPP 110 56.7 16.9 198.725 77.2 25.3
“Old" WPP 83.836 43.3 12.9 58.776 22.8 7.5
Total for WPP 193.836 100.0 29.9 257.501 100.0 32.8
Small HPP 73.453 100 11.3 171.943 100 21.9
Biomass power plants 6.2 100 1.0 17.662 100 2.3
Biogas power plants 3.955 100 0.6 3.538 100 0.5
Total 649.007 100.0 784.234 100.0
Source: NAER

Main factors hindering development of the renewable energy market for electricity production
Factor Types of projects concerned Solution approach
Subsidized electricity tariffs for residential
customers, subsidized natural gas tariffs for
ultimate customers and teplokomunenergos
[utility enterprises], partial inclusion of investment
and other expenditures in the cost of electricity
generated by conventional power plants
All types Liberalization of energy market and reduction of
tariffs to economically sound level
Under-high level of green tariff Biomass and biogas Review of green tariff coefficients
Local content Wind, biogas, biomass, solar Review of legislation on local content
Lack of possibility for making long-term feedstock
supply contracts
Wood-based biomass Review of legislation and business practice of state
forest sector
Lack of possibility for the use of biomass products,
only waste is permitted to use
Biomass and biogas Review of legislation
Lack of green tariff Co-combustion of renewable and conventional
sources of energy
Review of legislation
Environmental constraints Small HPP Individual approach to projects
Difficulties in the implementation of permitting
procedures
All types Simplification of permitting procedures and
harmonization of practice of their application
Lack of flexing generating capacities, particularly in
some parts of the power system
Wind and solar Reconstruction and new construction of electric
grids and flexing generating plants, implementation
of practice and regular power system planning
Impossibility to approve the green tariff before
starting financing of project
All types Review of legislation
Difficulties in application of tax exemptions when
importing equipment
All types Simplification of procedures and harmonization of
practice of their application
Selective approach while reimbursing costs of
connection
All types Harmonization of practice of application,
development and approval of bylaws

Local Content
Solar projects Component content
elements
Operations to be carried
out on the territory of
Ukraine
Fixed share in the cost of
the power plant, %
Polycrystalline silicon Production 32
Single-crystal, multi-
crystal or pseudo-
crystalline ingots
Production 13
Single-crystal and
pseudo-crystalline plates
Production 7
Photovoltaic cells Production 20
Photovoltaic modules Assembly 23
Construction works Performance 5
Total 100
In order to obtain the green tariff, it is necessary to ensure: 30% - for the power plants put into operation starting from 1.06.2013 50% - for the power plants put into operation starting from 1.06.2014
In consequence of premature introduction of the local content most of projects will deal with lack of equipment and exclusively high prices for it Local content requirements (not applied to the power plants the construction of which began before 1 January 2012 and to small HPP projects)
Wind projects Component content
elements
Operations to be
carried out on the
territory of Ukraine
Fixed share in the cost
of the power plant, %
Blades Production 15
Tower Production 15
Nacelle Assembly 30
Main frame Production 5
Main shaft Production 5
Rotor Production (casting) 5
Assembly 5
Construction works Performance 20
Total 100
In order to obtain the green tariff, it is necessary to ensure: 30% - for the power plants put into operation starting from 1.06.2013 50% - for the power plants put into operation starting from 1.06.2014

Local Content In consequence of premature introduction of the local content most of projects will deal with lack of equipment and exclusively high prices for it Local content requirements (not applied to the power plants the construction of which began before 1 January 2012 and to small HPP projects)
Biomass burning projects
Component content
elements
Operations to be
carried out on the
territory of Ukraine
Fixed share in the cost
of the power plant, %
Turbine Production 25
Boiler Production 35
Construction works Performance 40
Total 100
In order to obtain the green tariff, it is necessary to ensure: 30% - for the power plants put into operation starting from 1.06.2013 50% - for the power plants put into operation starting
from 1.06.2014
Biogas burning projects
Component content
elements
Operations to be
carried out on the
territory of Ukraine
Fixed share in the cost
of the power plant, %
Digester Production 35
Cogenerator Production 35
Construction works Performance 30
Total 100
In order to obtain the green tariff, it is necessary to ensure : 30% - for the power plants put into operation starting from
1.01.2014 50% - for the power plants put into operation starting from 1.01.2015

Current and long-term contractual relations for electricity sale
Buyers Energy supply companies
Wholesale electricity supplier
(SE “Energorynok”)
Conventional power plants
Renewable energy source power plants
Current Single-Buyer Model
Wholesale market (current model of “Single Buyer” market)
Advanced Model of Direct Contracts
“Non-eligible” electricity customers Energy supply companies
“Eligible" electricity customers
Value imbalance fund
“Cheap" conventional power plants
“Expensive" conventional power
plants
Renewable energy source power plants
Wholesale market (advanced model as related to direct contracts)
Electricity
Payments
Market Operator

Renewable Energy Source Development Plans Ukraine has considerable potential for the use of renewable energy sources
Directions of RES development Annual technically achievable energy potential, million toe
1. Wind energy 28,0
2. Solar energy, including 6.0
2.1. - electric 2.0
2.2. - thermal 4.0
3. Small hydropower 3.0
4. Bioenergy, including: 31.0
4.1. - electric 10.3
4.2. - thermal 20.7
5. Geothermal heat-power engineering 12.0
6. Environmental energy (heat pumps) 18.0
Total volume of replacement of conventional fuel and power resources 98.0
Preliminary updated energy strategy provides for the priority development of wind and solar power plants
Forecast of electricity generation from RES
ТW-h 2010 2015 2020 2025 2030
Wind power generation 0.1 0.6 1.9 3.8 7.4
Solar power generation <0.1 0.3 0.8 1.4 2.6
Small HPP 0.2 0.4 0.7 1.3 2.1
Bioenergy generation <0.1 <0.1 0.2 0.2 0.3
Generation from other RES <0.1 <0.1 <0.1 0.1 0.2
Total, production from RES <0.4 <1.4 3.6 6.8 12.6 Source: Preliminary updated energy strategy for the period until 2030
Source: NAER
In case of the implementation of these plans a share of renewable energy source power plants will be about 10% by 2013 in the total balance of installed capacities, which is much lower than the target share of renewable energy sources in the EU energy balance – 20% of the volume of electricity consumption till 2020
Thank you for attention!
USELF Office
4th floor, Office 4B,
BC Horizon Office Towers
42-44 Shovkovychna Street,
01601 Kyiv, Ukraine
Tel.: +38 095 8998 443
E-mail: [email protected]
Web-site: www.uself.com.ua