development of seismic fragility functions for a moment
TRANSCRIPT

Development of Seismic Fragility Functions for a Moment ResistingReinforced Concrete Framed Structure
McCrum, D. P., Amato, G., & Suhail, R. (2016). Development of Seismic Fragility Functions for a MomentResisting Reinforced Concrete Framed Structure. The Open Construction and Building Technology Journal,10(Suppl 1: M2), 42-51. https://doi.org/10.2174/1874836801610010042
Published in:The Open Construction and Building Technology Journal
Document Version:Publisher's PDF, also known as Version of record
Queen's University Belfast - Research Portal:Link to publication record in Queen's University Belfast Research Portal
Publisher rights© 2015 The Authors.This is an open access article licensed under the terms of the Creative Commons Attribution-Non-Commercial 4.0 International PublicLicense (CC BY-NC 4.0) (https://creativecommons.org/licenses/by-nc/4.0/legalcode), which permits unrestricted, non-commercial use,distribution and reproduction in any medium, provided the work is properly cited.
General rightsCopyright for the publications made accessible via the Queen's University Belfast Research Portal is retained by the author(s) and / or othercopyright owners and it is a condition of accessing these publications that users recognise and abide by the legal requirements associatedwith these rights.
Take down policyThe Research Portal is Queen's institutional repository that provides access to Queen's research output. Every effort has been made toensure that content in the Research Portal does not infringe any person's rights, or applicable UK laws. If you discover content in theResearch Portal that you believe breaches copyright or violates any law, please contact [email protected].
Download date:04. Apr. 2022

Send Orders for Reprints to [email protected]
42 The Open Construction and Building Technology Journal, 2016, 10, (Suppl 1: M2) 42-51
1874-8368/16 2016 Bentham Open
The Open Construction and BuildingTechnology Journal
Content list available at: www.benthamopen.com/TOBCTJ/
DOI: 10.2174/1874836801610010042
Development of Seismic Fragility Functions for a Moment ResistingReinforced Concrete Framed Structure
D. P. McCrum, G. Amato* and R. Suhail
School of Planning, Architecture and Civil Engineering, Queen's University of Belfast, Belfast, United Kingdom
Abstract: Understanding the seismic vulnerability of building structures is important for seismic engineers, building owners, riskinsurers and governments. Seismic vulnerability defines a buildings predisposition to be damaged as a result of an earthquake of agiven severity. There are two components to seismic risk; the seismic hazard and the exposure of the structural inventory to anygiven earthquake event. This paper demonstrates the development of fragility curves at different damage states using a detailedmechanical model of a moment resisting reinforced concrete structure typical of Southern Europe. The mechanical model consists ofa complex three-dimensional finite element model of the reinforced concrete moment resisting frame structure and is used to definethe damage states through pushover analysis. Fragility curves are also defined using the HAZUS macro-seismic methodology and theRisk-UE macro-seismic methodology. Comparison of the mechanically modelled and HAZUS fragility curve shows good agreementwhile the Risk-UE methodology shows reasonably poor agreement.
Keywords: Abaqus, FEM, Fragility functions, Reinforced concrete, Vulnerability.
1. INTRODUCTION
Seismic risk of the built environment comprises of the earthquake hazard and the exposure of the built environmentto earthquake damage. The seismic hazard is defined through seismic hazard maps [1] which represent the likelihood ofa certain ground motion on a local, regional and national level. The level of potential ground motion on a site dependson the type of faults e.g. dip-slip or strike-slip, in the area under consideration and on their size.
Within seismic hazard analysis the mapping of European countries through the SHARE project [2] has resulted ingreatly improved seismic hazard maps that are open source. Moreover, collaborative projects involving data collectionand web-based computational platforms such as the Global Earthquake Model (GEM) Project(www.globalquakemodel.org) and OpenQuake [3] are pushing the development of risk assessment at global, nationaland local scales.
To assess the exposure of a built area to seismic damage a macro-seismic vulnerability method has been classicallyused [4]. This approach, based on observed and statistically analysed damage, classifies the existing building stocks interms of structural typology, material and design code level. One of the issues of concern within the field of seismic riskassessment is the lack of detail used to characterise the existing building stock. Often, the height (therefore the period ofvibration), construction type e.g. steel/reinforced concrete and date of construction i.e. whether seismic design codeswere used or not, are the only parameters taken into consideration. This is understandable, particularly coming from acity planning or catastrophe risk insurance point of view where detailed classification of building stock is limited. Thisproject aims to provide some physically modelled seismic structural response data to aid validation of the fragilitycurves achieved through statistical methodologies.
The exposure is calculated by computing fragility functions, that is by measuring the probability of each buildingtype of exceeding a quantified set of damage states.
* Address correspondence to this author at the School of Planning, Architecture and Civil Engineering, David Keir Building, Queen’s UniversityBelfast, BT9 5AG, United Kingdom; Tel: +44 (0)28 9097 4006; Fax: +44 (0)28 9097 4278; E-mail: [email protected]
Development of Seismic Fragility Functions The Open Construction and Building Technology Journal, 2016, Volume 10 43
These damage states are typically levels of displacement drift in a structure in which for example the structure firstyields, reaches ultimate limit state or collapses. Finally, the seismic risk is represented by a vulnerability function whichis the probabilistic distribution of a loss ratio conditional on a certain level of ground motion [5] and depends on boththe structural stock exposure and the local seismic hazard.
In this paper, the vulnerability curves of a medium height framed reinforced concrete (RC) structure obtained usingmacro-seismic approaches are assessed using a sophisticated Finite Element (FE) model of a three-storey momentresisting RC sub-frame. A pushover analysis is performed on the structure and damage states are defined by visualobservation and a mechanical method presented in the framework of the Risk-UE project [6, 7], a European projectaiming at assessing earthquake scenarios on European cities with regard to current and historical buildings. The damagestates are then compared to those defined through the HAZUS [8] macro-seismic method.
The structure has been designed according to Eurocode 8 [9] and Eurocode 2 [10] and is typical of modernconstruction within Europe. Many seismic risk studies have been performed on existing non-code designed RCstructures to better understand their performance, however few exist on more recently constructed buildings.
2. PUSHOVER ANALYSIS OF A THREE-DIMENSIONAL REINFORCED CONCRETE FRAMEDSTRUCTURE
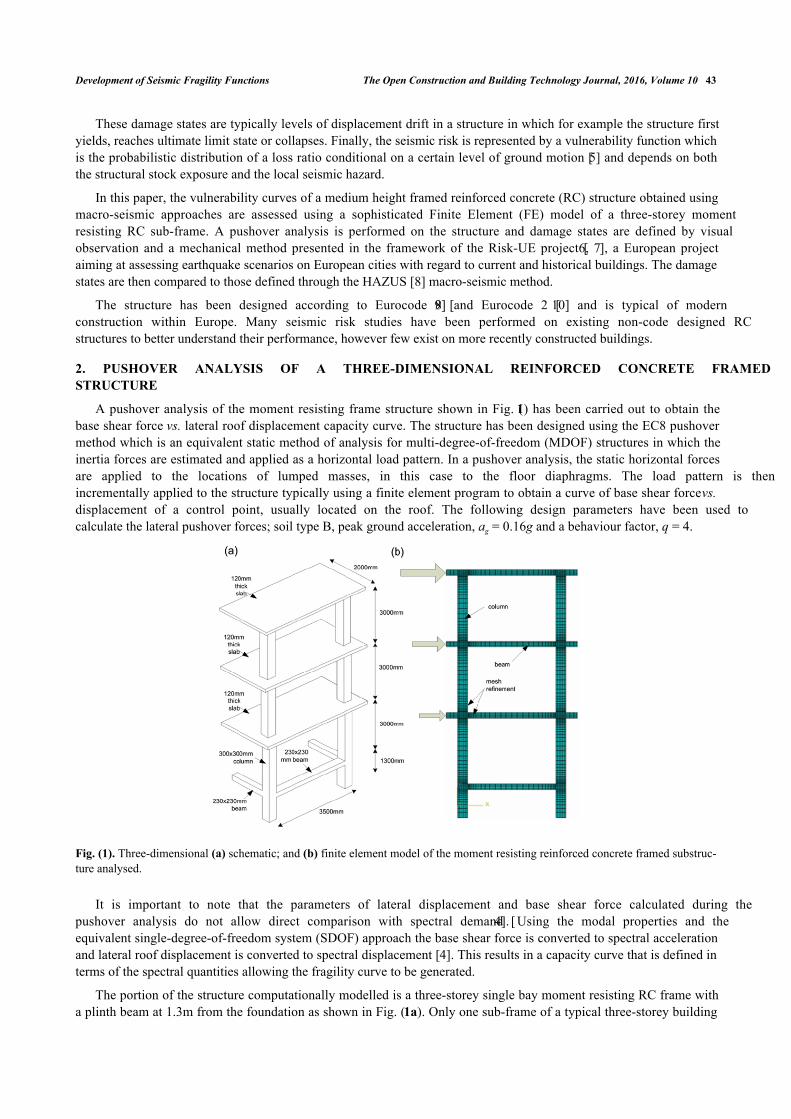
A pushover analysis of the moment resisting frame structure shown in Fig. (1) has been carried out to obtain thebase shear force vs. lateral roof displacement capacity curve. The structure has been designed using the EC8 pushovermethod which is an equivalent static method of analysis for multi-degree-of-freedom (MDOF) structures in which theinertia forces are estimated and applied as a horizontal load pattern. In a pushover analysis, the static horizontal forcesare applied to the locations of lumped masses, in this case to the floor diaphragms. The load pattern is thenincrementally applied to the structure typically using a finite element program to obtain a curve of base shear force vs.displacement of a control point, usually located on the roof. The following design parameters have been used tocalculate the lateral pushover forces; soil type B, peak ground acceleration, ag = 0.16g and a behaviour factor, q = 4.
Fig. (1). Three-dimensional (a) schematic; and (b) finite element model of the moment resisting reinforced concrete framed substruc-ture analysed.
It is important to note that the parameters of lateral displacement and base shear force calculated during thepushover analysis do not allow direct comparison with spectral demand [4]. Using the modal properties and theequivalent single-degree-of-freedom system (SDOF) approach the base shear force is converted to spectral accelerationand lateral roof displacement is converted to spectral displacement [4]. This results in a capacity curve that is defined interms of the spectral quantities allowing the fragility curve to be generated.
The portion of the structure computationally modelled is a three-storey single bay moment resisting RC frame witha plinth beam at 1.3m from the foundation as shown in Fig. (1a). Only one sub-frame of a typical three-storey building

44 The Open Construction and Building Technology Journal, 2016, Volume 10 McCrum et al.
was computationally modelled to reduce computational time and demand. The pushover load pattern has beencalculated for the sub-frame of the building shown in Fig. (1a). Therefore, the results are scalable to an entire framedstructure. Each storey height in the building is 3.0m, with column cross-sections of 300 mm x 300 mm and beam cross-sections of 230 mm x 230 mm throughout. Floor slabs are 120 mm in thickness. Concrete cover in columns and beamswas taken as 30 mm and 25mm, respectively. All floors were loaded with a uniformly distributed superimposed deadload of 1kN/m2 and live load of 2.5kN/m2. A compressive strength of 34 N/mm2 is used for the concrete in thisstudy.The material properties of the reinforcing steel are given in Table 1.
Table 1. Material properties for steel reinforcement.
Bar Dia.(mm) Steel Use Eo
(GPa)fy
(MPa)fu
(MPa)8 Column Shear Link Bar 214 551 64310 Beam Shear Link Bar 213 447 53816 Column Longitudinal Bar 214 420 54120 Beam Longitudinal Bar 210 449 568
A finite element model of the building was developed in ABAQUS 6.13 [11] as shown in Fig. (1b). In this studyConcrete Damage Plasticity Model (CDPM) developed by Lubliner et al. [12] with modifications proposed by Lee andFenves [17] is used. CDPM in ABAQUS uses the concept of isotropic damage and is used in combination with theisotropic tensile and compressive plasticity to represent the nonlinear behaviour of the concrete [13]. CDPM inABAQUS is defined using uniaxial compression and tension response of concrete, and requires five constitutiveparameters to define the shape of yield surface and flow potential surface [11].
In this study the constitutive law for uniaxial compression response of the unconfined concrete proposed byThorenfeldt [14]. Tension response of the concrete is defined using the stress-crack opening displacement relationshipproposed by Hordijk [15]. Fracture energy required to define tension softening of concrete is calculated using theexpression
Gf = 73 fc0.18 given in CEB-FIB Model Code 2010 [16]. The constitutive parameters used to define yield surface andflow potential surface are: dilation angle(ψ),flow potential eccentricity(ε), ratio of strength of concrete under biaxialcompression to the strength under uniaxial compression (fb0/fc0), ratio of strength of concrete under biaxial compressionto strength under tri-axial compression (K) and viscosity parameter (μ). Values of these constitutive parameters used inthis study are shown in Table 2 and are based on literature research on CDPM [17 - 19].
The RC frame is modelled using 3D brick elements and 2D truss elements. The 8 node C3D8R linear brick elementis used to model the nonlinear behaviour of the concrete frame. C3D8R is a first order continuum stress/displacementsolid finite element capable of satisfactorily capturing the nonlinear response of concrete when used with hourglassstiffness control. The enhanced hourglass stiffness option available in ABAQUS is used to alleviate the effect of zeroenergy modes due to reduced integration. The steel reinforcement is modelled using a 2 node 2D truss element, namelyT3D2. Reinforcement is embedded inside the concrete frame using embedded technique which assumes a perfect bondbetween reinforcement and concrete. A mesh sensitivity analysis was performed to ensure solution accuracy at criticallocations such as the beam-column, whilst minimisingmesh refinement at less critical locations in order to reduce thecomputation time.
3. CAPACITY CURVE RESULTS
The base shear force vs. lateral roof displacement curve obtained from the lateral pushover analysis of the sub-frameperformed according to EC8 is shown in Fig. (2). The model failed due to lack of convergence at 238.33 mm. This does
Table 2. ABAQUS concrete damage plasticity model parameters.
Ψ (deg) ε K Μ
36° 0.1 1.16 2/3 10-7
Development of Seismic Fragility Functions The Open Construction and Building Technology Journal, 2016, Volume 10 45
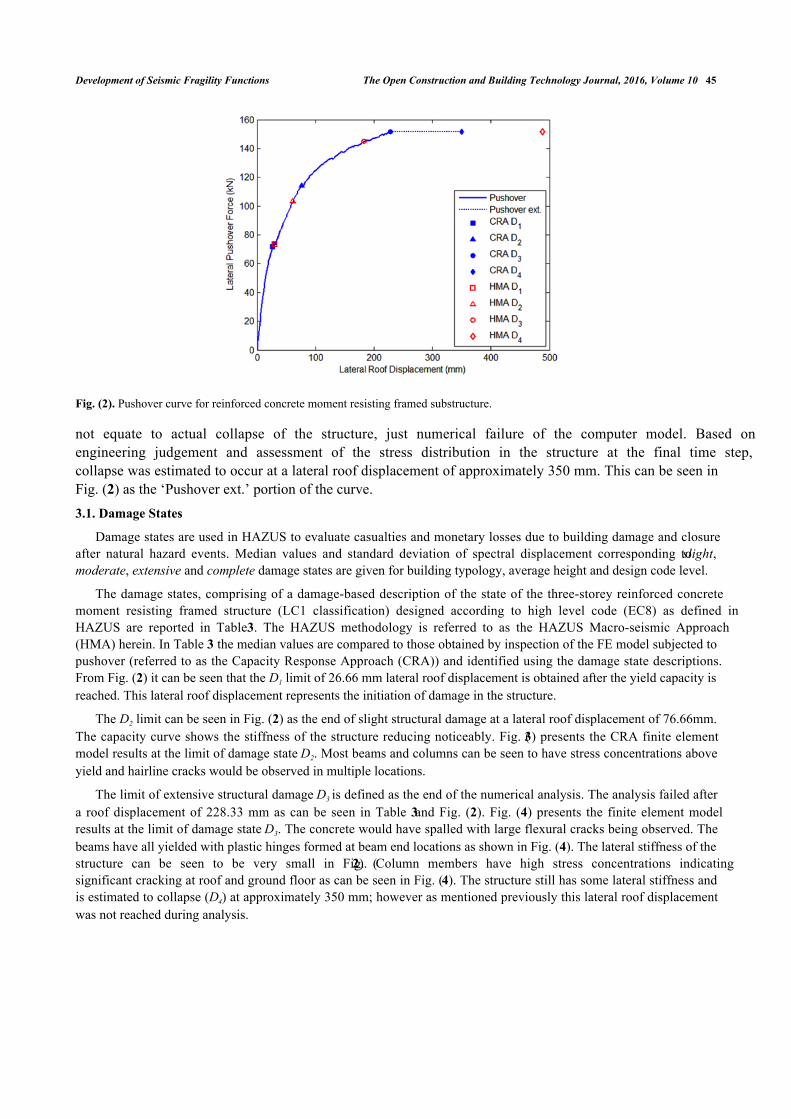
Fig. (2). Pushover curve for reinforced concrete moment resisting framed substructure.
not equate to actual collapse of the structure, just numerical failure of the computer model. Based onengineering judgement and assessment of the stress distribution in the structure at the final time step,collapse was estimated to occur at a lateral roof displacement of approximately 350 mm. This can be seen inFig. (2) as the ‘Pushover ext.’ portion of the curve.3.1. Damage States
Damage states are used in HAZUS to evaluate casualties and monetary losses due to building damage and closureafter natural hazard events. Median values and standard deviation of spectral displacement corresponding to slight,moderate, extensive and complete damage states are given for building typology, average height and design code level.
The damage states, comprising of a damage-based description of the state of the three-storey reinforced concretemoment resisting framed structure (LC1 classification) designed according to high level code (EC8) as defined inHAZUS are reported in Table 3. The HAZUS methodology is referred to as the HAZUS Macro-seismic Approach(HMA) herein. In Table 3 the median values are compared to those obtained by inspection of the FE model subjected topushover (referred to as the Capacity Response Approach (CRA)) and identified using the damage state descriptions.From Fig. (2) it can be seen that the D1 limit of 26.66 mm lateral roof displacement is obtained after the yield capacity isreached. This lateral roof displacement represents the initiation of damage in the structure.
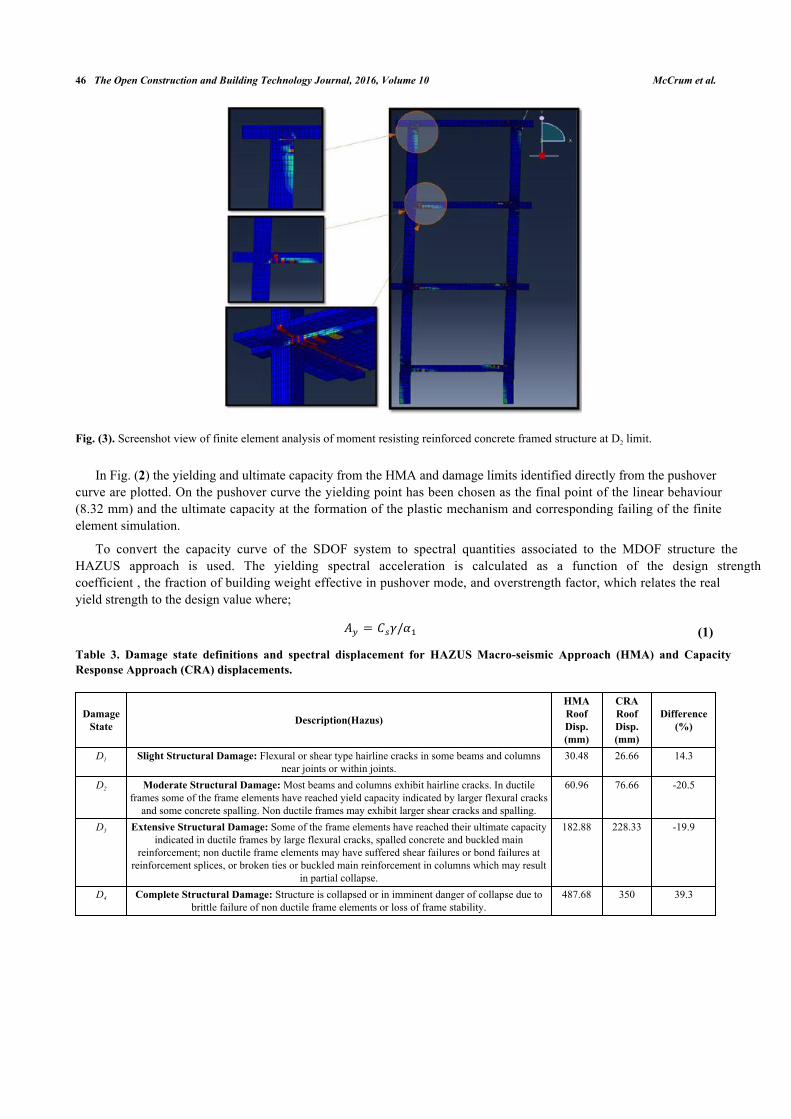
The D2 limit can be seen in Fig. (2) as the end of slight structural damage at a lateral roof displacement of 76.66mm.The capacity curve shows the stiffness of the structure reducing noticeably. Fig. (3) presents the CRA finite elementmodel results at the limit of damage state D2. Most beams and columns can be seen to have stress concentrations aboveyield and hairline cracks would be observed in multiple locations.
The limit of extensive structural damage D3 is defined as the end of the numerical analysis. The analysis failed aftera roof displacement of 228.33 mm as can be seen in Table 3 and Fig. (2). Fig. (4) presents the finite element modelresults at the limit of damage state D3. The concrete would have spalled with large flexural cracks being observed. Thebeams have all yielded with plastic hinges formed at beam end locations as shown in Fig. (4). The lateral stiffness of thestructure can be seen to be very small in Fig. (2). Column members have high stress concentrations indicatingsignificant cracking at roof and ground floor as can be seen in Fig. (4). The structure still has some lateral stiffness andis estimated to collapse (D4) at approximately 350 mm; however as mentioned previously this lateral roof displacementwas not reached during analysis.
46 The Open Construction and Building Technology Journal, 2016, Volume 10 McCrum et al.
Fig. (3). Screenshot view of finite element analysis of moment resisting reinforced concrete framed structure at D2 limit.
In Fig. (2) the yielding and ultimate capacity from the HMA and damage limits identified directly from the pushovercurve are plotted. On the pushover curve the yielding point has been chosen as the final point of the linear behaviour(8.32 mm) and the ultimate capacity at the formation of the plastic mechanism and corresponding failing of the finiteelement simulation.
To convert the capacity curve of the SDOF system to spectral quantities associated to the MDOF structure theHAZUS approach is used. The yielding spectral acceleration is calculated as a function of the design strengthcoefficient , the fraction of building weight effective in pushover mode, and overstrength factor, which relates the realyield strength to the design value where;
(1)
Table 3. Damage state definitions and spectral displacement for HAZUS Macro-seismic Approach (HMA) and CapacityResponse Approach (CRA) displacements.
DamageState Description(Hazus)
HMARoofDisp.(mm)
CRARoofDisp.(mm)
Difference(%)
D1 Slight Structural Damage: Flexural or shear type hairline cracks in some beams and columnsnear joints or within joints.
30.48 26.66 14.3
D2 Moderate Structural Damage: Most beams and columns exhibit hairline cracks. In ductileframes some of the frame elements have reached yield capacity indicated by larger flexural cracks
and some concrete spalling. Non ductile frames may exhibit larger shear cracks and spalling.
60.96 76.66 -20.5
D3 Extensive Structural Damage: Some of the frame elements have reached their ultimate capacityindicated in ductile frames by large flexural cracks, spalled concrete and buckled main
reinforcement; non ductile frame elements may have suffered shear failures or bond failures atreinforcement splices, or broken ties or buckled main reinforcement in columns which may result
in partial collapse.
182.88 228.33 -19.9
D4 Complete Structural Damage: Structure is collapsed or in imminent danger of collapse due tobrittle failure of non ductile frame elements or loss of frame stability.
487.68 350 39.3

Development of Seismic Fragility Functions The Open Construction and Building Technology Journal, 2016, Volume 10 47
Fig. (4). Screenshot view of finite element analysis of moment resisting reinforced concrete framed structure at D3 limit.
The yielding spectral displacement, Sd, y is obtained as a function of the elastic period of the structure, Te ;
(2)
Ultimate spectral values are given as a function of ductility, µ and overstrength ratio, λ where;
(3)
(4)
All coefficients are reported in tables according to the structure type and level of design code in HAZUS. Spectraldisplacement, Sd,k and acceleration, Ad,k are related to lateral roof displacement, Dk and base shear force, F respectively,by the height response factors, α2 and the fraction of building weight, W at location of pushover mode displacement, α1
as follows;
(5)
(6)
4. ALTERNATIVE MECHANICAL APPROACH
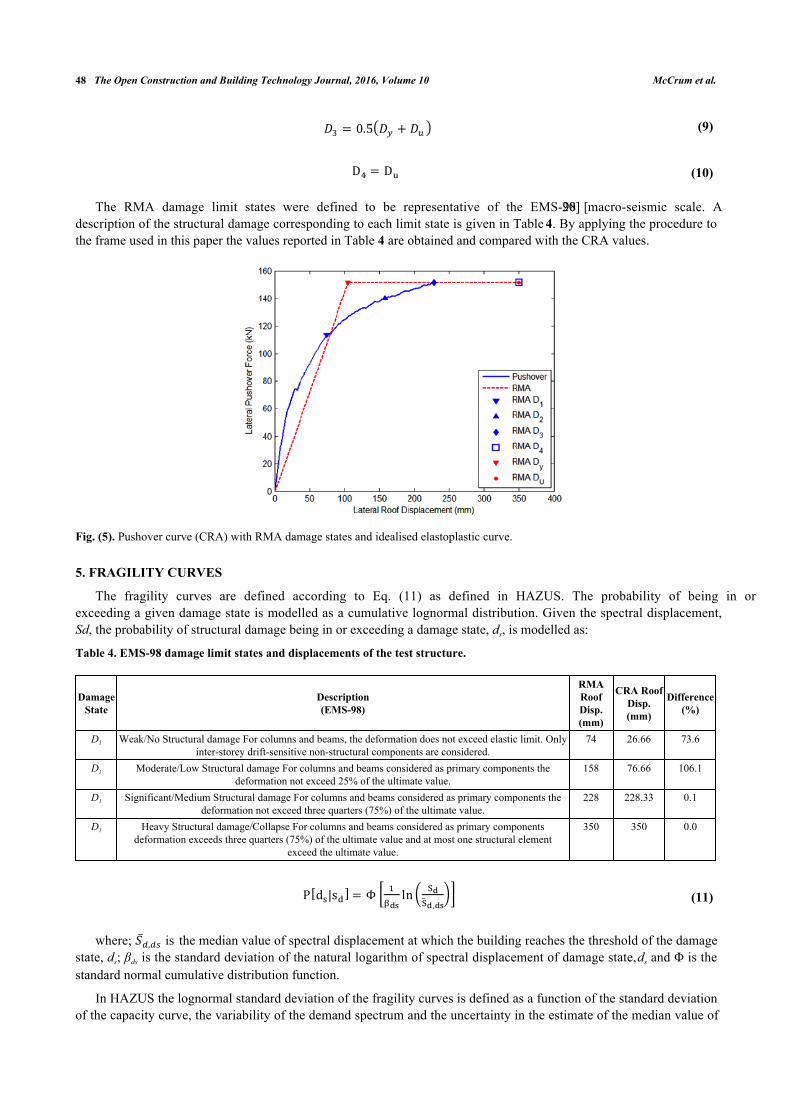
In order to use an automatic procedure for defining the idealisedelasto-plastic capacity curve corresponding to apushover force-displacement curve, EC8 defines the yielding displacement, Dv as the displacement for which the energyassociated to the two curves is the same, see Fig. (5). This value does not represent the end of the elastic curve of thestructure nor the real yield capacity. According to this approach in the RISK-UE project [7], referred to as the Risk-UEMechanical Approach (RMA) herein, the damage state limits are set as a function of the yielding, Dy and ultimatedisplacements Du;
(7)
(8)
Sd,k = α2 Dk
Ad,k = α1 W F
48 The Open Construction and Building Technology Journal, 2016, Volume 10 McCrum et al.
(9)
(10)
The RMA damage limit states were defined to be representative of the EMS-98 [20] macro-seismic scale. Adescription of the structural damage corresponding to each limit state is given in Table 4. By applying the procedure tothe frame used in this paper the values reported in Table 4 are obtained and compared with the CRA values.
Fig. (5). Pushover curve (CRA) with RMA damage states and idealised elastoplastic curve.
5. FRAGILITY CURVES
The fragility curves are defined according to Eq. (11) as defined in HAZUS. The probability of being in orexceeding a given damage state is modelled as a cumulative lognormal distribution. Given the spectral displacement,Sd, the probability of structural damage being in or exceeding a damage state, ds, is modelled as:
Table 4. EMS-98 damage limit states and displacements of the test structure.
DamageState
Description(EMS-98)
RMARoofDisp.(mm)
CRA RoofDisp.(mm)
Difference(%)
D1 Weak/No Structural damage For columns and beams, the deformation does not exceed elastic limit. Onlyinter-storey drift-sensitive non-structural components are considered.
74 26.66 73.6
D1 Moderate/Low Structural damage For columns and beams considered as primary components thedeformation not exceed 25% of the ultimate value.
158 76.66 106.1
D1 Significant/Medium Structural damage For columns and beams considered as primary components thedeformation not exceed three quarters (75%) of the ultimate value.
228 228.33 0.1
D1 Heavy Structural damage/Collapse For columns and beams considered as primary componentsdeformation exceeds three quarters (75%) of the ultimate value and at most one structural element
exceed the ultimate value.
350 350 0.0
(11)
where; is the median value of spectral displacement at which the building reaches the threshold of the damagestate, ds; βds is the standard deviation of the natural logarithm of spectral displacement of damage state, ds and Φ is thestandard normal cumulative distribution function.
In HAZUS the lognormal standard deviation of the fragility curves is defined as a function of the standard deviationof the capacity curve, the variability of the demand spectrum and the uncertainty in the estimate of the median value of
[ ] [
(
)]
( )
Development of Seismic Fragility Functions The Open Construction and Building Technology Journal, 2016, Volume 10 49
the structural damage spectral displacement. In the RMA the standard deviation was estimated as a function of thestructure ductility as β=0.4 ln(µ).
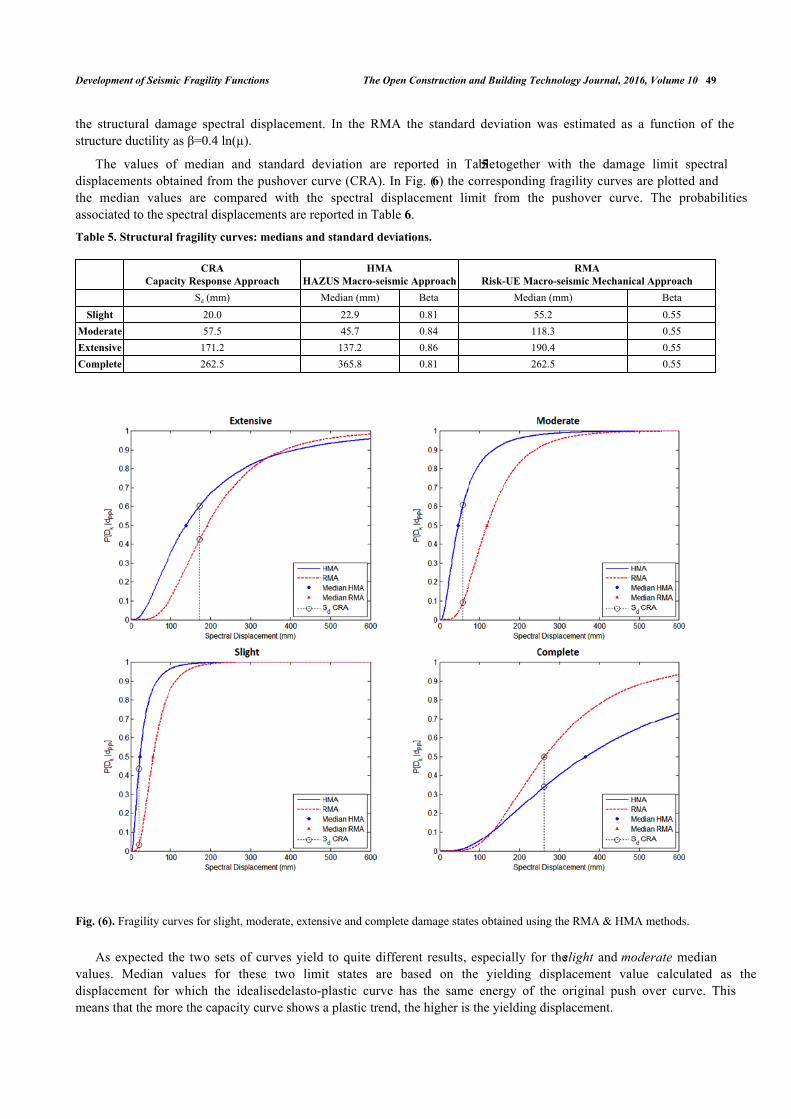
The values of median and standard deviation are reported in Table 5 together with the damage limit spectraldisplacements obtained from the pushover curve (CRA). In Fig. (6) the corresponding fragility curves are plotted andthe median values are compared with the spectral displacement limit from the pushover curve. The probabilitiesassociated to the spectral displacements are reported in Table 6.
Table 5. Structural fragility curves: medians and standard deviations.
CRACapacity Response Approach
HMAHAZUS Macro-seismic Approach
RMARisk-UE Macro-seismic Mechanical Approach
Sd (mm) Median (mm) Beta Median (mm) BetaSlight 20.0 22.9 0.81 55.2 0.55
Moderate 57.5 45.7 0.84 118.3 0.55Extensive 171.2 137.2 0.86 190.4 0.55Complete 262.5 365.8 0.81 262.5 0.55
Fig. (6). Fragility curves for slight, moderate, extensive and complete damage states obtained using the RMA & HMA methods.
As expected the two sets of curves yield to quite different results, especially for the slight and moderate medianvalues. Median values for these two limit states are based on the yielding displacement value calculated as thedisplacement for which the idealisedelasto-plastic curve has the same energy of the original push over curve. Thismeans that the more the capacity curve shows a plastic trend, the higher is the yielding displacement.
50 The Open Construction and Building Technology Journal, 2016, Volume 10 McCrum et al.
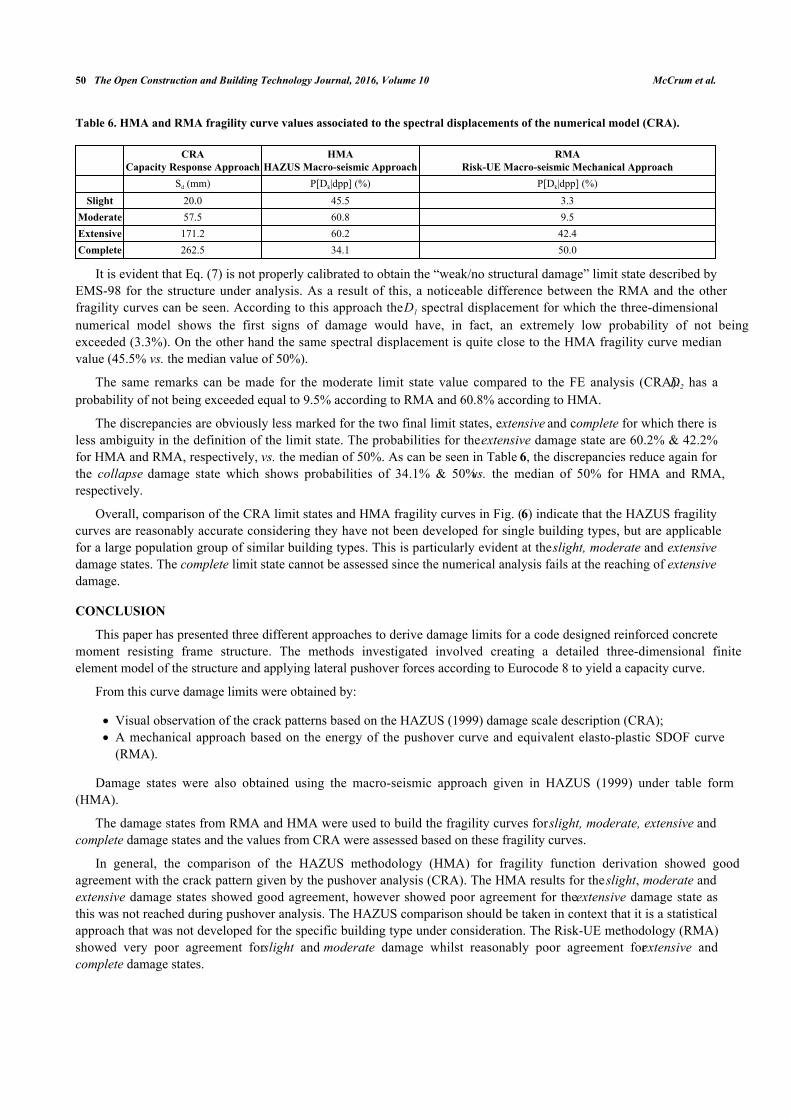
Table 6. HMA and RMA fragility curve values associated to the spectral displacements of the numerical model (CRA).
CRACapacity Response Approach
HMAHAZUS Macro-seismic Approach
RMARisk-UE Macro-seismic Mechanical Approach
Sd (mm) P[Dk|dpp] (%) P[Dk|dpp] (%)Slight 20.0 45.5 3.3
Moderate 57.5 60.8 9.5Extensive 171.2 60.2 42.4Complete 262.5 34.1 50.0
It is evident that Eq. (7) is not properly calibrated to obtain the “weak/no structural damage” limit state described byEMS-98 for the structure under analysis. As a result of this, a noticeable difference between the RMA and the otherfragility curves can be seen. According to this approach the D1 spectral displacement for which the three-dimensionalnumerical model shows the first signs of damage would have, in fact, an extremely low probability of not beingexceeded (3.3%). On the other hand the same spectral displacement is quite close to the HMA fragility curve medianvalue (45.5% vs. the median value of 50%).
The same remarks can be made for the moderate limit state value compared to the FE analysis (CRA). D2 has aprobability of not being exceeded equal to 9.5% according to RMA and 60.8% according to HMA.
The discrepancies are obviously less marked for the two final limit states, extensive and complete for which there isless ambiguity in the definition of the limit state. The probabilities for the extensive damage state are 60.2% & 42.2%for HMA and RMA, respectively, vs. the median of 50%. As can be seen in Table 6, the discrepancies reduce again forthe collapse damage state which shows probabilities of 34.1% & 50% vs. the median of 50% for HMA and RMA,respectively.
Overall, comparison of the CRA limit states and HMA fragility curves in Fig. (6) indicate that the HAZUS fragilitycurves are reasonably accurate considering they have not been developed for single building types, but are applicablefor a large population group of similar building types. This is particularly evident at the slight, moderate and extensivedamage states. The complete limit state cannot be assessed since the numerical analysis fails at the reaching of extensivedamage.
CONCLUSION
This paper has presented three different approaches to derive damage limits for a code designed reinforced concretemoment resisting frame structure. The methods investigated involved creating a detailed three-dimensional finiteelement model of the structure and applying lateral pushover forces according to Eurocode 8 to yield a capacity curve.
From this curve damage limits were obtained by:
Visual observation of the crack patterns based on the HAZUS (1999) damage scale description (CRA);A mechanical approach based on the energy of the pushover curve and equivalent elasto-plastic SDOF curve(RMA).
Damage states were also obtained using the macro-seismic approach given in HAZUS (1999) under table form(HMA).
The damage states from RMA and HMA were used to build the fragility curves for slight, moderate, extensive andcomplete damage states and the values from CRA were assessed based on these fragility curves.
In general, the comparison of the HAZUS methodology (HMA) for fragility function derivation showed goodagreement with the crack pattern given by the pushover analysis (CRA). The HMA results for the slight, moderate andextensive damage states showed good agreement, however showed poor agreement for the extensive damage state asthis was not reached during pushover analysis. The HAZUS comparison should be taken in context that it is a statisticalapproach that was not developed for the specific building type under consideration. The Risk-UE methodology (RMA)showed very poor agreement for slight and moderate damage whilst reasonably poor agreement for extensive andcomplete damage states.

Development of Seismic Fragility Functions The Open Construction and Building Technology Journal, 2016, Volume 10 51
CONFLICT OF INTEREST
The authors confirm that this article content has no conflict of interest.
ACKNOWLEDGEMENTS
This work was part-funded by a Department for Employment and Learning Research Studentship.
REFERENCES
[1] M.A. Erberik, and A.S. Elnashai, "Seismic Vulnerability of Flat-slab Structures", In: Mid-America Earthquake Center. University of Il-linoisat Urbana-Champaign: Urbana, 2003.
[2] SHARE Consortium, SHARE Seismic Hazard Harmonization for Europe - European Seismic Hazard Maps. DGEB-Workshop, 27 May,2014. Available from: http://www. share-eu.org/node/57
[3] H. Crowley, "Introducing openquake, the interactive platform for collaborative earthquake risk assessment", In: Proceedings of 10th NationalConference on Earthquake Engineering, Alaska, United States, 2014.
[4] P. Gueguen, Seismic Vulnerability of Structures. Wiley: New York, United States, 2013.[http://dx.doi.org/10.1002/9781118603925]
[5] V. Silva, H. Crowley, H. Varum, R. Pinho, and R. Sousa, "Evaluation of analytical methodologies used to derive vulnerability functions",Earthquake Eng. Struct. Dynam., vol. 43, no. 2, pp. 181-204, 2014.[http://dx.doi.org/10.1002/eqe.2337]
[6] P. Mouroux, E. Bertrand, M. Bour, B. Le Brun, S. Depinois, and P. Masure, "The european RISK-UE project: An advanced approach toearthquake risk scenarios", In: Proceedings of the 13th World Conference on Earthquake Engineering, Vancouver, Canada, 2004.
[7] S. Lagomarsino, and S. Giovinazzi, "Macroseismic and mechanical models for the vulnerability and damage assessment of current buildings",Bull. Earthquake Eng., vol. 4, no. 4, pp. 415-443, 2006.[http://dx.doi.org/10.1007/s10518-006-9024-z]
[8]
[9] European Committee for Standardization, Eurocode 8: Design of Structures for Earthquake Resistance" Part 1: General Rules, SeismicActions and Rules for Buildings, Terminology and General Criteria for Test Methods, 2004.
[10] European Committee for Standardization, European Committee for Standardization. CEN (2004b) Eurocode 2: Design of Concrete Structures– Part 1: General Rules and Rules for Buildings. Product Requirements and Evaluation of Con-formity for Vehicle Restraint Systems, 2004.
[11] Simulia, Abaqus Finite Element Program Version 6.13, Abaqus, 2013.
[12] J. Lubliner, J. Oliver, S. Oller, and E. Onate, "A plastic-damage model for concrete", Int. J. Solids Struct., vol. 25, no. 3, pp. 299-326, 1989.[http://dx.doi.org/10.1016/0020-7683(89)90050-4]
[13] ABAQUS Analysis User's Manual. ABAQUS, 2013.
[14] E. Thorenfeldt, A. Tomaszewicz, and J. Jensen, "Mechanical properties of high-strength concrete and application in design", In: Proceedingsof the Symposium Utilization of High Strength Concrete, Stavanger, 1987.
[15] D.A. Hordijk, "Local Approach to Fatigue of Concrete", Phd thesis, Delft University of Technology, 1991.
[16] Comité Euro-Internationa du Béton, CEB-FIP Model Code 2010, First Completed Draft, Comité Euro-International Du Béton, Lausanne:Lausanne, Switzerland, 2010.
[17] J. Lee, and G.L. Fenves, "Plastic-damage model for cyclic loading of concrete structures", J. Eng. Mech., vol. 124, no. 8, pp. 892-900, 1998.[http://dx.doi.org/10.1061/(ASCE)0733-9399(1998)124:8(892)]
[18] T. Yu, J. Teng, Y. Wong, and S. Dong, "Finite element modeling of confined concrete-II: Plastic-damage model", Eng. Struct., vol. 32, no. 3,pp. 680-691, 2010.[http://dx.doi.org/10.1016/j.engstruct.2009.11.013]
[19] R. Malm, "Predicting Shear Type Crack Initiation and Growth in Concrete with Non-Linear Finite Element Method", Doctoral thesis, KTH,Department of Civil and Architectural Engineering, 2009.
[20] European Seismological Commission, European Macroseismic Scale 1998. Joseph Beffort, Helfent-Bertrange: Luxembourg, 1998.
Received: June 30, 2015 Revised: August 15, 2015 Accepted: August 26, 2015
© McCrum et al.; License Bentham Open.
This is an open access article licensed under the terms of the Creative Commons Attribution-Non-Commercial 4.0 International Public License (CCBY-NC 4.0) (https://creativecommons.org/licenses/by-nc/4.0/legalcode), which permits unrestricted, non-commercial use, distribution andreproduction in any medium, provided the work is properly cited.
HAZUS®MH MR4. Multi-Hazard Loss Estimation Methodology: Earthquake Model. Department of Homeland Security, FEMA: Washington, DC, 2003.