development of self-compacting concrete to produce precast cladding...
TRANSCRIPT
Second International Symposium on Design, Performance and Use of Self-Consolidating Concrete SCC’2009-China, June 5-7 2009, Beijing,China
851
DEVELOPMENT OF SELF-COMPACTING CONCRETE TO PRODUCE PRECAST CLADDING PANELS
Chengfei Sui1, Mohammed Sonebi1, Abhey Gupta2 and Su Taylor1
(1) School of Planning, Architecture and Civil Eng., Queen’s University Belfast, Belfast, UK
(2) Macrete, Precast Concrete Engineers, Toomebridge, UK
Abstract
This investigation aims to develop self-compacting concrete containing limestone powder to produce precast cladding panels with grade C40/50. The cost of materials will be decreased by reducing the cement content and using limestone powder (LSP) with a minimum amount of superplasticizer (SP). A factorial design was carried out to model the influence of mix parameters on filling ability, passing ability, segregation, and compressive strength that are important for the successful development of SCC incorporating LSP. The parameters considered in the study were the contents of cement and LSP, water-to-powder (cement+LSP) ratio (W/P), and the dosage of SP. Twenty-one mixes were prepared to derive the statistical models. The models are valid for mixes made with W/P of 0.40 to 0.60, cement content of 280 to 400 kg/m3, LSP of 30 to 120 kg/m3, and SP of 0.35 to 0.55%, by mass of powder. The models of fresh properties and compressive strengths were established. The influences of W/P, cement and LSP contents, and the dosage of SP were characterised and analysed using polynomial regression which can identify the primary factors and their interactions on the measured properties. The results indicate that W/P had the greatest effect on the slump flow, the segregation, and the compressive strengths, followed by limestone powder and cement in case of slump flow, and by cement and LSP for segregation and compressive strength.
1. INTRODUCTION Self-compacting concrete (SCC) is one of the major innovation in the area of concrete of
modern time. A distinctive feature of SCC has been that concrete flows into place and around obstructions under its own weight without any segregation and blocking, which results in a better quality concrete and substantial improvement of working conditions, a faster and more economical concrete construction process [1, 2].
The first generation of SCC used in the UK and Europe contained a higher dosage of powder and SP to ensure the flowability of SCC (filling ability, passing ability and segregation resistance) [3]. The cost of SCC increased due to the high content of the powder; however savings in labour cost might offset the increased cost. Moreover, using mineral admixtures such as pulverised fly ash (PFA), ground granulated blast slag (GGBS), or
Second International Symposium on Design, Performance and Use of Self-Consolidating Concrete SCC’2009-China, June 5-7 2009, Beijing,China
852
limestone powder (LSP) could increase the fluidity of the concrete without any increase in the cost, hence the requirement of SP necessary to obtain similar slump flow compared to the same concrete containing only cement are reduced [4, 5, 6]. These supplementary materials enhanced also the rheological parameters [7] and reduced the risk of cracking of concrete due to the heat of hydration, and therefore make the concrete suitable for large volume casting and improved the durability of the concrete [8, 9].
Low content of binder was used in the second generation of SCC, such as limestone powder or pulverised fly ash [10, 11]. The replacement of large volume of cement by limestone powder can reduce the cost and could achieve a given slump flow, viscosity, and compressive strength of early age. Such concrete also exhibit a greater resistance of surface settlement compared to similar concrete with low dosage of limestone powder [11]. Other researchers [10, 12, 13] evaluated the properties of SCC incorporating high volumes of fly ash in order to reduce the cost of SCC.
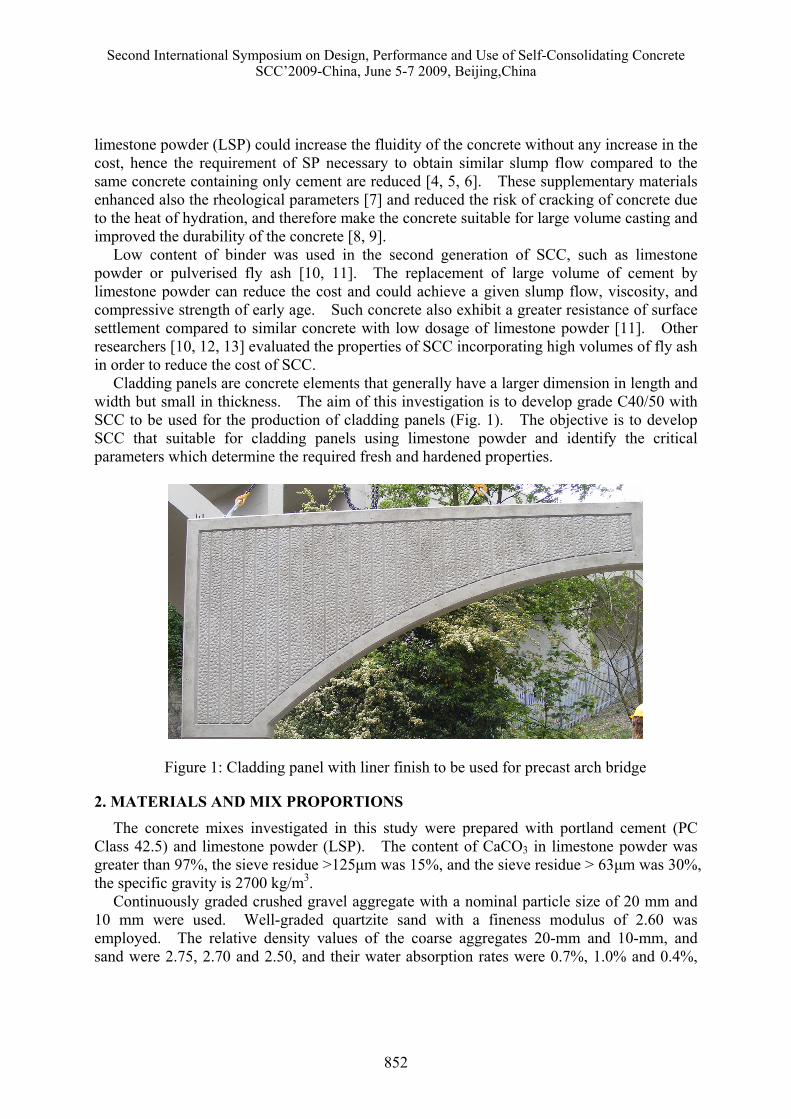
Cladding panels are concrete elements that generally have a larger dimension in length and width but small in thickness. The aim of this investigation is to develop grade C40/50 with SCC to be used for the production of cladding panels (Fig. 1). The objective is to develop SCC that suitable for cladding panels using limestone powder and identify the critical parameters which determine the required fresh and hardened properties.
Figure 1: Cladding panel with liner finish to be used for precast arch bridge
2. MATERIALS AND MIX PROPORTIONS The concrete mixes investigated in this study were prepared with portland cement (PC
Class 42.5) and limestone powder (LSP). The content of CaCO3 in limestone powder was greater than 97%, the sieve residue >125μm was 15%, and the sieve residue > 63μm was 30%, the specific gravity is 2700 kg/m3.
Continuously graded crushed gravel aggregate with a nominal particle size of 20 mm and 10 mm were used. Well-graded quartzite sand with a fineness modulus of 2.60 was employed. The relative density values of the coarse aggregates 20-mm and 10-mm, and sand were 2.75, 2.70 and 2.50, and their water absorption rates were 0.7%, 1.0% and 0.4%,
Second International Symposium on Design, Performance and Use of Self-Consolidating Concrete SCC’2009-China, June 5-7 2009, Beijing,China
853
respectively. SP based on chains of modified polycarboxylic ether was used and had 40% solid content and specific gravity of 1.08.
3. EXPERIMENTAL PROGRAM AND TEST METHODS The technique of analysis used was a statistical analysis of the results obtained from a set
of experiments [14]. In total, twenty one mixes were used to evaluate the influence of two different levels (maximum and minimum) for each variable on the relevant concrete properties (4 factors at 2 levels) with five replicate central points were prepared to estimate the degree of experimental error for the modelled responses. Four key parameters lsp, sp, cement and w/p that can have significant influence on mix characteristics of scc were selected to develop statistical models for evaluating relevant properties using central composite design. The modelled experimental region consisted of mixes ranging between coded variables of –1.68 to +1.68. the statistical models are valid for mixes made with ranges of w/p of 0.40 to 0.60, dosages of sp of 0.2% to 1% (by mass of powder), cement content of 280 to 400 kg/m3, and lps content of 30 to 120 kg/m3. the volume of coarse aggregates was fixed at total of 312 l/m3) for all mixes (202 l/m3 for 20-mm ca, and 110 l/m3 for 10-mm ca), to enhance the filling ability, passing ability and the resistance of segregation. The responses modelled were the slump flow, the segregation ratio, and 1, 7 and 28-day compressive strengths. All concrete mixes were prepared in 30 litres batches in a drum mixer. The slump flow test was used to evaluate the filling ability and deformability of scc [15]. The passing ability of scc mixes was assessed by jring [15]. The resistance to segregation was measured by the modified settlement segregation column test made with three equal sections 190-mm diameter and 170-mm height to allow concrete sample to undergo static segregation for 15 minutes [16]. Standard 100-mm cubes were demoulded one day after casting and covered with wet burlap and plastic sheeting. Specimens were then cured in lime water at 20 ± 2 °c until testing at ages of 1 d, 7 d, and 28 d.
The batching sequence consisted of homogenizing the sand and coarse aggregate for 30 seconds, then adding cement and lsp to mix for another 30 seconds. After this time, water was added and the concrete mixed for another 2 minutes, the mixer was covered with plastic bags to minimise evaporation of mixing water. The sp was then introduced at the end of the mix, and the concrete was mixed for a further five minutes. In total, eight minutes are needed for the mixing.
4. RESULTS AND DISCUSSION The statistical models developed in this study and the correlation coefficients are
summarized in Table 1. The estimates for each parameter refer to the coefficients of the model found by a least square method. The significance of each parameter on a given response is evaluated using t-test values based on Student’s distribution [14]. Probabilities less than 0.10 often are considered as significant evidence that the contribution of the proposed parameter has a highly significant influence on the measured response. The R2 values of the response surface models for the slump flow, the segregation and compressive strength at 1d, 7d, and 28 d were found to be 0.88, 0.85, 0.87, 0.85, and 0.89, respectively. The correlation coefficient of most responses demonstrates a good correlation with the proposed models. The results of JRing did not perform well, and therefore they were not included in Table 1.

Second International Symposium on Design, Performance and Use of Self-Consolidating Concrete SCC’2009-China, June 5-7 2009, Beijing,China
854
The parameters in Table 1, which are presented in coded values, show the comparison of various parameters as well as the interactions of the modelled responses. A negative estimate signifies that an increase of a given parameter results in a reduction of the measured response. The average measured response of the five repeated mixes of slump flow, segregation ratio, compressive strengths at 1 d, 7 d, and 28 d were 547 mm, 0.99, 15.1 MPa, 38 MPa, and 47.7 MPa, respectively. The estimated errors for the slump flow, the segregation ratio, 1-d f’c,7-d f’c ,28-d f’c were ± 27 mm, ± 0.02, 0.8 MPa, ± 1.8 MPa, and ± 1.7 MPa, respectively.
As shown in Table 1 and Fig. 2, the slump flow is influenced, in order of significance, by W/P, the percentage of LSP, the dosages of cement and SP. As expected, the W/P had the greatest effect on the slump flow (203 vs. 111, 98, 72). An increase in W/P had nearly 2 times greater effect than an increase in percentage of LSP or cement. The increase in cement content had slight higher influence on increasing the slump flow compared with an increase in the percentage of SP (97.6 vs. 72.3). An increase in SP also led to an enhancement of the workability. This is attributed to better steric and electrostatic repulsions among cement particles that react with SP which led a better deflocculation of the cement particles. The variation of the slump flow with W/P and SP, when cement and LSP were fixed at 340 kg/m3, and 75 and 120 kg/m3, respectively, is shown in Fig. 2. For given W/P and dosage of SP, the increase in percentage of LSP (from 75 to 120 kg/m3) led to an increase in slump flow. This could be explained by the mechanism that there is less water demand for LSP, thus more free water in the system, thus resulting in better workability. An increase in the SP dosage from 0.2 to 1%, and/or W/P from 0.40 to 0.60, for any given values of cement and LSP, resulted in an increase in workability.
Fig. 3 shows isocurves of the effect of dosage of cement for mixes made with W/P of 0.50, and 75 and 120 kg/m3 of LSP. It can be noted that for fixed dosage of SP, the increase of cement resulted in an increase in slump flow. In this figure, the increase of LSP from 75 to 120 kg/m3 indicated that the workability increased with LSP when W/P is kept constant.
Table 1 : Parameter estimated of statistical response models
Slump flow (mm)
1/Segregation 1/f’c at 1d (MPa)
f’c at 7d (MPa)
f’c at 28d (MPa)
R2 = 0.88 R2 = 0.85 R2 =0.87 R2 =0.85 R2 = 0.89 Intercept 584 1.0 0.069 38.17 46.2 LSP 111 0.078 0.0074 NS -3.48 SP 72.3 0.068 -0.0088 NS 3.16 C 97.6 0.086 -0.0160 2.90 5.65 W/P 203 0.090 0.022 -9.31 -12.0
LSP x SP NS 0.053 NS -3.93 NS LSP x C -26.3 0.070 NS NS NS LSP x W/P NS 0.068 NS NS NS LSP2 NS NS NS NS NS SP 2 -0.12 NS -0.0077 NS 3.0 C2 NS NS NS NS NS W/P2 NS NS NS NS NS

Second International Symposium on Design, Performance and Use of Self-Consolidating Concrete SCC’2009-China, June 5-7 2009, Beijing,China
855
400
450500
550 600 650 700 750
C = 340 kg/m3
0.40 0.45 0.50 0.55 0.600.20
0.40
0.60
0.80
1.00
W/P
SP (%
)
LSP = 75 kg/m3
Slump flow (mm)
400
500
600700
800900
1000
C = 340 kg/m3
0.40 0.45 0.50 0.55 0.600.20
0.40
0.60
0.80
1.00
W/P
LSP = 120kg/m3SP
(%)
Slump flow (mm)
Figure 2: Isocurves of slump flow vs. W/P and dosage of SP for concrete made with C= 340 kg/m3 and LSP = 75 and 120 kg/m3
400
450
500
550
600
650
W/P = 0.50
280 310 340 370 4000.20
0.40
0.60
0.80
1.00
C (kg/m3)
SP
(%)
LSP = 75 kg/m3
Slump flow (mm)
400450
500550
600
650
700
750
W/P = 0.50
280 310 340 370 4000.20
0.40
0.60
0.80
1.00
C (kg/m3)
SP (%
)
LSP = 120 kg/m3
Slump flow (mm)
Figure 3: Isocurves of slump flow vs. cement and SP for concrete made with W/P = 0.50 and LSP = 75 and 120 kg/m3
For the segregation test, the segregation resistance was affected significantly by W/P, the
dosage of cement, the percentage of LSP, and the dosage of SP. As expected, an increase in W/P and the dosage of SP led to an increase in segregation and separation of the constituents of the mix resulting in non-uniform distribution. This was due to an increase in free water in the system, and thus reducing the viscosity of the matrix, therefore the coarse aggregate will sink to the bottom the column of segregation test [12]. This creates a non-uniform material and a situation where there is a higher a proportion of the separated material in one section of the hardened concrete and a lower proportion in another section.
Second International Symposium on Design, Performance and Use of Self-Consolidating Concrete SCC’2009-China, June 5-7 2009, Beijing,China
856
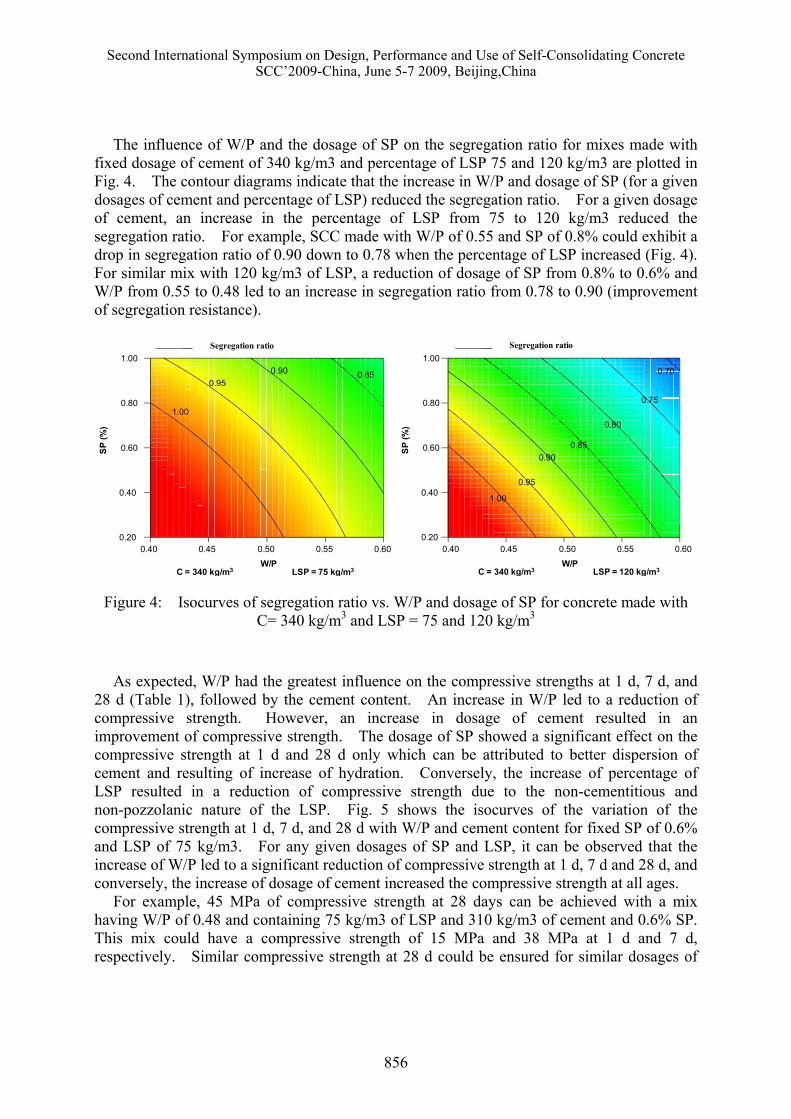
The influence of W/P and the dosage of SP on the segregation ratio for mixes made with fixed dosage of cement of 340 kg/m3 and percentage of LSP 75 and 120 kg/m3 are plotted in Fig. 4. The contour diagrams indicate that the increase in W/P and dosage of SP (for a given dosages of cement and percentage of LSP) reduced the segregation ratio. For a given dosage of cement, an increase in the percentage of LSP from 75 to 120 kg/m3 reduced the segregation ratio. For example, SCC made with W/P of 0.55 and SP of 0.8% could exhibit a drop in segregation ratio of 0.90 down to 0.78 when the percentage of LSP increased (Fig. 4). For similar mix with 120 kg/m3 of LSP, a reduction of dosage of SP from 0.8% to 0.6% and W/P from 0.55 to 0.48 led to an increase in segregation ratio from 0.78 to 0.90 (improvement of segregation resistance).
0.850.900.95
1.00
C = 340 kg/m3
0.40 0.45 0.50 0.55 0.600.20
0.40
0.60
0.80
1.00
W/P
SP (%
)
LSP = 75 kg/m3
Segregation ratio
0.70
0.75
0.80
0.850.90
0.95
1.00
C = 340 kg/m3
0.40 0.45 0.50 0.55 0.600.20
0.40
0.60
0.80
1.00
W/P
SP (%
)
LSP = 120 kg/m3
Segregation ratio
Figure 4: Isocurves of segregation ratio vs. W/P and dosage of SP for concrete made with C= 340 kg/m3 and LSP = 75 and 120 kg/m3
As expected, W/P had the greatest influence on the compressive strengths at 1 d, 7 d, and 28 d (Table 1), followed by the cement content. An increase in W/P led to a reduction of compressive strength. However, an increase in dosage of cement resulted in an improvement of compressive strength. The dosage of SP showed a significant effect on the compressive strength at 1 d and 28 d only which can be attributed to better dispersion of cement and resulting of increase of hydration. Conversely, the increase of percentage of LSP resulted in a reduction of compressive strength due to the non-cementitious and non-pozzolanic nature of the LSP. Fig. 5 shows the isocurves of the variation of the compressive strength at 1 d, 7 d, and 28 d with W/P and cement content for fixed SP of 0.6% and LSP of 75 kg/m3. For any given dosages of SP and LSP, it can be observed that the increase of W/P led to a significant reduction of compressive strength at 1 d, 7 d and 28 d, and conversely, the increase of dosage of cement increased the compressive strength at all ages.
For example, 45 MPa of compressive strength at 28 days can be achieved with a mix having W/P of 0.48 and containing 75 kg/m3 of LSP and 310 kg/m3 of cement and 0.6% SP. This mix could have a compressive strength of 15 MPa and 38 MPa at 1 d and 7 d, respectively. Similar compressive strength at 28 d could be ensured for similar dosages of

Second International Symposium on Design, Performance and Use of Self-Consolidating Concrete SCC’2009-China, June 5-7 2009, Beijing,China
857
LSP and SP (75 kg/m3 & 0.6%) by reducing W/P to 0.47 and decreasing the dosage of cement to 280 kg/m3.
10
12
14
16
18
20
22
24
SP = 0.6%
0.40 0.45 0.50 0.55 0.60280
310
340
370
400
W/P
Cem
ent (
kg/m
3 )
LSP = 75 kg/m3
f’c1d
3032
3436
3840
4244
46
48
SP = 0.6%
0.40 0.45 0.50 0.55 0.60280
310
340
370
400
W/PC
emen
t (kg
/m3 )
LSP = 75 kg/m3
f’c7d
3540
45
5055
60
f’c28d
Figure 5: Isocurves of compressive strengths at 1 d, 7 d, and 28 d vs. W/P and cement for concrete made with SP = 0.60%and LSP = 75 kg/m3
Fig. 6 indicates the trade-off between W/P and the dosage of SP on the slump flow and the
compressive strength at 28 d for mixes made with cement content of 340 kg/m3, and 75 and 120 kg/m3 of LSP, respectively. For SCC mix having slump flow greater than 650 mm and 28d-f’c of 45 MPa, the maximum W/P required ensuring these performances with a LSP content of 75 kg/m3 was 0.52. It necessitated a minimum of 0.65% SP. Similar performances could be achieved by reducing W/P and SP to 0.50 and 0.50%, respectively, while 120 kg/m3 of LSP used. For the same concrete containing 120 kg/m3 of LSP and made with W/P of 0.52 and SP of 0.65%, the concrete had a slump flow and 28-d f’c of 780 mm and 44 MPa, respectively.
400
450500
550 600 650 700 750
C = 340 kg/m3
0.40 0.45 0.50 0.55 0.600.20
0.40
0.60
0.80
1.00
W/P
SP (%
)
LSP = 75 kg/m3
35
4045
50
55
60
Slump flow f’c28d
400
500
600700
800900
1000
C = 340 kg/m3
0.40 0.45 0.50 0.55 0.600.20
0.40
0.60
0.80
1.00
W/P
SP (%
)
LSP = 120 kg/m3
3540
45
50
55
60
Slump flow f’c28d
Figure 6: Isoresponses of slump flow and 28-d f’c with W/P and SP for two dosages of LSP of 75 and 120 kg/m3

Second International Symposium on Design, Performance and Use of Self-Consolidating Concrete SCC’2009-China, June 5-7 2009, Beijing,China
858
Fig. 7 presents the trade-off between the slump flow and the segregation ratio with W/P and dosage of SP for mixes made with percentage of LSP of 75 and 120 kg/m3 and dosage of cement of 340 kg/m3. For example, to ensure a mix with a 700 mm slump flow with 75 kg/m3 of LSP, 0.75% SP and a W/P ratio of 0.54, respectively, were necessary to achieve workability. In this case, the segregation ratio was 0.90. However, with a dosage of 120 kg/m3 of LSP and 0.75% SP, a lower W/P of 0.49 could be used to give a segregation ratio of 0.85 thus ensure similar workability. With the same dosage of LSP of 120 kg/m3 and 0.49 W/P could be used to improve the segregation ratio to 0.90 with less SP (0.52%), but in this case the slump flow dropped to 600 mm.
0.850.900.95
1.00
C = 340 kg/m3
0.40 0.45 0.50 0.55 0.600.20
0.40
0.60
0.80
1.00
W/P
SP (%
)
LSP = 75 kg/m3
400
450500
550 600 650 700 750
Slump flowSegregation ratio
0.70
0.75
0.80
0.850.90
0.95
1.00
C = 340 kg/m3
0.40 0.45 0.50 0.55 0.600.20
0.40
0.60
0.80
1.00
W/P
SP (%
)
LSP = 120 kg/m3
400
500
600 700800
900
1000
Slump flowSegregation ratio
Figure 7: Isoresponses of slump flow and segregation ratio with W/P and SP for two dosages of LSP of 75 and 120 kg/m3
5. CONCLUSIONS The effects of cement, limestone powder, W/P, and superplasticiser on the filling ability,
the segregation, and the concrete compressive strength at 1 d, 7 d and 28 d were investigated. The proposed statistical models can simplify the test protocol required to optimize a given mix for SCC by reducing the number of trial batches needed to achieve a balance among mix variables. The models established use a factorial design approach and are valid for set materials for mix proportioning of SCC. These models can also provide relationships between the foregoing results for mix optimisation and quality control. W/P had the most significant effect on the slump flow, the segregation, and the compressive strength at 1 d, 7 d, and 28 d, followed by limestone powder and cement for slump flow, and by cement and LSP for segregation and compressive strength. Although the models are based on a given set of materials, they can be easily extended to other materials. The next step of this investigation is to select some optimum SCC mixes and test them at the batching plant of the precast company to produce cladding panels with SCC grade of C40/50.

Second International Symposium on Design, Performance and Use of Self-Consolidating Concrete SCC’2009-China, June 5-7 2009, Beijing,China
859
ACKNOWLEDGEMENTS The authors would like to thank Knowledge Transfer Partnerships for the financial
support of this industrial project with Macrete Ltd.
REFERENCES [1] Ozawa, K., Maekawa, K., Okamura, H. Development of High Performance Concrete. Journal of
the Faculty of Engineering, The University of Tokyo (XLI) 3 (1992) 381-439. [2] Ozawa, K., Sakata, N., Okamura, H. Evaluation of Self-Compactibility of Fresh Concrete Using
the Funnel Test. Concrete library of JSCE, Vol. 25, No., 1995, pp. 59-75. [3] Khayat, K.H., Ghezal, A., Hadriche, MS. Factorial Design Models For Proportioning
Self-Consolidating Concrete. Materials and Structures, V. 32, 1999, pp. 679-686. [4] Sonebi. M. et al., Properties of Hardened Concrete (Self-Compacting Concrete) – Task 4,
European project entitled: “Rational Production and Improved Working Environment through Using Self-Compacting Concrete” Brite EuRam project BE96-3801, European Commission, May 2000, Brussels, Belgium, 75 p.
[5] Leemannn, A., Hoffmann, C. Properties of Self-Compacting and Conventional Concrete – Differences and Similarities. Magazine of Concrete Research, Vol. 57, No. 6, 2005, pp. 315-319.
[6] Sonebi, M., Bartos, P.J.M., Tamimi, A.K. Flexural Response and Performance of Reinforced Beams Cast with Self-Compacting Concrete. Proceedings of the 2nd International Symposium on Self-Compacting Concrete, Ed. K. Ozawa & M. Ouchi, Tokyo, Japan, October 2001, pp. 517-526.
[7] Yahia, A., Tanimura, M., Shimoyama, Y. Rheological Properties of Highly Flowable Mortar Containing Limestone, filler-effect of powder content and W/C ratio. Cement and Concrete Research, Vol. 35, 2005, pp. 532-539.
[8] Sonebi, M., Ibrahim, M. Assessment of the durability of medium strength SCC from its permeation properties. Proceedings of 5th International RILEM Symposium on SCC, Vol. 2, Ghent, Belgium, 2007, pp. 677-682.
[9] De Schutter, G., Audenaert, K., Durability of Self-Compacting Concrete. Report 38, RILEM TC 205-DSC, RILEM Publications S.A.R.L., 2007, 185 p.
[10] Khurana, R., Saccone, R. Fly Ash in Self-Compacting Concrete. Proceedings of the 7th CANMET/ACI International Conference on Fly Ash, Silica Fume, Slag and Natural Pozzolans in Concrete, Ed. M. Malhotra, Madras, India, 2001, pp. 259-274.
[11] Ghezal, A., Khayat, K.H. Optimizing Self-Consolidating Concrete with Limestone Filler by using Statistical Factorial Design Methods. ACI Materials Journal, Vol. 99, No. 3, 2002, pp. 264-272.
[12] Sonebi, M. Medium Strength Self-Compacting Concrete Containing Fly Ash : Modelling Using Factorial Experimental Plans., Cement and Concrete Research, Vol. 34, No. 7, 2004, pp. 1199-1208.
[13] Bouzoubaâ, N., Lachemi, M. Self-Compacting Concrete Incorporating High Volumes of Class F fly Ash Preliminary Results. Cement & Concrete Research, Vol. 31, No., 2001, pp. 413-420.
[14] Montgomery, D.C., “Design and analysis of experiments”, Sixth edition, John Wiley & Sons, NY, 2005.
[15] Bartos, P. J. M., Sonebi, M., Tamimi, A.K. Workability and Rheology of Fresh Concrete: Compendium of Tests. Report of RILEM Technical Committee TC 145-WSM: Workability of Special Concrete Mixes, RILEM Publications S.A.R.L, Paris, 2002, 127 p.
[16] Daczko, J. Stability of Self-Consolidating Concrete, Assumed or Ensured?, Proc. of 1st North American Conf. on design and use of Self-Consolidating Concrete, Chicago, 2002, pp. 223-228.