development of the x-33 aerodynamic uncertainty … development of the x-33 aerodynamic uncertainty...
TRANSCRIPT

NASA/TP-1998-206544
Development of the X-33 Aerodynamic Uncertainty Model
Brent R. CobleighDryden Flight Research CenterEdwards, California
April 1998

The NASA STI Program Office . . . in Profile
Since its founding, NASA has been dedicatedto the advancement of aeronautics and space science. The NASA Scientific and Technical Information (STI) Program Office plays a keypart in helping NASA maintain thisimportant role.
The NASA STI Program Office is operated byLangley Research Center, the lead center forNASA’s scientific and technical information.The NASA STI Program Office provides access to the NASA STI Database, the largest collectionof aeronautical and space science STI in theworld. The Program Office is also NASA’s institutional mechanism for disseminating theresults of its research and development activities. These results are published by NASA in theNASA STI Report Series, which includes the following report types:
• TECHNICAL PUBLICATION. Reports of completed research or a major significantphase of research that present the results of NASA programs and include extensive dataor theoretical analysis. Includes compilations of significant scientific and technical data and information deemed to be of continuing reference value. NASA’s counterpart of peer-reviewed formal professional papers but has less stringent limitations on manuscriptlength and extent of graphic presentations.
• TECHNICAL MEMORANDUM. Scientificand technical findings that are preliminary orof specialized interest, e.g., quick releasereports, working papers, and bibliographiesthat contain minimal annotation. Does notcontain extensive analysis.
• CONTRACTOR REPORT. Scientific and technical findings by NASA-sponsored contractors and grantees.
• CONFERENCE PUBLICATION. Collected papers from scientific andtechnical conferences, symposia, seminars,or other meetings sponsored or cosponsoredby NASA.
• SPECIAL PUBLICATION. Scientific,technical, or historical information fromNASA programs, projects, and mission,often concerned with subjects havingsubstantial public interest.
• TECHNICAL TRANSLATION. English- language translations of foreign scientific and technical material pertinent toNASA’s mission.
Specialized services that complement the STIProgram Office’s diverse offerings include creating custom thesauri, building customizeddatabases, organizing and publishing researchresults . . . even providing videos.
For more information about the NASA STIProgram Office, see the following:
• Access the NASA STI Program Home Pageat
http://www.sti.nasa.gov
• E-mail your question via the Internet to [email protected]
• Fax your question to the NASA Access HelpDesk at (301) 621-0134
• Telephone the NASA Access Help Desk at(301) 621-0390
• Write to:NASA Access Help DeskNASA Center for AeroSpace Information7121 Standard DriveHanover, MD 21076-1320

NASA/TP-1998-206544
Development of the X-33 Aerodynamic Uncertainty Model
Brent R. CobleighDryden Flight Research CenterEdwards, California
April 1998
National Aeronautics andSpace Administration
Dryden Flight Research CenterEdwards, California 93523-0273

NOTICE
Use of trade names or names of manufacturers in this document does not constitute an official endorsementof such products or manufacturers, either expressed or implied, by the National Aeronautics andSpace Administration.
Available from the following:
NASA Center for AeroSpace Information (CASI) National Technical Information Service (NTIS)7121 Standard Drive 5285 Port Royal RoadHanover, MD 21076-1320 Springfield, VA 22161-2171(301) 621-0390 (703) 487-4650
ABSTRACT
An aerodynamic uncertainty model for the X-33 single-stage-to-orbit demonstrator aircraft has beendeveloped at NASA Dryden Flight Research Center. The model is based on comparisons of historicalflight test estimates to preflight wind-tunnel and analysis code predictions of vehicle aerodynamicsdocumented during six lifting-body aircraft and the Space Shuttle Orbiter flight programs. The lifting-body and Orbiter data were used to define an appropriate uncertainty magnitude in the subsonic andsupersonic flight regions, and the Orbiter data were used to extend the database to hypersonic Machnumbers. The uncertainty data consist of increments or percentage variations in the importantaerodynamic coefficients and derivatives as a function of Mach number along a nominal trajectory. Theuncertainty models will be used to perform linear analysis of the X-33 flight control system and MonteCarlo mission simulation studies. Because the X-33 aerodynamic uncertainty model was developedexclusively using historical data rather than X-33 specific characteristics, the model may be useful forother lifting-body studies.
NOMENCLATURE
b reference span, ft
BF body flap, deg
CD drag coefficient
nominal drag coefficient
Cl rolling moment coefficient
derivative of rolling moment due to nondimensional roll rate, ∂Cl/∂(pb/2V), rad–1
derivative of rolling moment due to nondimensional yaw rate, ∂Cl/ ∂(rb/2V), rad–1
derivative of rolling moment due to sideslip, ∂Cl/∂β, deg–1
derivative of rolling moment due to aileron, ∂Cl/∂δa, deg–1
derivative of rolling moment due to rudder, ∂Cl/∂δr, deg–1
CL lift coefficient
nominal lift coefficient
Cm pitching moment coefficient
derivative of pitching moment due to nondimensional pitch rate, ∂Cm/∂(qL/2V), rad–1
derivative of pitching moment due to body flap, ∂Cm/∂δbf, deg–1
derivative of pitching moment due to elevon, ∂Cm/ ∂δe, deg–1
Cn yawing moment coefficient
derivative of yawing moment due to nondimensional roll rate, ∂Cn/∂(pb/2V), rad–1
derivative of yawing moment due to nondimensional yaw rate, ∂Cn/∂(rb/2V), rad–1
derivative of yawing moment due to sideslip, ∂Cn/∂β, deg–1
derivative of yawing moment due to aileron, ∂Cn/∂δa, deg–1
CDnom
Clp
Clr
ClβClδa
Clδr
CLnom
Cmq
Cmδbf
Cmδe
Cnp
Cnr
CnβCnδa
1
derivative of yawing moment due to rudder, ∂Cn/∂δr, deg–1
CY side force coefficient
derivative of side force due to sideslip, ∂CY/∂β, deg–1
derivative of side force due to aileron, ∂CY/∂δa, deg–1
derivative of side force due to rudder, ∂CY/∂δr, deg–1
FAD flight assessment delta
L vehicle reference length, ft
L/D lift-to-drag ratio
L/Dnom nominal lift-to-drag ratio
L/Dunc lift-to-drag ratio uncertainty
MAC mean aerodynamic chord
p roll rate, rad/sec
q pitch rate, rad/sec
r yaw rate, rad/sec
RCS reaction control system
V velocity, ft/sec
α angle of attack, deg
β angle of sideslip, deg
δa aileron deflection, deg
δbf body flap deflection, deg
δe elevon deflection, deg
δr rudder deflection, deg
∆ increment from nominal
modified drag uncertainty
unmodified drag uncertainty
modified lift uncertainty
unmodified lift uncertainty
σ standard deviation
INTRODUCTION
Part of the design and implementation of any control system involves the testing for potential errors,also called uncertainties or dispersions, in the mathematical model of the system and in any inputs usedby the control algorithms. Some of the uncertainties, such as the accuracy of a particular instrument, canbe measured through laboratory testing; however, errors in the system model are frequently not easilymeasurable or are excessively expensive to obtain. In these cases, engineering judgment is often used to
Cnδr
CYβCYδa
CYδr
∆CD
∆CDunc
∆CL
∆CLunc
2
construct an uncertainty model of the system that will allow for adequate “stress” testing of the proposedcontrol algorithms. If the model is too severe, the system may be found to be uncontrollable or theperformance of the system may be unduly penalized. Errors that are not modeled adequately can result ina system that is unable to handle reasonable variances or failures. For traditional piloted vehicles, thecontrol system is stress-tested to a reasonable degree, assuming that any remaining handling anomaliesshould be compensable by the pilot. Autonomous vehicles, however, do not have the luxury of a pilotand, therefore, must be designed to handle any “reasonable” error in the system model.
One of the most detailed analyses into aerodynamic uncertainty modeling was completed for theSpace Shuttle Orbiter program.1 The Orbiter aerodynamic uncertainty model consisted of two parts. Thefirst part was based on the wind tunnel–to–wind tunnel and model-to-model variations gathered duringthe 27,000-hour wind-tunnel test program that was used to derive the aerodynamic model. Thesedeviations, termed “tolerances,” were considered to be the minimum error that should be expected. Thecontrol laws would need to be able to handle these errors with little or no effect on the vehicle stability orguidance. The second part of the uncertainty model was based on the differences between the historicalflight test measurements and the preflight predictions found for many similar (in configuration ormission) vehicles.2 By combining as many similar vehicles as possible, a pseudo “worst-case”aerodynamic prediction error bound was estimated for each of the important aerodynamic coefficients.These worst-case aerodynamic uncertainties were termed “variations.”
This paper addresses the development of the initial aerodynamic uncertainty models for theX-33 single-stage-to-orbit technology demonstrator. The uncertainties are based on comparisons betweenhistorical flight measurements and preflight predictions of other similar aircraft configurations. In mostcases, the preflight predictions were based on wind-tunnel data, although some prediction code data wereused. The uncertainties are analogous to the variations developed during the Orbiter program. Theseuncertainties provide the basis for “stress” testing of candidate X-33 guidance and control systems. Thestress testing will consist of linear analysis at selected flight conditions and complete mission MonteCarlo simulations. In this way, both the vehicle closed-loop control and the vehicle guidance control lawwill be tested. Further refinement of the X-33 aerodynamic uncertainty model may occur as the wind-tunnel test program is completed. Flight test validation of the wind-tunnel database will likely reduce theuncertainty. This report describes the vehicles used to build the aerodynamic uncertainty models, detailsthe method used to gather data, and presents the uncertainty models selected for the X-33 program. Theappropriate use of the models is also discussed.
VEHICLE DESCRIPTIONS
The X-33 aircraft (fig. 1) is an autonomous, hypersonic, lifting-body-type demonstrator vehicledesigned to validate the technologies necessary for a single-stage-to-orbit reusable launch vehicle. Thevehicle uses linear aerospike rocket engines capable of thrust vectoring in pitch, roll, and yaw. In additionto thrust vectoring, the vehicle uses lower, outboard body flaps for pitch, roll, and yaw control; tworudders symmetrically for low angle-of-attack yaw control and asymmetrically for energy managementand pitch control; and two small, 20° dihedral wings with trailing-edge elevon flaps that produce pitch,roll, and yaw. Eight aft-mounted reaction control system (RCS) jets are also available for high-speed,high-altitude control.
The M2-F1 aircraft (fig. 2(a)) was a lightweight glider designed for subsonic investigations of thelifting-body concept. Longitudinal control was provided by an upper body flap and elevons, located on
3

the upper, outboard rudder surface. Roll control came from differential deflection of the elevons anddirectional control from the two vertical rudders.
Figure 1. Three-view of the X-33 vehicle.
(a) The M2-F1 vehicle.
Figure 2. Three-view drawing of vehicles used to develop the X-33 aerodynamic uncertainty model.
69.26 ft
76.76 ft
22.34 ft25.77 ft
Body flaps
Rudders
Elevons
Aerospike engine ramp
980071
20.00 ft
9.5 ft
Body flap
Rudder
Horizontal reference plane (cone axis)
Elevon
13°
13°
14.167 ft
980072
4

The M2-F2 aircraft (fig. 2(b)) was a rocket-powered, blunt, 13°-half-cone-shaped lifting-bodyvehicle. The vehicle had two outboard fins that had rudder surfaces that could only deflect outward.Primary pitch control was provided by a lower body flap, and roll control came from the two upperbody flaps.
The M2-F3 aircraft (fig. 2(c)) was a slight variation on the M2-F2 configuration. An additionalvertical fin was added between the upper flaps. The design also included a rocket engine for higher speedand longer duration flights than the M2-F2 aircraft achieved.
The HL-10 aircraft (fig. 2(d)) was a rocket-powered, negative-camber lifting body designed to test atsubsonic to low supersonic Mach numbers. Elevons were used as the primary longitudinal and rollcontrol effectors. Directional control came from the rudder located on the center, vertical fin. Two otherslightly canted-out fins were located outboard. Surfaces on the outboard fins and an upper flap on each ofthe elevons were used to adjust the vehicle configuration.
The X-24A aircraft (fig. 2(e)) was another rocket-powered, lifting-body research vehicle. The aircrafthad three vertical fins: one along the centerline and two slightly canted out, outboard. Each of theoutboard fins had an upper and lower rudder surface. For pitch and roll control, two upper and two lowerflaps were included.
The X-24B aircraft (fig. 2(f)) had a double-delta planform with a flat bottom and flat sides. The uppersurface was a curved airfoil with three vertical fins. The off-center fins were located inboard of thewingtips and canted out. The aerodynamic control surfaces included two upper and two lower flaps, twoupper and two lower rudders, and two ailerons. The lower flaps provided the primary pitch control.
(b) The M2-F2 vehicle.
Figure 2. Continued.
9.63 ft
22.20 ft
Horizontal reference plane, Z = 0 in.
Lateral reference plane, Y = 0 in.
Lower body flap
Upper body flaps
Rudders flared 5°
Fin
980073
5

(c) The M2-F3 vehicle.
(d) The HL-10 vehicle.
Figure 2. Continued.
9.63 ft
22.20 ft
Horizontal reference plane
Lateral reference plane
Lower body flap
Upper body flap
Rudder
Rudder
980074
13.60 ft
AA
21.17 ft
9.60 ft
Horizontal reference plane
Rudders and speed brakes
Cross section AA
Elevon flaps
Elevon flaps
Elevons
InboardOutboard
Elevon
980075
Forward
Tip-finflaps
6

(e) The X-24A vehicle.
(f) The X-24B vehicle.
Figure 2. Continued.
24.50 ft
9.60 ft
11.50 ft
980045
37.50 ft
25.10 ft
19.00 ft
72°
Radius = 0.33
78°
3°
980046
7

The Space Shuttle Orbiter (fig. 2(g)) is a large, double-delta-winged vehicle designed to enter theatmosphere and land horizontally. Control power for Orbiter reentry is provided by 12 vertical RCS jets(6 down-firing and 6 up-firing), 8 horizontal RCS jets (4 to the left and 4 to the right), 4 wing-mountedelevon surfaces, a lower body flap, and a split rudder surface. Used symmetrically, the vertical jets andthe elevons are the primary controls for the pitch axis. Roll control is obtained through asymmetricalusage of the vertical jets and elevons. Used as a secondary pitch trim control, the body flap helpsmaintain the predetermined elevon schedule as a function of flight condition. The rudder and the sidefiring jets provide the directional control. The body flap and elevons activate at a dynamic pressure of2 lbf/ft2. The rudders activate at Mach numbers below 5.
(g) The Space Shuttle Orbiter.
Figure 2. Concluded.
METHOD
The development of an appropriate uncertainty model for the X-33 aerodynamics began with areview of the historical flight test documentation of similar vehicle configuration. By comparing theflight test–measured aerodynamics to wind-tunnel measurements or engineering code estimates of othersimilar vehicles, a database of actual prediction errors was generated. This database was used as a guidein determining an appropriate uncertainty magnitude for each of the important aerodynamic parametersas a function of flight condition. Table 1 shows a list of the vehicles used in the study and some geometricdata. The lifting-body configurations (the HL-10, M2-F1, M2-F2, M2-F3, X-24A, and X-24B aircraft)were chosen because of their geometric similarity to the X-33 vehicle and the availability of acceptabledocumentation. The Orbiter was also selected for its largely similar angle-of-attack and Mach numbermission profile and its excellent flight-to-preflight prediction documentation. The flight and preflight
78.06 ft 107.53 ft
46.33 ft
56.58 ft
122.25 ft
Body flap
Rudder
Elevons
980033
8

data used in the study were obtained from previous publications.3–15 The following subsectionsdescribe how the X-33 aerodynamic uncertainty model was developed from the lifting-body andOrbiter databases.
Lifting Body Aerodynamic Uncertainties
Engineering judgment was used in the selection of the lifting-body data for this model. The postflightaerodynamic estimates were subject to several error sources such as an inadequate number of flight testmaneuvers, instrument measurement errors, and immature prediction techniques. Using theaforementioned reasoning, much of the HL-10 damping, M2-F1 lateral, M2-F3 longitudinal, and X-24Alongitudinal data were not used in the study.
Figure 3 shows the process used to obtain the static stability and control derivative uncertainty data.The flight-measured aerodynamic parameter estimates were plotted as a function of angle of attack at agiven Mach number, and a fairing was drawn through the points based on engineering judgment. Thefairing helps to reduce variations in the estimates that are caused by maneuver quality and analysisvariations. Because all parameter estimation codes are statistically based, the analysis of severalmaneuvers at the same flight condition is a common practice to reduce maneuver, instrumentation, andanalysis variations. The differences between the flight fairing and preflight predictions were calculated.Usually data were taken in 4° angle-of-attack increments (for example, 0°, 4°, 8°).
To minimize the effects of varying planform layout, the data were compiled as a percentage of theprediction where possible.
Table 1. Vehicles with basic geometry.
Vehicle Area, ft2 Length, ft Span, ft Sweep, deg
M2-F1 139.0 actual 20.00 actual 9.50 actual 77.0
M2-F2 139.0 reference160.0 actual
20.00 reference22.20 actual
9.54 reference9.63 actual
77.0
M2-F3 160.0 reference156.0 actual
22.20 actual 9.95 reference9.63 actual
77.0
HL-10 160.0 reference 21.17 reference 13.60 reference 74.0
X-24A 162.0 reference195.0 actual
23.00 reference 10.00 reference 75.0
X-24B 330.5 reference 37.50 reference 19.00 reference19.17 actual
78.0 inboard72.0 outboard
Orbiter 2690.0 reference 108.03 body39.56 MAC (ref.)
78.06 reference 81.0 strake45.0 wing
X-33 1608.0 reference 63.20 reference 36.60 reference 70.0
9
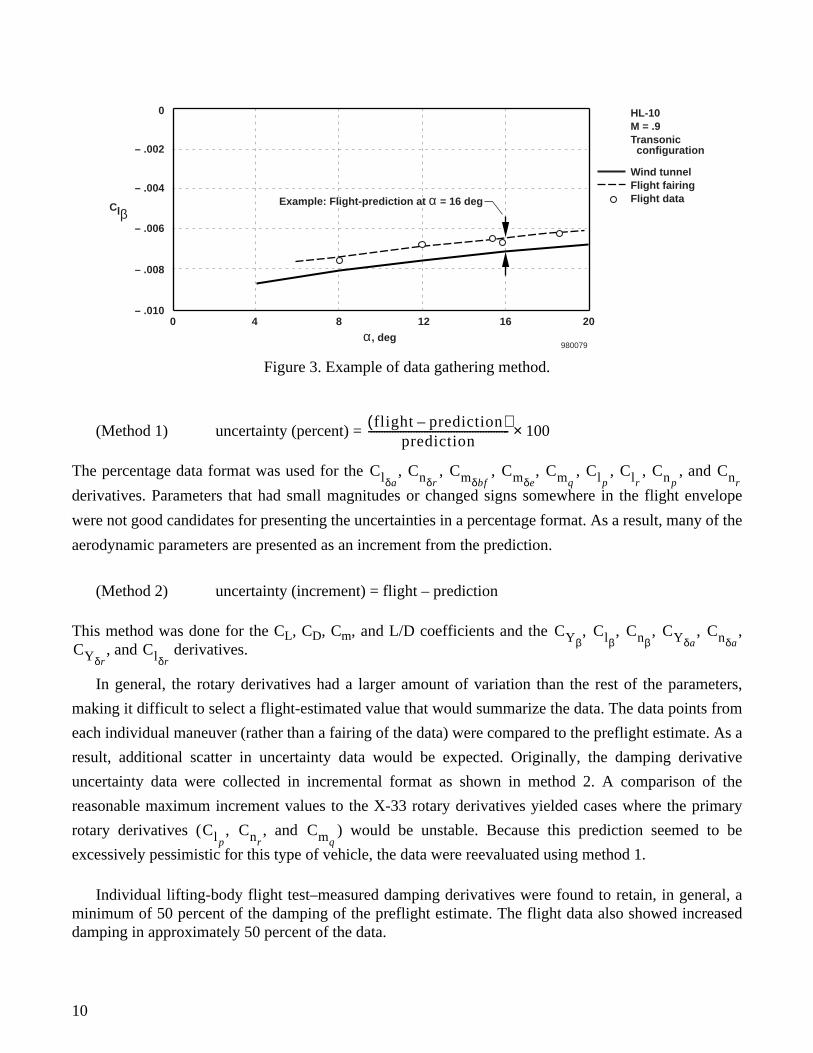
Figure 3. Example of data gathering method.
(Method 1) uncertainty (percent) =
The percentage data format was used for the , , , , , , , , and
derivatives. Parameters that had small magnitudes or changed signs somewhere in the flight envelope
were not good candidates for presenting the uncertainties in a percentage format. As a result, many of the
aerodynamic parameters are presented as an increment from the prediction.
(Method 2) uncertainty (increment) = flight – prediction
This method was done for the CL, CD, Cm, and L/D coefficients and the , , , , ,, and derivatives.
In general, the rotary derivatives had a larger amount of variation than the rest of the parameters,
making it difficult to select a flight-estimated value that would summarize the data. The data points from
each individual maneuver (rather than a fairing of the data) were compared to the preflight estimate. As a
result, additional scatter in uncertainty data would be expected. Originally, the damping derivative
uncertainty data were collected in incremental format as shown in method 2. A comparison of the
reasonable maximum increment values to the X-33 rotary derivatives yielded cases where the primary
rotary derivatives ( , , and ) would be unstable. Because this prediction seemed to be
excessively pessimistic for this type of vehicle, the data were reevaluated using method 1.
Individual lifting-body flight test–measured damping derivatives were found to retain, in general, aminimum of 50 percent of the damping of the preflight estimate. The flight data also showed increaseddamping in approximately 50 percent of the data.
0 4 8
Example: Flight-prediction at α = 16 deg
12 16 20
α, deg
Clβ
Wind tunnelFlight fairingFlight data
HL-10M = .9Transonic configuration
0
– .002
– .004
– .006
– .008
– .010
980079
flight prediction–( )prediction
----------------------------------------------------- 100×
ClδaCnδr
CmδbfCmδe
CmqClp
ClrCnp
Cnr
CYβClβ
CnβCYδa
CnδaCYδrClδr
ClpCnr
Cmq
10

Orbiter Aerodynamic Uncertainties
The Orbiter aerodynamic database has been derived from an enormous wind-tunnel test program.This level of effort will not be expended to develop the X-33 aerodynamic database, or likely any otherfuture database. In terms of wind-tunnel testing, the Orbiter has perhaps the best preflight wind-tunnelprediction that can be expected. In addition, a team of highly experienced engineers has been involved inupdating the Orbiter aerodynamic database using the latest analysis techniques.
The Orbiter preflight aerodynamic database has been supplemented with flight assessmentdeltas (FADs), which are increments between the flight test and preflight aerodynamic predictions. Thus,the FADs represent the error in the Orbiter preflight database as found in flight test. These increments areused directly in this study. In addition to the FADs, the Orbiter program used aerodynamic uncertainties(originally developed in a similar fashion to this study) that have been modified using flight predictions.These uncertainties were also used in this work to develop the X-33 aerodynamic uncertainties. Becausethe Orbiter aerodynamic database was developed from such an extensive ground test program, itsuncertainty levels would, in general, be smaller than those expected for the X-33 aircraft.
All of the lifting-body programs, including the X-33 program, use the body length as the referencelength to nondimensionalize the pitching moment coefficient. The Orbiter uses the wing meanaerodynamic chord. To ensure a correct comparison, the Orbiter pitching moment coefficients weremultiplied by the ratio of the Orbiter wing mean aerodynamic chord to the Orbiter body length.
The Orbiter FADs and uncertainties are documented as a function of Mach number and, in somecases, elevon or body flap position around the scheduled angle of attack. Both the FAD and Orbiteruncertainty databases are valid to a maximum 10° angle-of-attack deviation from the nominal schedule.Figure 4 shows a comparison between the Orbiter and three X-33 trajectories. For all planned trajectories,the X-33 angle-of-attack schedule is within 10° of the Orbiter nominal trajectory during the reentryportion of the flight. During the other phases of the trajectory, the X-33 angle of attack is lower than theOrbiter angle of attack for a given Mach number. Assuming that the uncertainties generally increase withincreasing angle of attack, using the reentry schedule uncertainties during other phases of the flightshould be a conservative approach.
Figure 4. Comparison of X-33 and Space Shuttle Orbiter reentry trajectories.
5 10
ReentryTransition
Ascent
15 20
Mach
α,deg
Orbiter referenceX-33 Silurian-2X-33 Michael-5X-33 Malmstrom-5
60
50
40
30
20
10
0
980080
11

X-33 Aerodynamic Uncertainty Model
The coefficient uncertainty data described in the previous sections were combined and plotted as afunction of Mach number for each of the coefficients and derivatives. When plotted, a judgment on themaximum expected uncertainties in the predicted parameters was made. Where data were sparse, theOrbiter uncertainty was used to help define the shape of the X-33 aerodynamic uncertainty, particularly athigh supersonic Mach numbers where no lifting-body data exist. An explanation of the development ofeach coefficient uncertainty is given in the next section.
The aerodynamic uncertainties generated in this work do not attempt to account for structuralflexibility. The uncertainties should be applied to the rigid-body aerodynamics before the flexibilitycorrections are applied.
Note that the preceding method for developing the X-33 uncertainty model did not depend on anyparticular X-33 characteristic other than its generic lifting-body-type shape. Thus, the database may beuseful for other lifting-body studies.
UNCERTAINTY MODEL DEVELOPMENT
The data for the important aerodynamic parameters and a suggested X-33 uncertainty model arepresented in this section. Data were available from six lifting-body configurations (the HL-10, M2-F1,M2-F2, M2-F3, X-24A, and X-24B vehicles) to a maximum of Mach 1.6 and from the Orbiter toMach 30. Angle-of-attack variations do not directly show up in the model, although the Mach numberdata includes the effect of the nominal trim angle of attack.
Longitudinal Uncertainties
The X-33 drag, lift, pitching moment, longitudinal control effectiveness, and pitching moment due topitch rate uncertainties are discussed in this subsection. A method to limit the maximum lift and dragratio uncertainties to prevent an unrealistic lift-to-drag ratio uncertainty is also presented.
Drag
For a variety of reasons (including sting, Reynolds number, real gas and tunnel blockage effects),drag is susceptible to errors during wind-tunnel testing. This susceptibility is evident in the flight-to-prediction comparisons for the Orbiter (fig. 5(a)). The drag coefficient prediction is incorrect by as muchas 100 counts to – 200 counts transonically. At subsonic and low supersonic Mach numbers, the Orbiterangle of attack is less than 15°. At Mach numbers greater than 5, the drag error increases. Explanationsfor the increasing drag uncertainty include increasing errors in the induced drag at increasing angle ofattack, and difficulties in reproducing the hypersonic Reynold’s number and real gas environments in awind tunnel. As shown in figure 2, the Orbiter angle of attack is greater than 25° when the Mach numberis greater than 5. The lifting-body results show positive and negative drag increments that are generallybounded by the Orbiter uncertainty boundaries. Both the X-24B and Orbiter data have sharp negative andthen positive peaks in the drag increment near Mach 1.0. This fluctuation is likely caused by amisprediction of the Mach number at which the transonic drag rise occurs, a common problem caused bywind-tunnel blockage effects. Because the X-33 vehicle will have a limited wind-tunnel test program andits base area is responsible for more than 80 percent of its total zero-lift drag, the X-33 drag prediction is
12
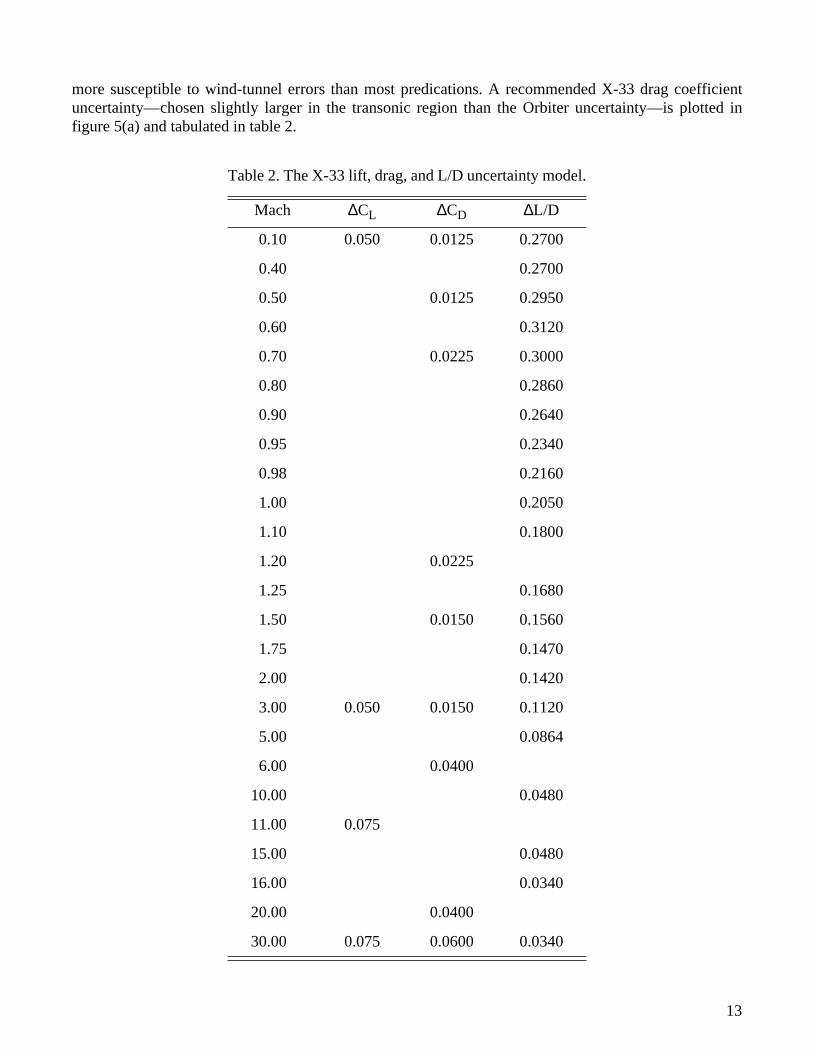
more susceptible to wind-tunnel errors than most predications. A recommended X-33 drag coefficientuncertainty— chosen slightly larger in the transonic region than the Orbiter uncertainty—is plotted infigure 5(a) and tabulated in table 2.
Table 2. The X-33 lift, drag, and L/D uncertainty model.
Mach ∆CL ∆CD ∆L/D
0.10 0.050 0.0125 0.2700
0.40 0.2700
0.50 0.0125 0.2950
0.60 0.3120
0.70 0.0225 0.3000
0.80 0.2860
0.90 0.2640
0.95 0.2340
0.98 0.2160
1.00 0.2050
1.10 0.1800
1.20 0.0225
1.25 0.1680
1.50 0.0150 0.1560
1.75 0.1470
2.00 0.1420
3.00 0.050 0.0150 0.1120
5.00 0.0864
6.00 0.0400
10.00 0.0480
11.00 0.075
15.00 0.0480
16.00 0.0340
20.00 0.0400
30.00 0.075 0.0600 0.0340
13

Lift
Figure 5(b) shows a limited amount of lift coefficient prediction error data. Historically, lift isreasonably well-predicted in the wind tunnel. The recommended X-33 lift coefficient uncertainty isshown in figure 5(b) and tabulated in table 2.
(a) Drag uncertainty.
(b) Lift uncertainty.
Figure 5. The X-33 lift and drag uncertainties.
Lift-to-Drag Ratio
Figure 5(c) shows the lift-to-drag ratio variations for the M2-F1, X-24B, and Orbiter vehicles. Basedon this sparse amount of data, the recommended X-33 lift-to-drag ratio uncertainties are shown infigure 5(c) and tabulated in table 2. The magnitudes were achieved by increasing the Orbiter uncertainty
1.0.1 10.0
Mach
∆CD
HL-10M2-F2X-24BOrbiterOrbiter uncertaintyX-33 uncertainty
.08
.06
.04
.02
0
– .02
– .04
– .06
– .08
980081
1.0.1 10.0
Mach
∆CL
M2-F1OrbiterOrbiter uncertaintyX-33 uncertainty
.10
.05
0
– .05
– .10
980082
14
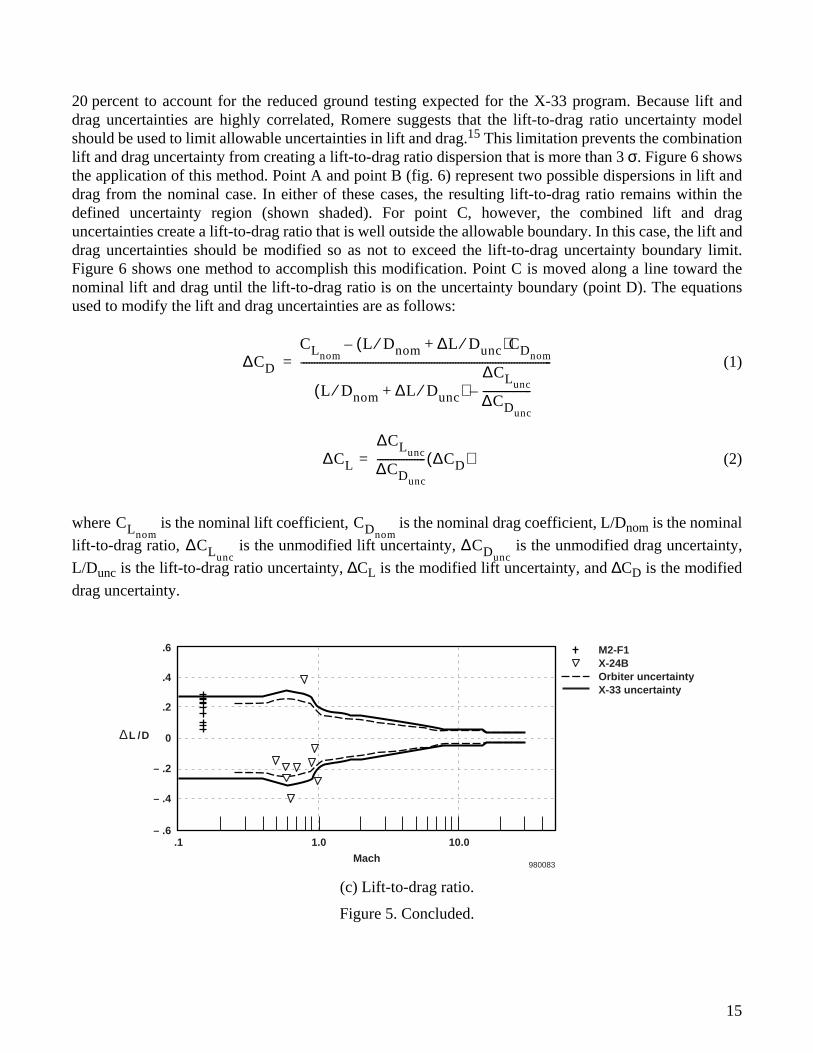
20 percent to account for the reduced ground testing expected for the X-33 program. Because lift anddrag uncertainties are highly correlated, Romere suggests that the lift-to-drag ratio uncertainty modelshould be used to limit allowable uncertainties in lift and drag.15 This limitation prevents the combinationlift and drag uncertainty from creating a lift-to-drag ratio dispersion that is more than 3 σ. Figure 6 showsthe application of this method. Point A and point B (fig. 6) represent two possible dispersions in lift anddrag from the nominal case. In either of these cases, the resulting lift-to-drag ratio remains within thedefined uncertainty region (shown shaded). For point C, however, the combined lift and draguncertainties create a lift-to-drag ratio that is well outside the allowable boundary. In this case, the lift anddrag uncertainties should be modified so as not to exceed the lift-to-drag uncertainty boundary limit.Figure 6 shows one method to accomplish this modification. Point C is moved along a line toward thenominal lift and drag until the lift-to-drag ratio is on the uncertainty boundary (point D). The equationsused to modify the lift and drag uncertainties are as follows:
(1)
(2)
where is the nominal lift coefficient, is the nominal drag coefficient, L/Dnom is the nominal
lift-to-drag ratio, is the unmodified lift uncertainty, is the unmodified drag uncertainty,
L/Dunc is the lift-to-drag ratio uncertainty, ∆CL is the modified lift uncertainty, and ∆CD is the modified
drag uncertainty.
(c) Lift-to-drag ratio.
Figure 5. Concluded.
∆CD
CLnomL Dnom ∆L Dunc⁄+⁄( )CDnom
–
L Dnom ∆L Dunc⁄+⁄( )∆CLunc
∆CDunc
------------------ –
----------------------------------------------------------------------------------------------=
∆CL ∆CLunc
∆CDunc
------------------ ∆CD( )=
CLnomCDnom
∆CLunc∆CDunc
1.0.1 10.0
Mach
∆L /D
.6
.4
.2
0
– .2
– .4
– .6
980083
M2-F1X-24BOrbiter uncertaintyX-33 uncertainty
15

Figure 6. Application of lift and drag aerodynamic uncertainties (see text).
Pitching Moment
Like drag, pitching moment is also susceptible to wind-tunnel measurement errors. The Orbiter hadlarge pitching moment errors at hypersonic speeds caused by real gas effects16 in addition to the typicalvariations seen both subsonically and transonically. These real gas effects are reasonably well-understoodphenomena that can be estimated through modern computational fluid dynamics codes. For the currentX-33 uncertainty model, some attempt is assumed to have been made to account for real gas effects in theaerodynamic model. Without these effects, the uncertainty band should be increased in the hypersonicregion. Figure 7 shows the pitching moment prediction errors for the M2-F3, X-24B and Orbiter vehicles.The Orbiter uncertainty bands appear to model the errors well to where the real gas effects begin.Because of the limited wind-tunnel program, some additional uncertainty over the uncertainty modeledby the Orbiter is warranted. The recommended X-33 pitching moment coefficient uncertainty is shown infigure 7 and tabulated in table 3.
Figure 7. The X-33 pitching moment uncertainty.
CL
CD
B
D
C A
CLnom
CLnomAllowable lift and drag uncertainty range
CDnom
CDnom
L/Dnom
L/Dnom
L/Dnom –
L/Dnom + ∆L/Dunc
∆L/Dunc
980084
1.0.1 10.0
Mach
∆Cm
M2-F3X-24BOrbiterOrbiter uncertaintyX-33 uncertainty
.015
.010
.005
0
– .005
– .010
980085
16
Pitch Control Effectiveness
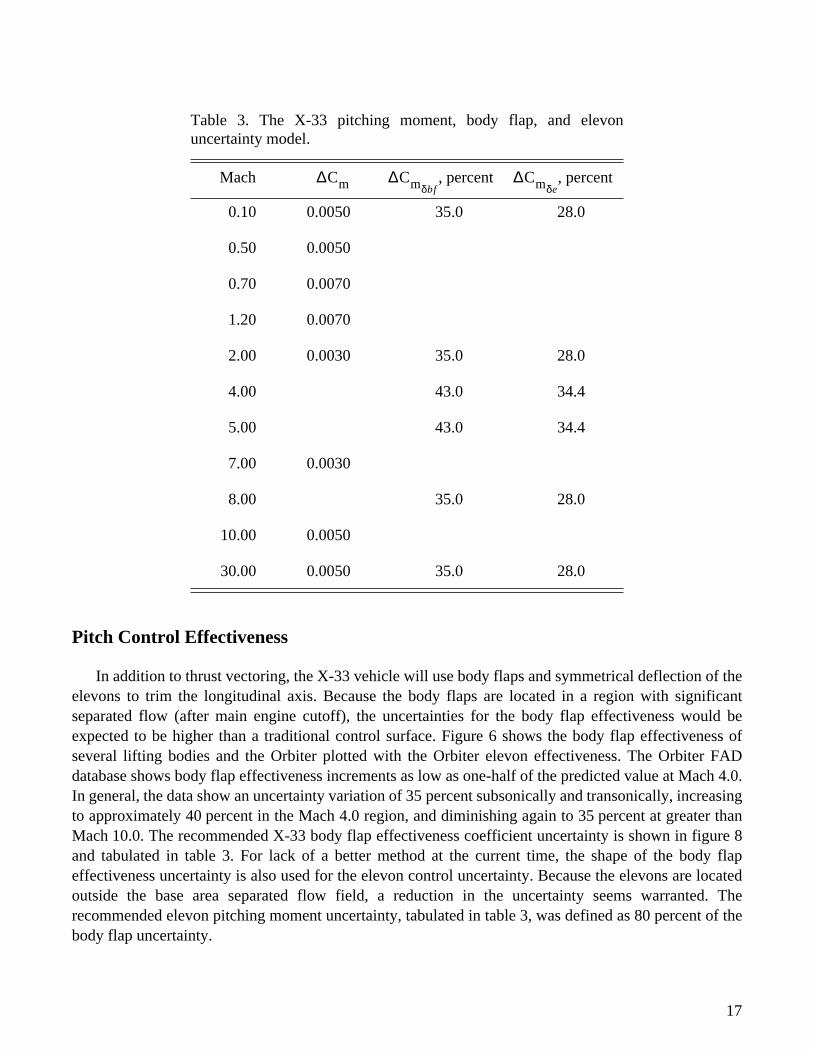
In addition to thrust vectoring, the X-33 vehicle will use body flaps and symmetrical deflection of theelevons to trim the longitudinal axis. Because the body flaps are located in a region with significantseparated flow (after main engine cutoff), the uncertainties for the body flap effectiveness would beexpected to be higher than a traditional control surface. Figure 6 shows the body flap effectiveness ofseveral lifting bodies and the Orbiter plotted with the Orbiter elevon effectiveness. The Orbiter FADdatabase shows body flap effectiveness increments as low as one-half of the predicted value at Mach 4.0.In general, the data show an uncertainty variation of 35 percent subsonically and transonically, increasingto approximately 40 percent in the Mach 4.0 region, and diminishing again to 35 percent at greater thanMach 10.0. The recommended X-33 body flap effectiveness coefficient uncertainty is shown in figure 8and tabulated in table 3. For lack of a better method at the current time, the shape of the body flapeffectiveness uncertainty is also used for the elevon control uncertainty. Because the elevons are locatedoutside the base area separated flow field, a reduction in the uncertainty seems warranted. Therecommended elevon pitching moment uncertainty, tabulated in table 3, was defined as 80 percent of thebody flap uncertainty.
Table 3. The X-33 pitching moment, body flap, and elevonuncertainty model.
Mach , percent , percent
0.10 0.0050 35.0 28.0
0.50 0.0050
0.70 0.0070
1.20 0.0070
2.00 0.0030 35.0 28.0
4.00 43.0 34.4
5.00 43.0 34.4
7.00 0.0030
8.00 35.0 28.0
10.00 0.0050
30.00 0.0050 35.0 28.0
∆Cm ∆Cmδbf∆Cmδe
17

Figure 8. The X-33 body flap pitching moment uncertainty.
Pitch Damping
Figure 7 shows the comparisons of flight test measurements to preflight predictions for pitch
damping, . As previously stated, the plot reflects data points taken from individual flight test
maneuvers. As such, maneuver quality and analysis variations add to the magnitude of the scatter. To
account for the increased scatter, outliers were discarded in selecting an appropriate uncertainty for the
X-33 vehicle. The uncertainty magnitude chosen for the X-33 model (±80 percent) is shown in figure 9
and tabulated in table 4. For , the preflight prediction codes often underpredicted the amount of
damping of the lifting bodies.
Figure 9. The X-33 pitch damping uncertainty.
Orbiter elevon uncertainty
1.0.1 10.0
Mach
HL-10M2-F3X-24AX-24BOrbiter BF = –11.7Orbiter BF = –5Orbiter BF = 5Orbiter BF = 10Orbiter BF = 16.3Orbiter BF = 22.5Orbiter uncertainty, CmδeX-33 uncertainty
100
50
0
– 50
– 100
980086
∆Cmδbf,
percent
Cmq
Cmq
1.0.1 10.0
Mach
∆Cmq,
percent
M2-F2M2-F3X-24AX-24BX-33 uncertainty
150
50
100
0
–50
–100
–150
980087
18

Lateral-Directional Uncertainties
The lateral-directional derivative uncertainties are discussed in the following subsection. Theuncertainty model is composed of effects caused by sideslip, control deflection, and rotation rate.
Sideslip Derivatives
Figure 10(a) shows the derivative errors for rolling moment due to sideslip, , for the HL-10,
M2-F2, M2-F3, X-24A, X-24B, and Orbiter vehicles. The Orbiter uncertainty levels bound the data
scatter except for a few outliers. To account for the reduced ground testing expected for the X-33 vehicle,
the Orbiter uncertainties were increased by 20 percent. The recommended X-33 dihedral effect
uncertainty is shown in figure 10(a) and tabulated in table 5.
Figure 10(b) shows the directional stability, . The plot clearly shows that the scatter is not
evenly distributed around zero. In addition, the Orbiter uncertainty levels do not adequately contain the
variation seen on several of the lifting-body programs. The recommended X-33 directional stability
uncertainty is shown in figure 10(b) and tabulated in table 5. A nonsymmetrical uncertainty magnitude
was selected to better reflect the historical data.
(a) Rolling moment due to sideslip.
Figure 10. The X-33 sideslip derivative uncertainties.
Table 4. The X-33 pitch damping uncertainty.
Mach , percent
0.1 80.0
30.0 80.0
∆Cmq
∆Clβ
∆Cnβ
1.0.1 10.0
Mach
HL-10M2-F2M2-F3X-24AX-24BOrbiterOrbiter uncertaintyX-33 uncertainty
.0025
.0015
.0020
.0010
.0005
– .0005
0
– .0010
– .0015
980088
∆Clβ,
deg–1
19

Table 5. The X-33 sideslip derivative uncertainty model.
Mach
,
deg–1
(+),
deg–1
(–),
deg–1
(+),
deg–1
(–),
deg–1
0.10 0.00072 0.00070 – 0.00070 0.00233 – 0.00233
0.40 0.00072 0.00070 – 0.00070 0.00233 – 0.00233
0.60 0.00084
0.70 0.00100 – 0.00200
0.80 0.00108 0.00720 – 0.00300
0.90 0.00115
0.95 0.00118 0.00720
1.05 0.00120 0.00718
1.10 0.00716
1.20 0.00120 0.00713
1.30 0.00119 0.00707
1.50 0.00114 0.00100 – 0.00200 0.00692
2.00 0.00096 0.00100 – 0.00100 0.00636
3.00 0.00066 0.00526
3.20 0.00059 0.00506
3.60 0.00054 0.00469
4.00 0.00432
5.00 0.00364
5.50 0.00359
8.00 0.00100 – 0.00100 0.00336
9.00 0.00070 – 0.00070
20.00 0.00054 0.00336
25.00 0.00058 0.00070 – 0.00070 0.00480
30.00 0.00066 0.00090 – 0.00090 0.00480 – 0.00300
∆Clβ∆Cnβ
∆Cnβ∆CYβ
∆CYβ
20

Figure 10(c) shows the derivative errors for the side force due to sideslip, . The Orbiter
uncertainty levels appear to adequately contain the data variation on the positive side; however, very little
data were found showing a negative increment. This asymmetry is similar to the parameter, which
was skewed to the negative direction. The recommended X-33 coefficient uncertainty for side force due
to sideslip is shown in figure 10(c) and tabulated in table 5. As with , a nonsymmetrical uncertainty
magnitude was selected to better match the historical data.
(b) Yawing moment due to sideslip.
(c) Side force due to sideslip.
Figure 10. Concluded.
Aileron Effectiveness
Figure 11 shows the aileron control derivative variations. Because the Orbiter aileron surface has amuch larger moment arm and more control surface area than the lifting-body vehicles, the surface can
∆CYβ
∆Cnβ
∆Cnβ
1.0.1 10.0
Mach
HL-10M2-F2M2-F3X-24AX-24BOrbiterOrbiter uncertaintyX-33 uncertainty
.002
0
.001
– .001
– .002
– .003
– .004
– .005
980089
∆Cnβ,
deg–1
1.0.1 10.0
Mach
HL-10M2-F3X-24AX-24BOrbiterOrbiter uncertaintyX-33 uncertainty
.015
.010
.005
– .005
0
– .010
980090
∆CYβ,
deg–1
21

generate much larger forces and moments. To minimize this configuration-dependent effect, the rollingmoment increments (flight minus prediction) were normalized by the predicted aileron effectiveness.Unfortunately, the derivatives for side force and yawing moment due to aileron achieve smallmagnitudes, which are not conducive to a normalized comparison. In these cases, the Orbiteruncertainties and FADs were multiplied by a factor that caused the Orbiter uncertainty to be slightlylarger than the scatter from the lifting-body data. This uncertainty level was then used as the X-33uncertainty recommendation. For lack of a better method, the following aileron uncertainties should beused to model the unknowns in the differential body flap and differential elevon control power.
Figure 11(a) shows the roll control power increments, . In this case, the Orbiter uncertainty did
not provide a good guide to develop an uncertainty for the X-33 vehicle. The lifting-body data were used
in conjunction with the Orbiter FAD to arrive at a roll control power uncertainty. The recommended X-33
roll control power uncertainty is shown in figure 11 and tabulated in table 6.
(a) Rolling moment due to aileron.
(b) Yawing moment due to aileron.
Figure 11. The X-33 aileron derivative uncertainties.
∆Clδa
1.0.1 10.0
Mach
HL-10M2-F2M2-F3X-24AX-24BOrbiterOrbiter uncertaintyX-33 uncertainty
100
50
0
– 50
980091
∆Clδa,
percent
1.0.1 10.0
Mach
HL-10M2-F2M2-F3X-24AX-24BOrbiterOrbiter uncertaintyX-33 uncertainty
.0015
.0010
.0005
– .0005
0
– .0010
980092
∆Cnδa,
deg–1
22

(c) Side force due to aileron.
Figure 11. Concluded.
Table 6. The X-33 aileron derivative uncertainty model.
Mach
,
percent
,
deg–1
,
deg–1
0.10 25.0 0.00027 0.00039
0.40 0.00027 0.00039
0.50 25.0
0.60 0.00033 0.00058
0.70 40.0
0.80 0.00048 0.00198
0.90 0.00052 0.00218
0.95 0.00053 0.00221
1.00 0.00053
1.05 0.00054 0.00214
1.10 0.00054 0.00198
1.20 40.0 0.00052 0.00149
1.30 0.00048 0.00122
1.40 0.00043
1.50 0.00037 0.00072
1.0.1 10.0
Mach
HL-10M2-F3X-24BOrbiterOrbiter uncertaintyX-33 uncertainty
.004
.002
.003
.001
0
– .002
– .001
– .003
– .004
980093
∆CYδa,
deg–1
∆Clδa∆Cnδa
∆CYδa
23

Figure 11(b) shows increments of the yawing moment due to aileron, . The Orbiter uncertainty
was multiplied by 0.6 so that its magnitude was slightly larger than the lifting-body scatter. The
recommended X-33 coefficient uncertainty for yawing moment due to aileron is shown in figure 11 and
tabulated in table 6.
Figure 11(c) shows increments of the side force due to aileron, . The Orbiter uncertainty was
again multiplied by 0.6 so that its magnitude was slightly larger than the lifting-body scatter. The
recommended X-33 coefficient uncertainty for side force due to aileron is shown in figure 11 and
tabulated in table 6.
Rudder Effectiveness
The X-33 aircraft has several control effectors for yawing moment generation: thrust vectoring, thevertical tail pair, and asymmetrical deflection of the body flaps. The rudder derivative information shownhere from the lifting bodies is based on the large vertical tails present on most lifting bodies. Figure 12shows the rudder derivative variations.
Figure 12(a) shows increments of the rolling moment due to rudder, . The historical data weresparse because of the difficulty in estimating this particular parameter. The Orbiter uncertaintymagnitudes appear to adequately contain the data scatter with enough margin to account for the reduced
Table 6. Concluded.
Mach
,
percent
,
deg–1
,
deg–1
1.80 30.0 0.00033
2.00 0.00030 0.00058
2.20 0.00028
3.00 0.00020
4.00 0.00019
25.35 0.00019 0.00058
26.85 0.00021 0.00072
27.25 0.00026 0.00105
27.35 0.00032 0.00129
27.50 0.00036 0.00144
30.00 30.0 0.00036 0.00144
∆Clδa∆Cnδa
∆CYδa
∆Cnδa
∆CYδa
∆CIδr
24
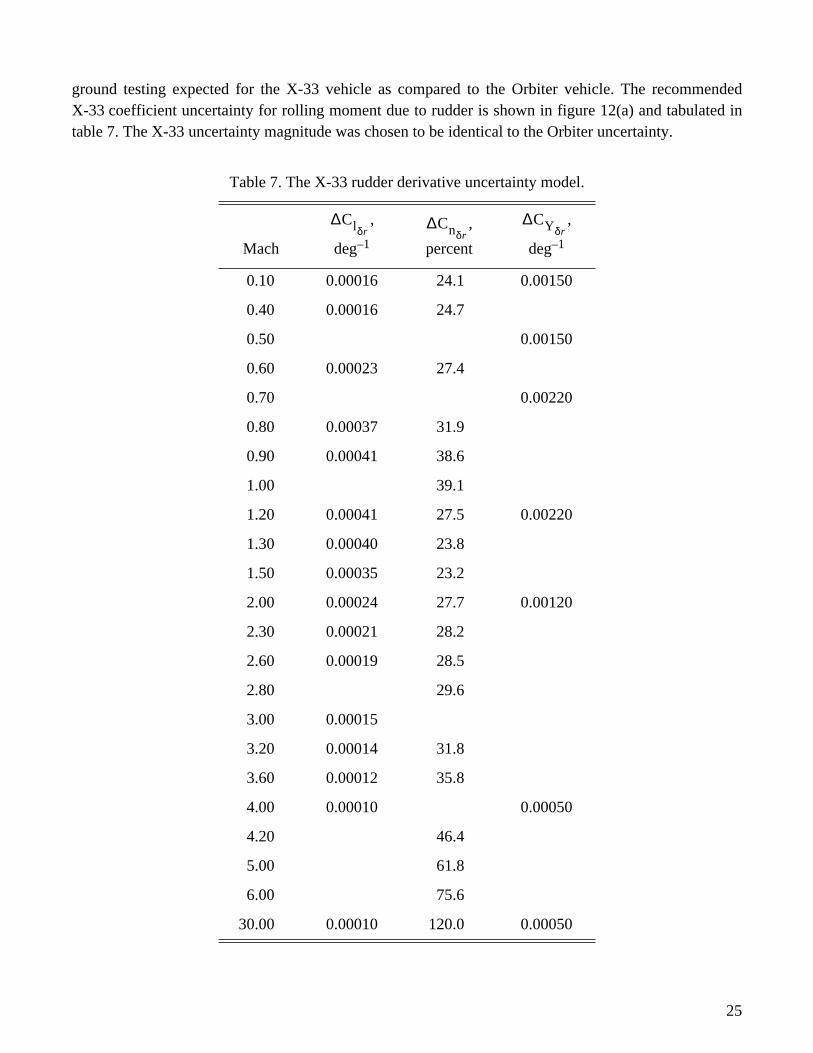
ground testing expected for the X-33 vehicle as compared to the Orbiter vehicle. The recommendedX-33 coefficient uncertainty for rolling moment due to rudder is shown in figure 12(a) and tabulated intable 7. The X-33 uncertainty magnitude was chosen to be identical to the Orbiter uncertainty.
Table 7. The X-33 rudder derivative uncertainty model.
Mach
,
deg–1
,
percent
,
deg–1
0.10 0.00016 24.1 0.00150
0.40 0.00016 24.7
0.50 0.00150
0.60 0.00023 27.4
0.70 0.00220
0.80 0.00037 31.9
0.90 0.00041 38.6
1.00 39.1
1.20 0.00041 27.5 0.00220
1.30 0.00040 23.8
1.50 0.00035 23.2
2.00 0.00024 27.7 0.00120
2.30 0.00021 28.2
2.60 0.00019 28.5
2.80 29.6
3.00 0.00015
3.20 0.00014 31.8
3.60 0.00012 35.8
4.00 0.00010 0.00050
4.20 46.4
5.00 61.8
6.00 75.6
30.00 0.00010 120.0 0.00050
∆Clδr∆Cnδr
∆CYδr
25
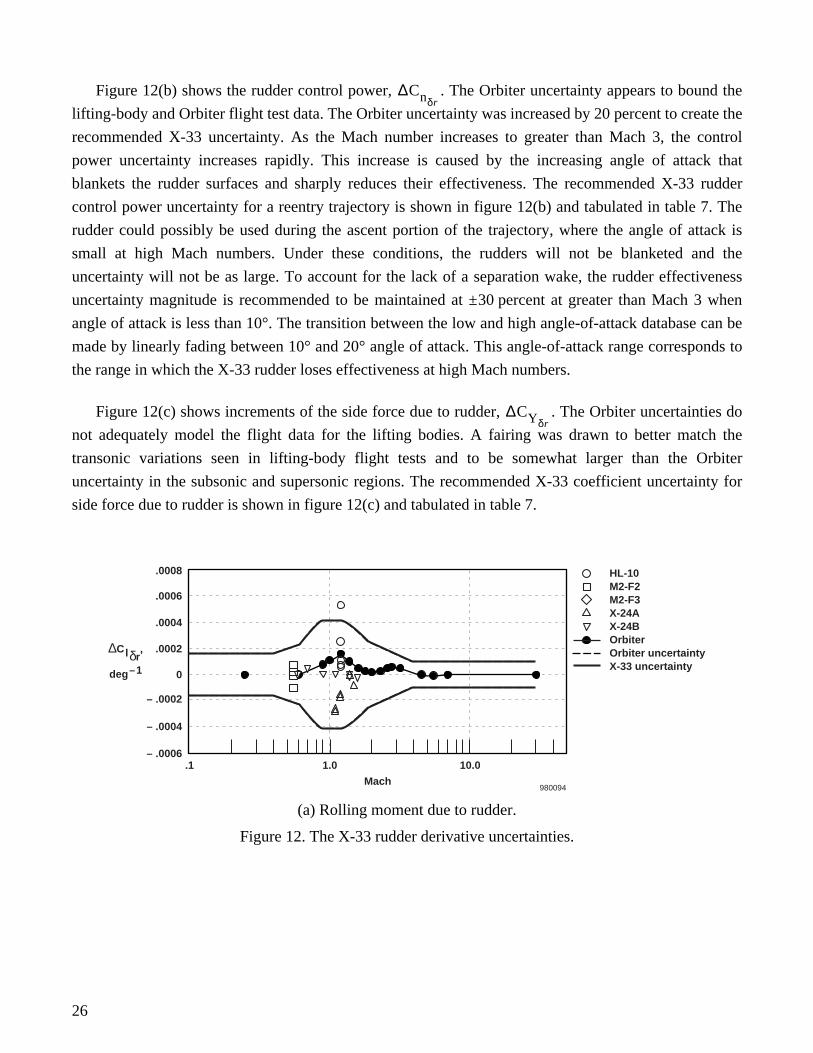
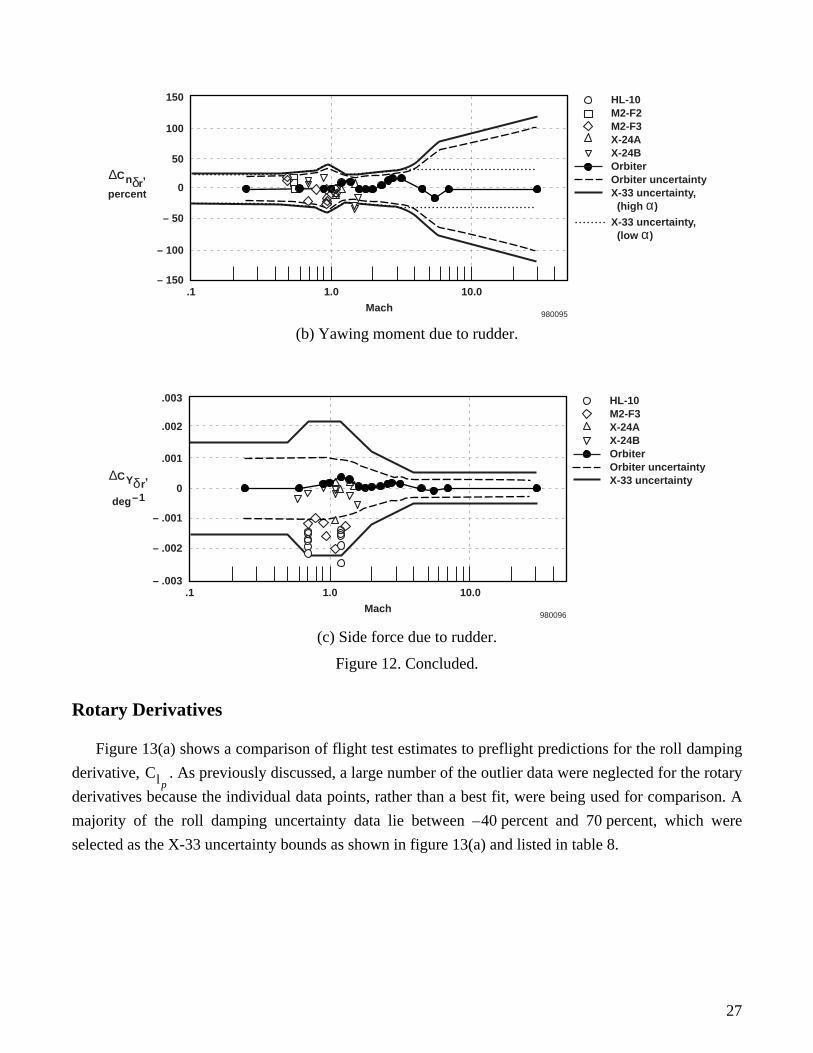
Figure 12(b) shows the rudder control power, . The Orbiter uncertainty appears to bound the
lifting-body and Orbiter flight test data. The Orbiter uncertainty was increased by 20 percent to create the
recommended X-33 uncertainty. As the Mach number increases to greater than Mach 3, the control
power uncertainty increases rapidly. This increase is caused by the increasing angle of attack that
blankets the rudder surfaces and sharply reduces their effectiveness. The recommended X-33 rudder
control power uncertainty for a reentry trajectory is shown in figure 12(b) and tabulated in table 7. The
rudder could possibly be used during the ascent portion of the trajectory, where the angle of attack is
small at high Mach numbers. Under these conditions, the rudders will not be blanketed and the
uncertainty will not be as large. To account for the lack of a separation wake, the rudder effectiveness
uncertainty magnitude is recommended to be maintained at ± 30 percent at greater than Mach 3 when
angle of attack is less than 10°. The transition between the low and high angle-of-attack database can be
made by linearly fading between 10° and 20° angle of attack. This angle-of-attack range corresponds to
the range in which the X-33 rudder loses effectiveness at high Mach numbers.
Figure 12(c) shows increments of the side force due to rudder, . The Orbiter uncertainties do
not adequately model the flight data for the lifting bodies. A fairing was drawn to better match the
transonic variations seen in lifting-body flight tests and to be somewhat larger than the Orbiter
uncertainty in the subsonic and supersonic regions. The recommended X-33 coefficient uncertainty for
side force due to rudder is shown in figure 12(c) and tabulated in table 7.
(a) Rolling moment due to rudder.
Figure 12. The X-33 rudder derivative uncertainties.
∆Cnδr
∆CYδr
1.0.1 10.0
Mach
HL-10M2-F2M2-F3X-24AX-24BOrbiterOrbiter uncertaintyX-33 uncertainty
.0008
.0004
.0006
.0002
– .0002
0
– .0004
– .0006
980094
∆Clδr,
deg–1
26
(b) Yawing moment due to rudder.
(c) Side force due to rudder.
Figure 12. Concluded.
Rotary Derivatives
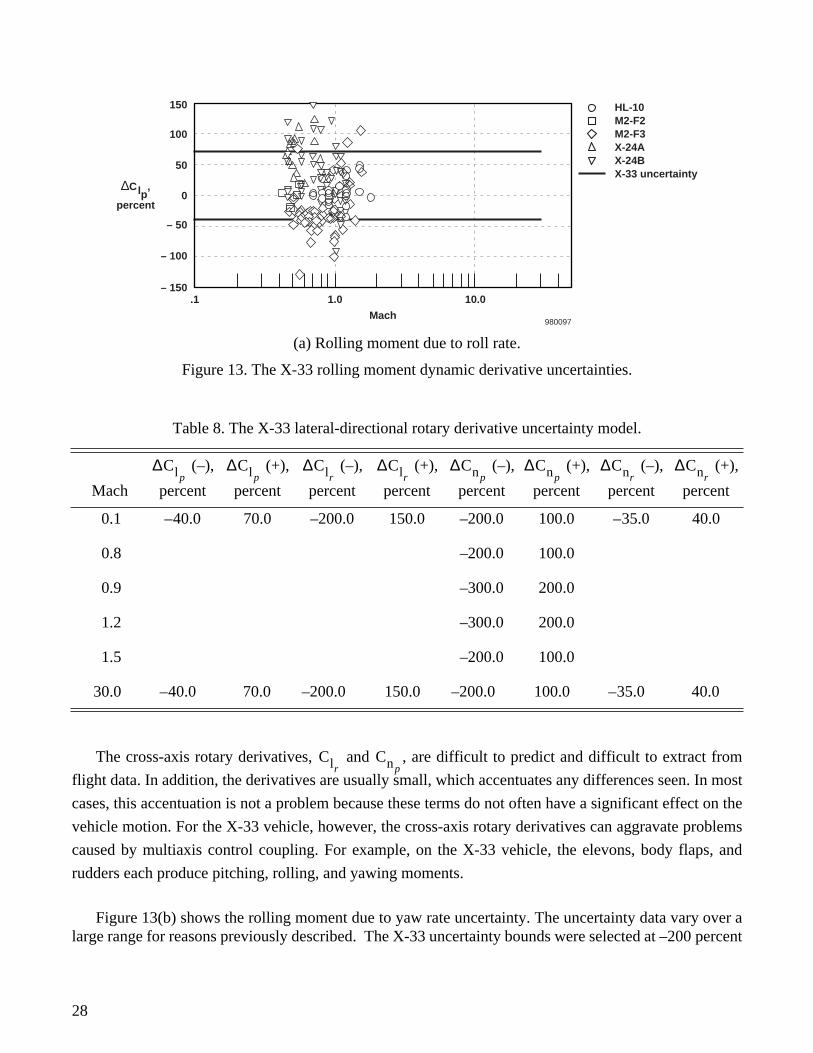
Figure 13(a) shows a comparison of flight test estimates to preflight predictions for the roll damping
derivative, . As previously discussed, a large number of the outlier data were neglected for the rotary
derivatives because the individual data points, rather than a best fit, were being used for comparison. A
majority of the roll damping uncertainty data lie between – 40 percent and 70 percent, which were
selected as the X-33 uncertainty bounds as shown in figure 13(a) and listed in table 8.
1.0.1 10.0
Mach
HL-10M2-F2M2-F3X-24AX-24BOrbiterOrbiter uncertaintyX-33 uncertainty, (high α)
X-33 uncertainty, (low α)
150
50
100
0
– 50
– 100
– 150
980095
∆Cnδr,
percent
1.0.1 10.0
Mach
HL-10M2-F3X-24AX-24BOrbiterOrbiter uncertaintyX-33 uncertainty
.003
.002
.001
0
– .001
– .002
– .003
980096
∆CYδ r,
deg–1
Clp
27
(a) Rolling moment due to roll rate.
Figure 13. The X-33 rolling moment dynamic derivative uncertainties.
The cross-axis rotary derivatives, and , are difficult to predict and difficult to extract from
flight data. In addition, the derivatives are usually small, which accentuates any differences seen. In most
cases, this accentuation is not a problem because these terms do not often have a significant effect on the
vehicle motion. For the X-33 vehicle, however, the cross-axis rotary derivatives can aggravate problems
caused by multiaxis control coupling. For example, on the X-33 vehicle, the elevons, body flaps, and
rudders each produce pitching, rolling, and yawing moments.
Figure 13(b) shows the rolling moment due to yaw rate uncertainty. The uncertainty data vary over alarge range for reasons previously described. The X-33 uncertainty bounds were selected at –200 percent
Table 8. The X-33 lateral-directional rotary derivative uncertainty model.
Mach
(–),
percent
(+),
percent
(–),
percent
(+),
percent
(–),
percent
(+),
percent
(–),
percent
(+),
percent
0.1 – 40.0 70.0 –200.0 150.0 –200.0 100.0 – 35.0 40.0
0.8 –200.0 100.0
0.9 –300.0 200.0
1.2 –300.0 200.0
1.5 –200.0 100.0
30.0 – 40.0 70.0 –200.0 150.0 –200.0 100.0 – 35.0 40.0
1.0.1 10.0
Mach
HL-10M2-F2M2-F3X-24AX-24BX-33 uncertainty
150
100
50
0
– 50
– 100
– 150
980097
∆Clp,
percent
∆Clp∆Clp
∆Clr∆Clr
∆Cnp∆Cnp
∆Cnr∆Cnr
ClrCnp
28

to 150 percent, which is tabulated in table 8. The X-33 control system must be able to compensate forhaving the wrong sign on or having a magnitude 2.5 times higher than predicted.
(b) Rolling moment due to yaw rate.
Figure 13. Concluded.
Figure 14(a) shows data for the yawing moment due to roll rate uncertainty. As expected, the scatteris large, increasing through transonic Mach numbers. The X-33 uncertainty bounds were increased in thisarea to partially account for this effect. The bounds vary from –300 percent to 200 percent transonicallyand –200 percent to 100 percent subsonically and supersonically. The model is listed in table 8.
Figure 14(b) shows the yawing moment due to yaw rate derivative uncertainty data. As with rolldamping, flight results show positive and negative increments of yaw damping. Few data points showedless than one-half the predicted damping. The selected X-33 uncertainty ratio varies from –35 percent to40 percent, as shown in table 8.
(a) Yawing moment due to roll rate.
Figure 14. The X-33 yawing moment dynamic derivative uncertainty.
Clr
1.0.1 10.0
Mach
HL-10M2-F2M2-F3X-24AX-24BX-33 uncertainty
600
200
400
0
– 200
– 400
– 600
980098
∆Clr,
percent
1.0.1 10.0
Mach
HL-10M2-F2M2-F3X-24AX-24BX-33 uncertainty
400
200
0
– 200
– 400
980099
∆Cnp,
percent
29

(b) Yawing moment due to yaw rate.
Figure 14. Concluded.
APPLICATION OF UNCERTAINTY MODELS
Now that the aerodynamic uncertainty models have been generated, some method for applying theaerodynamic errors in a logical way must be developed. The X-33 program will employ several types oftesting that will use the aerodynamic uncertainty models. These test methods include Monte Carlosimulations of the complete mission and linear analysis of the flight control laws from each of the flightphases. The following subsections will describe some of the details of these two test methods.
Monte Carlo Simulation
Stress testing of the X-33 flight control system would not be complete without simulations of theX-33 missions. This type of testing ensures that adequate margins (control, thermal, structural, and soforth) exist throughout the envelope. The X-33 batch simulation will be used to repeatedly “fly” aspecific mission profile. Because the vehicle is completely autonomous, no intervention (by a pilot, forexample) is required to simulate a complete flight. This autonomy allows multiple runs with varyingaerodynamics to be compared directly.
In order to implement the aerodynamic uncertainty model into a Monte Carlo simulation, thedistribution of the uncertainties must be defined. For the X-33 program, the aerodynamic uncertaintieswere assumed to be normally distributed with the uncertainty magnitudes defined in this paper equivalentto a 3-σ value. This assumption allows the uncertainty magnitudes to be easily scaled to any desiredstatistical uncertainty value (for example, 2σ = (2/3)3σ; –1σ = (–1/3)3σ). For better implementation intothe Monte Carlo simulation, the uncertainty models were scaled to 1-σ values. Within the simulationcode, the individual 1-σ uncertainty terms are multiplied by normally distributed random numbers, orgains, that have zero mean and unit variance. In order to prevent unreasonable uncertainties, the gains canbe limited to a maximum variation (for example, ±3).
1.0.1 10.0
Mach
HL-10M2-F2M2-F3X-24AX-24BX-33 uncertainty
100
50
0
– 50
– 100
980100
∆Cnr,
percent
30
For a given simulation run, each of the aerodynamic uncertainty gains will be randomly set alongwith the uncertainties gains from other important models, including propulsion, navigation, actuator,RCS, winds, atmosphere, fuel system, and thermal models. Analysis of a statistically significant numberof runs will reveal those aerodynamic uncertainty combinations that result in a failure to complete themission or cause some limit (heating, Mach number, loads, and so forth) to be exceeded. Extremesensitivity to a particular uncertainty or combination of uncertainties may require an improvement tocontrol law or guidance design. When the flight software is frozen, the Monte Carlo results will be usedto show that the mission success criteria (currently 95 percent confidence level for the X-33 program)will be met.
Linear Analysis
The effect of aerodynamic dispersions on the phase and gain margins of the control system will alsobe assessed. Using the simulation, the X-33 aircraft will be trimmed at points along the trajectories andlinear models of the aerodynamics and control system will be output. These models will be used tocalculate the phase and gain margins at selected points in the flight envelope.17 Typically, the criterionfor evaluation of the control law is that the control law will be stable when subjected to worst-caseuncertainties. Selection of the uncertainty magnitude can be done in a normally random fashion, similarto the Monte Carlo approach described previously; or the important parameters can be perturbedindividually (to their maximum uncertainty) or in small groups (to less than their maximum uncertainty).
CONCLUDING REMARKS
An aerodynamic uncertainty model for the X-33 single-stage-to-orbit demonstrator aircraft has beendeveloped. The model is based on comparisons of historical flight test estimates to preflight wind-tunneland analysis code predictions documented during six lifting-body aircraft and the Space Shuttle Orbiterflight programs. The lifting-body and Orbiter data were used to define an appropriate uncertaintymagnitude in the subsonic and supersonic flight regions, and the Orbiter data were used to extend thedatabase to hypersonic Mach numbers. The uncertainty models will be used to perform linear analysis ofthe X-33 flight control system and Monte Carlo mission simulation studies. The aerodynamic uncertaintymodels developed herein, along with the uncertainty models of all other systems that affect the vehicleflight characteristics (including propulsion, navigation, actuator, reaction control system, winds,atmosphere, fuel system, and thermal models), will be used to stress-test the autonomous X-33 controland guidance systems. Further refinement of the X-33 aerodynamic uncertainty model may occur at theconclusion of the wind-tunnel test program. Because the aerodynamic uncertainty model was developedexclusively using historical data rather than X-33 specific characteristics, the model may be useful toother lifting-body studies.
31

REFERENCES
1Young, James C. and Jimmy M. Underwood, “The Development of Aerodynamic Uncertainties for theSpace Shuttle Orbiter,” Shuttle Performance: Lessons Learned, NASA CP-2283, Part 2, 1983, pp. 1169–1185.
2Weil, Joseph and Bruce G. Powers, Correlation of Predicted and Flight Derived Stability and ControlDerivatives—With Particular Application to Tailless Delta Wing Configurations, NASATM-81361, 1981.
3Pyle, Jon S., Lift and Drag Characteristics of the HL-10 Lifting Body During Subsonic Gliding Flight,NASA TN-D-6263, 1971.
4Strutz, Larry W., Flight-Determined Derivatives and Dynamic Characteristics for the HL-10 LiftingBody Vehicle at Subsonic and Transonic Mach Numbers, NASA TN-D-6934, 1972.
5Horton, Victor W., Richard C. Eldredge, and Richard E. Klein, Flight-Determined Low-Speed Lift andDrag Characteristics of the Lightweight M2-F1 Lifting Body, NASA TN-D-3021, 1965.
6Kempel, Robert W. and Ronald C. Thompson, Flight-Determined Aerodynamic Stability and ControlDerivatives of the M2-F2 Lifting Body Vehicle at Subsonic Speeds, NASA TM-X-2413, 1971.
7Pyle, Jon S. and Robert H. Swanson, Lift and Drag Characteristics of the M2-F2 Lifting Body DuringSubsonic Gliding Flight, NASA TM-X-1431, 1967.
8Sim, Alex G., Flight-Determined Stability and Control Characteristics of the M2-F3 Lifting BodyVehicle, NASA TN-D-7511, 1973.
9Kirsten, Paul W., “Wind Tunnel and Flight Test Stability and Control Derivatives for the X-24A LiftingBody,” FTC-TD-71-7, Apr. 1972.
10Nagy, Christopher J. and Paul W. Kirsten, “Handling Qualities and Stability Derivatives of theX-24B Research Aircraft,” AFFTC-TR-76-8, Mar. 1976.
11Richardson, David F., “Comparison of Flight Test and Wind Tunnel Performance Characteristics of theX-24B Research Aircraft,” AFFTC-TR-76-10, Apr. 1976.
12Sim, Alex G., A Correlation Between Flight Determined Derivatives and Wind-Tunnel Data for theX-24B Research Aircraft, NASA TM-113084, 1997.
13Iliff, Kenneth W. and Mary F. Shafer, Extraction of Stability and Control Derivatives From OrbiterFlight Data, NASA TM-4500, 1993.
14Rockwell International, “Operational Aerodynamic Data Book,” Volume 3, STS85-0118 CHG3,Mar. 1991.
15Romere, Paul O., “STS-26 Flight Assessment Package (FAD 26): Orbiter Aerodynamics,” JSCReport 22078, Apr. 1986.
32

16Maus, J. R., B. J. Griffith, K. Y. Szema, and J. T. Best, “Hypersonic Mach Number and Real GasEffects on Space Shuttle Orbiter Aerodynamics,” AIAA-83-0343, Jan. 1983.
17Bosworth, John T., Linearized Aerodynamic and Control Law Models of the X-29A Airplane anComparison With Flight Data, NASA TP-4356, 1992.
33

REPORT DOCUMENTATION PAGE Form ApprovedOMB No. 0704-0188
Public reporting burden for this collection of information is estimated to average 1 hour per response, including the time for reviewing instructions, searching existing data sources, gathering andmaintaining the data needed, and completing and reviewing the collection of information. Send comments regarding this burden estimate or any other aspect of this collection of information,including suggestions for reducing this burden, to Washington Headquarters Services, Directorate for Information Operations and Reports, 1215 Jefferson Davis Highway, Suite 1204, Arlington,VA 22202-4302, and to the Office of Management and Budget, Paperwork Reduction Project (0704-0188), Washington, DC 20503.
1. AGENCY USE ONLY (Leave blank) 2. REPORT DATE 3. REPORT TYPE AND DATES COVERED
4. TITLE AND SUBTITLE 5. FUNDING NUMBERS
6. AUTHOR(S)
8. PERFORMING ORGANIZATION REPORT NUMBER
7. PERFORMING ORGANIZATION NAME(S) AND ADDRESS(ES)
9. SPONSORING/MONITORING AGENCY NAME(S) AND ADDRESS(ES) 10. SPONSORING/MONITORING AGENCY REPORT NUMBER
11. SUPPLEMENTARY NOTES
12a. DISTRIBUTION/AVAILABILITY STATEMENT 12b. DISTRIBUTION CODE
13. ABSTRACT (Maximum 200 words)
14. SUBJECT TERMS 15. NUMBER OF PAGES
16. PRICE CODE
17. SECURITY CLASSIFICATION OF REPORT
18. SECURITY CLASSIFICATION OF THIS PAGE
19. SECURITY CLASSIFICATION OF ABSTRACT
20. LIMITATION OF ABSTRACT
NSN 7540-01-280-5500 Standard Form 298 (Rev. 2-89)Prescribed by ANSI Std. Z39-18298-102
Development of the X-33 Aerodynamic Uncertainty Model
WU 242 33 02 00 23 00 TA2
Brent R. Cobleigh
NASA Dryden Flight Research CenterP.O. Box 273Edwards, California 93523-0273
H-2221
National Aeronautics and Space AdministrationWashington, DC 20546-0001 NASA/TP-1998-206544
An aerodynamic uncertainty model for the X-33 single-stage-to-orbit demonstrator aircraft has beendeveloped at NASA Dryden Flight Research Center. The model is based on comparisons of historicalflight test estimates to preflight wind-tunnel and analysis code predictions of vehicle aerodynamicsdocumented during six lifting-body aircraft and the Space Shuttle Orbiter flight programs. Thelifting-body and Orbiter data were used to define an appropriate uncertainty magnitude in thesubsonic and supersonic flight regions, and the Orbiter data were used to extend the database tohypersonic Mach numbers. The uncertainty data consist of increments or percentage variations in theimportant aerodynamic coefficients and derivatives as a function of Mach number along a nominaltrajectory. The uncertainty models will be used to perform linear analysis of the X-33 flight controlsystem and Monte Carlo mission simulation studies. Because the X-33 aerodynamic uncertaintymodel was developed exclusively using historical data rather than X-33 specific characteristics, themodel may be useful for other lifting-body studies.
Aerodynamic uncertainty, Lifting-body aircraft, Monte Carlo simulation, ReusableLaunch Vehicle, Stability and control derivatives, X-33
A03
39
Unclassified Unclassified Unclassified Unlimited
April 1998 Technical Paper
Unclassified—UnlimitedSubject Category 02