development of time-varying wind uplift test …
TRANSCRIPT

DEVELOPMENT OF TIME-VARYING WIND UPLIFT TEST PROTOCOLS FOR RESIDENTIAL WOOD ROOF SHEATHING PANELS
By
KENNETH M. HILL
A THESIS PRESENTED TO THE GRADUATE SCHOOL OF THE UNIVERSITY OF FLORIDA IN PARTIAL FULFILLMENT
OF THE REQUIREMENTS FOR THE DEGREE OF MASTER OF ENGINEERING
UNIVERSITY OF FLORIDA
2009
1

© 2009 Kenneth M. Hill
2

To Patricia, Jeff, Christina, Fitz, Mimi and Laddie
3

ACKNOWLEDGMENTS
The completion of this thesis is due to the hard work of several individuals. I would like to
thank Dr. David O. Prevatt for all the support and guidance. Further I would like to thank my
committee Dr. Kurtis Gurley and Dr. Forrest Masters for their considerable contributions through
experimental results and valuable insights. I would like to thank the Department of Civil and
Coastal Engineering for tuition support and the Florida Department of Community affairs for
their support of the research.
I would like to extend thanks to a number of students who have aided in the effort needed
to complete this work: Peter Datin, Bill Dugary, Zack Farrell, Carl Harrigan, Laun Chau, Jared
Easterlin and Johann Weeks who have all in some way contributed to the testing of the many
panels. I would also like to thank James Jesteadt and Chuck Broward for their help in
conducting tests.
Finally I would like to thank my family and friends for their support and confidence. I am
especially thankful for Christina whose support has made all the difference.
4

TABLE OF CONTENTS page
ACKNOWLEDGMENTS ...............................................................................................................4
LIST OF TABLES ...........................................................................................................................8
LIST OF FIGURES .......................................................................................................................11
ABSTRACT ...................................................................................................................................16
CHAPTER
1 INTRODUCTION ..................................................................................................................17
Motivation ...............................................................................................................................17 Objectives ...............................................................................................................................19 Organization of Thesis ............................................................................................................19
2 LITERATURE REVIEW .......................................................................................................22
Wind Loads on Low-Rise Buildings ......................................................................................22 Response to Earlier Historical Hurricane Damage .................................................................24 Recent Hurricane Damage to the United States .....................................................................25 Construction of Residential Houses ........................................................................................27 Wind Uplift Behavior of Residential Wood Roof Sheathing Panels ......................................29
Variability in Uplift Capacity Testing .............................................................................29 Retrofit Measures ............................................................................................................31 In Field Testing ................................................................................................................31
Building Codes .......................................................................................................................32 Wind Uplift Resistance of Dowel Type Fastener Connections in Wood ...............................32
ASTM D-1761 Protocol ..................................................................................................32 Effect of Rate of Loading on Withdrawal Resistance .....................................................33 Pull-Through Testing .......................................................................................................34 Age and Weathering Effects ............................................................................................34 Nail Withdrawal Tests on Existing Residential Buildings ..............................................35
Dynamic Loading ...................................................................................................................36 Related Research at the University of Florida ........................................................................37 Summary .................................................................................................................................37
3 DEVELOPMENT OF STANDARD WIND UPLIFT METHOD WITH STATIC AND DYNAMIC LOADING ..........................................................................................................46
UF Wood Roof Sheathing Uplift Test (UF-WRSUT) Protocol .............................................47 The UF-WRSUT, Method A Static Pressure Test Protocol ............................................48 UF WRSUT, Method B Dynamic Pressure Test Protocol ..............................................49
Failure of Wood Roof Sheathing Panels ................................................................................51
5
Determination of Panel Failure Pressure .........................................................................52
4 EXPERIMENTAL SETUP ....................................................................................................57
Panel Test Series and Construction ........................................................................................57 Panel Test Series ..............................................................................................................57 Laboratory Fabricated Panels (New) ...............................................................................58 Harvested Panels (Aged) .................................................................................................59
Specific Gravity and Moisture Content Measurements ..........................................................61 Uplift Testing Equipment .......................................................................................................63
Panel Installation .............................................................................................................64 Manual Control ................................................................................................................64 Pressure Load Actuator ...................................................................................................65
5 RESULTS AND ANALYSIS.................................................................................................77
Laboratory Static Panel Uplift Tests .......................................................................................77 Evaluation of Fastener Size and Spacing on Uplift Capacity ..........................................77 Comparison of Results with Previous Studies .................................................................79 Evaluation of Calculated Fastener Resistance .................................................................81 Evaluation of ccSPF Retrofit ...........................................................................................82 Failure Mechanisms Observed ........................................................................................83
Harvested Static Panel Uplift Test ..........................................................................................84 Evaluation of Existing Panel Uplift Resistance ...............................................................84 Evaluation of Retrofit of Existing Panels ........................................................................86
Comparison of Laboratory vs. Harvested Specific Gravity Samples .....................................87 Static vs. Dynamic Panel Uplift Test ......................................................................................88
Comparison of Static vs. Dynamic Laboratory Fabricated Panel Uplift Test .................89 Comparison of Static vs. Dynamic Harvested Panel Uplift Test ....................................90 Peak Pressure vs. Failure Pressure ..................................................................................91
Analysis of Variance of Results .............................................................................................91 Procedure .........................................................................................................................92 Laboratory Fabricated Panels Tested Statically ..............................................................94 Harvested Panels Tested Statically ..................................................................................95 Laboratory Fabricated Panels Tested Statically vs. Dynamically ...................................95
6 DISCUSSION .......................................................................................................................118
Analysis of Design Wind Speeds .........................................................................................118 Effect of Aging or Weathering on Wind Uplift Resistance ..................................................121 Effect of Dynamic Nature of Wind Uplift Loading ..............................................................122 Wind Uplift Behavior of Residential Wood Roof Sheathing ...............................................122
7 CONCLUSIONS AND RECOMMENDATIONS ...............................................................127
Conclusions ...........................................................................................................................127 Comparison of Results with Previous Studies ...............................................................127 Effect of In-Service and Environmental Effects on Roof Panel Strength .....................127
6

Dynamic Load Effects on Wood Panel Strength ...........................................................128 Recommendations .................................................................................................................128
APPENDIX
A FULL PANEL UPLIFT RESULTS ......................................................................................130
B FULL FAILURE MODE AND LOCATION INFORMATION ..........................................148
C PANEL CONSTRUCTION OF STATIC VS. DYNAMIC TESTING OF HARVESTED PANELS ......................................................................................................160
D FULL SPECIFIC GRAVITY MEASUREMENTS ..............................................................161
E STATIC VS. DYNAMIC PANEL TESTING, TARGET AND ACTUAL PRESSURE TIME-HISTORIES ...............................................................................................................164
LIST OF REFERENCES .............................................................................................................195
BIOGRAPHICAL SKETCH .......................................................................................................199
7

LIST OF TABLES
Table page 2-1 Wind Uplift Failure Pressure Research Conducted on Wood Roof Sheathing Panels
(1993 through 2004) ..........................................................................................................42
2-2 Summary of selected uplift pressure testing results from Jones (1998) investigation into adhesive retrofit methods for residential wood roof sheathing ..................................43
2-3 Summary of existing residential roof sheathing uplift testing conducted by Judge and Reinhold (2002) .................................................................................................................43
2-4 Summary of building code requirements for roof sheathing design in Florida (1988 to current) ...........................................................................................................................44
2-5 Percentage of original strength summary of Chow et al. investigation of ageing effects on fastener withdrawal and pull-through resistance, (Chow et al. 1990) ...............44
4-1 Laboratory fabricated (New) panel series tested, constructed with ½ in. OSB and 2 in. by 4 in. southern yellow pine # 2 or better ...................................................................69
4-2 Harvested panel series tested .............................................................................................70
4-2 Summary of harvested panels tested statically and statically vs. dynamically ..................73
5-1 Results of static UF-WRSUT of laboratory fabricated panels fastened with 2-3/8 in. long 6d smooth shank, 8d smooth shank and 8d ring shank nails .....................................97
5-2 Comparison of mean and 5% exclusion value failure pressures for panels fabricated in the lab tested statically UF-WRSUT vs. previous studies .............................................98
5-3 Mean of calculated maximum fastener loads based on tributary area ...............................98
5-4 Results of static UF-WRSUT of laboratory fabricated panels fastened with 8d ring shank nails at 6 in. / 12 in. retrofitted with ccSPF adhesive ..............................................99
5-5 Measured failure pressure and calculated fastener failure load of statically tested panels harvested from existing structures in Central Florida ...........................................102
5-6 Mean failure pressures of static UF-WRSUT of panels harvested from existing LFWS located in Central Florida and retrofitted existing panels ....................................105
5-7 Summary of specific gravities calculated to investigate effect of specific gravity on panel wind uplift resistance .............................................................................................107
5-8 Mean failure pressure of laboratory fabricated panels attached with 2 in. long 6d common nails tested statically and dynamically per UF-WRSUT ..................................108
8

5-9 Mean failure pressure of panels harvested from existing construction attached with 1.5 in. long staples at 4 in. / 4 in. tested statically and dynamically per UF-WRUT .......109
5-10 Summary of comparison of peak vs. failure pressure for all static vs. dynamic panel results (34 panels) ............................................................................................................110
5-11 Summary of reduction from statically tested to dynamically tested panel resistance for both peak and failure pressures ..................................................................................111
5-12 Summary of series used in analysis of variance ..............................................................111
5-13 ANOVA table for all laboratory fabricated static phase results (alpha = 0.05, therefore 95% confidence level) ......................................................................................112
5-14 Bonferroni test full results for laboratory fabricated statically tested panels (alpha = 0.05) .................................................................................................................................113
5-15 Bonferroni test summary for laboratory fabricated static tested results (alpha = 0.05) ...115
5-16 ANOVA table for all panels fastened with 6d smooth shank nails spaced at 6 in. / 12 in. (alpha = 0.05, therefore 95% confidence level) ..........................................................116
5-17 Bonferroni test full results for all panels fastened with 6d smooth shank nails spaced at 6 in / 12 in. (alpha = 0.5) ..............................................................................................116
5-18 T-test result for panels retrofitted with 8d ring shank nails at 6 in. / 12 in. vs. panels with only 8d ring shank nails at 6 in. / 12 in. ...................................................................116
5-19 ANOVA table for all panels tested in static vs. dynamic phase using peak pressure (alpha = 0.05, therefore 95% confidence level) ...............................................................117
5-20 Bonferroni test full results for panels tested in static vs. dynamic phase using peak pressure (alpha = 0.05) .....................................................................................................117
5-21 ANOVA table for all panels tested in static vs. dynamic phase using failure pressure (alpha = 0.05, therefore 95% confidence level) ...............................................................117
5-22 Bonferroni test full results for panels tested in static vs. dynamic phase using failure pressure (alpha = 0.05) .....................................................................................................117
6-1 Comparison of design wind speeds calculated per ASCE 7-05 Method 2 for UF-WRSUT Method A results based on A) a factor of safety of 2.0 applied to the mean and B) 5% exclusion of the data (enclosed gable roof building in exposure B assumed, with a mean roof height of 15 ft) .....................................................................125
9

6-2 Comparison of design wind speeds calculated per ASCE 7-05 Method 2 for UF-WRSUT Method B results A) statically tested panels and B) dynamically tested panels (enclosed gable roof building in exposure B assumed, with a mean roof height of 15 ft) ............................................................................................................................126
A-1 Summary of panel uplift test series ..................................................................................130
A-2 Full uplift test results of panels fastened with 1.5 in. staples ..........................................132
A-3 Full uplift test results of panels fastened with 2.5 in. staples ..........................................133
A-4 Full uplift test results of panels fastened with 6d smooth shank nails .............................134
A-5 Full uplift test results of panels fastened with 8d smooth shank nails .............................138
A-6 Full uplift test results of panels fastened with 8d ring shank nails ..................................142
D-1 All specific gravity measurements taken from laboratory fabricated static vs. dynamic uplift testing ......................................................................................................161
D-2 All specific gravity measurements taken from harvested static vs. dynamic uplift testing ...............................................................................................................................162
E-1 Summary of dynamic pressure trace for 6d SS at 6 in. / 12 in. panels (blue – actual and red target) ..................................................................................................................167
E-2 Summary of dynamic pressure trace for 6d SS at 6 in. / 6 in. panels (blue – actual and red target) ..................................................................................................................175
E-3 Summary of dynamic pressure trace for 6d SS at 6 in. / 12 in. retrofitted panels (blue – actual and red target) .....................................................................................................182
E-4 Summary of dynamic pressure trace for 1.5 in. Staples at 4”/4” panels (blue – actual and red target) ..................................................................................................................186
E-5 Summary of dynamic pressure trace for 1.5 in. Staples at 4”/4” with Ret. A-2 panels (blue – actual and red target) ...........................................................................................192
10

LIST OF FIGURES
Figure page 1-1 Total damages due to hurricane events by decade normalized to 2005 US currency
by population vs. housing units presented in a paper by Pielke et al. (2008) ....................21
1-2 Structural damage due to loss of roof sheathing below design wind speeds, design wind speed 140 mph actual wind speed 120 mph Ono Island, AL (FEMA et al. 2005b) ................................................................................................................................21
2-1 Resulting pressure loads from wind loading of residential structures ...............................39
2-2 Structural damage due to loss of roof sheathing below design wind speeds, design wind speed 140 mph actual wind speed 120 mph Ono Island, AL (FEMA et al. 2005b) ................................................................................................................................39
2-3 Typical residential structure construction with wood roof sheathing attached to metal plate trusses or rafter, which are attached to walls with either metal straps or toe-nails ...40
2-4 Fastener schedule and construction of roof panel designed by pre-1994 building code ...40
2-5 Loss of roof sheathing at overhang locations, Hurricane Katrina (130 mph) long beach Mississippi (FEMA et al. 2006) ..............................................................................41
2-6 Tributary areas for individual fastener installed in a 6 in. / 12 in. spaced roof sheathing panel ...................................................................................................................41
2-7 Nail Extraction Device Developed at Clemson University by Sutt (2000) .......................45
3-1 UF-WRSUT static pressure trace. (5 psf initial static pressure is included in the trace) ..................................................................................................................................53
3-2 Gable roof model A) installed in Wind Tunnel and B) close-up of model ........................53
3-3 Pressure tap location A) 1:50 model scale (62 ft by 35 ft full scale) and B) full scale representation of panel .......................................................................................................54
3-4 Comparison of static vs. dynamic pressure traces .............................................................54
3-5 Diagram of instantaneous failure pressure for panel tested statically ................................55
3-6 Sample of target and actual pressure time-history for panels tested with the PLA system A) full time-history and B) close up of instantaneous peak and deviation from target pressure ....................................................................................................................56
4-1 Summary of panel series tested in the static phase of this study .......................................66
4-2 Summary of panel series tested in the static vs. dynamic phase of this study ...................66
11

4-3 Laboratory fabricated panel construction, 6 in. / 12 in fastener schedule shown ..............67
4-4 Laboratory panel fastening schedule (6 in. / 12 in., 6 in. / 8 in. and 6 in. / 6 in.) ..............67
4-5 Static ccSPF retrofit construction of A) fillet sample set and B) full 3 in. sample set ......68
4-6 Panel construction for static vs. dynamic testing with 2 mils. thick plastic sheet placed between sheathing and wood framing member during fabrication ........................68
4-7 Locations of residential structures where panels were harvested ......................................71
4-8 Pictures of harvested panel removal, A) Expose framing members, B) Cut framing members and C) Roof after panels removed ......................................................................71
4-9 Comparison of retrofit measures A-1 and A-2 ..................................................................72
4-10 ccSPF retrofit of an existing residential structure in Port Orange, FL ...............................72
4-11 Laboratory fabricated panel specific gravity sample locations ..........................................73
4-12 Harvested panel specific gravity and moisture content sample locations ..........................74
4-13 Panel installed in pressure chamber with negative pressure setup ....................................74
4-14 Panel installed in pressure chamber with positive pressure setup .....................................75
4-15 Manual control of pressure chamber (A gate valve control and (B vacuum pump in series ..................................................................................................................................75
4-16 Pressure Load Actuator (PLA) ...........................................................................................76
4-17 Comparison of dynamic target vs. actual chamber pressure used with the PLA ...............76
5-1 Mean failure pressures of laboratory fabricated panels tested statically ...........................97
5-2 Summary of mean panel failure (psf) vs. calculated fastener failure (lbs) for A) 8d ring shank nails and B) 8d smooth shank nails attached at 6 in. / 12 in., 6 in. / 8 in. and 6 in. / 6 in. schedules ...................................................................................................99
5-3 Sample of failure mode and location calculations from Statically tested 8d smooth shank nails at 6 in. /12 in. ................................................................................................100
5-4 Distribution of Laboratory Fabricated Statically Tested Panels Dominated by Withdrawal or Pull-through Failure modes A) 6 in. / 12 in. spacing, B) ccSPF retrofit of 6 in. / 12 spacing, C) 6 in. / 8 in. spacing and D) 6 in. / 6 in. spacing .........................101
5-5 Comparison of statically tested harvested and new panels full results of failure pressure ............................................................................................................................103
12

5-6 Comparison of mean uplift capacities with mean calculated fastener failure loads for harvested panels attached with a) staples and b) nails .....................................................104
5-7 Comparison of statically tested harvested panels in existing vs. retrofit conditions separated by individual source houses .............................................................................106
5-8 Probability distribution of Specific Gravity of Panels Tested in Phase 2 for (A New Panels and (B Harvested Panels 15 years old ..................................................................107
5-9 Comparison of statically vs. dynamically loaded laboratory fabricated panels attached with 2 in. long 6d smooth shank nails at 6 in. / 12 in. (existing and retrofit) and 6 in. / 6 in. .................................................................................................................108
5-10 Comparison of statically vs. dynamically loaded panels harvested from existing construction attached with 1.5 in. long staples at 4 in. / 4 in. (existing and retrofit) .......109
6-1 Comparison of lab static mean and 5% exclusion failure pressures to studies by Kallem (1997) w/ plywood, IHRC (2004) w/ plywood and Murphy et al. (1996) w/ OSB (IHRC 8d SS @ 6”/12” was not a normal distribution so 5% exclusion value is not provided) ....................................................................................................................124
B-1 Failure mode / location for panels fastened with 6d smooth shank nail spaced at 6 in. / 12 in. tested statically.....................................................................................................148
B-2 Failure mode / location for panels fastened with 6d smooth shank nail spaced at 6 in. / 12 in., 6 in. / 12 in. retrofitted with ret. A-2, and 6 in. / 6 in. tested statically...............149
B-3 Failure mode / location for panels fastened with 6d smooth shank nail spaced at 6 in. / 12 in., 6 in. / 12 in. retrofitted with ret. A-2, and 6 in. / 6 in. tested dynamically .........150
B-4 Failure mode / location for panels fastened with 8d smooth shank nail spaced at 6 in. / 12 in. tested statically.....................................................................................................151
B-5 Failure mode / location for panels fastened with 8d smooth shank nails spaced at 6 in. / 8 in. tested statically .................................................................................................152
B-6 Failure mode / location for panels fastened with 8d smooth shank spaced at 6 in. / 6 in. tested statically ............................................................................................................153
B-7 Failure mode / location for panels fastened with 8d ring shank nails spaced at 6 in. / 12 in. tested statically .......................................................................................................154
B-8 Failure mode / location for panels fastened with 8d ring shank nails spaced at 6 in. / 12 in. retrofitted with 1-1/2 in. fillet of ccSPF tested statically .......................................155
B-9 Failure mode / location for panels fastened with 8d ring shank nails spaced at 6 in. / 12 in. retrofitted with full 3 in. thick layer of ccSPF tested statically .............................156
13
B-10 Failure mode / location of panels fastened with 8d ring shank nails spaced at 6 in. / 6 in. tested statically ............................................................................................................157
B-11 Failure mode / location for panels fastened with 8d ring shank nails spaced at 6 in. / 8 in. tested statically .........................................................................................................158
B-12 Failure mode / location for panels fastened with 8d ring shank nails spaced at 6 in. / 12 in. tested statically .......................................................................................................159
C-1 Summary of missing fasteners from static vs. dynamic testing, Debary #1 series ..........160
E-1 Summary of pressure time-history for static 6d SS at 6/12 panel (6d SS-38) .................164
E-2 Summary of pressure time-history for static 6d SS at 6/12 panel (6d SS-40) .................164
E-3 Summary of pressure time-history for static 6d SS at 6/12 panel (6d SS-41) .................165
E-4 Summary of pressure time-history for static 6d SS at 6/12 panel (6d SS-42) .................165
E-5 Summary of pressure time-history for static 6d SS at 6/12 panel (6d SS-39) .................166
E-6 Summary of pressure time-histories for dynamic 6d SS at 6/12 panel (6d SS-43) A) full time-history and B) close up of failure ......................................................................168
E-7 Summary of pressure time-histories for dynamic 6d SS at 6/12 panel (6d SS-44) A) full time-history and B) close up of failure ......................................................................169
E-8 Summary of pressure time-histories for dynamic 6d SS at 6/12 panel (6D SS-45) A) full time-history and B) close up of failure ......................................................................170
E-9 Summary of pressure time-histories for dynamic 6d SS at 6/12 panel (6d SS-46) full time-history and B) close up of failure ............................................................................171
E-10 Summary of pressure time-histories for dynamic 6d SS at 6/12 panel (6d SS-47) A) full time-history and B) close up of failure ......................................................................172
E-11 Summary of pressure time-history for static 6d SS at 6/6 panel (6d SS-53) ...................173
E-12 Summary of pressure time-history for static 6d SS at 6/6 panel (6d SS-52) ...................173
E-13 Summary of pressure time-history for static 6d SS at 6/6 panel (6d SS-56) ...................174
E-14 Summary of pressure time-history for static 6d SS at 6/6 panel (6d SS-55) ...................174
E-15 Summary of pressure time-history for static 6d SS at 6/6 panel (6d SS-54) ...................175
E-16 Summary of pressure time-histories for dynamic 6d SS at 6/6 panel (6d SS-57) A) full time-history and B) close up of failure ......................................................................176
14

E-17 Summary of pressure time-histories for dynamic 6d SS at 6/6 panel (6d SS-58) A) full time-history and B) close up of failure ......................................................................177
E-18 Summary of pressure time-histories for dynamic 6d SS at 6/6 panel (6d SS-59) A) full time-history and B) close up of failure ......................................................................178
E-19 Summary of pressure time-histories for dynamic 6d SS at 6/6 panel (6d SS-60) A) full time-history and B) close up of failure ......................................................................179
E-20 Summary of pressure time-histories for dynamic 6d SS at 6/6 panel (6d SS-61) A) full time-history and B) close up of failure ......................................................................180
E-21 Summary of pressure time-history for static 6d SS at 6/12 ret. A-2 panel (6d SS-48) ....181
E-22 Summary of pressure time-history for static 6d SS at 6/12 Ret. A-2 panel (6d SS-49) ..181
E-23 Summary of pressure time-history for dynamic 6d SS at 6/12 ret. A-2 panel (6d SS-50) A) full time-history and B) close up of failure ..........................................................183
E-24 Summary of pressure time-history for dynamic 6d SS at 6/12 ret. A-2 panel (6d SS-51) A) full time-history and B) close up of failure ..........................................................184
E-25 Summary of pressure time-history for static 1.5 in. Staple at 4/4 (1.5 in. Staple-7) .......185
E-26 Summary of pressure time-history for static 1.5 in. Staple at 4/4 (1.5 in. Staple-8) .......185
E-27 Summary of pressure time-history for dynamic 1.5 in. Staple at 4/4 (1.5 in Staple-9) A) full time-history and B) close up of failure ................................................................187
E-28 Summary of pressure time-history for dynamic 1.5 in. Staple at 4/4 (1.5 in. Staple-10) A) full time-history and B) close up of failure ..........................................................188
E-29 Summary of pressure time-history for dynamic 1.5 in. Staple at 4/4 (1.5 in. Staple-11) A) full time-history and B) close up of failure ..........................................................189
E-30 Summary of pressure time-history for dynamic 1.5 in. Staple at 4/4 (1.5 in. Staple-12) A) full time-history and B) close up of failure ..........................................................190
E-31 Summary of pressure time-history for static 1.5 in. Staple at 4/4 with Ret. A-2 (1.5 in. Staple-13) ....................................................................................................................191
E-32 Summary of pressure time-history for static 1.5 in. Staple at 4/4 with Ret. A-2 (1.5 in. Staple-14) ....................................................................................................................191
E-33 Summary of pressure time-history for dynamic 1.5 in. Staple at 4/4 with Ret. A-2 (1.5 in. Staple-15) A) full time-history and B) close up of failure ..................................193
E-34 Summary of pressure time-history for dynamic 1.5 in. Staple at 4/4 with Ret. A-2 (1.5 in. Staple-16) A) full time-history and B) close up of failure ..................................194
15

16
Abstract of Thesis Presented to the Graduate School of the University of Florida in Partial Fulfillment of the Requirements for the Degree of Master of Engineering
DEVELOPMENT OF TIME-VARYING WIND UPLIFT TEST PROTOCOLS FOR
RESIDENTIAL WOOD ROOF SHEATHING PANELS
By
Kenneth M. Hill
December 2009 Chair: David O. Prevatt Major: Civil Engineering
Following the damage caused by Hurricane Andrew (1992) several research institutions
and universities made an effort to improve the performance of residential wood roof sheathing
panels in extreme wind events. The outcome of this research was predicted panel uplift
resistance based on observed performance under varying static test methods. Changes in panel
construction have resulted in improved wind uplift resistance, however failures are still observed
below design level wind speeds. It is the hypothesis of this investigation that some residential
wood roof sheathing panel failures are due to current test methods overestimating panel
resistance. Previous wood roof sheathing panel uplift tests have used uniform static pressure on
newly constructed panels. However aged wood roof sheathing panels are subjected to
temporally varying pressure loading in the field. As part of this research standardized test
protocols are developed for static and temporally varying (dynamic) pressure loading. Panels
fabricated in the lab and harvested from existing construction are tested with static and dynamic
pressure. Over 170 panels were tested statically, 38 of which were harvested from existing
construction, and 34 panels were tested statically vs. dynamically. It is found that dynamic
loading reduces uplift capacity of wood roof sheathing panels approximately 20%, and that age
or weathering do not appear to effect the uplift resistance of panels.

CHAPTER 1 INTRODUCTION
Motivation
The damaging effects of hurricanes making landfall along the eastern seaboard of the
United States have been well documented in the past 20 years, beginning with Hurricane Hugo
(1989). Hurricanes annually cause billions of dollars in property loss in coastal regions of the
south-east United States (van de Lindt et al. 2007). Examples of hurricane damage were
observed in Hurricane Hugo in 1989, Hurricane Andrew in 1992 and most recently during the
eight land falling hurricanes of 2004 and 2005 seasons. Approximately 160 billion dollars
(normalized to 2005) in damages occurred in the 2004-05 hurricanes from Hurricanes Jeanne,
Frances, Ivan, Charley, Rita, Wilma and Katrina (Pielke et al. 2008). This significant damage
highlights a need to better understand the effects of Hurricane events on society. Figure 1-1
summarizes the total damages due to wind events by decade from 1900-2005 normalized to 2005
US dollar by Pielke et al. (2008), which suggests that this level of impact is not uncommon.
Wind damage to light-frame wood structural systems is responsible for a significant
proportion of the observed damage from hurricane events. Sparks (1991b) observed that extreme
winds in Hurricane Hugo were responsible for 60% of the insured losses. Further, a large
proportion of the damage caused to light-framed wood structures is concentrated in damage to
the roof systems. Baskaran and Dutt (1997) estimated that 95% of all monetary losses from
Hurricanes Iniki and Andrew in 1992 resulted from the failure of roof system materials.
The construction of wood roofs typically consists of wood sheathing nailed to wood trusses
or rafters that are attached to the walls of the building. Wood roof sheathing panels provide a
structural diaphragm which resists lateral loads and encloses the structure when used in
conjunction with a roof covering system. Post disaster investigations have found that roof
17

sheathing wind uplift failures lead to structural damage, due to loss of lateral stiffness (FEMA
1993), and extensive water damage (FEMA et al. 2005a). The damage caused by wood roof
sheathing failure presents considerable monetary risk to the state of Florida considering that
approximately $1.5 trillion in building stock are exposed to hurricane events (Pinelli et al. 2004).
Typically, the wind uplift tests used for commercial roofs and roofing systems (i.e. ASTM
E15-92, UL 1897 and FM 4470) are based on physical tests using uniform static pressure applied
to a sample until the specimen fails. However no such test exists for residential roof structures.
The current prescriptive standards for wind uplift resistance of wood roof construction in the
International Building Code (ICC 2006) were developed from experimental research conducted
by Cunningham (1993), Schiff et al. (1994) and others. These tests which are basis for current
design against wind uplift, which were developed five to seventeen years ago, lack the dynamic
characteristics necessary to replicate actual wind forces generated during a hurricane.
It has been observed from post hurricane investigations that roof systems fail at wind
speeds below design level. For example FEMA (2006) reported roof damage to homes in
Alabama and Mississippi during Hurricane Katrina occurred in 120 mph winds although the
design wind speeds for the areas were 140 mph (Figure 1-2). Reasons suggested for this include
poor construction quality, environmental effects which accelerate loss of strength, natural
variability in wood properties and under-estimation of the actual wind forces that occur during
hurricanes. Another reason for this disconnect between in-field and predicted performance may
be related to limitations of current wind uplift test protocols that predict uplift performance.
Baskaran and Dutt (1997) demonstrated that dynamic loads along individual dowel-type
fasteners in wood reduced their withdrawal capacity by 10 to 30%. This effect is not currently
accounted for in panel uplift testing and it may result in overly conservative prediction of wind
18
uplift capacity of wood roof sheathing. Similarly the in service conditions of residential wood
roof sheathing may reduce the uplift resistance. Studies have shown that moisture and high
humidity can cause 38% to 75% reduction in the strength of nails and staples installed in
sheathing to wood framing connection (Chow et al. 1990; Feldborg 1989; Pye 1995).
Judge and Reinhold (2002) conducted one of the first studies to investigate the wind uplift
capacity of roof sheathing installed in residential structures. While their limited study of twelve
harvested wood roof sheathing panels from nine homes in Horry County, SC is not able suggest
any conclusions it provides precedence for uplift testing of harvested panels conducted as part of
this investigation.
It is the hypothesis of this investigation that some premature failures of roof sheathing
panels occur because current wind uplift test methods overestimate the resistance of wood roof
sheathing panels to real wind loading. A second hypothesis is that wood roof sheathing panel
uplift resistance is reduced due to in service environmental effects which may degrade wood
material properties over the typical life (0-50 years) of a residential roof.
Objectives
In order to test these hypotheses, wind uplift pressure testing will be conducted to
• Evaluate the uplift resistance of new vs. aged (harvested) wood roof sheathing panels in order to assess the effect of in-service conditions such as moisture cycles and,
• Compare the wind uplift resistance of wood roof sheathing panels tested statically vs. dynamically in order to assess the effects of dynamic loading.
Organization of Thesis
Chapter 2 presents a literature review of the current knowledge of wind uplift pressure
testing for residential roofs, construction and vulnerability of wood residential buildings. The
structural load path associated with wind events in typical residential wood roof sheathing
system construction and failure mechanisms of wood roof sheathing systems are established.
19

Standardized commercial wood roof sheathing test protocols are reviewed to provide basis for
development of the wind uplift test protocol to be used in testing.
A new standardized wind uplift test protocol is developed in Chapter 3 to evaluate the
wind uplift resistance of wood roof sheathing panels. The protocol include a static pressure test
method that is used to compare results with previously reported studies in the literature, and a
dynamic pressure test method that provides more realistic simulation of actual wind forces.
Through wind uplift testing this investigation will a) evaluate the uplift performance of
new panels and aged wood roof sheathing panels harvested from existing residential structures,
b) compare the failure mechanisms and failure pressures of roof panels tested using new static
vs. dynamic pressure test protocols, c) evaluate the effect of retrofit on existing roof wind uplift
capacity and d) evaluate the effect of specific gravity on failure pressure of wood roof sheathing.
Descriptions of sample construction/harvesting and test equipment are presented in Chapter 4.
Chapter 5 presents the results and analysis of wind uplift tests performed. A discussion of
findings relating to the objectives is then presented in Chapter 6. Chapter 7 makes conclusions
based on results and provides recommendations for future use in a standardized test method.
20

21
0
50,000
100,000
150,000
200,000
250,000
1900
-1905
1906
-1915
1916
-1925
1926
-1935
1936
-1945
1946
-1955
1956
-1965
1966
-1975
1976
-1985
1986
-1995
1996
-2005
Year Range
Mill
ions
of U
S D
olla
rs (2
005) Normalized by Population
Normalized by Housing Units
Figure 1-1. Total damages due to hurricane events by decade normalized to 2005 US currency by population vs. housing units presented in a paper by Pielke et al. (2008)
Figure 1-2. Structural damage due to loss of roof sheathing below design wind speeds, design wind speed 140 mph actual wind speed 120 mph Ono Island, AL (FEMA et al. 2005b)

CHAPTER 2 LITERATURE REVIEW
Wind Loads on Low-Rise Buildings
Natural winds exhibit considerable and rapid fluctuation in its velocity and direction, and
this fluctuation (or turbulence) of the wind produces pressures on bluff bodies in its path that
vary both spatially and in time. Wind tunnel studies have determined that the wind pressure vary
over the building surface, with generally positive pressures being created on the windward walls
and negative pressures on the leeward and side walls of the structure. In low-rise buildings
which have sloped roof structures, fairly high negative pressures can be created in flow
separation zones (at roof corners, ridges or edges) (Holmes 2001), see Figure 2-1. These
negative pressures or suctions can be several times greater than the positive pressures on the
windward walls. These suction forces are responsible for the wind damage to roof structures of
low-rise structures observed after recent hurricanes. To estimate the pressure in the regions of
flow separation Bernoulli’s equation in the form (eq. 2-1),
2
0
1 ⎟⎟⎠
⎞⎜⎜⎝
⎛−=
UUC p (2-1)
is used where Cp is a non-dimensional pressure coefficient, U is the wind speed at the location
being measured and U0 is the reference wind speed. Strictly speaking Bernoulli’s equation is not
applicable in separated flow regions but it has been found that reasonable predictions can be
found. The relationship of wind velocity to the resulting pressure force variations is described by
the aerodynamic admittance function.
Wind speeds are highly variable and the resulting pressure forces depend greatly on the
geometry of the structure making it impossible to solve for loads deterministically. Therefore
stochastic methods are employed to envelope results to account for all possible combinations of
22

variables in determining design pressure loads. This enveloping process is conducted by analysis
of both wind tunnel testing of structural models of different roof shapes and expected wind
speeds for a particular location. Wind tunnel tests result in non-dimensional Cp pressure
coefficients for a particular roof shape to be scaled by the design wind speed. Design wind
speeds are developed by computer modeling to determine the probability of a wind speed being
experienced at any location in the US. These wind speeds are defined at 10 meters (33 ft) above
ground level in open exposure ,and must be adjusted to both the mean roof height and exposure
condition to be applied to wind tunnel determined pressure coefficients. This stochastic analysis
is summarized ASCE 7 (2006), which is the current reference manual used to determine wind
uplift loading on low-rise residential structures.
The turbulent nature of wind loading results in “gusts” which can be significantly higher
than mean wind speeds. These gusts are incorporated into design loads by categorizing the
surface area a connection is designed to resist pressure loading over or “effective wind area”.
The smaller the effective wind area subjected to a gust the larger the effect that gust has on the
connection, because the gust load is not able to be distributed. This is accounted for in ASCE 7
by two categories main wind force resisting systems (MWFRS) and components and cladding
(C&C), which are further broken down by actual effective wind areas. Design wind speeds are
developed by computer modeling to determine the probability of a wind speed being experienced
at any location in the US. These wind speeds are defined at 10 meters (33 ft) above ground level
and must be adjusted to the mean roof height to be applied to wind tunnel determined pressure
coefficients. Pressure loads are summarized in figures by cross-referencing effective wind areas
by roof zones. The zones on a roof are determined from the analysis of wind tunnel studies and
include field, edge, corner and overhang zones, where corner and overhang zones have the
23

highest load. Described above are the external pressure coefficients which are a result of
building geometry, as pressure loading is a result of difference in pressure it is also necessary to
know the internal pressure to determine a load. The internal pressure during wind loading is
dependant on the openings in a structure through which wind can affect internal pressures.
ASCE 7 accounts for this by using three categories open, partially enclosed and enclosed. ASCE
7 design pressures are determined from roof geometry, location, exposure, mean roof height,
effective wind area and openings.
Response to Earlier Historical Hurricane Damage
Following Hurricane Hugo (in 1989) which caused $7 billion dollars in losses and
Hurricane Andrew (in 1992) which caused $26 billion dollars in losses, several organizations
initiated wind uplift testing on wood roof structural components. The results from those tests
have informed many of the wind load design requirements for residential roof construction. The
research was initiated after numerous observations of premature roof failures indicated the
vulnerability of wood roofs on single-family residential structures.
Sparks (1991a) estimated that approximately 60% of the total damage from Hurricane
Hugo occurred to residential buildings, the majority of which occurred to the roof structure. An
analysis of insurance claims from Hugo found that for nearly all case-studies the vast majority
(95%) of losses were a direct result of failure of roof materials (Amirkhanian et al. 1994). Keith
and Rose (1992) observed that 24% of wood-framed residential homes in their study area
(Miami, FL) lost at least one roof sheathing panel during Hurricane Andrew. The consequences
of roof sheathing failure is significant for two reasons: 1) as sheathing fails the roof structure can
lose its structural integrity resulting in structural failure and collapse and 2) sheathing loss
creates openings in the roof that allow water intrusion that causes severe water damage to
interior partitions and building contents (Cook Jr 1991)
24

The connection of wood sheathing to wood framing members was identified as a key
factor in wood roof system failure. Experimental studies were conducted by Cunningham
(1993), Schiff et al. (1994) and others to investigate and improve this connection. These studies
used roof panels installed on a rigid pressure chamber where the chamber pressure is increased
until failure occurs. Failure defined as the first failure of a nailed connection or fracture of the
wood panel or wood framing member. Test results are reported as the mean failure pressure
(psf) and the design (or allowable) wind uplift capacity is determined by dividing the mean
failure pressure by a factor of safety (i.e. 2.0) or using the 5% exclusion value of the data. A full
treatment of experimental studies into wind uplift loading of residential wood roof sheathing is
provided in a later section.
Recent Hurricane Damage to the United States
Since 1900 the monetary loss associated with hurricanes in the United States is
approximately $10 billion normalized to 2005 USD (Pielke et al. 2008), which suggests
consistent potential for loss. Most recently the 2004 and 2005 storms have totaled over $150
billion dollars in damages (Pielke et al. 2008). Hurricane Katrina was the largest contributor
causing over $125 billion of damage followed by Charley ($15 billion) and Ivan ($14 billion).
Wind damage during hurricane events has historically shown to be responsible for the
majority of losses. For example Baskaran and Dutt (1997) estimated that 95% of losses from
Hurricanes Iniki and Andrew in 1992 resulted from the failure of roof system materials under
wind loading. However significant losses can occur from flood damage, which is caused by an
increase in water levels which is referred to as a “storm surge”. Hurricane Katrina is an example
where flood damage has far exceeded wind damage. The damaging effects of wind loading can
reach further inland than storm surge limits and therefore present a risk to larger areas than flood
damage.
25

Wood roof sheathing panels fail in hurricane wind loading by removal or separation of the
sheathing from the wood framing members. Failure occurs when individual fastener connections
fail or to a lesser extent when wood components fracture. The complete removal of a panel is
not necessary to consider a panel to have failed, as water intrusion will increase even with partial
panel removal as observed in Hurricane Hugo (Murden 1991) and elsewhere. Nail withdrawal
from the framing member is the primary mode of failure observed in roof sheathing panels due to
wind loading, with nail pull-through and fracture of the sheathing and/or wood framing observed
to a lesser extent. Nail pull-through is a punching failure of the sheathing where the nail shank
remains embedded in the wood framing while the sheathing is pulled away.
Hurricane Charley a category 4 hurricane on the saffir-simpson scale struck Punta Gorda,
FL on August 13th , 2004 (FEMA et al. 2005a). The storm tracked north-west across Florida
exiting in the Daytona Beach area approximately 10 hours later causing total flood and wind
damages of approximately $16 billion. From a post disaster investigation it was observed that
the majority of damages to residential structures occurred in homes constructed prior to code
changes in 1994. This suggests the reduced fastener spacing and increased size have resulted in
improved performance as compared to homes built after 1994.
Hurricane Ivan a category 3 hurricane on the saffir-simpson scale struck Alabama and
Florida coastline on September 19th, 2004 (FEMA et al. 2005a). The storm tracked north west
over the next week eventually exiting from the Delaware, Maryland, Virginia peninsula causing
approximately $15 billion in losses. Again it was observed that the majority of damage occurred
to construction built after 1994. It was observed that wood sheathing failures occurred in wind
speeds below design level winds. For example roof sheathing failure was observed in 120 mph
winds (estimated from FEMA HAZUS maps) at Ono Island, Alabama where current design wind
26

speed is 140 mph (Figure 2-2). Damage to roof sheathing was also observed in newer
construction below the design wind speeds.
Hurricane Katrina struck southern Florida as a category 1 hurricane on August 25, 2005
then after strengthening in the Gulf of Mexico struck the Louisiana and Mississippi coasts as a
category 3 hurricane (FEMA et al. 2006). As mentioned before the majority of the total
estimated $125 billion in losses was caused by flooding. The majority of wind damage was
observed in pre-1994 construction. Wind damage was also observed in new construction below
design level wind speeds (van de Lindt et al. 2007).
The extensive monetary losses experienced from recent hurricanes have put the affected
communities under considerable strain to cope with recovery. What’s more the homes destroyed
by either the resulting structural or water intrusion damage cause disruptions to thousands of
residents. It is estimated that Hurricane Katrina destroyed over 300,000 single family homes in
Louisiana and Mississippi displacing 450,000 thousand residents (FEMA et al. 2006).
Construction of Residential Houses
Low-rise residential wood roof structures are the focus of this investigation and the load
path associated with resisting wind uplift pressure loads defined above is discussed in this
section. The typical residential structure is composed of a roof system which transfers wind load
to the wall system and then on to the foundation (Figure 2-3). The structural roof sheathing
system is composed of wood sheathing attached to wood framing members. Roof sheathing is
the part of the building envelope which provides weather resisting barrier to the structures and in
many cases its lateral stiffness. Wind loading on roof sheathing panels are resisted by individual
fasteners (nails or staples), which are installed into the wood framing. Roof structures can
consist of individual rafters or more commonly metal-plate connected trusses.
27

These components are fastened to the walls using toe-nailed connection in older homes or
using metal strap connections in contemporary construction. Typical spacing of wood framing
roof members is 24 in. on center. Oriented strand board (OSB) sheathing have been used as roof
sheathing the 1980’s (Feng et al. 2008). OSB is a composite material consisting of small wood
chips glued together and oriented in random directions. Plywood is also a composite material
composed of layers of thin wood sheets adhered together in alternating orthogonal directions.
Current International Building Code specifies the use of ½ in. thick plywood sheathing
(ICC 2006). The code also specifies the minimum fastener sizes and spacing to meet design
wind uplift capacity for residential wood roofs. Fastening schedule written as x in. / y in.,
defines the spacing of fasteners installed along the exterior panel edge the nail spacing’s on
interior panel members. The minimum code requirements for installing wood roof sheathing
systems for building construction before 1994 were 2 in. long nails with 0.113 in. diameter (6d
Common) at 6 in. / 12 in, see Figure 2-4. Approximately 86% of the current building stock are
constructed before building code modifications were introduced in 1994 to improve the wind
resistance of structures (US Census Bureau 2003). Wood roof sheathing systems built after 1994
in high wind zones in Florida are required to use a 2-1/2 in. long 0.113 in. diameter annularly
threaded nails (8d ring shank) at 6 in. / 6 in. or 4 in. / 4 in. at gable ends (ICC 2004).
Many residential roofs overhang the exterior walls along the eaves and at gable ends.
These overhangs are typically 12 to 18 in. long. Light soffit materials are installed below the
cantilever wood members and the soffits also have vents that allow air flow into the attics. This
overhang allows pressure to act on both faces of the sheathing extending into the overhang which
has been observed to be the location of increased failures (Figure 2-5).
28

Wind Uplift Behavior of Residential Wood Roof Sheathing Panels
Design of roof sheathing systems currently relies on full-scale system testing to measure
roof wind uplift capacities. Residential wood roof systems have no industry-recognized test
protocols for determining their wind uplift capacities. Currently accepted loading methods use
static pressures applied uniformly to the full-scale test specimen. It appears that residential wood
roof sheathing design is based on a limited number test studies conducted in the 1990s in
response to extensive damage associated with roof materials observed in Hurricanes Hugo
(1989), Andrew (1992), & Iniki (1992).
The majority of the published work from 1994 through 2008 on residential wood wind
uplift testing was carried at research institutions; Clemson University (Jones 1998; Mizzell 1994;
Murphy et al. 1996; Sutt 2000), FIU (IHRC 2004), while other testing was performed at the APA
(Cunningham 1993), NAHB (NAHB 2003) and Stanley-Bostich (Reinhold et al. 2003).
The wind uplift capacity or structural resistance of wood roof panels can only be
determined by wind uplift testing. Currently there are no analytically based methods for
predicting the wind uplift capacity of wood roof sheathing panels. The current design method is
based on static uplift pressure tests to determine failure capacities of specimens. Fastener load
is calculated by the product of the failure pressure (psf) and the tributary area (ft2), which results
in units of pounds. A sample of tributary areas for a panel fastened with a 6 in. / 12 in. spacing
can be seen in Figure 2-6.
Variability in Uplift Capacity Testing
The lack of a standard residential roof sheathing uplift test protocol is a possible cause for
the variability in pressure test results. The natural variation of wood strength, moisture content
and the wide variety of fasters which may also contribute to observed variability in results, which
range from 26 psf for a 6d smooth shank at 6 in. / 12 in. to 397 psf for a 8d ring shank nail at 6
29

in. / 6in. Tests were performed using pneumatic air pressure or air bags and the failure pressure
was defined as the pressure at which the first sign of structural distress or failure occurred. The
results were reported as the ultimate failure pressure from which nail type and fastener schedule
design values were determined by dividing the ultimate pressure by a factor of safety (typically
2.0) or 5% exclusion values (Kallem 1997).
Table 2-1 summarizes results of studies into wind uplift failure capacities conducted from
1993 to 2004. It can be seen that the mean failure pressure increases with nail size and reduced
fastener spacing, and there appears to be similar performance of wood roof panels fabricated
using OSB or plywood sheathing.
Comparison of these results are somewhat misleading because all of the differences in
individual test methods used to obtain failure pressures such that reported tests lack a common
basis to make comparisons. NAHB (2003) tests were conducted using air bags, while the
remaining test used actual air pressure. The use of air-bags may result in different transfer of
load to the sheathing that pressure loading does. Cunningham (1993) tested only one specimen
per roof configuration. A further difference was observed even within institutions, such as
Mizzell (1994) used a 40 psf/min rate increase versus the near-instantaneous loading that Kallem
(1997) and Sutt (2000) relied upon.
Mean failure pressures vary significantly between studies. Panel attached with 6d smooth
shank fasteners at a 6 in. / 12 in. schedule have mean failure pressures of 55 psf (15/32”
plywood, Cunningham 1993), 65 psf (5/8” plywood, Cunningham 1993)) and 33 psf (plywood,
Kallem 1997). Panels attach with 8d smooth shank fasteners attached at 6 in. / 12 in. had mean
failure capacities of 79 psf (15/32” plywood, Sutt 2000), 67 psf (7/16 OSB, Sutt 2000) and 110
psf (1/2” plywood, IHRC 2004).
30

All told 22 wind uplift failure pressure studies found involved a total of 220 test specimens
and the author was not able to find any other studies available in literature. Despite possible
changes to materials that have been made over past 16 years the results from the 1990s and early
2000s are the basis of recent probabilistic studies and reliability models (i.e. Li and Ellingwood
2009 etc.). The current minimum fastener schedules in the Florida Building Code (ICC 2007)
appear to still be based on these early test results. In successive versions of the Florida Building
Code fastener schedules strengthened and nail dimensions increased in order to increase the wind
uplift capacity of roofs. However, given the wide variation in methodologies used and spread of
failure capacities observed it is difficult to have confidence in the test values used to develop
these prescriptive guidelines.
Retrofit Measures
Retrofit of wood roof sheathing has been investigated at Clemson University for spray
applied adhesives (Jones 1998). Samples were constructed with 4 ft by 8 ft by 15/32 in. plywood
or 19/32 in. OSB attached to 2 in. by 4 in. framing members with 6d smooth shank nails at 6 in. /
12 in. Spray applied adhesive was applied in several combinations of full-bead and partial-bead
between sheathing and framing members. Table 2-2 presents selected results from this study. It
was found that significant improvement can be achieved through this approach.
In Field Testing
Judge and Reinhold (2002) reports on the destructive testing of several homes in Horray
County, SC. Ten wood roof panels were tested and are presented in Table 2-3. Panel
construction tested was connected with staples, 8d sinker nails, and 16d nails. Sheathing was
0.465 in. plywood, 7/16 in. OSB and 8 in. wide wood planking. Failure pressures ranged from
110 psf for staples spaced 3 in. to 5 in. apart to an extremely high 450 psf failure pressure for the
planking.
31

Building Codes
Building codes specify the minimum requirements for construction of buildings within a
jurisdiction. Their purpose is to protect life safety and provide a minimum standard for
performance to protect public/private property. The design and construction of low-rise
residential structures in Florida is governed by the Florida Building Code (ICC 2007) which has
adopted ASCE 7 for reference as the minimum design loads of buildings. Currently the FBC
specifies the construction of residential wood roof sheathing in high wind zones to be ½ in.
plywood attached with 8d ring shank nails spaced at 6 in. Prior to 1994 equivalent provisions
specified the connection of wood roof sheathing to be 6d smooth shank nails spaced at 6 in. / 12
in. Table 2-4 summarizes residential wood roof sheathing attachment in Florida from 1988 to
present.
Wind Uplift Resistance of Dowel Type Fastener Connections in Wood
In previous sections the failure modes of roof sheathing panels are defined as the
individual fastener connections failing in withdrawal or pull-through. This section reviews the
current state of knowledge on withdrawal strength of roof fastener connections. The National
Design Specifications for Wood Construction (NDS) (AF&PA 2005) requires that withdrawal
capacities of all nail types & sizes which shall be used to resist uplift in roof sheathing be
experimentally determined per ASTM D-1761 “Standard Test Methods for Mechanical Fasteners
in Wood” (ASTM 2006a). In addition the nail pull-through capacity of wood based panel
products is considered in the design of wood roof sheathing, and ASTM D-1037 “Evaluating
Properties of Wood-Based Fiber and Particle Panel Materials” (ASTM 2006c) is specified.
ASTM D-1761 Protocol
ASTM D-1761 test protocol “Standard Test Methods for Mechanical Fasteners in Wood”
determines the withdrawal strength of nails under a constant withdrawal rate of 0.1 in. / minute,
32

which is applied to failure. The test specimens are wood prisms with the nail driven at right
angles to the face. Load is applied directly to the nail head wood prism is clamped to the testing
machine. A minimum of 10 samples are tested with expected range of coefficient of variation
(COV) between 15 to 30%. Larger number of samples is needed to obtain COVs in the 5 to 10%
range due to the inherent variability in wood.
Effect of Rate of Loading on Withdrawal Resistance
Kallem (1997) conducted an investigation to determine the effect of nail withdrawal rate
on the nail ultimate failure capacity. The test procedure used by Kallem was based on ASTM
1761 protocol and he compared strength versus six nail withdrawal rate; namely 0.1, 0.5, 1.0,
5.0, 10.0 in. per minute and near instantaneous~1/8 to a 1/10 of a second. Results were then
analyzed for each 10 sample series. Samples were constructed with 2-1/2 in. 8d smooth shank
nails (0.131 in. diameter) installed in spruce pine fir. Mean withdrawal capacities ranged from
153 to 165 lbs and COVs ranged from 21 to 34%. It found that for the given data there was no
apparent relationship between rate of loading and withdrawal strength; however they note that
the study is not conclusive and further testing should include conditioning of wood.
Further investigation was conducted at by Sherman (2000) which used four stages of
loading (0.05, 0.1, 1.0, and 10.0 in./min.) to determine the effect of loading rates on fastener
withdrawal strength in wood. Sample were constructed with two wood species, southern yellow
pine and spruce pine fir, and three fastener, had driven 8d smooth shank nails, power driven 8d
smooth shank nails and hand driven 8d ring shank nails, for 20 repeats each. Again there was no
increase in strength as rate of loading increased, in fact withdrawal loads were slightly higher for
the slowest loading rate. Results do not suggest a relationship between loading rate and fastener
withdrawal strength.
33

Pull-Through Testing
The pull-through strength of OSB and plywood panels and effects of aging have been
investigated in order to determine the appropriate failure mode for wood roof sheathing. Chui
and Craft (2002) investigated pull-through strengths of roof sheathing system with plywood or
OSB per ASTM D-1037 (ASTM 2000). It was found that unless sheathing, both OSB and
plywood, is sufficiently thick (i.e. greater than 1/2 in.) the pull-through strength of 2-3/8 in.
common and 3 in. common roof sheathing fasteners will be the controlling failure mechanism.
Roof sheathing fastener strength is a function of both pull-through & withdrawal failure modes,
where the lower capacity controls.
Age and Weathering Effects
Age and weathering effects on roof sheathing fastener withdrawal strength has been
investigated in laboratory settings in several studies discussed below. Feldborg (1989)
conducted long term withdrawal testing of annularly threaded and smooth shank nails to evaluate
the effects of long term loading and humidity cycling. Nails were driven to three different
depths and loaded with constant withdrawal load for two years while using five different
humidity cycling treatments. After two years the withdrawal strengths of samples which did not
fail were obtained by short term tests. It is found that long term loading has little effect on
withdrawal capacity but that alternating humidity does reduce withdrawal capacity.
Chow et al. (1990) tested 6d smooth shank nails and 2 in. long 16 gauge staples for
withdrawal and pull-through strengths after being exposed to (1) long term (5 years) weathering
outside and (2) accelerated aging in the laboratory per ASTM D-1037 (1978) by soaking in water
and drying in cycles. Results from plywood and OSB samples are summarized in Table 2-5.
Mean withdrawal strength from 16 samples ranged from 31% to 125% of the corresponding
original strength, and mean pull-through resistance ranged from 75% to 99% of the
34
corresponding original pull through strength. A possible reason for increased withdrawal
strength is suggested to be due to corrosion.
Pye (1995) addressed the effects of nail driving/coating, shank type, framing species, and
heat cycles. In testing he used 2 in. by 5 in. by 15/32 in. plywood sheathing attached to a 2 in. by
4 in. by 4-1/2 in. wood framing members of southern yellow pine and spruce pine fir. Pye found
by testing different fasteners that coated or power driven nails had a higher withdrawal capacity
than uncoated, hammer-driven nails. Ring shank nails had a 51% higher capacity than similar
diameter smooth shank nails. Fasteners installed in southern yellow pine wood had the highest
capacity except in the case of heat testing. Heat cycles ranging from 1 to 48 hours in duration
were found to have the most significant effect, producing approximately 56% reduction, on
fastener withdrawal capacity as compared with samples not exposed to heat cycling.
Nail Withdrawal Tests on Existing Residential Buildings
Laboratory investigations (Feldborg 1989, Chow et al. 1990 and Pye 1995) have found that
humidity and heat reduces ultimate withdrawal strength of nails and staples installed in wood
framing members under laboratory conditions. However the effect of humidity and heat cycles
on the in-service performance of mechanical fasteners has not been well defined.
Sutt et al. (2000) developed a portable nail extraction device to measure nail withdrawal
strength of nails installed in existing roof structures. The device uses a 2000 lb load cell
connected to metal jaws that engage the nail heads (after sheathing has been removed), and lever
arms used to pull this assembly vertically upwards. The load cell was connected to a digital
readout that provides peak withdrawal load from the nail (Figure 2-7). Sutt et al. collected nail
withdrawal loads from 200 samples taken from a single residential structure in Anderson, SC.
The 2-3/8 in. long 0.113 in. diameter nails were installed in SYP and SPF. The mean nail
withdrawal load and coefficient of variation for SYP results were 68 lbs/in. and 56%
35

respectively. The mean nail withdrawal load and coefficient of variation for SPF results were 42
lbs/in. and 59% respectively. The rather high variability in withdrawal loads and low mean
capacities obtained by Sutt’s work was attributed to aging effects associated with in-service
conditions. Sutt also suggested that the withdrawal capacity of the nails were lower than
expected from NDS (AF&PA 2005) design values also due to the effects of age and weathering
of the wood.
Dynamic Loading
Investigations into the effects of uniform dynamic wind loading on flexible thermoplastic
roofing systems attached with mechanical fasteners have been conducted by (Baskaran and Dutt
1997; Baskaran et al. 1999b). In this study component testing of individual nails installed in a ½
in. of plywood and OSB sheathing was conducted by applying sinusoidal load to the nails.
When compared to static loading it was found that the mean withdrawal loads for the dynamic
loading were reduced by 13 to 30 %.
The effects of dynamic loading on axially loaded dowel type fastener in wood is relatively
unknown. The only such research has been conducted by Baskaran and Dutt (1997) described
above. The varying load may cause damage to the frictional interface of the nail surface and the
wood material. This type of damage may be similar to fatiguing effects in other materials where
the number and amplitude of cycles determines the amount of damage.
The cumulative damage model used to describe the interaction of multiple durations at
different amplitude was proposed by Miner (Benham and Warnock 1976) can be described by,
1...2
2
1
1 =++Nn
Nn
(2-2)
Where n1 is the number of cycles at one stress level which would require N1 cycles to
cause failure, and n2 is the number of cycles at a second stress level which would require N2
36

cycles to cause failure. The idea is that the sum of the ratio of numbers of cycles at each stress
level should sum to 1.0 or total damage.
In order to use this fatigue model for dowel type fasteners installed in wood it is necessary
to determine the failure or stress level – number of cycles (S-N) curve, which would define how
many cycles at a stress level it would take to fail a connection. To extend this fatigue model to
wood roof sheathing uplift capacity it is first necessary to understand how pressure load is
distributed to individual fasteners. As both the withdrawal strength of individual nails and the
distribution of pressure load through a sheathing panel are extremely variable processes the
problem would need to be solved through stochastic methods requiring large numbers of repeats.
Related Research at the University of Florida
This thesis seeks to advance the understanding of the structural performance of wood roof
sheathing systems through component based testing of new and existing wood roof panel
specimens. The study follows a research direction initiated through the Florida Coastal
Monitoring Program (FCMP). FCMP was initiated at Clemson University in 1998 with three
main goals; (a) the characterization of wind field in real loading conditions, (b) quantifying the
resistance of existing residential construction structural components and (c) laboratory
simulation of hurricane loading characteristics in component testing (Jesteadt 2006). Jesteadt
developed and summarized methods to harvest existing residential wood roof sheathing panels.
These procedures were used for removal and testing in this investigation to evaluate the effects
of aging and weathering.
Summary
This chapter presented testing procedures, review of damage levels observed to wood
structures in hurricanes, wind load on low-rise structures, structural behavior of wood roof
37

panels at ultimate wind uplift loads, and source of the previous wood roof sheathing panel uplift
tests used as comparison in this study.
38

Ground Level
Flow Separation ZonesWind Flow
Figure 2-1. Resulting pressure loads from wind loading of residential structures
Figure 2-2. Structural damage due to loss of roof sheathing below design wind speeds, design wind speed 140 mph actual wind speed 120 mph Ono Island, AL (FEMA et al. 2005b)
39

Figure 2-3. Typical residential structure construction with wood roof sheathing attached to metal plate trusses or rafter, which are attached to walls with either metal straps or toe-nails
6 in. / 12 in.
6 in.
12 in.
24 in.
Wood framing member nominal 2 in. wide by 4 in.
Figure 2-4. Fastener schedule and construction of roof panel designed by pre-1994 building code
40

41
Figure 2-5. Loss of roof sheathing at overhang locations, Hurricane Katrina (130 mph) long beach Mississippi (FEMA et al. 2006)
Figure 2-6. Tributary areas for individual fastener installed in a 6 in. / 12 in. spaced roof sheathing panel

Table 2-1. Wind Uplift Failure Pressure Research Conducted on Wood Roof Sheathing Panels (1993 through 2004) Reference Sheathing
Thickness, in. Sheathing Type
Wood Member Size
Wood Member Species Nail Size Nail Spacing,
in./in. Number of Samples
Average Uplift, psf COV Distribution Loading Regime
(Cunningham 1993)
15/32 5-ply plywood 2x4 Douglas-fir or
larch 6d Common 6/12 1 55 N/A N/A
Monotonic 30-40 psf/min
15/32 5-ply plywood 2x4 Douglas-fir or
larch 8d Common 6/12 1 130 N/A N/A
7/16 OSB 2x4 Douglas-fir or larch
6d Common 6/12 1 65 N/A N/A
5/8 4-ply plywood 2x4 Douglas-fir or
larch 8d Common 6/12 1 105 N/A N/A
15/32 5-ply plywood 2x4 Douglas-fir or
larch 6d Common 6/6 1 120 N/A N/A
5/8 4-ply plywood 2x4 Douglas-fir or
larch 8d Common 6/6 1 218 N/A N/A
5/8 4-ply plywood 2x4 Douglas-fir or
larch 8d Ring Shank 6/6 1 397 N/A N/A
(Mizzell 1994)
15/32 Plywood 2x4 SPF #2 or better
6d Common 6/12 4 26 0.09 Normal
Step: Increase 1 psf increments and hold for 1.5 sec
15/32 Plywood 2x4 SPF#2 or better 8d Common 6/12 10 61 0.11 Normal
15/32 Plywood 2x4 SPF #2 or better
8d Common 6/6 10 107 0.16 Lognormal
19/32 Plywood 2x4 SPF#2 or better 8d Common 6/6 10 115 0.28 Lognormal
19/32 OSB 2x4 SPF #2 or better
8d Common 6/6 10 77 0.27 Normal
(Murphy et al. 1996) 15/32 OSB N/A SYP #2 or
better 8d Common 6/6 30 131 0.14 Normal Step: Increase
1 psf for 1.5 sec
(Kallem 1997) NA 4-ply Plywood 2x4 SYP 6d
Common 6/12 14 33 0.22 Normal Rapid Monotonic (failure in “less than 16 seconds”)
(Jones 1998) 19/32 OSB 2x4 SYP/SPF #2 or
better 8d Common 6/12 10 87 0.28 Lognormal
Monotonic 15/32 CDX
Plywood 2x4 SYP/SPF #2 or better
8d Common 6/12 9 80 0.17 Normal
(Sutt 2000) 15/32 Plywood 2x4 SYP 8d
Common 6/12 7 79 0.09 N/A Rapid Monotonic – Failure occurs within 10-45 sec 7/16 OSB 2x4 SYP 8d
Common 6/12 7 67 0.15 N/A
(NAHB 2003) 7/16 OSB 2x6 SPF #1/#2 8d Common 6/12 3 228 0.07 N/A Monotonic: 20 psf/min
(IHRC 2004) 1/2 CDX
Plywood 2x4 SYP 8d Common 6/12 49 110 0.17 Lognormal
Monotonic 1/2 CDX
Plywood 2x4 SYP 8d Ring Shank 6/12 50 140 0.17 Normal
42

Table 2-2. Summary of selected uplift pressure testing results from Jones (1998) investigation into adhesive retrofit methods for residential wood roof sheathing
Control Full-bead both sides % Increase in Mean Failure Pressure # of
Panels Mean Failure Pressure (psf) COV # of
Panels Mean Failure Pressure (psf) COV
OSB 10 87 28% 4 185 16% 113% Plywood 9 72 10 213 196%
Table 2-3. Summary of existing residential roof sheathing uplift testing conducted by Judge and Reinhold (2002)
House Sheathing and Framing Fastener Spacing # of Panels
Failure Pressure (psf)
1 0.465 Ply, 2" x 4" @ 24" o.c. 2.5" 0.113" dia. 6" / 8-12" 1 127
2 0.465 Ply, 2" x 6" @ 16" o.c. 2.5" 0.113" dia. 6" / 8-10" 2 232
3 7/16" OSB, rafter @ 24" o.c. Staples 3-5" 1 105
4 7/16" OSB, rafter @ 24" o.c. Staples 3-5" 2 110
5 rafter @ 24" o.c. 2.5" 0.113" dia. 7-9"/5.5-7.5" 1 196
6 rafter @ 24" o.c. 2.5" 0.113" dia. 7-9"/5.5-7.5" 2 119
7 8" Plank, rafter @ 16" o.c. two 8d and one 16d nail per rafter 1 450
43

Table 2-4. Summary of building code requirements for roof sheathing design in Florida (1988 to current)
Year Building Code Nail Min. Sheathing Thickness Fastening Schedule
1988 South Florida Building Code (Dade County 1988)
6d common 8d common
½ in. or less greater than ½ in. 6 in. / 12 in.
1994 South Florida Building Code(Dade County 1994) 8d common up to 19/32 in. 6 in. / 12 in.,
and 4” at gable ends
1997 Standard Building Code (SBCCI 1997)
6d common 8d common
½ in. or less 19/32 in. or greater 6 in. / 12 in.
2000 International Building Code (ICC 2000) 8d common ¾ in. or less 6 in. / 12 in.
2004 Florida Building Code (ICC 2004) 8d common ¾ in. or less 6 in. / 6 in.,
and 4” at roof corners
2004 Florida Building Code High-Velocity Hurricane Zone (ICC 2004)
8d ring shank Minimum 19/32 in. 6 in. / 6 in., and 4” at gable ends
2006 International Building Code (ICC 2006) 8d common ¾ in. or less 4 in. / 8 in.
2007 Florida Building Code High-Velocity Hurricane Zone (ICC 2007)
8d ring shank Minimum 19/32 in. 6 in. / 6 in., and 4” at gable ends
Table 2-5. Percentage of original strength summary of Chow et al. investigation of ageing effects on fastener withdrawal and pull-through resistance, (Chow et al. 1990)
Sheathing Fastener Withdrawal Pull-Through Outdoor Lab Outdoor Lab
Plywood C-D grade Nail 38% 38% 85% 77% Staple 61% 30% 87% 99%
OSB (pine) Nail 31% 125% 75% 82% Staple 56% 18% 83% 97%
Notes: Nail-6d smooth shank; Staple-2 in. long 16 gauge staples; Lab aging per ASTM D-1037 (78)
44

45
Figure 2-7. Nail Extraction Device Developed at Clemson University by Sutt (2000)

CHAPTER 3 DEVELOPMENT OF STANDARD WIND UPLIFT METHOD WITH STATIC AND
DYNAMIC LOADING
The intent of any standard wind uplift test protocol should be to replicate the real effects of
wind loading on building components, under controlled laboratory conditions, that the building
component would experience in an extreme wind event. The test protocol should also be
repeatable, consistently reproducing the same test conditions in every test, so that reasonable
comparisons can be made for performance of any roof or wall system. For this reason simple
uniform static test protocols have been used for the majority of commercial and residential roof
sheathing tests. These tests assume that extreme wind loading can be modeled as a pseudo-static
pressure load on a rigid building. Most wind uplift tests ignore the dynamic characteristics of the
wind, assuming that structural component are rigid and therefore will not have a significant
response to fluctuating loads (Holmes 2001). However it may not be an accurate assumption
because it relies on the rigidity of the structure not the components. Residential wood structures
are rigid systems but the stiffness of individual building cladding components (i.e. wood roof
sheathing panels) may not be as rigid. Wind flow produces pressures and structural loads that
vary temporally and spatially but these features are not represented in static test methods.
In order to evaluate wind uplift performance of wood roof sheathing panels a test protocol
must be selected that reasonably recreates wind load conditions. As discussed in the previous
chapter, no such protocol currently exists and still no widely accepted test methods are available
for wood roof sheathing. Thus a first stage of this research was to develop a suitable wind uplift
test protocol. It was decided to develop both a static test protocol having clear-cut guidelines, as
well as a dynamic test protocol, to test the hypothesis that fluctuating wind load reduces the
ultimate resistance of wood roof panels.
46

This chapter presents the development of the test protocol and two loading functions that
will be used in the experimental studies following this chapter. The test protocol is called the
University of Florida - Wood Roof Sheathing Uplift Test (UF-WRSUT) Protocol with Method
A – Static Pressure and Method B – Dynamic Pressure. The main features of the UF-WRSUT
Protocol are as follows:
In order to provide a basis for comparison the parameters effecting panel uplift resistance
addressed are,
• The pressure traces are fully described to enable accurate reproduction,
• The number of repeats in each test series is established (a minimum of 10 repeats is recommended)
• Failure modes are observed and recorded,
• The material properties (specific gravities and moisture contents) of the wood sheathing and components are recorded,
• Details of geometric dimensions and characteristics of the fasteners are recorded,
During this investigation the above requirements were added incrementally as knowledge
of critical parameters was gained through (1) a literature review of previous findings and (2)
experience gained during testing. Therefore not all testing presented in this investigation adheres
to these requirements. Additionally some requirements are not able to be followed due to
limitations such as a lack of sufficient harvested samples, this is noted in the discussion.
UF Wood Roof Sheathing Uplift Test (UF-WRSUT) Protocol
Several experimental studies have been previously used to determine the wind uplift
resistance of wood panels (Cunningham 1993; IHRC 2004; Kallem 1997; Mizzell 1994). For the
purposes of this research a “static” pressure test is defined when the chamber pressure does not
cycle or fluctuate. Static pressure tests may include periods of constant pressures held for
specific lengths of time or periods where pressure is monotonically increasing or decreasing.
47

The UF-WRUST test protocol was adapted from the existing standard test protocol, ASTM
E330-02 for determining the structural performance of exterior curtain walls and windows and
doors (ASTM 2004b). ASTM E330 is intended only for evaluating the structural performance
associated with the specified test specimen and not the structural performance of adjacent
construction. This test method was the selected starting point instead of using wind uplift test
protocols for commercial roofing tests because of the typical duration of each test was
comparable to durations of previous studies. ASTM E330 acknowledges the time-dependency of
strength and deflection characteristics in some materials and so it recommends testing assemblies
for the actual time duration to which it would be exposed.
The test is conducted by sealing a test specimen against one face of a closed test chamber
to which air is supplied or exhausted at a sufficient rate to maintain the pressure difference across
the specimen. The ultimate failure pressure of the panel is the maximum pressure that it sustains
without failure. Failure of the panel can be by nail withdrawal or pull through or by fracture of
one or more wood framing members or of the sheathing. During a hurricane event a roof
structure would typically experience several hours of elevated wind speeds and increasing
gustiness, however typically wind speeds approach or exceed the design wind speeds of the
house only during a few time periods. It is assumed that the extreme wind speeds are the sole
cause of roof damage, and therefore the effect of lower intensity pressure duration and
fluctuations are neglected. The 10 second period wind pressure is then representing the period in
which peak pressure acts on the structure to cause damage. The static test will reproduce the
most severe peak pressure but not the sustained buffeting that the roof may experience.
The UF-WRSUT, Method A Static Pressure Test Protocol
The UF-WRSUT, Method A Static test protocol uses the step-and-hold procedure
identified by ASTM E-330 procedure B with a 10-second pressure plateau. The pressure control
48

can be applied manually or under computer-control. For the computer-control approach it is
found that two 20 second long initial stabilizing pressure steps are needed; at 5 psf and again at
15 psf. The chamber pressure is increased in 15 psf increments, held for 10 seconds and
increased again until failure. A typical pressure trace is shown in Figure 3-1.
The following adjustments to the ASTM E330 test protocol were made:
• Include initial pressure stabilization time steps of 5 psf and 15 psf for 20 sec. each.
• Apply pressure in one direction only; i.e. either suction (reduced chamber pressure) or pressure (increased chamber pressure), but not both.
• Eliminate deflection readings to observe permanent panel deformations.
• Eliminate the 60 second recovery period for stabilization during testing.
• Determine and report the moisture content and specific gravity of wood members.
• Record and report the nail properties (length, shank diameter, head diameter, coating material and deformed shank pattern).
Panel failure is defined as any permanent separation between sheathing and framing
member, sheathing fracture, split in framing member or failure of nails (in withdrawal or pull
through). The chamber pressure is monitored and continuously recorded during the test and the
peak instantaneous pressure at failure is recorded. The determination of the peak instantaneous
failure pressure is discussed in a subsequent section. Each panel is inspected after the tests and
the locations and failure mechanisms of the fasteners are noted.
UF WRSUT, Method B Dynamic Pressure Test Protocol
The dynamic wind pressure trace was developed to better simulate the wind pressure
fluctuations observed in actual wind loading. There are a few existing dynamic pressure test
protocols used for roof sheathing, for example SIDGERS (Baskaran et al. 1999a). These test
traces apply uniformly distributed pressures in regular cycles, amplitude and constant frequency,
to the specimen. The more recent SIDGERS was developed using rain-flow analysis of wind
49

tunnel pressure data. The UF-WRSUT, Method B was also developed from a wind tunnel study
but the characteristics of the fluctuations were retained.
Development of the UF-WRSUT, Method B dynamic trace is based on time histories of
pressure fluctuations collected from wind tunnel data conducted at Clemson Universities
boundary layer wind tunnel facility. The study (Datin and Prevatt 2007) used a 1:50 scale model
of a 30 ft by 60 ft gable roof residential structure. The building had a mean roof height of 13 ft 6
in. and a 4 in 12 (18.4º) slope, Figure 3-2, and 387 taps were installed.
Upwind terrain was modeled as suburban terrain exposure, (zo = 0.22 m) with a turbulence
intensity of 24% at mean roof height in the tunnel (with building model removed). Only selected
highlights of this experiment are reported here, and further details can be obtained in Datin and
Prevatt (2009). For this study a simulated pressure trace was developed from the measured
pressure coefficients at pressure tap #002, located at (16.75 in., 7.75 in.) from the ridge corner at
full-scale, see Figure 3-3.
The dynamic pressure trace was developed using the reduced frequency relationship to
provide an equivalent full-scale time step. This is done because wind tunnel measurements are
taken at a faster rate than the pressure control system can process, therefore requiring that the
data be compressed while retaining the frequency content of the wind tunnel measurements. A
10 second period pressure fluctuation was chosen so that it contained at least three peak pressure
excursions of near equal and highest magnitude during the period. The wind pressure coefficient
trace was converted to full-scale pressure trace and the highest peak pressure was matched to a
pressure plateau (i.e. 15 psf, 30 psf, 45 psf, etc.) as in Method A static pressure trace, see Figure
3-4.
50

Failure of Wood Roof Sheathing Panels
The predominant failure mode for wood roof panels is nail withdrawal, followed by nail
pull through failures and to a lesser extent fracture of the wood framing member or sheathing.
Typically connections fail in fastener withdrawal or fastener head pull-through failure modes.
The failure of an entire panel is a result of multiple connections failing in which individual
connections progressively fail after the initial fastener. However the removal of an entire roof
sheathing panel from the framing members is not necessary to consider the panel as failed since
even partial removal provides a path for water flow into the structure. Additionally the nailed
(dowel-type) fastener connections to wood, loaded axially in withdrawal is a very brittle one in
which nearly all strength is lost after minimal displacement (Forest Products Laboratory 1999).
Currently it is not possible to relate the load distribution behavior of fasteners in wood sheathing
panels to failure pressures because there have been no studies conducted that directly measured
the nail withdrawal load. Further it is not always possible to relate field performance of roof
panels to failure pressures given the large number of parameters (construction quality, actual
wind speed, wood specific gravity and condition, nail type and length, and spacing’s etc.) for
which no data is available. Further post-disaster studies do not usually detail the actual failure
mechanisms observed in the panels.
It is proposed that to establish the relationship of fastener type and spacing, sheathing, and
framing condition on roof panel performance the location and modes of failure for all fastener
failures must be observed. Qualitative considerations such as the location of the connection
failures within the panel and the type of failure (rapid versus slow) may also be important. It is
noted however, that such visual observations of failure modes after the panel has failed cannot
determine the location of the initial fastener to fail.
51

Determination of Panel Failure Pressure
The panel failure pressure recorded is the instantaneous peak pressure recorded at failure
where panel failure is determined by examination of pressure trace. Pressure for panels tested in
the static phase of the investigation were predominantly recorded with a peak measurement
pressure gauge, therefore failure pressure for these samples is simply the peak instantaneous
pressure from the test. The peak instantaneous pressure is selected as the panel failure pressure
because it is the largest pressure the panel could withstand before permanent damage was
inflicted.
A pressure transducer was incorporated to recorded time-histories for the ccSPF retrofit
test series from which the peak instantaneous pressure was found (Figure 3-5). The benefit of
the pressure time-history is that if for some reason the pressure spiked after panel failure this
false peak pressure could be identified and discarded.
Panels tested in the static vs. dynamic phase of the investigation used a computer
controlled system which measured the pressure time-history. The program shuts off if it
determined there was significant leakage in the system resulting in a deviation from the target
pressure. Pressure time-histories were evaluated to determine the peak instantaneous pressure
which preceded failure. Figure 3-6 presents a sample of the pressure time-history for a panel
fastened at 6 in. / 12 in. All time-histories of dynamically tested panels are presented in
Appendix E.
52

Increase
to Fail
ure
Figure 3-1. UF-WRSUT static pressure trace. (5 psf initial static pressure is included in the
trace)
A B Figure 3-2. Gable roof model A) installed in Wind Tunnel and B) close-up of model
53

4.1”2.9”
18.4⁰
7.2”
14.9"
4.2"
4.2"
14.9”
4.2”
4.2”
A
4 ft
8 ft
Ridge LineX
Y
027
001
023026 025 024
005 004 003 002
B
Figure 3-3. Pressure tap location A) 1:50 model scale (62 ft by 35 ft full scale) and B) full scale
representation of panel
Figure 3-4. Comparison of static vs. dynamic pressure traces
54

Failure Pressure (60 psf)
Figure 3-5. Diagram of instantaneous failure pressure for panel tested statically
55

56
A
Instantaneous Peak
Initial deviation from target pressure (failure)
Target Actual
B
Figure 3-6. Sample of target and actual pressure time-history for panels tested with the PLA
system A) full time-history and B) close up of instantaneous peak and deviation from target pressure

CHAPTER 4 EXPERIMENTAL SETUP
Wind uplift pressure tests were conducted using 4 ft by 8 ft roof sheathing panels tested on
a steel pressure chamber. Tests were conducted on both laboratory-fabricated panels and roof
panels harvested from existing structures. The description of sample panel construction,
harvesting, preparation, instrumentation, test equipment and procedures used in testing are
presented in this chapter.
Panel Test Series and Construction
Laboratory fabricated panels were constructed in two groups with slightly different
arrangements and different retrofit methods. The first group evaluated the effects of fastener
type and spacing on uplift resistance of panels tested statically. The second compared the uplift
resistance of panel tested statically vs. dynamically. Aged roof panels were harvested from 12
existing residential houses through the FCMP program over a year period from 2006 to 2009,
and tested in two groups with different retrofit methods. Harvested panels have relatively small
data sets due to the difficulties in procuring them, which is detailed below.
Panel Test Series
The first phase of testing is conducted on both laboratory fabricated panels and harvested
panels, which is summarized in Figure 4-1. Testing was conducted to evaluate the developed
test method (UF-WRSUT) and the effect of aging on panel uplift capacity. The second phase of
testing is also conducted on both laboratory fabricated panels and harvested panels, which is
summarized in Figure 4-2. Testing was conducted to evaluate the effect of dynamic loading on
panel uplift capacity.
57

Laboratory Fabricated Panels (New)
Test panel specimens were fabricated using a 4 ft by 8 ft by ½ in. thick oriented strand
board (OSB) sheathing fastened to 2 in. by 4 in. nominal dimensions southern yellow pine (SYP)
framing members spaced 24 in. apart. The framing members were at least 4 ft-6 in. long in order
to span the short dimension of the pressure chamber, see Figure 4-3. Nails were installed using a
air compressor driven nail-gun, Stanley Bostitch Model FL21P. The air pressure was set at 70
psi to 80 psi and adjusted periodically to avoid over-driving the nails.
In the static phase of testing panels were constructed with three nail sizes; a) smooth shank
0.131 in. diameter 2-1/2 in. long nail (8d smooth shank nail) b) annularly threaded 0.113 in.
diameter 2-1/2 in. long nail (8d ring shank nail) and c) smooth shank 0.113 in. diameter 2-3/8 in.
long nail (2-3/8 in. 6d smooth shank nail). The 8d smooth shank and 8d ring shank nails were
installed in three fastener schedules 6 in. / 12 in., 6 in. / 8 in., and 6 in. / 6 in. with approximately
15 replications in each set. The 2-3/8 in. 6d smooth shank nails were installed at 6 in. / 12 in.
only with 15 replications, see Figure 4-4. To evaluate the structural benefit of retrofitting
existing panels two arrangements of closed cell spray applied polyurethane foam (ccSPF)
adhesive were tested. The ccSPF was installed on panels originally constructed with 8d ring
shank nails spaced at 6 in. / 12 in. The panels were installed with (1) a fillet of ccSPF along each
side of framing member to sheathing interface (see Figure 4-5 a) and (2) a full 3 in. thick layer of
ccSPF filling each space between framing members (see Figure 4-5 b). A series of control
panels were also tested with the same materials to provide a direct comparison, see Table 4-1 for
a summary of panel series.
In the static vs. dynamic phase of testing laboratory fabricated panels were constructed
with one nail type attached with two fastening schedules and one retrofit method. Hot dipped
galvanized 2 in. 6d (0.113 in. diameter) smooth shank nails were used to match dimension of the
58

nails found in harvested panels. Two fastening schedules were used 6 in./12 in. and 6 in. /6 in.
with 10 replications each, where half were tested statically and the other half were tested
dynamically (Table 4-1). A 2 mils. thick plastic sheet was inserted between the wood stud and
OSB sheet during fabrication to allow samples to be tested with positive chamber pressure
(Figure 4-6), discussed below in installation of panel section. To evaluate the effect of dynamic
loading on retrofitted panels four additional panels were constructed with the 2 in. 6d common
nails at 6 in. /12 in., then installed with 8d ring shank nails between the 6d smooth shank nails.
Harvested Panels (Aged)
To evaluate the effect of in-service conditions on wind uplift resistance of residential
structures panels were harvested from existing homes. Panels were removed from thirteen
existing residential wood roof structures located in four communities throughout Central Florida,
see Figure 4-7 for locations of structures. A total of 48 panels were harvested from 2006 thru
2009. Testing is broken into two groups the first conducted statically to evaluate the effect of
age and two retrofit measures. The second test group is tested statically vs. dynamically in order
to evaluate the effect of dynamic loading on roof sheathing wind uplift capacity. Panel
attachment varies significant, in fastener type or spacing, resulting in limited sample sizes and
relatively few direct comparisons to laboratory fabricated samples. In order to obtain panels
researchers must wait for homes purchased by local or state governments to be made available
before demolition. This is a slow process and results in researches getting what is available,
which is rarely the ideal sample. Additionally the process of removing panels prohibits large
numbers of panels to be removed from a single roof.
To access panels shingles are removed from the necessary section of roof. Panels are
removed by cutting the sheathing around the sample panel with a circular-saw to expose framing
members (Figure 4-8 a). This prevents any adjacent panel to be used as a sample panel therefore
59

keeping the number of panels removed from a single roof small, see Figure 4-8 c. The sample
panel is then removed from the roof structure by cutting the exposed framing (Figure 4-8 b).
Care is taken to brace the panel only on the sheathing during removal to prevent damage to
fastener connections. The panel is then lowered to ground level to remove any additional truss
members connected with metal plates, while only holding the sheathing. Metal truss plates are
cut with a grinder while bracing the framing member to protect the fastener connections. Panels
are braced only by the sheathing during transportation to prevent racking of the framing.
All harvested panels tested in the first group (38) to evaluate the effect of in-service
conditions on wood roof sheathing wind uplift resistance consisted of 4 ft by 8 ft by ½ in. thick
plywood sheathing. Sheathing is attached to 2 in. by 4 in. wood truss or rafter members spaced
24 in. apart with 1.5 in. staples, 2.5 in. staples, 2.5 in. long 0.131 in. diameter (8d) smooth shank
nails and 2 in. long 0.113 in. diameter (6d) smooth shank nails at various spacing ranging from 4
in. / 4 in. to 6 in. / 12 in. detailed in Table 4-2. Panels were harvested from twelve homes located
in three cities in Central Florida (Port Orange, Crystal City and Bartow) and ranged in age from
29 to 33 years. Twenty five harvested of the panels were tested in their existing configuration
and thirteen panels were retrofitted. Retrofitting of panels was performed to simulate the
economical strengthening of existing roof sheathing. Panels were retrofitted using one of two
methods; a) twelve were retrofitted using 8d-ring shank nails installed at a 6 in. / 12 in. spacing
which can be performed when a roof covering is replaced (retrofit A-1, see Figure 4-9), and b)
one panel was retrofitted using a 3 in. thick layer of closed-cell spray-applied polyurethane foam
(ccSPF) which can be installed through the attic at any time (Figure 4-10).
Ten panels were harvested from the same home in order to evaluate the effect of dynamic
loading on wind uplift resistance of wood roof sheathing. Construction of panels are 4 ft by 8 ft
60

by 7/16 in. thick OSB attached to 2 in. by 4 in. framing members spaced 24 in. apart. Sheathing
was fastened with 1-1/2 in. long 14 gauge staples spaced at 4 in. interior and exterior. Six panels
were tested in existing conditions, two statically and four dynamically. The remaining four
panels, two static and two dynamic, were retrofitted with 8d ring shank nails spaced between a 6
in. / 12 in. fastening schedule (retrofit A-2, see Figure 4-9) to correspond to static vs. dynamic
testing of laboratory fabricated panels. Table 4-2 summarizes the test series.
Specific Gravity and Moisture Content Measurements
Specific gravity and moisture content of wood members are identified in Chapter 2 as
parameters effecting the wind uplift resistance of wood roof sheathing. Therefore specific
gravity measurements were taken for all static vs. dynamic testing to evaluate their effect on
uplift resistance. Moisture content measurements were taken only for sample harvested from
existing structures. Each reported framing member specific gravity or moisture content is the
average of three samples, but methods for collecting samples were different between laboratory
fabricated panels and harvested panels.
Oven dry specific gravity measurements were determined for framing members following
procedures outlined in ASTM D 2395 (2006b), Method A. The equation for specific gravity
presented in Method A (#2) is
LwtMKWSG
⎟⎟⎠
⎞⎜⎜⎝
⎛⎟⎠⎞
⎜⎝⎛+
=
1001
(
which
4.1)
calculates the “green” specific gravity or in other words the specific gravity relative to the
moisture content at the time of testing. It was that the definition used in the wood design manual
NDS (AF&PA 2005) would be selected, which specifies the oven dry specific gravity. The term
61

⎟⎟⎠
⎞⎜⎜⎝
⎛⎟⎠⎞
⎜⎝⎛+100
1 MW (
is defi
4.2)
ned as the calculated oven-dry weight of specimen based on moisture content
t of testing measurements. Due to the selection of oven dry specific gravity as the primary resul
the oven-dry weight was directly measured. The resulting equation is
LwtKWSG =
(4.3)
where K = 27.68 t =
ss (in.). The oven used for drying is a 3488M Model Lab-line Instruments convection
thod B was selected due
to its ted
ared and allowed to dry for 2-3 weeks. Each 10 ft board was cut
to ma
t
unit conversion, W = dry weight (lbs), L = length (in.), w = width (in.), and
thickne
oven. Vernier calipers were used to measure the specimen volume and an Omega WSB – 8150
scale with a maximum capacity of 15 Kg was used to measure mass.
Moisture content measurements were conducted on harvested static vs. dynamic tested
samples per ASTM D4442 Method B secondary oven dry method. Me
similarity to the specific gravity method used, therefore samples were simultaneously tes
for specific gravity and moisture content. The precision of measurements is assumed to be the
nearest whole percent because precision and bias calculations (section 5) were not made.
Additionally endpoint measurements were not used because the drying time specified in the
specific gravity was followed.
Framing members of panels fabricated in the laboratory are constructed with ten foot
boards purchased together, prep
ke 2 framing members. Three samples were collected from each ten foot board, one on
either end and one in the middle (Figure 4-11), and used to determine the specific gravity of both
framing members cut from the ten foot board. ASTM D2395 specifies that specimens be cut a
62
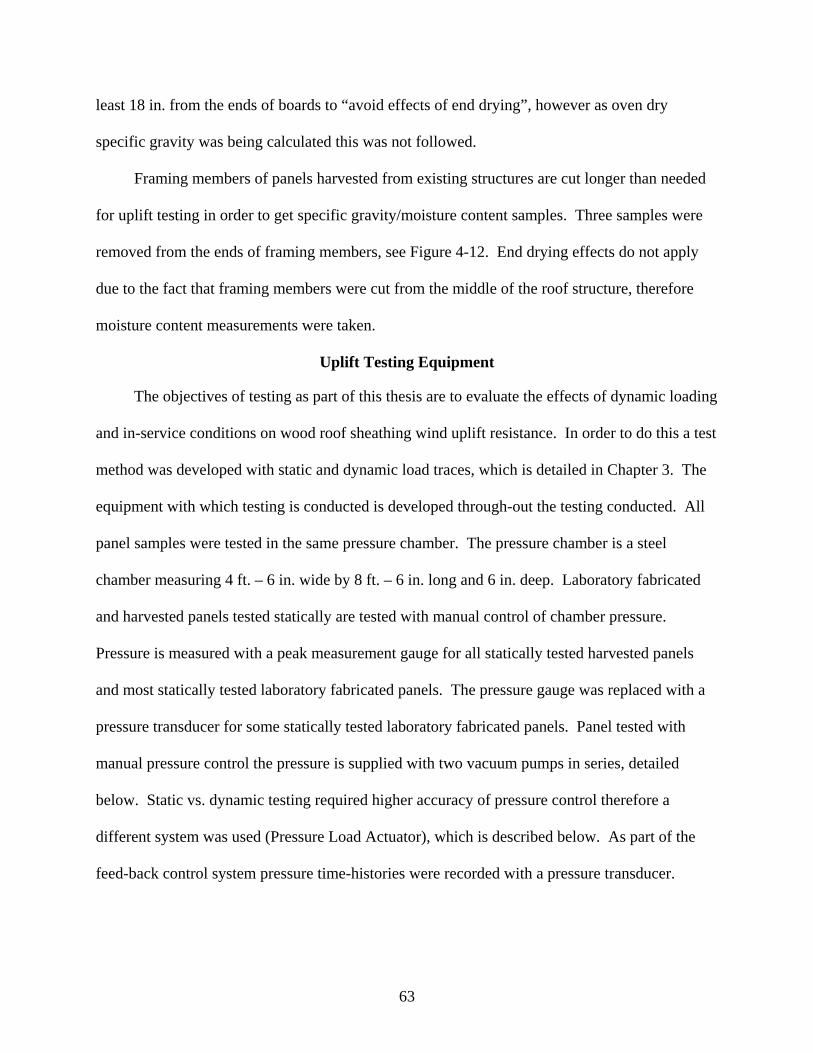
least 18 in. from the ends of boards to “avoid effects of end drying”, however as oven dry
specific gravity was being calculated this was not followed.
Framing members of panels harvested from existing structures are cut longer than ne
for uplift testing in order to get specific gravity/moisture con
eded
tent samples. Three samples were
remov
thesis are to evaluate the effects of dynamic loading
and in-service conditions on wood istance. In order to do this a test
metho
ith a
e
ed from the ends of framing members, see Figure 4-12. End drying effects do not apply
due to the fact that framing members were cut from the middle of the roof structure, therefore
moisture content measurements were taken.
Uplift Testing Equipment
The objectives of testing as part of this
roof sheathing wind uplift res
d was developed with static and dynamic load traces, which is detailed in Chapter 3. The
equipment with which testing is conducted is developed through-out the testing conducted. All
panel samples were tested in the same pressure chamber. The pressure chamber is a steel
chamber measuring 4 ft. – 6 in. wide by 8 ft. – 6 in. long and 6 in. deep. Laboratory fabricated
and harvested panels tested statically are tested with manual control of chamber pressure.
Pressure is measured with a peak measurement gauge for all statically tested harvested panels
and most statically tested laboratory fabricated panels. The pressure gauge was replaced w
pressure transducer for some statically tested laboratory fabricated panels. Panel tested with
manual pressure control the pressure is supplied with two vacuum pumps in series, detailed
below. Static vs. dynamic testing required higher accuracy of pressure control therefore a
different system was used (Pressure Load Actuator), which is described below. As part of th
feed-back control system pressure time-histories were recorded with a pressure transducer.
63

Panel Installation
Pressure is applied in one of two different methods, either negative or positive applied
pressure depending on whether the specimen was lab built or harvested from an existing house.
In both arrangements an uplift load is applied to the panel.
The negative pressure arrangement was used for all panels tested statically and harvested
panels tested statically vs. dynamically. Panels are placed on top of the chamber then covered
with 2 mil plastic leaving extra folds at framing to allow continuous contact of plastic and
sheathing. Duct tape is used to seal plastic to chamber, see Figure 4-12. Then a shop-vac is used
to remove the excess air in system, which can affect pressure control. After loading is completed
the panel is removed from chamber and inspected for fastener failure type and location.
Laboratory fabricated panels tested statically vs. dynamically are tested in the positive
pressure arrangement. Panels tested with positive pressure are constructed with plastic between
the sheathing and framing. Panels are placed inside the chamber sheathing up to restrain the
panel. Shims and wood blocking are then used to restrain the panel from movement during
loading. Finally a steel frame is placed over the plastic and clamped tight, see Figure 4-13.
After loading, the panel is removed from the chamber and inspected for fastener failure type and
location.
Manual Control
Laboratory fabricated and harvested panels tested statically were controlled manually.
Pressure was supplied with two 15 CFM US Vacuum pumps (model CP15) connected in series
with PVC tubing to the pressure chamber supply pressure, see Figure 4-14. Pressure is
controlled manually with a gate valve (Figure 4-14 a) which is closed to reduce the chamber
pressure. Pressure measurements were initially recorded with an Omega DPG8000 general
64

purpose digital peak load measurement pressure gauge, later pressure measured with an Omega,
Model # PX243A-2.5BG5V pressure transducer.
Pressure Load Actuator
Static vs. dynamic testing requires a more accurate system to control chamber pressure.
The accurate development and repeatability of the dynamic pressure trace was only possible
because of the unique capabilities of the test apparatus used. The Pressure Loading Actuator
(PLA) system utilizes a 12 hp regenerative blower and computer-controlled feedback loop to
actuate a 3 port valve with 5 arrangements, see Figure 4-15. The active valve control system and
blower enable highly responsive control of chamber pressure resulting in a chamber pressure that
closely follows the large amplitude pressure fluctuations and 10 Hz response of the simulated
dynamic wind pressure. The PLA system was developed by Cambridge Consultants for the
University of Western Ontario to investigate wind loading of full scale structures. Development
of the PLA system can be found in Kemp (2008). The system was designed to provide pressure
loading to boxes (chambers) ranging from 1 to 64 ft2, which are placed on a structure allowing
spatially varying dynamic pressure loading of an entire structure. This ongoing study is detailed
in Bartlett et al. (2007). The PLA system enabled accurate repeatable dynamic pressure loading
of wood roof sheathing panels, see Figure 4-16.
65

Static Testing (171)
Lab‐Built (133) Harvested (38)
Existing (103)
• 6d SS @ 6/12 (15)• 8d SS @ 6/12 (15)• 8d SS @ 6/8 (15)• 8d SS @ 6/6 (15)• 8d RS @ 6/12 (15)• 8d RS @ 6/8 (15)• 8d RS @ 6/6 (13)
Retrofit (30)
• 8d RS @ 6/12 (10)• ccSPF fillet (10)• ccSPF full 3”(10)
Existing (25)
• 1.5” S @ 3/6 (4)• 2.5” S @ 3/6 (2)• 2.5” S @ 6/12 (2)• 8d SS @ 6/12 (2)• 6d SS @ 6/12 (10)• 6d SS @ 8/8 (2)• 6d SS @ 3/6 (2)• 6d SS @ 4/4 (1)
Retrofit (13)
• 8d RS @ 6/12 (12)• ccSPF full 3” (1)
Figure 4-1. Summary of panel series tested in the static phase of this study
Static vs. Dynamic Testing (34)
Lab‐Built (24) Harvested (10)
Existing (20)
• 6d SS @ 6/12• 6d SS @ 6/6
Retrofit (4)
• 8d RS @ 6/12
Existing (6)
• 1.5” Staple @ 4/4
Retrofit (4)
• 8d RS @ 6/12
Static(5)(5)
Dynamic(5)(5)
Static(2)
Dynamic(2)
Static(2)
Dynamic(4)
Static(2)
Dynamic(2)
Figure 4-2. Summary of panel series tested in the static vs. dynamic phase of this study
66
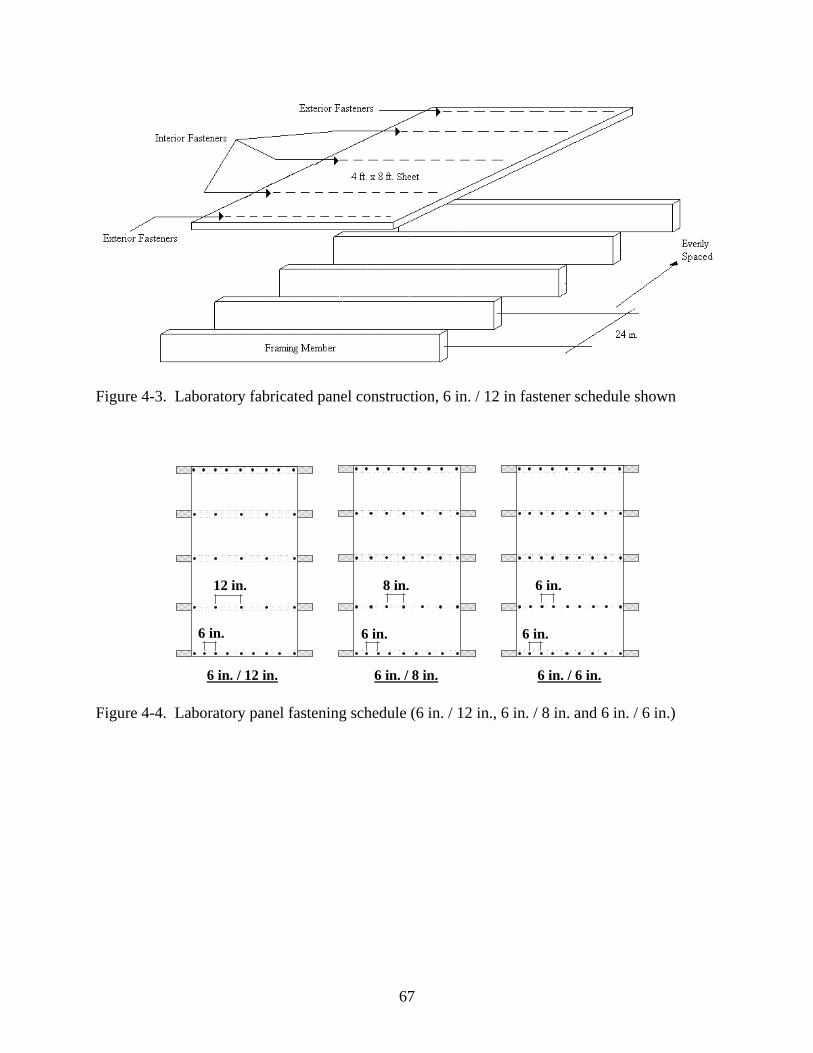
Figure 4-3. Laboratory fabricated panel construction, 6 in. / 12 in fastener schedule shown
6 in. / 12 in. 6 in. / 8 in. 6 in. / 6 in.
6 in.
12 in.
6 in. 6 in.
8 in. 6 in.
Figure 4-4. Laboratory panel fastening schedule (6 in. / 12 in., 6 in. / 8 in. and 6 in. / 6 in.)
67

A
B
Figure 4-5. Static ccSPF retrofit construction of A) fillet sample set and B) full 3 in. sample set
Figure 4-6. Panel construction for static vs. dynamic testing with 2 mils. thick plastic sheet placed between sheathing and wood framing member during fabrication
68

Table 4-1. Laboratory fabricated (New) panel series tested, constructed with ½ in. OSB and 2 in. by 4 in. southern yellow pine # 2 or better
Fastener Spacing # of Panels
Static Panel Series
2-3/8 in. 6d smooth shank nail 6 in. / 12 in. 15 2-1/2 in. 8d smooth shank nail 6 in. / 12 in. 15
2-1/2 in. 8d smooth shank nail 6 in. / 8 in. 15
2-1/2 in. 8d smooth shank nail 6 in. / 8 in. 15
2-1/2 in. 8d ring shank nail 6 in. / 12 in. 15
2-1/2 in. 8d ring shank nail 6 in. / 8 in. 15
2-1/2 in. 8d ring shank nail 6 in. / 6 in. 13
2-1/2 in. 8d ring shank nail 6 in. / 12 in. 10
2-1/2 in. 8d ring shank nail, with Ret. B-1 6 in. / 12 in. 10
2-1/2 in. 8d ring shank nail, with Ret. B-2 6 in. / 12 in. 10
Static vs. Dynamic Panel Series
2 in. 6d smooth shank nail 6 in. / 12 in. 10 2 in. 6d smooth shank nail 6 in. / 6 in. 10
2 in. 6d smooth shank nail, with Ret. A-2 6 in. / 12 in. 10
69

Table 4-2. Harvested panel series tested
Source Age (years) Existing Retrofit # of Panels # of Panels Retrofit Method
Static Tested Panel Series 1.5 in. staple @ 3 in. / 6 in. spacing Port Orange #1 - 4 2 A-1 2.5 in. staple @ 3 in. / 6 in. spacing Bartow #1 - 2 - - Bartow #2 - 2 2 A-1 2.5 in. smooth shank nail @ 6 in. / 12 in. spacing Crystal River #1 36 2 2 A-1 2 in. smooth shank nail @ 6 in. / 12 in. spacing Port Orange #2 29 3 1 B-2 Bartow #3 33 2 2 A-1 Port Orange #3 - 2 1 A-1 Port Orange #4 - 2 - - 2 in. smooth shank nail @ 8 in. / 8 in. spacing Port Orange #5 - 2 - - 2 in. smooth shank nail @ 3 in. / 6 in. spacing Bartow #4 - 1 2 A-1 Port Orange #6 - 2 - - 2 in. smooth shank nail @ 4 in. / 4 in. spacing Bartow #5 33 1 1 A-1
Static vs. Dynamic Tested Panel Series 1.5 in. staple @ 4 in. / 4 in. spacing Debary #1 15 6 4 A-2 Notes: Retrofit Method A-1. 8d ring shank nail @ 6 in. / 12 in. spacing Retrofit Method A-2. 8d ring shank nail between 6 in. / 12 in. spacing Retrofit Method B-2. 3 in. thick layer of spray applied polyurethane adhesive
70

Figure 4-7. Locations of residential structures where panels were harvested
A
B
C
Figure 4-8. Pictures of harvested panel removal, A) Expose framing members, B) Cut framing
members and C) Roof after panels removed
71

6 in.6 in.
12 in.12 in.
Retrofit A-1 Retrofit A-2
Existing Retrofit
Figure 4-9. Comparison of retrofit measures A-1 and A-2
Figure 4-10. ccSPF retrofit of an existing residential structure in Port Orange, FL
72

Table 4-2. Summary of harvested panels tested statically and statically vs. dynamically
Sheathing Attachment Method House Address Existing Retrofit
# of Panels # of Panels Retrofit Method
Statically vs. Dynamically Tested Panels, constructed with 7/16 in. OSB 1.5 in. staple @ 4 in. / 4 in. Debary #1 6 4 A-2
Statically Tested Panels, constructed with ½ in. Plywood 1.5 in. staple @ 3 in. / 6 in. Port Orange #1 4 2 A-1 2.5 in. staple @ 3 in. / 6 in. Bartow #1 2 NA NA 2.5 in. staple @ 6 in. / 12 in. Bartow #2 2 2 A-1 2.5 in. smooth shank nail @ 6 in. / 12 in. Crystal River #1 2 2 A-1 2 in. smooth shank nail @ 6 in. / 12 in. Port Orange #2 3 1 B-2 2 in. smooth shank nail @ 6 in. / 12 in. Bartow #3 2 2 A-1 2 in. smooth shank nail @ 6 in. / 12 in. Port Orange #3 2 1 A-1 2 in. smooth shank nail @ 6 in. / 12 in. Bartow #4 1 2 A-1 2 in. smooth shank nail @ 4 in. / 4 in. Bartow #5 1 1 A-1 2 in. smooth shank nail @ 3 in. / 6 in. Port Orange #6 2 NA NA 2 in. smooth shank nail @ 8 in. / 8 in. Port Orange #5 2 NA NA 2 in. smooth shank nail @ 6 in. / 12 in. Port Orange #4 2 NA NA Notes: Retrofit A-1 is 8d ring shank nails installed at 6 in. / 12 in. spacing, Retrofit A-2 is 8d ring shank nails installed between a 6 in. / 12 in. spacing, and Retrofit B-2 is ccSPF installed in a full 3 in. thick layer
Figure 4-11. Laboratory fabricated panel specific gravity sample locations
73
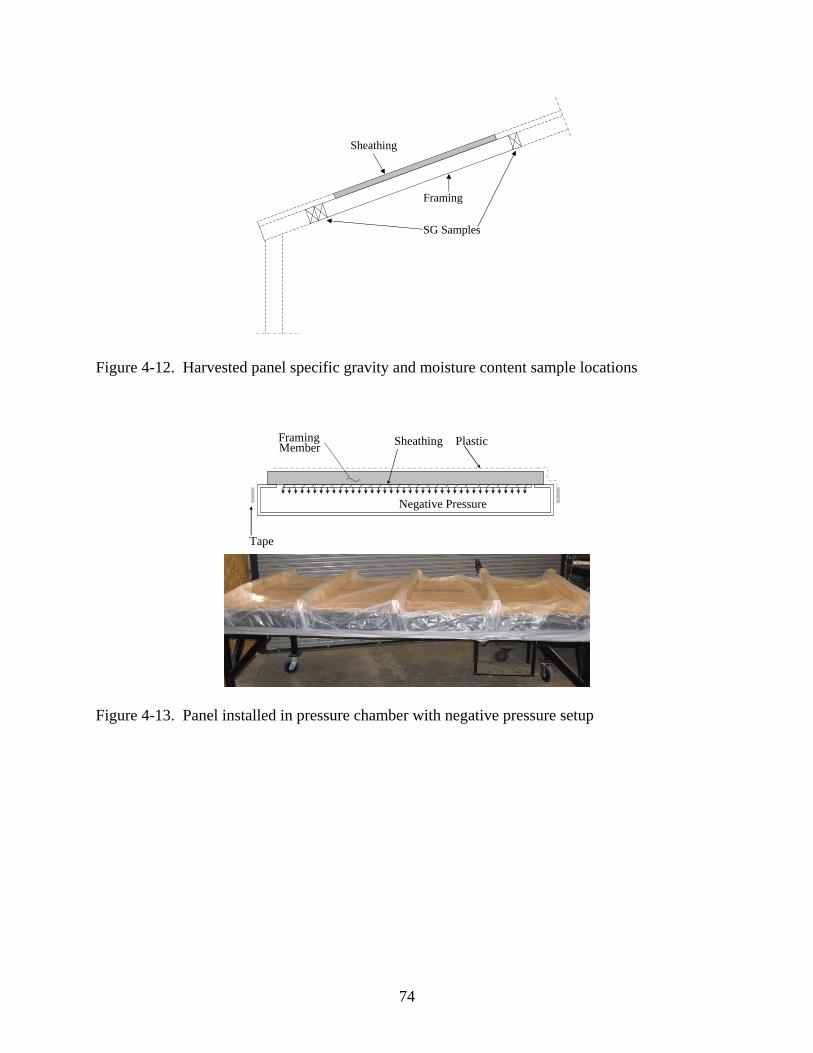
Framing
SG Samples
Sheathing
Figure 4-12. Harvested panel specific gravity and moisture content sample locations
SheathingMemberFraming Plastic
Negative Pressure
Tape
Figure 4-13. Panel installed in pressure chamber with negative pressure setup
74

C-ClampSteel Frame &Gasket Sheathing
Wood Blocking Framing Member
ShimPlastic
Positive Pressure
Figure 4-14. Panel installed in pressure chamber with positive pressure setup
A
B
Figure 4-15. Manual control of pressure chamber (A gate valve control and (B vacuum pump in
series
75

76
Figure 4-16. Pressure Load Actuator (PLA)
Figure 4-17. Comparison of dynamic target vs. actual chamber pressure used with the PLA
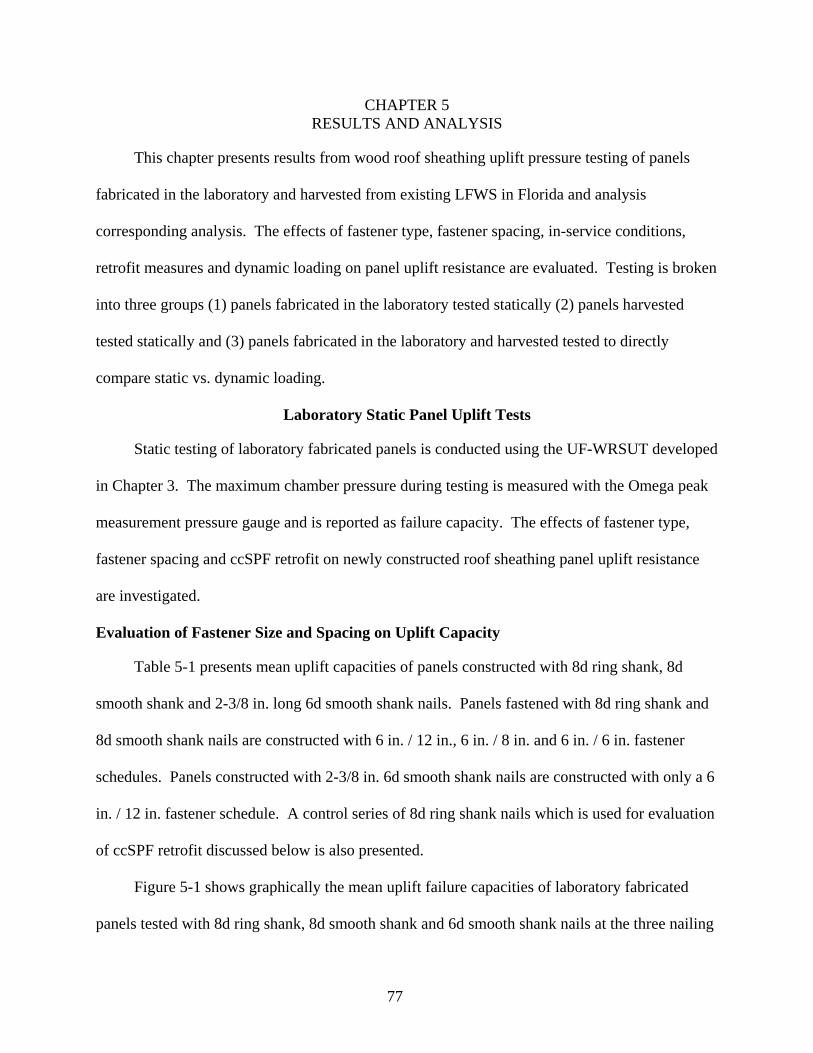
CHAPTER 5 RESULTS AND ANALYSIS
This chapter presents results from wood roof sheathing uplift pressure testing of panels
fabricated in the laboratory and harvested from existing LFWS in Florida and analysis
corresponding analysis. The effects of fastener type, fastener spacing, in-service conditions,
retrofit measures and dynamic loading on panel uplift resistance are evaluated. Testing is broken
into three groups (1) panels fabricated in the laboratory tested statically (2) panels harvested
tested statically and (3) panels fabricated in the laboratory and harvested tested to directly
compare static vs. dynamic loading.
Laboratory Static Panel Uplift Tests
Static testing of laboratory fabricated panels is conducted using the UF-WRSUT developed
in Chapter 3. The maximum chamber pressure during testing is measured with the Omega peak
measurement pressure gauge and is reported as failure capacity. The effects of fastener type,
fastener spacing and ccSPF retrofit on newly constructed roof sheathing panel uplift resistance
are investigated.
Evaluation of Fastener Size and Spacing on Uplift Capacity
Table 5-1 presents mean uplift capacities of panels constructed with 8d ring shank, 8d
smooth shank and 2-3/8 in. long 6d smooth shank nails. Panels fastened with 8d ring shank and
8d smooth shank nails are constructed with 6 in. / 12 in., 6 in. / 8 in. and 6 in. / 6 in. fastener
schedules. Panels constructed with 2-3/8 in. 6d smooth shank nails are constructed with only a 6
in. / 12 in. fastener schedule. A control series of 8d ring shank nails which is used for evaluation
of ccSPF retrofit discussed below is also presented.
Figure 5-1 shows graphically the mean uplift failure capacities of laboratory fabricated
panels tested with 8d ring shank, 8d smooth shank and 6d smooth shank nails at the three nailing
77

schedules used. It is seen that as interior fastener spacing decreases the mean uplift capacity
increases. Panels fastened with 8d ring shank nails increase 45% to 57% in mean uplift strength
(174/161 to 252 psf) from 6 in. / 12 in. to 6 in. / 6 in. fastening schedules. Panels fastened with
8d smooth shank nails increased 59% in mean uplift strength (129 psf to 205 psf) from 6 in. / 12
in. to 6 in. / 6 in. fastening schedules. Additionally it is found that this relationship between
uplift capacity and fastener spacing appears to be linear for panels attached with 8d ring shank or
smooth shank nails. The slopes for 8d ring shank and 8d smooth shank are 13.6 psf/in. and 12.5
psf/in. respectively suggesting that the relationship between fastener spacing and uplift capacity
is independent of fastener type.
Ring shank nails are found to have higher uplift strength than smooth shank nails. Results
show a 27% mean increase in strength from 8d smooth shank to 8d ring shank. Additionally it is
found that 8d smooth shank nails have a higher uplift capacity than 2-3/8 in. 6d smooth shank
nails. Only the 6 in. / 12 in. fastener schedule was tested for 2-3/8 in. long 6d common nails so
no conclusive trends can be found; however it was found that uplift strength is increased 74%
from 6d smooth shank nails to 8d smooth shank nails.
Failure pressure results of laboratory fabricated panel tested statically provide a control
series which can be used for comparative purposes. In the following section results are
compared to
• Previous studies for assessment of developed test method, • Design fastener withdrawal strengths for evaluation of design assumptions, • ccSPF attached panel for evaluation of strength benefits of ccSPF, • Harvested panels for evaluation of in-service effects, • Retrofitted harvested panels to evaluate strength benefits, • Dynamically tested panels to determine the effects of dynamic loading.
78

Comparison of Results with Previous Studies
Results from static UF-WRSUT are compared with results identified in Chapter 2 in order
to assess the relative performance of the developed test method with previous methods. Due to
difficulties in making direct comparisons previously discussed in Chapter 2 results presented in
Table 5-1 are compared to ranges of similar construction presented in literature review. Previous
studies mean and 5% exclusion failure pressures with sufficient numbers of samples are
compared to results.
Panel results from previous studies constructed with 6d smooth shank fasteners attached at
6 in. / 12 in. yielded mean failure pressures ranging from 26 psf to 55 psf, which is lower than
static UF-WRSUT results having a mean failure pressure of 74 psf. Panel results from previous
studies constructed with 8d smooth shank fasteners attached at 6 in. / 12 in. and 6 in. / 6 in. had
ranges of mean failure pressures of 61 psf to 228 psf and 77 psf to 218 psf respectively. Static
UF-WRSUT results of panels fastened with 8d smooth shank nails at 6 in. / 12 in. yielded a
mean failure pressure of 129 psf and panels attached at 6 in. / 6 in. had a mean failure pressure of
205 psf; both of which fall within the corresponding ranges found from literature. Panels
constructed with 8d ring shank fasteners had only one data set for each spacing of 6 in. / 12 in.
and 6 in. / 6 in. Results from previous testing of panels constructed with 8d ring shank nails at 6
in. / 12 in. had a mean failure pressure of 140 psf, and the one panel fastened with 8d ring shank
nails at 6 in. / 6 in. had a failure pressure of 397 psf. Panels constructed with 8d ring shank nails
tested per UF-WRSUT for 6 in . / 12 in. and 6 in. / 6 in. fastener schedules resulted in mean
failure pressures of 174 psf and 252 psf, which are lower than results from previous testing.
Table 5-2 presents a comparison of the mean and 5% exclusion failure pressures of
laboratory fabricated static UF-WRSUT results and results of previous studies which had a
sufficiently large sample size. Sample sizes from statically tested laboratory fabricated panels as
79

part of this study were 13 to 15 panels and for comparative purposes previous studies selected
had similar or larger sample sizes; details of selected studies can be found in Chapter 2. The 5%
exclusion failure pressure is presented to give a comparison of the variability in results. A
statistical analysis of laboratory fabricated static UF-WRSUT found that all data sets fit a normal
distribution at the 0.05 confidence level using an Anderson-Darin test. Using the normal
cumulative distribution function the 5% value was calculated for results from static UF-WRSUT
and all previous studies selected had normal distributions.
Static UF-WRSUT results from panels installed with 6d smooth shank fasteners at 6 in. /
12 in. are significantly higher than results from Kallem (1997), which had 14 samples, for both
mean and 5% exclusion failure pressures. Panels attached with 8d smooth shank fasteners at 6
in. / 12 in. UF-WRSUT mean failure pressure result is within 18% of a 49 panel data set by
IHRC (IHRC 2004) of similar construction. Statically tested UF-WRSUT panels attached with
8d smooth shank fastener spaced at 6 in. / 6 in. (205 psf mean and 170 psf 5% exclusion) are
significantly higher than a 30 panel data set (131 psf mean and 101 psf 5% exclusion) of similar
construction by Murphy et al. (1996). Statically tested UF-WRSUT panels attached with 8d ring
shank fastener spaced at 6 in. / 12 in. (174 psf mean and 137 psf 5% exclusion) are significantly
higher than a 50 panel data set (140 psf mean and 101 psf 5% exclusion) of similar construction
by IHRC (IHRC 2004).
Results presented in Tables 5-1 and 5-2 show that laboratory fabricated panels tested with
static UF-WRSUT yield failure pressures which in the same range as previous results
considering that direct comparisons cannot be made. First, UF-WRSUT results are both above
and below results from previous studies. Second, results from previous studies vary by the same
magnitude between each other as they do to UF-WRSUT results. Third, the coefficients of
80

variation for static UF-WRSUT results (7% to 22%) are similar to previous testing (7% to 28%).
Finally, while it is found that while difference in mean failure pressures can vary significantly
the closest match with previous studies are from datasets as large or larger than those tested with
UF-WRSUT. Given that result are comparable to previous studies, which wood roof sheathing
panel design is based on, UF-WRSUT results can be compared with design values.
Evaluation of Calculated Fastener Resistance
Table 5-3 presents mean fastener failure loads calculated based on the assumption of
tributary area for laboratory fabricated panels tested statically, where the maximum tributary area
of fasteners installed in the panel is used. Panel failure pressure are dived by a factor of safety of
2.0 for design pressure then multiplied by the maximum tributary area to obtain calculated
withdrawal strengths. Resulting failure loads are compared to design withdrawal strength based
on NDS strengths (Table 11.2C) (AF&PA 2005). Withdrawal strengths from the NDS are
multiplied by the built in factor of safety (5) and depth of penetration for each fastener, which is
2 in. for 8d smooth shank or ring shank nails and 1.875 in. for 2-3/8 in. 6d smooth shank nails.
For example, 8d smooth shank fasteners have a design withdrawal value of 41 (lbs/in.) and a
depth of penetration of 2 in. when installed through ½ in. OSB, is
lbsSFininlbs 410)(5.)(2
.41 =××⎟
⎠⎞
⎜⎝⎛ (5-1)
Figure 5-2 summarizes the effect of fastener spacing on mean panel failure pressure vs.
mean fastener failure load. Calculated fastener failure load results show that as nail spacing is
reduced mean withdrawal loads decrease, for both the 8d ring shank and smooth shank nails. It
is observed that failure loads for the 8d ring shank nail decreased from 175 lbs to 126 lbs as the
interior fastener spacing reduced from 12 in. to 6 in. o.c. Similarly nail failure loads decreased
from 130 lbs to 103 lbs for 8d common nail as fastening spacing decreased from 12 in. to 6 in.
81
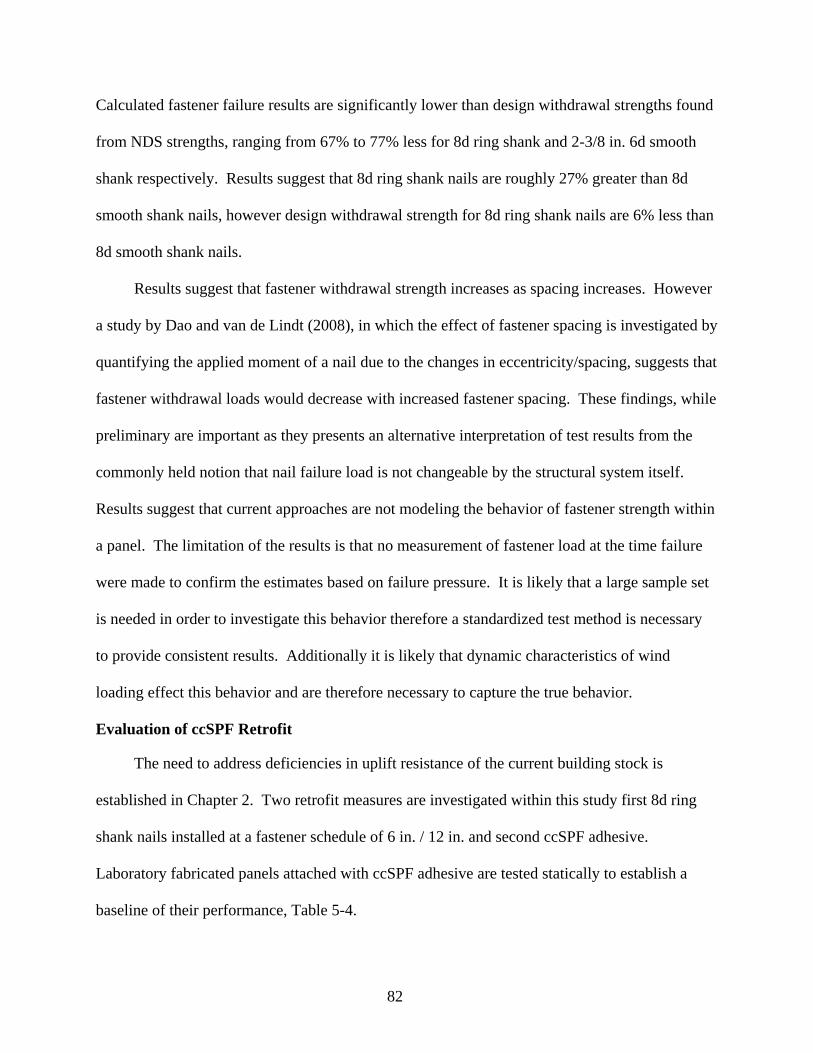
Calculated fastener failure results are significantly lower than design withdrawal strengths found
from NDS strengths, ranging from 67% to 77% less for 8d ring shank and 2-3/8 in. 6d smooth
shank respectively. Results suggest that 8d ring shank nails are roughly 27% greater than 8d
smooth shank nails, however design withdrawal strength for 8d ring shank nails are 6% less than
8d smooth shank nails.
Results suggest that fastener withdrawal strength increases as spacing increases. However
a study by Dao and van de Lindt (2008), in which the effect of fastener spacing is investigated by
quantifying the applied moment of a nail due to the changes in eccentricity/spacing, suggests that
fastener withdrawal loads would decrease with increased fastener spacing. These findings, while
preliminary are important as they presents an alternative interpretation of test results from the
commonly held notion that nail failure load is not changeable by the structural system itself.
Results suggest that current approaches are not modeling the behavior of fastener strength within
a panel. The limitation of the results is that no measurement of fastener load at the time failure
were made to confirm the estimates based on failure pressure. It is likely that a large sample set
is needed in order to investigate this behavior therefore a standardized test method is necessary
to provide consistent results. Additionally it is likely that dynamic characteristics of wind
loading effect this behavior and are therefore necessary to capture the true behavior.
Evaluation of ccSPF Retrofit
The need to address deficiencies in uplift resistance of the current building stock is
established in Chapter 2. Two retrofit measures are investigated within this study first 8d ring
shank nails installed at a fastener schedule of 6 in. / 12 in. and second ccSPF adhesive.
Laboratory fabricated panels attached with ccSPF adhesive are tested statically to establish a
baseline of their performance, Table 5-4.
82

The mean uplift capacity of panels connected with 8d ring shank nail at 6 in. / 12 in. was
161 psf with a coefficient of variation of 18%, which compares well with results presented in
Table 5-1. This mean uplift capacity is increased to 202 psf when a fillet of ccSPF (ret. B-1) is
applied resulting in a 25% increase capacity. When ccSPF was applied in a full 3 in. thick layer
(ret. B-2) the increased effect was negligible with the mean uplift capacity increasing to 209 psf.
Results suggest that from the standpoint of improving structural strength there is little
added benefit from the fillet to full coverage of ccSPF. Results provide a baseline for
comparison with,
• Harvested panels retrofitted ccSPF to determine the effects of adhesion with aged panels,
• New and harvested panels retrofitted with 8d ring shank nails to compare the strength benefits.
Failure Mechanisms Observed
As detailed in Chapter 2 the uplift design of wood roof sheathing is based on the
withdrawal strength of the individual fasteners. In order to assess the validity of this assumption
that fastener connecting wood roof sheathing to framing fail in withdrawal panels were examined
after testing for failure mode and location of all failures. Figure 5-3 presents a sample of the
failure mode and location information of 8d smooth shank and ring shank nails at 6 in. / 6 in.,
which is collected for all laboratory fabricated panel tested statically. The framing members
attached to the 4 ft. by 8 ft. sheathing is represented by the lines, on-top of which a shape
corresponding to a particular failure mode is placed on each fastener that failed. Observations
were made after panel was removed from the chamber. Full results are found in Appendix B.
The dominant failure mode of laboratory fabricated panels tested with the static UF-
WRSUT is presented in Figure 5-4. It is found that failure of OSB panels fastened with smooth
shank nail tend to be dominated by the withdrawal failure mode. Alternatively it is found that
83

panels attached with ring shank nails tend to be dominated by the pull-through failure mode.
Additionally it is seen that as fastener spacing decreases pull-through failure mode becomes
more dominant, however the effect of spacing is less significant than fastener type. The addition
of ccSPF as a retrofit measure is seen to cause a more even distribution of panel failure modes.
Results will provide a basis for comparison of behavior of fasteners during failure.
Comparisons of failure behavior will be made for new and harvested panels attached with
different fasteners tested statically vs. dynamically.
Harvested Static Panel Uplift Test
Static testing of panels harvested from 12 homes throughout Central Florida was
conducted using the UF-WRSUT developed in Chapter 3. The maximum chamber pressure
during testing recorded with the Omega peak measurement pressure gauge is reported as failure
capacity. The effects of age/weathering, fastener type, fastener spacing and retrofitting on
existing panel constructions uplift resistance are investigated.
Evaluation of Existing Panel Uplift Resistance
Table 5-5 presents full results for static UF-WRSUT panels harvested from LFWS located
in Central Florida in their existing condition, and the fastener failure loads calculated by the
assumption of tributary area. Fastener failure loads are calculated by multiplying the failure
pressure by the maximum tributary area in the panel; for example the 1.5 in. staples at 4 in. / 4 in.
have a maximum tributary area of 2/3 ft2 which is multiplied by the failure pressure of 93 psf to
get a fastener failure load of 62 lbs. It is seen that panels attached with 2 in. smooth shank nails
at 4 in. / 4 in. had the highest uplift capacity, which corresponds to the smallest tributary area
seen. The fastener with the highest withdrawal capacity is the 2.5 in. (8d) smooth shank nail,
which corresponds to the largest tributary area and fastener size. The most common panel
attachment harvested was 6d smooth shank nails spaced at 6 in. / 12 in. having a range of mean
84

uplift capacities of 39 psf to 102 psf, which contains the laboratory fabricated result of 74 psf.
Harvested panels attached with 8d common smooth shank nails at 6 in. / 12 in. had a mean uplift
capacity of 107 psf which considering the small sample size (2) is similar to the laboratory
fabricated result of 129 psf
Figure 5-5 presents a comparison of the scatter of static uplift capacity results from
harvested vs. new panels. Harvested panels attached with 1.5 in. staples are attached at two
fastener schedules having tributary areas of two thirds and one ft2, which yield similar results.
Harvested panels attached with 2.5 in. staples are attached at a 6 in. / 12 in. schedule and yield
results lower than the 1.5 in. staples, which is reasonable considering that due to tributary area
the 2.5 in. staples experience load levels as much as three times greater than the 1.5 in. staples.
Harvested panels attached with 2 in. 6d smooth shank fasteners are attached with four fastener
schedules (2, 1-1/3, 1 and 2/3 ft2). As discussed in Chapter 4 panels constructed with 6d smooth
shank should nominally be attached with a 6 in. / 12 in. schedule however spacing is somewhat
variable in the field. Comparing harvested and new 6d smooth shank fastened panels it is seen
that harvested panels have a slightly higher mean but contain laboratory fabricated panel results.
This increased capacity of harvested panels can be attributed to the smaller loads on individual
fasteners due to the closer spacing of harvested panels. Harvested panels attached with 8d
smooth shank fasteners are attached at a 6 in. / 12 in. schedule and have 17% lower mean uplift
capacity than new panels, however only two samples exist for harvested results and both fall
within range of new panel results.
Figure 5-6 presents a comparison of mean uplift capacity vs. calculated fastener
withdrawal load for panels attached with staples and nails at different fastening schedules. The
change in fastening is best thought of as change in tributary area because fastener withdrawal
85

loads are calculated by multiplying the tributary area by panel uplift capacity. Panels attached
with 1.5 in. staples experienced a decrease in mean uplift capacity and calculated fastener load as
tributary area decreases. Panels attached with 2 in. smooth shank nails had similar mean uplift
capacities for fastening schedules 6 in. / 12 in. to 3 in. / 6 in., but calculated fastener withdrawal
strength steadily decreased. From fastening schedules 3 in. / 6 in. to 4 in. / 4 in. panel uplift
capacity increased and fastener withdrawal strength increased slightly, however only a single
sample was tested at 4 in. / 4 in. spacing so this result may not be representative. This trend of
decreasing fastener load as tributary area decreases is confirmed in laboratory fabricated static
test results.
Results from panels harvested from existing structures and laboratory fabricated panels
presented above provide a data for the evaluation of age or weathering effects on wood roof
sheathing panel uplift capacity. These results show that statically tested uplift capacities of
existing wood roof sheathing panels have similar uplift capacities as newly fabricated panels.
This suggests that laboratory testing of newly fabricated roof sheathing panels can sufficiently
approximate the in-service strength of wood roof sheathing panels.
Evaluation of Retrofit of Existing Panels
Table 5-6 presents mean uplift capacity results from a comparative study of panels
harvested from existing LFWS located in Central Florida in existing condition vs. retrofitted. All
panels are tested statically per UF-WRSUT. Panels are retrofitted with 8d ring shank nails
spaced at 6 in. / 12 in. installed as if a panel had no existing fasteners (Retrofit A-1). When
existing fastener locations coincided with the 8d ring shank retrofit fastener locations nails were
installed directly next to the existing fastener. One panel was retrofitted with a full 3 in. thick
layer of ccSPF adhesive (Retrofit B-2).
86

Figure 5-7 presents a comparison of statically tested harvested panels in existing and
retrofit conditions. Results are averaged by individual source houses to account for any variation
between source houses of similar construction in the comparison. Harvested panel which were
retrofitted were found to have significantly increased uplift capacities. Panels retrofitted with 8d
ring shank nails spaced at 6 in. / 12 in. had an average increase in capacity of over 2.5 times.
Variations in retrofitted uplift capacity are seen to be independent of the existing fastener.
Panels retrofitted with ccSPF retrofitted increased 2.4 time however only 1 sample was tested.
Results presented in this section provide data for the evaluation of the initial strength
benefits of retrofitting existing construction. It is seen that retrofitting with one of the two
methods used can increase the uplift capacity of existing panels immediately after retrofits are
installed significantly.
Comparison of Laboratory vs. Harvested Specific Gravity Samples
Specific gravity measurements (167 laboratory samples and 178 harvested samples totaling
345 samples) were taken for all panels tested in static vs. dynamic testing. The mean specific
gravity of laboratory samples is 0.52 and 0.57 for harvested panels, which is similar to the NDS
specified specific gravity for southern yellow pine of 0.55. However, the mean values of two
sets of specific gravity are not statistically equal (p-value on the order of 10-8). The specific
gravities of the framing members used in the lab-built panels were best fit by a lognormal
distribution (Figure 5-8a), and for the harvested panels (15 years old), a normal distribution was
a better fit (Figure 5-8b). Rammer et al. (2001) found that normal and lognormal distributions fit
the specific gravity of southern yellow pine.
Table 5-7 presents specific gravities calculated in an attempt to determine if framing
member specific gravity affects the wind uplift capacity of wood roof sheathing. Three specific
gravities are calculated; the first is a mean of all framing members, the second is a mean of all
87

framing members which failed and the third is the mean of the framing members which were
observed or determined to fail first. In the third case if it was not possible to observe which
framing member failed first, then the framing members with relatively larger numbers of fastener
failures were used. The normalized panel failure pressure was calculated by dividing each panel
failure pressure by the maximum failure pressure for the given data set.
It is found that the specific gravity of framing members collected from in-service wood
roof systems are higher than wood framing members which were structural #2 grade or higher.
This suggests that there is no degradation of wood properties once installed in the field. An
analysis of the effects of specific gravity to uplift capacity suggests no correlation, however
limitations in testing make it difficult to pinpoint the initial failure and corresponding specific
gravity. It is found that if specific gravity effects the uplift capacity of wood roof sheathing it is
not a dominant factor.
Static vs. Dynamic Panel Uplift Test
The effects of dynamic loading characteristics on existing and retrofitted panels both
fabricated in the laboratory and harvested from existing construction are investigated.
Laboratory fabricated panels fastened with 6d smooth shank fasteners at 6 in. / 12 in. and 6 in. / 6
in. schedules from the same sample population are tested both statically and dynamically. Then
laboratory fabricated “existing” panels attached with the 6d smooth shank fasteners at 6 in. / 12
in. “retrofitted” with 8d ring shank nails are tested both statically and dynamically. Panels
harvested from existing construction in Central Florida fastened with 1.5 in. staples at 4 in. / 4 in.
are tested both statically and dynamically. Harvested panels are retrofitted with 8d ring shank
nails and tested statically and dynamically. All static vs. dynamic samples are tested with the
PLA system detailed in Chapter 4. Results recorded are pressure time-histories framing member
88

specific gravity, failure mode and location, moisture content for only harvested panels and
defects in harvested panel constructions (i.e. missing fasteners).
Comparison of Static vs. Dynamic Laboratory Fabricated Panel Uplift Test
Table 5-8 presents results from static vs. dynamic UF-WRSUT of laboratory fabricated
panels. Failure pressures of statically tested laboratory fabricated panels attached with 2 in. long
6d smooth shank nails spaced at 6 in. / 12 in. (62 psf) are similar to results obtained in static UF-
WRSUT results (74 psf). Similarly statically tested panels retrofitted with 8d ring shank nails
yield a mean failure pressure (183 psf) close to that of static UF-WRSUT results of similar
construction (174 psf and 161 psf).
Figure 5-9 presents a comparison of statically vs. dynamically tested panels fabricated in
the lab. As expected from static testing of panels fabricated lab, panels having 6 in. / 12 in.
fastening schedules failed at lower pressures than the panels having 6 in. / 6 in. fastening
schedules for both static tests (62 psf vs. 108 psf) and dynamic tests (52 psf vs. 90 psf).
Similarly as expected from static testing of panels retrofitted with 8d ring shank nails, panels
retrofitted with 8d ring shank nails had a higher failure pressure than in existing condition for
both static (62 psf vs. 183 psf) and dynamic (52 psf 167 psf) loading. A reduction of 16% was
found in uplift capacity of panels in existing condition tested dynamically. The capacity of
retrofitted panels was reduced 9% from static to dynamic loading.
Results from this section provide a comparison of statically vs. dynamically tested panels,
and the effect of dynamic loading on new 8d ring shank retrofitted panels. It is seen that
dynamic loading reduces the uplift capacity of new panels constructed with smooth shank
fasteners 16% and new panels constructed with ring shank fasteners 9%. This suggests that
dynamic loading reduces wood roof sheathing uplift strength and that the effects are lessened for
annularly threaded nails.
89

Comparison of Static vs. Dynamic Harvested Panel Uplift Test
Table 5-9 presents results from static vs. dynamic UF-WRSUT of panels harvested from a
single existing LFWS in Florida. Failure pressures of statically tested harvested panels attached
with 1.5 in. long staples (93 psf) are less than results obtained in static UF-WRSUT results (120
psf). Similarly statically tested panels retrofitted with 8d ring shank nails yield a mean failure
pressure (168 psf) less than that of static UF-WRSUT results of similar construction (270 psf).
However retrofitted panel uplift capacity fall within the range of statically tested laboratory
fabricated panels attached with 8d ring shank nails at 6 in. / 12 in. (174 psf and 161 psf).
Figure 5-10 presents a comparison of statically vs. dynamically tested panels harvested
existing construction. As expected from static testing of panels retrofitted with 8d ring shank
nails, panels retrofitted with 8d ring shank nails had a higher failure pressure than in existing
condition for both static (93 psf vs. 168 psf) and dynamic (72 psf vs. 126 psf) loading. A
reduction of 23% was found in uplift capacity of panels in existing condition tested dynamically.
The capacity of retrofitted panels was reduced 26% from static to dynamic loading.
Results from this section provide data for the evaluation of the effect of dynamic loading
on harvested panel in existing and retrofitted conditions. It is seen that dynamic loading reduces
harvested panels in existing conditions by 23% and panels in retrofitted conditions by 26%. This
increase in effect for panels retrofitted with 8d ring shank nails is contradictory to laboratory
fabricated panel results, however as detailed in Chapter 4 the panels used for retrofitting were the
panel with most missing fasteners. Thus harvested retrofitted panels effectively had larger
tributary areas than those of laboratory fabricated retrofitted panels making them more
susceptible to dynamic loading. However limited sample sizes prevent conclusive findings. It is
clear that dynamic loading effects the uplift capacity of wood roof sheathing panels.
90

Peak Pressure vs. Failure Pressure
Table 5-10 presents a summary of the peak pressures and the failure pressure of all panels
tested statically vs. dynamically. This is investigated to determine if panel failure occurs at a
peak pressure or later at some reduced pressure. Dynamically tested results are the focus of this
comparison but statically tested results are provided for comparison. If a panel fails at a peak
pressure or pressure spike then the failure is assumed to be due to the large loading rate.
However if a panel fails after a pressure spike at a lower pressure then failure is assumed to be
due to some accumulation of damage in the nail to wood connection. It is found that half (9) of
the dynamically tested panels failed at a pressure spike and are therefore due to the loading rate.
It is found that the half of the dynamically tested panels failed after a pressure spike at a reduced
pressure, which were on average is 87% of the peak pressure recorded.
For dynamically tested panels the failure pressure compared to peak pressure it can be
seen that the failure pressure is lower than the peak pressure by 3-9%. Statically tested panels
show little difference from peak to failure pressure. Therefore the reduction from dynamically to
statically tested panel resistance is increased when using the failure pressure instead of peak
pressure, which is what has typically been used in previous static tests. Table 5-11 presents the
reductions from static to dynamic resistance for both the peak and failure pressures. As expected
the magnitude of the reductions from static panel resistance are increased when calculated with
the failure pressures
Analysis of Variance of Results
Results are analyzed to determine if the control variables fastener type, fastener spacing,
age, date tested, retrofit and type of loading have a statistically significant effect on failure
pressure in this section. This is done by analyzing the variance within data series to test the null
hypothesis that all the samples come from the same sample population. Analysis of Variance
91

(ANOVA) test is a measure of the error between some number of data series by judging
statistically if the differences in the sample means are different. With the limited number of
samples there is a risk that the theoretical behavior of a combination of variables is not being
captured in results therefore the analysis is conducted for datasets of four samples or greater.
Similarly the methods employed assume that the distribution of the results is normal which has
only been verified for laboratory fabricated samples in the static phase of testing constructed
with 8d ring shank, 8d smooth shank and 6d smooth shank. All series used in analysis of
variation are presented in Table 5-12.
Procedure
To analyze the variance in the different datasets the comparison is broken down into two
parts (1) the error due to comparison or treatment and (2) the error due to the differences in
individual samples within a given dataset. The general procedure to analyze the variance
(ANOVA) of several datasets is to first calculated the sum of the squares error for the treatment
(SST) by,
(∑ −=i
i yynSST 2... ) (5-2)
Where .iy is the mean of an individual series, ..y is the mean of all the series combined, n is the
number of samples in the series and i is the number of the current treatment. Next the sum of the
squares error for those variations which are not due to the treatment (SSE) by,
(∑ −=ij
iij yySSE 2. ) (5-3)
Where is the jth term of the ith series or treatment and ijy .iy is the mean of the ith series or
treatment. Then unbiased estimates of the variance of the error between series are calculated for
the error due to the treatment (MST) and the error due to differences in sample means (MSE),
92

1−
=tSSTMST (5-4)
tN
SSEMSE−
= (5-5)
Where t is the number of treatments and N is the total number of samples in all series. Therefore
the ratio of the two unbiased mean square errors MST to MSE (F-value) should approach 1.0 if
the series were from similar sample populations expressed as,
MSEMSTvalueF =− (5-6)
Simply stated this means that if the variations of the mean values of each dataset about the
overall mean are the same as the variations of the individual samples to their corresponding
mean, then the samples can be said to come from the same population. To assess the probability
that the F-value is close to 1.0 a p-value analysis is used where the probability that the F-value
will be close to the expected value (p-value) is determined and compared to a level of
confidence. To assess the probability that the F-value will be close to 1.0 the p-value must be
less than the confidence limit α . For example if a p-value is greater than 0.05 then one can say
“the data is from the same population with 95% confidence” ( ( ) %1001%95 ⋅−= α ). A critical
Fcritical-value is calculated corresponds to the confidence limit meaning that if the F-value is
greater than the Fcritical-value then the datasets come from different sample populations.
To further analyze the result the Bonferroni Method (Ott and Longnecker 2004) is applied
to determine if individual datasets are similar to each other. The Bonferroni Method compares
the variance between datasets in the same way described above except that it does this for each
individual dataset. This is done by adjusting the confidence interval for the individual
comparisons by dividing the α by C, where C is,
93

( )2
1−=
IIC (5-7)
and I is the number of treatments or comparisons. By dividing the α by C the problem becomes
more conservative, therefore with large numbers of comparisons there is a risk of rejecting the
null hypothesis when it is true. The problem is evaluated by adjusting the comparison of the
series means by adding and subtracting the critical t-value (eq. 5-8).
( ) ⎟⎟⎠
⎞⎜⎜⎝
⎛+±− −
jiCNji JJ
MSEtXX 112/,1.. α (5-8)
Where is calculated from the “Students t-table”, )2/(,1 CNt α− .iX is the mean of the series i, is
the number of observation in series i,
iJ
.jX is the mean of the series j and is the number of
observation in series j. If zero lies between the limits of equation 6 then the series means are
found from the same population because the difference is zero within the confidence interval.
jJ
Laboratory Fabricated Panels Tested Statically
A comparison of the variances between all laboratory fabricated panel datasets in the static
phase of testing is conducted using the procedure described above with to determine if the
different datasets came from the same sample population. Table 5-13 presents the ANOVA table
which finds that the datasets come from different sample populations. Table 5-14 presents a full
comparison of the individual datasets to each other using the Bonferroni Method, which is
summarized in Table 5-15. It was found that the two 8d ring shank series spaced at 6 in. / 12 in.
are from the same sample population. It was found that the two ccSPF retrofit arrangements
(fillet and full 3 in.) were from the same sample population. Additionally it was found that 8d
ring shank nails at 6 in. / 12 in. are from the same population as 8d smooth shank nails at 6 in. / 8
94

in. Similarly 8d ring shank nails at 6 in. / 8 in. are found to be from the same population as 8d
smooth shank nails at 6 in. / 6 in. All remaining populations were found to be different.
Harvested Panels Tested Statically
A comparison of variances for all panels constructed with 6d smooth shank panel spaced at
6 in. / 12 in. was conducted to determine if harvested panel results came from the same sample
population as newly constructed results. This comparison included harvested and laboratory
fabricated panels from the static phase of testing, as well as laboratory fabricated panels from the
static vs. dynamic phase of testing. Table 5-16 presents the ANOVA table for the four datasets.
It is found that all datasets constructed with 6d smooth shank nails at 6 in. / 12 in. come from the
same sample population. Table 5-17 presents the full results for comparison using the
Bonferroni Method, which suggest again that all datasets come from the same sample
population.
A comparison of all statically loaded panels retrofitted with 8d ring shank nails spaced at 6
in. / 12 in. versus existing panel with 8d ring shank nails spaced at 6 in. / 12 in. was conducted
using the unequal variance t-test. The t-test is identical to the analysis of variance procedure
described above except that only two samples are compared. The full T-table is presented in
Table 5-18 and it is found that the two results are not from the same sample population for a
confidence level of 95%. This suggests that the original fasteners installed at the time of
construction make a difference
Laboratory Fabricated Panels Tested Statically vs. Dynamically
A comparison of variances for panels fastened with 6d smooth shank nails spaced at both 6
in. / 12 in. and 6 in. / 6 in. from the static vs. dynamic phase of testing are compared. The peak
pressure recorded during a test and the pressure which the panel failed at were both used. Table
5-19 and Table 5-21 present ANOVA tables for the peak and failure pressures respectively,
95

which both suggests that all statically and dynamically tested panels regardless of fastener
spacing come from the same sample population. Table 5-20 and Table 5-22 present the
Bonferroni analysis for the peak and failure pressures respectively, and again both suggest that
statically and dynamically tested panels are from the same population for both 6 in. / 12 in. and 6
in. / 6 in. spacings.
96

Table 5-1. Results of static UF-WRSUT of laboratory fabricated panels fastened with 2-3/8 in. long 6d smooth shank, 8d smooth shank and 8d ring shank nails
Fastener Schedule
8d Ring Shank Nails 8d Smooth Shank Nails 6d Smooth Shank Nails
# of Panels
Mean Failure (psf)
COV # of Panels
Mean Failure (psf)
COV # of Panels
Mean Failure (psf)
COV
6 in. / 12 in. 10 161.0 18% 15 129.4 11% 15 74.3 22% 15 174.4 13% 6 in. / 8 in. 15 216.1 17% 15 175.1 11% NA NA NA 6 in. / 6 in. 13 252.4 7% 15 205.3 10% NA NA NA Notes: Notes: Ring Shank Nails - 2.5 in. long 0.113 in. dia., 8d Smooth Shank Nails - 2.5 in. long 0.131 in. dia., and 6d Smooth shank - 2.375 in. long 0.113 in. dia.
Figure 5-1. Mean failure pressures of laboratory fabricated panels tested statically
97
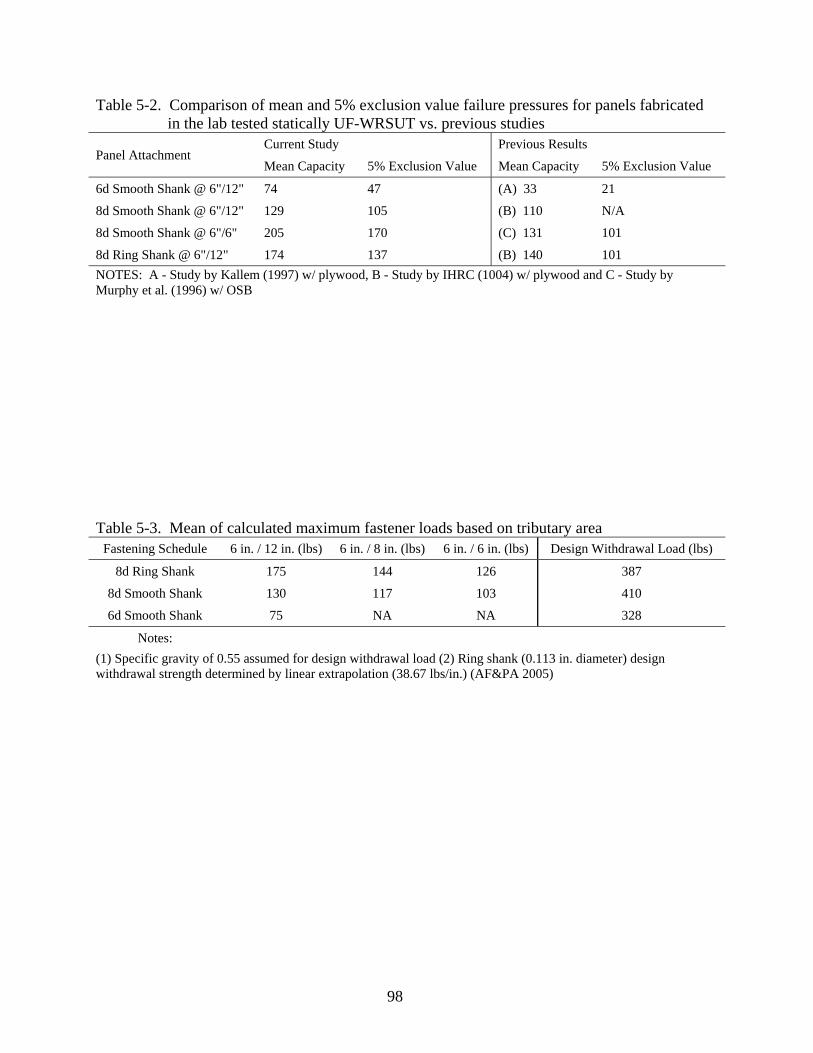
Table 5-2. Comparison of mean and 5% exclusion value failure pressures for panels fabricated in the lab tested statically UF-WRSUT vs. previous studies
Panel Attachment Current Study Previous Results
Mean Capacity 5% Exclusion Value Mean Capacity 5% Exclusion Value
6d Smooth Shank @ 6"/12" 74 47 (A) 33 21
8d Smooth Shank @ 6"/12" 129 105 (B) 110 N/A
8d Smooth Shank @ 6"/6" 205 170 (C) 131 101
8d Ring Shank @ 6"/12" 174 137 (B) 140 101 NOTES: A - Study by Kallem (1997) w/ plywood, B - Study by IHRC (1004) w/ plywood and C - Study by Murphy et al. (1996) w/ OSB
Table 5-3. Mean of calculated maximum fastener loads based on tributary area Fastening Schedule 6 in. / 12 in. (lbs) 6 in. / 8 in. (lbs) 6 in. / 6 in. (lbs) Design Withdrawal Load (lbs)
8d Ring Shank 175 144 126 387
8d Smooth Shank 130 117 103 410
6d Smooth Shank 75 NA NA 328
Notes: (1) Specific gravity of 0.55 assumed for design withdrawal load (2) Ring shank (0.113 in. diameter) design withdrawal strength determined by linear extrapolation (38.67 lbs/in.) (AF&PA 2005)
98
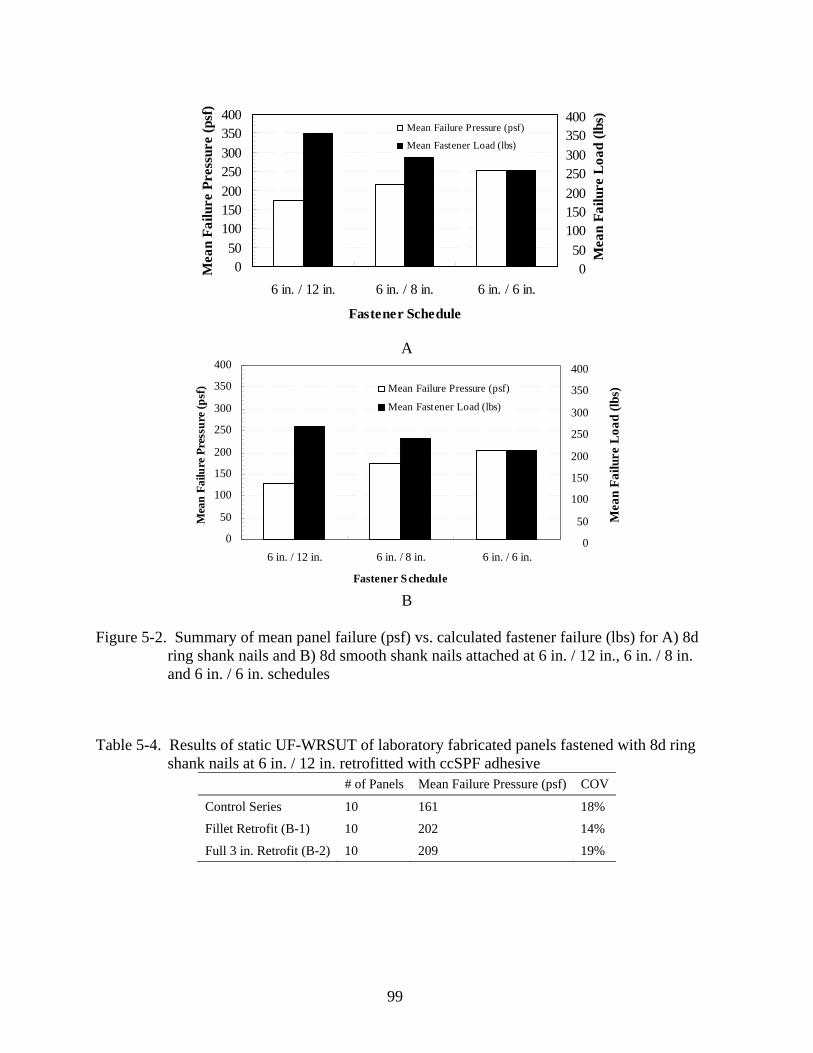
99
050
100150200250300350400
6 in. / 12 in. 6 in. / 8 in. 6 in. / 6 in
Fastener Schedule
Mea
n Fa
ilure
Pre
ssur
e (p
sf)
.
Mean Failure Pressure (psf)
Mean Fastener Load (lbs)
Mea
n Fa
ilure
Loa
d (lb
s)
050
100150200250300350400
A
0
50
100
150
200
250
300
350
400
6 in. / 12 in. 6 in. / 8 in. 6 in. / 6 in.
Fastener Schedule
Mea
n Fa
ilure
Pre
ssur
e (p
sf) Mean Failure Pressure (psf)
Mean Fastener Load (lbs)
Mea
n Fa
ilure
Loa
d (lb
s)
0
50
100
150
200
250
300
350
400
B
Figure 5-2. Summary of mean panel failure (psf) vs. calculated fastener failure (lbs) for A) 8d
ring shank nails and B) 8d smooth shank nails attached at 6 in. / 12 in., 6 in. / 8 in. and 6 in. / 6 in. schedules
Table 5-4. Results of static UF-WRSUT of laboratory fabricated panels fastened with 8d ring shank nails at 6 in. / 12 in. retrofitted with ccSPF adhesive
# of Panels Mean Failure Pressure (psf) COV
Control Series 10 161 18%
Fillet Retrofit (B-1) 10 202 14%
Full 3 in. Retrofit (B-2) 10 209 19%

Board Split
Partial Withdraw
Pull Through
Full Withdraw
195.2 psf
Moderate#39
193.8 psf
Fast failure#38
222.1 psf
Fast failure#37
195.9 psf
Moderate#36
232.7 psf
Fast failure#35
239.1 psf
Fast failure#33176.1 psf
Fast failure#34
213.6 psf
Moderate#44
193.1 psf
Fast failure#45
188.8 psf
Fast failure#31
163.4 psf
Moderate#32
207.2 psf
Fast failure#43
226.3 psf
Fast failure#41
223.5 psf
Fast failure#42
Legend
208.6 psf
Fast failure#40
8 in4 ft
8 ft
2 ft
15 samples
Mean : 205.3 psf
Max : 239.1 psf
Min : 163.4 psf
STD : 21.35 psfCOV : 0.104
Test dates : 10/22/2007 and 10/25/2007
Spacing : 6 inches O.C. interior ( 9 total) and at 6 inches O.C. edge (9 total)
Fastener : 8d smooth shank
0%10%20%30%40%50%60%70%80%90%
100%
8d SS 8d RS
1203Total Number of Panels
WithdrawalEvenPull-Through
∑
Fastener
% o
f Pan
el F
ailu
res
PTPTWWWWWWWWPTWWWWPanel Failure Mode
34201361168791078139# of Withdrawal Failures
6575352142112352# of Pull-Through Failures
454443424140393837363534333231Panel
Figure 5-3. Sample of failure mode and location calculations from Statically tested 8d smooth shank nails at 6 in. /12 in.
100

0%
10%
20%
30%
40%
50%
60%
70%
80%
90%
100%
6d SS 8d SSFastener
% o
f Fai
lure
Mod
e
8d RS
A 6 in. / 12 in.
0%
10%
20%
30%
40%
50%
60%
70%
80%
90%
100%
8d RS fillet 8d RS full
Fastener
% o
f Fai
lure
Mod
e
B ccSPF Retrofit
0%
10%
20%
30%
40%
50%
60%
70%
80%
90%
100%
8d SS 8d RS
Fastener
% o
f Fai
lure
Mod
e
C 6 in. / 8 in.
0%
10%
20%
30%
40%
50%
60%
70%
80%
90%
100%
8d SS 8d RS
Fastener
% o
f Fai
lure
Mod
e
D 6 in. / 6 in.
Legend Pull-Through DominatedEven FailuresWithdrawal Dominated
Figure 5-4. Distribution of Laboratory Fabricated Statically Tested Panels Dominated by
Withdrawal or Pull-through Failure modes A) 6 in. / 12 in. spacing, B) ccSPF retrofit of 6 in. / 12 spacing, C) 6 in. / 8 in. spacing and D) 6 in. / 6 in. spacing
101

Table 5-5. Measured failure pressure and calculated fastener failure load of statically tested panels harvested from existing structures in Central Florida
House Failure Pressure (psf) Tributary Area (ft2) Fastener Withdrawal Load (lbs)
Staples: 1.5 in. staple @ 4 in. / 4 in. spacing, ½ in. OSB
1.5 in. Staple-7 93 0.67 62
1.5 in. Staple-8 93 0.67 62
Mean 93 62
Staples: 1.5 in. staple @ 3 in. / 6 in. spacing, ½ in. Plywood
1.5 in. Staple-1 137 1 137
1.5 in. Staple-2 132 1 132
1.5 in. Staple-3 117 1 117
1.5 in. Staple-4 93 1 93
Mean 120 120
Staples: 2.5 in. staple @ 3 in. / 6 in. spacing, ½ in. Plywood
2.5 in. Staple-1 66 1 66
2.5 in. Staple-2 97 1 97
2.5 in. Staple-3 30 1 30
2.5 in. Staple-4 39 1 39
Mean 58 58
Nails: 2.5 in. smooth shank nail @ 6 in. / 12 in. spacing, ½ in. Plywood
8d Smooth Shank-46 112 2 224
8d Smooth Shank-47 101 2 202
Mean 107 213
Nails: 2 in. smooth shank nail @ 6 in. / 12 in. spacing, ½ in. Plywood
6d Smooth Shank-16 134 2 268
6d Smooth Shank-17 98 2 196
6d Smooth Shank-18 74 2 148
6d Smooth Shank-20 53 2 106
6d Smooth Shank-21 132 2 264
6d Smooth Shank-29 46 2 92
6d Smooth Shank-30 31 2 62
6d Smooth Shank-36 59 2 118
6d Smooth Shank-37 90 2 180
Mean 80 159
Nails: 2 in. smooth shank nail @ 8 in. / 8 in. spacing, ½ in. Plywood
6d Smooth Shank-34 83 1.33 111
6d Smooth Shank-35 62 1.33 83
Mean 73 97
102

Table 5-5. Continued House Failure Pressure (psf) Tributary Area (ft2) Fastener Withdrawal Load (lbs)
Nails: 2 in. smooth shank nail @ 3 in. / 6 in. spacing, ½ in. Plywood
6d Smooth Shank-24 117 1 117
6d Smooth Shank-32 62 1 62
6d Smooth Shank-33 64 1 64
Mean 81 81
Nails: 2 in. smooth shank nail @ 4 in. / 4 in. spacing, ½ in. Plywood
6d Smooth Shank-27 149 0.67 99
0
20
40
60
80
100
120
140
160
180
0.5 1.5 2.5 3.5 4.5 5.5 6.5 7.5 8.5 9.5
Panel Attachment
Failu
re P
ress
ure
(psf
)
1.5 in. Staple (Harvested) 2.5 in. Staple (Harvested)2 in. 6d Smooth Shank (Harvested) 8d Smooth Shank (Harvested)2.375 in. 6d Smooth Shank (New) 8d Smooth Shank (New)L
EG
EN
D
3" / 6" 3" / 6" 6" / 12"
8" / 8" 3" / 6" 4" / 4" 6" / 12"
6" / 12"
6" / 12"
Harvested
New
NewHarvested
Figure 5-5. Comparison of statically tested harvested and new panels full results of failure
pressure
103

0
25
50
75
100
125
150
175
200
225
2.5" @ 3"/6" 1.5" @ 3"/6" 1.5" @ 4"/4
Staple S ize and Spacing
Mea
n Fa
ilure
Pre
ssur
e (p
sf)
"
Failure Pressure (psf)
Fastener Withdrawal Load (lbs)
0
25
50
75
100
125
150
175
200
225
Mea
n Fa
ilure
Loa
d (lb
s)
2.5 in. STAPLE 1.5 in. STAPLE
A
0
25
50
75
100
125
150
175
200
225
2.5" @ 6"/12" 2" @ 6"/12" 2" @ 8"/8" 2" @ 3"/6" 2" @ 4"/4"
Nail S ize and Spacing
Mea
n Fa
ilure
Pre
ssur
e (p
sf) Failure Pressure (psf)
Fastener Withdrawal Load (lbs)
Mea
n Fa
ilure
Loa
d (lb
s)
0
25
50
75
100
125
150
175
200
2252.5 in. NAIL 2 in. NAIL
B
Figure 5-6. Comparison of mean uplift capacities with mean calculated fastener failure loads for
harvested panels attached with a) staples and b) nails
104

Table 5-6. Mean failure pressures of static UF-WRSUT of panels harvested from existing LFWS located in Central Florida and retrofitted existing panels
Source Existing Retrofit % increase in
Mean Failure Pressure # of
Panels Mean Failure Pressure (psf) # of
Panels Retrofit Method
Mean Failure Pressure (psf)
Staples: 1.5 in. staple @ 3 in. / 6 in. spacing, ½ in. plywood
Port Orange #1 4 120 2 A-1 270 125%
Staples: 2.5 in. staple @ 3 in. / 6 in. spacing, ½ in. plywood
Bartow #2 2 35 2 A-1 167 377%
Nails: 2.5 in. smooth shank nail @ 6 in. / 12 in. spacing, ½ in. plywood
Crystal River #1 2 107 2 A-1 200 87%
Nails: 2 in. smooth shank nail @ 6 in. / 12 in. spacing, ½ in. plywood
Port Orange #2 3 102 1 B-2 250 145%
Bartow #3 2 93 2 A-1 218 134%
Port Orange #3 2 39 1 A-1 140 259%
Nails: 2 in. smooth shank nail @ 3 in. / 6 in. spacing, ½ in. plywood
Bartow #4 1 117 2 A-1 169 44%
Nails: 2 in. smooth shank nail @ 4 in. / 4 in. spacing, ½ in. plywood
Bartow #5 1 149 1 A-1 197 32%
Notes: Retrofit Method A-1. 8d ring shank nail @ 6 in. / 12 in. spacing
Retrofit Method B-2. 3 in. thick layer of spray applied polyurethane adhesive
105

0
50
100
150
200
250
300
1.5"
Sta
ple
@3"
/6"
(ret
. A-
1)
2.5"
Sta
ple
@3"
/6"
(ret
. A-
1)
2.5"
Nai
l @6"
/12"
(ret
.A
-1)
2" N
ail @
6"/1
2" (r
et.
B)
2" N
ail @
6"/1
2" (r
et.
A-1
)
2" N
ail @
6"/1
2" (r
et.
A-1
)
2" N
ail @
3"/6
" (r
et. A
-1)
2" N
ail @
4"/4
" (r
et. A
-1)
Panel Attachment and Retrofit
Mea
n Fa
ilure
Pre
ssur
e (p
sf) Existing
Retrofit
1.5 in. STAPLE
2.5 in. STAPLE
2.5 in. NAIL
2 in. NAIL
Figure 5-7. Comparison of statically tested harvested panels in existing vs. retrofit conditions separated by individual source houses
106

0.2 0.3 0.4 0.5 0.6 0.7 0.80
2
4
6
8
Specific Gravity
Prob
abilit
y D
ensi
ty
n = 167
Specific Gravity DataNormal DistributionLognormal Distribution
A
0.2 0.3 0.4 0.5 0.6 0.7 0.80
2
4
6
8
Specific Gravity
Pro
babi
lity
Den
sity
n = 178
Specific Gravity DataNormal DistributionLognormal Distribution
B
Figure 5-8. Probability distribution of Specific Gravity of Panels Tested in Phase 2 for (A New
Panels and (B Harvested Panels 15 years old
Table 5-7. Summary of specific gravities calculated to investigate effect of specific gravity on panel wind uplift resistance
ID Statically Tested Dynamically Tested Mean Failure Pressure (psf) SG 1 SG 2 SG 3 Mean Failure
Pressure (psf) SG 1 SG 2 SG 3
6d Com. at 6"/12" 62 0.47 0.55 0.57 52 0.53 0.52 0.52
6d Com. At 6"/6" 108 0.52 0.55 0.54 90 0.54 0.55 0.54 6d Com. At 6"/12" Ret. A 183 0.47 0.46 0.48 167 0.55 0.58 0.63
1.5" 14 gauge Staple at 4"/4" 93 0.60 0.62 0.60 72 0.56 0.55 0.50
Notes: SG 1 calculated as mean of all framing members, SG 2 calc. as mean of all framing members which failed, and SG 3 calc. as mean of initial framing member(s) that failed
107

Table 5-8. Mean failure pressure of laboratory fabricated panels attached with 2 in. long 6d common nails tested statically and dynamically per UF-WRSUT
Fastener Schedule
Mean Specific Gravity of Framing
Static Dynamic Ratio of Dynamic to Static Mean Failure Pressures
# of Panels
Mean Failure Pressure (psf) # of
Panels Mean Failure Pressure (psf)
6 in. / 12 in. 0.50 5 62 5 52 0.84
6 in. / 6 in. 0.53 5 108 5 90 0.83 6 in. / 12 in. ret. A-2 0.51 2 183 2 167 0.91
Notes:
Retrofit Method A-2. 8d ring shank nails installed between an existing fastener spacing of 6 in. / 12 in.
020406080
100120140160180200
6 in. / 12 in. 6 in. / 6 in. 6 in. / 12 in. ret. A-2
Fastener Spacing
Mea
n U
plift
Cap
acity
(psf
) StaticDynamic
Existing Retrofit
Figure 5-9. Comparison of statically vs. dynamically loaded laboratory fabricated panels attached with 2 in. long 6d smooth shank nails at 6 in. / 12 in. (existing and retrofit) and 6 in. / 6 in.
108

Table 5-9. Mean failure pressure of panels harvested from existing construction attached with 1.5 in. long staples at 4 in. / 4 in. tested statically and dynamically per UF-WRUT
Fastener Schedule
Mean Specific Gravity of Framing
Mean Moisture Content of Framing
Static Dynamic Ratio of Dynamic to Static Mean Failure Pressures
# of Panels
Mean Failure Pressure (psf)
# of Panels
Mean Failure Pressure (psf)
4 in. / 4 in. 0.56 9% 2 93 4 72 0.77 4 in. / 4 in. ret. A-2 0.58 9% 2 168 2 126 0.75
Notes:
Retrofit Method A-2. 8d ring shank nails installed between an existing fastener spacing of 6 in. / 12 in.
0
20
40
60
80
100
120
140
160
180
4 in. / 4 in. 4 in. / 4 in. ret. A-2
Fastener Schedule
Mea
n U
plift
Cap
acity
(psf
) Static
Dynamic
Existing Retrofit
Figure 5-10. Comparison of statically vs. dynamically loaded panels harvested from existing construction attached with 1.5 in. long staples at 4 in. / 4 in. (existing and retrofit)
109

Table 5-10. Summary of comparison of peak vs. failure pressure for all static vs. dynamic panel results (34 panels)
Dynamically Tested Panels Statically Tested Panels
Panel
Peak Failure Ratio of Failure to Peak
Panel
Peak Failure Ratio of Failure to Peak
(psf) (sec.) (psf) (sec.) (psf) (sec.) (psf) (sec.)
6d SS at 6 in. / 12 in. (Lab)
6d SS-43 34.5 52 33 60 0.96 6d SS-38 47 52 47 52
6d SS-44 51 68 48 72 0.94 6d SS-40 58 61 58 61
6d SS-45 50 62 46 67.5 0.92 6d SS-41 64.8 61 63.3 70 98%
6d SS-46 58 72 58 72 6d SS-42 65 62 65 62
6d SS-47 66 82 66 82 6d SS-39 73 70 73 70
6d SS at 6 in. / 6 in. (Lab)
6d SS-57 44 62 44 62 6d SS-53 106 90 106 90
6d SS-58 103 111 103 111 6d SS-52 64 61 64 61
6d SS-59 105 111.5 105 111.5 6d SS-56 134 111 134 111
6d SS-60 72 82 53 85 0.74 6d SS-55 91 81 91 81
6d SS-61 124 121 104 124 0.84 6d SS-54 135 110 135 110
6d SS at 6 in. / 12 in. Retrofitted with A-2 (Lab)
6d SS-50 164 171 164 171 6d SS-48 199 150 195 154 98%
6d SS-51 171 173.5 162 173.8 0.95 6d SS-49 167 130 167 130
1.5 in. Staple at 4 in. / 4 in. (Harvested) 1.5 in. Staple-9 93 102 93 102 1.5 in.
Staple-7 93 80 90 82 97%
1.5 in. Staple-10 61 72 61 72 1.5 in.
Staple-8 93 80 90 84 97%
1.5 in. Staple-11 52 62 37 66 0.71
1.5 in. Staple-12 82 82 71 89 0.87
1.5 in. Staple at 4 in. / 4 in. with Retrofitted with A-2 (Harvested) 1.5 in. Staple-15 150 161 150 161 1.5 in.
Staple-13 168 130 165 132 98%
1.5 in. Staple-16 102 102 90 105 0.88 1.5 in.
Staple-14 169 130 165 136 98%
110

Table 5-11. Summary of reduction from statically tested to dynamically tested panel resistance for both peak and failure pressures
Peak Pressure Failure Pressure
6d SS at 6 in. / 12 in. (Lab) 16% 20%
6d SS at 6 in. / 6 in. (Lab) 15% 23%
6d SS at 6 in. / 12 in. Retrofitted with A-2 (Lab) 8% 10%
1.5 in. Staple at 4 in. / 4 in. (Harvested) 23% 27%
1.5 in. Staple at 4 in. / 4 in. with Retrofitted with A-2 (Harvested) 25% 27%
Table 5-12. Summary of series used in analysis of variance Series # of Panels Mean (psf) St. Dev.
Laboratory Fabricated Static
8d RS 6/12 w/ ccSPF fillet 10 202 28
8d RS 6/12 w/ full ccSPF 10 209 39
8d RS 6/12 15 174 23
8d RS 6/12 ccSPF Control 10 161 28
8d RS 6/8 15 216 36
8d RS 6/6 13 252 18
8d SS 6/12 15 129 15
8d SS 6/8 15 175 20
8d SS 6/6 15 205 21
6d SS 6/12 15 74 16
Harvested Static
6d SS 6/12 harvest 9 80 37
6d SS 6/12 lab 15 74 16
Laboratory Fabricated Static vs. Dynamic
6d SS 6/12 S 5 62 10
6d SS 6/12 D 5 52 12
6d SS 6/6 S 5 108 29
6d SS 6/6 D 5 90 31
111

Table 5-13. ANOVA table for all laboratory fabricated static phase results (alpha = 0.05, therefore 95% confidence level)
Source of Variation SS df MS F P-value F crit
Between Groups 301684 7 43097.72 81.87163 1.27E-39 2.098005
Within Groups 55272.63 105 526.406
Total 356956.7 112
112

Table 5-14. Bonferroni test full results for laboratory fabricated statically tested panels (alpha = 0.05)
Series A Series B Lower Bound Upper Bound Null Hypothesis
8d RS 6/12 w/ ccSPF fillet 8d RS 6/12 w/ full ccSPF -43.98155544 30.18155544 Accept
8d RS 6/12 -6.284007303 61.41734064 Accept
8d RS 6/12 ccSPF control 3.91844456 78.08155544 Reject
8d RS 6/8 -47.91067397 19.79067397 Accept
8d RS 6/6 -85.26899174 -15.51562365 Reject
8d SS 6/12 38.7699927 106.4713406 Reject
8d SS 6/8 -6.944007303 60.75734064 Accept
8d SS 6/6 -37.1440073 30.55734064 Accept
6d SS 6/12 93.88265936 161.5840073 Reject
8d RS 6/12 w/ full ccSPF 8d RS 6/12 0.615992697 68.31734064 Reject
8d RS 6/12 ccSPF control 10.81844456 84.98155544 Reject
8d RS 6/8 -41.01067397 26.69067397 Accept
8d RS 6/6 -78.36899174 -8.615623647 Reject
8d SS 6/12 45.6699927 113.3713406 Reject
8d SS 6/8 -0.044007303 67.65734064 Accept
8d SS 6/6 -30.2440073 37.45734064 Accept
6d SS 6/12 100.7826594 168.4840073 Reject
8d RS 6/12 8d RS 6/12 ccSPF control -20.41734064 47.2840073 Accept
8d RS 6/8 -71.9036299 -11.34970343 Reject
8d RS 6/6 -109.378864 -46.53908473 Reject
8d SS 6/12 14.77703677 75.33096323 Reject
8d SS 6/8 -30.93696323 29.61696323 Accept
8d SS 6/6 -61.13696323 -0.583036768 Reject
6d SS 6/12 69.88970343 130.4436299 Reject
8d RS 6/12 ccSPF control 8d RS 6/8 -88.91067397 -21.20932603 Reject
8d RS 6/6 -126.2689917 -56.51562365 Reject
8d SS 6/12 -2.230007303 65.47134064 Accept
8d SS 6/8 -47.9440073 19.75734064 Accept
8d SS 6/6 -78.1440073 -10.44265936 Reject
6d SS 6/12 52.88265936 120.5840073 Reject
8d RS 6/8 8d RS 6/6 -67.75219732 -4.912418063 Reject
8d SS 6/12 56.40370343 116.9576299 Reject
8d SS 6/8 10.68970343 71.2436299 Reject
8d SS 6/6 -19.51029657 41.0436299 Accept
6d SS 6/12 111.5163701 172.0702966 Reject
113

114
Table 5-14. Continued Series A Series B Lower Bound Upper Bound Null Hypothesis
8d RS 6/6 8d SS 6/12 91.59308473 154.432864 Reject
8d SS 6/8 45.87908473 108.718864 Reject
8d SS 6/6 15.67908473 78.51886399 Reject
6d SS 6/12 146.7057514 209.5455307 Reject
8d SS 6/12 8d SS 6/8 -75.99096323 -15.43703677 Reject
8d SS 6/6 -106.1909632 -45.63703677 Reject
6d SS 6/12 24.83570343 85.3896299 Reject
8d SS 6/8 8d SS 6/6 -60.47696323 0.076963232 Accept
6d SS 6/12 70.54970343 131.1036299 Reject
8d SS 6/6 6d SS 6/12 100.7497034 161.3036299 Reject

Table 5-15. Bonferroni test summary for laboratory fabricated static tested results (alpha = 0.05)
8d RS at 6/12, ccSPF fillet
8d RS at 6/12, ccSPF full
8d RS at 6/12
8d RS at 6/12 ccSPF control
8d RS at 6/8
8d RS at 6/6
8d SS at 6/12
8d SS at 6/8
8d SS at 6/6
6d SS at 6/12
8d RS at 6/12, ccSPF fillet 1 - - - - - - - - -
8d RS at 6/12, ccSPF full 1 1 - - - - - - - -
8d RS at 6/12 1 0 1 - - - - - - -
8d RS at 6/12 ccSPF control 0 0 1 1 - - - - - -
8d RS at 6/8 1 1 0 0 1 - - - - -
8d RS at 6/6 0 0 0 0 0 1 - - - -
8d SS at 6/12 0 0 0 1 0 0 1 - - -
8d SS at 6/8 1 1 1 1 0 0 0 1 - -
8d SS at 6/6 1 1 0 0 1 0 0 1 1 -
6d SS at 6/12 0 0 0 0 0 0 0 0 0 1
Notes: 1 = same population (accept null hypothesis), and 0 = different population (reject null hypothesis)
115

Table 5-16. ANOVA table for all panels fastened with 6d smooth shank nails spaced at 6 in. / 12 in. (alpha = 0.05, therefore 95% confidence level)
Source of Variation SS df MS F P-value F crit
Between Groups 3076.918 3 1025.639 1.986536 0.137212 2.922277
Within Groups 15488.86 30 516.2954
Total 18565.78 33
Table 5-17. Bonferroni test full results for all panels fastened with 6d smooth shank nails spaced at 6 in / 12 in. (alpha = 0.5)
Series A Series B Lower Bound Upper Bound Null Hypothesis
6d SS 6/12 harvest 6d SS 6/12 lab -21.66197671 32.46197671 Accept
6d SS 6/12 S -17.63496351 53.96429685 Accept
6d SS 6/12 D -8.176963514 63.42229685 Accept
6d SS 6/12 lab 6d SS 6/12 S -20.37935052 45.90868385 Accept
6d SS 6/12 D -10.92135052 55.36668385 Accept
6d SS 6/12 S 6d SS 6/12 D -31.13496506 50.05096506 Accept
Table 5-18. T-test result for panels retrofitted with 8d ring shank nails at 6 in. / 12 in. vs. panels with only 8d ring shank nails at 6 in. / 12 in.
8d RS 6/12 ret. 8d RS 6/12 exist
Mean 192.789375 169.06
Variance 1886.39914 648.3875
Observations 16 25
Hypothesized Mean Difference 0
df 22
t Stat 1.978578735
P(T<=t) one-tail 0.030258876
t Critical one-tail 1.717144335
P(T<=t) two-tail 0.060517752
t Critical two-tail 2.073873058
116

117
Table 5-19. ANOVA table for all panels tested in static vs. dynamic phase using peak pressure (alpha = 0.05, therefore 95% confidence level)
Source of Variation SS df MS F P-value F crit
Between Groups 9952.879 3 3317.626 6.436434 0.004583 3.238872
Within Groups 8247.117 16 515.4448
Total 18200 19
Table 5-20. Bonferroni test full results for panels tested in static vs. dynamic phase using peak pressure (alpha = 0.05)
Series A Series B Lower Bound Upper Bound Null Hypothesis
6d SS 6/12 S 6d SS 6/12 D -33.73835588 52.65435588 Accept
6d SS 6/6 S -89.85435588 -3.461644119 Reject
6d SS 6/6 D -71.32035588 15.07235588 Accept
6d SS 6/12 D 6d SS 6/6 S -99.31235588 -12.91964412 Reject
6d SS 6/6 D -80.77835588 5.614355881 Accept
6d SS 6/6 S 6d SS 6/6 D -24.66235588 61.73035588 Accept
Table 5-21. ANOVA table for all panels tested in static vs. dynamic phase using failure pressure (alpha = 0.05, therefore 95% confidence level)
Source of Variation SS df MS F P-value F crit
Between Groups 9054.6535 3 3018.2178 5.782337 0.007095 3.238872
Within Groups 8351.552 16 521.972
Total 17406.2055 19
Table 5-22. Bonferroni test full results for panels tested in static vs. dynamic phase using failure pressure (alpha = 0.05)
Series A Series B Lower Bound Upper Bound Null Hypothesis
6d SS 6/12 S 6d SS 6/12 D -32.408998 54.52899801 Accept
6d SS 6/6 S -88.208998 -1.27100199 Reject
6d SS 6/6 D -64.008998 22.92899801 Accept
6d SS 6/12 D 6d SS 6/6 S -99.268998 -12.331002 Reject
6d SS 6/6 D -75.068998 11.86899801 Accept
6d SS 6/6 S 6d SS 6/6 D -19.268998 67.66899801 Accept

CHAPTER 6
DISCUSSION
Wood roof sheathing panel system wind uplift design is based on prescriptive codes which
specify acceptable panel construction materials and attachment. The determination of panel
construction is based on pseudo-static pressure testing of full size newly constructed panels to
failure. Wind uplift loading of wood roof sheathing systems in existing conditions is both
dynamic and subjected to aging or weathering. It is the hypothesis of this investigation that
pseudo-static pressure testing of newly constructed panels overestimates the wind uplift
resistance, which accounts for a portion of the observed failures below design wind speeds.
In order to do this a standard test protocol was developed (UF-WRSUT) as none currently
exist. The protocol has two procedures, Method A (static) and Method B (dynamic), in order to
(1) provide a direct comparison of static and dynamic loading and (2) create a test protocol using
simple equipment which can be utilized in most laboratories. The standard protocol is compared
with previous studies which currently form the basis for wood roof sheathing uplift design. The
static method is then used to evaluate the uplift resistance of panels harvested from existing
structures in Florida. Finally laboratory constructed and harvested panels are tested with both
methods in order to compare the uplift resistance of wood roof sheathing under dynamic loading.
This chapter discusses findings from the experimental study to evaluate the effect of dynamic
uplift loading and age or weathering on wood roof sheathing panel uplift capacity.
Analysis of Design Wind Speeds
As detailed in Chapter 2 the current wind uplift design of wood roof sheathing is based on
previous wind uplift pressure testing. To compare results from this experimental study to design
wind speeds ASCE 7-05 (2006) Method 2 – Analytical Procedure is worked in reverse. The
author was unable to find a standard method for determining design uplift pressure, therefore a
118

factor of safety is applied to the mean failure pressure to obtain the design pressure. The 2.0
factor of safety is selected based on a paper by Sutt et al. (2003) which summarizes applicable
research to panel uplift resistance. The paper proposes a design equation for residential wood
roof sheathing based on individual fastener capacity, which applies a factor of safety of 2.0 for
panel design pressures in addition to the factor of safety of 5.0 used in nail withdrawal design
loads. Additionally 5% exclusion values are used for design pressure where available for
comparison.
The structure which the panels are assumed to be installed in is a partially enclosed gable
roof building with a mean roof height of 15 ft in exposure B conditions. Equation 6-22 (eq. 6-2)
is rearranged to solve for the velocity pressure (qz) (eq. 6-3), where the design pressure (p) is
divided by the sum of the internal (GCpi = +0.55) and external (GCp = -2.6) product of gust
effect factor and pressure coefficients for an effective wind area of 2 ft2.
( ) ( )[ ]pipz GCGCqp −= (6-2)
)( ) ([ ]pipz GCGC
pq−
= (6-3)
Then equation 6-15 (eq. 6-4) is rearranged to solve for the design velocity (Vdesign) (eq. 6-5)
=
(6-4)
where qz is divided by the product of a unit conversion (0.00256), elevation coefficient (Kz =
0.7), topographic factor (Kzt = 1.0), directionality factory (Kd = 0.85) and importance factor (I
1.0). Then the roof of that is the design velocity.
IVKKKq designdztzz ⋅⋅⋅⋅⋅= 200256.0
IKKKq
Vdztz
zdesign ⋅⋅⋅⋅
=00256.0
(6-5)
119

Table 6-1 summarizes the calculated design wind speeds for laboratory fabricated UF-
WRSUT Method A results with both 2.0 factor of safety and 5% exclusion value design
pressures. From the analysis it is seen that the 2.0 factor of safety design pressure is more
conservative than the 5% exclusion design pressure, where wind speeds are 11-25% less for the
factor of safety design pressure. The current connection of residential wood roof sheathing in
coastal areas is in Florida is 8d ring shank at 6 in. / 6 in. (ICC 2004) and 8d smooth shank at 4 in.
/ 8 in. (ICC 2006). ASCE 7-05 (ASCE 2006) design wind speeds for coastal areas in Florida
range from 130-150 mph. Results corresponding to current construction practices, 8d ring shank
at 6 in. / 6 in. and 8d smooth shank at 6 in. / in. panels, are compared to design wind speeds in
coastal areas. Wind speeds calculated with the 5% exclusion design pressure are sufficient for
both connections. It is seen that current connections of 8d ring shank nails spaced at 6 in. / 6 in.
are sufficient to resist design wind speed in coastal areas. It is found that 6d smooth shank nails
provide an insufficient resistance design wind speeds above 100 mph. This suggests that the
current building stock constructed before 1994 is in need of retrofit measures to prevent
significant losses due to hurricane loading.
Design pressure calculated with the 2.0 factor of safety are considered herein due to lack of
5% exclusion values for all results. Table 6-2 summarizes calculated design wind speeds for
panels tested per UF-WRSUT Method B. It is seen that no panel configuration used is sufficient
to be used in coastal areas. Panels retrofitted with 8d ring shank nails at 6 in. / 12 in. have
increased calculated design wind speeds but do not meet ASCE 7-05 design wind speeds.
Dynamic testing was not conducted on current construction so conclusions cannot be made
regarding the effect of dynamic loading on current construction. However it is shown that
120

dynamic loading reduces similar wood roof sheathing uplift resistance, therefore it is reasonable
to assume that current construction uplift resistance would be reduced.
Effect of Aging or Weathering on Wind Uplift Resistance
Laboratory studies of wood roof sheathing connections have suggested that withdrawal
strength can be effected by conditions which may be present in the field, detailed in Chapter 2.
As part of this study the effects of aging or weathering on wind uplift resistance is investigated
by testing uplift capacities of panel harvested from existing structures. Results do not suggest
any significant reduction in wind uplift resistance of residential wood roof sheathing due to aging
effects. Results show that harvested panels are within the range of similar laboratory fabricated
results. Comparisons are difficult to make due to the limited sample sizes and variation in
construction of harvested panel. As discussed in Chapter 4 it is difficult to obtain harvested
panels and the researcher must take what is available. The effect of age or weathering is shown
not to have an effect on the specific gravity of the wood framing of harvested samples. The
specific gravity samples collected from existing structures is actually shown to have a higher
specific gravity (0.57) than those of laboratory constructed samples (0.52).
Panels retrofitted with all of the four methods used experience increased wind uplift
resistance. Retrofitting panels with 8d ring shank nails can be done when the roof covering is
being replace with little effort. Considering the finding that age or weathering do not effect
panel uplift capacity when fastened with nails, results suggests that the significant increase in
capacity found in testing will be sustained over the life of the roof. Panels retrofitted with ccSPF
have similar structural benefits and provide an option to retrofit the roof at any time, not just
when being re-roofed. However the effects of age or weather on ccSPF structural capacity are
not known.
121

Effect of Dynamic Nature of Wind Uplift Loading
The comparison of wind uplift performance of statically tested panels to similar panels
tested dynamically is conducted in order to evaluate the effect of the dynamic nature of wind
uplift loading on residential wood roof sheathing. Results showed approximately a 20%
reduction in uplift capacity when dynamically tested panels are compared with statically tested
ones. The amplitude and frequency content of the dynamic pressure trace derived from wind
tunnel tests was representative of actual wind pressure fluctuations to represent as accurately as
possible real wind flow. Current pseudo-static wind uplift testing is based on the assumption that
the residential wood structure is a rigid which results in a high natural frequency, therefore the
amplifying effects of dynamic loading can be neglected. While the natural frequency of
residential wood structures is known the natural frequency of wood roof sheathing is currently
unknown and may not be a rigid system. However displacement measurements were not taken
from sheathing during testing making conclusions about the rigidity of sheathing impossible, and
small sample sizes limit the statistical merit of the conclusions.
Results show that 50% of panels tested dynamically fail below the highest instantaneous
pressure during testing suggesting a cumulative damage effect. It is thought that if a panel is
able to take load after it receives a pressure spike then the panel failure is not due to the large
loading rate associated with the pressure spike. When failure then occurs at a pressure lower
than the preceding spike it is suggested that this is evidence of damage to the nail/wood interface
accumulating. These results are preliminary and further testing is necessary to confirm the
findings.
Wind Uplift Behavior of Residential Wood Roof Sheathing
Results showed an interesting fact in that current tributary area model used to estimate the
nail withdrawal load of sheathing behavior. For all data sets the calculated fastener failure load
122

increased with decreasing fastener spacings. It was expected that the withdrawal load would be
the same regardless of nail spacing since the same wood is used. A new model developed by
Dao and van de Lindt (2008) suggests that withdrawal capacity of fasteners installed in sheathing
is non-linearly dependant on fastener spacing, where as spacing increases the moment applied to
the fastener increases. It is found that under uniform loading panel displacement is increased
significantly and therefore field fastener strengths are reduced. This model is particularly
interesting when considering the spatial variations present in wind uplift loading, where pressure
may vary significantly over a 4 ft by 8 ft surface. Considering that moment reduces the
withdrawal capacity of fasteners installed in wood then field nails would also experience
moment.
Wood roof sheathing panels behavior is based on the assumption that fastener withdrawal
strength with be the limiting factor in panel failure capacity. As discussed in Chapter 2 pull-
through strengths of common wood roof sheathing are similar to fastener withdrawal strengths.
It is therefore expected that as fastener withdrawal capacity increases, based on fastener type or
spacing, the panel failure mode will change from withdrawal to pull-through. This trend is
observed in test results for fastener type, where panels fastened with ring shank nails have more
pull-through failures. It is observed that as fastener spacing increases the number of pull-through
failures decrease, which suggests an inverse relationship of fastener spacing and withdrawal
capacity. This finding supports Dao and van de Lindt findings that spacing effects fastener
withdrawal capacity. The confirmation of fastener withdrawal strength reducing as spacing
increases and the discrepancy of this finding with the tributary area calculated fastener load
suggest that tributary is not appropriate for wood roof sheathing.
123

0
25
50
75
100
125
150
175
200
225
Lab Static 6d SS@ 6"/12"
Kallem Static6d SS @ 6"/12"
Lab Static 8d SS@ 6"/12"
IHRC 8d SS @6"/12"
Lab Static 8d SS@ 6"/6"
Murhpy et al.8d SS @ 6"/6"
Lab Static 8d RS@ 6"/12"
IHRC 8d RS @6"/12"
Series ID
Pres
sure
(psf
)
Mean Failure Pressure5% Exclusion Failure Pressure
6d SS at 6 in. / 12 in. 8d SS at 6 in. / 12 in. 8d SS at 6 in. / 6 in. 8d RS at 6 in. / 12 in.
Figure 6-1. Comparison of lab static mean and 5% exclusion failure pressures to studies by Kallem (1997) w/ plywood, IHRC (2004) w/ plywood and Murphy et al. (1996) w/ OSB (IHRC 8d SS @ 6”/12” was not a normal distribution so 5% exclusion value is not provided)
124

Table 6-1. Comparison of design wind speeds calculated per ASCE 7-05 Method 2 for UF-WRSUT Method A results based on A) a factor of safety of 2.0 applied to the mean and B) 5% exclusion of the data (enclosed gable roof building in exposure B assumed, with a mean roof height of 15 ft)
Series Mean Failure Pressure (psf) Field Panels (mph) Overhang Panels (mph)
Zone 1 Zone 2 Zone 3 Zone 2 Zone 3
6d SS @ 6"/12" 74.3 130 104 88 105 81
8d SS 6"/12" 129.4 171 137 116 139 107
8d SS 6"/8" 175.1 199 160 135 162 125
8d SS 6"/6" 205.3 >200 173 146 175 135
8d RS @ 6"/12" 174.4 191 153 130 155 120
8d RS @ 6"/12" 161.0 199 160 135 161 124
8d RS @ 6"/8" 216.1 >200 178 150 180 138
8d RS @ 6"/6" 252.4 >200 192 162 194 150
Fillet of ccSPF (B-1) 202.0 >200 172 145 174 134
Full 3" of ccSPF (B-2) 209.0 >200 175 148 177 136 A Factor of safety = 2.0
Series 5% Exclusion Failure Pressure (psf)
Field Panels (mph) Overhang Panels (mph)
Zone 1 Zone 2 Zone 3 Zone 2 Zone 3
6d SS @ 6"/12" 74.3 146 117 99 119 92
8d SS @ 6"/12" 129.4 >200 175 148 177 136
8d SS @ 6"/8" 175.1 >200 >200 172 >200 159
8d SS @ 6"/6" 205.3 >200 >200 188 >200 174 8d RS @ 6"/12" 174.4 >200 >200 169 >200 156
8d RS @ 6"/8" 216.1 >200 >200 181 >200 167
8d RS @ 6"/6" 252.4 >200 >200 >200 >200 198 B 5% exclusion
125

126
Table 6-2. Comparison of design wind speeds calculated per ASCE 7-05 Method 2 for UF-WRSUT Method B results A) statically tested panels and B) dynamically tested panels (enclosed gable roof building in exposure B assumed, with a mean roof height of 15 ft)
Mean Failure Pressure (psf)
Field Panel Design Wind Speed (MPH) Overhang Panel Design
Wind Speed (MPH) Zone 1 Zone 2 Zone 3 Zone 2 Zone 3
Laboratory Fabricated Panels
2" 6d SS @ 6"/12" 62 118 95 80 96 74
2" SS @ 6"/6" 108 156 126 106 127 98
2" SS @ 6"/12" Ret. A-2 183 204 163 138 165 127
Harvested Panels
1.5" S @ 4"/4" 93 145 116 98 118 91
1.5" S @ 4"/4" Ret. A-2 168 195 157 132 158 122 A Static
Mean Failure
Pressure (psf)
Field Panel Design Wind Speed (MPH) Overhang Panel Design
Wind Speed (MPH) Zone 1 Zone 2 Zone 3 Zone 2 Zone 3
Laboratory Fabricated Panels
2" 6d SS @ 6"/12" 52 108 87 74 88 68
2" SS @ 6"/6" 90 143 115 97 116 89
2" SS @ 6"/12" Ret. A-2 167 194 156 132 158 122
Harvested Panels
1.5" S @ 4"/4" 72 128 102 87 104 80
1.5" S @ 4"/4" Ret. A-2 126 169 136 115 137 106 B Dynamic

CHAPTER 7 CONCLUSIONS AND RECOMMENDATIONS
Conclusions
The purpose of this research was to establish a relationship between laboratory test
performance of wood roof sheathing and the failure mechanisms observed in the field after
hurricanes. The reviewed literature identified no recognized test method for evaluating the wind
uplift performance of these systems, and so a test method was proposed that standardizes current
approaches used for wind uplift testing of residential wood roof sheathing. A dynamic pressure
test protocol was also developed using pressure time histories collected in wind tunnel
experiments. These two test methods (a Static and a Dynamic one) were used to compare the
ultimate wind uplift resistance of new and existing wood roof sheathing panels. The design wind
speeds associated with the failure pressures were determined in accordance with ASCE 7
minimum load provisions, and the following conclusions were made:
Comparison of Results with Previous Studies
Panels tested with standard wind uplift test protocol developed (UF-WRSUT) have failure
pressures in the same order of magnitude as previously reported test results. For example 8d
smooth shank nails at 6 in. / 12 in. yielded a mean failure pressure of 129 psf which is similar to
a study by IHRC (IHRC 2004) which had a mean failure pressure of 110 psf. Additionally
coefficients of variation from panel uplift results from UF-WRSUT (7% to 22%) are in similar
range as observed in previous studies (7% to 28%).
Effect of In-Service and Environmental Effects on Roof Panel Strength
Test results have not shown significant loss in wind uplift strength of roof panels due to
environmental conditions. Comparing panels fastened with 6d smooth shank nails at 6 in. / 12
in. spacing, harvested panels have a higher mean uplift capacity (80 psf) than laboratory
127

fabricated panels (74 psf). In the case of panels fastened with 8d smooth shank nails at 6 in. / 12
in. spacing harvested panels have a lower mean uplift capacity (107 psf) than laboratory
fabricated panels (129 psf), however only two harvested panels were tested. A larger data set of
existing panels would need to be tested to establish a statistical basis for this, however
experience with wood materials suggests that once its moisture content is maintained below
about 19% (as was the case in all the houses tested) the strength of the wood should not
deteriorate. Further low moisture content in the wood also prevents the growth of fungi that
permanently degrade wood strength.
Dynamic Load Effects on Wood Panel Strength
Dynamic loading is shown to reduce failure pressure results from 9% to 23%, which
suggests a potential reduction due to dynamic loading. The reduction from static to dynamic
testing is observed in both new panel construction and panels harvested from existing structures.
An analysis of variance finds that all static vs. dynamic results come from the same sample
population and a limited sample size is tested so no conclusive findings can be made. Further
testing with larger numbers of samples are needed to extrapolate results to current wind uplift
design of wood roof sheathing panels.
Recommendations
Previous residential wood roof sheathing uplift testing have used various methods which
have contributed to a varying body results. The use of a standard test method is suggested as a
for uplift testing of residential wood roof sheathing in order to reduce the error in comparisons
due the test method.
It is recommended that further testing of both dynamic and age or weathering effects be
continued as sample sizes were relatively small due to logistical and time constraints. It is
recommended that an investigation be conducted to determine if cumulative damage occurs in
128

129
the connection between individual dowel type fasteners and the wood it is embedded in. As
wood is found in to be an elastic material at low levels of energy cumulative damage effects may
only occur above some threshold. Quantifying cumulative damage would require lab studies of
nail samples subjected to cyclical loading of varying load levels and amplitude.
It is recommended that the distribution of pressure loads to individual fasteners in wood
roof sheathing panels be investigated to relate the previous recommendation to panel system
behavior.

APPENDIX A FULL PANEL UPLIFT RESULTS
Table A-1. Summary of panel uplift test series
Panel Series Fastener Schedule
Dates of Testing
Retrofit Type Description
1.5 in. Staple
Port Orange #1 3 in. / 6 in. - A-1 Six harvested panels tested statically in EC (4) and RC (2)
Debary #1 4 in. / 4 in. 15 yrs A-1 Ten harvested panels tested statically in EC (2) and RC (2) vs. dynamically in EC (4) and RC (2)
2.5 in. Staple
Bartow #1 3 in. / 6 in. - - Two harvested panels tested statically in EC
Bartow #2 6 in. / 12 in. - A-1 Four harvested panels tested statically in EC (2) and RC (2)
6d (0.113 in. diameter) Smooth Shank Nails, 2 in. and 2.375 in. long
Laboratory #1-A 6 in. / 12 in. New - Five laboratory fabricated panel tested statically
Laboratory #1-B 6 in. / 12 in. New - Ten lab-built panels tested statically to have similar sample size as other lab-built panels
Port Orange #2 6 in. / 12 in. 28 yrs B-2 Four harvested panels tested statically in EC (3) and RC (1)
Bartow #3 6 in. / 12 in. 32 yrs A-1 Four harvested panels tested statically in EC (2) and RC (2)
Bartow #4 3 in. / 6 in. 32 yrs A-1 Three harvested panels tested statically in EC (1) and RC (2)
Bartow #5 4 in. / 4 in. 32 yrs A-1 Two harvested panels tested statically in EC (1) and RC (1)
Port Orange #3 6 in. / 12 in. - A-1 Three harvested panels tested statically in EC (2) and RC (1)
Port Orange #4 3 in. / 6 in. - - Two harvested panels tested statically in EC (2)
Port Orange #5 8 in. / 8 in. - - Two harvested panels tested statically in EC (2)
Port Orange #6 6 in. / 12 in. - - Two harvested panels tested statically in EC (2)
Laboratory #2-A 6 in. / 12 in. New - Ten laboratory fabricated panels tested statically (5) and dynamically (5) in EC
Laboratory #2-B 6 in. / 12 in. New A-2 Four laboratory fabricated panels tested statically (2) and dynamically (2) in RC
Laboratory #2-C 6 in. / 6 in. New - Ten laboratory fabricated panels tested statically (5) and dynamically (5) in EC Notes: EC = existing condition, RC = retrofit condition; Retrofit Methods A-1. 8d ring shank nail @ 6 in. / 12 in. spacing, A-2. 8d ring shank nails installed between an existing fastener spacing of 6 in. / 12 in., B-1. fillet of spray applied polyurethane adhesive, B-2. 3 in. thick layer of spray applied polyurethane adhesive
130

131
Table A-1. Continued
Panel Series Fastener Schedule
Dates of Testing
Retrofit Type Description
8d (0.131 in. diameter) Smooth Shank Nails, 2.5 in. long
Laboratory #3-A 6 in. / 12 in. New - Fifteen laboratory fabricated panels tested statically in EC
Laboratory #3-B 6 in. / 8 in. New - Fifteen laboratory fabricated panels tested statically in EC
Laboratory #3-C 6 in. / 6 in. New - Fifteen laboratory fabricated panels tested statically in EC
Crystal River #1 6 in. / 12 in. 35 yrs A-1 Four harvested panel tested statically in EC (2) and RC (2)
8d (0.113 in. diameter) Ring Shank Nails, 2.5 in. long
Laboratory #4-A 6 in. / 12 in. New - Ten laboratory fabricated panels tested statically in EC, for comparison with B and C
Laboratory #4-B 6 in. / 12 in. New B-1 Ten laboratory fabricated panels tested statically in RC
Laboratory #4-C 6 in. / 12 in. New B-2 Ten laboratory fabricated panels tested statically in RC
Laboratory #5-A 6 in. / 12 in. New - Fifteen laboratory fabricated panels tested statically in EC
Laboratory #5-B 6 in. / 8 in. New - Fifteen laboratory fabricated panels tested statically in EC
Laboratory #5-C 6 in. / 6 in. New - Fifteen laboratory fabricated panels tested statically in EC Notes: EC = existing condition, RC = retrofit condition; Retrofit Methods A-1. 8d ring shank nail @ 6 in. / 12 in. spacing, A-2. 8d ring shank nails installed between an existing fastener spacing of 6 in. / 12 in., B-1. fillet of spray applied polyurethane adhesive, B-2. 3 in. thick layer of spray applied polyurethane adhesive

Table A-2. Full uplift test results of panels fastened with 1.5 in. staples
Panel Description Age Specific Gravity
Moisture Content
Existing Fastener
Retrofit Fastener Sheathing Static
Loading Dynamic Loading
Failure mode
Peak Uplift (psf)
10-sec. Mean Uplift (psf) Size Spacing Type Spacing
Port
Ora
nge
#1
1.5 in. Staple-1 - - -
1.5
in.
3 in
. / 6
in.
- -
1/2
in. P
ly
X - - 137 -
1.5 in. Staple-2 - - - - - X - - 132 -
1.5 in. Staple-3 - - - - - X - - 117 -
1.5 in. Staple-4 - - - - - X - - 93 -
1.5 in. Staple-5 - - -
8d
RS
6 in
. / 1
2 in
.
X - - 221 -
1.5 in. Staple-6 - - - X - - 319 -
Deb
ary
#1
1.5 in. Staple-7
15
yrs
0.56 8%
1.5
in. (
14 g
auge
)
4 in
. / 4
in
.
- -
7/16
in. O
SB
X - W 93 76
1.5 in. Staple-8 0.64 9% - - X - W 93 76
1.5 in. Staple-9
15 y
rs
0.56 10%
4 in
. / 4
in.
- - - X W 93 57
1.5 in. Staple-10 0.55 9% - - - X PT 61 33
1.5 in. Staple-11 0.54 9% - - - X W 52 25
1.5 in. Staple-12 0.58 9% - - - X W 82 42
1.5 in. Staple-13
15
yrs
0.61 10% 4
in.
/ 4
in. 8d
RS 6 in. / 12 in.
X - PT 168 152
1.5 in. Staple-14 0.56 9% X - W 169 152
1.5 in. Staple-15
15
yrs
0.62 9%
4 in
. / 4
in
. 8d RS
6 in. / 12 in.
- X PT 150 90
1.5 in. Staple-16 0.52 9% - X PT 102 57
Notes: Dominant failure mode described by W = withdrawal, PT = pull-through, E = even and RS = ring shank nail
132

Table A-3. Full uplift test results of panels fastened with 2.5 in. staples
Panel Description Age Specific
Gravity Moisture Content
Existing Fastener Retrofit Fastener
Sheathing Static Loading
Dynamic Loading
Failure mode
Peak Uplift (psf)
10-sec. Mean Uplift (psf) Size Spacing Type Spacing
Bar
tow
#
1 2.5 in. Staple-1 - - -
2.5
in.
3 in
. / 6
in
.
- -
1/2
in.
Ply
X - - 66 - 2.5 in. Staple-2 - - - - - X - - 97 -
Bar
tow
# 2
2.5 in. Staple-3 - - -
2.5
in.
6 in
. / 1
2 in
. - -
1/2
in. P
ly X - - 30 -
2.5 in. Staple-4 - - - - - X - - 39 - 2.5 in. Staple-5 - - -
8d RS 6 in. / 12 in.
X - - 165 - 2.5 in. Staple-6 - - - X - - 169 -
Notes: Dominant failure mode described by W = withdrawal, PT = pull-through, E = even and RS = ring shank nail
133

Table A-4. Full uplift test results of panels fastened with 6d smooth shank nails
Panel Description Age Specific
Gravity Moisture Content
Existing Fastener
Retrofit Fastener Sheathing Static
Loading Dynamic Loading
Failure mode
Peak Uplift (psf)
10-sec. Mean Uplift (psf) Size Spacing Type Spacing
Labo
rato
ry #
1-A
6d SS-1
New
- -
2.37
5 in
. (0.
113
in.)
6 in
. / 1
2 in
.
- -
1/2
in. O
SB
X - - 75 -
6d SS-2 - - - - X - - 105 -
6d SS-3 - - - - X - - 71 -
6d SS-4 - - - - X - - 76 -
6d SS-5 - - - - X - - 47 -
Labo
rato
ry #
1-B
6d SS-6
New
- - - - X - W 62 -
6d SS-7 - - - - X - W 59 -
6d SS-8 - - - - X - W 96 -
6d SS-9 - - - - X - W 69 -
6d SS-10 - - - - X - W 79 -
6d SS-11 - - - - X - W 87 -
6d SS-12 - - - - X - W 95 -
6d SS-13 - - - - X - W 57 -
6d SS -14 - - - - X - W 59 -
6d SS-15 - - - - X - W 76 -
Notes: Dominant failure mode described by W = withdrawal, PT = pull-through, E = even ; RS = ring shank nail and SS = smooth shank nail
134

Table A-4. Continued
Panel Description Age Specific
Gravity Moisture Content
Existing Fastener Retrofit Fastener
Sheathing Static Loading
Dynamic Loading
Failure mode
Peak Uplift (psf)
10-sec. Mean Uplift (psf) Size Spacing Type Spacing
Port
Ora
nge
#2
6d SS-16
28 y
rs
- -
2 in
. (0.
113
in.)
6 in
. / 1
2 in
. - -
1/2
in. P
ly X - - 134 -
6d SS-17 - - - - X - - 98 -
6d SS-18 - - - - X - - 74 -
6d SS-19 - - ccSPF Full (3 in.) X - - 250 -
Bar
tow
#3 6d SS-20
32 y
rs
- -
2 in
. (0.
113
in.)
6 in
. / 1
2 in
. - -
1/2
in. P
ly X - - 53 -
6d SS-21 - - - - X - - 132 -
6d SS-22 - - 8d RS 6 in. / 12 in.
X - - 229 -
6d SS-23 - - X - - 206 -
Bar
tow
#4 6d SS-24
32 y
rs - -
2 in
. (0
.113
in
.)
3 in
. / 6
in
.
- -
1/2
in.
Ply
X - - 117 -
6d SS-25 - - 8d RS 6 in. / 12 in.
X - - 136 -
6d SS-26 - - X - - 202 -
Bar
tow
#5
6d SS-27
32
yrs - -
2 in
. (0
.11
3 in
.) 4
in.
/ 4
in. - -
1/2 in.
Ply X - - 149 -
6d SS-28 - - 8d RS 6 in. / 12 in. X - - 197 -
Port
Ora
nge
#3
6d SS-29 - - -
2 in
. (0
.113
in
.)
6 in
. / 1
2 in
.
- -
1/2
in.
Ply
X - - 46 -
6d SS-30 - - - - - X - - 31 -
6d SS-31 - - - 8d RS 6 in. / 12 in. X - - 140 -
Notes: Dominant failure mode described by W = withdrawal, PT = pull-through, E = even, RS = ring shank nail and SS = smooth shank nail
135

Table A-4. Continued
Panel Description Age Specific
Gravity Moisture Content
Existing Fastener
Retrofit Fastener Sheathing Static
Loading Dynamic Loading
Failure mode
Peak Uplift (psf)
10-sec. Mean Uplift (psf) Size Spacing Type Spacing
Port
Ora
nge
#4 6d SS-32 - - -
2 in
. (0.
113
in.) 3
in.
/ 6
in. - -
1/2
in. P
ly
X - - 62 -
6d SS-33 - - - - - X - - 64 -
Port
Ora
nge
#5 6d SS-34 - - -
8 in
. / 8
in
. - - X - - 83 -
6d SS-35 - - - - - X - - 62 -
Port
Ora
nge
#6 6d SS-36 - - -
6 in
. / 1
2 in
. - - X - - 59 -
6d SS-37 - - - - - X - - 90 -
Labo
rato
ry #
2-A
6d SS-38
New
0.48 -
2 in
. (0.
113
in.)
6 in
. / 1
2 in
.
- -
1/2
in. O
SB
X - W 47 32
6d SS-39 0.49 - - - X - W 73 61
6d SS-40 0.44 - - - X - W 58 46
6d SS-41 0.44 - - - X - W 65 60
6d SS-42 0.51 - - - X - W 65 46
6d SS -43
New
0.50 - 2
in. (
0.11
3 in
.)
6 in
. / 1
2 in
.
- -
1/2
in. O
SB
- X W 35 23
6d SS-44 0.56 - - - - X W 51 32
6d SS-45 0.52 - - - - X W 51 29
6d SS-46 0.51 - - - - X W 58 32
6d SS-47 0.54 - - - - X W 66 40
Notes: Dominant failure mode described by W = withdrawal, PT = pull-through, E = even, RS = ring shank nail and SS = smooth shank nail
136

Table A-4. Continued
Panel Description Age Specific
Gravity Moisture Content
Existing Fastener Retrofit Fastener Sheathing Static
Loading Dynamic Loading
Failure mode
Peak Uplift (psf)
10-sec. Mean Uplift (psf) Size Spacing Type Spacing
Labo
rato
ry #
2-B
6d SS-48
New
0.49 -
2 in
.
(0
.113
in.)
6 in
. / 1
2 in
. 8d RS
6 in. / 12 in.
1/2
in. O
SB X - W 199 186
6d SS-49 0.44 - X - W 167 150
6d SS-50 0.55 - 8d RS
6 in. / 12 in.
- X W 164 99
6d SS-51 0.54 - - X W 171 100
Labo
rato
ry #
2-C
6d SS-52
New
0.50 -
2 in
. (0.
113
in.)
6 in
. / 6
in.
- -
1/2
in. O
SB
X - PT 64 47
6d SS-53 0.58 - - - X - W 106 90
6d SS-54 0.47 - - - X - W 135 120
6d SS-55 0.57 - - - X - W 91 77
6d SS-56 0.47 - - - X - W 134 120
6d SS-57 0.56 - - - - X W 44 27
6d SS-58 0.58 - - - - X W 103 62
6d SS-59 0.56 - - - - X W 105 62
6d SS-60 0.54 - - - - X W 72 43
6d SS-61 0.48 - - - - X W 124 70
Notes: Dominant failure mode described by W = withdrawal, PT = pull-through, E = even, RS = ring shank nail and SS = smooth shank nail
137
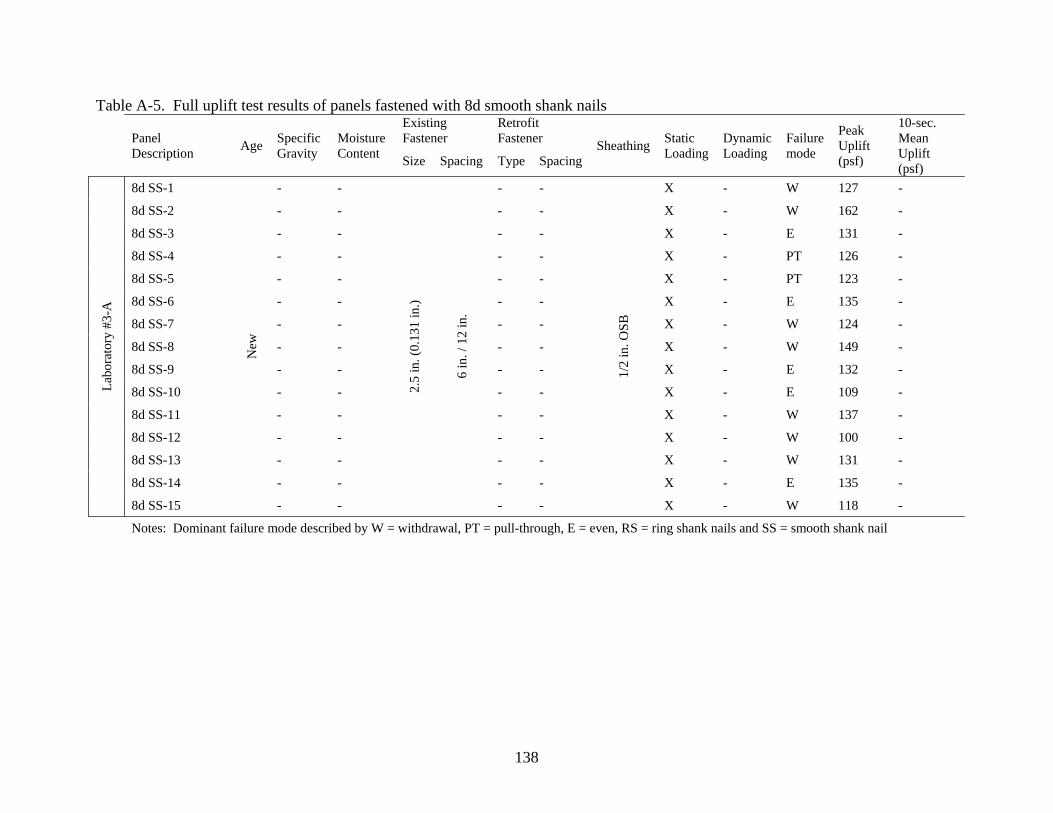
Table A-5. Full uplift test results of panels fastened with 8d smooth shank nails
Panel Description Age Specific
Gravity Moisture Content
Existing Fastener
Retrofit Fastener Sheathing Static
Loading Dynamic Loading
Failure mode
Peak Uplift (psf)
10-sec. Mean Uplift (psf) Size Spacing Type Spacing
Labo
rato
ry #
3-A
8d SS-1
New
- -
2.5
in. (
0.13
1 in
.)
6 in
. / 1
2 in
.
- -
1/2
in. O
SB
X - W 127 -
8d SS-2 - - - - X - W 162 -
8d SS-3 - - - - X - E 131 -
8d SS-4 - - - - X - PT 126 -
8d SS-5 - - - - X - PT 123 -
8d SS-6 - - - - X - E 135 -
8d SS-7 - - - - X - W 124 -
8d SS-8 - - - - X - W 149 -
8d SS-9 - - - - X - E 132 -
8d SS-10 - - - - X - E 109 -
8d SS-11 - - - - X - W 137 -
8d SS-12 - - - - X - W 100 -
8d SS-13 - - - - X - W 131 -
8d SS-14 - - - - X - E 135 -
8d SS-15 - - - - X - W 118 -
Notes: Dominant failure mode described by W = withdrawal, PT = pull-through, E = even, RS = ring shank nails and SS = smooth shank nail
138

Table A-5. Continued
Panel Description Age Specific
Gravity Moisture Content
Existing Fastener Retrofit Fastener
Sheathing Static Loading
Dynamic Loading
Failure mode
Peak Uplift (psf)
10-sec. Mean Uplift (psf) Size Spacing Type Spacing
Labo
rato
ry #
3-B
8d SS-16
New
- -
2.5
in. (
0.13
1 in
.)
6 in
. / 8
in.
- -
1/2
in. O
SB
X - PT 151 -
8d SS-17 - - - - X - PT 180 -
8d SS-18 - - - - X - E 178 -
8d SS-19 - - - - X - PT 183 -
8d SS-20 - - - - X - W 167 -
8d SS-21 - - - - X - W 160 -
8d SS-22 - - - - X - W 180 -
8d SS-23 - - - - X - PT 192 -
8d SS-24 - - - - X - W 145 -
8d SS-25 - - - - X - W 221 -
8d SS-26 - - - - X - W 172 -
8d SS-27 - - - - X - PT 151 -
8d SS-28 - - - - X - W 168 -
8d SS-29 - - - - X - W 178 -
8d SS-30 - - - - X - PT 202 -
Notes: Dominant failure mode described by W = withdrawal, PT = pull-through, E = even, RS = ring shank nail and SS = smooth shank nail
139

Table A-5. Continued
Panel Description Age Specific
Gravity Moisture Content
Existing Fastener Retrofit Spacing
Sheathing Static Loading
Dynamic Loading
Failure mode
Peak Uplift (psf)
10-sec. Mean Uplift (psf) Size Type Type Spacing
Labo
rato
ry #
3-C
8d SS-31
New
- -
2.5
in. (
0.13
1 in
.)
6 in
. / 6
in.
- -
1/2
in. O
SB
X - W 189 -
8d SS-32 - - - - X - W 163 -
8d SS-33 - - - - X - W 239 -
8d SS-34 - - - - X - W 176 -
8d SS-35 - - - - X - PT 233 -
8d SS-36 - - - - X - W 196 -
8d SS-37 - - - - X - W 222 -
8d SS-38 - - - - X - W 194 -
8d SS-39 - - - - X - W 195 -
8d SS-40 - - - - X - W 209 -
8d SS-41 - - - - X - W 226 -
8d SS-42 - - - - X - W 224 -
8d SS-43 - - - - X - W 207 -
8d SS-44 - - - - X - PT 214 -
8d SS-45 - - - - X - PT 193 -
Notes: Dominant failure mode described by W = withdrawal, PT = pull-through, E = even, RS = ring shank nail and SS = smooth shank nail
140
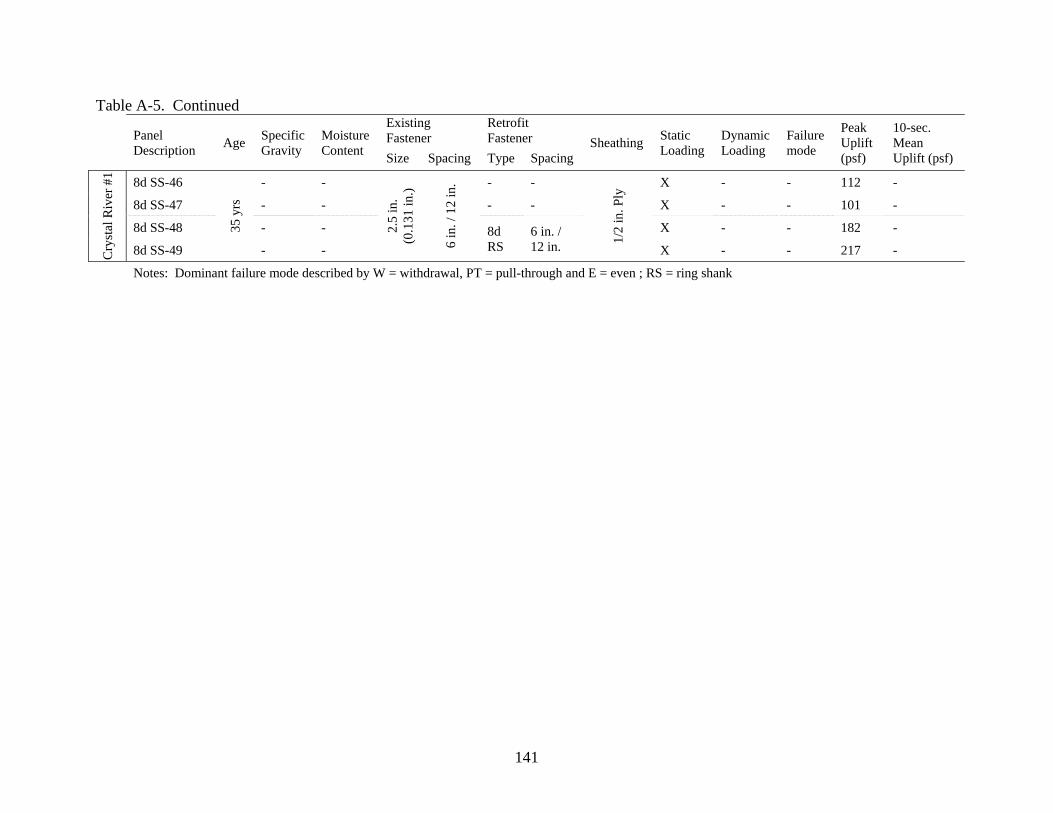
Table A-5. Continued
Panel Description Age Specific
Gravity Moisture Content
Existing Fastener
Retrofit Fastener Sheathing Static
Loading Dynamic Loading
Failure mode
Peak Uplift (psf)
10-sec. Mean Uplift (psf) Size Spacing Type Spacing
Cry
stal
Riv
er #
1 8d SS-46
35 y
rs
- -
2.5
in.
(0.1
31 in
.)
6 in
. / 1
2 in
. - -
1/2
in. P
ly X - - 112 -
8d SS-47 - - - - X - - 101 -
8d SS-48 - - 8d RS
6 in. / 12 in.
X - - 182 -
8d SS-49 - - X - - 217 -
Notes: Dominant failure mode described by W = withdrawal, PT = pull-through and E = even ; RS = ring shank
141

Table A-6. Full uplift test results of panels fastened with 8d ring shank nails
Panel Description Age Specific
Gravity Moisture Content
Existing Fastener Retrofit Fastener Sheathing Static
Loading Dynamic Loading
Failure mode
Peak Uplift (psf)
10-sec. Mean Uplift (psf)
Size Spacing Type Spacing
Labo
rato
ry #
4-A
8d RS-1
New
- -
2.5
in. (
0.11
3 in
.)
6 in
. / 1
2 in
.
- -
1/2
in. O
SB
X - W 115 -
8d RS-2 - - - - X - W 177 -
8d RS-3 - - - - X - E 144 -
8d RS-4 - - - - X - PT 164 -
8d RS -5 - - - - X - W 123 -
8d RS-6 - - - - X - W 168 -
8d RS -7 - - - - X - PT 153 -
8d RS-8 - - - - X - PT 210 -
8d RS-9 - - - - X - PT 174 -
8d RS-10 - - - - X - PT 182 -
Notes: Dominant failure mode described by W = withdrawal, PT = pull-through, E = even, RS = ring shank nail and SS = smooth shank
142
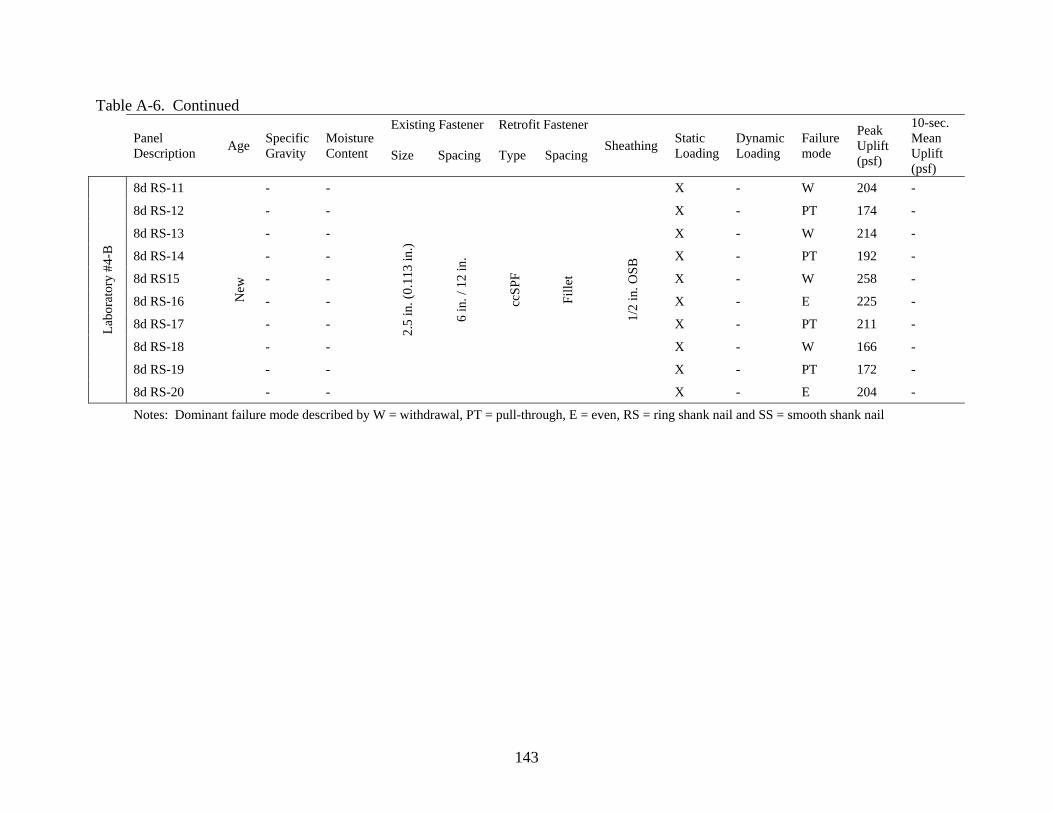
Table A-6. Continued
Panel Description Age Specific
Gravity Moisture Content
Existing Fastener Retrofit Fastener Sheathing Static
Loading Dynamic Loading
Failure mode
Peak Uplift (psf)
10-sec. Mean Uplift (psf)
Size Spacing Type Spacing
Labo
rato
ry #
4-B
8d RS-11
New
- -
2.5
in. (
0.11
3 in
.)
6 in
. / 1
2 in
.
ccSP
F
Fille
t
1/2
in. O
SB
X - W 204 -
8d RS-12 - - X - PT 174 -
8d RS-13 - - X - W 214 -
8d RS-14 - - X - PT 192 -
8d RS15 - - X - W 258 -
8d RS-16 - - X - E 225 -
8d RS-17 - - X - PT 211 -
8d RS-18 - - X - W 166 -
8d RS-19 - - X - PT 172 -
8d RS-20 - - X - E 204 -
Notes: Dominant failure mode described by W = withdrawal, PT = pull-through, E = even, RS = ring shank nail and SS = smooth shank nail
143

Table A-6. Continued
Panel Description Age Specific
Gravity Moisture Content
Existing Fastener Retrofit Fastener
Sheathing Static Loading
Dynamic Loading
Failure mode
Peak Uplift (psf)
10-sec. Mean Uplift (psf) Size Spacing Type Spacing
Labo
rato
ry #
4-C
8d RS-21 N
ew
- -
2.5
in. (
0.11
3 in
.)
6 in
. / 1
2 in
.
ccSP
F
Full
(3 in
.)
1/2
in. O
SB
X - E 210 -
8d RS-22 - - X - PT 241 -
8d RS-23 - - X - PT 273 -
8d RS-24 - - X - W 202 -
8d RS-25 - - X - W 151 -
8d RS-26 - - X - E 175 -
8d RS-27 - - X - PT 196 -
8d RS-28 - - X - E 165 -
8d RS-29 - - X - PT 245 -
8d RS-30 - - X - W 231 -
Notes: Dominant failure mode described by W = withdrawal, PT = pull-through, E = even, RS = ring shank nail and SS = smooth shank nail
144

Table A-6. Continued
Panel Description Age Specific
Gravity Moisture Content
Existing Fastener
Retrofit Fastener Sheathing Static
Loading Dynamic Loading
Failure mode
Peak Uplift (psf)
10-sec. Mean Uplift (psf) Size Spacing Type Spacing
Labo
rato
ry #
5-A
8d RS-59
New
- -
2.5
in. (
0.11
3 in
.)
6 in
. / 1
2 in
.
- -
1/2
in. O
SB
X - W 186 -
8d RS-60 - - - - X - W 151 -
8d RS-61 - - - - X - W 115 -
8d RS-62 - - - - X - PT 151 -
8d RS-63 - - - - X - PT 166 -
8d RS-64 - - - - X - PT 181 -
8d RS-65 - - - - X - PT 188 -
8d RS-66 - - - - X - PT 195 -
8d RS-67 - - - - X - W 199 -
8d RS-68 - - - - X - W 175 -
8d RS-69 - - - - X - W 192 -
8d RS-70 - - - - X - PT 172 -
8d RS-71 - - - - X - PT 198 -
8d RS-72 - - - - X - PT 186 -
8d RS-73 - - - - X - E 161 -
Notes: Dominant failure mode described by W = withdrawal, PT = pull-through, E = even, RS = ring shank nail and SS =smooth shank nail
145

Table A-6. Continued
Panel Description Age Specific
Gravity Moisture Content
Existing Fastener Retrofit Fastener
Sheathing Static Loading
Dynamic Loading
Failure mode
Peak Uplift (psf)
10-sec. Mean Uplift (psf) Size Spacing Type Spacing
Labo
rato
ry #
5-B
8d RS-44
New
- -
2.5
in. (
0.11
3 in
.)
6 in
. / 8
in.
- -
1/2
in. O
SB
X - PT 185 -
8d RS-45 - - - - X - PT 193 -
8d RS-46 - - - - X - PT 247 -
8d RS-47 - - - - X - W 134 -
8d RS-48 - - - - X - PT 239 -
8d RS -49 - - - - X - PT 269 -
8d RS-50 - - - - X - PT 207 -
8d RS-51 - - - - X - PT 211 -
8d RS-52 - - - - X - PT 245 -
8d RS-53 - - - - X - W 224 -
8d RS-54 - - - - X - PT 163 -
8d RS-55 - - - - X - PT 237 -
8d RS-56 - - - - X - W 222 -
8d RS-57 - - - - X - PT 219 -
8d RS-58 - - - - X - PT 247 -
Notes: Dominant failure mode described by W = withdrawal, PT = pull-through, E = even, RS = ring shank nail and SS = smooth shank nail
146

147
Table A-6. Continued
Panel Description Age Specific
Gravity Moisture Content
Existing Fastener Retrofit Fastener Sheathing Static
Loading Dynamic Loading
Failure mode
Peak Uplift (psf)
10-sec. Mean Uplift (psf)
Size Spacing Type Spacing
Labo
rato
ry #
5-C
8d RS-31
New
- -
2.5
in. (
0.11
3 in
. )
6 in
. / 6
in.
- -
1/2
in. O
SB
X - PT 241 -
8d RS-32 - - - - X - PT 268 -
8d RS-33 - - - - X - PT 239 -
8d RS-34 - - - - X - PT 253 -
8d RS-35 - - - - X - PT 284 -
8d RS-36 - - - - X - PT 253 -
8d RS-37 - - - - X - PT 254 -
8d RS-38 - - - - X - PT 241 -
8d RS-39 - - - - X - PT 255 -
8d RS-40 - - - - X - PT 248 -
8d RS-41 - - - - X - PT 221 -
8d RS-42 - - - - X - PT 239 -
8d RS-43 - - - - X - PT 286 -
Notes: Dominant failure mode described by W = withdrawal, PT = pull-through and E = even ; RS = ring shank
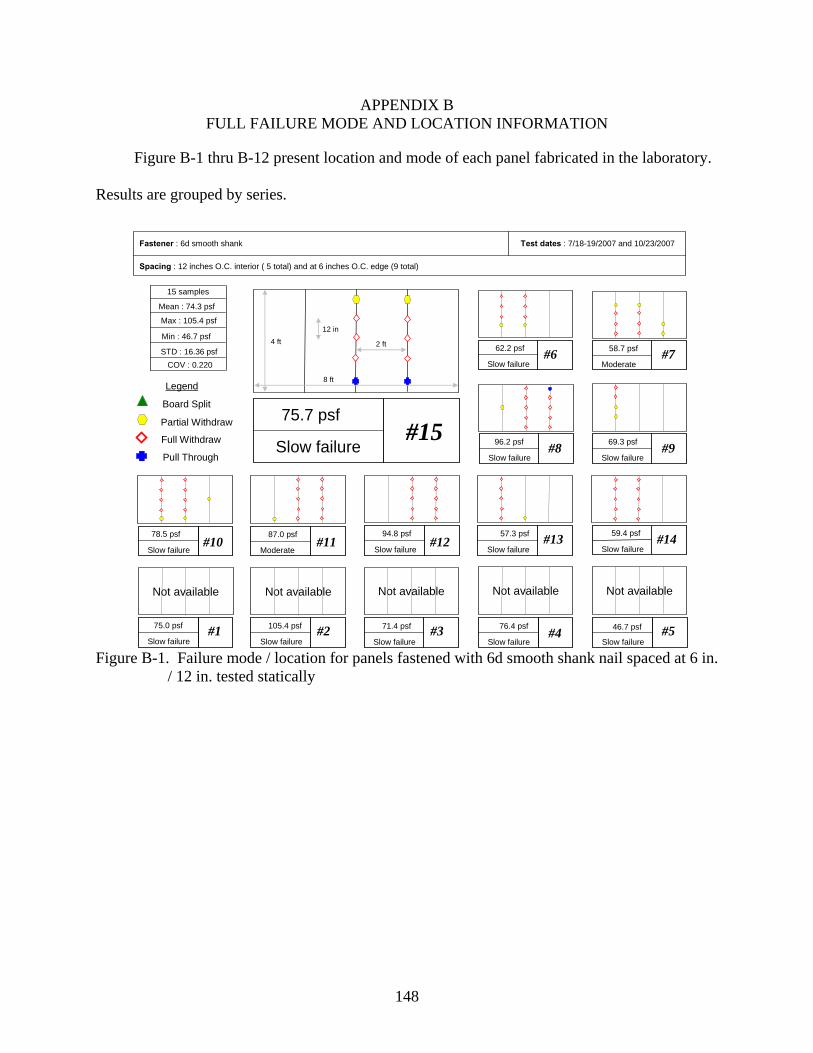
APPENDIX B FULL FAILURE MODE AND LOCATION INFORMATION
Figure B-1 thru B-12 present location and mode of each panel fabricated in the laboratory.
Results are grouped by series.
75.7 psf
Slow failure#15
62.2 psf
Slow failure#6 58.7 psf
Moderate#7
96.2 psf
Slow failure#8
94.8 psf
Slow failure#12
87.0 psf
Moderate#11
78.5 psf
Slow failure#10
69.3 psf
Slow failure#9
Not available
105.4 psf
Slow failure#2
Not available
75.0 psf
Slow failure#1
59.4 psf
Slow failure#1457.3 psf
Slow failure#13
Not available
46.7 psf
Slow failure#5
Not available
76.4 psf
Slow failure#4
Not available
71.4 psf
Slow failure#3
Test dates : 7/18-19/2007 and 10/23/2007
Spacing : 12 inches O.C. interior ( 5 total) and at 6 inches O.C. edge (9 total)
Board Split
Partial Withdraw
Pull Through
Full Withdraw
Legend
12 in
2 ft
8 ft
4 ft
15 samples
Mean : 74.3 psf
Max : 105.4 psf
Min : 46.7 psf
STD : 16.36 psfCOV : 0.220
Fastener : 6d smooth shank
Figure B-1. Failure mode / location for panels fastened with 6d smooth shank nail spaced at 6 in.
/ 12 in. tested statically
148

126.8 psf
Slow failure#1028d-c-06
12 in
2 ft
8 ft
4 ft
46.5 psf
6 in. / 12 in.#38
162.1 psf
Slow failure#1058d-c-06
162.1 psf
Slow failure#1058d-c-06
73 psf
6 in. / 12 in.#39
2 ft
8 ft
4 ft
2 samples
Mean : 182.8 psf
Max : 199 psf
Min : 167 psf
LegendLegend
Board Split
Partial Withdraw
Pull Through
Full Withdraw
Board Split
Partial Withdraw
Pull Through
Full Withdraw
Nail-head Failure
162.1 psf
Slow failure#1058d-c-06
162.1 psf
Slow failure#1058d-c-06
58 psf
6 in. / 12 in.#40
162.1 psf
Slow failure#1058d-c-06
162.1 psf
Slow failure#1058d-c-06
65 psf
6 in. / 12 in.#41 162.1 psf
Slow failure#1058d-c-06
162.1 psf
Slow failure#1058d-c-06
65 psf
6 in. / 12 in.#42
162.1 psf
Slow failure#1058d-c-06
162.1 psf
Slow failure#1058d-c-06
167 psf
6 in. / 12 in. ret.#49
162.1 psf
Slow failure#1058d-c-06
162.1 psf
Slow failure#1058d-c-06
63.9 psf
6 in. / 6 in.#52
162.1 psf
Slow failure#1058d-c-06
162.1 psf
Slow failure#1058d-c-06
198.6 psf
6 in. / 12 in. ret.#48
162.1 psf
Slow failure#1058d-c-06
162.1 psf
Slow failure#1058d-c-06
106 psf
6 in. / 6 in.#53
162.1 psf
Slow failure#1058d-c-06
162.1 psf
Slow failure#1058d-c-06
135 psf
6 in. / 6 in.#54
Test dates : 3/13/2009 to 3/25/2009
Spacing : 12 inches O.C. interior ( 5 total) or 6 inches O.C. interior (9 total), and at 6 inches O.C. edge (9 total); one series of 6”/12” retrofitted with A-2
Fastener : 2 in. 6d smooth shank, static vs. dynamic testing statically tested panels
162.1 psf
Slow failure#1058d-c-06
162.1 psf
Slow failure#1058d-c-06
134 psf
6 in. / 6 in.#56
162.1 psf
Slow failure#1058d-c-06
162.1 psf
Slow failure#1058d-c-06
102 psf
6 in. / 6 in.#55
5 samples
Mean : 61.5 psf
Max : 73 psf
Min : 47 psf
STD : 10 psfCOV : 0.16
5 samples
Mean : 108.2 psf
Max : 135 psf
Min : 64 psf
STD : 29 psfCOV : 0.27
6”/12” ret. w/ A-2
6”/6”
6”/12”
Figure B-2. Failure mode / location for panels fastened with 6d smooth shank nail spaced at 6 in.
/ 12 in., 6 in. / 12 in. retrofitted with ret. A-2, and 6 in. / 6 in. tested statically
149

126.8 psf
Slow failure#1028d-c-06
12 in
2 ft
8 ft
4 ft
34.5 psf
6 in. / 12 in.#43
162.1 psf
Slow failure#1058d-c-06
162.1 psf
Slow failure#1058d-c-06
51.2 psf
6 in. / 12 in.#44
2 ft
8 ft
4 ft
2 samples
Mean : 167.2 psf
Max : 171 psf
Min : 164 psf
LegendLegend
Board Split
Partial Withdraw
Pull Through
Full Withdraw
Board Split
Partial Withdraw
Pull Through
Full Withdraw
Nail-head Failure
162.1 psf
Slow failure#1058d-c-06
162.1 psf
Slow failure#1058d-c-06
50.5 psf
6 in. / 12 in.#45
162.1 psf
Slow failure#1058d-c-06
162.1 psf
Slow failure#1058d-c-06
58 psf
6 in. / 12 in.#46 162.1 psf
Slow failure#1058d-c-06
162.1 psf
Slow failure#1058d-c-06
66 psf
6 in. / 12 in.#47
162.1 psf
Slow failure#1058d-c-06
162.1 psf
Slow failure#1058d-c-06
170.7 psf
6 in. / 12 in. ret.#51
162.1 psf
Slow failure#1058d-c-06
162.1 psf
Slow failure#1058d-c-06
44.4 psf
6 in. / 6 in.#57
162.1 psf
Slow failure#1058d-c-06
162.1 psf
Slow failure#1058d-c-06
163.7 psf
6 in. / 12 in. ret.#50
162.1 psf
Slow failure#1058d-c-06
162.1 psf
Slow failure#1058d-c-06
102.8 psf
6 in. / 6 in.#58
162.1 psf
Slow failure#1058d-c-06
162.1 psf
Slow failure#1058d-c-06
104.6 psf
6 in. / 6 in.#59
Test dates : 3/13/2009 to 3/25/2009
Spacing : 12 inches O.C. interior ( 5 total) or 6 inches O.C. interior (9 total), and at 6 inches O.C. edge (9 total); one series of 6”/12” retrofitted with A-2
Fastener : 2 in. 6d smooth shank, static vs. dynamic testing dynamically tested panels
162.1 psf
Slow failure#1058d-c-06
162.1 psf
Slow failure#1058d-c-06
124 psf
6 in. / 6 in.#61
162.1 psf
Slow failure#1058d-c-06
162.1 psf
Slow failure#1058d-c-06
72.5 psf
6 in. / 6 in.#60
5 samples
Mean : 52 psf
Max : 66 psf
Min : 35 psf
STD : 12 psfCOV : 0.22
5 samples
Mean : 89.6 psf
Max : 124 psf
Min : 44 psf
STD : 31 psfCOV : 0.35
6”/12” ret. w/ A-2
6”/6”
6”/12”
Figure B-3. Failure mode / location for panels fastened with 6d smooth shank nail spaced at 6 in.
/ 12 in., 6 in. / 12 in. retrofitted with ret. A-2, and 6 in. / 6 in. tested dynamically
150

126.8 psf
Slow failure#1
162.1 psf
Slow failure#2
131.1 psf
Fast failure#3
126.1 psf
Fast failure#4
149.4 psf
Slow failure#8
124.0 psf
Fast failure#7
135.3 psf
Slow failure#6
123.3 psf
Fast failure#5
100.1 psf
Fast failure#12
137.4 psf
Slow failure#11
109.2 psf
Fast failure#10131.8 psf
Slow failure#9
118.4 psf
Fast failure#15
134.6 psf
Slow failure#14
131.1 psf
Slow failure#13
Board Split
Partial Withdraw
Pull Through
Full Withdraw
Legend
12 in
2 ft
8 ft
4 ft
15 samples
Mean : 129.4 psf
Max : 162.1 psf
Min : 100.1 psf
STD : 14.68 psfCOV : 0.11
Test dates : 1/24/2008 to 1/31/2008
Spacing : 12 inches O.C. interior ( 5 total) and at 6 inches O.C. edge (9 total)
Fastener : 8d smooth shank
Figure B-4. Failure mode / location for panels fastened with 8d smooth shank nail spaced at 6 in.
/ 12 in. tested statically
151

Board Split
Partial Withdraw
Pull Through
Full Withdraw
179.7 psf
Fast failure#17
178.3 psf
Fast failure#18
183.2 psf
Fast failure#19
167.0 psf
Fast failure#20
160.0 psf
Slow failure#21
191.7 psf
Moderate#23179.7 psf
Fast failure#22
150.8 psf
Slow failure#27
171.9 psf
Fast failure#26
220.6 psf
Slow failure#25
144.5 psf
Fast failure#24
168.4 psf
Slow failure#28
201.5 psf
Fast failure#30
178.3 psf
Moderate#29
Legend
150.8 psf
Fast failure#16
8 in4 ft
8 ft
2 ft
15 samples
Mean : 175.1 psf
Max : 220.6 psf
Min : 144.5 psf
STD : 20.07 psfCOV : 0.11
Test dates : 1/24/2008 to 1/31/2008
Spacing : 8 inches O.C. interior ( 7 total) and at 6 inches O.C. edge (9 total)
Fastener : 8d smooth shank
Figure B-5. Failure mode / location for panels fastened with 8d smooth shank nails spaced at 6
in. / 8 in. tested statically
152

Board Split
Partial Withdraw
Pull Through
Full Withdraw
195.2 psf
Moderate#39
193.8 psf
Fast failure#38
222.1 psf
Fast failure#37
195.9 psf
Moderate#36
232.7 psf
Fast failure#35
239.1 psf
Fast failure#33176.1 psf
Fast failure#34
213.6 psf
Moderate#44
193.1 psf
Fast failure#45
188.8 psf
Fast failure#31
163.4 psf
Moderate#32
207.2 psf
Fast failure#43
226.3 psf
Fast failure#41
223.5 psf
Fast failure#42
Legend
208.6 psf
Fast failure#40
8 in4 ft
8 ft
2 ft
15 samples
Mean : 205.3 psf
Max : 239.1 psf
Min : 163.4 psf
STD : 21.35 psfCOV : 0.104
Test dates : 10/22/2007 and 10/25/2007
Spacing : 6 inches O.C. interior ( 9 total) and at 6 inches O.C. edge (9 total)
Fastener : 8d smooth shank
Figure B-6. Failure mode / location for panels fastened with 8d smooth shank spaced at 6 in. / 6
in. tested statically
153

126.8 psf
Slow failure#1028d-c-06
12 in
2 ft
8 ft
4 ft
115 psf
Slow failure#1
162.1 psf
Slow failure#1058d-c-06
162.1 psf
Slow failure#1058d-c-06
177 psf
Sudden failure#2
12 in
2 ft
8 ft
4 ft
10 samples
Mean : 161 psf
Max : 210 psf
Min : 115 psf
STD : 28.36 psfCOV : 0.176
LegendLegend
Board Split
Partial Withdraw
Pull Through
Full Withdraw
Board Split
Partial Withdraw
Pull Through
Full Withdraw
Nail-head Failure
162.1 psf
Slow failure#1058d-c-06
162.1 psf
Slow failure#1058d-c-06
144 psf
Moderate failure#3
162.1 psf
Slow failure#1058d-c-06
162.1 psf
Slow failure#1058d-c-06
164 psf
Sudden Failure#4 162.1 psf
Slow failure#1058d-c-06
162.1 psf
Slow failure#1058d-c-06
123 psf
Slow failure#5
162.1 psf
Slow failure#1058d-c-06
162.1 psf
Slow failure#1058d-c-06
174 psf
Sudden failure#9
162.1 psf
Slow failure#1058d-c-06
162.1 psf
Slow failure#1058d-c-06
182 psf
Sudden failure#10
162.1 psf
Slow failure#1058d-c-06
162.1 psf
Slow failure#1058d-c-06
210 psf
Sudden failure#8
162.1 psf
Slow failure#1058d-c-06
162.1 psf
Slow failure#1058d-c-06
153 psf
Sudden failure#7
162.1 psf
Slow failure#1058d-c-06
162.1 psf
Slow failure#1058d-c-06
168 psf
Sudden failure#6
Test dates : 5/23/2008 to 6/4/2008
Spacing : 12 inches O.C. interior ( 5 total) and at 6 inches O.C. edge (9 total)
Fastener : 8d ring shank (control for lab ccSPF retrofit testing)
Figure B-7. Failure mode / location for panels fastened with 8d ring shank nails spaced at 6 in. / 12 in. tested statically
154

126.8 psf
Slow failure#1028d-c-06
12 in
2 ft
8 ft
4 ft
225 psf
Sudden failure#16
162.1 psf
Slow failure#1058d-c-06
162.1 psf
Slow failure#1058d-c-06
211 psf
Sudden failure#17
12 in
2 ft
8 ft
4 ft
10 samples
Mean : 202 psf
Max : 258 psf
Min : 166 psf
STD : 27.85 psfCOV : 0.138
LegendLegend
Board Split
Partial Withdraw
Pull Through
Full Withdraw
Board Split
Partial Withdraw
Pull Through
Full Withdraw
Nail-head Failure
162.1 psf
Slow failure#1058d-c-06
162.1 psf
Slow failure#1058d-c-06
166 psf
Slow failure#18
162.1 psf
Slow failure#1058d-c-06
162.1 psf
Slow failure#1058d-c-06
204 psf
Slow Failure#20 162.1 psf
Slow failure#1058d-c-06
162.1 psf
Slow failure#1058d-c-06
172 psf
Slow failure#19
162.1 psf
Slow failure#1058d-c-06
162.1 psf
Slow failure#1058d-c-06
174 psf
Sudden failure#12 162.1 psf
Slow failure#1058d-c-06
162.1 psf
Slow failure#1058d-c-06
204 psf
Sudden failure#11162.1 psf
Slow failure#1058d-c-06
162.1 psf
Slow failure#1058d-c-06
214 psf
Sudden failure#13162.1 psf
Slow failure#1058d-c-06
162.1 psf
Slow failure#1058d-c-06
192 psf
Sudden failure#14162.1 psf
Slow failure#1058d-c-06
162.1 psf
Slow failure#1058d-c-06
258 psf
Moderate failure#15
Test dates : 2/23/2008 to 6/4/2008
Spacing : 12 inches O.C. interior ( 5 total) and at 6 inches O.C. edge (9 total)
Fastener : 8d ring shank retrofitted with 1-1/2 inch fillet of ccSPF
Figure B-8. Failure mode / location for panels fastened with 8d ring shank nails spaced at 6 in. / 12 in. retrofitted with 1-1/2 in. fillet of ccSPF tested statically
155

126.8 psf
Slow failure#1028d-c-06
12 in
2 ft
8 ft
4 ft
273 psf
Sudden failure#23
162.1 psf
Slow failure#1058d-c-06
162.1 psf
Slow failure#1058d-c-06
202 psf
Slow failure#24
12 in
2 ft
8 ft
4 ft
10 samples
Mean : 209 psf
Max : 273 psf
Min : 151 psf
STD : 38.84 psfCOV : 0.186
LegendLegend
Board Split
Partial Withdraw
Pull Through
Full Withdraw
Board Split
Partial Withdraw
Pull Through
Full Withdraw
Nail-head Failure
162.1 psf
Slow failure#1058d-c-06
162.1 psf
Slow failure#1058d-c-06
151 psf
Sudden failure#25
162.1 psf
Slow failure#1058d-c-06
162.1 psf
Slow failure#1058d-c-06
175 psf
Sudden Failure#26 162.1 psf
Slow failure#1058d-c-06
162.1 psf
Slow failure#1058d-c-06
196 psf
Slow failure#27
162.1 psf
Slow failure#1058d-c-06
162.1 psf
Slow failure#1058d-c-06
210 psf
Sudden failure#21
162.1 psf
Slow failure#1058d-c-06
162.1 psf
Slow failure#1058d-c-06
241 psf
Sudden failure#22
162.1 psf
Slow failure#1058d-c-06
162.1 psf
Slow failure#1058d-c-06
245 psf
Slow failure#29
162.1 psf
Slow failure#1058d-c-06
162.1 psf
Slow failure#1058d-c-06
231 psf
Sudden failure#30
162.1 psf
Slow failure#1058d-c-06
162.1 psf
Slow failure#1058d-c-06
165 psf
Sudden failure#28
Test dates : 5/23/2008 to 6/4/2008
Spacing : 12 inches O.C. interior ( 5 total) and at 6 inches O.C. edge (9 total)
Fastener : 8d ring shank retrofitted with full 3 in. thick ccSPF
Figure B-9. Failure mode / location for panels fastened with 8d ring shank nails spaced at 6 in. / 12 in. retrofitted with full 3 in. thick layer of ccSPF tested statically
156

Board Split
Partial Withdraw
Pull Through
Full Withdraw
239.1 psf
Fast failure#42
220.7 psf
Fast failure#41
248.2 psf
Fast failure#40 255.3 psf
Fast failure#39
253.9 psf
Fast failure#37240.5 psf
Fast failure#38
252.5 psf
Moderate#34
284.3 psf
Fast failure#35252.5 psf
Fast failure#36
239.1 psf
Fast failure#33
240.5 psf
Fast failure#31268.1 psf
Fast failure#32
Legend
286.4 psf
Fast failure#43
8 in4 ft
8 ft
2 ft
13 samples
Mean : 252.4 psf
Max : 286.4 psf
Min : 220.7 psf
STD : 18.48 psfCOV : 0.073
Test dates : 10/23/2007 and 10/25/2007
Spacing : 6 inches O.C. interior ( 9 total) and at 6 inches O.C. edge (9 total)
Fastener : 8d ring shank
Figure B-10. Failure mode / location of panels fastened with 8d ring shank nails spaced at 6 in. / 6 in. tested statically
157

184.6 psf
Fast failure #44
193.1 psf
Fast failure#45
133.9 psf
Fast failure#47
246.6 psf
Fast failure#46
211.4 psf
Fast failure#51
206.5 psf
Fast failure#50
269.2 psf
Fast failure#49
238.9 psf
Fast failure#48
236.8 psf
Fast failure#55
162.8 psf
Fast failure#54
224.1 psf
Fast failure#53245.2 psf
Fast failure#52
247.3 psf
Fast failure#58218.5 psf
Fast failure#57222.0 psf
Fast failure#56
Partial Withdraw
Board Split
Pull Through
Full Withdraw
Legend
2 ft
8 ft
8 in
4 ft
15 samples
Mean : 216.1 psf
Max : 269.2 psf
Min : 133.9 psf
STD : 35.72 psfCOV : 0.17
Test dates : 1/24/2008 to 1/31/2008
Spacing : 8 inches O.C. interior ( 7 total) and at 6 inches O.C. edge (9 total)
Fastener : 8d ring shank
Figure B-11. Failure mode / location for panels fastened with 8d ring shank nails spaced at 6 in. / 8 in. tested statically
158

159
186.0 psf
Fast failure#59
195.2 psf
Fast failure#66
192.4 psf
Fast failure#69
Board Split
Partial Withdraw
Pull Through
Full Withdraw
Legend
12 in
2 ft
8 ft
4 ft151.4 psf
Slow failure#60
115.3 psf
Slow failure#61
151.4 psf
Slow failure#62 165.5 psf
Fast failure#63
181.1 psf
Fast failure#64
188.1 psf
Fast failure#65
198.7 psf
Fast failure#67
175.4 psf
Fast failure#68
171.9 psf
Fast failure#70 198.0 psf
Fast failure#71 186.0 psf
Fast failure#72 160.5 psf
Fast failure#73
15 samples
Mean : 174.5 psf
Max : 198.7 psf
Min : 115.3 psf
STD : 22.75 psfCOV : 0.13
Test dates : 2/22/2008 to 2/27/2008
Spacing : 12 inches O.C. interior ( 5 total) and at 6 inches O.C. edge (9 total)
Fastener : 8d ring shank
Figure B-12. Failure mode / location for panels fastened with 8d ring shank nails spaced at 6 in. / 12 in. tested statically

APPENDIX C PANEL CONSTRUCTION OF STATIC VS. DYNAMIC TESTING OF HARVESTED PANELS
2 samples
Mean : 168 psf
Max : 169 psf
Min : 167 psf
Test dates : 5/21/2009 to 5/22/2009
Spacing : 4 inches O.C. interior (13 total) and at 4 inches O.C. edge (13 total); series of retrofitted with A-2
Fastener : 1.5 in. staple tested statically & dynamically, and retrofitted with A-2
4 samples
Mean : 71.9 psf
Max : 93 psf
Min : 52 psf
STD : 19 psfCOV : 0.26
4”/4” Dynamic ret. w/ A-2
4”/4” Dynamic
2 samples
Mean : 93 psf
Max : 93 psf
Min : 93 psf
4”/4” Static
2 samples
Mean : 126 psf
Max : 150 psf
Min : 102 psf
4”/4” Static ret. w/ A-2
12 in
2 ft
8 ft
4 ft 2 ft
8 ft
4 ft
Truss 1 thru 5
Staple 1 thru 13
Figure C-1. Summary of missing fasteners from static vs. dynamic testing, Debary #1 series
Figure C-1 presents results
from observations of occurrences and
locations of missing fasteners taken at
time of harvesting.
160

APPENDIX D FULL SPECIFIC GRAVITY MEASUREMENTS
Table D-1. All specific gravity measurements taken from laboratory fabricated static vs. dynamic uplift testing
# SG # SG # SG # SG
1 0.372 43 0.655 85 0.455 127 0.409 number 168
2 0.429 44 0.601 86 0.585 128 0.468 mean 0.52
3 0.425 45 0.598 87 0.472 129 0.465 St-Dev 0.09
4 0.632 46 0.572 88 0.479 130 0.676 COV 18%
5 0.586 47 0.603 89 0.493 131 0.429
6 0.694 48 0.506 90 0.632 132 0.421
7 0.622 49 0.498 91 0.574 133 0.432
8 0.656 50 0.548 92 0.672 134 0.539
9 0.624 51 0.602 93 0.657 135 0.651
10 0.500 52 0.532 94 0.615 136 0.587
11 0.436 53 0.529 95 0.539 137 0.757
12 0.428 54 0.509 96 0.515 138 0.787
13 0.540 55 0.495 97 0.466 139 0.667
14 0.573 56 0.480 98 0.491 140 0.539
15 0.547 57 0.582 99 0.493 141 0.575
16 0.457 58 0.593 100 0.482 142 0.582
17 0.456 59 0.479 101 0.478 143 0.473
18 0.468 60 0.644 102 0.411 144 0.508
19 0.601 61 0.495 103 0.464 145 0.446
20 0.591 62 0.609 104 0.482 146 0.457
21 0.589 63 0.689 105 0.609 147 0.477
22 0.532 64 0.523 106 0.579 148 0.377
23 0.565 65 0.517 107 0.400 149 0.368
24 0.577 66 0.486 108 0.406 150 0.378
25 0.692 67 0.573 109 0.420 151 0.458
26 0.408 68 0.574 110 0.462 152 0.440
27 0.537 69 0.536 111 0.430 153 0.393
28 0.573 70 0.390 112 0.454 154 0.589
29 0.482 71 0.419 113 0.516 155 0.449
30 0.458 72 0.412 114 0.563 156 0.523
31 0.461 73 0.483 115 0.442 157 0.552
32 0.471 74 0.613 116 0.450 158 0.537
161

Table D-1. Continued # SG # SG # SG # SG
33 0.461 75 0.415 117 0.520 159 0.483
34 0.452 76 0.475 118 0.474 160 0.502
35 0.536 77 0.731 119 0.525 161 0.533
36 0.476 78 0.477 120 0.606 162 0.544
37 0.510 79 0.613 121 0.474 163 0.466
38 0.838 80 0.562 122 0.404 164 0.521
39 0.420 81 0.541 123 0.453 165 0.390
40 0.449 82 0.493 124 0.475 166 0.406
41 0.548 83 0.541 125 0.448 167 0.403
42 0.550 84 0.502 126 0.506
Table D-2. All specific gravity measurements taken from harvested static vs. dynamic uplift testing
# SG # SG # SG # SG
1 0.513 46 0.519 91 0.563 135 0.592 number 178
2 0.562 47 0.590 92 0.709 136 0.570 mean 0.57
3 0.476 48 0.661 93 0.586 137 0.575 St-Dev 0.08
4 0.451 49 0.443 94 0.517 138 0.709 COV 14%
5 0.613 50 0.536 95 0.563 139 0.665
6 0.590 51 0.513 96 0.572 140 0.585
7 0.575 52 0.545 97 0.674 141 0.545
8 0.601 53 0.501 98 0.558 142 0.566
9 0.412 54 0.630 99 0.621 143 0.441
10 0.619 55 0.595 100 0.549 144 0.489
11 0.611 56 0.494 101 0.505 145 0.484
12 0.435 57 0.646 102 0.495 146 0.503
13 0.478 58 0.586 103 0.565 147 0.594
14 0.424 59 0.485 104 0.549 148 0.511
15 0.477 60 0.467 105 0.636 149 0.624
16 0.484 61 0.535 106 0.481 150 0.506
17 0.560 62 0.586 107 0.609 151 0.567
18 0.508 63 0.593 108 0.619 152 0.620
19 0.497 64 0.633 109 0.512 153 0.737
20 0.462 65 0.523 110 0.482 154 0.532
21 0.643 66 0.518 111 0.492 155 0.536
22 0.617 67 0.778 112 0.575 156 0.542
162

Table D-2. Continued # SG # SG # SG # SG
23 0.619 68 0.601 113 0.523 157 0.532
24 0.470 69 0.631 114 0.652 158 0.536
25 0.646 70 0.613 115 0.599 159 0.655
26 0.693 71 0.504 116 0.441 160 0.615
27 0.634 72 0.561 117 0.675 161 0.519
28 0.529 73 0.455 118 0.462 162 0.670
29 0.705 74 0.684 119 0.599 163 0.572
30 0.452 75 0.487 120 0.644 164 0.666
31 0.425 76 0.541 121 0.713 165 0.622
32 0.526 77 0.590 122 0.611 166 0.609
33 0.285 78 0.622 123 0.590 167 0.556
34 0.562 79 0.555 124 0.437 168 0.590
35 0.596 80 0.576 125 0.450 169 0.481
36 0.567 81 0.544 126 0.573 170 0.548
37 0.564 82 0.560 127 0.698 171 0.505
38 0.632 83 0.625 128 0.668 172 0.723
39 0.667 84 0.601 129 0.571 173 0.630
40 0.439 85 0.596 130 0.571 174 0.436
41 0.529 86 0.699 131 0.670 175 0.548
42 0.672 87 0.585 132 0.546 176 0.539
43 0.657 88 0.575 133 0.655 177 0.644
44 0.605 89 0.450 134 0.549 178 0.573
45 0.457 90 0.526
163

APPENDIX E STATIC VS. DYNAMIC PANEL TESTING, TARGET AND ACTUAL PRESSURE TIME-
HISTORIES
• Laboratory Fabricated 6d Smooth Shank at 6 in. / 12 in. Static (5 panels)
0 10 20 30 40 50 600
10
20
30
40
50
Time (sec.)
Pressure (psf)
6/12 Static
Peak Pressure = 47 psf
Failure Pressure = 47 psf
Figure E-1. Summary of pressure time-history for static 6d SS at 6/12 panel (6d SS-38)
0 10 20 30 40 50 60 70‐10
0
10
20
30
40
50
60
70
Time (sec.)
Pressure (psf)
6d SS @ 6 in. / 12 in. Static
Peak Pressure = 58 psf
Failure Pressure = 58 psf
Figure E-2. Summary of pressure time-history for static 6d SS at 6/12 panel (6d SS-40)
164

0 10 20 30 40 50 60 70 80‐10
0
10
20
30
40
50
60
70
80
Time (sec.)
Pressure (psf)
6d SS @ 6 in. / 12 in. Static
Peak Pressure = 64.8 psf @ 61 sec.
Failure Pressure = 63.3 psf @ 70 sec.
Figure E-3. Summary of pressure time-history for static 6d SS at 6/12 panel (6d SS-41)
0 10 20 30 40 50 60 70‐10
0
10
20
30
40
50
60
70
Time (sec.)
Pressure (psf)
6d SS@ 6 in. / 12 in. Static
Peak Pressure = 65 psf
Failure Pressure = 65 psf
Figure E-4. Summary of pressure time-history for static 6d SS at 6/12 panel (6d SS-42)
165
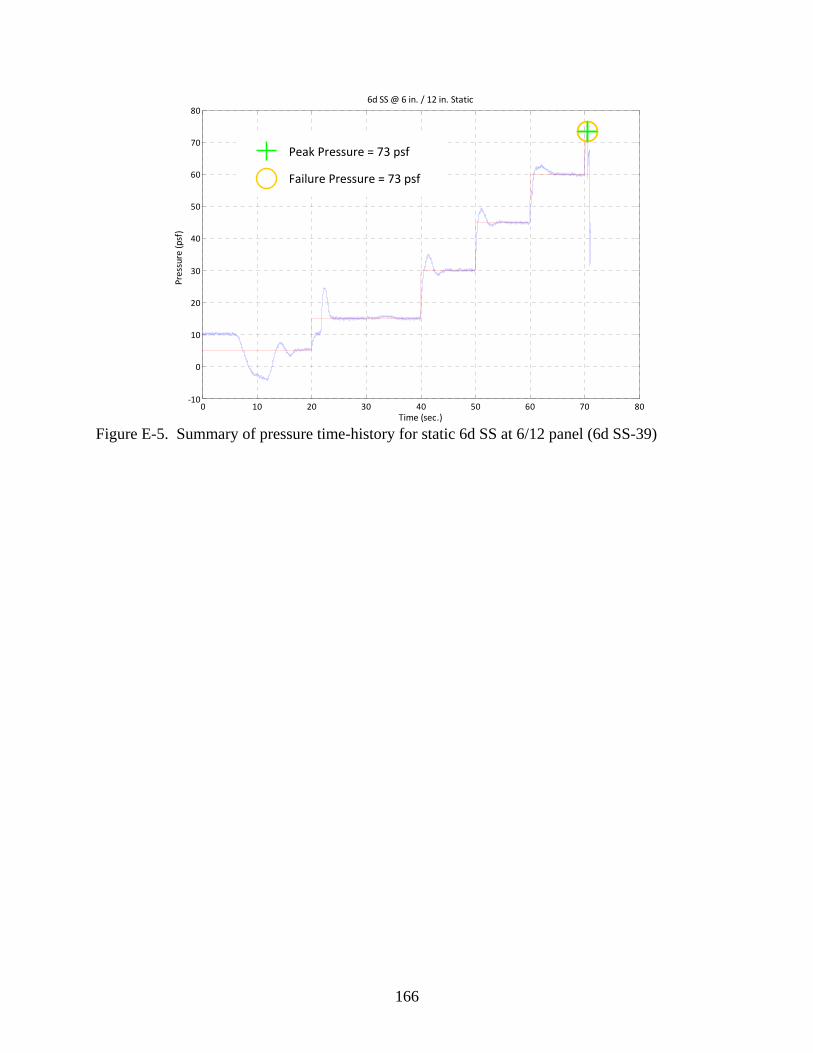
0 10 20 30 40 50 60 70 80‐10
0
10
20
30
40
50
60
70
80
Time (sec.)
Pressure (psf)�
6d SS @ 6 in. / 12 in. Static
Peak Pressure = 73 psf
Failure Pressure = 73 psf
Figure E-5. Summary of pressure time-history for static 6d SS at 6/12 panel (6d SS-39)
166

• Laboratory Fabricated 6d Smooth Shank at 6 in. / 12 in. Dynamic (5 panels) Table E-1. Summary of dynamic pressure trace for 6d SS at 6 in. / 12 in. panels (blue – actual
and red target) Peak 1 Peak 2 Peak 3 Peak Failure Ratio Failure to
Peak 6d SS at 6 in. / 12 in. Dynamic
6d SS-43
34.5 psf @ 52 sec.
33 psf @ 58 sec.
34 psf @ 59 sec.
34.5 psf @ 52 sec.
28 psf @ 60 sec. 0.96 37.7 psf @
52 sec. 38 psf @ 58 sec.
51 psf @ 59 sec.
37.7 psf @ 52 sec.
33 psf @ 60 sec.
6d SS-44
48 psf @ 62 sec.
47 psf @ 67 sec.
51 psf @ 68 sec.
51 psf @ 68 sec.
48 psf @ 72 sec. 0.94 50 psf @ 62
sec. 50 psf @ 67 sec.
65 psf @ 68 sec.
65 psf @ 68 sec.
63 psf @ 72 sec.
6d SS-45
50 psf @ 62 sec.
43 psf @ 66 sec.
46 psf @ 67 sec.
50 psf @ 62 sec.
46 psf @ 67.5 sec. 0.92 50 psf @ 62
sec. 41 psf @ 66 sec.
49 psf @ 67 sec.
50 psf @ 62 sec.
66 psf @ 67.5 sec.
6d SS-46
51 psf @ 62 sec.
51 psf @ 67.5 sec.
46 psf @ 69 sec.
58 psf @ 72 sec.
58 psf @ 72 sec. 1.00 50 psf @ 62
sec. 66 psf @ 67.5 sec.
46 psf @ 69 sec.
63 psf @ 72 sec.
63 psf @ 72 sec.
6d SS-47
60 psf @ 72 sec.
62 psf @ 76.5 sec.
55 psf @ 79.5 sec.
66 psf @ 82 sec.
66 psf @ 82 sec. 1.00 63 psf @ 72
sec. 79 psf @ 76.5 sec.
62 psf @ 79.5 sec.
75 psf @ 82 sec.
75 psf @ 82 sec.
167

0 10 20 30 40 50 60 700
10
20
30
40
50
60
Time (sec.)
Pressure (psf)
6/12 Dynamic
A
50 51 52 53 54 55 56 57 58 59 60 61 62 63 64 65 66 67 68 69 700
10
20
30
40
50
60
70
Time (sec.)
Pressure (psf)
6/12 Dynamic Close‐up of Failure
Peak Pressure = 34.5 psf at 52.4 sec.
Failure Pressure = 33 psf at 60 sec.
P1 P2 P3
B
Figure E-6. Summary of pressure time-histories for dynamic 6d SS at 6/12 panel (6d SS-43) A) full time-history and B) close up of failure
168

0 10 20 30 40 50 60 70 800
10
20
30
40
50
60
70
Time (sec.)
Pressure (psf)
6/12 Dynamic
A
60 62 64 66 68 70 72 74 76 78 800
10
20
30
40
50
60
70
80
Time (sec.)
Pressure (psf)
6/12 Dynamic Close‐up
Peak Pressure = 51 psf at 67.5 sec.
Failure Pressure = 48 psf at 72 sec.
P1 P2 P3
B
Figure E-7. Summary of pressure time-histories for dynamic 6d SS at 6/12 panel (6d SS-44) A) full time-history and B) close up of failure
169
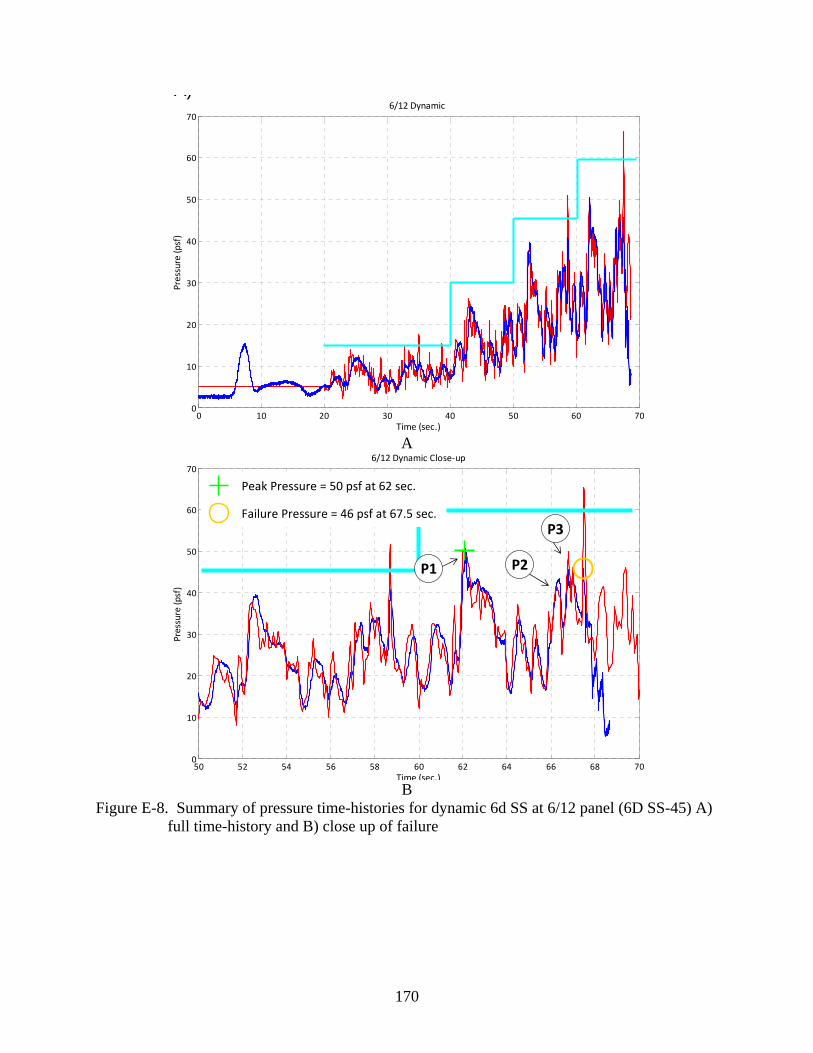
A)
0 10 20 30 40 50 60 700
10
20
30
40
50
60
70
Time (sec.)
Pressure (psf)
6/12 Dynamic
A
50 52 54 56 58 60 62 64 66 68 700
10
20
30
40
50
60
70
Time (sec.)
Pressure (psf)
6/12 Dynamic Close‐up
Peak Pressure = 50 psf at 62 sec.
Failure Pressure = 46 psf at 67.5 sec.
P1 P2
P3
B
Figure E-8. Summary of pressure time-histories for dynamic 6d SS at 6/12 panel (6D SS-45) A) full time-history and B) close up of failure
170

0 10 20 30 40 50 60 70 800
10
20
30
40
50
60
70
Time (sec.)
Pressure (psf)
6/12 Dynamic
A
60 62 64 66 68 70 72 74 76 78 800
10
20
30
40
50
60
70
80
Time (sec.)
Pressure (psf)
6/12 Dynamic
Peak Pressure = 58 psf at 72 sec.
Failure Pressure = 58 psf at 72 sec.
P1 P2 P3
B
Figure E-9. Summary of pressure time-histories for dynamic 6d SS at 6/12 panel (6d SS-46) full time-history and B) close up of failure
171

0 10 20 30 40 50 60 70 80 90‐10
0
10
20
30
40
50
60
70
80
Time (sec.)
Pressure (psf)
6d SS @ 6 in. / 12 in. Dynamic
A
70 72 74 76 78 80 82 84 86 88 9010
20
30
40
50
60
70
80
90
Time (sec.)
Pressure (psf)
6/12 Dynamic Close‐up
Peak Pressure = 66 psf at 82 sec. Failure Pressure = 66 psf at 82 sec.
P1 P2 P3
B
Figure E-10. Summary of pressure time-histories for dynamic 6d SS at 6/12 panel (6d SS-47) A)
full time-history and B) close up of failure
172

• Laboratory Fabricated 6d Smooth Shank at 6 in. / 6 in. Static (5 panels)
0 10 20 30 40 50 60 70 80 90 1000
20
40
60
80
100
120
Time (sec.)
Pressure (psf)
6/6 Static
Peak Pressure = 106 psf
Failure Pressure = 106 psf
Figure E-11. Summary of pressure time-history for static 6d SS at 6/6 panel (6d SS-53)
0 10 20 30 40 50 60 70‐10
0
10
20
30
40
50
60
70
Time (sec.)
Pressure (psf)
Static 6dC @ 6 in. / 6 in.
Peak Pressure = 64 psf
Failure Pressure = 64 psf
Figure E-12. Summary of pressure time-history for static 6d SS at 6/6 panel (6d SS-52)
173

0 20 40 60 80 100 120
0
20
40
60
80
100
120
140
Time (sec.)
Pressure (psf)
6d SS @ 6 in. / 6 in. Static
Peak Pressure = 134 psf
Failure Pressure = 134 psf
Figure E-13. Summary of pressure time-history for static 6d SS at 6/6 panel (6d SS-56)
0 10 20 30 40 50 60 70 80 90‐20
0
20
40
60
80
100
120
Time (sec.)
Pressure (psf)
6d SS @ 6 in. / 6 in. Static
Peak Pressure = 91 psf
Failure Pressure = 91 psf
Figure E-14. Summary of pressure time-history for static 6d SS at 6/6 panel (6d SS-55)
174

0 20 40 60 80 100 120
0
20
40
60
80
100
120
140
Time (sec.)
Pressure (psf)
6d SS @ 6 in. / 6in. Static
Peak Pressure = 135 psf
Failure Pressure = 135 psf
Figure E-15. Summary of pressure time-history for static 6d SS at 6/6 panel (6d SS-54)
• Laboratory Fabricated 6d Smooth Shank at 6 in. / 6 in. Dynamic (5 panels) Table E-2. Summary of dynamic pressure trace for 6d SS at 6 in. / 6 in. panels (blue – actual and
red target) Peak 1 Peak 2 Peak 3 Peak Failure
6d SS at 6 in. / 6 in. Dynamic
6d SS-57
38 psf @ 52 sec. 35 psf @ 58 sec. 40 psf @ 59 sec. 44 psf @ 62 sec. 44 psf @ 62 sec.
38 psf @ 52 sec. 38 psf @ 58 sec. 52 psf @ 59 sec. 50 psf @ 62 sec. 50 psf @ 62 sec.
6d SS-58
101 psf @ 101.5 sec. 96 psf @ 105 sec. 92 psf @ 107 sec. 103 psf @ 111 sec. 103 psf @ 111
sec. 98 psf @ 101.5 sec. 110 psf @ 105 sec. 97 psf @ 107 sec. 112 psf @ 111 sec. 112 psf @ 111
sec.
6d SS-59
102 psf @ 101.5 sec. 97 psf @ 105 sec. 93 psf @ 107.5
sec. 105 psf @ 111.5 sec.
105 psf @ 111.5 sec.
98 psf @ 101.5 sec. 110 psf @ 105 sec. 97 psf @ 107.5
sec. 112 psf @ 111.5 sec.
112 psf @ 111 sec.
6d SS-60
64 psf @ 72 sec. 64 psf @ 77 sec. 60 psf @ 79 sec. 72 psf @ 82 sec. 59 psf @ 82.5 sec.
63 psf @ 72 sec. 79 psf @ 77 sec. 62 psf @ 79 sec. 75 psf @ 82 sec. 60 psf @ 82.5 sec.
6d SS-61
114 psf @ 111 sec. 107 psf @ 115 sec. 102 psf @ 117 sec. 124 psf @ 121 sec. 104 psf @ 124
sec. 112 psf @ 111 sec. 128 psf @ 115 sec. 114 psf @ 117 sec. 128 psf @ 121 sec. 102 psf @ 124
sec.
175

0 10 20 30 40 50 60 700
10
20
30
40
50
60
Time (sec.)
Pressure (psf)
6/6 Dynamic
A
50 52 54 56 58 60 62 64 66 68 700
10
20
30
40
50
60
70
Time (sec.)
Pressure (psf)
6/6 Dynamic Close‐up
Peak Pressure = 44 psf at 62 sec.
P1 P2 P3
B
Figure E-16. Summary of pressure time-histories for dynamic 6d SS at 6/6 panel (6d SS-57) A) full time-history and B) close up of failure
176

0 10 20 30 40 50 60 70 80 90 100 110 1200
20
40
60
80
100
120
Time (sec.)
Pressure (psf)
6/6 Dynamic
A
100 102 104 106 108 110 112 114 116 118 1200
20
40
60
80
100
120
140
Time (sec.)
Pressure (psf)
6/6 Dynamic Close‐up
P1 P2P3
Peak Pressure = 103 psf at 111 sec.
Failure Pressure = 103 psf at 111 sec.
B
Figure E-17. Summary of pressure time-histories for dynamic 6d SS at 6/6 panel (6d SS-58) A) full time-history and B) close up of failure
177

0 20 40 60 80 100 1200
20
40
60
80
100
120
Time (sec.)
Pressure (psf)
6/6 Dynamic
A
100 102 104 106 108 110 112 114 116 118 1200
20
40
60
80
100
120
140
Time (sec.)
Pressure (psf)
6/6 Dynamic Close‐up
P1 P2P3
Peak Pressure = 105 psf at 111.5 sec.
Failure Pressure = 105 psf at 111.5 sec.
B
Figure E-18. Summary of pressure time-histories for dynamic 6d SS at 6/6 panel (6d SS-59) A)
full time-history and B) close up of failure
178

0 10 20 30 40 50 60 70 80 900
10
20
30
40
50
60
70
80
Time (sec.)
Pressure (psf)
6/6 Dynamic
A
70 72 74 76 78 80 82 84 86 88 900
10
20
30
40
50
60
70
80
90
Time (sec.)
Pressure (psf)
6/6 Dynamic Close‐up
P1 P3
Peak Pressure = 72 psf at 82 sec.
Failure Pressure = 53 psf at 85 sec.
P2
B
Figure E-19. Summary of pressure time-histories for dynamic 6d SS at 6/6 panel (6d SS-60) A) full time-history and B) close up of failure
179

0 10 20 30 40 50 60 70 80 90 100 110 120 130
0
20
40
60
80
100
120
140
Time (sec.)
Pressure (psf)
6d SS @ 6 in. / 6 in. Dynamic
A
110 112 114 116 118 120 122 124 126 128 1300
20
40
60
80
100
120
140
Time (sec.)
Pressure (psf)
6/6 Dynamic Close‐up
P1P3
Peak Pressure = 124 psf at 121 sec.
Failure Pressure = 104 psf at 124 sec.
P2
B
Figure E-20. Summary of pressure time-histories for dynamic 6d SS at 6/6 panel (6d SS-61) A)
full time-history and B) close up of failure
180
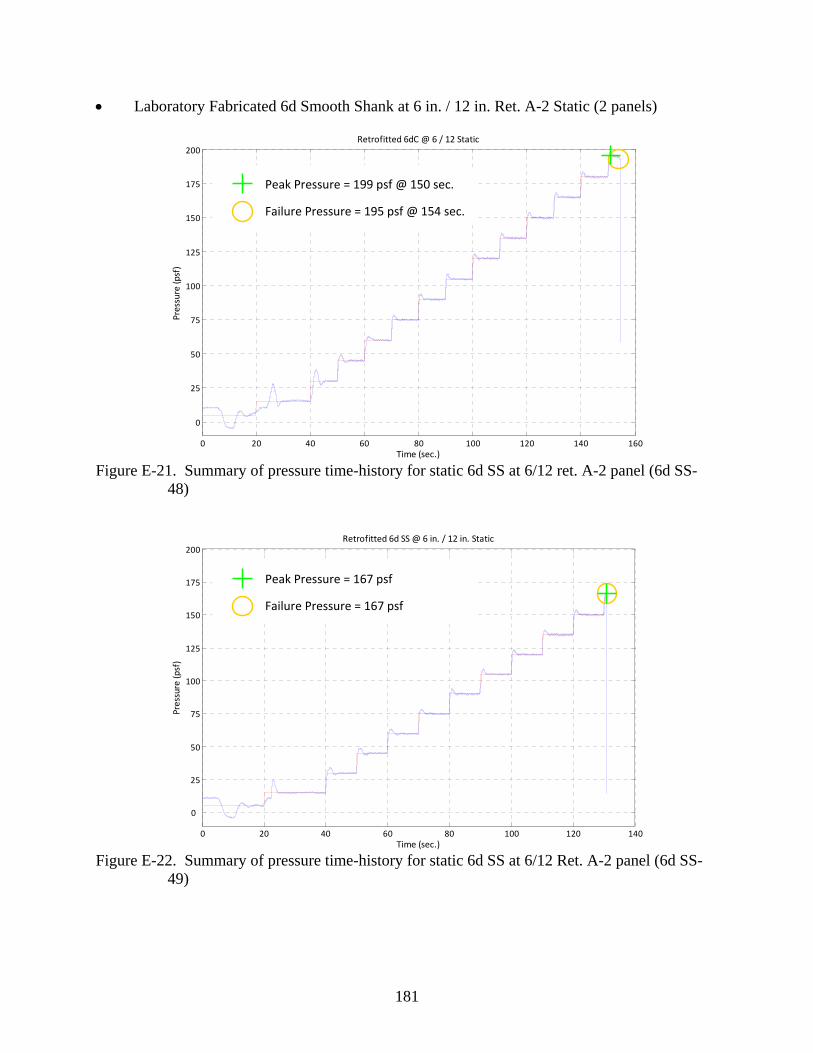
• Laboratory Fabricated 6d Smooth Shank at 6 in. / 12 in. Ret. A-2 Static (2 panels)
0 20 40 60 80 100 120 140 160
0
25
50
75
100
125
150
175
200
Time (sec.)
Pressure (psf)
Retrofitted 6dC @ 6 / 12 Static
Peak Pressure = 199 psf @ 150 sec.
Failure Pressure = 195 psf @ 154 sec.
Figure E-21. Summary of pressure time-history for static 6d SS at 6/12 ret. A-2 panel (6d SS-
48)
0 20 40 60 80 100 120 140
0
25
50
75
100
125
150
175
200
Time (sec.)
Pressure (psf)
Retrofitted 6d SS @ 6 in. / 12 in. Static
Peak Pressure = 167 psf
Failure Pressure = 167 psf
Figure E-22. Summary of pressure time-history for static 6d SS at 6/12 Ret. A-2 panel (6d SS-
49)
181

• Laboratory Fabricated 6d Smooth Shank at 6 in. / 12 in. Ret. A-2 Dynamic (2 panels) Table E-3. Summary of dynamic pressure trace for 6d SS at 6 in. / 12 in. retrofitted panels (blue
– actual and red target) Peak 1 Peak 2 Peak 3 Peak Failure
6d SS at 6 in. / 12 in. Retrofit Dynamic
6d SS-50
159 psf @ 161 sec. 155 psf @ 164 sec. 162 psf @ 166 sec. 164 psf @ 171 sec. 164 psf @ 171 sec.
181 psf @ 161 sec. 175 psf @ 164 sec. 152 psf @ 166 sec. 194 psf @ 171 sec. 194 psf @ 171 sec.
6d SS-51
160 psf @ 161 sec. 157 psf @ 164 sec. 152 psf @ 166 sec. 171 psf @ 173.5 sec.
162 psf @ 173.8 sec.
181 psf @ 161 sec. 175 psf @ 164 sec. 162 psf @ 166 sec. 169 psf @ 173.5 sec.
174 psf @ 173.8 sec.
182

0 20 40 60 80 100 120 140 160 180
0
25
50
75
100
125
150
175
200
Time (sec.)
Pressure (psf)
Retrofitted 6dSS @ 6 in. / 12 in. Dynamic
A
160 162 164 166 168 170 172 174 176 178 180
0
25
50
75
100
125
150
175
200
Time (sec.)
Pressure (psf)
Retrofitted 6dSS @ 6 in. / 12 in. Dynamic
P1
P3
Peak Pressure = 164 psf at 171 sec.
Failure Pressure = 164 psf at 171 sec.
P2
B
Figure E-23. Summary of pressure time-history for dynamic 6d SS at 6/12 ret. A-2 panel (6d SS-50) A) full time-history and B) close up of failure
183

0 20 40 60 80 100 120 140 160 180
0
25
50
75
100
125
150
175
200
Time (sec.)
Pressure (psf)
Retroiftted 6dC @ 6 in. / 12 in.
A
160 162 164 166 168 170 172 174 176 178 1800
20
40
60
80
100
120
140
160
180
200
Time (sec.)
Pressure (psf)
Retrofitted 6/12 Dynamic Close‐up
P1
P3
Peak Pressure = 171 psf at 173.5 sec.
Failure Pressure = 162 psf at 173.8 sec.
P2
B
Figure E-24. Summary of pressure time-history for dynamic 6d SS at 6/12 ret. A-2 panel (6d SS-51) A) full time-history and B) close up of failure
184

• Harvested 1.5 in. Staple at 4 in. / 4 in. Static (2 panels)
0 10 20 30 40 50 60 70 80 90‐20
0
20
40
60
80
100
Time (sec.)
Pressure (psf)
4/4 Static
Peak Pressure = 93 psf
Failure Pressure = 90 psf
Figure E-25. Summary of pressure time-history for static 1.5 in. Staple at 4/4 (1.5 in. Staple-7)
0 10 20 30 40 50 60 70 80 90‐20
0
20
40
60
80
100
Time (sec.)
Pressure (psf)
4/4 Static
Peak Pressure = 93 psf
Failure Pressure = 90 psf
Figure E-26. Summary of pressure time-history for static 1.5 in. Staple at 4/4 (1.5 in. Staple-8)
185

• Harvested 1.5 in. Staple at 4 in. / 4 in. Dynamic (4 panels) Table E-4. Summary of dynamic pressure trace for 1.5 in. Staples at 4”/4” panels (blue – actual
and red target) Peak 1 Peak 2 Peak 3 Peak Failure 1.5 in. Staple-9
92 psf @ 92 sec. 84 psf @ 96 sec. 82 psf @ 98 sec. 93 psf @ 102 sec. 93 psf @ 102 sec.
86 psf @ 92 sec. 105 psf @ 96 sec. 89 psf @ 98 sec. 98 psf @ 102 sec. 98 psf @ 102 sec. 1.5 in. Staple-10
55 psf @ 62 sec. 49 psf @ 67 sec. 54 psf @ 68 sec. 61 psf @ 72 sec. 61 psf @ 72 sec.
50 psf @ 62 sec. 49 psf @ 67 sec. 65 psf @ 68 sec. 63 psf @ 72 sec. 63 psf @ 72 sec. 1.5 in. Staple-11
42 psf @ 52 sec. 36 psf @ 58 sec. 42 psf @ 59 sec. 52 psf @ 62 sec. 37 psf @ 66 sec.
38 psf @ 52 sec. 38 psf @ 58 sec. 52 psf @ 59 sec. 50 psf @ 62 sec. 41 psf @ 66 sec. 1.5 in. Staple-12
69 psf @ 72 sec. 63 psf @ 77 sec. 61 psf @ 79 sec. 82 psf @ 82 sec. 71 psf @ 89 sec.
63 psf @ 72 sec. 78 psf @ 77 sec. 62 psf @ 79 sec. 75 psf @ 82 sec. 75 psf @ 89 sec.
186

0 10 20 30 40 50 60 70 80 90 100 110‐20
0
20
40
60
80
100
120
Time (sec.)
Pressure (psf)
4/4 Dynamic
A
90 92 94 96 98 100 102 104 106 108 1100
20
40
60
80
100
120
Time (sec.)
Pressure (psf)
4/4 Dynamic Close‐up
P1P3
Peak Pressure = 93 psf at 102 sec.
Failure Pressure = 93 psf at 102 sec.
P2
B
Figure E-27. Summary of pressure time-history for dynamic 1.5 in. Staple at 4/4 (1.5 in Staple-9) A) full time-history and B) close up of failure
187

0 10 20 30 40 50 60 70 80‐20
‐10
0
10
20
30
40
50
60
70
Time (sec.)
Pressure (psf)
4/4 Dynamic
A
60 62 64 66 68 70 72 74 76 78 800
10
20
30
40
50
60
70
80
Time (sec.)
Pressure (psf)
4/4 Dynamic Close‐up
P1P3
Peak Pressure = 61 psf at 72 sec.
Failure Pressure = 61 psf at 72 sec.
P2
B
Figure E-28. Summary of pressure time-history for dynamic 1.5 in. Staple at 4/4 (1.5 in. Staple-10) A) full time-history and B) close up of failure
188
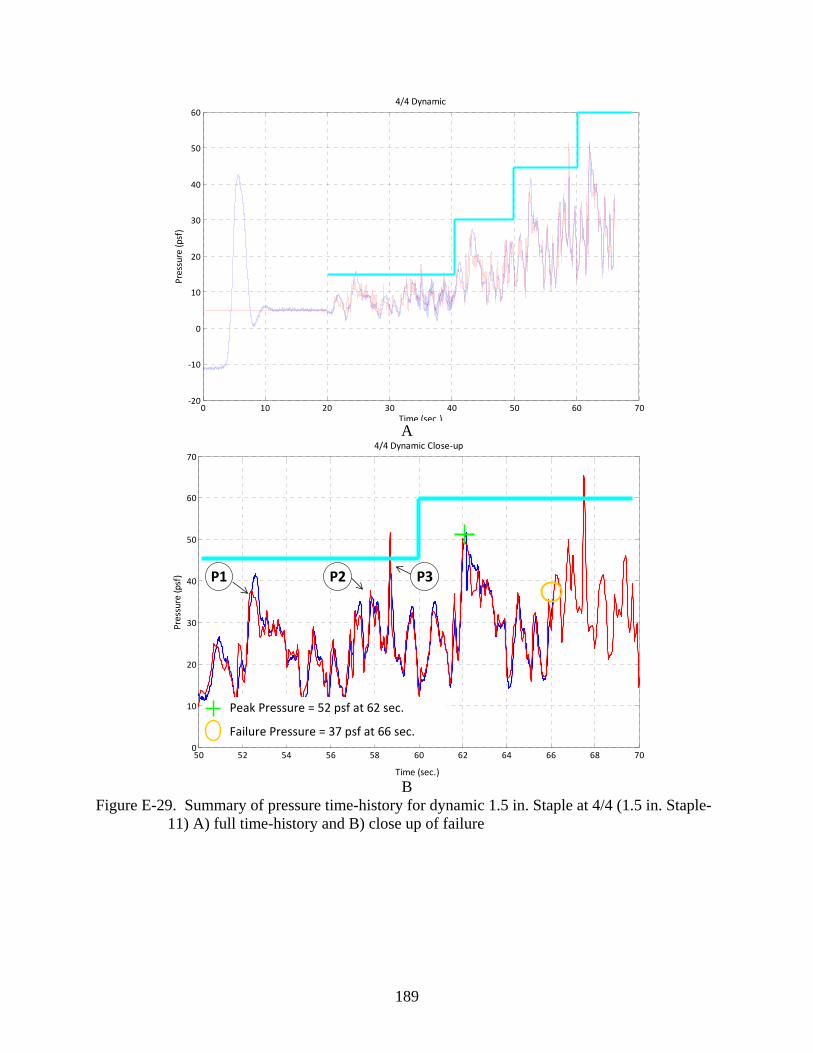
0 10 20 30 40 50 60 70‐20
‐10
0
10
20
30
40
50
60
Time (sec.)
Pressure (psf)
4/4 Dynamic
A
50 52 54 56 58 60 62 64 66 68 700
10
20
30
40
50
60
70
Time (sec.)
Pressure (psf)
4/4 Dynamic Close‐up
P1 P3
Peak Pressure = 52 psf at 62 sec.
Failure Pressure = 37 psf at 66 sec.
P2
B
Figure E-29. Summary of pressure time-history for dynamic 1.5 in. Staple at 4/4 (1.5 in. Staple-11) A) full time-history and B) close up of failure
189

0 10 20 30 40 50 60 70 80 90‐20
0
20
40
60
80
100
Time (sec.)
Pressure (psf)
4/4 Dynamic
A
70 72 74 76 78 80 82 84 86 88 900
10
20
30
40
50
60
70
80
90
Time (sec.)
Pressure (psf)
4/4 Dynamic Close‐up
P1 P3
Peak Pressure = 82 psf at 82 sec.
Failure Pressure = 71 psf at 89 sec.
P2
B
Figure E-30. Summary of pressure time-history for dynamic 1.5 in. Staple at 4/4 (1.5 in. Staple-12) A) full time-history and B) close up of failure
190

• Harvested 1.5 in. Staple at 4 in. / 4 in. Ret. with A-2 Static (2 panels)
0 20 40 60 80 100 120 140‐20
0
20
40
60
80
100
120
140
160
180
Time (sec.)
Pressure (psf)
4/4 Ret. Static
Peak Pressure = 168 psf
Failure Pressure = 165 psf
Figure E-31. Summary of pressure time-history for static 1.5 in. Staple at 4/4 with Ret. A-2 (1.5
in. Staple-13)
0 20 40 60 80 100 120 140‐20
0
20
40
60
80
100
120
140
160
180
Time (sec.)
Pressure (psf)
4/4 Ret. Static
Peak Pressure = 169 psf
Failure Pressure = 165 psf
Figure E-32. Summary of pressure time-history for static 1.5 in. Staple at 4/4 with Ret. A-2 (1.5
in. Staple-14)
191

• Harvested 1.5 in. Staple at 4 in. / 4 in. with Ret. A-2 Dynamic (2 panels) Table E-5. Summary of dynamic pressure trace for 1.5 in. Staples at 4”/4” with Ret. A-2 panels
(blue – actual and red target) Peak 1 Peak 2 Peak 3 Peak Pressure Failure Pressure
1.5 in. Staple-15
141 psf @ 151 sec.
140 psf @ 154 sec.
144 psf @ 156 sec. 150 psf @ 161 sec. 150 psf @ 161
sec. 160 psf @ 151 sec.
164 psf @ 154 sec.
141 psf @ 156 sec. 181 psf @ 161 sec. 181 psf @ 161
sec. 1.5 in. Staple-16
95 psf @ 92 sec. 85 psf @ 96 sec. 82 psf @ 98 sec. 102 psf @ 102 sec. 90 psf @ 105 sec.
86 psf @ 92 sec. 105 psf @ 96 sec. 89 psf @ 98 sec. 98 psf @ 102 sec. 94 psf @ 105 sec.
192

0 20 40 60 80 100 120 140 160 180‐20
0
20
40
60
80
100
120
140
160
180
200
Time (sec.)
Pressure (psf)
4/4 Ret. Dynamic
A
150 152 154 156 158 160 162 164 166 168 1700
20
40
60
80
100
120
140
160
180
200
Time (sec.)
Pressure (psf)
4/4 Ret. Dynamic
P1P3
Peak Pressure = 150 psf at 161 sec.
Failure Pressure = 150 psf at 161 sec.
P2
B
Figure E-33. Summary of pressure time-history for dynamic 1.5 in. Staple at 4/4 with Ret. A-2 (1.5 in. Staple-15) A) full time-history and B) close up of failure
193
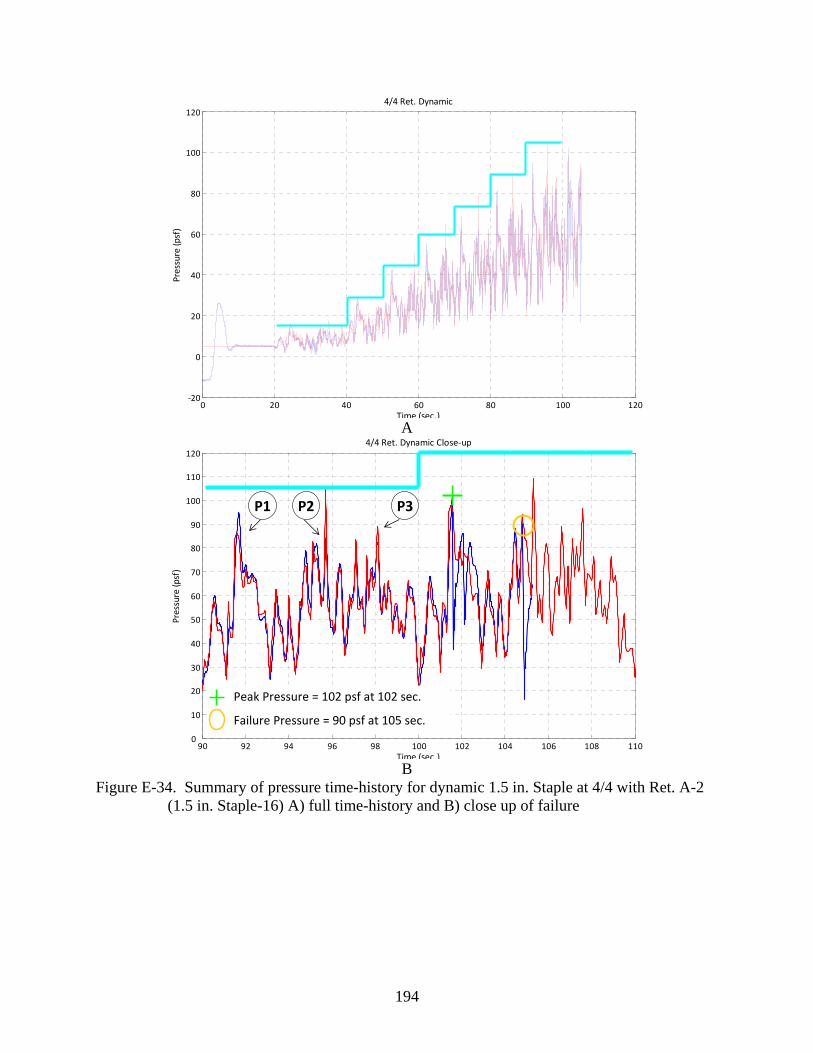
194
0 20 40 60 80 100 120‐20
0
20
40
60
80
100
120
Time (sec.)
Pressure (psf)
4/4 Ret. Dynamic
A
90 92 94 96 98 100 102 104 106 108 1100
10
20
30
40
50
60
70
80
90
100
110
120
Time (sec.)
Pressure (psf)
4/4 Ret. Dynamic Close‐up
P1 P3
Peak Pressure = 102 psf at 102 sec.
Failure Pressure = 90 psf at 105 sec.
P2
B
Figure E-34. Summary of pressure time-history for dynamic 1.5 in. Staple at 4/4 with Ret. A-2 (1.5 in. Staple-16) A) full time-history and B) close up of failure

LIST OF REFERENCES
AF&PA. (2005). "National Design Specification for Wood Construction." Chapter 11: Dowel-Type Fasteners, AF & PA American Wood Council, Washington DC.
Amirkhanian, S., Sparks, P., and Watford, S. (1994). "A Statistical Analysis of Wind Damage to Single-Family Dwellings Due to Hurricane Hugo." Structures Congress XII.
ASCE. (2006). Minimum Design Loads for Buildings and Other Structures (ASCE/SEI Standard 7-05), American Society of Civil Engineers, Reston, VA.
ASTM. (2000). "Evaluating Properties of Wood-Based Fiber and Panel Materials." Nail Head Pull-Through Test.
ASTM. (2006a). "Section 4: Construction." D-1761: Mechanical Fasteners in Wood.
ASTM. (2006b). "Standard Test Methods for Specific Gravity of Wood and Wood-Based Materials, D 2395 -02." Annual Book of ASTM Standards 2006.
ASTM. (2006c). "Standard Test Mwethods for Evaluating Properties of Wood-Based Fiber and Particle Panel Materials." D 1037-99.
Bartlett, F. M., Galsworthy, J. K., Henderson, D., Hong, H. P., Iizumi, E., Inculet, D. R., Kopp, G. A., Morrison, M. J., Savory, E., Sabarinathan, J., Sauer, A., Scott, J., St. Pierre, L. M., and Surry, D. (2007). "The Three Little Pigs Project: A New Test Facility for Full-Scale Small Buildings." 12th International Conference on Wind Engineering, Australasian Wind Engineering Society, Cairns, Australia.
Baskaran, A., Chen, Y., and Vilaipornsawai, U. (1999a). "A New Dynamic Wind Load Cycle to Evaluate Mechanically Attached Flexible Membrane Roofs." Journal of Testing and Evaluation, 27(4), 249-265.
Baskaran, A., and Dutt, O. (1997). "Performance of roof fasteners under simulated loading conditions." Journal of Wind Engineering and Industrial Aerodynamics, 72, 389-400.
Baskaran, A., Lee, W., and Richardson, C. (1999b). "Dynamic Evaluation of Thermoplastic Roofing System for Wind Performance." Journal of Architectural Engineering, 16-24.
Chow, P., McNatt, J. D., and Zhao, L. (1990). "Effects of outdoor weathering on withdrawal and head pull-through of nails and staples in wood-based building panels." Durability of Building Materials and Components, 259-259.
Chui, Y. H., and Craft, S. (2002). "Fastener head pull-through resistance of plywood and oriented strand board." Canadian Journal of Civil Engineering, 29(3), 384-388.
Cook Jr, R. L. (1991). "Lessons learned by a roof consultant." Hurricane Hugo One Year Later.
195

Cunningham, T. P. (1993). "Roof Sheathing Fastening Schedules for Wind Uplift." American Plywood Association.
Dade County. (1988). South Florida Building Code, Dade County Board of County Commissioners, Miami, Dade County, FL.
Dade County. (1994). South Florida Building Code, Dade County Board of County Commissioners, Miami, Dade County, FL.
Dao, T. N., and Van De Lindt, J. W. (2008). "New nonlinear roof sheathing fastener model for use in finite-element wind load applications." Journal of Structural Engineering, 134(10), 1668-1674.
Datin, P. L., and Prevatt, D. O. "Wind Uplift Reactions at Roof-to-Wall Connections of Wood-Framed Gable Roof Assembly." International Conference on Wind Engineering, Cairns, Australia.
Datin, P. L., and Prevatt, D. O. (2009). "Equivalent Roof Panel Wind Loading for Full-Scale Sheathing Testing." 11th Americas Conference on Wind Engineering, Puerto Rico.
Feldborg, T. (1989). "Timber joints in tension and nails in withdrawal under long-term loading and alternating humidity." Forest Products Journal, 39(11-12), 8-12.
FEMA, Mitigation, Assessment, and Team. (2005a). "Hurricane Charlie in Florida."
FEMA, Mitigation, Assessment, and Team. (2005b). "Hurricane Ivan in Alabama and Florida: Observations, Recommendations and Technical Guidance."
FEMA, Mitigation, Assessment, and Team. (2006). "Hurricane Katrina in the Gulf Coast: Mitigation Assessment Team Report, Building Performance Observations, Recommendations, and Technical Guidance."
FEMA, M. A. T. (1993). "Building Performance: Hurricane Iniki in Hawaii."
Feng, Y., D'Amours, S., and Beauregard, R. (2008). "The value of sales and operations planning in oriented strand board industry with make-to-order manufacturing system: Cross functional integration under deterministic demand and spot market recourse." International Journal of Production Economics, 115, 20.
Forest Products Laboratory. (1999). Wood Handbook: Wood as an Engineering Material, U.S. Department of Agriculture, Forest Service, Madison, WI.
Holmes, J. D. (2001). Wind Loading of Structures, Spon Press, New York.
ICC. (2000). International Building Code, International Code Council, Inc., Falls Church, VA.
ICC. (2004). Florida Building Code, Building, International Code Council, Inc., Falls Church, VA.
196

ICC. (2006). 2006 International Building Code, International Code Council, Falls Church, VA.
ICC. (2007). Florida Building Code.
IHRC. (2004). "Hurricane Loss Reduction for Housing in Florida: Final Report." International Hurricane Research Center, Florida International University, Miami, FL.
Jesteadt, J. P. (2006). "Wind Data Collection, Wind Resistance of Florica Residential Structures, and Simulation of Hurricane Force WInds: 2003 to 2006 Florida Coastal Monitoring Program (FCMP)," University of Florida, Gainesville.
Jones, D. T. (1998). "Retrofit Techniques Using Adhesives to Resist Wind Uplift in Wood Roof Systems," MS Thesis, Clemson University, Clemson, SC.
Judge, E. K., and Reinhold, T. A. "Practicality and Effectiveness of Wind Resistant Retrofit Measures." Solutions to Coastal Disasters 2002, Feb 24-27 2002, San Diego, CA, United States, p 983-996.
Kallem, M. R. (1997). "Roof Sheathing Attachment for High Wind Regions: Comparison of Screws and Nails," Clemson University, Clemson.
Keith, E. L., and Rose, J. D. (1992). "Hurricane Andrew - Structural Performance of Buidlings in Southern Florida." American Plywood Association, Report T92-21.
Kemp, G. (2008). "New hurricane test facility allows repeatable full-scale building testing." Test Engineering and Management, 70(4), 10-13.
Mizzell, D. P. (1994). "Wind Resistance of Sheathing for Residential Roofs," Clemson University, Clemson.
Murden, J. A. (1991). "Hugo 1989. The performance of structures in the wind." Hurricane Hugo One Year Later.
Murphy, S., Schiff, S., Rosowsky, D., and Pye, S. "System effects and uplift capacity of roof sheathing fasteners." Part 2 (of 2), Chicago, IL, 765.
NAHB. (2003). "Roof Sheathing Connection Tolerances." Prepared for the US Department of Housing and Urban Development by the NAHB Research Center, Upper Marlboro, MD.
Ott, R. L., and Longnecker, M. T. (2004). A First Course in Statistical Methods.
Pielke, R. A., Gratz, J., Landsea, C. W., Collins, D., Saunders, M. A., and Musulin, R. (2008). "Normalized hurricane damage in the United States: 1900-2005." Natural Hazards Review, 9(1), 29-42.
Pinelli, J.-P., Simiu, E., Gurley, K., Subramanian, C., Zhang, L., Cope, A., Filliben, J. J., and Hamid, S. (2004). "Hurricane damage prediction model for residential structures." Journal of Structural Engineering, 130(11), 1685-1691.
197

Pye, S. J. (1995). "Effect of In-Service Conditions on the Withdrawal Capacity of Roof Sheathing Fasteners," Clemson University, Clemson.
Rammer, D. R., Winistorfer, S. G., and Bender, D. A. (2001). "Withdrawal strength of threaded nails." Journal of Structural Engineering, 127(4), 442-449.
Reinhold, T., Mitrani, J., Alvarez, R., and Sutt, E. "Guidlines for Design of Roof Sheathing Fastener Schedules to Resist Uplift in High Winds." 11th Internation Conference on Wind Engineering, Lubbock, TX.
SBCCI. (1997). Standard Building Code, Southern Building Code Congress International, Birmingham, AL.
Schiff, S. D., Mizzell, D. P., and Zaitz, M. D. "Up-Lift Resistance of Plywood and OSB Roof Sheathing." Structures Congress, Atlanta.
Sherman, M. D. (2000). "Effect Of Loading Rate On Capacities Of Nailed Connections And Fasteners In Wood," Clemson University, Clemson.
Sparks, P. R. (1991a). "Damages and lessons learned from Hurricane Hugo." NIST Special Publication(n 820), p 435-450.
Sparks, P. R. (1991b). "Facts about Hurricane Hugo. What it was, what it wasn't and why it caused so much damage." Hurricane Hugo One Year Later.
Sutt, E. (2000). "The Effect of Combined Shear and Uplift Forces on Roof Sheathing Panels," Clemson University, Clemson,SC.
Sutt, E., Reinhold, T., and Rosowsky, D. "The effect of in-situ conditions on nail withdrawal capacities." World Conference of Timber Engineering, Whistler, BC.
US Census Bureau. (2003). "Census of population and housing (2000)." US Dept. of Commerce, Economics and Statistics Administration, Washington, D.C.
van de Lindt, J. W., Graettinger, A., Gupta, R., Skaggs, T., Pryor, S., and Fridley, K. (2007). "Performance of Woodframe Structures During Hurricane Katrina." Journal of Performance of Constructed Facilities, March/April.
198

199
BIOGRAPHICAL SKETCH
The author was born in Davis, California, in 1983. From there he moved with his family
to Nigeria then Tanzania. He relocated to the Washington DC area where he played football and
skied at every chance. In 2002 he began attending Clemson University where he received his
Bachelors of Science in civil engineering. While at Clemson he worked at the Wind Load Test
Facility conducting research with the wind tunnel. In 2007 he began attending the University of
Florida where he received his Master of Engineering degree in 2009.