development of two novel processes for hydrogenation of
TRANSCRIPT

catalysts
Article
Development of Two Novel Processes forHydrogenation of CO2 to Methanol overCu/ZnO/Al2O3 Catalyst to Improve the Performanceof Conventional Dual Type MethanolSynthesis Reactor
Behnaz Rahmatmand, Mohammad Reza Rahimpour * and Peyman Keshavarz
Chemical Engineering Department, Petroleum and Chemical Engineering School, University of Shiraz,Shiraz 71345, Iran; [email protected] (B.R.); [email protected] (P.K.)* Corresponding: [email protected]; Tel.: +98-713-230-3071
Received: 16 May 2018; Accepted: 15 June 2018; Published: 23 June 2018�����������������
Abstract: Conventional methanol synthesis process (CR configuration) consists of water-cooled andgas-cooled reactors in which methanol and water are condensed inside the gas-cooled reactor whichdeactivates the catalyst. In this study, two novel configurations (AW and ACW configurations) arerepresented to address this problem in which the gas-cooled reactor is replaced with adiabatic reactor.Moreover, a condenser is applied between adiabatic and water-cooled reactors in ACW configuration.Results show that temperature increases somewhat along the adiabatic reactor that prevents gascondensate formation. Besides, the adiabatic reactor maximum temperature is less than that offirst reactor in CR configuration which prevents copper based catalyst thermal sintering. Moreover,a high cross section-to-length ratio of the adiabatic reactor leads to negligible pressure drop alongthe reactor and improvement in CO2 conversion to methanol that has positive environmental effects.Also, water mole fraction decreases along the reactors of AW and ACW configurations to preventthe deactivation of catalyst active sites. Eventually, methanol production rates by AW and ACWconfigurations are improved around 25.5% and 43.1% in comparison with CR configuration. So,novel AW and ACW configurations provide many benefits including improvement in catalyst activityand durability, CO2 conversion, and the methanol production rate.
Keywords: methanol; gas condensate; catalyst lifetime; adiabatic reactor; gas-cooled reactor
1. Introduction
Energy is an integral part of everyone’s life. Fossil fuel is one of the most important sources ofenergy which is a non-renewable source of energy. Nowadays, methanol is recommended as a fuel dueto its chemical and physical properties and also it can be applied as a favorable automotive fuel [1].Methanol has received great attention due to its significant role in producing different materialssuch as formaldehyde, acetic acid, dimethyl ether, and methyl formate and also in hydrogen storageand transportation [2–6]. Accordingly, due to the economic value of methanol, any enhancement inmethanol production process to eliminate the problems of commercial methanol plants can bringconsiderable benefits [7]. In industrial plants, a two-step process for methanol synthesis processconsists of two sections. The first section is production of syngas by utilizing reforming processes.In the second section, syngas is converted to methanol which can be achieved by different method.One of these methods is conventional dual type which consists of two reactors including gas-cooledand water-cooled reactors which are shell and tube heat exchangers [8,9]. The water-cooled reactor tube
Catalysts 2018, 8, 255; doi:10.3390/catal8070255 www.mdpi.com/journal/catalysts

Catalysts 2018, 8, 255 2 of 28
and gas-cooled reactor shell are loaded with Cu/ZnO/Al2O3 catalyst which is the catalyst of methanolsynthesis reactions. At first, conversion of synthesis gas to methanol is accomplished partially in thewater-cooled reactor in isothermal coolant condition which is the first reactor. The product of the firstreactor, which encompasses methanol, enters the shell side of second downstream reactor that is thegas-cooled reactor. There is not a cooling device between first and second reactor. Inside the gas-cooledreactor, a syngas flow (i.e., water-cooled reactor (first reactor) feed) and reacting gas (i.e., the productof the first reactor, methanol-containing stream) are thermally coupled. In this reactor, the reactinggas and syngas go counter-currently through shell and tubes, respectively. Therefore, the reactant gastemperature flowing inside gas-cooled reactor shell side decreases continuously to provide the drivingforce for methanol production reaction [9]. However, it is observed that by the course of time, the shellside temperature of the gas-cooled reactor decreases so that it reaches the dew point temperatureof methanol and water vapors. Thus, in the gas-cooled reactor, water and methanol are condensedinside the shell side [7,9]. Gas condensate deactivates the catalyst of methanol synthesis which is notbeneficial from an economic perspective [10].
Many investigations focus on modeling of catalytic methanol synthesis reactor [7,11–17].In summary, Elnashaie and Wagialla [18] studied methanol production by the fluidized-bed reactor.Graaf et al. [19] modeled the reactor of methanol synthesis at low-pressure. They investigatedthe effect of catalyst particle size on intra-particle diffusion limitations. Lovik [20] optimized themethanol synthesis reactor by considering catalyst deactivation. Velardi and Barresi [21] studied theenhancement of reactor efficiency by utilizing multiple autothermal methanol synthesis reactors.With the aim of enhancing the efficiency of the methanol reactors, various arrangements areintroduced such as conventional double reactor [22], cascade membrane reactor [23], reactor consistinghydrogen permselective membrane [24,25], double reactor with membrane [26–29], and fluidized-bedreactor with membrane [30–32]. Rahimpour et al. [30] presented a process with two fluidized-bedreactors in which membrane was applied for hydrogen permeation. The outcome of modelingexhibited that this configuration enhances the yield of methanol production up to 9.53%. Moreover,Rahimpour et al. [11,33] optimized the conventional methanol synthesis process with two reactorswhich included membrane. In this regard, Rahimpour et al. [33] optimized a methanol synthesisprocess with reactors that contained membrane. Also, they considered catalyst deactivation. Manenti etal. [34] compared dynamic model and steady-state model for methanol synthesis. The results exhibitedthat more details contribute to numerical stability of dynamic model. Also, Manenti et al. [35] studiedmethanol synthesis process with two reactors from economic perspective. Bayat et al. [36] appliedgenetic algorithm to model a methanol synthesis process which consisted of two reactors with the aimof maximizing the production of methanol.
Mirvakili et al. [9] studied a drawback of the gas-cooled reactor in an industrial plant in whichgas was condensed. They applied real plant data to simulate the process. The results exhibited thatgas condensate forms near the bottom of this reactor. Also, in one other study, Mirvakili et al. [7]developed a computational fluid dynamics (CFD) to simulate flow and temperature distributionsinside the gas-cooled reactor. The results showed that undesirable flow distribution inside this reactorleads to non-uniform temperature distribution inside the shell side. It causes gas to condense insidethe reactor shell. Gas condensation including water and methanol deactivates the Cu/ZnO/Al2O3
catalyst and decreases the efficiency of the methanol synthesis reaction [10,37]. Because water reducesactive sites of this catalyst and causes catalyst deactivation [17,37–40]. Moreover, water is adsorbedby alumina which is the hydrophilic component of the reaction catalyst and it has negative effect oncatalyst activity. [39]. So, it can impose considerable financial burden on petrochemical complexes.As a result, it is indispensable to find an alternative solution to improve the efficiency of this plant.
In fact, there are parameters which cause the sintering and deactivation of copper basedcatalysts [41,42]. From the thermal sintering perspective, the main sintering mechanism in the bulk ofmetal catalysts is vacancy diffusion that proposes a relevance with the cohesive energy. Hughes [43]demonstrated that metals stability increase in the following order: Ag < Cu < Au < Pd < Fe < Ni <

Catalysts 2018, 8, 255 3 of 28
Co. < Pt < Rh < Ru < Ir < Os < Re. So, copper based catalysts have less resistance against the thermalsintering in comparison with other mentioned metal based catalysts [42]. Moreover, it is exhibitedby the low Hüttig temperature of copper [44], that reverberates the low melting point of copper(1063 ◦C) in comparison with that of other metals such as nickel (1455 ◦C) and iron (1535 ◦C) [42].Consequently, the operating temperature of copper based catalysts should not exceed the 300 ◦C [42].Also, at temperatures greater than 300 ◦C, ZnO crystallites grow which reinforces the sintering ofcopper [45]. Recently, the structures of copper based catalysts encompass oxides including Al2O3
or Cr2O3 to reduce the thermal sintering of the catalyst [42]. On the other hand, water producedby the CO2 hydrogenation to methanol reaction and reverse water gas shift reaction speeds up thedeactivation of catalyst active sites [40,46–50]. In fact, the number of deactivated sites increase byformation of sintered copper active species, and copper with high concentration of adsorbed water [40].As a result, the temperature and water vapor concentration are two important factors that affect theperformance of the copper based methanol synthesis reaction. So, reducing the temperature and watervapor concentration along the methanol synthesis reactor can plays significant role in enhancing thelife time and activity of the copper based catalyst of the methanol synthesis reaction.
Besides, carbon dioxide is one of the greenhouse gases which causes negative environmentalimpacts [51]. Also, the set of methanol synthesis reactions includes the hydrogenation of CO2 tovaluable product of methanol. Therefore, it is beneficial from an environmental perspective to proposenew configurations to enhance the conversion of carbon dioxide to methanol as valuable product. So,in the present investigation, two novel methanol synthesis configurations are proposed to improve thecatalyst activity, methanol production and the carbon dioxide conversion to methanol.
In the current research, the gas-cooled reactor is replaced with the adiabatic reactor in to improvethe methanol synthesis process efficiency and also eliminate the condensation of gas inside thegas-cooled reactor that is an unfavorable phenomenon. For this purpose, the performance of threedifferent configurations have been simulated and compared. The conventional configuration comprisesgas-cooled and water-cooled reactors that are named CR configuration. The AW configurationencompasses adiabatic reactor and water-cooled reactor. In this configuration, the syngas first isinjected to the adiabatic reactor and then the product of the adiabatic reactor enters the water-cooledreactor. The third configuration is ACW configuration in which methanol and water components ofadiabatic reactor’s product are condensed partially before entering the water-cooled reactor. The profileof temperature, pressure, rate of methanol production, conversion, and mole fraction of water arecalculated along the length of reactors, and the results are compared. Also, the configurations arecompared from energy consumption perspective, and finally the best configuration is introduced.
2. Results and Discussion
In this study, the performance of three configurations is investigated and compared from differentperspectives to eliminate the gas condensate formation and catalyst deactivation which are majordrawbacks in CR configuration. With this aim, different parameters are calculated inside reactorsby applying the mathematical modeling and modeling results of these three configurations havebeen compared.
2.1. Reaction Scheme and Kinetics
Conversion of syngas to methanol consists of three reactions including conversion of CO2 andCO to methanol and reverse water gas shift reaction (RWGS). These three reactions are presented asfollows [39]
CO + 2H2 ↔ CH3OH. ∆H0298 = −90.7 KJ/molCO (1)
CO2 + H2 ↔ CO + H2O. ∆H0298 = +41.2 KJ/molCO2 (2)
CO2 + 3H2 ↔ CH3OH + H2O. ∆H0298 = −49.5 KJ/molCO2 (3)

Catalysts 2018, 8, 255 4 of 28
The following kinetic model was used in the current study to estimate the kinetic of triple reactionnetwork of methanol synthesis. This model was introduced by Graaf et al. [52] for synthesis ofmethanol by applying CuO/ZnO/Al2O3 catalyst. The reaction kinetics are presented in the following
r1 =
k1KCO
[fCO f 3/2
H2− fCH3OH
f 1/2H2
Kp1
](1 + KCO fCO + KCO2 fCO2
)[f 1/2H2
+
(KH2O
K1/2H2
)fH2O
] (4)
r2 =k2KCO2
[fCO2 fH2 −
fH2O fCOKp2
](1 + KCO fCO + KCO2 fH2O
)[f 1/2H2
+
(KH2O
K1/2H2
)fH2O
] (5)
r3 =
k3KCO2
[fCO2 f 3/2
H2− fCH3OH fH2O
f 1/2H2
Kp3
](1 + KCO fCO + KCO2 fCO2
)[f 1/2H2
+
(KH2O
K1/2H2
)fH2O
] (6)
In these equations the fugacity of each component is shown by f. Table 1 shows adsorptionequilibrium constant, equilibrium constant, and rate constant.
Table 1. Methanol synthesis reactions constants [39].
Adsorption Equilibrium Constants
K =A exp
(B
RT
)A B
KH2O
K1/2H2
(6.37± 2.88)× 10−9 84, 000± 1400
KCO (2.16± 0.44) × 10−5 46, 800± 800KCO2 (7.05± 1.39)× 10−7 61, 700± 800
Rate Constants
k = A exp(
BRT
)A B
k1 (4.89± 0.029)× 107 −63, 000± 300k2 (9.64± 7.30) × 1011 −152, 900± 6800k3 (1.09± 0.07) × 105 −87, 500± 300
Equilibrium Constants
Kp = 10(A
T−B ) A BKp1 5139 12.621Kp2 3066 10.592Kp3 −2073 −2.029
2.2. Process Description
2.2.1. Conventional Methanol Synthesis Process with Two Reactors (CR Configuration)
Figure 1a demonstrates the schematic diagram of CR configuration. In this configuration, there aretwo reactors which are heat exchangers with shell and tube [9]. The methanol synthesis reaction isperformed over CuO/ZnO/Al2O3 catalyst. In this configuration, the gas-cooled reactor shell andwater-cooled reactor tubes are loaded with catalyst. In the first step, syngas enters the water-cooledreactor as the first reactor to convert to methanol partially. The water-cooled reactor product isintroduced to the gas-cooled reactor as the second reactor for further conversion. In the gas-cooledreactor, reacting gas passes through shell countercurrent to syngas flowing through shell [9]. Therefore,the temperature along the catalyst bed of shell decreases to retain the driving force of reaction over the

Catalysts 2018, 8, 255 5 of 28
length of the catalyst bed. Also, due to the heat transfer from the reacting gas to the syngas, the syngasis heated before entering the first reactor. The methanol conversion in the second reactor is less thanthat of the first reactor. Consequently, the temperature of the gas-cooled reactor is less than that of thewater-cooled reactor, so the catalyst is mainly deactivated the gas-cooled reactor due to methanol andwater condensation [9]. The operating conditions, reactor, and catalyst characterizations and plantinlet data are presented in Tables 2 and 3.
Figure 1. Cont.

Catalysts 2018, 8, 255 6 of 28
Figure 1. The schematic diagram of (a) CR configuration [9]; (b) AW configuration;and (c) ACW configuration.
Table 2. The conditions and specification of reactors and catalyst of conventional methanol synthesisprocess with two reactors (CR configuration).
ParametersWater-Cooled Reactor Gas-Cooled Reactor
Values Values
Shell diameter (m) 4.5 5.5Tube diameter (m) 0.038 0.0254Reactor length (m) 8.4 10.5
Particle diameter (m) 0.0057 0.0057Catalyst bed density (kg/m3) 1140 1140
Bed void fraction 0.39 0.39Number of tubes 5955 3026
Molar flow of feed in each tube (mol/s) 1.5 -Input shell side pressure (bar) - 71.8Input tube side pressure (bar) 75 76.98
Temperature of the shell side (K) 513 -Mass flow rate of the shell side (kg/h) 151,437 -
Feed Composition (Mole Basis) Values
H2 0.6334CH4 0.1006CO2 0.0832H2O 0.00039N2 0.093
CH3OH 0.0049CO 0.085

Catalysts 2018, 8, 255 7 of 28
Table 3. Industrial plant input data of conventional methanol synthesis process with two reactor(CR configuration) [9].
Feed Conditions Values
Feed mole fractionCO 0.0868CO2 0.0849H2 0.6461
CH4 0.0947N2 0.0847
H2O 0.001CH3OH 0.0037
Input temperature (K) 401Molar flow of feed in each tube (mol/s) 1.8
Feed input pressure (bar) 76
2.2.2. AW Configuration
Figure 1b demonstrates the schematic diagram of AW configuration. The AW configurationconsists of two reactors including adiabatic reactor and water-cooled reactor. The reaction of methanolsynthesis is carried out over CuO/ZnO/Al2O3 catalyst. In this configuration, the water-cooled reactortubes are loaded with catalyst. In the first step, syngas enters the first reactor which is the adiabaticreactor. The catalyst bed of adiabatic reactor has a high cross section-to-depth ratio so that the gaspressure drop along the length of the catalyst bed is less than 0.5 bar (see Section 6.2). Due to theexothermic feature of methanol synthesis reaction, the temperature of the gas flowing inside theadiabatic reactor increases somewhat as it is passing along the catalyst bed. Then, the product ofthe adiabatic reactor that contains methanol is introduced into the water-cooled reactor that is thesecond reactor. In the water-cooled reactor, reacting gas passes through tubes countercurrent to waterwhich is flowing through the shell. Therefore, heat is transmitted from the reaction side to water in theshell to retain the driving force of reaction over the length of the catalyst bed. A benefit associatedwith the present novel configuration is that temperature increase along the length of adiabatic reactorprevents water and methanol condensation inside this reactor. Therefore, catalyst lifetime of thisnovel configuration is higher than that of conventional methanol synthesis configuration. A furtheradvantage of AW configuration is that high cross section-to-length ratio of adiabatic reactor catalyst bedfacilitates the heat transfer from the catalyst at the bottom of the bed to relatively cooler catalyst locatedat the catalyst bed surface. So, an increase in the average temperature of adiabatic reactor catalyst bedenhances the reaction rate [53]. The operating conditions, reactor, and catalyst specifications in AWconfiguration are represented in Table 4.
Table 4. The operating conditions and specification of reactors and catalyst of AW configuration.
ParametersAdiabatic Reactor Water-Cooled Reactor
Values Values
Shell diameter (m) - 4.5Tube diameter (m) - 0.038
Reactor diameter (m) 5.5 -Reactor length (m) 2.6 8.4
Particle diameter (m) 0.0057 0.0057Catalyst bed density (kg/m3) 1140 1140
Bed void fraction 0.39 0.39Number of tubes - 5955
Rate of feed stream (mol/s) 17,865 -Input pressure (bar) 75 -

Catalysts 2018, 8, 255 8 of 28
Table 4. Cont.
ParametersAdiabatic Reactor Water-Cooled Reactor
Values Values
Input temperature (K) 513 -Input tube side pressure (bar) - 74.64
Input shell side temperature (K) - 513Mass flow rate of the shell side (kg/h) - 151,437
Feed Composition (Mole Basis) Values
H2 0.6334CH4 0.1006CO2 0.0832H2O 0.00039N2 0.093
CH3OH 0.0049CO 0.085
2.2.3. ACW Configuration
Figure 1c shows the schematic diagram of ACW configuration. The reactors and catalyst ofthis configuration are same as AW configuration. At first, syngas enters the first reactor which isthe adiabatic reactor, with a high cross-section to depth ratio. The temperature of the gas flowinginside the adiabatic reactor increases because of the exothermic feature of methanol synthesis reaction.The product of the first reactor is driven to the condenser and separator, respectively, to separatea part of water and methanol. The temperature of flow leaving the condenser is increased by theheater to reach the temperature that is indispensable for starting the methanol synthesis reaction inthe water-cooled reactor. For further syngas conversion to methanol, flow leaving the heater is routedto the water-cooled reactor. A benefit associated with ACW configuration is that separating a part ofmethanol and water by condenser improves the driving force of methanol synthesis reaction towardthe product in the water-cooled reactor. The operating conditions and specification of the water-cooledreactor, adiabatic reactor, and condenser are presented in Tables 5–7.
Table 5. The operating conditions and specification of the water-cooled reactor of ACW configuration.
Parameters Values
Shell diameter (m) 4.5Tube diameter (m) 0.038Reactor length (m) 8.4Number of tubes 5955
Molar flow of feed in each tube(mol/s) 1.34
Input tube side pressure (bar) 74.24Input tube side temperature (K) 534.4Temperature of the shell side (K) 513
Mass flow rate of the shell side (kg/h) 151,437
Feed Mole Fraction Values
H2 0.5871CH4 0.1119CO2 0.0632H2O 0.0020N2 0.1036
CH3OH 0.0568CO 0.0754

Catalysts 2018, 8, 255 9 of 28
Table 6. The operating conditions and specification of adiabatic reactor of ACW configuration.
Parameters Values
Reactor diamaeter (m) 5.5Reactor length (m) 2.6
Rate of feed stream (mol/s) 17,865Input pressure (bar) 75
Input temperature (K) 513
Feed Mole Fraction Values
H2 0.6334CH4 0.1006CO2 0.0832H2O 0.00039N2 0.093
CH3OH 0.0049CO 0.085
Table 7. Molar flow rates and compositions of inlet flow, outlet flows, and energy requirement ofcondenser in ACW configuration.
Parameters Inlet Flow Outlet Flow (Vapor Phase) Outlet Flow (Liquid Phase)
Molar flow (mol/s) 17,217 15,955 1260
Component Mole Fraction Mole Fraction Mole Fraction
CH3OH 0.1185 0.0568 0.8988CO2 0.0598 0.0632 0.0173CO 0.0700 0.0754 0.0016
H2O 0.0067 0.0020 0.0652H2 0.5445 0.5871 0.0054N2 0.0962 0.1036 0.0037
CH4 0.1043 0.1119 0.0080
Condenser Duty (KJ/s) 138,861
2.3. Mathematical Model
2.3.1. Reactor Model
In the current investigation, a homogeneous model is considered in one-dimension to calculatethe components molar flow and temperature along the length of reactors of proposed configurations.This model was proposed by Rezaie et al. [54] in which exterior mass transfer is eliminated, and thecalculations are performed by temperature and concentration of the gas flow. In fact, gas and solidphase behaviors which are in contact with each other are very close inside the reactor. Therefore,applying this model can reduce the level of computations without significant reduction in accuracy [54].In the proposed model, the following assumptions are considered: it is assumed that the gas phaseis the ideal gas, the steady-state condition is established during the process, mass and heat diffusionin axial direction are ignored, due to the insignificant heat dissipation, radial temperature changeis negligible, also the mass transfer in radial direction is not significant (one-dimensional model),the porosity of bed is constant in radial and axial directions, and the flow pattern inside the reactor isconsidered laminar plug flow [9,39]. Energy balance and mole balances were achieved by consideringa differential element in axial direction. Regarding mentioned presumptions, the reaction side materialbalance of water-cooled, gas-cooled, and adiabatic reactors are represented as
− 1Ac
dFidz
+ ∑j
ηνi.jrjρb = 0 (7)

Catalysts 2018, 8, 255 10 of 28
In which i and j are the numerator of component and reaction, respectively, ρb is the density ofcatalyst bed, ri is the reaction rate of component i, Ac is the cross section area of reaction side, νij is thecoefficient of each component (i) in each reaction (j), and the effectiveness factor (η) is computed bymodel of dusty gas [55].
The following equation shows the reaction side energy balance of water-cooled and gas-cooledreactors of CR configuration
−Cp
Ac
d(FtT)dz
+ ρb ∑j
ηri.j
(−∆H f .i
)± πDi
AcU1−2
(Tshell − Ttube
)= 0 (8)
In which Cp is the heat capacity of the gas phase, T exhibits the temperature of the reactionside, Tshell and Ttube displays the temperature of the shell side and the tube side and ∆Hi displaysthe heat change of the reaction. It should be mentioned that in the gas-cooled reactor the reaction isaccomplished in the shell side and syngas is passing through the tube side in order to absorb heatfrom the shell side. The reaction does not occur in gas-cooled reactor tubes, so the molar flow rate isconstant in tubes of this reactor. On the other hand, the reaction side of the water-cooled reactor is thetube side and the temperature along the shell side of this reactor is constant at 513 K.
The energy balance inside the adiabatic reactor of AW and ACW configurations is expressed as
−Cp
Ac
d(FtT)dz
+ ρb ∑j
ηri.j
(−∆H f .i
)= 0 (9)
The energy balance of the water-cooled reactor of AW and ACW configurations is same asEquation (8).
The pressure drop along reactors of CR, AW and ACW configurations is calculated byErgun equation
dpdz
= 150(1− ε)2µug
ε3d2p
+ 1.75(1− ε)u2
gρ
ε3dp(10)
The following initial conditions are used to solve the set of developed equations for each of theCR, AW, and ACW configurations
z = 0 P = P0 T = T0 yi = y0i i = 1− 2− . . .− N (11)
Therefore, mentioned differential-algebraic equations (DAE) are coupled with reaction rates,transport properties, and other auxiliary equations to model the methanol reactors. This setof equations are solved by applying a backward finite difference approximation in MATLABprogramming environment.
2.3.2. Thermodynamic Model
Dew Point Calculation
Dew point is the condition that the first droplet is condensed [9]. At this point the followingrelationship is established
∑i
xi = ∑i(yi/Ki) = 1 (12)
In which Ki is the K value of each component. Therefore, the dew point temperature can becalculated at each point of the reactor so that the above-mentioned equation is equal to unity at thattemperature. For this purpose, the K value of each component at each temperature is calculated bythe following procedure. It should be mentioned that liquid and gas phases are in equilibrium at dewpoint. Regarding the thermodynamic concepts, the fugacity in liquid and gas phases are equal for eachcomponent [39]

Catalysts 2018, 8, 255 11 of 28
f vi = yi ϕ
vi = xi ϕ
li = f l
i (13)
In which the subscript i is the numerator of each component. Also, liquid and vapor phases areshown respectively with l and v superscripts. Fugacity coefficient is shown by φ and fugacity is shownby f. Gas and liquid phases molar compositions are indicated by y and x, respectively. Therefore, the kvalue (gas to liquids mole fraction ratio) can be calculated as [39]
Ki =yixi
=ϕl
iϕv
i(14)
The modified Soave–Redlich–Kwong (SRK) equation of state is applied to calculate the fugacitycoefficient of each phase [39]
ϕi = exp(
bib(Z− 1)− q ln
(Z + B
Z
)− ln(Z− B)
)(15)
b = ∑i
yibi (16)
a = ∑i
∑j
yiyj(1− kij
)√aiaj (17)
B = bP
RT(18)
q =a
bRT(19)
q = q
2(
∑j yj(1− kij
)√aiaj
)a
− bib
(20)
where R, Z, and T are respectively the gas constant, compressibility factor and temperature. b and aare the pure gas phase parameters (calculated by using [39,56–58]) and ki,j is the binary interactioncoefficient (presented in [20,39]). In order to calculate the fugacity of liquid and gas phases, the liquidand gas phase compressibility factors should be replaced in Equation (15), respectively. The followingequations are applied to calculate the liquid and gas phases compressibility factor [59]
Zl = B + Zl(Zl + B)(
1 + B− ZlqB
)(21)
Zv = 1 + B− qB(
Zv − B(Zv + B)Zv
)(22)
A solution method of two abovementioned equations is trial and error. So, the best first guessesfor Zl and Zv are B and 1, respectively [59].
Flash Calculation
In this research, the flash calculation approach is applied for modeling the separator in the processin which thermodynamic equilibrium state is established between liquid and gas phases. Therefore,the vapor fraction and liquid and gas phases composition are estimated by this method at the inletcomposition of the gas stream to the separator and at the temperature and pressure that gas streamis supposed to be cooled until that temperature and pressure. The fundamental equation of flashcalculation approach is [9]
xi =zi
1 + Vf rac(Ki − 1)(23)

Catalysts 2018, 8, 255 12 of 28
In which K value of each component is calculated by applying Equations (14) to (22) at thetemperature and pressure that gas stream is supposed to be cooled until that temperature and pressure.zi is the composition of the inlet gas stream to the separator and xi is the composition of the liquidphase which is formed inside the separator. The parameter of Vfrac is the vapor fraction which isunknown. In order to calculate this parameter, the following summations can be applied [9]
∑i
xi = 1 (24)
∑i
Kixi = ∑i
yi = 1 (25)
The result of these summations is the Rachford–Rice equation which is the most suitable equationfor flash calculations to obtain the Vfrac [9]. It is easy to solve it numerically. This equation isrepresented as
∑i
zi(Ki − 1)1 + Vf rac(Ki − 1)
= 0 (26)
2.4. Model Validation
With the aim of validating the precision of proposed model, the modeling outcome of CRconfiguration is compared with industrial plant data [9]. As it is shown in Table 8, there is a goodagreement between the plant data and the modeling outcome. So, the introduced model was successfulto simulate the industrial condition.
Table 8. Comparison between the outcome of the model and industrial data of CR configuration.
ParametersModel Industrial Data Error %
Reactor Outlet Reactor Inlet Reactor Outlet
Temperature (K) 493.43 401 495 0.31
Mole Fraction
CH3OH 0.1062 0.0037 0.104 2.14CO2 0.0815 0.0849 0.0709 14.89CO 0.0227 0.0868 0.0251 −9.42
H2O 0.0204 0.001 0.0234 −12.70H2 0.5572 0.6461 0.5519 0.96N2 0.1009 0.0828 0.1107 −8.81
CH4 0.1133 0.0947 0.114 −0.64
2.5. Comparison between Temperature Profiles of CR, AW, and ACW Configurations
Figure 2a shows the temperature profile along the reactors of CR configuration. At first,the temperature along the length of water-cooled reactor increases due to the exothermic reactionof methanol synthesis and then the temperature decreases because of the heat transfer between thereaction side and water in the shell side. The average temperature of the gas-cooled reactor is less thanthat of the water-cooled reactor. For this reason, water and methanol are condensed near the bottomof the gas-cooled reactor which decreases the catalyst lifetime [10,37]. Since the catalyst of reactionincludes Cu and ZnO, water reinforces the rate of crystallization of these two components whichreduces the catalyst active sites and consequently deactivates the catalyst [17,37–39]. Moreover, water isadsorbed by alumina which is the hydrophilic component of the reaction catalyst and deactivates thecatalyst [39]. Therefore, the formation of gas condensate inside this reactor is a major drawback of CRconfiguration which deactivates the methanol synthesis catalyst and reduces the methanol productionefficiency. In Figure 2b, the temperature profile along the reactors of AW and ACW are compared.Since the cooling flow is not applied inside the adiabatic reactor in these two proposed configurations,

Catalysts 2018, 8, 255 13 of 28
the temperature increases along the length of this reactor and also the minimum temperature insidethe adiabatic reactor is greater than that of the gas-cooled reactor. Consequently, the gas condensate isnot formed inside adiabatic reactor which results in increasing the catalyst lifetime in comparison withthe gas-cooled reactor. A further advantage of AW configuration is that high cross section-to-lengthratio of adiabatic reactor catalyst bed facilitates the heat transfer from the catalyst at the bottom ofthe bed to relatively cooler catalyst located at the surface of the catalyst bed. So, the high averagetemperature of adiabatic reactor catalyst bed and also temperature increase along this reactor enhancethe reaction rate [53]. Therefore, the methanol production efficiency of AW and ACW configurations isgreater than that of CR configuration. Furthermore, the temperature along the water-cooled reactorof ACW configuration is greater than that of AW configuration. Because, in ACW configuration,a part of methanol and water leaving the adiabatic reactor is condensed and separated before enteringthe water-cooled reactor that increases the reaction driving force inside the water-cooled reactor toproduce more methanol and consequently heat. Also, the flow rate of gas passing thru the tubesof the water-cooled reactor in ACW configuration is less than that of AW configuration. For thesereasons, the average temperature inside the water-cooled reactor of ACW configuration is greater incomparison with AW configuration.
Due to the equilibrium feature of reactions (1) and (3), the excessive increase in temperatureof reaction side directs reactions (1) and (3) towards the reactants. Also, regarding to the pointthat copper based catalyst are susceptible to higher temperature, so excessive temperature increaseleads to the thermal sintering and deactivation of the methanol synthesis catalyst [42]. Therefore,the length of adiabatic reactor catalyst bed is attended and optimized to 2.6 m in order to controlthe temperature increase along the length of catalyst bed. So, the other benefit associated with thenovel AW configuration is that the maximum temperature of the gas flowing inside adiabatic andwater-cooled reactors of AW configuration is less than that of water-cooled and gas-cooled reactors inCR configuration. Therefore, since the high temperature of reaction side leads to the copper-basedcatalyst thermal sintering and reduction in the catalyst activity and durability, replacing the gas-cooledreactor with the adiabatic one results in preventing the methanol synthesis catalyst from deactivationand improving the catalyst lifetime.
Figure 2. Cont.

Catalysts 2018, 8, 255 14 of 28
Figure 2. Temperature profile along reactors in (a) CR configuration; and (b) AW andACW configurations.
As it is mentioned, the cooling flow is not used in the adiabatic reactor and consequently thetemperature increases along this reactor. Accordingly, methanol and water are not condensed insidethe adiabatic reactor. Therefore, the dew point temperature is only calculated along the length of thewater-cooled reactor and the results are compared with temperature profile along this reactor in AWand ACW configurations (see Figure 3a,b). As it is exhibited, the temperature along the water-cooledreactor is greater than the corresponding dew point temperature at each point of the reactor. So,the gas condensate is not formed inside the water-cooled reactor. Also, the comparison between AWand ACW configurations shows that the difference between dew point temperature and temperaturealong the reactor in ACW configuration is greater in comparison with AW configuration. Becauseseparating a part of methanol and water leaving the adiabatic reactor before entering water-cooledreactor leads to a reduction in the dew point temperature inside the water-cooled reactor in ACWconfiguration. Moreover, dew point temperature increases along the water-cooled reactor in AW andACW configurations due to increase in methanol mole flow along the reactor. Furthermore, increasein the dew point temperature of the water-cooled reactor in ACW configuration is greater than thatof AW configuration. Because separating a part of methanol and water before entering water-cooledreactor leads to increase in driving force of methanol production and the dew point temperature alongthe water-cooled reactor in ACW configuration.
2.6. Comparison between Pressure Profiles of CR, AW, and ACW Configurations
The pressure drop along the reactors in CR, AW, and ACW are shown in Figure 4a,b. As itis exhibited in Figure 4b, the pressure drop along the adiabatic reactor in both AW and ACWconfigurations is around 0.35 bar which is less than pressure drop along the gas-cooled reactor.Moreover, the total pressure drop in CR, AW and ACW configurations are 4.8, 4, and 3.5 bar,respectively. So, AW and ACW configurations have less pressure drop in comparison with CRconfiguration which has a significant effect on reducing the operating cost. Furthermore, because thestoichiometric coefficients of gas reactants in reactions (1) and (3) are greater than that of products,so greater pressure along the reactors of AW and ACW configurations in comparison with CRconfiguration leads to improvement in driving force of equilibrium reactions (1) and (3) towardsthe product to produce more methanol.

Catalysts 2018, 8, 255 15 of 28
In addition, the pressure drop along the water-cooled reactor in AW configuration is greaterthan that of ACW configuration due to the greater total molar flow of gas inside the water-cooledreactor in AW configuration in comparison with that of ACW configuration. Furthermore, the inletflow pressure of water-cooled reactor in ACW configuration is less than that of AW configuration,because flow leaving the adiabatic reactor in ACW configuration is routed to a condenser, separator,and heater, respectively, which leads to a reduction of flow pressure before entering water-cooledreactor in comparison with AW configuration.
Figure 3. Comparison between temperature profile and dew point temperature along the water-cooledreactor in (a) AW configuration; and (b) ACW configuration.

Catalysts 2018, 8, 255 16 of 28
Figure 4. Pressure profile along reactors in (a) CR configuration; and (b) AW and ACW configurations.
2.7. Comparison between Molar Flow Rate of Methanol in CR, AW, and ACW Configurations
As it is shown in Figure 5a–c, molar flow rate of methanol improves consistently as the syngasis flowing through the catalyst bed of the reactors. In comparison between CR, AW, and ACWconfigurations, the methanol molar flow which is produced by AW and ACW configuration isgreater than that of CR configuration. In fact, AW and ACW configurations improve the methanolproduction rate around 25.5% and 43.1% in comparison with CR configuration, respectively. Becausethe temperature increase along the length of adiabatic reactor catalyst bed enhances the rate of methanolsynthesis reaction. The other benefit associated with AW and ACW configuration is that high crosssection-to-length ratio of adiabatic reactor catalyst bed facilitates the heat transfer from the catalystat the bottom of the bed to relatively cooler catalyst located at the catalyst bed surface. Accordingly,increase in the average temperature of the catalyst bed is followed by increasing the reaction rate [53].Furthermore, the low pressure drop along the adiabatic reactor catalyst bed directs reactions (1) and(3) towards the product. On the other hand, the reactions of (1) and (3) are exothermic reactions, so the

Catalysts 2018, 8, 255 17 of 28
excessive temperature increase along the length of catalyst bed leads the reverse reactions of (1) and (3)to take place to convert the methanol to the reactants and absorb heat from the reaction side. For thisreason, the length of the adiabatic catalyst bed is optimized around 2.6 m to prevent the reverse reactionof methanol synthesis. In comparison between AW and ACW configurations in Figure 5b, the methanolproduction efficiency of ACW configuration is greater than that of AW configuration. The reason isthat methanol and water separation from the flow of gas before entering the water-cooled reactorenhances the driving force of reactions (1) and (3) towards the product. Consequently, the methanolproduction rate by ACW configuration is greater than that of AW configuration.
Figure 5. Methanol molar flow rate along reactors in (a) CR configuration; and (b) AW andACW configurations.
2.8. Comparison of H2, CO, and CO2 Conversions between CR, AW, and ACW Configurations
The conversion of H2, CO, and CO2 along the reactors of CR, AW, and ACW configurations areexhibited in Figures 6–8. The H2, CO, and CO2 conversions are calculated by applying Equations(27)–(29), respectively, which are mentioned in the following. It is shown in Figure 6a,b that H2

Catalysts 2018, 8, 255 18 of 28
conversions increases continuously along the reactors catalyst bed. Moreover, comparison of H2
conversion between CR, AW, and ACW configurations demonstrates that conversion of this componentalong the adiabatic reactor of AW and ACW configurations is less than that of water-cooled reactor inCR configuration. Because the temperature increase along water-cooled reactor in CR configurationis greater than that of adiabatic reactor, also the reaction (2) is endothermic reaction. So, greatertemperature increase along water-cooled reactor in CR configuration in comparison with that ofadiabatic reactor in AW and ACW configuration reinforces the driving force of reaction (2) to convertmore H2 to the product. Consequently, the H2 conversion in CR configuration is greater than thatof AW and ACW configurations. Figure 6b exhibits that H2 conversion of ACW configuration isgreater than that of AW configuration due to the separation of methanol and water partially before thewater-cooled reactor in ACW configuration which leads to increase in conversion of H2 to methanol.
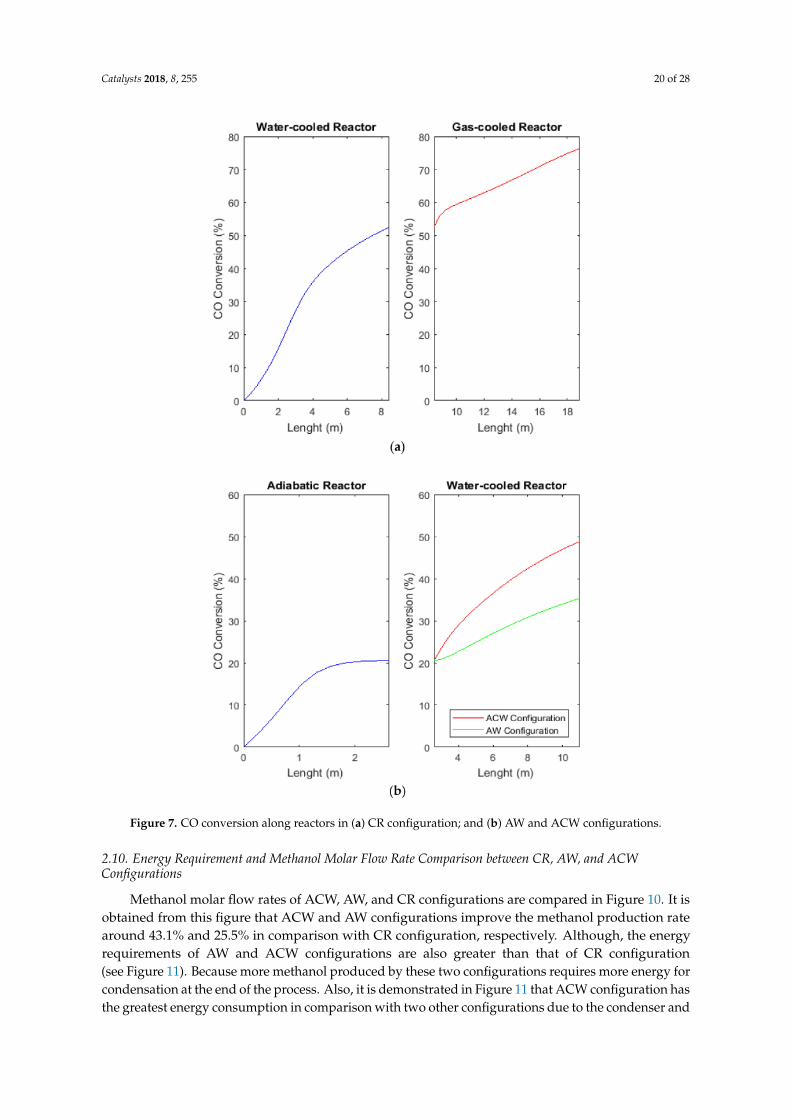
It is shown in Figures 7 and 8 that CO and CO2 conversions increase as the syngas is passingthrough the catalyst bed of reactors. Also, it is exhibited that the CO and CO2 conversions in ACWconfiguration are greater than that of AW configuration due to the reason mentioned previously.The comparison between Figure 7a,b shows that CO conversion along the first reactor (adiabaticreactor) of AW and ACW configurations is less than that of the first reactor (water-cooled reactor) inCR configuration. While, in the Figure 8a,b, it is demonstrated that CO2 conversion of adiabatic reactor(first reactor) in AW and ACW configuration is greater than the water-cooled reactor (first reactor) inCR configuration. Regarding the stoichiometric coefficients of reactions (1) and (3), gas reactantsstoichiometric coefficients of CO hydrogenation reaction (reaction (1)) is less than that of CO2
hydrogenation reaction (reaction (3)). Also, due to the small pressure drop along the adiabatic reactor,the pressure along this reactor is greater than that of the water-cooled reactor in CR configuration.According to the equilibrium reaction law, at high pressure, the driving force of the reaction thathas greater gas reactants stoichiometric coefficients (reaction (3)) is greater than that of the reactionwith smaller gas reactants stoichiometric coefficients (reaction (1)). Therefore, the CO2 conversionto methanol of AW and ACW configurations is greater than that of CR configuration, while the COconversion to methanol of AW and ACW configurations is less than that of CR configuration.
H2 conversion (%) =FH2. in − FH2. out
FH2. in× 100 (27)
CO conversion (%) =FCO. in − FCO. out
FCO. in× 100 (28)
CO2 conversion (%) =FCO2. in − FCO2. out
FCO2. in× 100 (29)
2.9. Comparison of H2O Mole Fraction between CR, AW, and ACW Configurations
It is exhibited in Figure 9a,b that the mole fraction of water along the reactors of AW and ACWconfigurations is less than that of CR configuration. Since the H2 conversion in AW and ACWconfigurations is less than that of CR configuration due to the reasons mentioned before, so less wateris produced by reaction (2) in AW and ACW configuration, consequently, the water mole of thesetwo configurations is less than that of CR configuration. It should be mentioned that water mole fractionat the inlet of the water-cooled reactor in ACW configuration is less than that of AW configurationbecause of separating a part of methanol and water between adiabatic and water-cooled reactor.Moreover, increase in mole fraction of water along the water-cooled reactor in ACW configuration isgreater than that of AW configuration due to the water and methanol separation before the water-cooledreactor which increases the driving force of methanol synthesis reactions towards the product includingwater (see Figure 9b). Since the catalyst of reaction includes Cu and ZnO, water reinforces the rateof crystallization of these two components which reduces the catalyst active sites and consequentlydeactivates the catalyst [17,38,39]. Moreover, water is adsorbed by alumina which is the hydrophilic

Catalysts 2018, 8, 255 19 of 28
component of the reaction catalyst and deactivates the catalyst [39]. Because water vapor causesthe deactivation of the copper based catalyst and reduces active sites of the catalyst [10,17,37–40],the durability and activity of the copper based methanol synthesis catalyst is improved by AW andACW configurations in which the gas-cooled reactor is replaced with the adiabatic reactor.
Figure 6. H2 conversion along reactors in (a) CR configuration; and (b) AW and ACW configurations.
Catalysts 2018, 8, 255 20 of 28
Figure 7. CO conversion along reactors in (a) CR configuration; and (b) AW and ACW configurations.
2.10. Energy Requirement and Methanol Molar Flow Rate Comparison between CR, AW, and ACWConfigurations
Methanol molar flow rates of ACW, AW, and CR configurations are compared in Figure 10. It isobtained from this figure that ACW and AW configurations improve the methanol production ratearound 43.1% and 25.5% in comparison with CR configuration, respectively. Although, the energyrequirements of AW and ACW configurations are also greater than that of CR configuration(see Figure 11). Because more methanol produced by these two configurations requires more energy forcondensation at the end of the process. Also, it is demonstrated in Figure 11 that ACW configuration hasthe greatest energy consumption in comparison with two other configurations due to the condenser and

Catalysts 2018, 8, 255 21 of 28
heater being applied before the water-cooled reactor. The schematic diagram of energy consumptionby heater and condenser in CR, AW, and ACW configurations are shown in Figure 12a–c. However,ACW configuration produces the greatest amount of methanol molar flow, but it also requires thegreatest amount of energy.
Figure 8. CO2 conversion along reactors in (a) CR configuration; and (b) AC and ACW configurations.

Catalysts 2018, 8, 255 22 of 28
Figure 9. Water mole fraction (%) along the reactors in (a) CR configuration; and (b) AW andACW configurations.
Figure 10. Methanol molar flow rate comparison between CR, AW, and ACW configurations.

Catalysts 2018, 8, 255 23 of 28
Figure 11. Energy requirement comparison between CR, AW, and ACW configurations.
Figure 12. The schematic diagram of the energy requirement of (a) CR configuration; (b) AWconfiguration; and (c) ACW configuration.

Catalysts 2018, 8, 255 24 of 28
3. Conclusions
The condensation of gas inside the gas-cooled reactor in conventional two-stage methanolsynthesis process (CR configuration) causes the catalyst deactivation [9,10,17,37–40]. So, in thecurrent study, novel AW and ACW configurations are represented in which the gas-cooled reactoris replaced with the adiabatic reactor. Moreover, a condenser is applied between adiabatic andwater-cooled reactors in ACW configuration. Results show that temperature increases along theadiabatic reactor that prevents methanol and water condensation and also improves the reactionrate inside this reactor. Besides, the adiabatic reactor maximum temperature is less than that ofthe first reactor in CR configuration which prevents copper based catalyst thermal sintering [42].The pressure drop along the adiabatic reactor is small due to the high cross section-to-length ratio ofthis reactor [53]. Consequently, the high pressure along the adiabatic reactor catalyst bed improves thedriving force of CO2 hydrogenation to methanol reaction which has positive environmental effects.Therefore, the methanol mole flow rate produced by AW and ACW configurations increase around25.5% and 43.1%, respectively, in comparison with CR configuration. Methanol production by ACWconfiguration is greater than that of AW configuration due to partial condensation and separationof water and methanol from the flow before entering the water-cooled reactor which increases themethanol synthesis reaction driving force. Furthermore, the water mole fraction along the catalystbed of reactors in AW and ACW configurations is less than that of CR configuration. Given that watervapor causes catalyst deactivation and reduces active sites of the catalyst [10,17,37–40], so, the lesswater mole fraction along the reactors of AW and ACW configurations leads to the improvement incatalyst activity and life time. From the energy perspective, the order of energy requirement by thesethree configurations is as following ACW > AW > CR. Eventually, novel AW and ACW configurationscan provide many benefits including eliminating the gas condensate formation, improvement in thecatalyst lifetime and activity, CO2 conversion, and the methanol production rate.
Author Contributions: B.R. and M.R.R. sketched the configurations; B.R. carried out the modeling of the process,M.R.R., and P.K. took part in analyzing the model results; B.R. wrote the paper.
Conflicts of Interest: The authors declare no conflict of interest.
Nomenclatures
Ac reaction side cross-section (m2)Ei activation energy of reaction (kJ kmol−1)Cp specific heat of gas (J mol−1 K−1)dp diameter of particle (m)fi fugacity (Pa)Ft total molar flow rate (mol s−1)Fi the component’s molar flow rate (mol s−1)∆Hf,i component (i) formation enthalpy (J mol−1)ki reaction rate coefficient (mol kg-1 s−1 bar−1/2)Ki adsorption equilibrium constant (bar−1)Ki k valueKpi constant of equilibriumL length of reactor (m)P total pressure (Pa)R universal gas constant (J mol−1 K−1)ri rate of reaction (mol kg−1 s−1)U overall heat transfer coefficient between two sides (W m−2 K−1)Vfrac vapor fractionT temperature (K)ug gas velocity (m s−1)

Catalysts 2018, 8, 255 25 of 28
xi component mole fraction in the liquid phaseyi component mole fraction in the gas phasez axial reactor coordinate (m)Z compressibility factorGreek letter∆H heat of reaction (J mol−1)νi,j component stoichiometric coefficient in each reactionε void fraction of bedφi fugacity coefficientµ viscosity (Pa s)ρ gas phase density (kg m−3)ρb catalyst bed density (kg m−3)η effectiveness factor of catalystSubscript and Superscriptsi indicator of componentj indicator of reaction0 inlet conditionv vapor phasel liquid phaseg in bulk of gas phaseAbbreviationsCFD computational fluid dynamicsCR conventional methanol synthesis reactorAW name of the proposed configurationACW name of the proposed configurationRWGS reverse water gas shift reactionDAE differential-algebraic equations
References
1. Bayat, M.; Heravi, M.; Rahimpour, M.R. Sorption enhanced process by integrated heat-exchanger reactorassisted by fluidization concept for methanol synthesis. Chem. Eng. Process. Process Intensif. 2016, 110, 30–43.[CrossRef]
2. Bakhtyari, A.; Haghbakhsh, R.; Rahimpour, M.R. Investigation of thermally double coupled doublemembrane heat exchanger reactor to produce dimethyl ether and methyl formate. J. Nat. Gas Sci. Eng. 2016,32, 185–197. [CrossRef]
3. Bakhtyari, A.; Mohammadi, M.; Rahimpour, M.R. Simultaneous production of dimethyl ether (DME), methylformate (MF) and hydrogen from methanol in an integrated thermally coupled membrane reactor. J. Nat.Gas Sci. Eng. 2015, 26, 595–607. [CrossRef]
4. Bakhtyari, A.; Parhoudeh, M.; Rahimpour, M.R. Optimal conditions in converting methanol to dimethyl ether,methyl formate, and hydrogen utilizing a double membrane heat exchanger reactor. J. Nat. Gas Sci. Eng.2016, 28, 31–45. [CrossRef]
5. Bakhtyari, A.; Darvishi, A.; Rahimpour, M.R. A heat exchanger reactor equipped with membranes to producedimethyl ether from syngas and methyl formate and hydrogen from methanol. Int. J. 2016, 3, 65.
6. Khanipour, M.; Mirvakili, A.; Bakhtyari, A.; Farniaei, M.; Rahimpour, M.R. Enhancement of synthesisgas and methanol production by flare gas recovery utilizing a membrane based separation process.Fuel Process. Technol. 2017, 166, 186–201. [CrossRef]
7. Mirvakili, A.; Bakhtyari, A.; Rahimpour, M.R. A CFD modeling to investigate the impact of flowmal-distribution on the performance of industrial methanol synthesis reactor. Appl. Therm. Eng. 2018,128, 64–78. [CrossRef]
8. Agahzamin, S.; Mirvakili, A.; Rahimpour, M.R. Investigation and recovery of purge gas streams to enhancesynthesis gas production in a mega methanol complex. J. CO2 Util. 2016, 16, 157–168. [CrossRef]
9. Mirvakili, A.; Rahimpour, M.R. Mal-distribution of temperature in an industrial dual-bed reactor forconversion of CO2 to methanol. Appl. Therm. Eng. 2015, 91, 1059–1070. [CrossRef]

Catalysts 2018, 8, 255 26 of 28
10. Forzatti, P.; Lietti, L. Catalyst deactivation. Catal. Today 1999, 52, 165–181. [CrossRef]11. Askari, F.; Rahimpour, M.R.; Jahanmiri, A.; Mostafazadeh, A.K. Dynamic Simulation and Optimization of a
Dual-Type Methanol Reactor Using Genetic Algorithms. Chem. Eng. Technol. 2008, 31, 513–524. [CrossRef]12. Santangelo, D.L.; Ahón, V.R.; Costa, A.L. Optimization of methanol synthesis loops with quench reactors.
Chem. Eng. Technol. 2008, 31, 1767–1774. [CrossRef]13. Parvasi, P.; Mostafazadeh, A.K.; Rahimpour, M.R. Dynamic modeling and optimization of a novel methanol
synthesis loop with hydrogen-permselective membrane reactor. Int. J. Hydrog. Energy 2009, 34, 3717–3733.[CrossRef]
14. Parvasi, P.; Rahimpour, M.R.; Jahanmiri, A. Incorporation of dynamic flexibility in the design of a methanolsynthesis loop in the presence of catalyst deactivation. Chem. Eng. Technol. 2008, 31, 116–132. [CrossRef]
15. Rahimpour, M.R.; Moghtaderi, B.; Jahanmiri, A.; Rezaie, N. Operability of an industrial methanol synthesisreactor with mixtures of fresh and partially deactivated catalyst. Chem. Eng. Technol. 2005, 28, 226–234.[CrossRef]
16. Sadeghi, S.; Vafajoo, L.; Kazemeini, M.; Fattahi, M. Modeling of the methanol synthesis catalyst deactivationin a spherical bed reactor: An environmental challenge. APCBEE Procedia 2014, 10, 84–90. [CrossRef]
17. Rahimpour, M.R.; Fathikalajahi, J.; Jahanmiri, A. Selective kinetic deactivation model for methanol synthesisfrom simultaneous reaction of CO2 and CO with H2 on a commercial copper/zinc oxide catalyst. Can. J.Chem. Eng. 1998, 76, 753–761. [CrossRef]
18. Wagialla, K.; Elnashaie, S. Fluidized-bed reactor for methanol synthesis. A theoretical investigation. Ind. Eng.Chem. Res. 1991, 30, 2298–2308. [CrossRef]
19. Graaf, G.H.; Scholtens, H.; Stamhuis, E.J.; Beenackers, A.A.C.M. Intra-particle diffusion limitations inlow-pressure methanol synthesis. Chem. Eng. Sci. 1990, 45, 773–783. [CrossRef]
20. Løvik, I. Modelling, Estimation and Optimization of the Methanol Synthesis with Catalyst Deactivation.Ph.D. Thesis, Department of Chemical Engineering (NTNU), Trondheim, Norway, 2001.
21. Velardi, S.A.; Barresi, A.A. Methanol synthesis in a forced unsteady-state reactor network. Chem. Eng. Sci.2002, 57, 2995–3004. [CrossRef]
22. Rahimpour, M.R. A two-stage catalyst bed concept for conversion of carbon dioxide into methanol.Fuel Process. Technol. 2008, 89, 556–566. [CrossRef]
23. Rahimpour, M.R.; Bayat, M. A novel cascade membrane reactor concept for methanol synthesis in thepresence of long-term catalyst deactivation. Int. J. Energy Res. 2010, 34, 1356–1371. [CrossRef]
24. Rahimpour, M.R.; Mostafazadeh, A.K.; Barmaki, M. Application of hydrogen-permselective Pd-basedmembrane in an industrial single-type methanol reactor in the presence of catalyst deactivation.Fuel Process. Technol. 2008, 89, 1396–1408. [CrossRef]
25. Rahimpour, M.R.; Ghader, S. Enhancement of CO conversion in a novel Pd–Ag membrane reactor formethanol synthesis. Chem. Eng. Process. Process Intensif. 2004, 43, 1181–1188. [CrossRef]
26. Rahimpour, M.R.; Lotfinejad, M. Enhancement of Methanol Production in a Membrane Dual-Type Reactor.Chem. Eng. Technol. 2007, 30, 1062–1076. [CrossRef]
27. Rahimpour, M.R.; Lotfinejad, M. Co-current and Countercurrent Configurations for a Membrane Dual TypeMethanol Reactor. Chem. Eng. Technol. 2008, 31, 38–57. [CrossRef]
28. Rahimpour, M.R.; Alizadehhesari, K. Enhancement of carbon dioxide removal in a hydrogen-permselectivemethanol synthesis reactor. Int. J. Hydrog. Energy 2009, 34, 1349–1362. [CrossRef]
29. Rahimpour, M.R.; Alizadehhesari, K. A Novel Fluidized-Bed Membrane Dual-Type Reactor Concept forMethanol Synthesis. Chem. Eng. Technol. 2008, 31, 1775–1789. [CrossRef]
30. Rahimpour, M.R.; Bayat, M.; Rahmani, F. Enhancement of methanol production in a novel cascadingfluidized-bed hydrogen permselective membrane methanol reactor. Chem. Eng. J. 2010, 157, 520–529.[CrossRef]
31. Rahimpour, M.R.; Bayat, M.; Rahmani, F. Dynamic simulation of a cascade fluidized-bed membrane reactorin the presence of long-term catalyst deactivation for methanol synthesis. Chem. Eng. Sci. 2010, 65, 4239–4249.[CrossRef]
32. Rahimpour, M.R.; Elekaei, H. Enhancement of methanol production in a novel fluidized-bedhydrogen-permselective membrane reactor in the presence of catalyst deactivation. Int. J. Hydrog. Energy2009, 34, 2208–2223. [CrossRef]

Catalysts 2018, 8, 255 27 of 28
33. Rahimpour, M.R.; Behjati, H.E. Dynamic optimization of membrane dual-type methanol reactor in thepresence of catalyst deactivation using genetic algorithm. Fuel Process. Technol. 2009, 90, 279–291. [CrossRef]
34. Manenti, F.; Cieri, S.; Restelli, M.; Bozzano, G. Dynamic modeling of the methanol synthesis fixed-bed reactor.Comput. Chem. Eng. 2013, 48, 325–334. [CrossRef]
35. Flavio, M.; Garcon-Leon, A.R.; Giulia, B. Energy-process integration of the gas-cooled/water-cooledfixed-bed reactor network for methanol synthesis. Chem. Eng. Trans. 2013, 1243–1248.
36. Bayat, M.; Rahimpour, M.R. Dynamic optimal analysis of a novel cascade membrane methanol reactor byusing genetic algorithm (GA) method. Energy Syst. 2013, 4, 137–164. [CrossRef]
37. Pask, J.A. Effect of Water Vapor on Sintering of Ceramic Oxides. In Sintering Key Papers; Springer: Dordrecht,The Netherlands, 1990; pp. 579–592.
38. Wu, J.; Saito, M.; Takeuchi, M.; Watanabe, T. The stability of Cu/ZnO-based catalysts in methanol synthesisfrom a CO2-rich feed and from a CO-rich feed. Appl. Catal. A Gen. 2001, 218, 235–240. [CrossRef]
39. Samimi, F.; Rahimpour, M.R.; Shariati, A. Development of an Efficient Methanol Production Process forDirect CO2 Hydrogenation over a Cu/ZnO/Al2O3 Catalyst. Catalysts 2017, 7, 332. [CrossRef]
40. Umegaki, T.; Kojima, Y.; Omata, K. Effect of oxide coating on performance of copper-zinc oxide-basedcatalyst for methanol synthesis via hydrogenation of carbon dioxide. Materials 2015, 8, 7738–7744. [CrossRef][PubMed]
41. Twigg, M.V.; Spencer, M.S. Deactivation of supported copper metal catalysts for hydrogenation reactions.Appl. Catal. A Gen. 2001, 212, 161–174. [CrossRef]
42. Twigg, M.V.; Spencer, M.S. Deactivation of copper metal catalysts for methanol decomposition, methanolsteam reforming and methanol synthesis. Top. Catal. 2003, 22, 191–203. [CrossRef]
43. Hughes, R. Deactivation of Catalysts; Academic Press: London, UK, 1984.44. Spencer, M. Stable and metastable metal surfaces in heterogeneous catalysis. Nature 1986, 323, 685. [CrossRef]45. Kung, H.H. Deactivation of methanol synthesis catalysts—A review. Catal. Today 1992, 11, 443–453.
[CrossRef]46. Arena, F.; Mezzatesta, G.; Zafarana, G.; Trunfio, G.; Frusteri, F.; Spadaro, L. How oxide carriers control the
catalytic functionality of the Cu–ZnO system in the hydrogenation of CO2 to methanol. Catal. Today 2013,210, 39–46. [CrossRef]
47. Arena, F.; Mezzatesta, G.; Zafarana, G.; Trunfio, G.; Frusteri, F.; Spadaro, L. Effects of oxide carriers onsurface functionality and process performance of the Cu–ZnO system in the synthesis of methanol via CO2
hydrogenation. J. Catal. 2013, 300, 141–151. [CrossRef]48. Saito, M.; Fujitani, T.; Takeuchi, M.; Watanabe, T. Development of copper/zinc oxide-based multicomponent
catalysts for methanol synthesis from carbon dioxide and hydrogen. Appl. Catal. A Gen. 1996, 138, 311–318.[CrossRef]
49. Arena, F.; Barbera, K.; Italiano, G.; Bunora, G.; Spadaro, L.; Frusteri, F. Synthesis, characterization and activitypattern of Cu–ZnO/ZrO2 catalysts in the hydrogenation of carbon dioxide to methanol. J. Catal. 2007, 249,185–194. [CrossRef]
50. Bartholomew, C.H. Mechanisms of catalyst deactivation. Appl. Catal. A Gen. 2001, 212, 17–60. [CrossRef]51. Rahmatmand, B.; Keshavarz, P.; Ayatollahi, S. Study of absorption enhancement of CO2 by SiO2, Al2O3, CNT,
and Fe3O4 nanoparticles in water and amine solutions. J. Chem. Eng. Data 2016, 61, 1378–1387. [CrossRef]52. Graaf, G.; Stamhuis, E.; Beenackers, A. Kinetics of low-pressure methanol synthesis. Chem. Eng. Sci. 1988, 43,
3185–3195.53. Eastland, P.H.D. A Reactor System, Plant and a Process for the Production of Methanol from Synthesis Gas; Johnson
Matthey Davy Technologies Ltd.: London, UK, 2012.54. Rezaie, N.; Jahanmiri, A.; Moghtaderi, B.; Rahimpour, M.R. A comparison of homogeneous and
heterogeneous dynamic models for industrial methanol reactors in the presence of catalyst deactivation.Chem. Eng. Process. Process Intensif. 2005, 44, 911–921. [CrossRef]
55. Bertau, M.; Offermanns, H.; Plass, L.; Schmidt, F. Methanol: The Basic Chemical and Energy Feedstock of theFuture; Springer: Heidelberg, Germany; New York, NY, USA; Dordrecht, The Netherlands; London, UK, 2014.
56. Hartig, F.; Keil, F.J. Large-scale spherical fixed bed reactors: Modeling and optimization. Ind. Eng. Chem. Res.1993, 32, 424–437. [CrossRef]

Catalysts 2018, 8, 255 28 of 28
57. Bennekom, J.G.V.; Winkelman, J.G.M.; Venderbosch, R.H.; Nieland, S.D.G.B.; Heeres, H.J. Modeling andexperimental studies on phase and chemical equilibria in high-pressure methanol synthesis. Ind. Eng.Chem. Res. 2012, 51, 12233–12243. [CrossRef]
58. Mathias, P.M. A versatile phase equilibrium equation of state. Ind. Eng. Chem. Process Des. Dev. 1983, 22,385–391. [CrossRef]
59. Smith, J.M.; Van Ness, H.C. Introduction to Chemical Engineering Thermodynamics, 7th ed.; McGraw-HillEducation: New York, NY, USA, 2015; ISBN 0073104450.
© 2018 by the authors. Licensee MDPI, Basel, Switzerland. This article is an open accessarticle distributed under the terms and conditions of the Creative Commons Attribution(CC BY) license (http://creativecommons.org/licenses/by/4.0/).