development: product design. the npd process phase 1: opportunity identification and selection phase...
Post on 20-Dec-2015
220 views
TRANSCRIPT
Development: Product Design
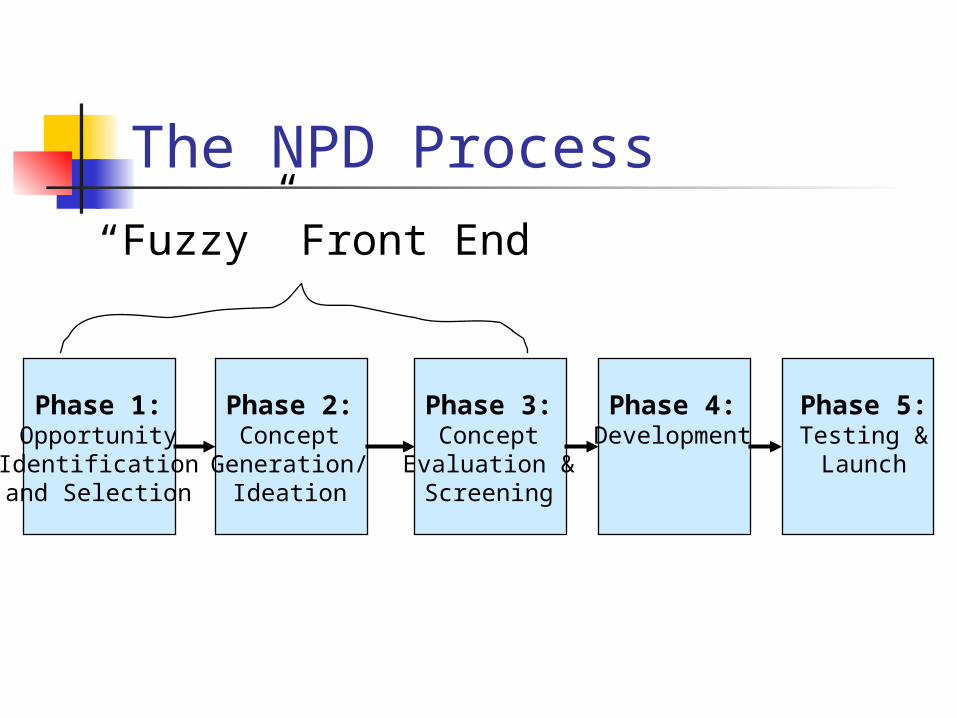
The NPD Process
Phase 1:Opportunity
Identificationand Selection
Phase 2:Concept
Generation/Ideation
Phase 3:Concept
Evaluation &Screening
Phase 4:Development
Phase 5:Testing &
Launch
“Fuzzy” Front End

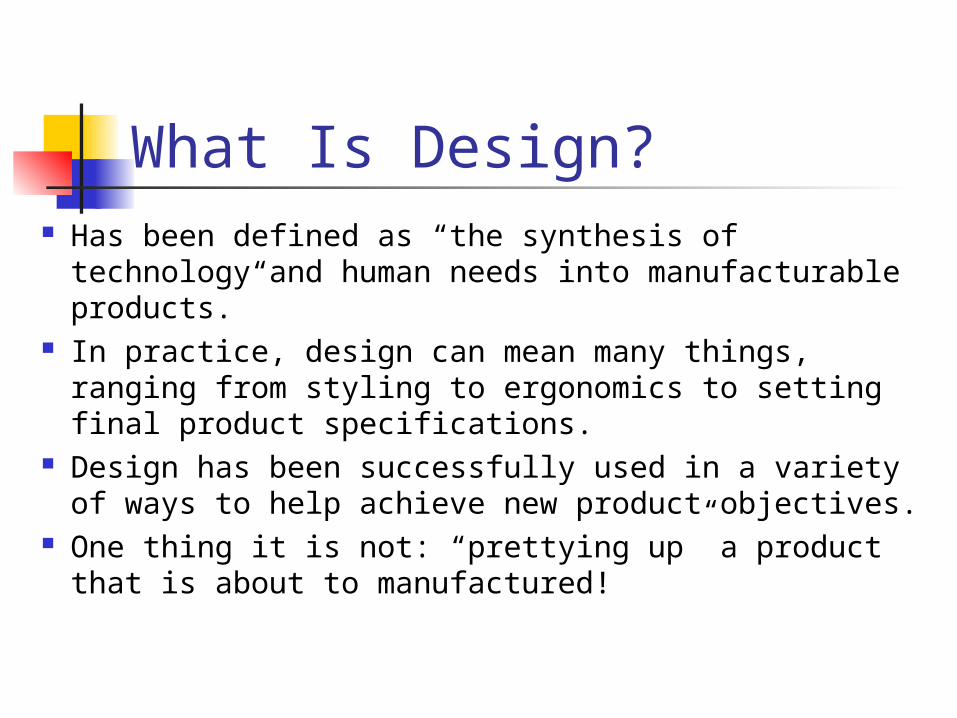
What Is Design? Has been defined as “the synthesis of technology
and human needs into manufacturable products.”
In practice, design can mean many things, ranging from styling to ergonomics to setting final product specifications.
Design has been successfully used in a variety of ways to help achieve new product objectives.
One thing it is not: “prettying up” a product that is about to manufactured!
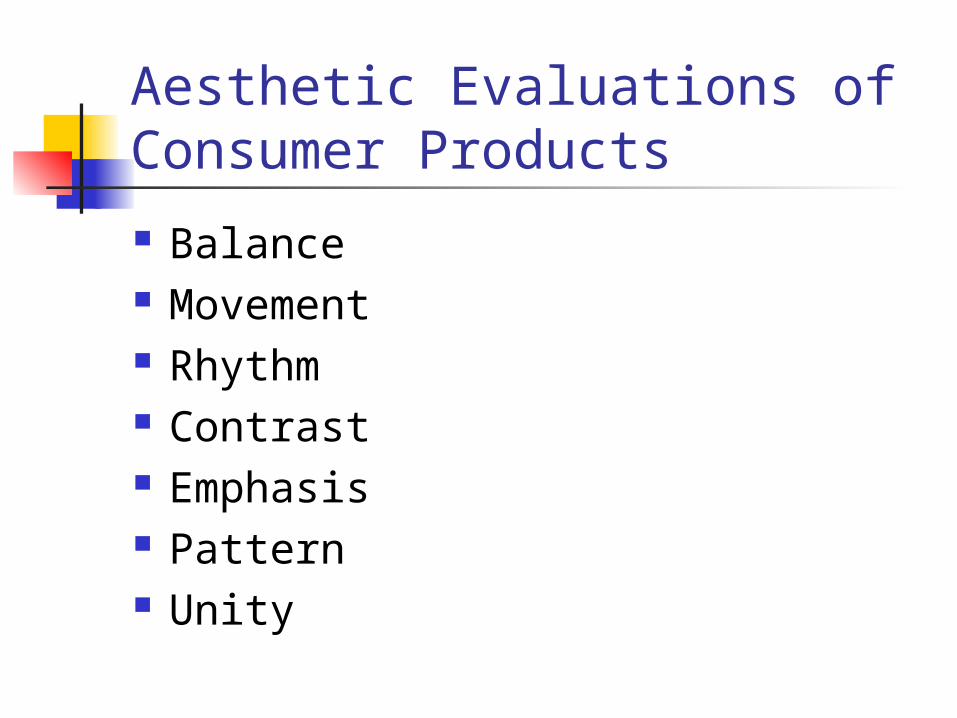
Aesthetic Evaluations of Consumer Products
Balance Movement Rhythm Contrast Emphasis Pattern Unity
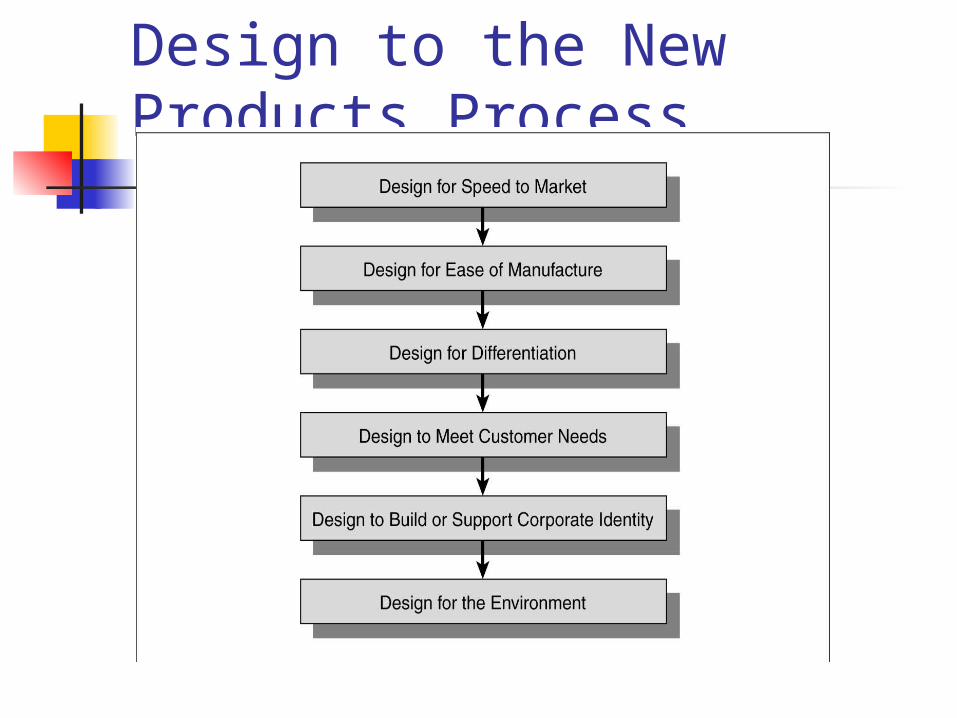
Contributions of Design to the New Products Process
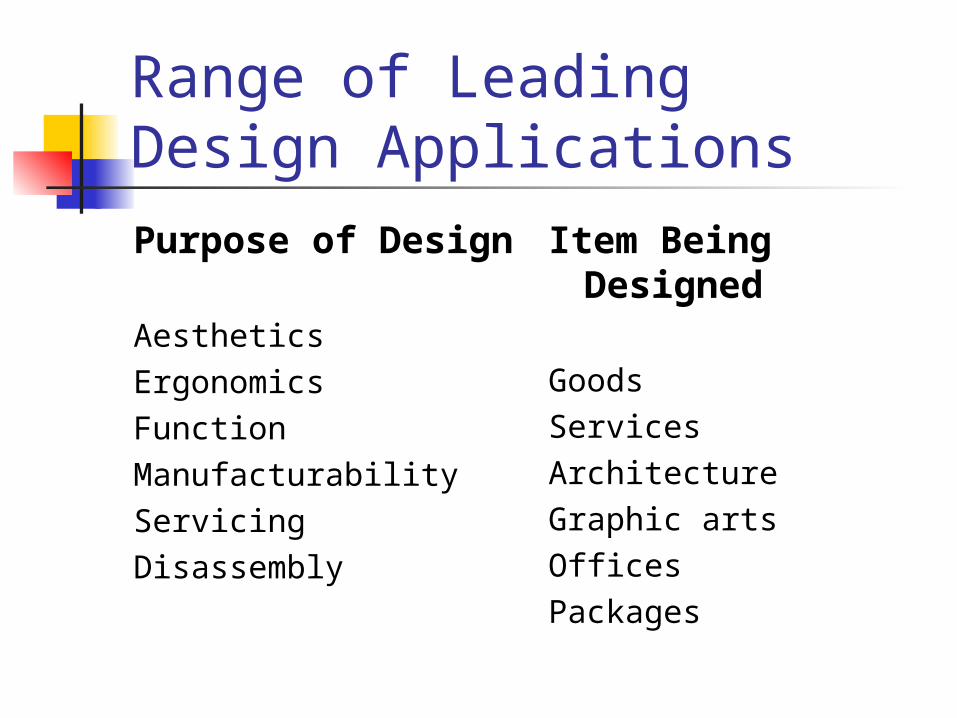
Range of Leading Design Applications
Purpose of Design
AestheticsErgonomicsFunctionManufacturabilityServicingDisassembly
Item Being Designed
GoodsServicesArchitectureGraphic artsOfficesPackages
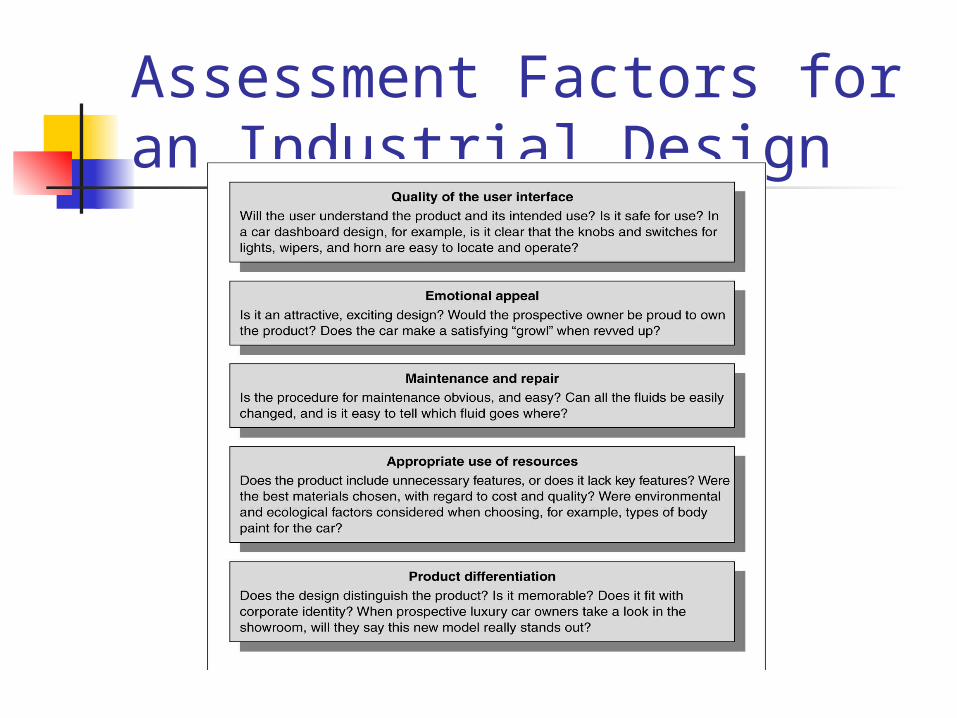
Assessment Factors for an Industrial Design

Consumer Response to Product Form (Adapted from Bloch 1995)
Product Form
PsychologicalResponses
to Product Form
CognitiveEvaluations
• Categorization• Beliefs
AestheticEvaluations
BehavioralResponses
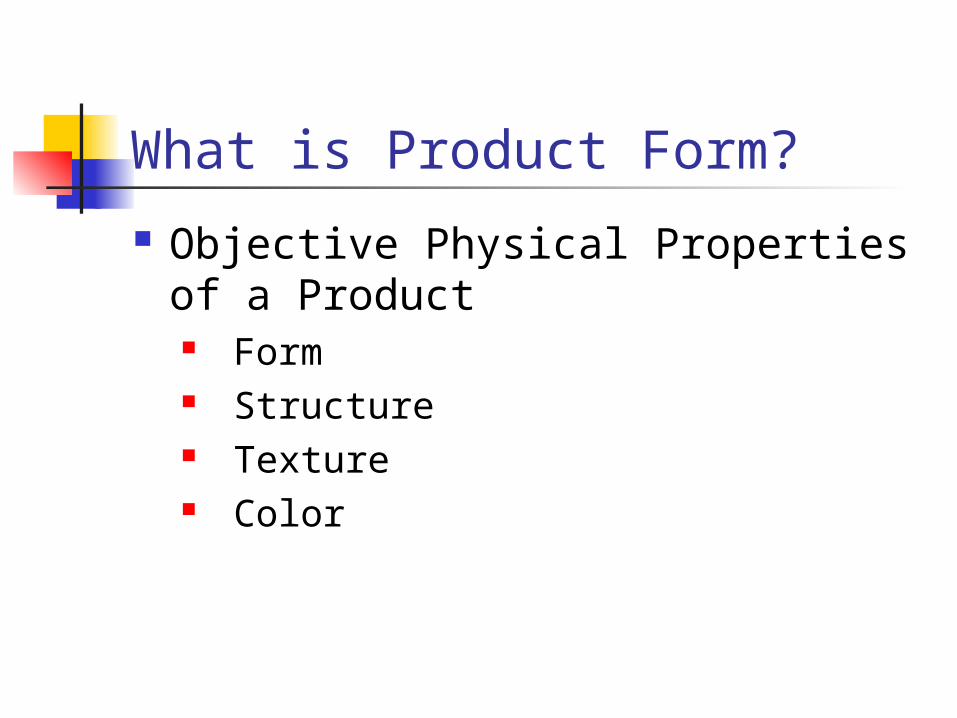
What is Product Form?
Objective Physical Properties of a Product Form Structure Texture Color
Psychological Responses to Consumer Products Context
Category Membership Functionality
What happens in the absence of context? Design communicates, but does it do so
effectively? How does the design and its context
influence: Consumers’ reactions to the new products Consumers’ communication strategies
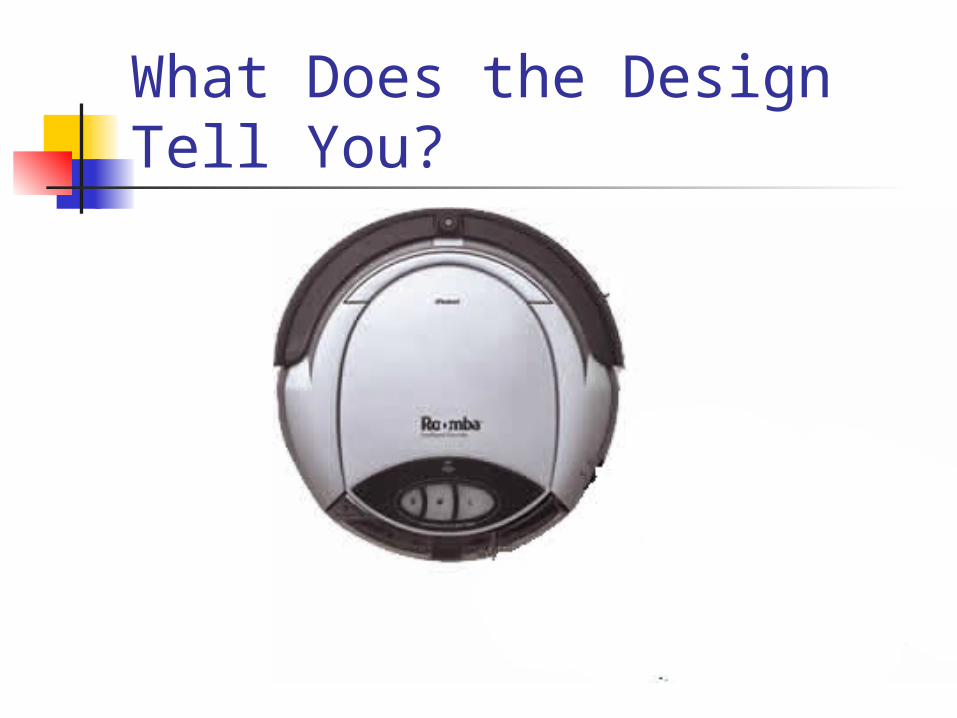
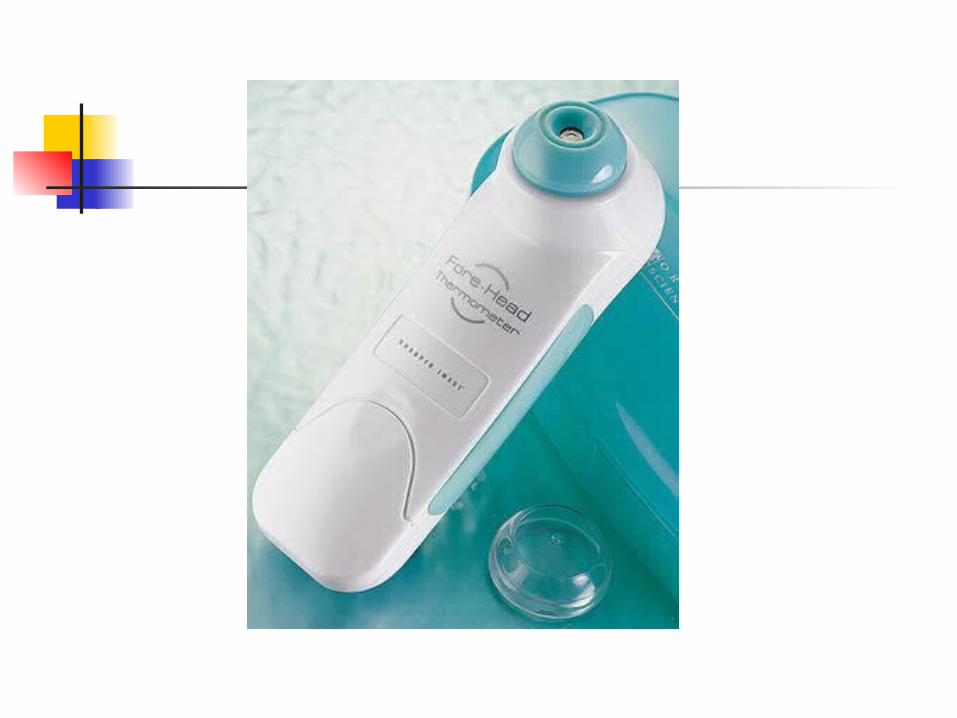
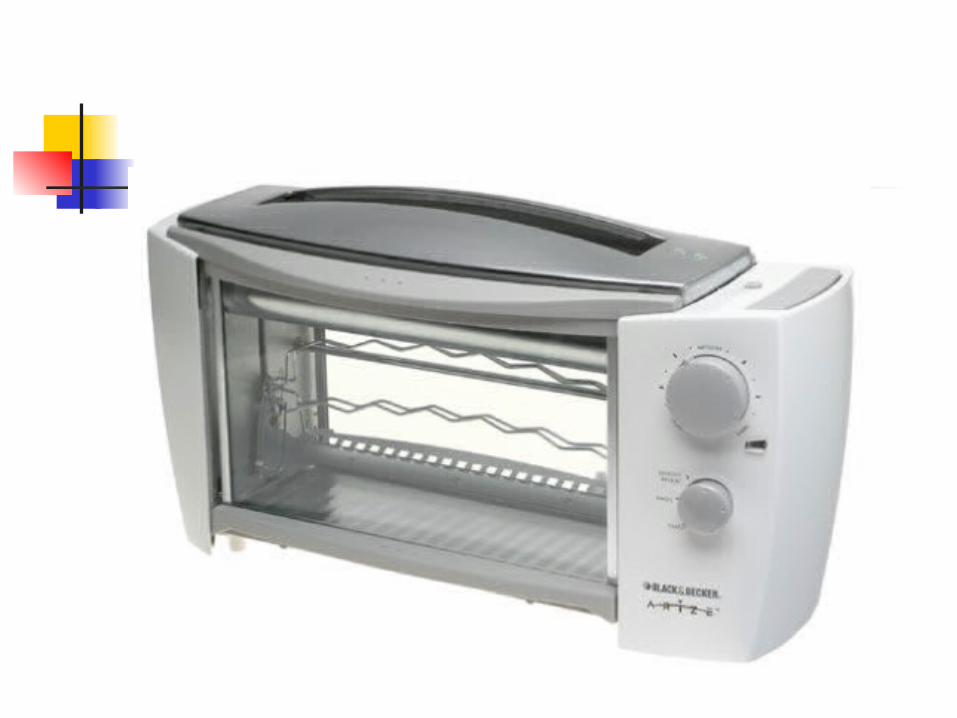
What Does the Design Tell You?

What Does the Design Tell You?

New Product Development
Sales Forecasting & Financial Analysis
Estimating Sales Potential
Sales Potential Estimation Often used to interpret concept
test results

The Concept Statement
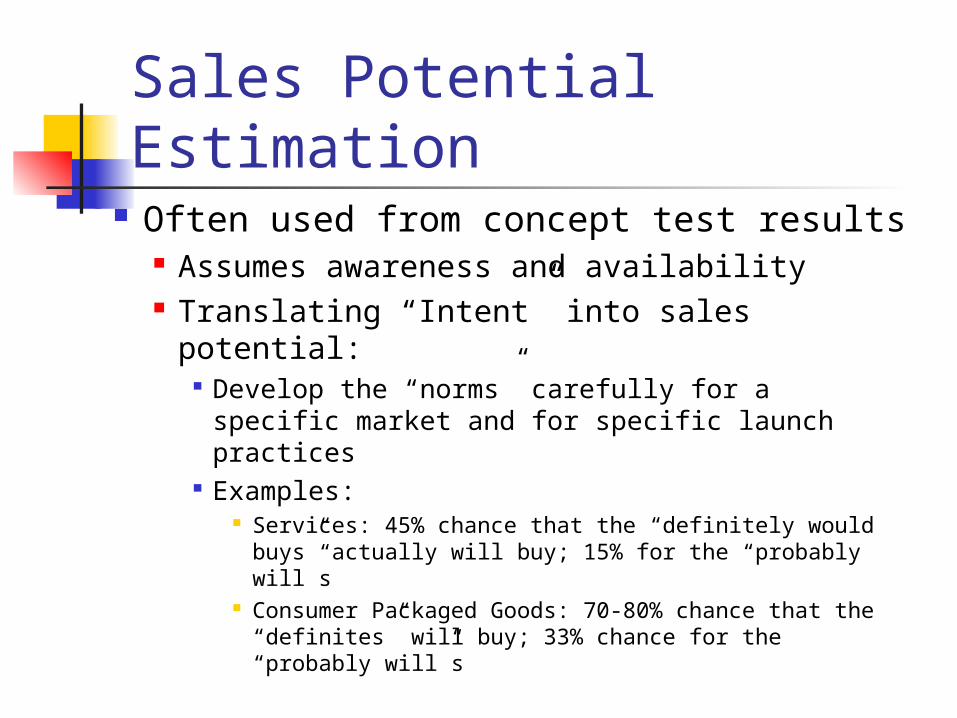
Sales Potential Estimation Often used from concept test results
Assumes awareness and availability Translating “Intent” into sales potential:
Develop the “norms” carefully for a specific market and for specific launch practices
Examples: Services: 45% chance that the “definitely would
buys” actually will buy; 15% for the “probably will”s Consumer Packaged Goods: 70-80% chance that the
“definites” will buy; 33% chance for the “probably will”s

Sales Potential Estimation
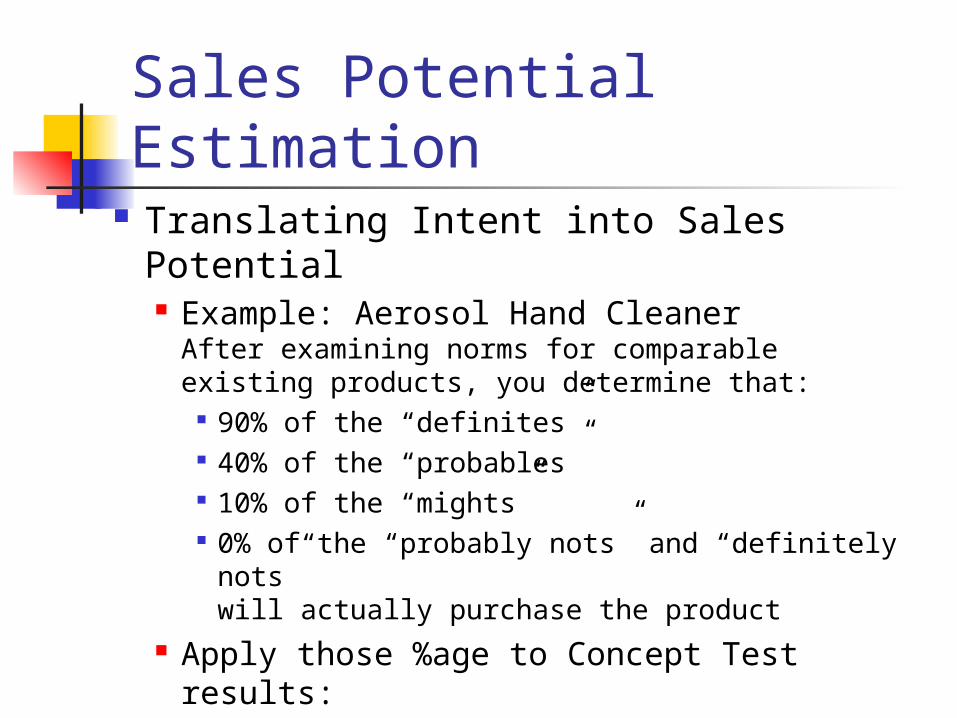
Sales Potential Estimation Translating Intent into Sales Potential
Example: Aerosol Hand CleanerAfter examining norms for comparable existing products, you determine that:
90% of the “definites” 40% of the “probables” 10% of the “mights” 0% of the “probably nots” and “definitely
nots”will actually purchase the product
Apply those %age to Concept Test results:
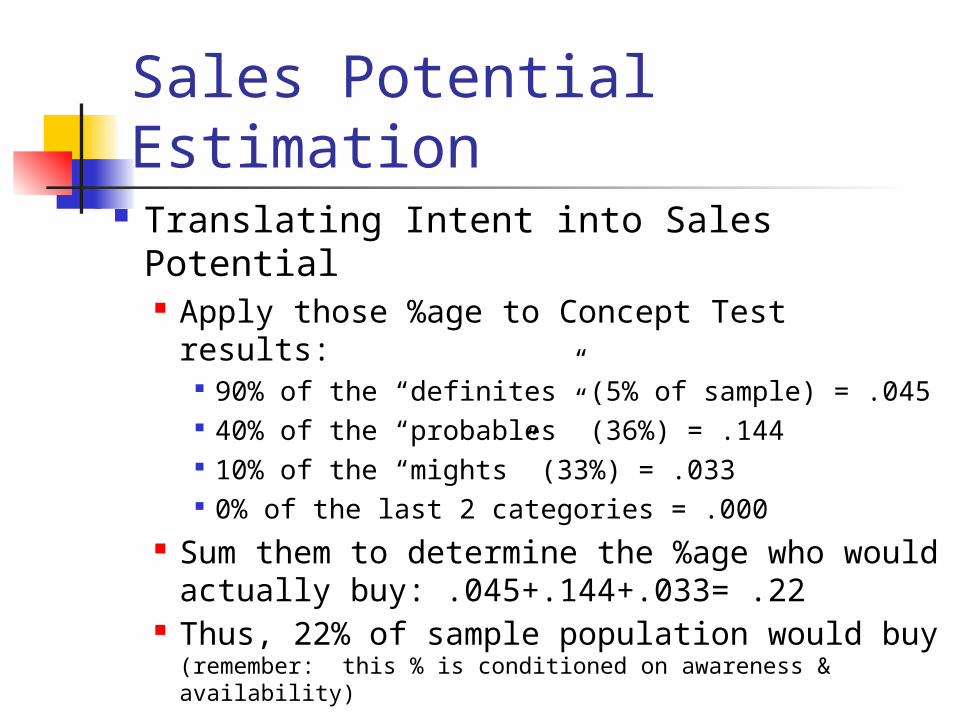
Sales Potential Estimation Translating Intent into Sales Potential
Apply those %age to Concept Test results: 90% of the “definites” (5% of sample) = .045 40% of the “probables” (36%) = .144 10% of the “mights” (33%) = .033 0% of the last 2 categories = .000
Sum them to determine the %age who would actually buy: .045+.144+.033= .22
Thus, 22% of sample population would buy(remember: this % is conditioned on awareness & availability)
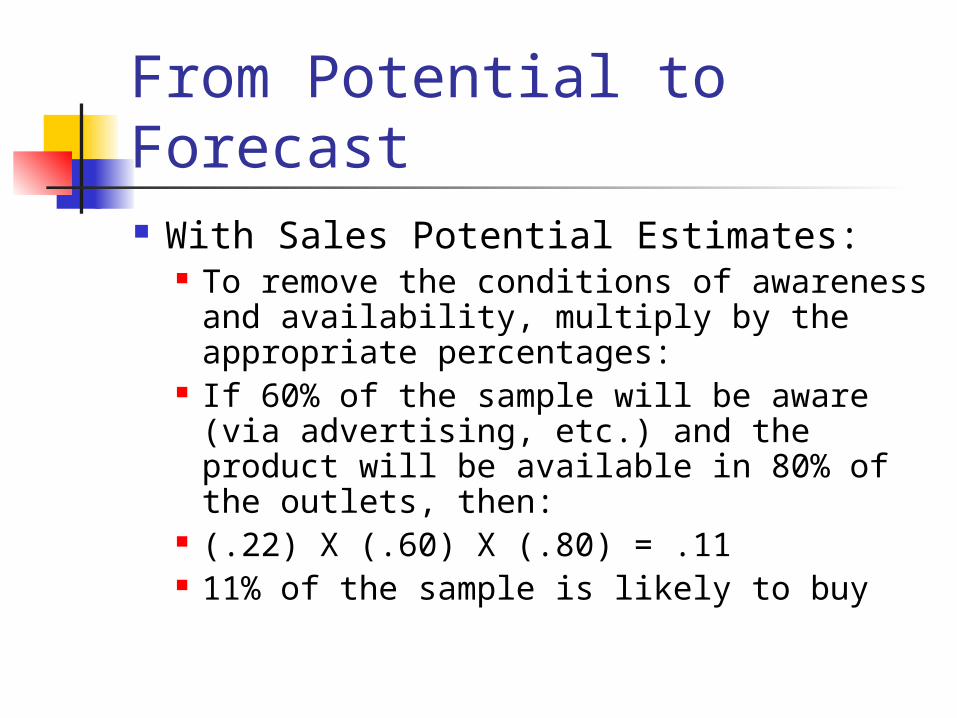
From Potential to Forecast With Sales Potential Estimates:
To remove the conditions of awareness and availability, multiply by the appropriate percentages:
If 60% of the sample will be aware (via advertising, etc.) and the product will be available in 80% of the outlets, then:
(.22) X (.60) X (.80) = .11 11% of the sample is likely to buy
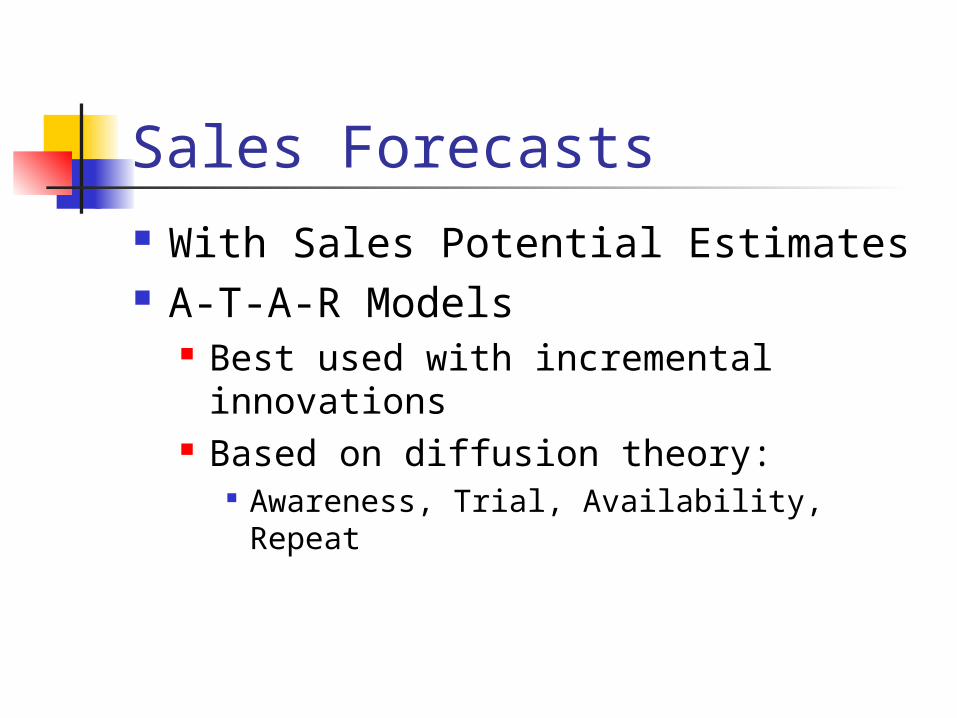
Sales Forecasts With Sales Potential Estimates A-T-A-R Models
Best used with incremental innovations
Based on diffusion theory: Awareness, Trial, Availability, Repeat

ATAR
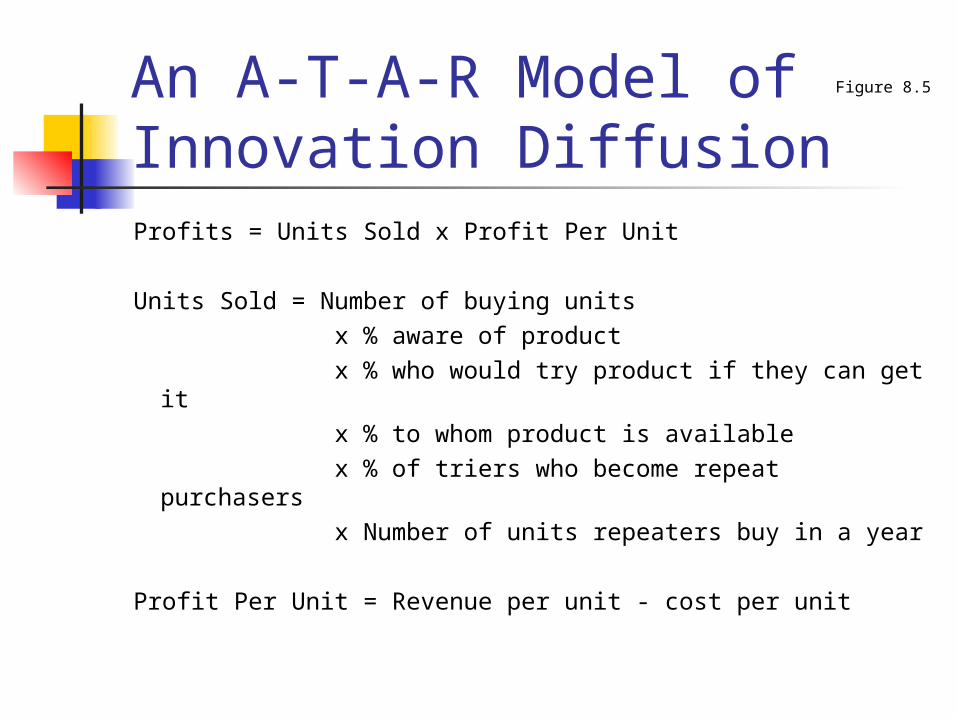
An A-T-A-R Model of Innovation DiffusionProfits = Units Sold x Profit Per Unit
Units Sold = Number of buying units x % aware of product x % who would try product if they can get it x % to whom product is available x % of triers who become repeat purchasers x Number of units repeaters buy in a year
Profit Per Unit = Revenue per unit - cost per unit
Figure 8.5
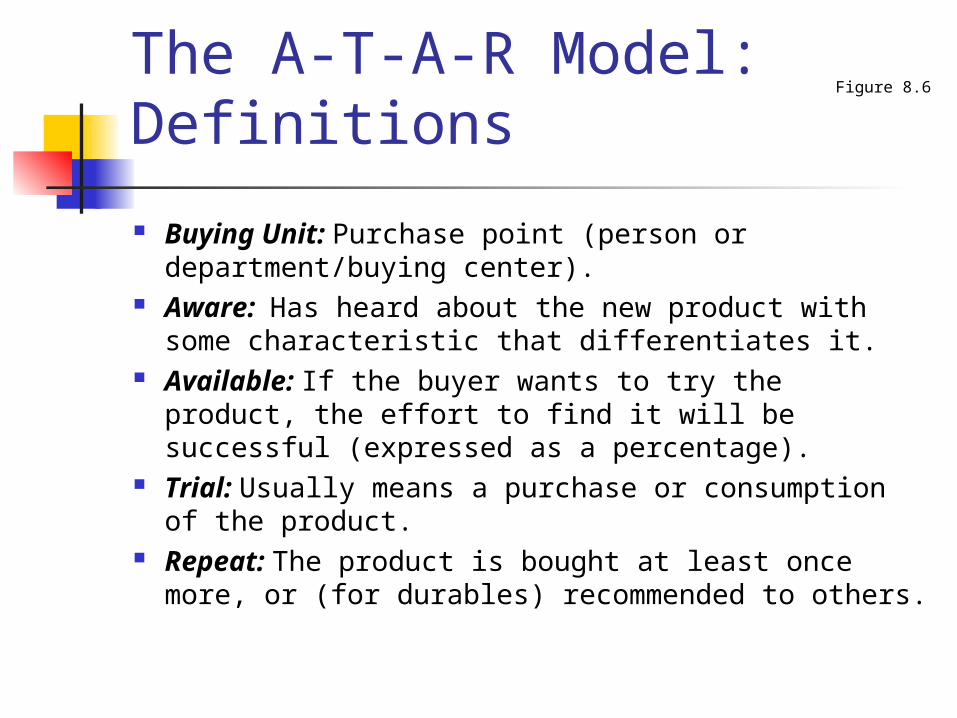
The A-T-A-R Model: Definitions
Buying Unit: Purchase point (person or department/buying center).
Aware: Has heard about the new product with some characteristic that differentiates it.
Available: If the buyer wants to try the product, the effort to find it will be successful (expressed as a percentage).
Trial: Usually means a purchase or consumption of the product.
Repeat: The product is bought at least once more, or (for durables) recommended to others.
Figure 8.6
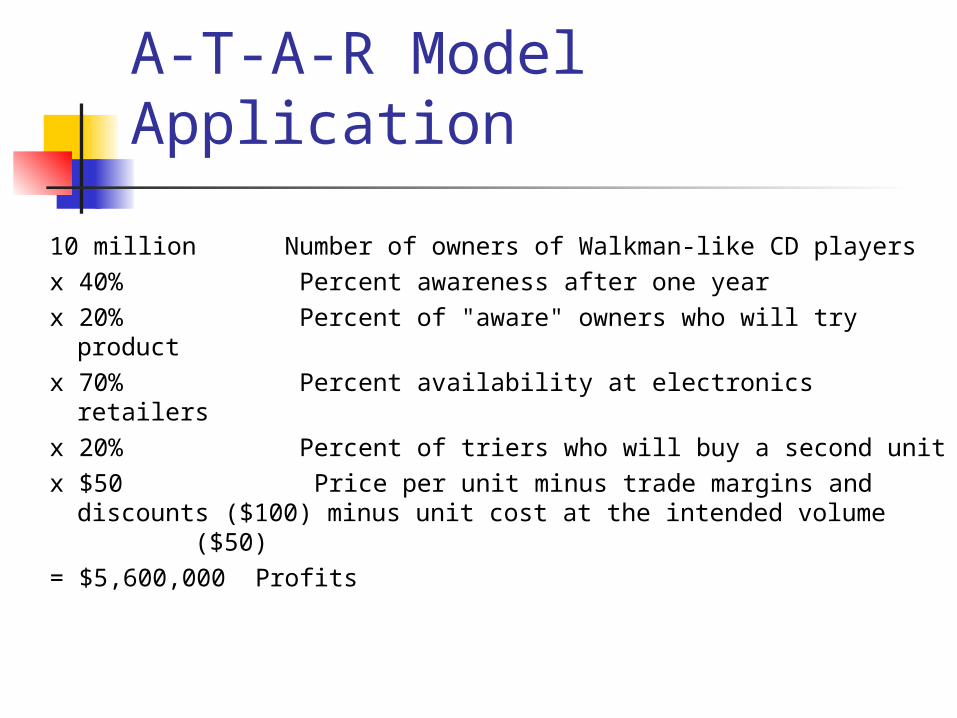
A-T-A-R Model Application
10 million Number of owners of Walkman-like CD playersx 40% Percent awareness after one yearx 20% Percent of "aware" owners who will try productx 70% Percent availability at electronics retailersx 20% Percent of triers who will buy a second unitx $50 Price per unit minus trade margins and
discounts ($100) minus unit cost at the intended volume ($50)
= $5,600,000 Profits
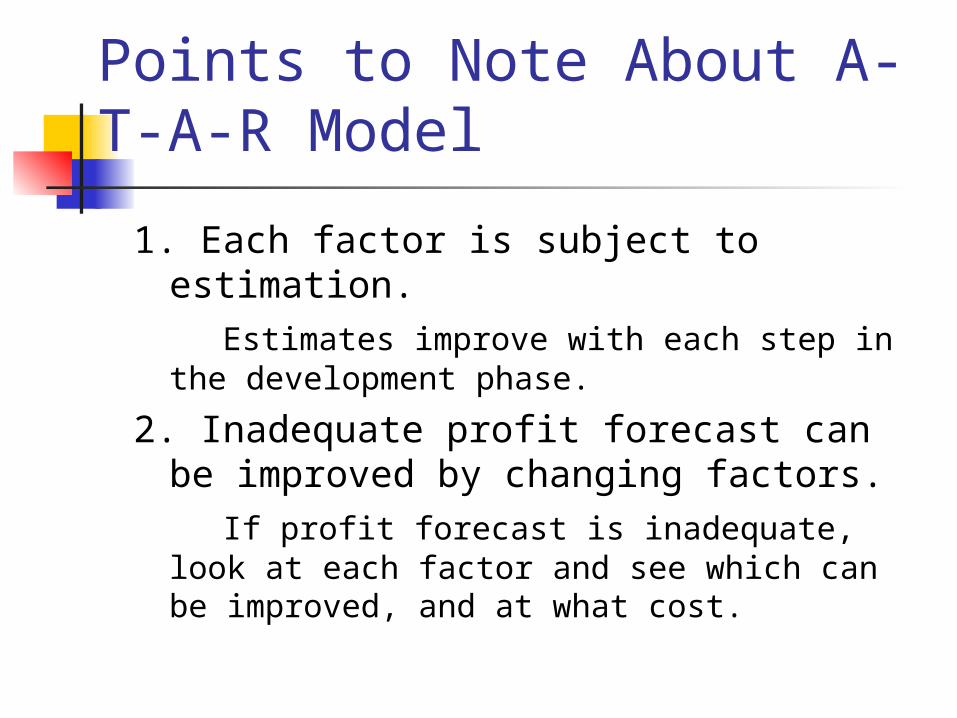
Points to Note About A-T-A-R Model
1. Each factor is subject to estimation. Estimates improve with each step in the
development phase.
2. Inadequate profit forecast can be improved by changing factors.
If profit forecast is inadequate, look at each factor and see which can be improved, and at what cost.
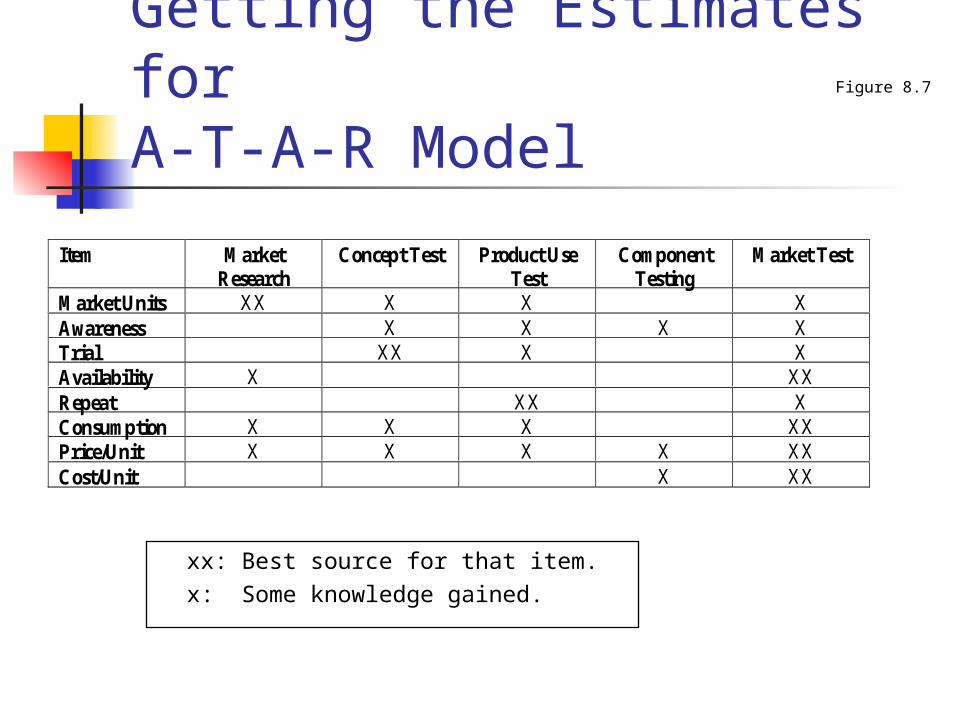
Getting the Estimates for A-T-A-R Model
xx: Best source for that item.x: Some knowledge gained.
Figure 8.7
Item MarketResearch
Concept Test Product UseTest
ComponentTesting
Market Test
Market Units XX X X XAwareness X X X XTrial XX X XAvailability X XXRepeat XX XConsumption X X X XXPrice/Unit X X X X XXCost/Unit X XX
Sales Forecasts With Sales Potential Estimates Diffusion of Innovations
The Bass Model: Predicts pattern of trial (doesn’t include
repeat purchases) at the category level Works for all types of products, and can
be used with discontinuous innovations
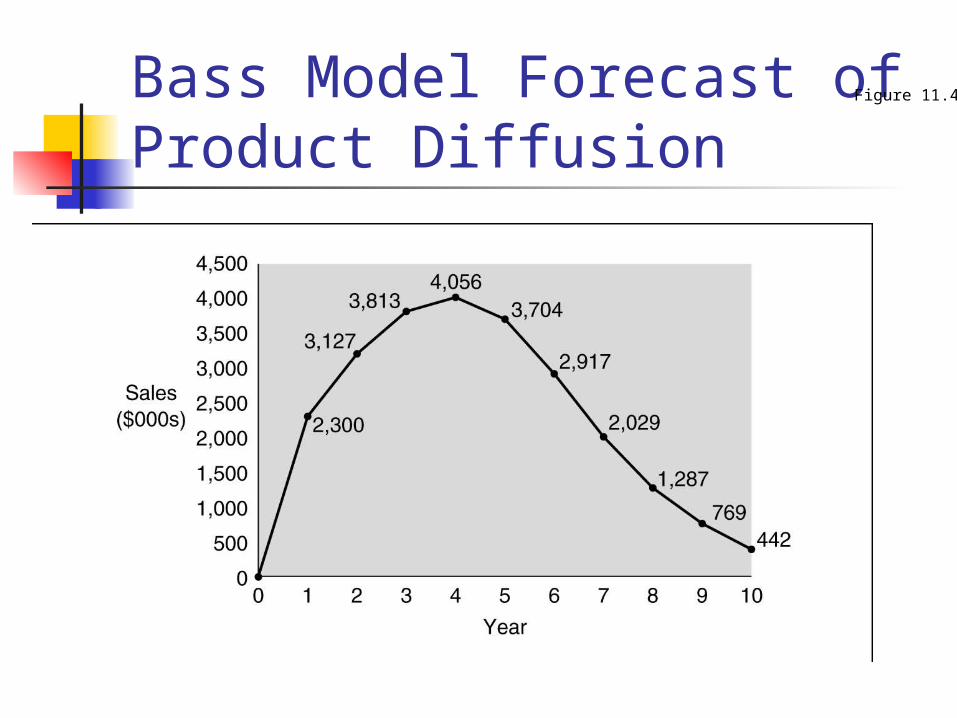
Bass Model Forecast ofProduct Diffusion
Figure 11.4

The Bass Model Estimates s(t) = sales of the product
class at some future time t:
s(t) = pm + [q-p] Y(t) - (q/m) [Y(t)]2
Where
p = the “coefficient of innovation” [Average value=.04]
q = the “coefficient of imitation” [Average value =.30]
m= the total number of potential buyers
Y(t) = the total number of purchases by time t
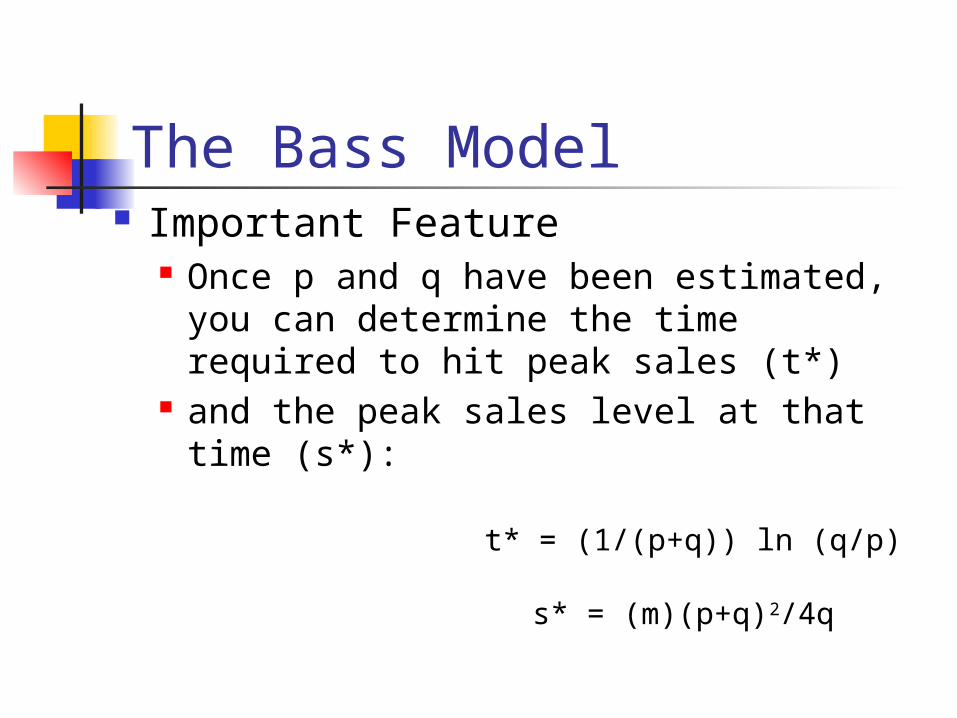
The Bass Model Important Feature
Once p and q have been estimated, you can determine the time required to hit peak sales (t*)
and the peak sales level at that time (s*):
t* = (1/(p+q)) ln (q/p)
s* = (m)(p+q)2/4q

Financial Analysis
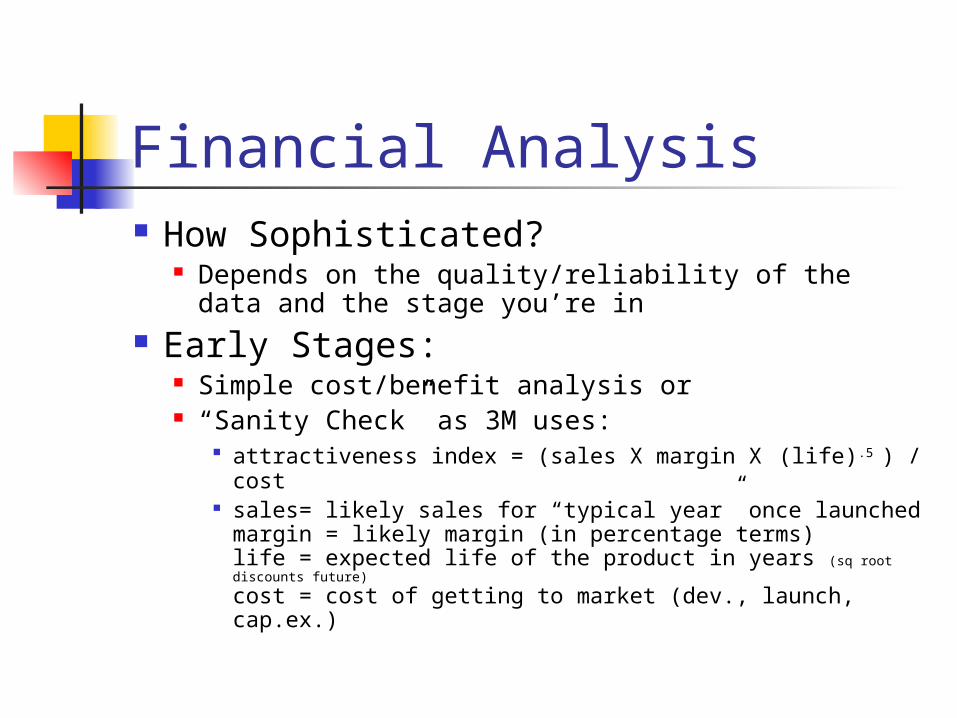
Financial Analysis How Sophisticated?
Depends on the quality/reliability of the data and the stage you’re in
Early Stages: Simple cost/benefit analysis or “Sanity Check” as 3M uses:
attractiveness index = (sales X margin X (life).5 ) / cost sales= likely sales for “typical year” once launched
margin = likely margin (in percentage terms)life = expected life of the product in years (sq root discounts future)
cost = cost of getting to market (dev., launch, cap.ex.)
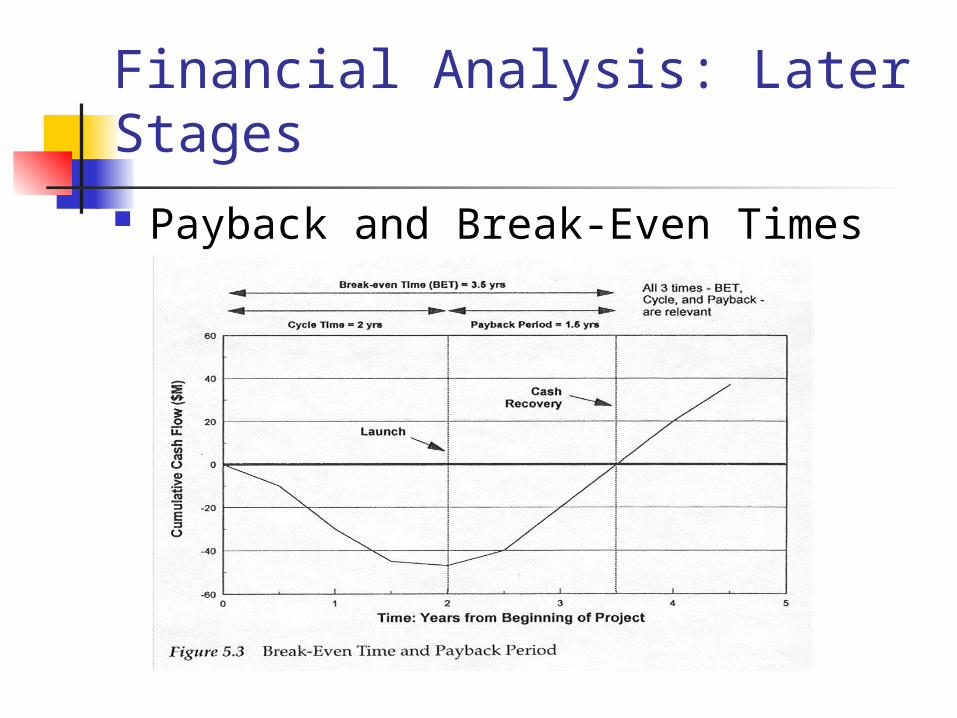
Financial Analysis: Later Stages Payback and Break-Even Times
Cycle Time Payback Period Break-Even Time (BET) = Cycle Time +
Payback Pd.
Financial Analysis: Later Stages Payback and Break-Even Times

Financial Analysis: Later Stages Payback and Break-Even Times Discounted Cash Flows (DCF, NPV, or
IRR) The most rigorous analysis for new products:
year-by-year cash flow projections discounted to the present
the discounted cash flows are summed if the sum of the dcf’s > initial outlays, the project passes
The “Dark Side” of NPV (for NPD) Unfairly penalizes certain projects by ignoring
the Go/Kill options along the way (option values not accounted for in traditional NPV)
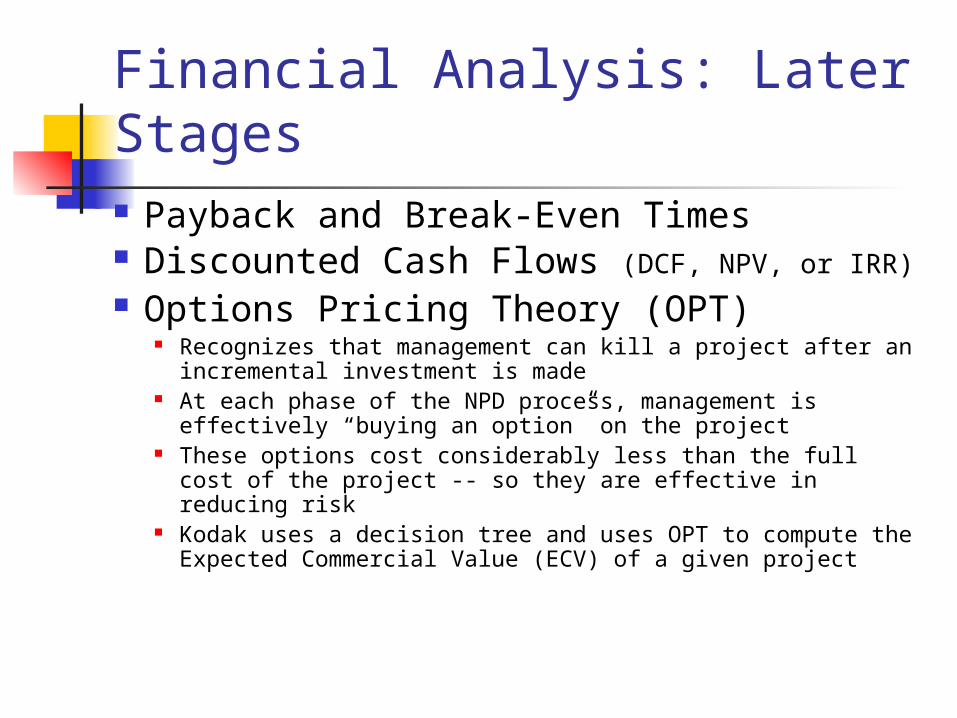
Financial Analysis: Later Stages Payback and Break-Even Times Discounted Cash Flows (DCF, NPV, or IRR) Options Pricing Theory (OPT)
Recognizes that management can kill a project after an incremental investment is made
At each phase of the NPD process, management is effectively “buying an option” on the project
These options cost considerably less than the full cost of the project -- so they are effective in reducing risk
Kodak uses a decision tree and uses OPT to compute the Expected Commercial Value (ECV) of a given project
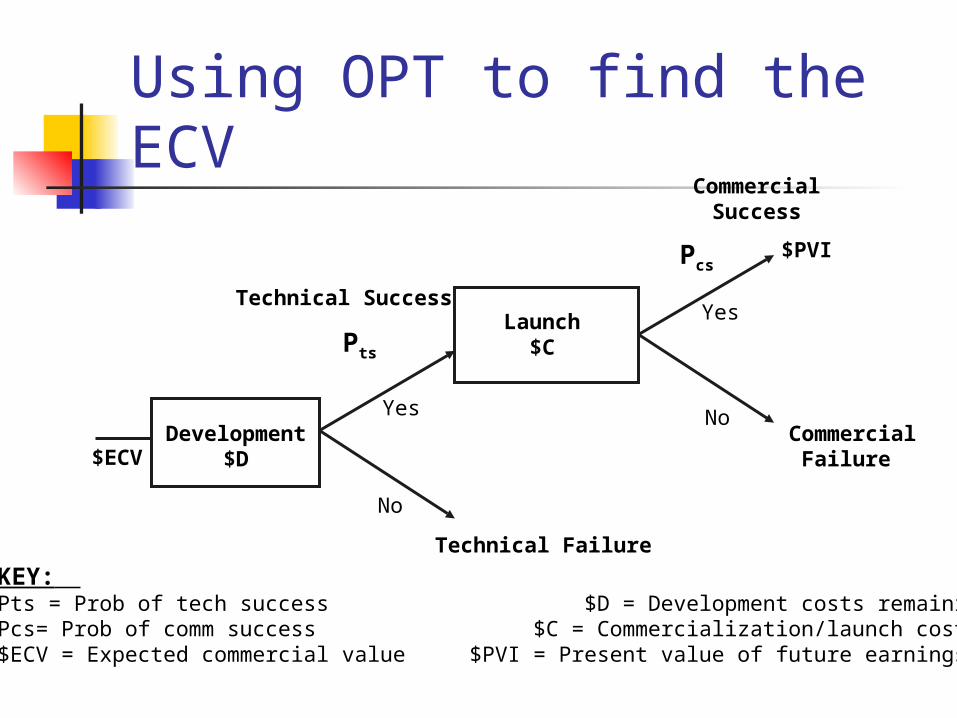
Using OPT to find the ECV
Development$D
Pts
Pcs
Technical Success
Technical Failure
Launch$C
CommercialSuccess
Commercial Failure$ECV
Yes
No
Yes
No
KEY: Pts = Prob of tech success $D = Development costs remainingPcs= Prob of comm success $C = Commercialization/launch costs$ECV = Expected commercial value $PVI = Present value of future earnings
$PVI
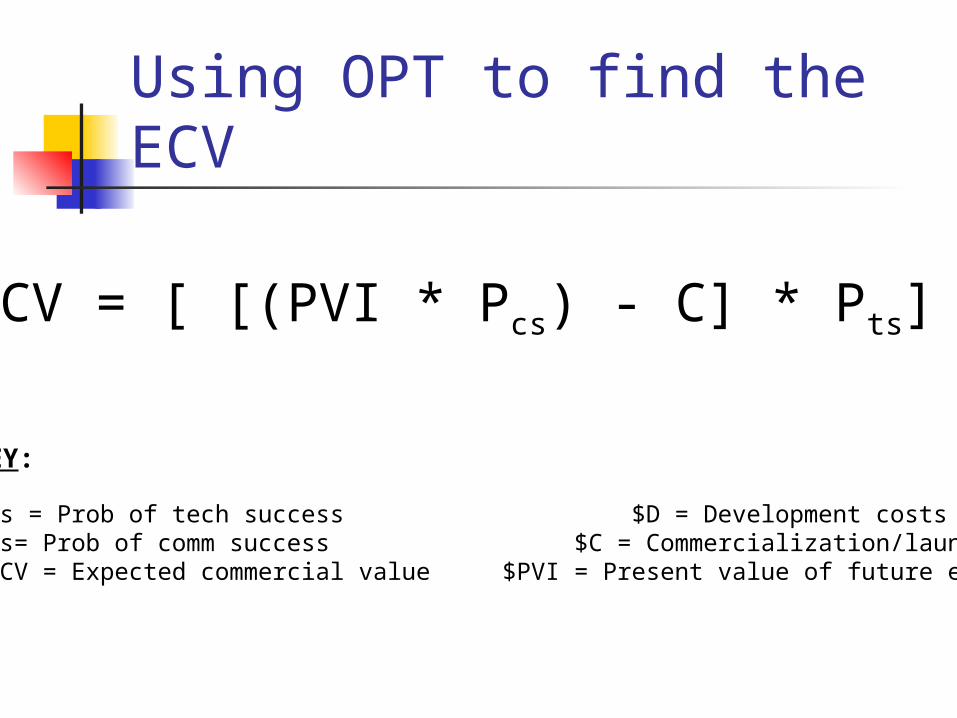
Using OPT to find the ECV
ECV = [ [(PVI * Pcs) - C] * Pts] - D
KEY:
Pts = Prob of tech success $D = Development costs remainingPcs= Prob of comm success $C = Commercialization/launch costs$ECV = Expected commercial value $PVI = Present value of future earnings
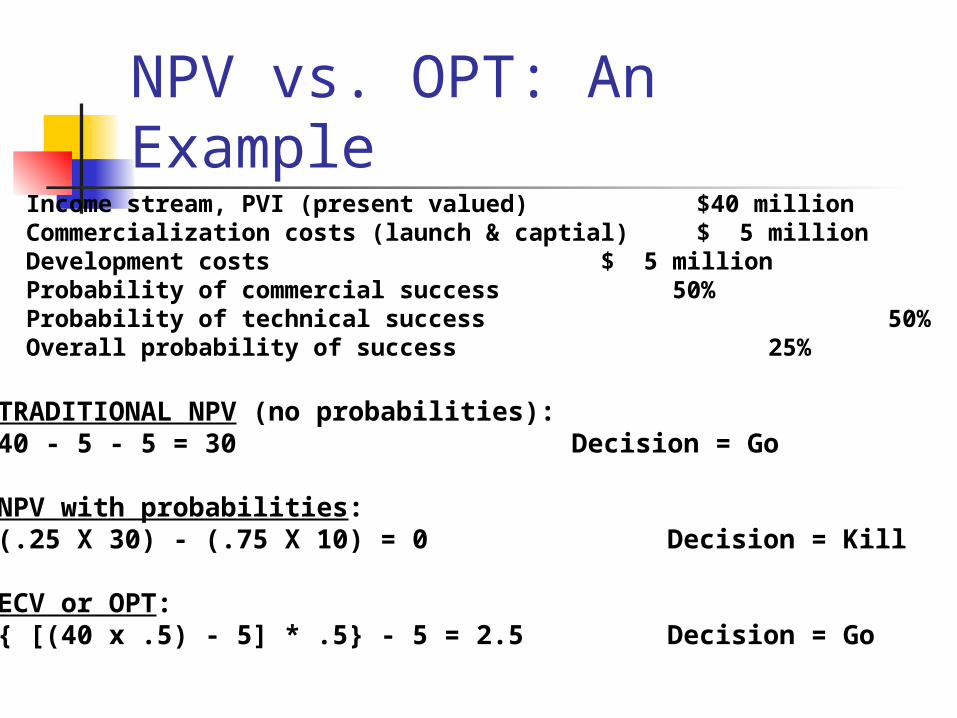
NPV vs. OPT: An Example
TRADITIONAL NPV (no probabilities):40 - 5 - 5 = 30 Decision = Go
NPV with probabilities:(.25 X 30) - (.75 X 10) = 0 Decision = Kill
ECV or OPT:{ [(40 x .5) - 5] * .5} - 5 = 2.5 Decision = Go
Income stream, PVI (present valued) $40 millionCommercialization costs (launch & captial) $ 5 millionDevelopment costs $ 5 millionProbability of commercial success 50%Probability of technical success 50%Overall probability of success 25%