developmental programming of adult obesity and ...weight c lp c-hc lp -hc fat pads (mg) 2251 ± 286...
TRANSCRIPT

Developmental programming of adult obesity and cardiovascular disease
in rodent by maternal nutrition imbalance
Claude Remacle
Institute of Life SciencesUniversité catholique de Louvain,Louvain-la-Neuve, Belgium
Note: for non-commercial purposes only

Florence BieswalVanesa BolSamira BoujendarHanane CheriffSalouah DahriOlivier DumortierIlham El KhattabiKevin GoosseLuise KalbeSiham MerezakPierre RomanusAnne SnoeckNicolas Theys
University of Louvain
Brigitte Reusens
Thomas BouckenoogheLuise KalbeCéline MorrensPierre Nivoit
Dept of Clinical BiochemistryUniversity of Cambridge, UKSuzan Ozanne
INSERM U457, ParisBernadette Bréant
Rowett Institute, AberdeenW.D. Rees
King’s College, London, UKLucilla Poston

Alarming increase of obesity

Alarming increase of obesity
McAllistair & many others, Crit. Rev. Food Sci. Nutr., 2009
InfectionsEpigeneticsMaternal Age Assortative MatingSleep DebtEndocrine DisruptorsPharmaceutical IatrogenesisAmbient Temperature
food practicereduction in physical activity
Intrauterine & intergenerational Effects
The Big Two :
Ten putativecontributors

Rogers & EURO-BLCS, Int. J. Obes. Relat. Metab. Disord., 2003; Mc. Millen & Robinson, Physiol.Rev., 2005
HighHigh birth weight ���� HighHigh BMI in adulthood
SmallSmall birth weight ���� HighHigh BMI in adulthood
SmallSmall birth weight ���� SmallSmall BMI BUTBUT altered distribution of fat mass
and a lean mass decreased in adulthood
Association between birth weightand adult BMI
Birth weight
AdultBMI
Importance of early catch-up growth ?
?

The Dutch Famine
Nov.1944 – Apr.1945
bread potato
sugar beet
Painter, Thesis, 2006

Born before famine
in mid pregnancy
79.0
91.8
26.7
65 %
79
92.4
26.7
63 %
84.2
95.6
75 %
Effect of prenatal exposure to the Dutch famine on size and obesity at age 50 in men
Ravelli et al., Am J Clin Nutr, 1999
Weight (kg)
Waist (cm)
Body Mass Index (kg/m 2)
BMI > 25 kg/m 2
Exposed to faminein late
pregnancyin early
pregnancy
76.8
91
26.6
64 %
28.1


Intrauterine exposure Unexposed p value
BMImale 24.6 25.2 0.39female 26.9 27.0 0.89
Waist:Hip ratiomale 0.86 0.87 0.66female 0.79 0.78 0.49
Subscapular:Tricepsmale 1.26 1.41 0.50female 1.01 0.88 0.17
Stanner & Yudkin, Twin Res, 2001
Fatness parameters in subjects exposed in uteroto starvation during the Leningrad Siege

5 monthscatch-up growth
28 monthsno catch-up growth

Yajnik, Proc Nutr Soc. 2004
Mean level of central obesity at 8 years of ageby tertiles of birth weight and weight at 8 y
Catch-up growth
Birth weight Weight at 8 y

Experimental groups (1)
20%
20% 20% 16%
16%
Gestation Lactation
C
C-Caf
Birth Week 3
Adult
20%
8%
8% 8%
R
R-Caf
8% 16%
16%
16%
16% + Caf
16%
16 % Caf
Week 7
Bieswal & al., Obesity, 2006

Body weight gain
0
100
200
300
400
500
600
700
800
900
0 4 8 12 16 20 24 28 32 36 40 44 48
C
C-Caf
R
R-Caf
Age (weeks)
Wei
ght g
ain
(gr)
Control
Controlcafeteria
Bieswal & al., Obesity, 2006

20%
20%
20%
20%
Gestation Lactation
C
LC
Birth Weaning
Adult males (6 months)
16%
16%
8%LP 16%20%
8 Pups
4 Pups
4 Pups
20% 20% 16% + Cafeteria
8% 20% 16% + Cafeteria
20% 20% 16% + Cafeteria
Experimental groups (2)
C-Caf
LP-Caf
LC-Caf
Bieswal & al., Obesity, 2006

Catch up growth during lactation
0
10
20
30
40
50
60
70
0 2 4 6 8 10 12 14 16 18 20 22
Days of lactation
Wei
ght (
gr)
CLPLC
birth weight6.9 ± 0.25.7 ± 0.2**5.7 ± 0.1**
Bieswal & al., Obesity, 2006

Obesity in adult
0
200
400
600
800
Bod
y W
eigh
t (gr
)
c
ba
c
C LP C LPCaf
Experiment 1No Catch-up growth
Experiment 2Catch-up growth
Bod
y W
eigh
t (gr
)0
200
400
600
800
1000
ab b
cd
e
C LP LC C LPCaf
LC
Body weight at 42 weeks
Bieswal & al., Obesity, 2006

Experiment 1No Catch-up growth
0
4
8
12
16
20
Rel
ativ
e W
AT
wei
ght (
%)
C LP C LPCaf
Experiment 2Catch-up growth
0
4
8
12
16
20
24
C LP LC
Rel
ativ
e W
AT
wei
ght (
%)
*
**
C LP LCCaf
Weight of visceral fat depots
Obesity in adult
Bieswal & al., Obesity, 2006

Obesity in adult
In rat,
postnatal catch up growth after intrauterine growth
retardation results in higher body mass and obesity, associated with factors favoring cardio-vascular
disease :
Leptin
Plasminogen Activator Inhibitor-1Angiotensinogen
Adiponectin
Bieswal & al., Obesity, 2006

20% 20%
Gestation Lactation
C
Birth Weaning
Adult males (36 weeks)
16%
8%LP 16%20%
8 Pups
4 Pups
20% 20% 16% + HC
8% 20% 16% + HC
Experimental groups (3)
C-Caf
LP-Caf
Bol & al., Amer J Physiol, 2009
In mice ?
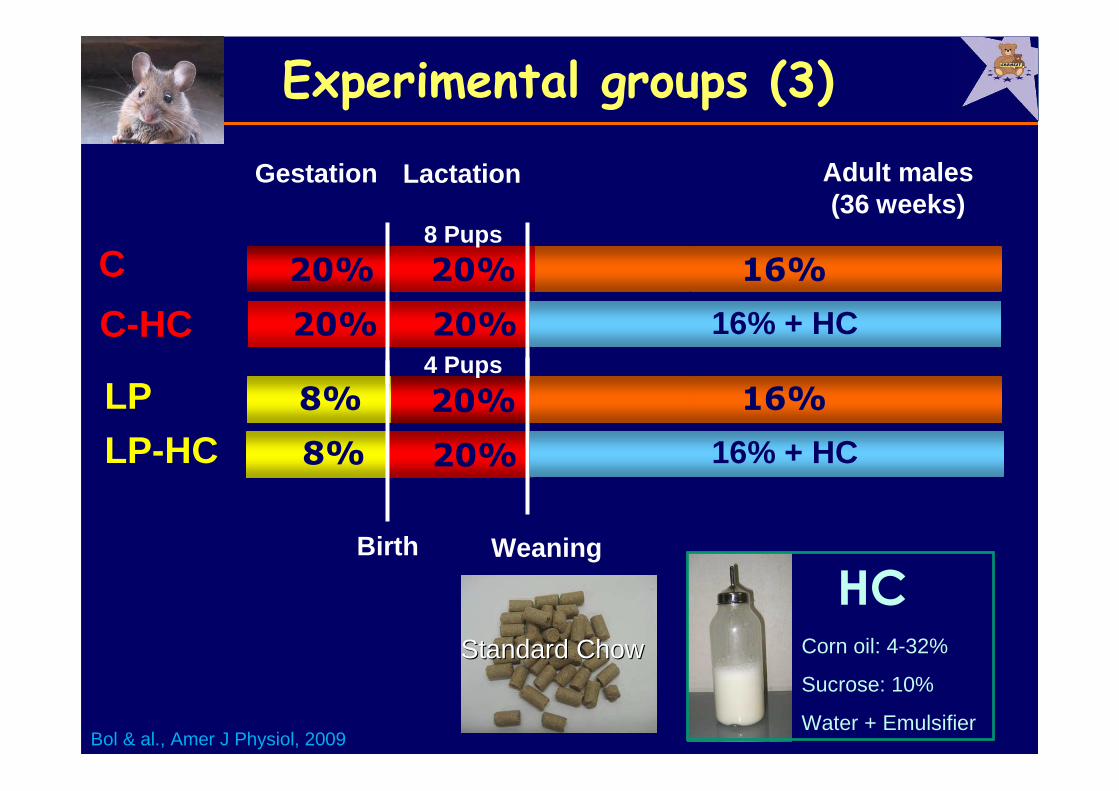
20% 20%
Gestation Lactation
C
Birth Weaning
Adult males (36 weeks)
16%
8%LP 16%20%
8 Pups
4 Pups
20% 20% 16% + HC
8% 20% 16% + HC
Experimental groups (3)
C-HC
LP-HC
Bol & al., Amer J Physiol, 2009
Corn oil: 4-32%
Sucrose: 10%
Water + Emulsifier
HCStandard ChowStandard Chow
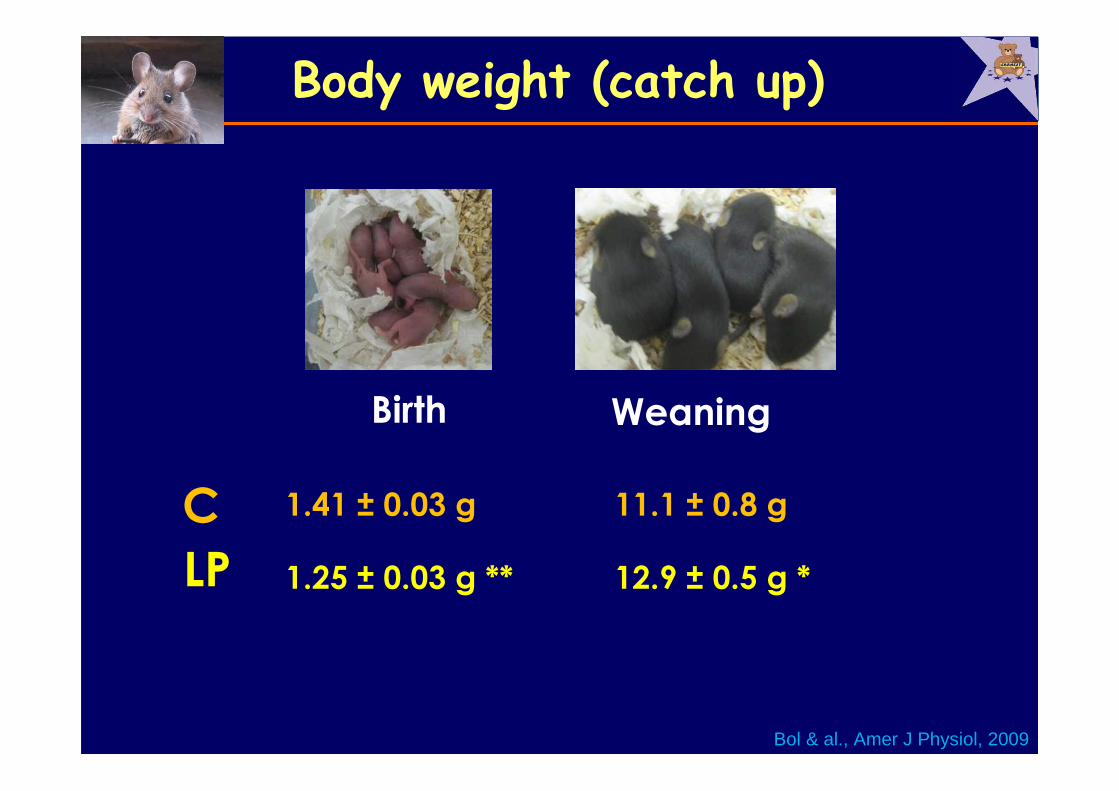
1.41 ± 0.03 g
1.25 ± 0.03 g **
11.1 ± 0.8 g
12.9 ± 0.5 g *
Birth Weaning
Body weight (catch up)
C
LP
Bol & al., Amer J Physiol, 2009

Body weight (adult)
31.0 ± 0.7 g
31.0 ± 0.8 g
34.5 ± 1.6 g
40.5 ± 1.5 g *
C
LP
-HC9 months
C-HC
LP-HC
Bol & al., Amer J Physiol, 2009

Energy intake
Chow HC suppl.
Corn oil: 4-32%
Sucrose: 10%
Water + Emulsifier
-HCStandardStandard ChowChow
Bol & al., Amer J Physiol, 2009

C LP LC C-HC LP-HC LC-HC
Dai
ly E
nerg
y in
take
(kJ
)
0
100
200
300
400
500
600
Bieswal et al, Obesity, 2006
Energy intake
Corn oil: 4-32%
Sucrose: 10%
Water + Emulsifier
-HCStandard ChowStandard Chow

Energy intake
The obesity stimulated by early
malnutrition followed by catch up
growth is not obligatorily attributable to
hyperphagia.

Effects of rapid postnatal catch-up growth on the adult phenotype
Jimenez-Chillaron & Patti, Curr Opin Endocrinol Diabetes Obes. 2007

Adiposity : fat pads
Bol & al., Amer J Physiol, 2009
Standard ChowStandard Chow HypercaloricHypercaloricWeight CC LPLP CC--HCHC LPLP--HCHCFat pads (mg)Fat pads (mg) 2251 ± 286 2427 ± 259 3247 3247 ±± 538 538 $$$$$$ 5169 5169 ±± 460 460 $$$ * $$$ * ££
% Fat pads% Fat pads 6.8 ± 0.7 7.3 7.3 ±± 0.60.6 8.8 8.8 ±± 1.11.1 12.5 12.5 ±± 0.70.7
(ANOVA 2 : * foetal diet effect; $ hypercaloric die t effect, £ interaction effect)

Adiposity : fat cell size
Bol & al., Amer J Physiol, 2009

Pluripotent stem cell
Multipotential mesenchymal
precursor
Determined preadipocyte
Immature multilocular adipocyte
Mature unilocular adipocyte
Pref-1
C/EBP-ββββ
C/EBP-αααα
SREBP-1
C/EBP-δδδδ
PPAR-δδδδ
PPAR-γγγγAdipocyte specific proteins :- lipogenic enzymes (LPL, Malic enzyme, GPDH, …)- secreted proteins (leptin, adipsin, adiponectin, P AI-1)
MITOSESCLONAL
EXPANSIONGROWTHARREST
MATURATION

C
8% 20%
20%20%
LP
Birth Weaning
� Isolation of
perigonadal adipose
tissue
� Digestion,
centrifugation &
filtration
� Seeding of cells (D0)
� Addition of Insulin &
Dexamethasone (D1)
�Differentiation
(D2-D9)
Assessment of
proliferation and
differentiation at
different time points
28 Days
Fat cell precursors
Bol & al., Obesity, 2008

Fat cell precursors
?Adipocyte precursors capacity for proliferation and differentiationin case of growth retardation
NOBieswal & al., J Nutr, 2004
Stromal-vascular fraction of perigenital fat tissue,1 mo-old rat

Fat cell precursors
?Adipocyte precursors capacity for proliferation and differentiationin case of growth retardation followed by catch up growth
YES
Stromal-vascular fraction of perigenital fat tissue,1 mo-old rat
Bol & al., Obesity, 2008

% of differentiation estimated by rating the TG droplets in cells
Enzymatic activities of two markers of differentiation
DAY 4 DAY 9DAY 7
Fat cell precursors
Bol & al., Obesity, 2008
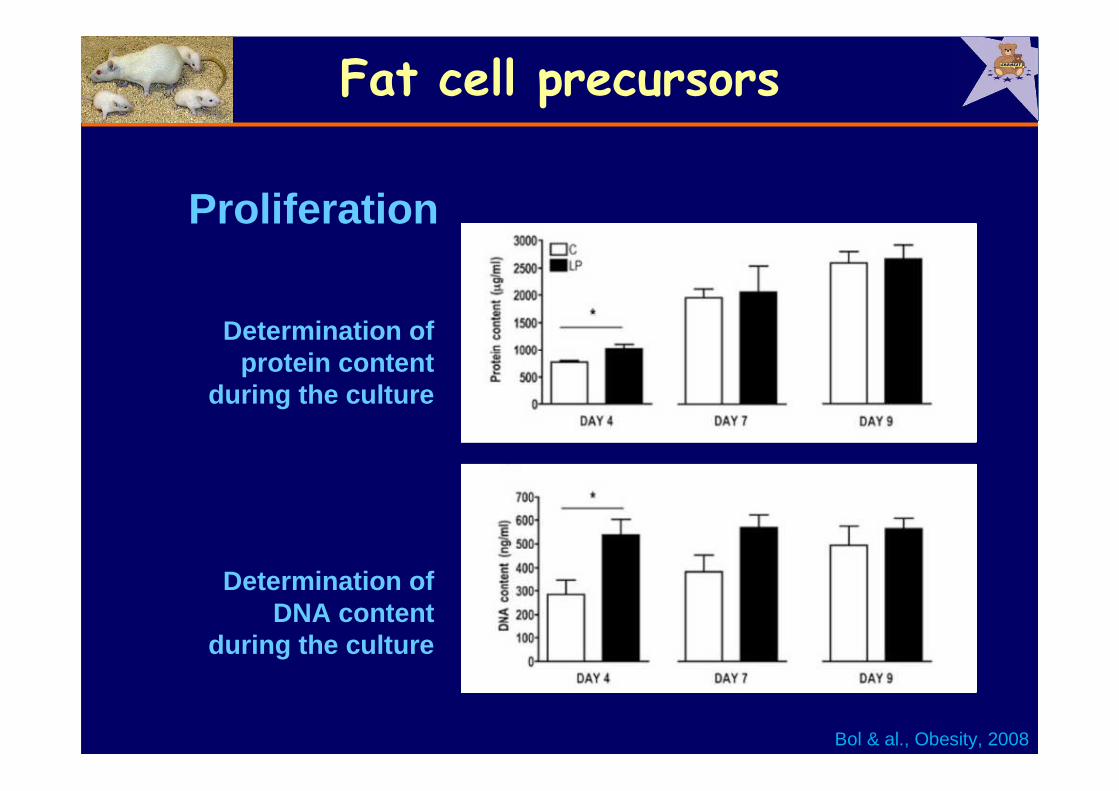
Determination of protein content
during the culture
Determination of DNA content
during the culture
Fat cell precursors
Proliferation
Bol & al., Obesity, 2008

Cell counting at early stages
of culture
Fat cell precursors
Proliferation
Bol & al., Obesity, 2008

Early markers of differentiation
Fat cell precursors
Proliferation vs
Differentiation
rt-RT
-PC
RCyclin D1
SREBP-1c PPAR-γγγγ
Bol & al., Obesity, 2008

Late marker of differentiation
DAY 9
Fat cell precursors
Leptin
Bol & al., Obesity, 2008

Fat cell precursors
A higher proliferative capacity of fat cell
precursors may contribute to the obesity
stimulated by early malnutrition followed
by catch up growth.

Expression of selected genes
in adult adipose tissue
of IUGR + catch up growth mice
by microarray analysis of 89 murine probes
‘Adipochips’
Bol & al., Amer J Physiol, 2009
C
LP
C-HC
LP-HC

Genes (#)Genes (#) InteractionInteraction FoetalFoetal HCHC
Cell cycle (1)Cell cycle (1) 11 11
Hormones/growth factors (11)Hormones/growth factors (11) 22 66 99
Transcription factors (3)Transcription factors (3) 11 22
Transporters (4)Transporters (4) 11 22 22
Cell structure (2)Cell structure (2) 11 44
Lipid metabolism (7)Lipid metabolism (7) 11 55 44
Others (2)Others (2) 11 11 22
Statistically significant modification of expression
according to fetal or adult diet (31/89 genes)
‘Adipochips’
Bol & al., Amer J Physiol, 2009

‘Adipochips’
maternal hypercaloric
2 3 15
10 3 3
Adipsin AngiotensinogenCaveolin 1Carnitin palmitoyl transferase-2Cystatin CCyclin D3DiOHacetone phosph. ac.transf.Fatty acid binding protein 4Fatty acid synthaseGlut4Glycerol3P-dehydrogenase mitoGlycerol3P-dehydrogenase cytoHaptoglobulinHydroxysteroid dehydrogenaseResistinSecreted acid cystein glycoprot . SREBP-1cTissue Factor
Bol & al., Amer J Physiol, 2009

‘Adipochips’
Glucose
Dihydroxyacetone-P
GlucogenesisGlucogenesis
Pyruvate
GlycolysisGlycolysis
GLUT4
SREBP
DHAPTG3PD
GAPT
Triacylglycerol
Glycerol-3-P
Lysophosphatidic acid
PEPCK
Fatty Acyl CoA
BB--OxidationOxidation
TriacylglycerolTriacylglycerol
synthesissynthesis
Malonyl-CoAFAS
CPT2
Fatty Acid
Fatty Acid
Lipoprotein
DOWN
Bol & al., Amer J Physiol, 2009

‘Adipochips’
Glucose
Dihydroxyacetone-P
GlucogenesisGlucogenesis
Pyruvate
GlycolysisGlycolysis
GLUT4
SREBP
DHAPTG3PD
GAPT
Triacylglycerol
Glycerol-3-P
Lysophosphatidic acid
PEPCK
Fatty Acyl CoA
BB--OxidationOxidation
TriacylglycerolTriacylglycerol
synthesissynthesis
Malonyl-CoAFAS
CPT2
Fatty Acid
FABP
4
LPL
Cav1
MCAD
Fatty Acid
Lipoprotein
DOWN
UP
Bol & al., Amer J Physiol, 2009
Expression profiling
The early imbalanced diet induced obesity
(supplemented with HC diet).Obesity was accompanied by changes
in adipose expression of several enzymes involved in lipid metabolism and changes in hormones/growth
factors

Is early mismatched nutrition (LP/catch-up growth) able to induce obesity-related CVD (hypertension and atherosclerosis)
?
adipocyte
leptinadiponectin
resistin
angiotensinogenPAI-1MCP-1
serum amyloid Aapelintissue factor
C-V system

Meta-analysis :
Difference in systolic blood pressure :- 0.5-2 mm Hgper 1 kg higher birthweight
Programming of hypertension in
Human
Huxley et al., Lancet, 2002
?

Programming of hypertension in Human
Yajnik, Obesity Reviews, 2002
Relation between birthweight, weight at 8 years, and systolic
blood pressure in Indian Children.
Birth weight
Body weight of 8-year-old
12
3123

� Postnatal obesogenic diet increased blood pressure and heart rate in all offspring groups.
� In adult progeny which received unbalanced diet in early life (growth retardation in utero and postnatal catch up growth), blood pressure and heart rate were higher.
� Their circadian rhythm disappeared.� Although LP offspring showed higher plasma
cholesterol than controls, atherosclerosis assessed in aortic roots featured increased plaque area due to obesogenic feeding but not due to early mismatched nutrition.
Obesity & CVD