dewatering optimization near-term savings and long-term
TRANSCRIPT

Dewatering Optimization
Near-Term Savings and Long-Term Capital Planning

Outline
2
• Robert W. Hite Treatment Facility in Denver, CO
• Phosphorus Regulations and Impacts
• Dewatering Optimization: Why We Care
• Full-scale Dewatering Optimization
• Bench-scale Dewatering Optimization and Research
• Metro District’s Phosphorus Initiative
• Current Implementation Status

Robert W. Hite Treatment Facility
3
• 1.8 million population equivalent service area, 220 MGD• Separate secondary processes, converting to A2O • Combined solids processing creates significant sidestream

Phosphorus Regulations and Drivers
4

Biological Phosphorus Removal Pilot
5
• 2011-2012 pilot study determined that effluent quality stability was determined directly related to digested sludge dewatering recycle loads.

Biological Phosphorus Removal Impacts
6
• Significant decrease in dewatered cake solids and increase in polymer demand were observed, in addition to struvite deposition.
• Piloting allowed staff to rapidly increase knowledge about effluent quality requirements and other side-effects and cost impacts.

Biological Phosphorus Removal Impacts
7
• Managing phosphorus in the solids processes and recycle stream became increasingly important to account for multiple drivers.

Dewatering Optimization: Why We Care
8
• $2.5 – $3.5M in annual dewatering polymer costs• Complexity includes multiple variables
➢ Targeted biosolids cake %TS – Hauling and land application regularity ➢ Targeted dewatering capture efficiency➢ Polymer type and preparation ➢ Centrifuge feed and mechanical settings➢ Sludge dewaterability
• Continuous optimization builds datasets for cost savings and future comparative evaluations
Total District Combined Treatment and Hauling / Land Application Expenses - Emulsion Polymer
Dewatered Cake TS%
18 20 22 24
Hauling/Land App $ 4,031,977 $ 3,549,763 $ 3,316,589 $ 3,226,443
Polymer $ 2,244,565 $ 2,694,699 $ 3,144,832 $ 3,594,965
Total $ 6,276,543 $ 6,244,462 $6,461,421 $ 6,821,408
Full-scale Dewatering Optimization
9
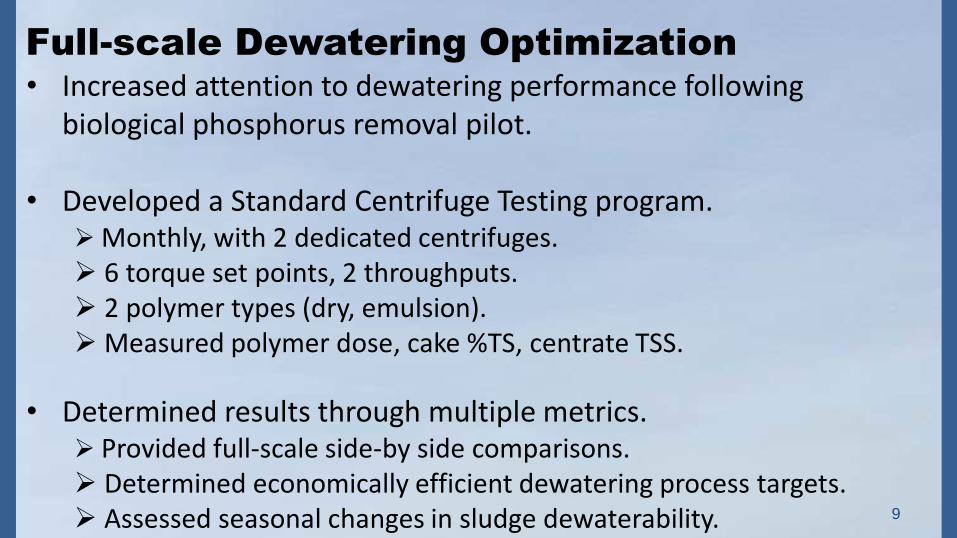
• Increased attention to dewatering performance following biological phosphorus removal pilot.
• Developed a Standard Centrifuge Testing program.➢ Monthly, with 2 dedicated centrifuges.➢ 6 torque set points, 2 throughputs.➢ 2 polymer types (dry, emulsion).➢ Measured polymer dose, cake %TS, centrate TSS.
• Determined results through multiple metrics.➢ Provided full-scale side-by side comparisons.➢ Determined economically efficient dewatering process targets.➢ Assessed seasonal changes in sludge dewaterability.

Full-scale Dewatering Optimization
10
• Graphical representations of dewatering results showed the impacts of operational modifications.
• Gained additional confidence in operator understanding and attention to dewatering.

Bench-scale Dewatering Optimization
11
• In-house development of the “Limit Dryness Test” to develop optimal polymer dose estimates.
• Staff understanding that changes are relative.• Goal of bench-scale modifications to recommend pilot-scale
activities.

Bench-scale Dewatering Optimization
12
• Real-time measurement of water release rate.• Repeatability is critical for gaining confidence.

Bench-scale Dewatering Optimization
13
• Optimal polymer dose testing targeted more than cake %TS.• Changes captured over time with changing process conditions.

Bench-scale Dewatering Optimization
14
• Optimal polymer dose tracked well with full-scale performance.• Normalized to pounds of dry polymer per dry ton @ 20% TS.

Bench-scale Dewatering Research
15
• Testing of MgCl2 addition and aeration showed significantly improved dewaterability.
• Consideration of recycle phopshorus control processes to meet other goals.
• 90% reduction in filtrate ortho-phosphate• 10-20% reduction in dewatering polymer demand
• Improvements led to decision to move forward with digested sludge phosphorus recovery pilot testing.
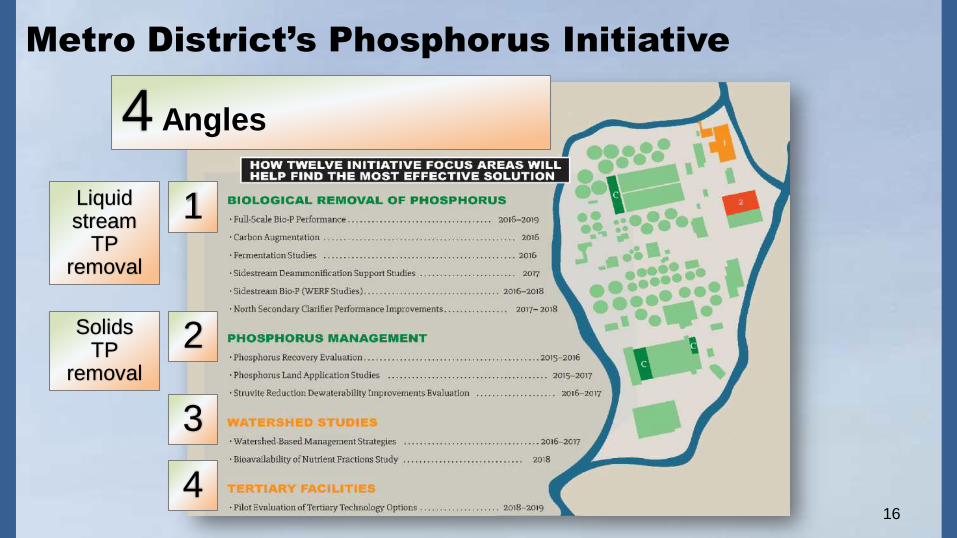
Metro District’s Phosphorus Initiative
4 Angles
1
2
3
4
Liquid stream
TP removal
SolidsTP
removal
16

Metro District’s Phosphorus Initiative
GOAL
To find the most effective and sustainable phosphorus management approach through an intensive study phase of phosphorus recovery technologies under the phosphorus initiative

Effective and Sustainable Phosphorus
Management
5 Measures for Success
1. Break the phosphorus recycle loop
2. Biosolids dewatering costs
3. Struvite-scale issues for O&M
4. Phosphorus loading on soils
5. Recovery of a finite resource
1 lb of phosphorus equates to 8 lbs of struvite.7,000 lbs of phosphorus enter the RWHTF each day!
18

AirPrex Pilot Testing
Hypothesis:
Will create a controlled
environment to precipitate struvite
from District solids to
simultaneously address:
Break P-Recycle Loop
Biosolids Dewatering
Struvite Issues
Phosphorus Index
Product Recovery 19
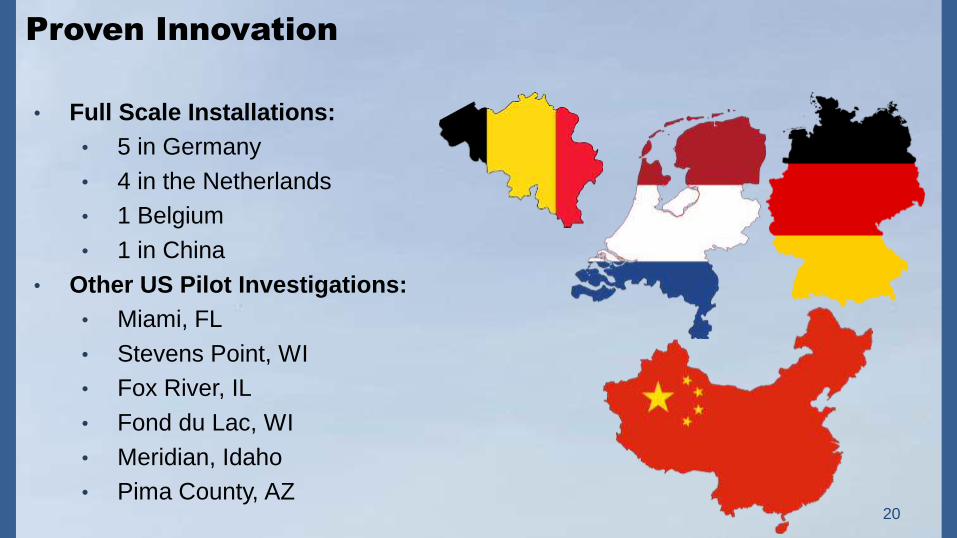
Proven Innovation
20
• Full Scale Installations:
• 5 in Germany
• 4 in the Netherlands
• 1 Belgium
• 1 in China
• Other US Pilot Investigations:
• Miami, FL
• Stevens Point, WI
• Fox River, IL
• Fond du Lac, WI
• Meridian, Idaho
• Pima County, AZ

How Does AirPrex Work?
Anaerobic Digestion
Centrifuge
Centrate
Biosolids
AirPrex
Struvite
Digester effluent is fed to AirPrex reactorReactor is aerated which strips the CO2 from the reactor and raises the pH
Magnesium is dosed to the reactor causing struvite to
precipitate
CO2 Mg
Struvite settles and is pumped out and cleaned
AirPrex effluent, stripped of phosphorus, is sent to dewatering centrifuges
21

AirPrex Pilot
• Pilot onsite from June 6th through
August 3rd
• Reactor operated continuously at a
flow of 11 gpm
• Centrisys CS10-4 centrifuge
operated 6 – 8 hours per day
• Mg:P molar dosing ratio varied
between 0.7:1 – 1.7:1
22

Sampling and Testing Protocol
23
• Weekly water quality analyses• Daily dewatering analyses• Over 3000 water and solids analyses!
Parameter Reactor CentrifugeInfluent Underflow Effluent Influent Centrate Cake
pH • • • •
Temperature • • • •
Total Solids (TS) • • • • •
Volatile Solids (TVS) • • • •
Total Ca, Mg, Fe, K, Na • • • • •
Dissolved Ca, Mg, Fe, K, Na • • • •
Orthophosphate • • • •
Total Phosphorus •
Water Extractable Phosphorus • •
Acid-cake Struvite Test •
Ammonium • • • •
Conductivity • • • •
Total Alkalinity • • • •
CODEPS • • •

Modeling
• Thermodynamic modeling to model nuisance struvite formation potential upstream and downstream of the digesters and recovery technologies
• Struvite Tool (Office of Water Programs, Sacramento, California)
• Visual Minteq (KTH, Sweden)
• BioWin
• Effects of reduction in recycle phosphorus would have on Bio P performance
24

Driver 1: Phosphorus Recycle Control
0
100
200
300
Typical Untreated Mg:P0.7:1
Mg:P1.4:1
Mg:P1.7:1
Ph
osp
ho
rus,
mg/
L
Orthophosphorus Particulate Phosphorus
25
• OP and TP were observed to decrease in the centrate as the Mg:P molar dosing ratio increased to 1.4:1
• At 1.7:1 Mg:P molar ratio, OP was lowest while TP increased –potentially due to fines loss

Driver 1: Phosphorus Recycle Control
0
100
200
300
400
500
0
0.05
0.1
0.15
0.2
0.25
0.3
No Recovery Digestate
Ce
ntr
ate
Re
cycl
e S
olu
ble
P,
mg
/L
Seco
nd
ary
Effl
uen
t So
lub
le P
, mg/
L
Secondary Effluent Soluble P Centrate Recycle Soluble P
26
• Reducing recycle soluble phosphorus concentrations from 400 mg P/L to 30 mg P/L would result in a decrease in secondary effluent OP

Driver 2: Dewatering Performance
• Cost Centers:
$ Polymer consumption
$ Wet mass of biosolids for hauling and dispersal
▪ Tracked cake total solids and polymer consumption Polymer dose varied in 5 active pound/dry ton increments
Higher average centrifuge hydraulic pressures for AirPrex treated
27
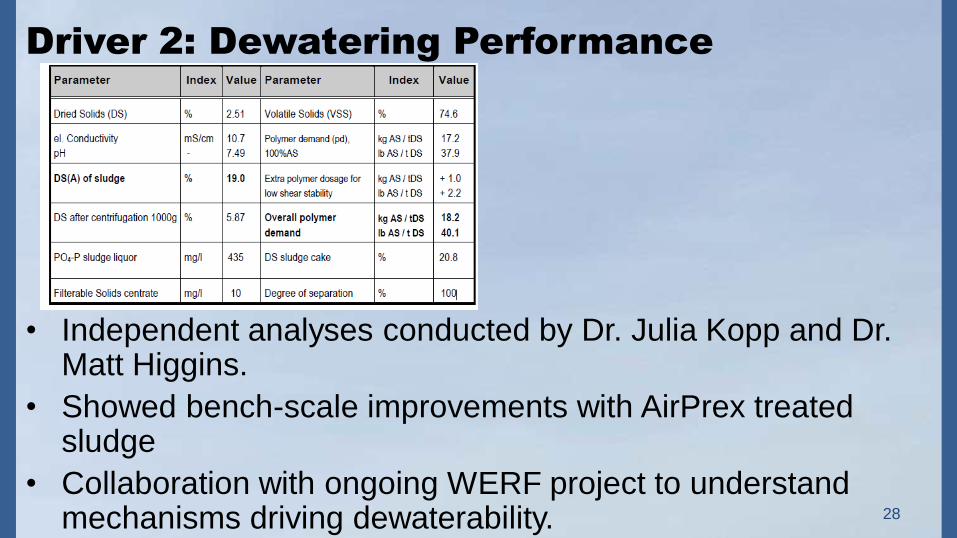
Driver 2: Dewatering Performance
• Independent analyses conducted by Dr. Julia Kopp and Dr. Matt Higgins.
• Showed bench-scale improvements with AirPrex treated sludge
• Collaboration with ongoing WERF project to understand mechanisms driving dewaterability. 28

Solids Correction – Dry Mass
CentrifugeAirprex Apx Eff Biosolids
Cen
trate
MgC
l2
fp
29
NH4MgPO4●6H2O Generated in AirPrex
Total solids = ∆𝑂𝑃 ∗ (𝑀𝑊𝑆𝑡𝑟𝑢𝑣𝑖𝑡𝑒
𝑀𝑊𝑃)
Fraction of struvite in biosolids matrix - fb
Digestate
Product
Fraction of struvite fines in centrate - fcFraction of struvite that settles and is pumped out as product - fp
fp + fc + fb = 1
fb
fc

Solids Correction – Dry Mass
CentrifugeAirPrex Apx Eff Biosolids
Cen
trate
fp
30
Digestate
Product
fb
fc
Acidification tests performed on dewatered biosolids to estimate total struvite
Untreated cake struvite content ~5.3%
AirPrex treated cake struvite content ~11.7%
~6.4% increase in struvite - 80% retention in cake
Assumed negligible based on centrate TP at optimal operation
~0
~80%
~20%

Solids Correction
NH4MgPO4●6H2OAmmonia and water evaporate from struvite in
the temperature range of 55 oC to 250 oC
Traditional TS concentration test measures a portion of struvite mass as water, underestimating total solids in sample
NH4 + 6H2O = 51.4% of struvite mass
This affects metrics traditionally used for assessing sludge dewaterability

Solids Correction Method
▪ Corrected TS concentration measurement Ongoing work to determine actual extent of struvite evaporation
Assumed 51.4% loss of struvite due to evaporation
▪ Digestate TS correction:
%𝑇𝑆 𝑐𝑜𝑟𝑟𝑒𝑐𝑡𝑒𝑑 = %𝑇𝑆 𝑚𝑒𝑎𝑠𝑢𝑟𝑒𝑑 ∗ (1 + 0.053 ∗ 0.514 )
• AirPrex effluent TS correction:%𝑇𝑆 𝑐𝑜𝑟𝑟𝑒𝑐𝑡𝑒𝑑 = %𝑇𝑆 𝑚𝑒𝑎𝑠𝑢𝑟𝑒𝑑 ∗ (1 + 0.117 ∗ 0.514 )
• Wet tons calculation:
𝑊𝑇𝑃𝐷 =𝐷𝑇𝑃𝐷
%𝑇𝑆32

AirPrex - Dewaterability
Complete Dataset
15%
17%
19%
21%
23%
25%
27%
29%
0 1 2 3 4 5 6 7
Cak
e %
To
tal S
olid
s (U
nco
rrec
ted
fo
r St
ruvi
te)
Polymer Dose (Active Pounds per Hour)
AirPrex Effluent
Digestate
33
297 data points analyzed
8.9 % reduction in wet tons hauled

AirPrex – Dewaterability
Sorted - 10 gpm, 90% OP removal
15%
17%
19%
21%
23%
25%
27%
29%
0 1 2 3 4 5
Cak
e %
To
tal S
olid
s(U
nco
rrec
ted
fo
r St
ruvi
te)
Polymer Dose (Active Pounds per Hour)
AirPrex
Effluent
Digestate
34
61 data points analyzed
12.44% reduction in wet tons hauled

AirPrex – Dewaterability
Paired Dataset
15%
17%
19%
21%
23%
25%
27%
29%
0 1 2 3 4 5
CA
KE
% T
OTA
L SO
LID
S (U
NC
OR
REC
TED
FO
R S
TRU
VIT
E)
POLYMER DOSE (ACTIVE POUNDS PER HOUR)
AirPrex
Digestate
35
20 data points analyzed
8.7% reduction in wet tons hauled
17.6% decrease in polymer consumption

Sensitivity Analysis of Assumptions
36
• Assumptions on product recovery and evaporated TS mass do impact the estimation of wet tons hauled per day

AirPrex Biosolids Dewatering Costs
Approximately 15–20% decrease in polymer
use
8.7% reduction of biosolids hauled
Untreated Biosolids21 Hauled Truckloads
After AirPrex Treatment19 Hauled Truckloads
Difference of 2 truckloads per day or 730 truckloads per year!
37

Driver 3: Nuisance Struvite Reduction
0
200
400
600
800
1000
1200
1400
6/9 6/19 6/29 7/9 7/19 7/29
Pre
Air
Pre
x, P
ost
Air
Pre
x, a
nd
C
entr
ate
Stru
vite
Pro
du
ctio
n, l
b/d
Untreated Digestate Airprex Treated Digestate
38
Significant reduction of struvite mass predicted between untreated and AirPrex treated
0
100
200
300
400
500
600
700
800
6/9 6/19 6/29 7/9 7/19 7/29
Pre
Air
Pre
x, P
ost
Air
Pre
x, a
nd
C
entr
ate
Stru
vite
Pro
du
ctio
n, l
b/d
Untreated Centrate Treated Centrate
Reduced Mg Feed Reduced Mg Feed
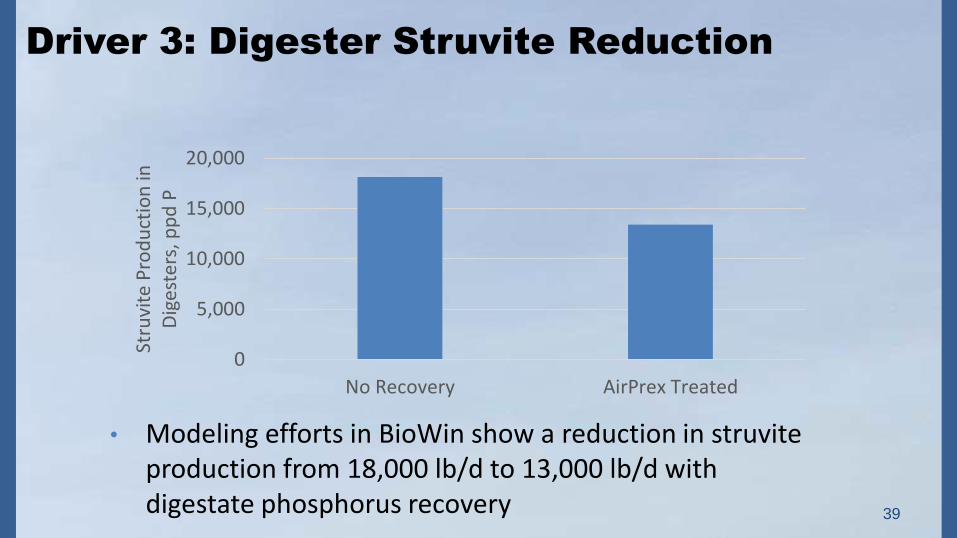
Driver 3: Digester Struvite Reduction
0
5,000
10,000
15,000
20,000
No Recovery AirPrex Treated
Stru
vite
Pro
du
ctio
n in
D
iges
ters
, pp
d P
39
• Modeling efforts in BioWin show a reduction in struvite production from 18,000 lb/d to 13,000 lb/d with digestate phosphorus recovery

Driver 5: Product Recovery
150 tons of phosphorus recovered annually
Potential distribution
Composters
Fertilizer manufacturers
Potential uses
Turf grass
Alfalfa
40

Driver 5: Product Recovery
Struvite Product - Metals Analysis
Pollutant"High Quality"
Pollutant ConcentrationLimits (mg/kg)
Pilot MAP Results(ppm)
Lab Analysis from Previous Pilot (ppm)
Arsenic 41 BDL2
Cadmium 89 BDL BDLCopper 1500 71 19
Lead 300 18.9Mercury 17 1.7
Molybdenum1 < 75 0.8Nickel 420 BDL BDL
Selenium 100 BDLZinc 2800 33 26
1. There is currently no limit for Molybdenum for High Quality while rules are awaiting EPA investigation. Ceiling limit is 75 ppm.
2. Levels were below detection limit
Struvite product produced by Airprex is well below limits of “high quality” pollutant concentrations

Driver 5: Product Recovery
Struvite Product - Pathogen Testing
Fecal Coliforms Drying Test (MPN/g-TS)
Sample Date Initial 24hr 48hr
8/2/2016 31 26 65
Class A: maximum density of fecal coliform < 1000 MPN per gram total solids (dry-weight basis)
2 Samples were taken for pathogen testing using fecal coliforms July 19: 1000 MPN/g TS August 2: Investigate fecal coliform with drying time
Current testing of product shows Airprex struvite may be within Class A categorization for biosolids

AirPrex Pilot Testing Results
43
Phosphorus Recycle Control Reliable OP and TP Reduction
Biosolids Dewaterability
Polymer ~17% polymer reduction
Truck Hauls ~8.7% reduction hauled mass
Struvite Reduction
Digesters~25% reduction digester struvite
DewateringSignificant reduction in dewatering nuisance struvite
Phosphorus IndexAccumulation of phosphorus in biosolids
Product Recovery 25% - 35% product recovery

Preliminary Pilot Testing Results
44
DigestatePhosphorus
Stripping
Phosphorus Recycle Control
Reliable OP and TP reduction
Assessing need for lamella plate settlers
Biosolids Dewaterability
Polymer ~17% polymer reduction Awaiting additional testing
Truck Hauls~8.7% reduction hauled mass
~6.6% reduction hauled mass
Struvite Reduction
Digesters~25% reduction digester struvite
~55% reduction digester struvite
DewateringSignificant reduction in dewatering nuisance struvite due to limiting OP
Significant reduction in dewatering nuisance struvite due to limiting Mg
Phosphorus IndexImprovement over chemical sequestration
Improvement over chemical sequestration
Product Recovery 25% - 35% product recovery
70%+ product recovery

Annual O&M Costs and Product Revenue
45


PHOSPHORUS WAS STRIPPING AND
CENTRATE RECOVERY PILOT WORK
Phosphorus Recovery Pilot Work
47

Ostara Pearl
First installation 2008
CalgaryEdmonton
Saskatoon
48

How Ostara+WASSTRIP Works
ThickeningDewatering
Anaerobic Digestion
WASSTRIPProcess
Struvite
Biosolids
Centrate
Phosphorus-stripped WAS from the WASSTRIP reactor is thickened
Phosphorus is released into the liquid stream and separated from the biosolids
Low P
High P
Centrate from dewatering is high in ammonia and is combined with liquid stream from WASSTRIP
Caustic
Mg
Caustic is added to raise the pH
Magnesium is dosed to the reactor, causing struvite to precipitate
Struvite pearls settle and are pumped out and cleaned
Ostara Pearl effluent, stripped of phosphorus, is recycled back to mainstream
49

Phosphorus Stripping Pilot Test
50
Pilot October 2016 to ongoing
Evaluate features and benefits of WAS phosphorus stripping
Dewatering performance
Nuisance struvite reduction
Batch WAS phosphorus stripping reactor with thickening press

Phosphorus Stripping Pilot Test
51
Control Train receives TWAS, test train receives stripped TWAS
Two separate activated sludge trains allows for centrate recycle to be fed to North; control train reflects bio-P with recycle control
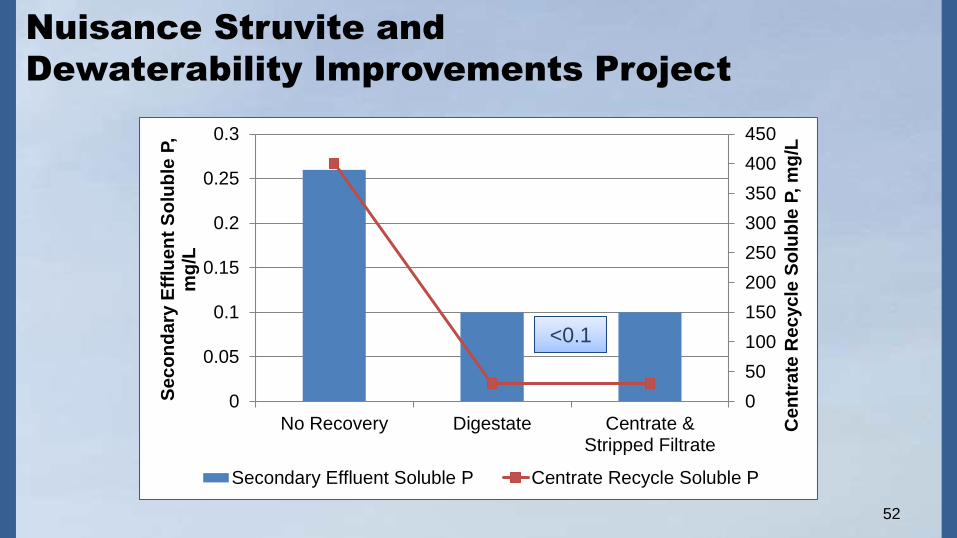
Nuisance Struvite and
Dewaterability Improvements Project
0
50
100
150
200
250
300
350
400
450
0
0.05
0.1
0.15
0.2
0.25
0.3
No Recovery Digestate Centrate &Stripped Filtrate
Cen
trate
Recycle
So
lub
le P
, m
g/L
Sec
on
dary
Eff
luen
t S
olu
ble
P,
mg
/L
Secondary Effluent Soluble P Centrate Recycle Soluble P
52
<0.1

Digester Nuisance Struvite Production
53
0
4,000
8,000
12,000
16,000
20,000
No Recovery Digestate Centrate &Stripped Filtrate
Stru
vite
Pro
du
ctio
n in
D
iges
ters
, lb
/d
Anaerobic Digestion
Method of determination: • Mass balance on measured analytes• BioWin modeling• XRD analysis
25% 45%

Biosolids Production
54
0
100
200
300
400
500
No Recovery Digestate Centrate & StrippedFiltrate
Bio
solid
s P
rod
uct
ion
, tp
d
Dry Mass, dtpd Total Mass, wtpd
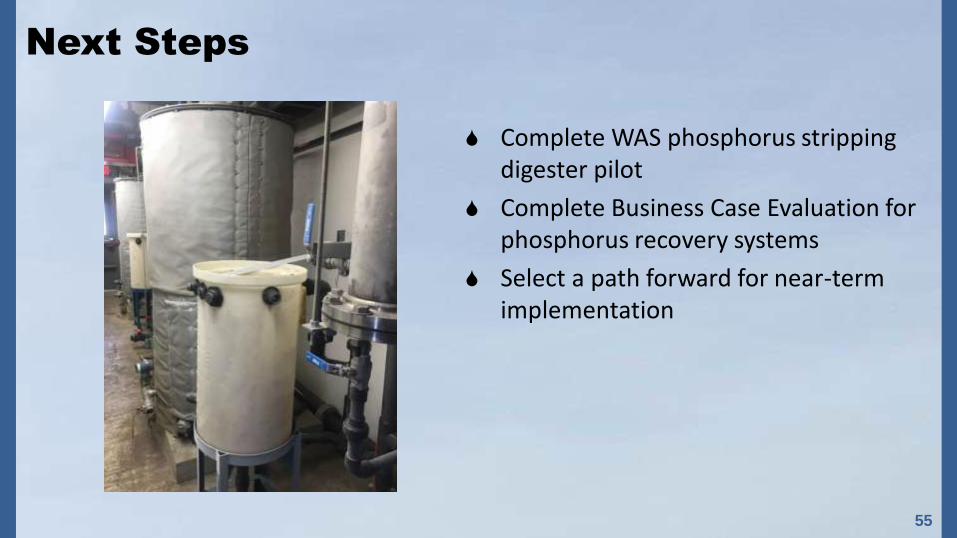
Next Steps
55
Complete WAS phosphorus stripping digester pilot
Complete Business Case Evaluation for phosphorus recovery systems
Select a path forward for near-term implementation

Product Recovery
56
Class B – From digestion process
Class A – Demonstrated through VAR, pathogen, metals testing
Classification leaving RWHTF Product Production Potential Final Use
Compost – Blended with final product for custom high P product
Fertilizer – Incorporated into blended product or sold as-is
Compost – Added at beginning of process to create Class A product
Fertilizer – Incorporated into blended product
Class A unrestricted use –Turf grass, high P demand crops such as alfalfa
Class A unrestricted use –Turf grass, high P demand crops such as alfalfa
Class B restricted use –Golf courses