dgca: a comprehensive r package for differential gene
TRANSCRIPT
RESEARCH ARTICLE Open Access
DGCA: A comprehensive R package forDifferential Gene Correlation AnalysisAndrew T. McKenzie1,2,3, Igor Katsyv1,2,3, Won-Min Song1,2, Minghui Wang1,2 and Bin Zhang1,2,4*
Abstract
Background: Dissecting the regulatory relationships between genes is a critical step towards building accuratepredictive models of biological systems. A powerful approach towards this end is to systematically study thedifferences in correlation between gene pairs in more than one distinct condition.
Results: In this study we develop an R package, DGCA (for Differential Gene Correlation Analysis), which offers asuite of tools for computing and analyzing differential correlations between gene pairs across multiple conditions.To minimize parametric assumptions, DGCA computes empirical p-values via permutation testing. To understanddifferential correlations at a systems level, DGCA performs higher-order analyses such as measuring the averagedifference in correlation and multiscale clustering analysis of differential correlation networks. Through a simulationstudy, we show that the straightforward z-score based method that DGCA employs significantly outperforms theexisting alternative methods for calculating differential correlation. Application of DGCA to the TCGA RNA-seq datain breast cancer not only identifies key changes in the regulatory relationships between TP53 and PTEN and theirtarget genes in the presence of inactivating mutations, but also reveals an immune-related differential correlationmodule that is specific to triple negative breast cancer (TNBC).
Conclusions: DGCA is an R package for systematically assessing the difference in gene-gene regulatoryrelationships under different conditions. This user-friendly, effective, and comprehensive software tool will greatlyfacilitate the application of differential correlation analysis in many biological studies and thus will helpidentification of novel signaling pathways, biomarkers, and targets in complex biological systems and diseases.
Keywords: Differential correlation, Differential coexpression, Multiscale clustering analysis, R package, RNA-Seq,TP53, Breast cancer, Triple negative breast cancer
BackgroundOver the past two decades, a wealth of high-dimensionalbiological data types have emerged including microarray,RNA-seq, proteomics, epigenomics, metabolomics, lipido-mics, and many others [1, 2]. A common use of these datais to gather and compare samples from multiple conditions,e.g., disease and non-diseased, in an attempt to identifymolecular identifiers (e.g., probes, transcripts, genomic fea-tures, proteins, metabolites, lipids; henceforth, “genes”) thatdistinguish between different conditions. Currently, themost common method of comparing samples from
different conditions is differential expression analysis [3, 4].Recently, new methods for detecting differential co-expression or differential correlation analysis have emergedto gain insights into the difference in gene-gene relation-ships between various conditions of interest. Distinct fromdifferential expression, differential correlation operates onthe level of gene pairs rather than individual genes (Fig. 1).Differential co-expression analysis can start with coex-pressed gene modules or clusters based on the similarity oftheir gene expression in each condition using WGCNA [5]and MEGENA [6] and then computes module overlapstatistics between conditions [7] or the average modulardifferential connectivity [8, 9]. Alternative approachesincluding DICER [10], DINGO [11], CoXpress [12], SDC[13], DiffCoEx [14], GSCA [15], and GSNCA [16] were de-veloped to identify differential co-expression relationships
* Correspondence: [email protected] of Genetics and Genomic Sciences, Icahn School of Medicine atMount Sinai, One Gustave L. Levy Place, New York, NY 10029, USA2Icahn Institute of Genomics and Multiscale Biology, Icahn School ofMedicine at Mount Sinai, One Gustave L. Levy Place, New York, NY 10029,USAFull list of author information is available at the end of the article
© The Author(s). 2016 Open Access This article is distributed under the terms of the Creative Commons Attribution 4.0International License (http://creativecommons.org/licenses/by/4.0/), which permits unrestricted use, distribution, andreproduction in any medium, provided you give appropriate credit to the original author(s) and the source, provide a link tothe Creative Commons license, and indicate if changes were made. The Creative Commons Public Domain Dedication waiver(http://creativecommons.org/publicdomain/zero/1.0/) applies to the data made available in this article, unless otherwise stated.
McKenzie et al. BMC Systems Biology (2016) 10:106 DOI 10.1186/s12918-016-0349-1

between conditions and gene modules in each conditionsimultaneously.While differential coexpression analysis has proven useful
in identifying significantly different modular connectivitypatterns, differential correlation analysis of individual genepairs is far more granular. As an example of such adifferential correlation, RNA levels of the prostate cancerbiomarker gene AMACR have been found to have positivecorrelation with the tumor suppressor gene PTEN inadjacent normal tissue samples, but not in prostate cancertissue samples [17]. Multiple approaches for identifyingdifferential correlation between individual gene pairs havebeen developed, including DiffCorr [18], EBcoexpress [19],and Discordant [20]. DiffCorr calculates correlations ineach condition and uses the difference in z-transformedcorrelation coefficients to calculate p-values. EBcoexpressuses an empirical Bayesian approach and a nestedexpectation-maximization algorithm to estimate the poster-ior probability of differential correlation between gene pairs.Discordant fits a mixture distribution of correlation classesin each condition and uses an expectation-maximizationalgorithm to estimate the posterior probability of eachdifferential correlation category [21].In this manuscript, we introduce DGCA, an R package
to identify differential correlations between gene pairs in
multiple conditions. DGCA shares some features withexisting approaches for identifying differential correlation.Like DiffCorr, DGCA transforms correlation coefficientsto z-scores and uses differences in z-scores to calculatep-values of differential correlation between genes. LikeDiscordant, DGCA classifies differentially correlated genepairs into the nine possible categories. However, DGCAdiffers from the existing differential correlation approachesin four key ways. First, DGCA calculates false discoveryrate of differential correlations through non-parametricsample permutation. Second, DGCA can calculate theaverage difference in correlation between one gene and agene set across two conditions. Third, DCGA integrateswith MEGENA to perform multiscale clustering analysisof differential correlation networks to identify gene mod-ules (clusters) and hub genes. Finally, DGCA providescomprehensive downstream functional analysis of differen-tial correlation structures including visualization, geneontology (GO) enrichment, and network tools.To assess the performance of DGCA and the existing
methods EBcoexpress and Discordant in identifyingdifferentially correlated gene pairs, we designed andimplemented a simulation study. Next, we applied DGCAto the breast cancer data from The Cancer Genome Atlas(TCGA) with and without p53 and PTEN coding
Fig. 1 An example demonstrating the theoretical difference between differential expression and differential correlation. The top panel shows theRNA expression levels for two example genes in two example conditions. The bottom left panel shows that both of these genes have decreasedexpression values from condition A to condition B. On the other hand, the bottom right panel shows that these genes have positive correlationin condition A but no correlation in condition B, which could not have been predicted on the basis of the differential expressionrelationships alone
McKenzie et al. BMC Systems Biology (2016) 10:106 Page 2 of 25
mutations. We identified five genes with a significantchange of correlation with TP53 in the p53-mutated sam-ples, and two genes with a significant change of correlationwith PTEN in the PTEN-mutated samples. We showed thateach gene’s differential correlation with TP53/PTENbetween p53/PTEN wildtype and inactivated samples isuncorrelated with its differential expression in this data set.By evaluating differential correlations between the overallcorrelation matrices, DGCA allowed us to harness add-itional insights about the regulatory patterns among TP53’stargets following p53 mutation. We further performedDGCA on the estrogen receptor-positive (ER+) and triplenegative (TN) breast cancer subtypes in the TCGA breastcancer data and identified key gene ontology categories thatdiffer in regulation between breast cancer subtypes. By inte-grating DGCA with the multiscale clustering approachMEGENA, we identified modules containing key hub genesthat coordinate differential correlations between the twosubtypes. We demonstrated that DGCA/MEGENA canbetter detect modules than the established approachesDICER and DiffCoEx in another simulation study. Further-more, we showed that a majority of the modules detectedby DGCA/MEGENA in the TCGA breast cancer data werenot detected by DiffCoEx or DICER, while a majority of themodules detected by either DiffCoEx or DICER wereuncovered by DGCA/MEGENA, revealing the novelty ofour proposed module detection approach.
MethodsDifferential correlation analysis flowDGCA has three main inputs including a matrix of geneexpression values, a design matrix specifying conditionsassociated with samples, and a specification of the condi-tions for comparison (Fig. 2). Prior to the actual analysis,users have the option to filter the input expression matrixto remove genes with low expression central tendencyand/or dispersion, since these genes are more likely tohave spurious correlations. Note that central tendency re-fers to measures of centrality in a distribution, includingthe arithmetic mean or median, while dispersion refers tomeasures of spread in a distribution, including thestandard deviation and the dispersion index (the variancedivided by the mean). To stabilize the variance of samplecorrelation coefficients in each condition, the Fisherz-transformation is employed [22, 23]:
z ¼ atanh rð Þ ¼ 12loge
1þ r1−r
� �
where r is the sample correlation coefficient, loge is the nat-ural logarithm function, and atanh is the arc-tangent hyper-bolic function. In this context, the Fisher z-transformationfunction serves as a normalizing transformation. Thevariance of the resulting z-scores depends on whether the
sample correlation coefficient is the Pearson product-moment correlation coefficient (rp) or the Spearman’s rankcorrelation coefficient (rs) [24]. When the underlyingdistribution is assumed to be bivariate normally distributed,the variance can be calculated by
var rp� � ¼ 1
n−3orvar rsð Þ ¼ 1:06
n−3
where n is the sample size of the calculated correlation.Notably, the variance of the correlation coefficients in aparticular condition could differ due to a different num-ber of samples or due to missing data in one or both ofthe genes’ expression measurements. These equationsfor the variance have been found to be valid over a widerange of sample sizes that are common in currentbiological data sets [24]. Due to the denominator, theequations require that there are at least 4 samples ineach condition considered. The difference in z-scores(dz) between two conditions can then be calculated by,
dz ¼ ðz1−z2Þffiffiffiffiffiffiffiffiffiffiffiffiffiffiffijsz12 − sz22 jp
where s2zx refers to the variance of the z-score in condi-tion x. Using the difference in z-scores dz, a two-sidedp-value can be calculated using the standard normaldistribution. Gene pairs can then be ranked on the basisof their relative strength of differential correlation.
Multiple hypothesis testing correctionWhen testing for differential correlation between gene pairsin genome-wide experiments, the number of hypothesistests grows quadratically in the number of genes. Forexample, differential correlation analysis of 20,000 geneswould require 199,990,000 hypothesis tests. Therefore,DGCA offers several options for adjusting p-values formultiple hypothesis tests, including the conservativeBenjamini-Hochberg p-value adjustment method [25, 26]and the local false discovery rate method [27]. However,even when using these options, it can be difficult to makeintuitive sense of the p-values returned because thep-values are originally derived from the difference ofz-scores method, which depends on specifying the correctform for the variance of the sample correlation coefficients,and in turn on the bivariate distribution of the gene expres-sion values. Therefore, DGCA also offers to generate per-mutation samples by randomly shuffling the sample labelsacross the input conditions and then re-computing the dif-ferential correlation calls. The z-scores from the originaland permuted data sets are used to calculate empiricalp-values, using a reference pool distribution approachadapted from the R package qvalue [28]. These empiricalp-values are used to estimate the proportion of null hypoth-eses in empirical p-values by extrapolating a linear trend
McKenzie et al. BMC Systems Biology (2016) 10:106 Page 3 of 25

from a cubic spline fitted over candidate ranges of the tun-ing parameter lambda [29]. Then, q-values are calculatedbased on the empirical p-values and the estimated propor-tion of null hypotheses.
Classifying differentially correlated gene pairsAt the most basic level, gene pairs can be classified as hav-ing gain of correlation (GOC) or loss of correlation (LOC)between one condition compared to another. For example,a gene pair with ρ = 0.8 in a condition A and ρ = 0.2 in acondition B is defined as having a gain of correlation in thecondition A and a loss of correlation in the condition B. Togo beyond this binary classification, we also determine iftwo genes are significantly correlated in each condition ornot. By default and throughout this manuscript, the αthreshold for statistical significance of the hypothesis testthat the correlation in each condition is significantly differ-ent from zero is defined as p < 0.05, although users can setdifferent thresholds. This p-value is calculated based on theapproximation that the correlation coefficient follows a
t-distribution with n - 2 degrees of freedom, where n is thesample size of the calculated correlation [30]. The p-valuesassociated with the hypothesis test of non-zero correlationin each separate condition are not adjusted for multipletests by default. Based upon a threshold for correlationsignificance and the sign of correlation in each condition(i.e., positive or negative), gene-gene correlations in eachcondition can be categorized into 3 classes, i.e. significantpositive correlation, no significant correlation, and signifi-cant negative correlation. Therefore, there are 9 classes fordifferential correlations between two conditions (Fig. 3).DGCA also allows users to perform downstream analysesof differential correlation classes, including heatmapvisualization and gene ontology (GO) enrichment analysisof the genes in each differential correlation class.
Calculating the average differential correlation betweengene pairsIt is sometimes useful to measure the difference in averagecorrelations of a gene and a set of genes between two
Fig. 2 Workflow for the Differential Gene Correlation Analysis (DGCA) R package. Users input a gene expression matrix, a design matrix to specifythe conditions, and a comparison vector to specify which conditions will be compared. DGCA then calculates the gene pair correlations withineach condition, processes these correlation values, and compares them to build up a difference in correlation matrix. If permutation testing ischosen, DGCA will perform the same procedure on permuted gene expression matrices. These permutation samples are used to estimate anempirical false discovery rate. After investigators choose the significance threshold for differential correlation between conditions (if any) tochoose downstream gene pairs, they can use DGCA’s capacities for visualization, gene ontology (GO) enrichment, and/or network construction
McKenzie et al. BMC Systems Biology (2016) 10:106 Page 4 of 25

conditions. DGCA quantifies the median difference inz-transformed correlation coefficients of a gene and a geneset (henceforth, median difference in z-score) between twoconditions. In this context, a median difference in z-scoreabove 0 indicates a tendency towards a gain of correlationbetween the given gene and the gene set in the first condi-tion with respect to the second condition, while a mediandifference in z-score below 0 indicates a tendency towardsa loss of correlation. To measure the significance of themedian change in correlation, DGCA leverages the permu-tation samples to calculate empirical p-values, as illustratedby the following equation,
1−Xnp
medj:j≠i dzij
� ���� ��� > medj:j≠i dzpij
� ��� ���=n
where, med refers to the function for the median of aset, i is the gene for which the median difference inz-score is being compared between conditions, dzij is thedifference in z-transformed correlation coefficients be-tween genes i and j in the two conditions, p refers to a
permutation, and n refers to the total number of permu-tations. As a generalization, DGCA also offers to calcu-late the median difference in z-score between all genepairs in two conditions. In this case, in order to calculatea two-sided p-value, the median is taken over all of thegene pairs using the following equation,
1−Xnp
medi;j:i≠j dzij
� ���� ��� > medi;j:i≠j dzpij
� ��� ���=n
This approach is similar to the modular differentialcorrelation calculation that was previously described andused [8, 9].
Simulated biological data and comparison withEBcoexpress and DiscordantWe designed a simulation study to assess the perform-ance of DGCA and the existing methods EBcoexpress(version 1.12.0) [19] and Discordant (version 0.99.0) [20]at detecting differentially correlated gene pairs in thepresence of noise. We did not compare DGCA toDiffCorr [18] in the simulation study, since both of thesepackages use the Fisher z-transformation and z-scorecalculation as its underlying algorithm, although DGCAoffers a number of additional options, including permu-tation testing to quantify the statistical significance ofgene-gene differential correlation. Among the 600 genesin our simulation study, 300 have high average expres-sion and high dispersion (i.e., are occasionally “activated”in a biological sense) and 100 have high average expres-sion and one-fold lower dispersion (i.e., are “housekeep-ing” genes that are constitutively expressed), and 200have substantially lower average expression and highdispersion (i.e., genes that in a particular cell or tissuetype are “non-expressed”). We built two covariancematrices to describe the dependence structure of the179,700 gene pairs in each condition. We specified thesecovariance matrices so that 19 gene pairs, for whichboth of the genes were in the “activated” gene set, weresegregated into each of the 8 differential correlationclasses. Note that by default all of the gene pairs in thecovariance matrices are set as 0 and the “0/0” differentialcorrelation class means that two correlations under twoconditions are not statistically different and thus it arenot specified. To maintain a positive-definite covariancematrix in the case of negative correlations, we only setthe super- and subdiagonals of the off-diagonals of thecovariance matrix to non-zero values. The super- andsubdiagonals were set to 0.5 or -0.5 times the variance ofa particular gene pair, corresponding to positive or nega-tive correlation in one condition, respectively. Becausetwo differential correlation classes, ρ = +/+ and ρ = -/-,do not specify a difference between correlation betweenconditions, the number of actually differentially
Fig. 3 Definition of differential correlation classes. This diagramdemonstrates the definition of differential correlation classes usedthroughout DGCA in the case of two conditions. The default p-valuesignificance level threshold (α) parameter setting for the hypothesis testof non-zero correlation in one individual condition in DGCA andthroughout this manuscript is 0.05, although users of DGCA can adjustthis parameter if they choose to. In each condition, gene pairs aredefined as having a non-significant correlation (p-value < α), a significantand positive correlation (p-value < α, correlation (ρ) > 0), or a significantand negative correlation (p-value < α, correlation (ρ) < 0). The Cartesianproduct of the 3 possible correlation classes in one condition with the 3in the other condition yields a total of 9 possible differential correlationclasses. Note that, theoretically, a gene pair with a significant positivecorrelation in one condition and a non-significant correlation in anothercondition may not be significantly differentially correlated betweenthese conditions since the correlation class identification is independentof the differential correlation hypothesis test
McKenzie et al. BMC Systems Biology (2016) 10:106 Page 5 of 25
correlated gene pairs is reduced from 152 to 114. Wethen simulated the mean values for each gene using anegative binomial distribution with a dispersion param-eter of 0.5, and set the mean values of less than one toone. The negative binomial distribution and its parame-ters were designed to approximately match the bimodal-ity of expression means observed in RNA expressionexperiments [31, 32]. With the mean values for eachgene as well as the covariance matrix, we simulatedmultivariate normally distributed gene expression matri-ces for various numbers of samples using the R packageMASS [33]. We then employed receiver operating char-acteristic (ROC) curves [34] to measure the performanceof DGCA and EBcoexpress on detecting the 114 trulydifferentially correlated gene pairs out of the total179,700 gene pairs, for six different numbers of simu-lated samples in each condition, i.e., n = 10, 30, 50, 70,90, and 100. We ran the simulation 5 times in order toestimate the standard error of the area under curve(AUC) statistics in the ROC curves. To estimate thestatistical significance of the difference in performancebetween these methods, we used Student’s t-test to com-pare their AUCs at various sample sizes. We adjustedthe p-value threshold required to call a comparison assignificantly different for the number of simulated cases(n = 6; p < 0.05/6 = 0.00833).Of the six types of differential correlation in this simula-
tion study, 38 truly differentially correlated gene pairs hada strong difference (|Δρ| = 1) in correlation coefficient be-tween conditions, while 76 had a medium difference(|Δρ| = 0.5) in correlation coefficient between conditions.We measured the accuracy of each of the methods to dis-tinguish truly differentially correlated gene pairs for boththe strong and medium difference classes, using the samecomparison approach as in the full simulation experiment.For the simulations with n = 30 simulated samples, we alsoplotted representative ROC curves for each class, tovisualize the ability of each of the differential correlation Rpackages to detect truly differentially correlated gene pairsin each of the 6 differential correlation classes. R code forthis simulation study is available online (see “Availabilityand requirements”).
Data processing for applications using breast cancer RNAexpression dataWe applied DGCA to the breast cancer RNA-seq data fromThe Cancer Genome Atlas (TCGA) [35] under two scenar-ios: a) the samples with and without a p53/PTEN mutationand b) the estrogen receptor-positive (ER+) samples andthe triple negative (TN) samples. The level 3 RNAseqV2data of breast cancer in the TCGA data portal first wentthrough a log(x + 1) transform, then was quantile-normalized, and finally was corrected for age, batch, race,and gender using a linear regression approach. For the
differential correlation analysis of p53/PTEN, this RNA ex-pression data was filtered to contain only genes previouslydescribed as within p53/PTEN pathways (described below),but underwent no expression filtering. For the differentialcorrelation analysis between ER+ and triple negative breastcancer, RNA expression data was filtered to remove genesin the bottom 25th percentile of median expression and/ordispersion index of expression (described below), butunderwent no filtering for specific gene sets.
Differential correlation of p53/PTEN targets in normal andp53-/PTEN-mutated breast cancer tumor samplesSomatic mutation data was obtained from TCGA-curated mutations (Washington University School ofMedicine curated mutation calling). We identified a setof RNA expression samples with and without a) a non-silent p53 DNA mutation and b) a non-silent PTENDNA mutation. For the p53 analysis, we next filteredthese RNA expression matrices to contain only genesthat contain a p53 response element [36], are in theMolecular Signatures Database (MSigDB) p53 hallmarkgene set [37], and/or are a downstream target of p53 inthe Pathway Interaction Database [38]. For the PTENanalysis, we filtered the RNA expression matrices to onlycontain genes that are in the Biocarta PTEN pathway[39], the Sigma-Aldrich PTEN pathway [40], and/or havebeen identified in physical interactions with PTEN byaffinity capture, as curated via Biogrid [41]. We then cal-culated the differential Spearman correlations on this fil-tered RNA expression matrices between the p53/PTENmutated and non-p53/non-PTEN mutated breast cancersamples. For p53 only, we used the signType argumentin DGCA to restrict the difference in z-score calculationbetween conditions to positive correlations, since p53 isa transcriptional activator and we reasoned that negativecorrelations with TP53 are less likely to be biologicallymeaningful. Notably, the signType argument in DGCA,which refers to the differential correlation sign type (i.e.,direction), can also be used to restrict the difference inz-score calculation between conditions to negativecorrelations if users are interested in only consideringnegative correlations as non-zero when assessing the dif-ference in correlation between conditions. To assess thesignificance of the difference in gene-gene correlations,we generated empirical p-values via 10,000 permuta-tions. For p53, we further visualized the global differencein correlations among p53-associated genes using theDGCA heatmap visualization, which builds on the gplotsR package (version 2.17). We then visualized the gene-gene correlation matrix in each condition, and calculatedboth the median change in correlation for each gene andthe median change in correlation for all gene pairsbetween the conditions, using 1000 permutations toquantify the significance.
McKenzie et al. BMC Systems Biology (2016) 10:106 Page 6 of 25

Differential correlations in RNA expression data fromestrogen receptor-positive compared to triple-negativebreast cancer samplesFor the data from the ER+ and TN breast cancer samples,we removed the genes in the bottom 25th percentile ofmedian expression and/or dispersion index of expression.Note that the dispersion index is calculated as the ratio ofthe variance divided by the mean. We measured the differ-ences in Pearson correlation between all pairs, using 5 per-mutations to quantify the significance of the difference incorrelation, and identified genes with q-value < 0.05 fordownstream analysis. Upon identifying the significantly dif-ferentially correlation gene pairs, we first collapsed thesegene pairs to identify the genes uniquely present in genepairs with a gain of correlation in one condition comparedto the other, and used the DGCA wrapper function to per-form gene ontology (GO) enrichment analysis based onthe GOstats R package (version 2.34) [42] and org.Hs.eg.dbGO annotation R package (version 3.1.2). For the GO en-richment analysis, we used genes identified in gene pairswith q < 0.01, since this greater specificity yielded a largerset of genes uniquely present in only one of the twodifferential correlation conditions. To compare the GO en-richment between the two conditions, we first filtered forthose GO terms with between 50 and 600 gene symbolswith a nominal significant p-value (<0.05) in at least one ofthe conditions. We next took the log of the ORs, since logORs converge more rapidly to a normal distribution. Wethen calculated the standard error for the log ORs in eachcondition, using the following equations [43],
OR ¼ logn11 � n22n12 � n21
� �
SEOR ¼ffiffiffiffiffiffiffiffiffiffiffiffiffiffiffiffiffiffiffiffiffiffiffiffiffiffiffiffiffiffiffiffiffiffiffiffiffiffiffiffiffiffiffi1n11
þ 1n12
þ 1n21
þ 1n22
r
where, n11 is the number of genes in the intersection be-tween a gene signature and a GO term, n12 is the num-ber of member genes in the GO term but not in thegene signature, n21 is the number of genes in the signa-ture but not in the GO term, and n22 is the number ofgenes in the universe but not in either group. In orderto quantify the significance of the difference in the logORs in each group, we used the following equation,
z ¼ OR1−OR2ffiffiffiffiffiffiffiffiffiffiffiffiSEOR1
p−SEOR2
where, OR1 and OR2 refer to the log odds ratio of theenrichment in conditions 1 and 2, respectively, while zrefers to the z-score of the difference in log ORs. Wethen calculated the associated p-value from the z-scoreusing the cumulative distribution function for thestandard normal distribution. For each GO term type
(i.e., Biological Process (BP), Cellular Component (CC),and Molecular Function (MF)), we adjusted thesep-values using the Benjamini-Hochberg false discoveryrate (FDR) method. We chose the top 5 terms in eachgroup with FDR < 0.05 for visualization.Next, we used the MEGENA R package (version 1.3) [6]
to first build a planar filtered network (PFN) from signifi-cantly differentially correlated gene pairs (q < 0.05) and thenidentify multiscale gene modules in the PFN. We used theabsolute value of the z-score for the difference in correl-ation between conditions as the network weights, and aftercalculating the perfuse forced network, we also normalizedthese weights, to follow the convention that networkweights fall between 0 and 1. Next, we identified modulesand hubs, using the default MEGENA parameters values,including module significance threshold of p < 0.05, a hubdetection significance threshold of p < 0.05, 100 networkpermutations, and a module size of between 50 and 800.We then calculated the odds ratios of the enrichment ofcorrelation class edges in each module using the hypergeo-metric test, and adjusted the enrichment p-values for eachcorrelation class using the Benjamani-Hochberg method.Further, we performed the enrichment of GO terms in eachmodules using the GOstats R package [42] and org.-Hs.eg.db GO annotation R package and adjusted the result-ing p-values for all GO terms in each module with theBenjamini-Hochberg method. We visualized two of thenetworks derived from differential correlation modulesusing Cytoscape and created interactive versions of themvia CyNetShare.
Comparison to alternative module detection approachesWe sought to compare DGCA/MEGENA to twoapproaches to differential correlation module detection,DiffCoEx [44] and DICER [10]. For DiffCoEx, we down-loaded the R script that the authors released in theirSupplementary materials and used the same method andset of R commands they used therein. For DICER, wedownloaded the Java executable file from the author’swebsite (http://acgt.cs.tau.ac.il/dicer/) on 8/21/2016 andran it using Java v. 1.8.0_66. We designed a simulationstudy to assess the performance of different approachesfor detecting differentially correlated modules. Thissimulation study uses many of the same parameters asour previous simulation study of differentially correlatedgene pairs but has several unique features. First, insteadof individual gene pairs that vary in correlation betweenconditions, we designated two modules of 30 genes each,a fraction of the pairs of which were positively correlatedin one of the conditions but had no correlation in theother. In the simulation, we changed the fraction ofpositively correlated gene pairs in a module, definedas the network connectivity κ, from κ = 0.5 to 1, inincrements of 0.1. Further, to ensure positive-definite
McKenzie et al. BMC Systems Biology (2016) 10:106 Page 7 of 25

covariance matrices, we set the numerical tolerance to0.4 in simulating each of the multivariate normally dis-tributed gene expression matrices. Because this numer-ical tolerance moderated the strength of the correlationdifference between conditions, we increased the strengthof correlated gene pairs to 0.9 in the positively correlatedcondition. Notably, we used the default 10 permutationsand q-value threshold of 0.05 for DGCA in the simula-tion study to identify differentially correlated gene pairsas input to MEGENA for module detection. To be con-sistent with DICER, the minimum module size was setto 15 for both MEGENA and DiffCoEx. For each of the10 simulation runs, we computed the highest sensitivity(i.e., the size of the detected module intersection withthe true module) for all modules with less than 50 mem-bers for each module detection method. In each simula-tion run, we also computed the highest Jaccard index(i.e., the size of the intersection of the detected andmodules divided by the union) for all modules for eachmodule detection method. In the case that no moduleswere detected by a method, a pseudo-module comprisedof all the genes in the simulation study was assigned,leading to a Jaccard index of 0.05 (30/600). We thencompared the sensitivity statistics and Jaccard indices ofall simulation runs between the methods at eachnetwork connectivity fraction and number of samplesusing a t-test.We next compared the module detection methods in
terms of their performance on the same set of filteredgenes for ER+ and TN breast cancer RNA expressiondata as used by the DGCA/MEGENA pipeline. We firstassess the relevance of the sets of modules identified bythe three methods through the enrichment test for fivegene signatures characterizing these breast cancer sub-types under study. The modules from each method werefiltered by size to retain modules with greater than 25and less than 1000 members. The five gene sets usedwere a set of genes associated with ER+ breast cancer inmultiple data sets [45], a set of genes associated withTNBC in multiple data sets [46], a set of genes associ-ated with ER signaling curated from several data sets[37, 38, 47–52], KEGG Cell Cycle genes, and KEGGDNA Mismatch Repair genes [47] (Additional file 1).The Benjamini-Hochberg adjustment method was usedto correct the enrichment p-values for multiple testing,and we used an FDR threshold of 0.3 for all the enrich-ments of the gene sets. We then tested how the modulesdetected by one method are conserved in each othermethod based on a significance threshold (p < 0.05) ofthe Benjamini-Hochberg adjusted Fisher’s Exact Test(FET) enrichment p-value. A module is defined asunique to a method if it does not significantly overlapwith any module identified by any other method. Thisprocedure allowed us to determine the proportion of
modules specific to each of the three methods or in anypairwise comparison of modules.
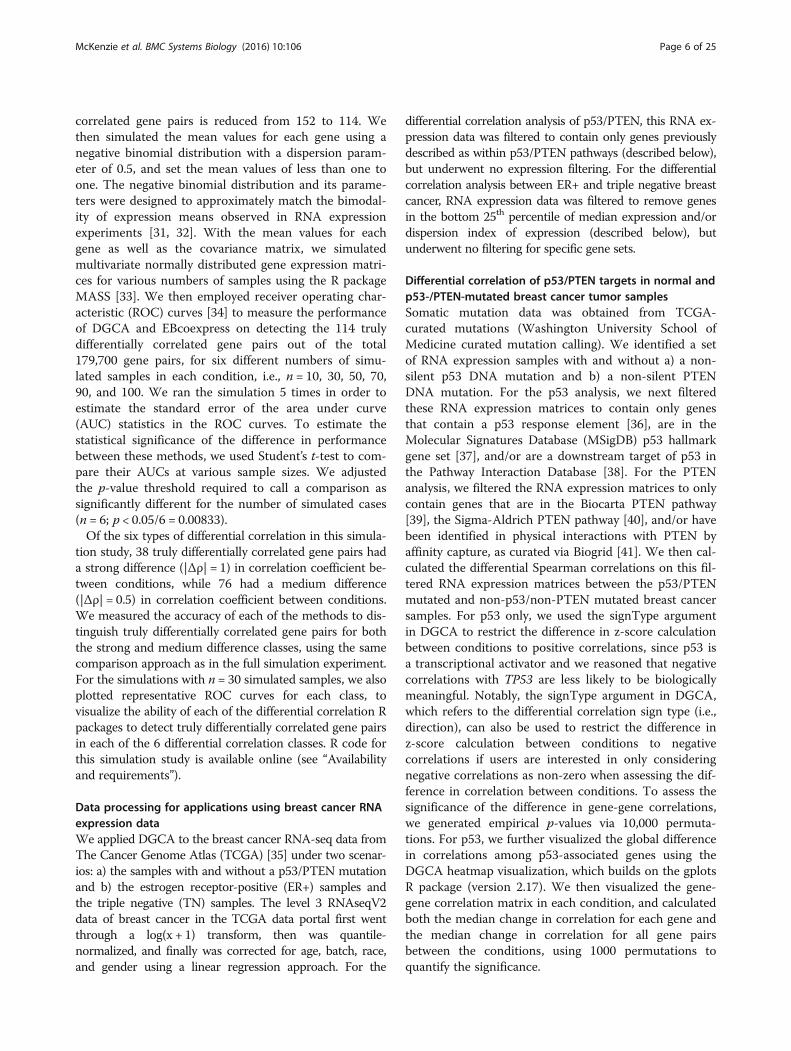
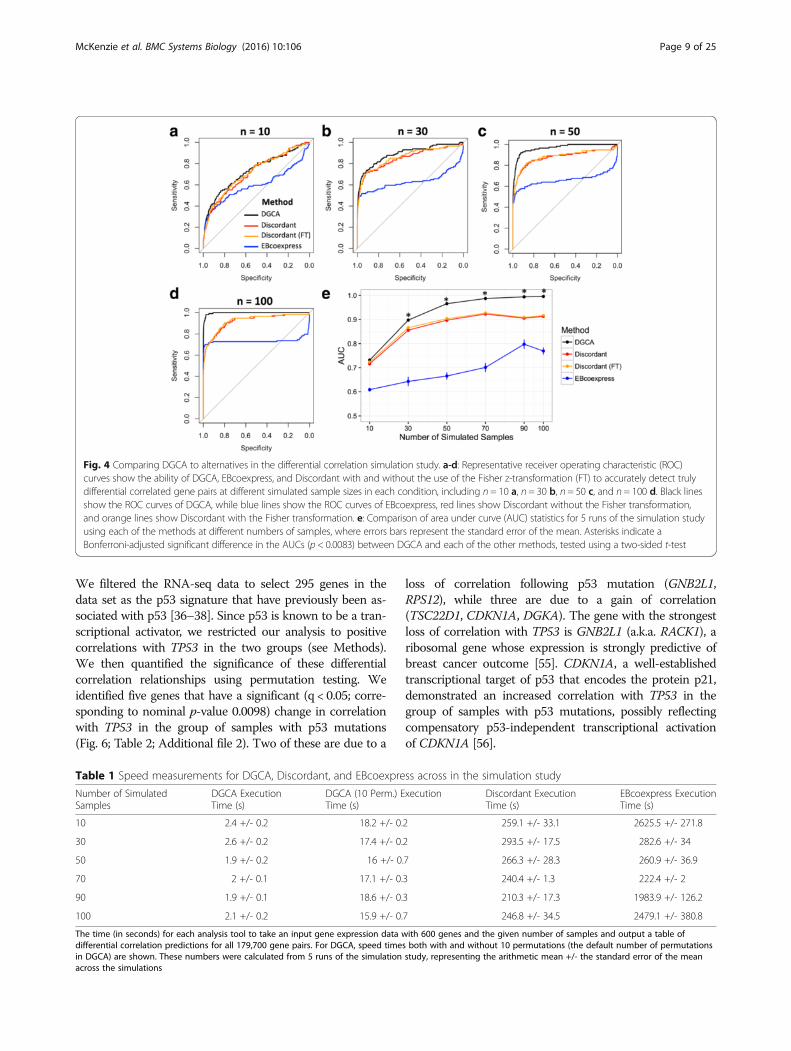
ResultsSimulation study to measure the accuracy of detectingdifferential correlationDGCA is an R package designed to detect differences inthe correlations of gene pairs between distinct biologicalconditions. We first developed a simulation study toconfirm that DGCA can accurately detect differential cor-relation relationships between gene pairs. Specifically, wedesigned an in silico experiment with 600 genes and 114differentially correlated gene pairs out of 179,700 totalgene pairs. Thirty eight of the truly differentially correlatedgene pairs had a strong difference (1) in correlation coeffi-cient between conditions, while 76 had a medium differ-ence (0.5) in correlation coefficient between conditions.The accuracy of DGCA increased as the number of simu-lated gene expression samples in each condition increased(Fig. 4a-d). DGCA also demonstrated significantly higheraccuracy under these simulation conditions than Discord-ant with and without use of the Fisher z-transformationfor n = 30, 50, 70, 90, and 100 samples (two-sided Stu-dent’s t-test, p-value < 0.0083), although the two packagesdid not significantly differ in accuracy at n = 10 samples(Fig. 4e). DGCA demonstrated significantly higher accur-acy in the simulation study than EBcoexpress at all of thesample sizes tested (Fig. 4e). Furthermore, DGCA wassubstantially faster than the other two methods (Table 1).At n = 30 samples, all three methods more accurately de-tected gene pairs with strong difference in correlation thangene pairs with medium difference in correlation, butthere were no major differences within methods betweencorrelation classes within the strong or medium groups(Fig. 5a-c). All the methods have similar power to detectgene pairs with strong differences in correlation at any ofthe sample sizes tested (Fig. 5d). For medium strengthgene pairs, DGCA does not significantly differ fromDiscordant at n = 10 and 30 in terms of accuracy, butoutperforms Discordant at n = 50, 70, 90, and 100, whileDGCA outperforms EBcoexpress at all sample sizes tested(Fig. 5e). Therefore, DGCA outperforms the twoestablished approaches, EBcoexpress and Discordant, inour simulation study.
Differential correlation of p53 targets in normal and p53-mutated breast cancer tumor samplesWe downloaded RNA-seq data of breast cancer sampleswith and without non-silent p53 DNA mutations fromTCGA (n = 590 non p53-mutated samples, n = 254 non-mutated samples), and corrected the data for knowncovariates. We chose this data set because the ability ofp53 to affect the expression of its downstream targets isknown to be altered following p53 mutation [53, 54].
McKenzie et al. BMC Systems Biology (2016) 10:106 Page 8 of 25
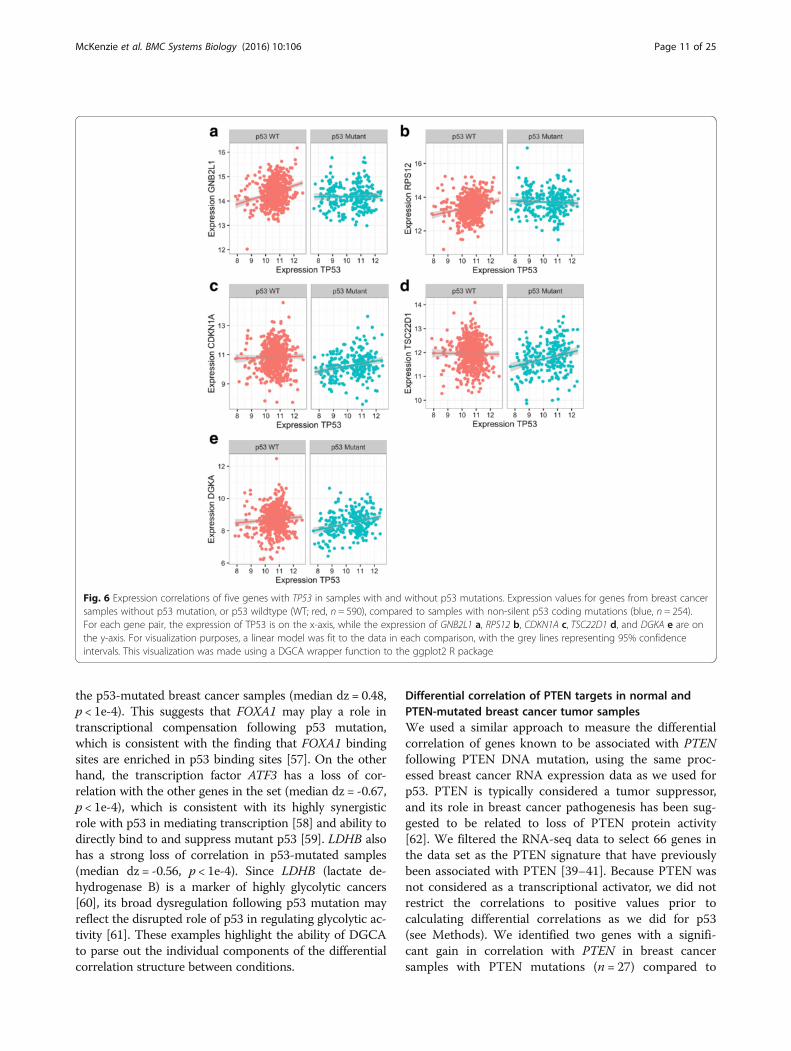
We filtered the RNA-seq data to select 295 genes in thedata set as the p53 signature that have previously been as-sociated with p53 [36–38]. Since p53 is known to be a tran-scriptional activator, we restricted our analysis to positivecorrelations with TP53 in the two groups (see Methods).We then quantified the significance of these differentialcorrelation relationships using permutation testing. Weidentified five genes that have a significant (q < 0.05; corre-sponding to nominal p-value 0.0098) change in correlationwith TP53 in the group of samples with p53 mutations(Fig. 6; Table 2; Additional file 2). Two of these are due to a
loss of correlation following p53 mutation (GNB2L1,RPS12), while three are due to a gain of correlation(TSC22D1, CDKN1A, DGKA). The gene with the strongestloss of correlation with TP53 is GNB2L1 (a.k.a. RACK1), aribosomal gene whose expression is strongly predictive ofbreast cancer outcome [55]. CDKN1A, a well-establishedtranscriptional target of p53 that encodes the protein p21,demonstrated an increased correlation with TP53 in thegroup of samples with p53 mutations, possibly reflectingcompensatory p53-independent transcriptional activationof CDKN1A [56].
Fig. 4 Comparing DGCA to alternatives in the differential correlation simulation study. a-d: Representative receiver operating characteristic (ROC)curves show the ability of DGCA, EBcoexpress, and Discordant with and without the use of the Fisher z-transformation (FT) to accurately detect trulydifferential correlated gene pairs at different simulated sample sizes in each condition, including n = 10 a, n = 30 b, n = 50 c, and n = 100 d. Black linesshow the ROC curves of DGCA, while blue lines show the ROC curves of EBcoexpress, red lines show Discordant without the Fisher transformation,and orange lines show Discordant with the Fisher transformation. e: Comparison of area under curve (AUC) statistics for 5 runs of the simulation studyusing each of the methods at different numbers of samples, where errors bars represent the standard error of the mean. Asterisks indicate aBonferroni-adjusted significant difference in the AUCs (p < 0.0083) between DGCA and each of the other methods, tested using a two-sided t-test
Table 1 Speed measurements for DGCA, Discordant, and EBcoexpress across in the simulation study
Number of SimulatedSamples
DGCA ExecutionTime (s)
DGCA (10 Perm.) ExecutionTime (s)
Discordant ExecutionTime (s)
EBcoexpress ExecutionTime (s)
10 2.4 +/- 0.2 18.2 +/- 0.2 259.1 +/- 33.1 2625.5 +/- 271.8
30 2.6 +/- 0.2 17.4 +/- 0.2 293.5 +/- 17.5 282.6 +/- 34
50 1.9 +/- 0.2 16 +/- 0.7 266.3 +/- 28.3 260.9 +/- 36.9
70 2 +/- 0.1 17.1 +/- 0.3 240.4 +/- 1.3 222.4 +/- 2
90 1.9 +/- 0.1 18.6 +/- 0.3 210.3 +/- 17.3 1983.9 +/- 126.2
100 2.1 +/- 0.2 15.9 +/- 0.7 246.8 +/- 34.5 2479.1 +/- 380.8
The time (in seconds) for each analysis tool to take an input gene expression data with 600 genes and the given number of samples and output a table ofdifferential correlation predictions for all 179,700 gene pairs. For DGCA, speed times both with and without 10 permutations (the default number of permutationsin DGCA) are shown. These numbers were calculated from 5 runs of the simulation study, representing the arithmetic mean +/- the standard error of the meanacross the simulations
McKenzie et al. BMC Systems Biology (2016) 10:106 Page 9 of 25

We further explored the relationship betweendifferential correlation and differential expression. Weperformed differential expression analysis on these genesusing the R package limma (Additional file 3). We thencalculated the Spearman correlation between themagnitude of differential expression (measured by thet-statistic) and the differences in positive correlationvalues with TP53 for all of the genes. Although thesetwo measures trended in the same direction, they hadno significant correlation between them (ρ = 0.08,p-value = 0.15; Fig. 7a). Because this lack of correspond-ence may have been influenced by our restriction todifferences in positive correlations, we also measuredthe correlation between differential expression anddifferential correlation with TP53 across all thecorrelations, and found no correlation in that case either(ρ = 0.06, p-value = 0.30; Fig. 7b). The lack of correlationcorroborates our theoretical claim that differential ex-pression and differential correlation are complementaryapproaches to identifying differences in gene expressionbetween conditions.To gain more insights into the overall change in
correlation structure in RNA expression matrices between
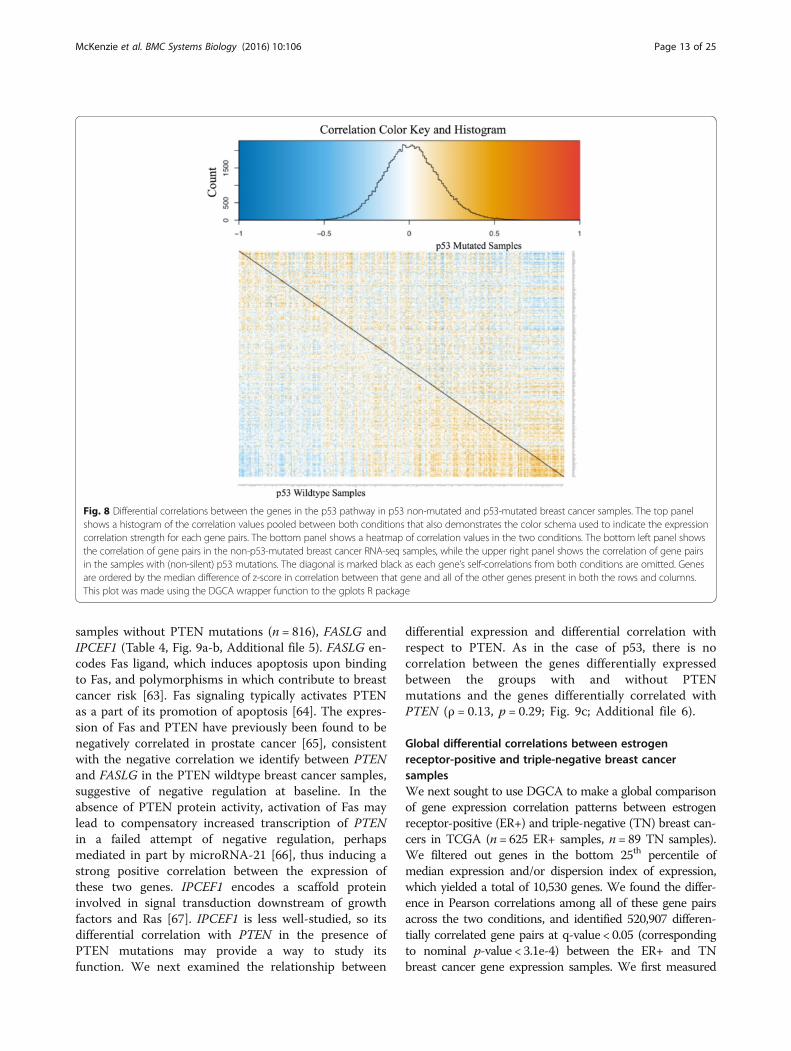
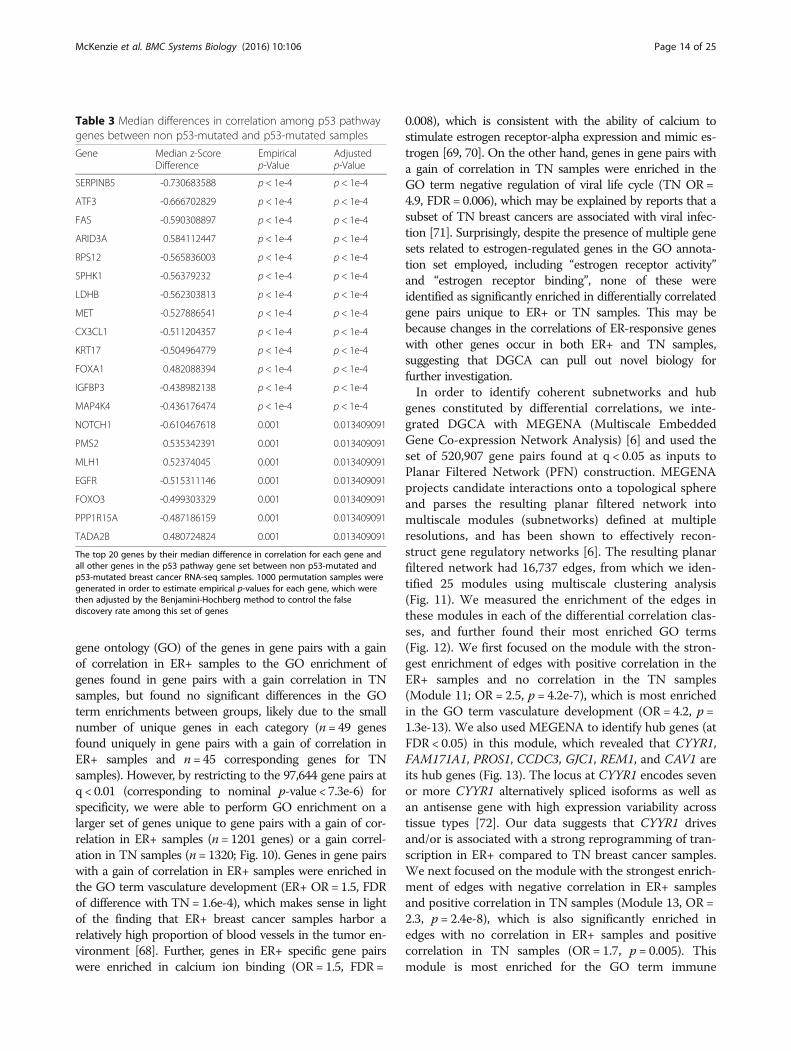
p53-mutated and p53-non-mutated breast cancer samples,we used DGCA to visualize the all gene pair correlationsin both conditions (Fig. 8). Genes in this heatmap areordered by their median z-score correlation differencewith all of the other genes in the filtered set between thetwo conditions, without the restriction to positive correla-tions. When we quantified the difference in correlationbetween all gene pairs using permutation testing, we iden-tified a global loss of correlation between p53-mutatedand p53-wildtype samples (median difference in z-score(dz) = -0.06, p = 0.007), suggesting that p53 mutationsdecrease the correlations among the p53 signature genes.Because visual inspection of the heatmap indicated that asubset of genes tended towards gain in correlation whileothers tended towards a loss in correlation, we usedpermutation testing to measure whether each gene’smedian change in correlation was more extreme than ex-pected, and adjusted the resulting empirical p-values formultiple hypothesis testing. Using this approach, we iden-tified genes with significant changes in median correlationin p53-mutated samples (Table 3; Additional file 4).Notably, the transcription factor FOXA1 has a gain incorrelation with the other genes in the p53 signature in
Fig. 5 Comparing DGCA to alternatives segregated by the strength of correlation difference. a-c: Representative receiver operating characteristic(ROC) curves show the ability of DGCA a, EBcoexpress b, and Discordant (with the use of the Fisher z-transformation) c to accurately detect trulydifferential correlated gene pairs in each of the six differential correlation classes that specify a difference in correlations between conditions, aswell as when comparing all gene pairs with a gain in correlation (GOC) or a loss of correlation (LOC) in one condition compared to the other, ata sample size of n = 30. d-e: Comparison of area under curve (AUC) statistics for 5 runs of the simulation study using each of the three methodsat different numbers of samples, where errors bars represent the standard error of the mean, segregated to only those gene pairs with a strongdifference in correlation (absolute value of difference in ρ = 1; d) or segregated to only those gene pairs with a medium strength difference incorrelation (absolute value of difference in ρ = 0.5; e). Asterisks indicate a Bonferroni-adjusted significant difference in the AUCs (p < 0.0083)between DGCA and each of the other methods, tested using a two-sided t-test
McKenzie et al. BMC Systems Biology (2016) 10:106 Page 10 of 25
the p53-mutated breast cancer samples (median dz = 0.48,p < 1e-4). This suggests that FOXA1 may play a role intranscriptional compensation following p53 mutation,which is consistent with the finding that FOXA1 bindingsites are enriched in p53 binding sites [57]. On the otherhand, the transcription factor ATF3 has a loss of cor-relation with the other genes in the set (median dz = -0.67,p < 1e-4), which is consistent with its highly synergisticrole with p53 in mediating transcription [58] and ability todirectly bind to and suppress mutant p53 [59]. LDHB alsohas a strong loss of correlation in p53-mutated samples(median dz = -0.56, p < 1e-4). Since LDHB (lactate de-hydrogenase B) is a marker of highly glycolytic cancers[60], its broad dysregulation following p53 mutation mayreflect the disrupted role of p53 in regulating glycolytic ac-tivity [61]. These examples highlight the ability of DGCAto parse out the individual components of the differentialcorrelation structure between conditions.
Differential correlation of PTEN targets in normal andPTEN-mutated breast cancer tumor samplesWe used a similar approach to measure the differentialcorrelation of genes known to be associated with PTENfollowing PTEN DNA mutation, using the same proc-essed breast cancer RNA expression data as we used forp53. PTEN is typically considered a tumor suppressor,and its role in breast cancer pathogenesis has been sug-gested to be related to loss of PTEN protein activity[62]. We filtered the RNA-seq data to select 66 genes inthe data set as the PTEN signature that have previouslybeen associated with PTEN [39–41]. Because PTEN wasnot considered as a transcriptional activator, we did notrestrict the correlations to positive values prior tocalculating differential correlations as we did for p53(see Methods). We identified two genes with a signifi-cant gain in correlation with PTEN in breast cancersamples with PTEN mutations (n = 27) compared to
Fig. 6 Expression correlations of five genes with TP53 in samples with and without p53 mutations. Expression values for genes from breast cancersamples without p53 mutation, or p53 wildtype (WT; red, n = 590), compared to samples with non-silent p53 coding mutations (blue, n = 254).For each gene pair, the expression of TP53 is on the x-axis, while the expression of GNB2L1 a, RPS12 b, CDKN1A c, TSC22D1 d, and DGKA e are onthe y-axis. For visualization purposes, a linear model was fit to the data in each comparison, with the grey lines representing 95% confidenceintervals. This visualization was made using a DGCA wrapper function to the ggplot2 R package
McKenzie et al. BMC Systems Biology (2016) 10:106 Page 11 of 25

Table 2 Differential correlations of genes with TP53 between non p53-mutated and p53-mutated samples
Gene p53 WT Cor. p53 Mut. Cor. z-score Empirical p-Value q-Value Classes
GNB2L1 0.257 0.01 -3.25 3.81E-05 0.008 +/0
RPS12 0.231 -0.002 -3.02 0.0001 0.009 +/0
TSC22D1 -0.027 0.227 2.97 0.0001 0.009 0/+
CDKN1A 0.019 0.227 2.73 0.0004 0.02 0/+
DGKA 0.057 0.252 2.58 0.0007 0.03 0/+
CARM1 0.172 -0.036 -2.24 0.0025 0.091 NonSig
DDB2 0.025 0.191 2.16 0.0033 0.094 NonSig
TNFRSF10B 0.194 0.034 -2.09 0.0043 0.094 NonSig
RPL18 0.158 -0.01 -2.05 0.0049 0.094 NonSig
ATF3 0.004 0.161 2.04 0.0051 0.094 NonSig
PYCARD 0.205 0.05 -2.04 0.0051 0.094 NonSig
TAX1BP3 0.305 0.156 -2.03 0.0052 0.094 NonSig
EI24 0.154 -0.007 -1.99 0.0059 0.097 NonSig
TNFRSF10C 0.179 0.03 -1.94 0.0069 0.097 NonSig
CCNG1 0.149 -0.092 -1.93 0.0072 0.097 NonSig
PML 0.016 0.163 1.92 0.0076 0.097 NonSig
CREBBP 0.153 0.006 -1.91 0.0077 0.097 NonSig
ABAT 0.145 -0.037 -1.88 0.0085 0.102 NonSig
NOL8 0.228 0.089 -1.85 0.0094 0.107 NonSig
The output of running DGCA on the p53 pathway gene set in the breast cancer RNA-seq samples, comparing correlations of these genes with TP53 in p53-wildtypesamples to correlations in p53-mutated samples, using the option to consider only positive correlations in calculating differential correlation between conditions. Thetop 20 gene pairs are shown here, while the rest are available in the Supplementary data. The “Classes” column indicates the correlation class of each of the gene pairswhere, e.g., “+/0” indicates a significant (q < 0.05) positive correlation in the p53-wildtype samples and no significant correlation in the p53-mutated samples. Note thatthe significance for the correlations within each condition is not adjusted for multiple comparisons. 10,000 permutation samples were generated in order to estimateempirical p-values, using a pooled reference distribution approach, from which q-values were calculatedWT Wildtype, Mut. Non-silent p53 mutation
Fig. 7 Comparing differential expression and differential correlation with TP53 in samples with and without p53 mutations. For each gene, we plotboth DGCA’s calculated differential correlation z-score between that gene and TP53 in p53 non-mutated breast cancer samples and p53-mutatedsamples (x-axis), as well as limma’s differential expression t statistic for that gene’s differential expression between the same p53 wildtype samples andp53-mutated samples (y-axis). When differential correlation z-scores are calculated on positive correlation values only a, the Spearman correlationbetween these two measures is not significant (ρ = 0.08, p-value = 0.15), and when differential correlation z-scores are calculated across all correlationvalues b, the Spearman correlation between these two measures is also not significant (ρ = 0.06, p-value = 0.30). The blue line represents a linear modelof the best fit, with the grey lines representing 95% confidence intervals, computed using ggplot2
McKenzie et al. BMC Systems Biology (2016) 10:106 Page 12 of 25
samples without PTEN mutations (n = 816), FASLG andIPCEF1 (Table 4, Fig. 9a-b, Additional file 5). FASLG en-codes Fas ligand, which induces apoptosis upon bindingto Fas, and polymorphisms in which contribute to breastcancer risk [63]. Fas signaling typically activates PTENas a part of its promotion of apoptosis [64]. The expres-sion of Fas and PTEN have previously been found to benegatively correlated in prostate cancer [65], consistentwith the negative correlation we identify between PTENand FASLG in the PTEN wildtype breast cancer samples,suggestive of negative regulation at baseline. In theabsence of PTEN protein activity, activation of Fas maylead to compensatory increased transcription of PTENin a failed attempt of negative regulation, perhapsmediated in part by microRNA-21 [66], thus inducing astrong positive correlation between the expression ofthese two genes. IPCEF1 encodes a scaffold proteininvolved in signal transduction downstream of growthfactors and Ras [67]. IPCEF1 is less well-studied, so itsdifferential correlation with PTEN in the presence ofPTEN mutations may provide a way to study itsfunction. We next examined the relationship between
differential expression and differential correlation withrespect to PTEN. As in the case of p53, there is nocorrelation between the genes differentially expressedbetween the groups with and without PTENmutations and the genes differentially correlated withPTEN (ρ = 0.13, p = 0.29; Fig. 9c; Additional file 6).
Global differential correlations between estrogenreceptor-positive and triple-negative breast cancersamplesWe next sought to use DGCA to make a global comparisonof gene expression correlation patterns between estrogenreceptor-positive (ER+) and triple-negative (TN) breast can-cers in TCGA (n = 625 ER+ samples, n = 89 TN samples).We filtered out genes in the bottom 25th percentile ofmedian expression and/or dispersion index of expression,which yielded a total of 10,530 genes. We found the differ-ence in Pearson correlations among all of these gene pairsacross the two conditions, and identified 520,907 differen-tially correlated gene pairs at q-value < 0.05 (correspondingto nominal p-value < 3.1e-4) between the ER+ and TNbreast cancer gene expression samples. We first measured
Fig. 8 Differential correlations between the genes in the p53 pathway in p53 non-mutated and p53-mutated breast cancer samples. The top panelshows a histogram of the correlation values pooled between both conditions that also demonstrates the color schema used to indicate the expressioncorrelation strength for each gene pairs. The bottom panel shows a heatmap of correlation values in the two conditions. The bottom left panel showsthe correlation of gene pairs in the non-p53-mutated breast cancer RNA-seq samples, while the upper right panel shows the correlation of gene pairsin the samples with (non-silent) p53 mutations. The diagonal is marked black as each gene’s self-correlations from both conditions are omitted. Genesare ordered by the median difference of z-score in correlation between that gene and all of the other genes present in both the rows and columns.This plot was made using the DGCA wrapper function to the gplots R package
McKenzie et al. BMC Systems Biology (2016) 10:106 Page 13 of 25
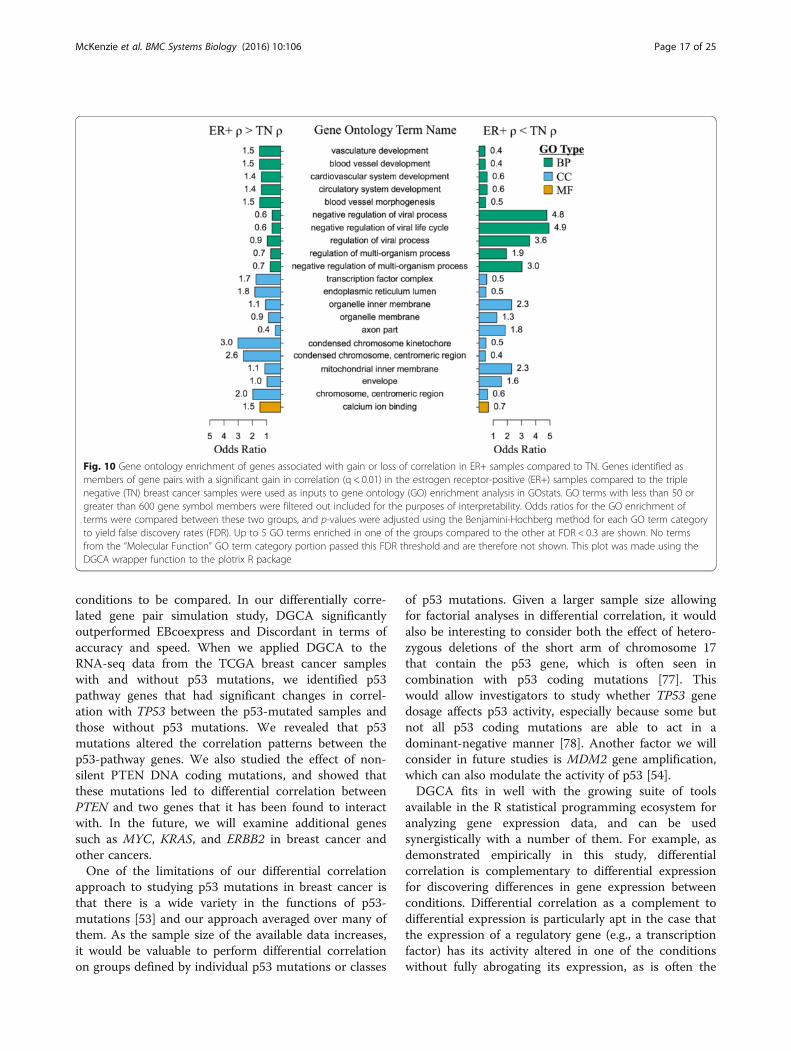
gene ontology (GO) of the genes in gene pairs with a gainof correlation in ER+ samples to the GO enrichment ofgenes found in gene pairs with a gain correlation in TNsamples, but found no significant differences in the GOterm enrichments between groups, likely due to the smallnumber of unique genes in each category (n = 49 genesfound uniquely in gene pairs with a gain of correlation inER+ samples and n = 45 corresponding genes for TNsamples). However, by restricting to the 97,644 gene pairs atq < 0.01 (corresponding to nominal p-value < 7.3e-6) forspecificity, we were able to perform GO enrichment on alarger set of genes unique to gene pairs with a gain of cor-relation in ER+ samples (n = 1201 genes) or a gain correl-ation in TN samples (n = 1320; Fig. 10). Genes in gene pairswith a gain of correlation in ER+ samples were enriched inthe GO term vasculature development (ER+ OR= 1.5, FDRof difference with TN= 1.6e-4), which makes sense in lightof the finding that ER+ breast cancer samples harbor arelatively high proportion of blood vessels in the tumor en-vironment [68]. Further, genes in ER+ specific gene pairswere enriched in calcium ion binding (OR= 1.5, FDR =
0.008), which is consistent with the ability of calcium tostimulate estrogen receptor-alpha expression and mimic es-trogen [69, 70]. On the other hand, genes in gene pairs witha gain of correlation in TN samples were enriched in theGO term negative regulation of viral life cycle (TN OR=4.9, FDR = 0.006), which may be explained by reports that asubset of TN breast cancers are associated with viral infec-tion [71]. Surprisingly, despite the presence of multiple genesets related to estrogen-regulated genes in the GO annota-tion set employed, including “estrogen receptor activity”and “estrogen receptor binding”, none of these wereidentified as significantly enriched in differentially correlatedgene pairs unique to ER+ or TN samples. This may bebecause changes in the correlations of ER-responsive geneswith other genes occur in both ER+ and TN samples,suggesting that DGCA can pull out novel biology forfurther investigation.In order to identify coherent subnetworks and hub
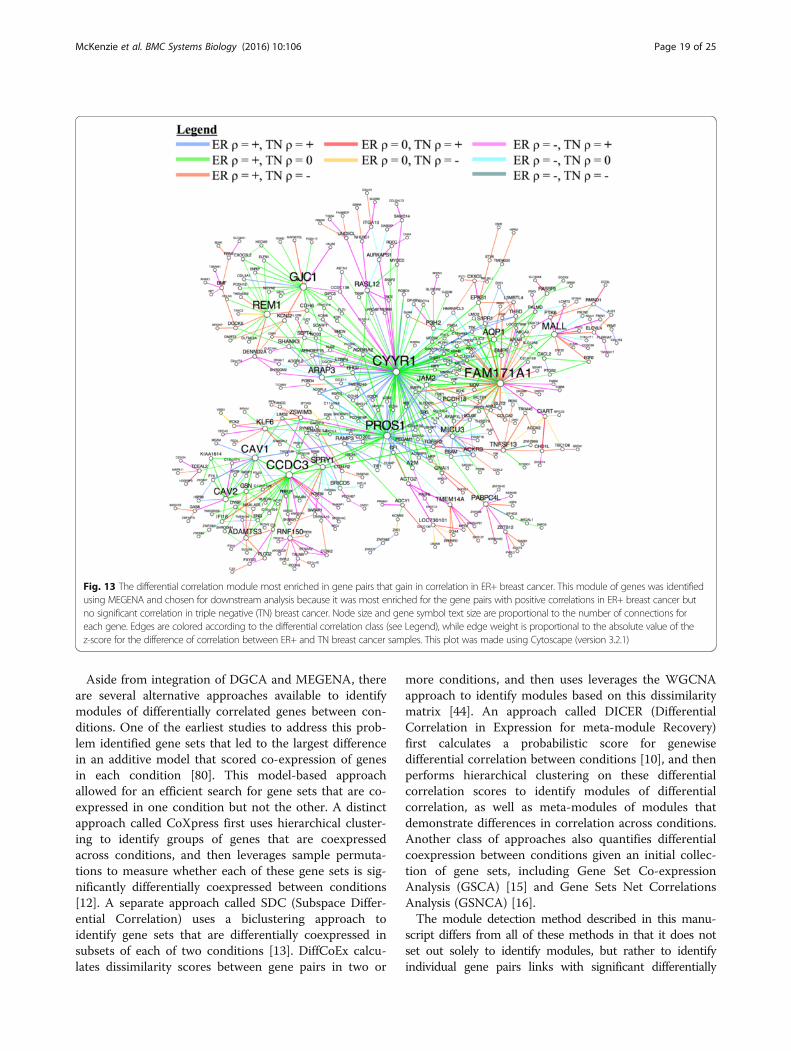
genes constituted by differential correlations, we inte-grated DGCA with MEGENA (Multiscale EmbeddedGene Co-expression Network Analysis) [6] and used theset of 520,907 gene pairs found at q < 0.05 as inputs toPlanar Filtered Network (PFN) construction. MEGENAprojects candidate interactions onto a topological sphereand parses the resulting planar filtered network intomultiscale modules (subnetworks) defined at multipleresolutions, and has been shown to effectively recon-struct gene regulatory networks [6]. The resulting planarfiltered network had 16,737 edges, from which we iden-tified 25 modules using multiscale clustering analysis(Fig. 11). We measured the enrichment of the edges inthese modules in each of the differential correlation clas-ses, and further found their most enriched GO terms(Fig. 12). We first focused on the module with the stron-gest enrichment of edges with positive correlation in theER+ samples and no correlation in the TN samples(Module 11; OR = 2.5, p = 4.2e-7), which is most enrichedin the GO term vasculature development (OR = 4.2, p =1.3e-13). We also used MEGENA to identify hub genes (atFDR < 0.05) in this module, which revealed that CYYR1,FAM171A1, PROS1, CCDC3, GJC1, REM1, and CAV1 areits hub genes (Fig. 13). The locus at CYYR1 encodes sevenor more CYYR1 alternatively spliced isoforms as well asan antisense gene with high expression variability acrosstissue types [72]. Our data suggests that CYYR1 drivesand/or is associated with a strong reprogramming of tran-scription in ER+ compared to TN breast cancer samples.We next focused on the module with the strongest enrich-ment of edges with negative correlation in ER+ samplesand positive correlation in TN samples (Module 13, OR =2.3, p = 2.4e-8), which is also significantly enriched inedges with no correlation in ER+ samples and positivecorrelation in TN samples (OR = 1.7, p = 0.005). Thismodule is most enriched for the GO term immune
Table 3 Median differences in correlation among p53 pathwaygenes between non p53-mutated and p53-mutated samples
Gene Median z-ScoreDifference
Empiricalp-Value
Adjustedp-Value
SERPINB5 -0.730683588 p < 1e-4 p < 1e-4
ATF3 -0.666702829 p < 1e-4 p < 1e-4
FAS -0.590308897 p < 1e-4 p < 1e-4
ARID3A 0.584112447 p < 1e-4 p < 1e-4
RPS12 -0.565836003 p < 1e-4 p < 1e-4
SPHK1 -0.56379232 p < 1e-4 p < 1e-4
LDHB -0.562303813 p < 1e-4 p < 1e-4
MET -0.527886541 p < 1e-4 p < 1e-4
CX3CL1 -0.511204357 p < 1e-4 p < 1e-4
KRT17 -0.504964779 p < 1e-4 p < 1e-4
FOXA1 0.482088394 p < 1e-4 p < 1e-4
IGFBP3 -0.438982138 p < 1e-4 p < 1e-4
MAP4K4 -0.436176474 p < 1e-4 p < 1e-4
NOTCH1 -0.610467618 0.001 0.013409091
PMS2 0.535342391 0.001 0.013409091
MLH1 0.52374045 0.001 0.013409091
EGFR -0.515311146 0.001 0.013409091
FOXO3 -0.499303329 0.001 0.013409091
PPP1R15A -0.487186159 0.001 0.013409091
TADA2B 0.480724824 0.001 0.013409091
The top 20 genes by their median difference in correlation for each gene andall other genes in the p53 pathway gene set between non p53-mutated andp53-mutated breast cancer RNA-seq samples. 1000 permutation samples weregenerated in order to estimate empirical p-values for each gene, which werethen adjusted by the Benjamini-Hochberg method to control the falsediscovery rate among this set of genes
McKenzie et al. BMC Systems Biology (2016) 10:106 Page 14 of 25

response (OR = 4.6, p = 7.9e-17), consistent with reportsof the relatively strong role of the immune system in me-diating TNBC [73–75]. The hub genes identified in thisnetwork are NAGS, JADE2, DRAM1, PTGER2, andPROB1 (Fig. 14). Notably, the protein product of JADE2has been found to act as a ubiquitin-ligase to regulate theactivity of the histone demethylase LSD1 in neuronal dif-ferentiation [76], suggesting that it may play a role in shift-ing the immune-related epigenetic landscape in TNBCsamples. Interactive figures for these two differential cor-relation networks are available online (see “Availabilityand requirements”).
Evaluation of differential correlation module detectionapproachesTo evaluate the performance of DGCA/MEGENA indetecting differential correlations, we first compared itwith two established methods, DiffCoEx [44] and DICER[10], using a simulation study. In this simulation, we de-signed two differential correlation modules of 30 geneseach, out of a total of 600 genes. In each module, a fractionof gene pairs (ranging from κ = 0.5 to 1) have significantpositive correlations in one condition but no significantcorrelation in the other. For each of the true modules
across various numbers of simulated samples (n = 100 to400), we identified the top sensitivity and Jaccard index sta-tistics of the modules detected by each method and thencompared them (Fig. 15). DGCA/MEGENA identifiedmodules with significantly higher sensitivity and Jaccard in-dices than DiffCoEx and DICER in all the simulation con-ditions that have κ < 1 (t-tests, all unadjusted p-values <0.05), with the exception of the Jaccard index comparisonwith DICER at κ = 0.9, n = 400 samples (p = 0.25). In theextreme condition where all the gene pairs are differentiallycorrelated (κ = 1), DiffCoEx identifies modules with higherJaccard indices (p-values < 0.05) but not higher sensitivitiesthan DGCA/MEGENA at all sample sizes, while DICERidentifies modules with higher sensitivities and Jaccard in-dices than both methods at n = 200, 300, and 400 (t-tests,all unadjusted p-values < 0.05). However, even under theextreme and limited condition of κ = 1, the practicalperformance difference between DGCA/MEGENA andthe other two methods is very small. In contrast, DiffCoExand DICER usually fail to identify the differentially corre-lated modules under the more general conditions (κ < 0.9).In summary, DGCA/MEGENA demonstrated the best per-formance in detecting differential correlation modulesunder the more general simulation conditions.
Table 4 Differential correlations of genes with PTEN between non PTEN-mutated and PTEN-mutated samples
Gene PTEN WT Cor. PTEN Mut. Cor. z-score Empirical p-Value q-Value Classes
FASLG -0.076 0.628 3.816 0.0003 0.015 -/+
IPCEF1 -0.012 0.627 3.511 0.0008 0.021 0/+
PIK3CD 0.015 0.52 2.63 0.01 0.169 NonSig
FBXW7 0.0001 0.433 2.177 0.031 0.381 NonSig
STUB1 -0.075 -0.473 -2.06 0.041 0.381 NonSig
WWP2 -0.107 -0.482 -1.965 0.051 0.381 NonSig
MAPK3 0.013 -0.379 -1.934 0.054 0.381 NonSig
AKT1 0.077 -0.28 -1.71 0.087 0.492 NonSig
BCAR1 -0.025 -0.369 -1.696 0.09 0.492 NonSig
NCOA3 -0.055 0.272 1.566 0.116 0.573 NonSig
PARK7 -0.001 -0.301 -1.453 0.144 0.587 NonSig
CBL 0.069 0.36 1.444 0.147 0.587 NonSig
MVP 0.215 -0.082 -1.414 0.155 0.587 NonSig
SOS1 0.022 0.299 1.343 0.176 0.62 NonSig
ANAPC5 -0.068 0.195 1.246 0.209 0.65 NonSig
PIK3R1 0.309 0.065 -1.193 0.229 0.65 NonSig
RBL2 0.109 0.338 1.139 0.251 0.65 NonSig
CDC27 0.002 0.239 1.131 0.254 0.65 NonSig
SLC9A3R1 -0.065 -0.267 -0.975 0.323 0.65 NonSig
The output of running DGCA on the PTEN pathway gene set in the breast cancer RNA-seq samples, comparing correlations of these genes with PTEN in PTEN-wildtypesamples to correlations in PTEN-mutated samples. The top 20 gene pairs are shown here, while the rest are available in the Supplementary data. The “Classes” columnindicates the correlation class of each of the gene pairs. Note that the significance for the correlations within each condition is not adjusted for multiple comparisons.10,000 permutation samples were generated in order to estimate empirical p-values, using a pooled reference distribution approach, from which q-valueswere calculatedWT Wildtype, Mut. Non-silent PTEN mutation
McKenzie et al. BMC Systems Biology (2016) 10:106 Page 15 of 25

We next examined whether the differential correlationmodules identified by DGCA/MEGENA on the ER+ andTN breast cancer RNA expression differed from thoseidentified by DiffCoEx [44] and DICER [10] (Additionalfile 7). Although these alternative methods do notautomatically specify gene-gene links or identify hubgenes, they do also identify differentially correlated genemodules. We first counted the number of modules iden-tified by each method that were significantly enriched(FDR < 0.3) in five gene sets chosen because of theirimportance in breast cancer (Fig. 16a; Additional file 1).We found that DGCA/MEGENA identified the mostmodules significantly enriched in genes associated withER+ breast cancer and estrogen receptor (ER) signaling,while DGCA/MEGENA and DICER tied in the numberof modules significantly enriched in TNBC genes, andDICER identified the most modules significantlyenriched in the KEGG terms Cell Cycle and MismatchRepair. We then identified the modules unique to eachmethod. We found the proportion of modules for each
method that were not significantly enriched in any ofthe modules by one (off-diagonals, by column) or either(diagonals) of the other methods (Fig. 16b). DGCA/MEGENA identified a higher proportion of unique mod-ules compared both pairwise and globally to the existingmethods DiffCoEx and DICER.
DiscussionThe R package DGCA developed by this study is apowerful new tool for querying the regulatory relation-ship of gene pairs under different conditions. DGCA isapplicable to a wide range of input data types, includingmicroarray data, tissue-level or single-cell RNA-seq data,proteomic data, methylation data, and metabolomicdata. In general, DGCA can be used to compare the cor-relations between features from both continuous- andcount-based data types. Users input a gene expressionmatrix with gene identifiers in rows and samples in col-umns, a design matrix specifying which samples corres-pond to which conditions, and a vector specifying the
Fig. 9 Summary of differential correlation results of PTEN in samples with and without PTEN mutations. a-b: Expression values for genes from breastcancer samples without PTEN mutation, or PTEN wildtype (WT; red, n = 816), compared to samples with non-silent PTEN mutations (blue, n = 27). Foreach gene pair, the expression of PTEN is on the x-axis, while the expression of FASLG a and IPCEF1 b are on the y-axis. For visualization purposes, alinear model was fit to the data in each comparison, with the grey lines representing 95% confidence intervals. c: For each gene, we plot both DGCA’scalculated differential correlation z-score between that gene and PTEN in PTEN non-mutated breast cancer samples and PTEN-mutated samples (x-axis),as well as limma’s differential expression t statistic for that gene’s differential expression between the same PTEN non-mutated samples and PTEN-mutated samples (y-axis). The correlation between the two measures is not significant (ρ = 0.13, p = 0.29). The blue line represents a linear model ofthe best fit, with the grey lines representing 95% confidence intervals
McKenzie et al. BMC Systems Biology (2016) 10:106 Page 16 of 25
conditions to be compared. In our differentially corre-lated gene pair simulation study, DGCA significantlyoutperformed EBcoexpress and Discordant in terms ofaccuracy and speed. When we applied DGCA to theRNA-seq data from the TCGA breast cancer sampleswith and without p53 mutations, we identified p53pathway genes that had significant changes in correl-ation with TP53 between the p53-mutated samples andthose without p53 mutations. We revealed that p53mutations altered the correlation patterns between thep53-pathway genes. We also studied the effect of non-silent PTEN DNA coding mutations, and showed thatthese mutations led to differential correlation betweenPTEN and two genes that it has been found to interactwith. In the future, we will examine additional genessuch as MYC, KRAS, and ERBB2 in breast cancer andother cancers.One of the limitations of our differential correlation
approach to studying p53 mutations in breast cancer isthat there is a wide variety in the functions of p53-mutations [53] and our approach averaged over many ofthem. As the sample size of the available data increases,it would be valuable to perform differential correlationon groups defined by individual p53 mutations or classes
of p53 mutations. Given a larger sample size allowingfor factorial analyses in differential correlation, it wouldalso be interesting to consider both the effect of hetero-zygous deletions of the short arm of chromosome 17that contain the p53 gene, which is often seen incombination with p53 coding mutations [77]. Thiswould allow investigators to study whether TP53 genedosage affects p53 activity, especially because some butnot all p53 coding mutations are able to act in adominant-negative manner [78]. Another factor we willconsider in future studies is MDM2 gene amplification,which can also modulate the activity of p53 [54].DGCA fits in well with the growing suite of tools
available in the R statistical programming ecosystem foranalyzing gene expression data, and can be usedsynergistically with a number of them. For example, asdemonstrated empirically in this study, differentialcorrelation is complementary to differential expressionfor discovering differences in gene expression betweenconditions. Differential correlation as a complement todifferential expression is particularly apt in the case thatthe expression of a regulatory gene (e.g., a transcriptionfactor) has its activity altered in one of the conditionswithout fully abrogating its expression, as is often the
Fig. 10 Gene ontology enrichment of genes associated with gain or loss of correlation in ER+ samples compared to TN. Genes identified asmembers of gene pairs with a significant gain in correlation (q < 0.01) in the estrogen receptor-positive (ER+) samples compared to the triplenegative (TN) breast cancer samples were used as inputs to gene ontology (GO) enrichment analysis in GOstats. GO terms with less than 50 orgreater than 600 gene symbol members were filtered out included for the purposes of interpretability. Odds ratios for the GO enrichment ofterms were compared between these two groups, and p-values were adjusted using the Benjamini-Hochberg method for each GO term categoryto yield false discovery rates (FDR). Up to 5 GO terms enriched in one of the groups compared to the other at FDR < 0.3 are shown. No termsfrom the “Molecular Function” GO term category portion passed this FDR threshold and are therefore not shown. This plot was made using theDGCA wrapper function to the plotrix R package
McKenzie et al. BMC Systems Biology (2016) 10:106 Page 17 of 25

case for DNA mutations in tumor cells. However, differ-ential correlation can be applied more broadly as well;for example, in discovering differences in the pathwaysthat genes participate in between tissues and cell types.Differential correlation is also complementary to moduledetection approaches, such as MEGENA, as was shownin this manuscript through a comparison of estrogenreceptor-positive breast cancer to triple-negative breastcancer. By using the finely-grained DGCA method, ourapproach was able to identify individual differential cor-relations between key gene pairs, and use them to create“bottom-up” differential correlation network modules.Further, differential correlation of individual gene pairsworks particularly well downstream of higher-level mod-ule detection approaches, such as WGCNA, to perform“top-down” identification of modules with significantdifferential correlation. This is because parsing up theinput gene expression matrix into smaller sets is oftencritical in order to make sense of the millions or evenbillions of gene pair combinations that can be analyzedin a typical RNA expression data set. In order to addfurther to the R programming gene expression analysissuite, future directions for improving DGCA includedetection of linear changes in correlation across morethan two conditions and integration with differentialexpression to define genes with differential wiring acrossconditions [79].
Fig. 12 Enrichment of GO terms and differential correlation classes in the multiscale modules. This plot displays the enrichments of each of themultiscale modules (whose sizes are between 100 and 800 members) in the ER+ vs TN differential correlation network. The left panel shows theenrichment (Benjamini-Hochberg adjusted -log10 p-value) of edges in each of the differential correlation (DC) classes in each of the modules. Theright panel shows the most significantly enriched gene ontology (GO) term (-Benjamini-Hochberg adjusted log10 p-value) for the genes in eachof the corresponding modules, along with the GO enrichment of that same GO term in all the other modules. This plot was made using a DGCAwrapper function to R package ggplot2
Fig. 11 Planar filtered network of differentially correlated genes.Gene pairs with a significant change in correlation (q < 0.05) inestrogen receptor-positive (ER+) compared to triple negative (TN)breast cancer samples were to construct a planar filtered networkshown here. The modules identified at p < 0.05 in this network withbetween 100 and 800 members are identified with distinct colors.This plot was made using Cytoscape (version 3.2.1)
McKenzie et al. BMC Systems Biology (2016) 10:106 Page 18 of 25
Aside from integration of DGCA and MEGENA, thereare several alternative approaches available to identifymodules of differentially correlated genes between con-ditions. One of the earliest studies to address this prob-lem identified gene sets that led to the largest differencein an additive model that scored co-expression of genesin each condition [80]. This model-based approachallowed for an efficient search for gene sets that are co-expressed in one condition but not the other. A distinctapproach called CoXpress first uses hierarchical cluster-ing to identify groups of genes that are coexpressedacross conditions, and then leverages sample permuta-tions to measure whether each of these gene sets is sig-nificantly differentially coexpressed between conditions[12]. A separate approach called SDC (Subspace Differ-ential Correlation) uses a biclustering approach toidentify gene sets that are differentially coexpressed insubsets of each of two conditions [13]. DiffCoEx calcu-lates dissimilarity scores between gene pairs in two or
more conditions, and then uses leverages the WGCNAapproach to identify modules based on this dissimilaritymatrix [44]. An approach called DICER (DifferentialCorrelation in Expression for meta-module Recovery)first calculates a probabilistic score for genewisedifferential correlation between conditions [10], and thenperforms hierarchical clustering on these differentialcorrelation scores to identify modules of differentialcorrelation, as well as meta-modules of modules thatdemonstrate differences in correlation across conditions.Another class of approaches also quantifies differentialcoexpression between conditions given an initial collec-tion of gene sets, including Gene Set Co-expressionAnalysis (GSCA) [15] and Gene Sets Net CorrelationsAnalysis (GSNCA) [16].The module detection method described in this manu-
script differs from all of these methods in that it does notset out solely to identify modules, but rather to identifyindividual gene pairs links with significant differentially
Fig. 13 The differential correlation module most enriched in gene pairs that gain in correlation in ER+ breast cancer. This module of genes was identifiedusing MEGENA and chosen for downstream analysis because it was most enriched for the gene pairs with positive correlations in ER+ breast cancer butno significant correlation in triple negative (TN) breast cancer. Node size and gene symbol text size are proportional to the number of connections foreach gene. Edges are colored according to the differential correlation class (see Legend), while edge weight is proportional to the absolute value of thez-score for the difference of correlation between ER+ and TN breast cancer samples. This plot was made using Cytoscape (version 3.2.1)
McKenzie et al. BMC Systems Biology (2016) 10:106 Page 19 of 25

correlations between conditions. Using this empiricallyidentified set gene pairs, we demonstrated how integrationwith MEGENA, which has been previously shown to out-perform alternatives in co-expression network construction[6], can be used to construct a planar filtered network andidentify informative modules. This integration allows forvisualization of the individual differential correlation linksand their differential correlation classes, as well as the iden-tification of hub genes within each module, which to thebest of our knowledge none of the existing methods offer.Notably, DGCA is also complementary with several of thepreviously described approaches, since DGCA offers func-tions to calculate the average correlation difference acrossconditions within a module of genes, both averaging acrossall genes in the module and averaging across one genecompared to all other genes in the module.
We further sought to comprehensively assess theperformance of the differential correlation modulesidentified by DGCA/MEGENA in comparison with thetwo most similar methods, DiffCoEx and DICER. First,in our simulation study for detecting differentiallycorrelated modules, DGCA/MEGENA consistently out-performed DiffCoEx and DICER under the more generalsimulation settings, whereas DGCA/MEGENA has com-parable performance with DiffCoEx and DICER underthe more extreme circumstance in which a vast majorityof gene pairs are differentially correlated. This resultmakes sense in light of the fact that DGCA/MEGENAadopts a “bottom-up” approach by first identifyingdifferentially correlated gene pairs and then detectingmodular structures, whereas DiffCoEx and DICERemploy a “top-down” approach that relies more heavily
Fig. 14 The differential correlation module most enriched for the gene pairs that gain correlation in TN breast cancer. This module of genes wasidentified using MEGENA and chosen for downstream analysis because it was most enriched for the gene pairs that were positively correlated inTN breast cancer but were either negatively or not significantly correlated in ER+ breast cancer. Node size and gene symbol text size areproportional to the number of connections for each gene. Edges are colored according to the differential correlation class (see Legend), whileedge weight is proportional to the absolute value of the z-score for the difference of correlation for that gene pair between ER+ and TN breastcancer samples. This plot was made using Cytoscape (version 3.2.1)
McKenzie et al. BMC Systems Biology (2016) 10:106 Page 20 of 25
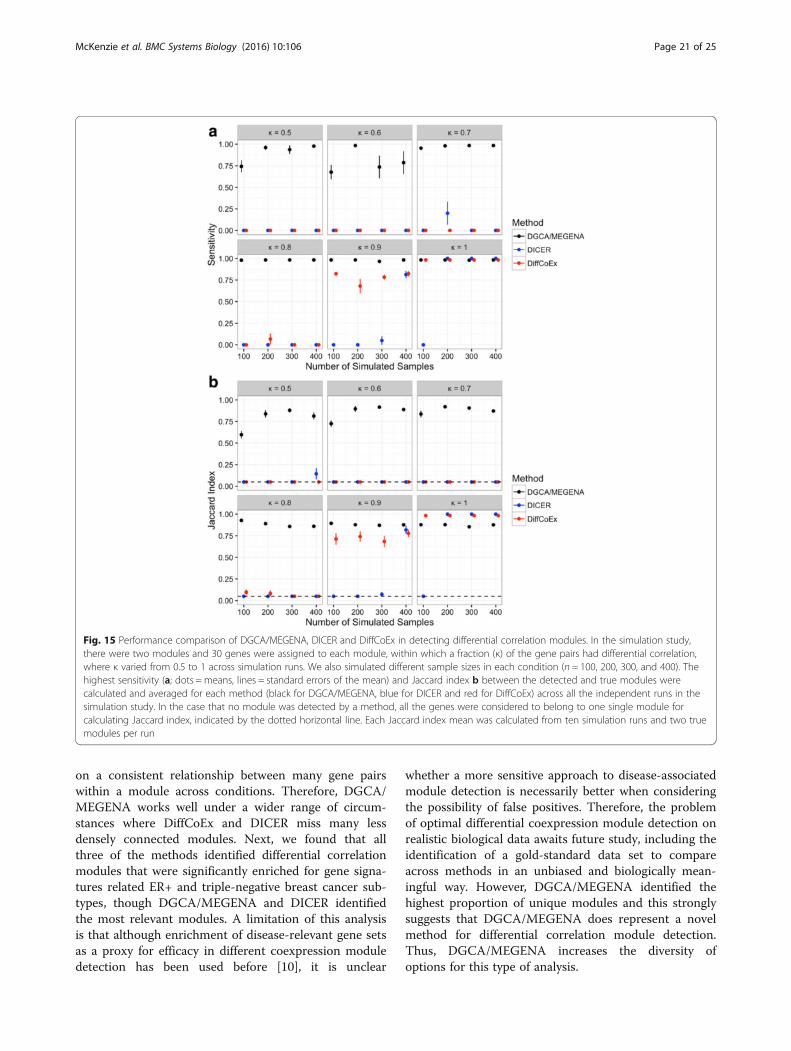
on a consistent relationship between many gene pairswithin a module across conditions. Therefore, DGCA/MEGENA works well under a wider range of circum-stances where DiffCoEx and DICER miss many lessdensely connected modules. Next, we found that allthree of the methods identified differential correlationmodules that were significantly enriched for gene signa-tures related ER+ and triple-negative breast cancer sub-types, though DGCA/MEGENA and DICER identifiedthe most relevant modules. A limitation of this analysisis that although enrichment of disease-relevant gene setsas a proxy for efficacy in different coexpression moduledetection has been used before [10], it is unclear
whether a more sensitive approach to disease-associatedmodule detection is necessarily better when consideringthe possibility of false positives. Therefore, the problemof optimal differential coexpression module detection onrealistic biological data awaits future study, including theidentification of a gold-standard data set to compareacross methods in an unbiased and biologically mean-ingful way. However, DGCA/MEGENA identified thehighest proportion of unique modules and this stronglysuggests that DGCA/MEGENA does represent a novelmethod for differential correlation module detection.Thus, DGCA/MEGENA increases the diversity ofoptions for this type of analysis.
Fig. 15 Performance comparison of DGCA/MEGENA, DICER and DiffCoEx in detecting differential correlation modules. In the simulation study,there were two modules and 30 genes were assigned to each module, within which a fraction (κ) of the gene pairs had differential correlation,where κ varied from 0.5 to 1 across simulation runs. We also simulated different sample sizes in each condition (n = 100, 200, 300, and 400). Thehighest sensitivity (a; dots = means, lines = standard errors of the mean) and Jaccard index b between the detected and true modules werecalculated and averaged for each method (black for DGCA/MEGENA, blue for DICER and red for DiffCoEx) across all the independent runs in thesimulation study. In the case that no module was detected by a method, all the genes were considered to belong to one single module forcalculating Jaccard index, indicated by the dotted horizontal line. Each Jaccard index mean was calculated from ten simulation runs and two truemodules per run
McKenzie et al. BMC Systems Biology (2016) 10:106 Page 21 of 25

As an important aspect of DGCA is the use of permuta-tion samples to assess the statistical significance of differen-tial correlations, we offer some guidelines for the use of thisapproach. It is important to distinguish between permuta-tion analyses that use pooled empirical null distributions asopposed to analyses that use empirical null distributionsfrom each gene or gene pair [81]. For pooled approaches,
fewer permutations are needed because information isshared across gene pairs; for example, given a 10,000 genedata set and five permutations, the differential correlation ofeach actual gene pair is compared to 249,975,000 permutedgene pairs in order to estimate empirical null p-values. How-ever, this vastly increases the memory footprint required forempirical p-value calculation and q-value estimation. Per-haps as a result, some investigators have used only one per-mutation of the data in such analyses [9]. If these memoryconstraints limit the number of permutations possible, wesuggest that a reasonable approach is to repeat the analysis.For example, we repeated the ER+ vs TN breast cancer dif-ferential correlation analysis three times and found that thenumber of significantly identified differentially correlatedgene pairs at both q < 0.05 and q < 0.01 were within accept-able limits (within 30% of one another) for the purpose ofdownstream analyses on gene sets. Although the above rea-soning applies to cases with many gene pairs, heavy filteringof the input data and/or differential correlation calculationsof only one gene compared to all others leads to far fewerempirical null statistics. For example, five permutations ofthe 295 gene pairs for the p53 differential correlation ana-lysis would lead to only 1475 permuted gene pairs for use inestimating empirical null p-values, which is why we usedmore permutations (10,000) in this case. Non-pooled ap-proaches are commonly used on the data sets with reduceddimensionality, such as the module level, or in our case, inthe comparison of the average correlation of each genecompared to all other genes in two conditions. Non-pooledpermutation approaches commonly use on the order of 100or 1000 permutations [82, 83], and we use 1000 permuta-tions to balance interpretability with computational effi-ciency. Notably, the number of permutations in non-pooledapproaches delineates a clear lower bound on the empiricalp-value that can be ascertained from the analysis. Overall,the number of permutations used in DGCA for pooled ref-erence distributions depends on the total number of empir-ical gene pairs under consideration, while for non-pooledreference distributions it depends on the desired sensitivityof the lower bound of empirical p-values.
ConclusionsDespite the theoretical advantages of studying differencesin the correlation of key gene pairs between conditions,differential coexpression or differential correlation is notyet widely utilized, partially due to the lack of effective andbiology-oriented software packages that enable biologicalmeaningful findings. Our R package, DGCA, provides acomprehensive and user-friendly tool for not only calculat-ing differential correlation between two conditions but alsoperforming a number of downstream functional analysesincluding categorization of differential correlations, identifi-cation of multiscale differential correlation clustering struc-tures, detection of key differential correlation hubs, and
Fig. 16 Comparison of modules detected with DGCA/MEGENA tothose detected with DiffCoEx and DICER. a: The number of modulessignificantly enriched (Fisher’s Exact Test; FDR < 0.3) that were detectedby each of DGCA/MEGENA (red), DiffCoEx (green), and DICER (blue) infive different gene sets selected for their relevance to breast cancer.b: The proportion of modules detected by each of the three methodsthat are not significantly enriched in (i.e., do not overlap with) any ofthe modules detected by one (off-diagonals) or both (diagonals) of theother methods, by Fisher’s Exact Test, Benjamini-Hochberg adjustedp-value < 0.05. Columns labels denote the reference method compared;e.g., 62% of DGCA/MEGENA-detected modules do not significantlyoverlap with modules detected by either method, and 78% of DGCA/MEGENA-detected modules do not significantly overlap with anyDICER-detected modules
McKenzie et al. BMC Systems Biology (2016) 10:106 Page 22 of 25
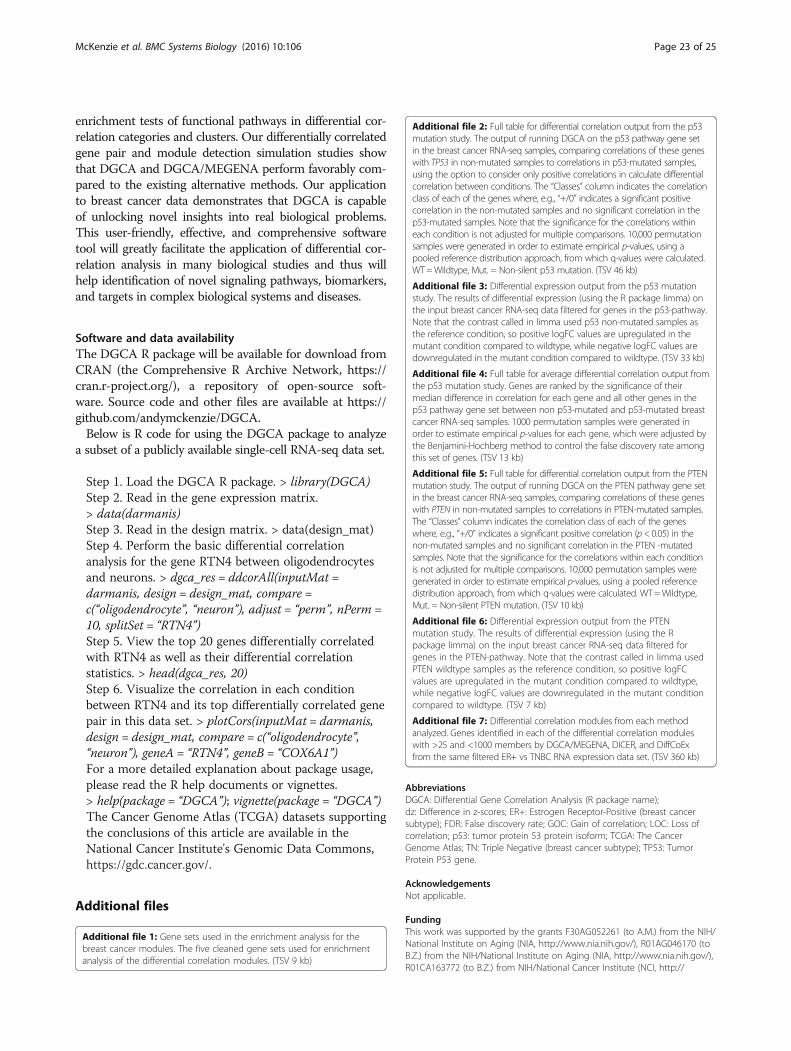
enrichment tests of functional pathways in differential cor-relation categories and clusters. Our differentially correlatedgene pair and module detection simulation studies showthat DGCA and DGCA/MEGENA perform favorably com-pared to the existing alternative methods. Our applicationto breast cancer data demonstrates that DGCA is capableof unlocking novel insights into real biological problems.This user-friendly, effective, and comprehensive softwaretool will greatly facilitate the application of differential cor-relation analysis in many biological studies and thus willhelp identification of novel signaling pathways, biomarkers,and targets in complex biological systems and diseases.
Software and data availabilityThe DGCA R package will be available for download fromCRAN (the Comprehensive R Archive Network, https://cran.r-project.org/), a repository of open-source soft-ware. Source code and other files are available at https://github.com/andymckenzie/DGCA.Below is R code for using the DGCA package to analyze
a subset of a publicly available single-cell RNA-seq data set.
Step 1. Load the DGCA R package. > library(DGCA)Step 2. Read in the gene expression matrix.> data(darmanis)Step 3. Read in the design matrix. > data(design_mat)Step 4. Perform the basic differential correlationanalysis for the gene RTN4 between oligodendrocytesand neurons. > dgca_res = ddcorAll(inputMat =darmanis, design = design_mat, compare =c(“oligodendrocyte”, “neuron”), adjust = “perm”, nPerm =10, splitSet = “RTN4”)Step 5. View the top 20 genes differentially correlatedwith RTN4 as well as their differential correlationstatistics. > head(dgca_res, 20)Step 6. Visualize the correlation in each conditionbetween RTN4 and its top differentially correlated genepair in this data set. > plotCors(inputMat = darmanis,design = design_mat, compare = c(“oligodendrocyte”,“neuron”), geneA = “RTN4”, geneB = “COX6A1”)For a more detailed explanation about package usage,please read the R help documents or vignettes.> help(package = “DGCA”); vignette(package = “DGCA”)The Cancer Genome Atlas (TCGA) datasets supportingthe conclusions of this article are available in theNational Cancer Institute's Genomic Data Commons,https://gdc.cancer.gov/.
Additional files
Additional file 1: Gene sets used in the enrichment analysis for thebreast cancer modules. The five cleaned gene sets used for enrichmentanalysis of the differential correlation modules. (TSV 9 kb)
Additional file 2: Full table for differential correlation output from the p53mutation study. The output of running DGCA on the p53 pathway gene setin the breast cancer RNA-seq samples, comparing correlations of these geneswith TP53 in non-mutated samples to correlations in p53-mutated samples,using the option to consider only positive correlations in calculate differentialcorrelation between conditions. The “Classes” column indicates the correlationclass of each of the genes where, e.g., “+/0” indicates a significant positivecorrelation in the non-mutated samples and no significant correlation in thep53-mutated samples. Note that the significance for the correlations withineach condition is not adjusted for multiple comparisons. 10,000 permutationsamples were generated in order to estimate empirical p-values, using apooled reference distribution approach, from which q-values were calculated.WT =Wildtype, Mut. = Non-silent p53 mutation. (TSV 46 kb)
Additional file 3: Differential expression output from the p53 mutationstudy. The results of differential expression (using the R package limma) onthe input breast cancer RNA-seq data filtered for genes in the p53-pathway.Note that the contrast called in limma used p53 non-mutated samples asthe reference condition, so positive logFC values are upregulated in themutant condition compared to wildtype, while negative logFC values aredownregulated in the mutant condition compared to wildtype. (TSV 33 kb)
Additional file 4: Full table for average differential correlation output fromthe p53 mutation study. Genes are ranked by the significance of theirmedian difference in correlation for each gene and all other genes in thep53 pathway gene set between non p53-mutated and p53-mutated breastcancer RNA-seq samples. 1000 permutation samples were generated inorder to estimate empirical p-values for each gene, which were adjusted bythe Benjamini-Hochberg method to control the false discovery rate amongthis set of genes. (TSV 13 kb)
Additional file 5: Full table for differential correlation output from the PTENmutation study. The output of running DGCA on the PTEN pathway gene setin the breast cancer RNA-seq samples, comparing correlations of these geneswith PTEN in non-mutated samples to correlations in PTEN-mutated samples.The “Classes” column indicates the correlation class of each of the geneswhere, e.g., “+/0” indicates a significant positive correlation (p< 0.05) in thenon-mutated samples and no significant correlation in the PTEN -mutatedsamples. Note that the significance for the correlations within each conditionis not adjusted for multiple comparisons. 10,000 permutation samples weregenerated in order to estimate empirical p-values, using a pooled referencedistribution approach, from which q-values were calculated. WT =Wildtype,Mut. = Non-silent PTEN mutation. (TSV 10 kb)
Additional file 6: Differential expression output from the PTENmutation study. The results of differential expression (using the Rpackage limma) on the input breast cancer RNA-seq data filtered forgenes in the PTEN-pathway. Note that the contrast called in limma usedPTEN wildtype samples as the reference condition, so positive logFCvalues are upregulated in the mutant condition compared to wildtype,while negative logFC values are downregulated in the mutant conditioncompared to wildtype. (TSV 7 kb)
Additional file 7: Differential correlation modules from each methodanalyzed. Genes identified in each of the differential correlation moduleswith >25 and <1000 members by DGCA/MEGENA, DICER, and DiffCoExfrom the same filtered ER+ vs TNBC RNA expression data set. (TSV 360 kb)
AbbreviationsDGCA: Differential Gene Correlation Analysis (R package name);dz: Difference in z-scores; ER+: Estrogen Receptor-Positive (breast cancersubtype); FDR: False discovery rate; GOC: Gain of correlation; LOC: Loss ofcorrelation; p53: tumor protein 53 protein isoform; TCGA: The CancerGenome Atlas; TN: Triple Negative (breast cancer subtype); TP53: TumorProtein P53 gene.
AcknowledgementsNot applicable.
FundingThis work was supported by the grants F30AG052261 (to A.M.) from the NIH/National Institute on Aging (NIA, http://www.nia.nih.gov/), R01AG046170 (toB.Z.) from the NIH/National Institute on Aging (NIA, http://www.nia.nih.gov/),R01CA163772 (to B.Z.) from NIH/National Cancer Institute (NCI, http://
McKenzie et al. BMC Systems Biology (2016) 10:106 Page 23 of 25

www.cancer.gov/), and U01AI111598-01 (to B.Z.) from NIH/National Instituteof Allergy and Infectious Diseases (NIAID, http://www.niaid.nih.gov/). Thefunders had no role in study design, data collection and analysis, decision topublish, or preparation of the manuscript.
Authors’ contributionsAM and BZ designed and conceptualized the R package. AM wrote the Rpackage and package vignette. AM designed and implemented thesimulation studies. IK and AM applied DGCA to the TCGA breast cancer data.WS and AM used MEGENA to extend differential correlation gene pairs tothe network level. MW contributed code and insight for data visualization.AM and BZ drafted and edited the manuscript. All authors read andapproved the manuscript.
Competing interestsThe authors declare that they have no competing interests.
Consent for publicationNot applicable.
Ethics approval and consent to participateNot applicable.
Author details1Department of Genetics and Genomic Sciences, Icahn School of Medicine atMount Sinai, One Gustave L. Levy Place, New York, NY 10029, USA. 2IcahnInstitute of Genomics and Multiscale Biology, Icahn School of Medicine atMount Sinai, One Gustave L. Levy Place, New York, NY 10029, USA. 3MedicalScientist Training Program, Icahn School of Medicine at Mount Sinai, OneGustave L. Levy Place, New York, NY 10029, USA. 4Department of Genetics &Genomic Sciences, Icahn School of Medicine at Mount Sinai, 1470 MadisonAvenue, Room S8-111, New York, NY 10029, USA.
Received: 23 May 2016 Accepted: 3 November 2016
References1. Zhu J, Zhang B, Schadt EE. A systems biology approach to drug discovery.
Adv Genet. 2008;60:603–35.2. Auffray C, Chen Z, Hood L. Systems medicine: the future of medical
genomics and healthcare. Genome Med. 2009;1:2.3. Anders S, Huber W. Differential expression analysis for sequence count data.
Genome Biol. 2010;11:R106.4. Cui X, Churchill GA. Statistical tests for differential expression in cDNA
microarray experiments. Genome Biol. 2003;4:210.5. Zhang B, Horvath S. A general framework for weighted gene co-expression
network analysis. Stat Appl Genet Mol Biol. 2005;4:Article17.6. Song W-M, Zhang B. Multiscale Embedded Gene Co-expression Network
Analysis. PLoS Comput Biol. 2015;11:e1004574.7. Langfelder P, Luo R, Oldham MC, Horvath S. Is my network module
preserved and reproducible? PLoS Comput Biol. 2011;7:e1001057.8. Zhang B, Gaiteri C, Bodea L-G, Wang Z, McElwee J, Podtelezhnikov AA,
Zhang C, Xie T, Tran L, Dobrin R, et al. Integrated Systems ApproachIdentifies Genetic Nodes and Networks in Late-Onset Alzheimer’s Disease.Cell. 2013;153:707–20.
9. Narayanan M, Huynh JL, Wang K, Yang X, Yoo S, McElwee J, Zhang B, Zhang C,Lamb JR, Xie T, et al. Common dysregulation network in the human prefrontalcortex underlies two neurodegenerative diseases. Mol Syst Biol. 2014;10:743.
10. Amar D, Safer H, Shamir R. Dissection of regulatory networks that are altered indisease via differential co-expression. PLoS Comput Biol. 2013;9:e1002955.
11. Ha MJ, Baladandayuthapani V, Do K-A. DINGO: Differential Network Analysisin Genomics. Bioinformatics. 2015;31:btv406.
12. Watson M. CoXpress: differential co-expression in gene expression data.BMC Bioinformatics. 2006;7:509.
13. Fang G, Kuang R, Pandey G, Steinbach M, Myers CL, Kumar V. Subspacedifferential coexpression analysis: problem definition and a generalapproach, Pacific Symposium on Biocomputing Pacific Symposium onBiocomputing. 2010. p. 145–56.
14. Tesson BM, Breitling R, Jansen RC. DiffCoEx: a simple and sensitive method tofind differentially coexpressed gene modules. BMC Bioinformatics. 2010;11:497.
15. Choi Y, Kendziorski C. Statistical methods for gene set co-expressionanalysis. Bioinformatics. 2009;25:2780–6.
16. Rahmatallah Y, Emmert-Streib F, Glazko G. Gene Sets Net CorrelationsAnalysis (GSNCA): a multivariate differential coexpression test for gene sets.Bioinformatics. 2014;30:360–8.
17. Lai Y, Wu B, Chen L, Zhao H. A statistical method for identifying differentialgene-gene co-expression patterns. Bioinformatics. 2004;20:3146–55.
18. Fukushima A. DiffCorr: an R package to analyze and visualize differentialcorrelations in biological networks. Gene. 2013;518:209–14.
19. Dawson JA, Ye S, Kendziorski C. R/EBcoexpress: an empirical Bayesian frameworkfor discovering differential co-expression. Bioinformatics. 2012;28:1939–40.
20. Siska C, Bowler R, Kechris K. The Discordant Method: A Novel Approach forDifferential Correlation. Bioinformatics. 2016;32:690–96.
21. Lai Y, Adam B-l, Podolsky R, She J-X. A mixture model approach to the testsof concordance and discordance between two large-scale experiments withtwo-sample groups. Bioinformatics. 2007;23:1243–50.
22. Fisher RA. Frequency Distribution of the Values of the Correlation Coefficient inSamples from an Indefinitely Large Population. Biometrika. 1915;10:507–21.
23. Cox NJ. Speaking Stata: Correlation with confidence, or Fisher’s z revisited.Stata J. 2008;8:413–39.
24. Fieller EC, Hartley HO, Pearson ES. Tests for Rank Correlation Coefficients. I.Biometrika. 1957;44:470–81.
25. Benjamini Y, Hochberg Y. Controlling the False Discovery Rate: A Practicaland Powerful Approach to Multiple Testing. J R Stat Soc Ser B Methodol.1995;57:289–300.
26. Storey JD, Tibshirani R. Statistical methods for identifying differentially expressedgenes in DNA microarrays. Methods Mol Biol. 2003;224:1064–3745. (Print)):149-157.
27. Strimmer K. fdrtool: a versatile R package for estimating local and tail area-based false discovery rates. Bioinformatics. 2008;24:1461–2.
28. Storey J. qvalue: Q-value estimation for false discovery rate control. 2015.29. Storey JD, Tibshirani R. Statistical significance for genomewide studies. Proc
Natl Acad Sci U S A. 2003;100:9440–5.30. Howell DC. Statistical Methods for Psychology. 2012. p. 280–1.31. Mason CC, Hanson RL, Ossowski V, Bian L, Baier LJ, Krakoff J, Bogardus C.
Bimodal distribution of RNA expression levels in human skeletal muscletissue. BMC Genomics. 2011;12:98.
32. Zhang Y, Sloan Steven A, Clarke Laura E, Caneda C, Plaza Colton A, BlumenthalPaul D, Vogel H, Steinberg Gary K, Edwards Michael SB, Li G, et al. Purificationand Characterization of Progenitor and Mature Human Astrocytes RevealsTranscriptional and Functional Differences with Mouse. Neuron. 2015;89:37–53.
33. Venables WN, Ripley BD. Modern Applied Statistics with S. 2002.34. Robin X, Turck N, Hainard A, Tiberti N, Lisacek F, Sanchez J-C, Müller M.
pROC: an open-source package for R and S+ to analyze and compare ROCcurves. BMC Bioinformatics. 2011;12:77.
35. Koboldt DC, Fulton RS, McLellan MD, Schmidt H, Kalicki-Veizer J, McMichaelJF, Fulton LL, Dooling DJ, Ding L, Mardis ER, et al. Comprehensive molecularportraits of human breast tumours. Nature. 2012;490:61–70.
36. Inga A, Storici F, Darden TA, Resnick MA. Differential transactivation by thep53 transcription factor is highly dependent on p53 level and promotertarget sequence. Mol Cell Biol. 2002;22:8612–25.
37. Liberzon A, Birger C, Thorvaldsdóttir H, Ghandi M, Mesirov Jill P, Tamayo P.The Molecular Signatures Database Hallmark Gene Set Collection. CellSystems. 2015;1:417–25.
38. Schaefer CF, Anthony K, Krupa S, Buchoff J, Day M, Hannay T, Buetow KH.PID: the Pathway Interaction Database. Nucleic Acids Res. 2009;37:D674–9.
39. Nishimura D. BioCarta. Biotech Software Internet Report. 2001;2:117–20.40. Subramanian A, Tamayo P, Mootha VK, Mukherjee S, Ebert BL, Gillette MA,
Paulovich A, Pomeroy SL, Golub TR, Lander ES, et al. Gene set enrichmentanalysis: a knowledge-based approach for interpreting genome-wideexpression profiles. Proc Natl Acad Sci U S A. 2005;102:15545–50.
41. Stark C, Breitkreutz B-J, Reguly T, Boucher L, Breitkreutz A, Tyers M. BioGRID: ageneral repository for interaction datasets. Nucleic Acids Res. 2006;34:D535–9.
42. Falcon S, Gentleman R. Using GOstats to test gene lists for GO termassociation. Bioinformatics. 2007;23:257–8.
43. Agresti A. Categorical Data Analysis. 2012. p. 70–7.44. Tesson BM, Breitling R, Jansen RC, Chu S, DeRisi J, Eisen M, Mulholland J, Botstein
D, Brown P, Herskowitz I, et al. DiffCoEx: a simple and sensitive method to finddifferentially coexpressed gene modules. BMC Bioinformatics. 2010;11:497.
45. Haricharan S, Bainbridge MN, Scheet P, Brown PH. Somatic mutation load ofestrogen receptor-positive breast tumors predicts overall survival: an analysis ofgenome sequence data. Breast Cancer Res Treat. 2014;146:211–20.
McKenzie et al. BMC Systems Biology (2016) 10:106 Page 24 of 25
46. Al-Ejeh F, Simpson PT, Sanus JM, Klein K, Kalimutho M, Shi W, Miranda M,Kutasovic J, Raghavendra A, Madore J, et al. Meta-analysis of the globalgene expression profile of triple-negative breast cancer identifies genes forthe prognostication and treatment of aggressive breast cancer.Oncogenesis. 2014;3:e100.
47. Kanehisa M, Goto S, Sato Y, Kawashima M, Furumichi M, Tanabe M. Data,information, knowledge and principle: back to metabolism in KEGG. NucleicAcids Res. 2014;42:D199–205.
48. Feng Q, Zhang Z, Shea MJ, Creighton CJ, Coarfa C, Hilsenbeck SG, Lanz R,He B, Wang L, Fu X, et al. An epigenomic approach to therapy fortamoxifen-resistant breast cancer. Cell Res. 2014;24:809–19.
49. Buchwalter G, Hickey Michele M, Cromer A, Selfors Laura M, GunawardaneRuwanthi N, Frishman J, Jeselsohn R, Lim E, Chi D, Fu X, et al. PDEFPromotes Luminal Differentiation and Acts as a Survival Factor for ER-Positive Breast Cancer Cells. Cancer Cell. 2013;23:753–67.
50. Patani N, Jiang WG, Newbold RF, Mokbel K. Histone-modifier geneexpression profiles are associated with pathological and clinical outcomesin human breast cancer. Anticancer Res. 2011;31:4115–25.
51. Daniel AR, Gaviglio AL, Knutson TP, Ostrander JH, D’Assoro AB,Ravindranathan P, Peng Y, Raj GV, Yee D, Lange CA. Progesterone receptor-B enhances estrogen responsiveness of breast cancer cells via scaffoldingPELP1- and estrogen receptor-containing transcription complexes.Oncogene. 2015;34:506–15.
52. Fenne IS, Helland T, Flågeng MH, Dankel SN, Mellgren G, Sagen JV.Downregulation of steroid receptor coactivator-2 modulates estrogen-responsive genes and stimulates proliferation of mcf-7 breast cancer cells.PLoS One. 2013;8:e70096.
53. Freed-Pastor WA, Prives C. Mutant p53: one name, many proteins. GenesDev. 2012;26:1268–86.
54. Muller PAJ, Vousden KH. p53 mutations in cancer. Nat Cell Biol. 2013;15:2–8.55. Cao X-X, Xu J-D, Xu J-W, Liu X-L, Cheng Y-Y, Wang W-J, Li Q-Q, Chen Q, Xu
Z-D, Liu X-P. RACK1 promotes breast carcinoma proliferation and invasion/metastasis in vitro and in vivo. Breast Cancer Res Treat. 2009;123:375–86.
56. Macleod KF, Sherry N, Hannon G, Beach D, Tokino T, Kinzler K, Vogelstein B,Jacks T. p53-dependent and independent expression of p21 during cellgrowth, differentiation, and DNA damage. Genes Dev. 1995;9:935–44.
57. Bochkis IM, Schug J, Ye DZ, Kurinna S, Stratton SA, Barton MC, Kaestner KH.Genome-wide location analysis reveals distinct transcriptional circuitry byparalogous regulators Foxa1 and Foxa2. PLoS Genet. 2012;8:e1002770.
58. Yan C, Boyd DD. ATF3 regulates the stability of p53: a link to cancer. CellCycle (Georgetown, Tex). 2006;5:926–9.
59. Wei S, Wang H, Lu C, Malmut S, Zhang J, Ren S, Yu G, Wang W, Tang DD,Yan C. The activating transcription factor 3 protein suppresses theoncogenic function of mutant p53 proteins. J Biol Chem. 2014;289:8947–59.
60. Doherty JR, Cleveland JL. Targeting lactate metabolism for cancertherapeutics. J Clin Invest. 2013;123:3685–92.
61. Madan E, Gogna R, Bhatt M, Pati U, Kuppusamy P, Mahdi AA. Regulation ofglucose metabolism by p53: emerging new roles for the tumor suppressor.Oncotarget. 2011;2:948–57.
62. Kechagioglou P, Papi RM, Provatopoulou X, Kalogera E, Papadimitriou E,Grigoropoulos P, Nonni A, Zografos G, Kyriakidis DA, Gounaris A. Tumorsuppressor PTEN in breast cancer: heterozygosity, mutations and proteinexpression. Anticancer Res. 2014;34:1387–400.
63. Wang W, Zheng Z, Yu W, Lin H, Cui B, Cao F. Polymorphisms of the FASand FASL genes and risk of breast cancer. Oncol Lett. 2012;3:625–8.
64. Peacock JW, Palmer J, Fink D, Ip S, Pietras EM, Mui AL-F, Chung SW, Gleave ME,Cox ME, Parsons R, et al. PTEN Loss Promotes Mitochondrially Dependent TypeII Fas-Induced Apoptosis via PEA-15. Mol Cell Biol. 2009;29:1222–34.
65. Bandyopadhyay S, Pai SK, Watabe M, Gross SC, Hirota S, Hosobe S, TsukadaT, Miura K, Saito K, Markwell SJ, et al. FAS expression inversely correlateswith PTEN level in prostate cancer and a PI 3-kinase inhibitor synergizeswith FAS siRNA to induce apoptosis. Oncogene. 2005;24:5389–95.
66. Sayed D, He M, Hong C, Gao S, Rane S, Yang Z, Abdellatif M. MicroRNA-21 Isa Downstream Effector of AKT That Mediates Its Antiapoptotic Effects viaSuppression of Fas Ligand. J Biol Chem. 2010;285:20281–90.
67. Attar MA, Salem JC, Pursel HS, Santy LC. CNK3 and IPCEF1 produce a singleprotein that is required for HGF dependent Arf6 activation and migration.Exp Cell Res. 2012;318:228–37.
68. Lloyd MC, Alfarouk KO, Verduzco D, Bui MM, Gillies RJ, Ibrahim ME, BrownJS, Gatenby RA. Vascular measurements correlate with estrogen receptorstatus. BMC Cancer. 2014;14:279.
69. Journé F, Dumon J-C, Kheddoumi N, Fox J, Laïos I, Leclercq G, Body J-J.Extracellular calcium downregulates estrogen receptor alpha and increasesits transcriptional activity through calcium-sensing receptor in breast cancercells. Bone. 2004;35:479–88.
70. Divekar SD, Storchan GB, Sperle K, Veselik DJ, Johnson E, Dakshanamurthy S,Lajiminmuhip YN, Nakles RE, Huang L, Martin MB. The role of calcium in theactivation of estrogen receptor-alpha. Cancer Res. 2011;71:1658–68.
71. Banerjee S, Wei Z, Tan F, Peck KN, Shih N, Feldman M, Rebbeck TR, AlwineJC, Robertson ES. Distinct microbiological signatures associated with triplenegative breast cancer. Scientific Reports. 2015;5:15162.
72. Casadei R, Pelleri MC, Vitale L, Facchin F, Canaider S, Strippoli P, Vian M,Piovesan A, Bianconi E, Mariani E, et al. Characterization of human gene locusCYYR1: a complex multi-transcript system. Mol Biol Rep. 2014;41:6025–38.
73. Dieci MV, Griguolo G, Miglietta F, Guarneri V. The immune system andhormone-receptor positive breast cancer: Is it really a dead end? CancerTreat Rev. 2016;46:9–19.
74. Rose DP, Gracheck PJ, Vona-Davis L. The Interactions of Obesity, Inflammationand Insulin Resistance in Breast Cancer. Cancers. 2015;7:2147–68.
75. Stagg J, Allard B. Immunotherapeutic approaches in triple-negative breast cancer:latest research and clinical prospects. Ther Advanc Med Oncol. 2013;5:169–81.
76. Han X, Gui B, Xiong C, Zhao L, Liang J, Sun L, Yang X, Yu W, Si W, Yan R,et al. Destabilizing LSD1 by Jade-2 promotes neurogenesis: an antibrakingsystem in neural development. Mol Cell. 2014;55:482–94.
77. Rivlin N, Brosh R, Oren M, Rotter V. Mutations in the p53 Tumor SuppressorGene: Important Milestones at the Various Steps of Tumorigenesis. Genes &Cancer. 2011;2:466–74.
78. Oren M, Rotter V. Mutant p53 Gain-of-Function in Cancer. Cold Spring HarbPerspect Biol. 2010;2:a001107-a001107.
79. Hudson NJ, Reverter A, Dalrymple BP. A differential wiring analysis ofexpression data correctly identifies the gene containing the causalmutation. PLoS Comput Biol. 2009;5:e1000382.
80. Kostka D, Spang R. Finding disease specific alterations in the co-expressionof genes. Bioinformatics. 2004;20 Suppl 1:194–9.
81. Storey JD, Xiao W, Leek JT, Tompkins RG, Davis RW. Significance analysis of timecourse microarray experiments. Proc Natl Acad Sci U S A. 2005;102:12837–42.
82. Mäkinen V-P, Civelek M, Meng Q, Zhang B, Zhu J, Levian C, Huan T, SegrèAV, Ghosh S, Vivar J, et al. Integrative Genomics Reveals Novel MolecularPathways and Gene Networks for Coronary Artery Disease. PLoS Genet.2014;10:e1004502.
83. Yoo S, Takikawa S, Geraghty P, Argmann C, Campbell J, Lin L, Huang T, TuZ, Feronjy R, Spira A, et al. Integrative Analysis of DNA Methylation andGene Expression Data Identifies EPAS1 as a Key Regulator of COPD. PLoSGenet. 2015;11:e1004898.
• We accept pre-submission inquiries
• Our selector tool helps you to find the most relevant journal
• We provide round the clock customer support
• Convenient online submission
• Thorough peer review
• Inclusion in PubMed and all major indexing services
• Maximum visibility for your research
Submit your manuscript atwww.biomedcentral.com/submit
Submit your next manuscript to BioMed Central and we will help you at every step:
McKenzie et al. BMC Systems Biology (2016) 10:106 Page 25 of 25