d/h equilibrium fractionation in ices · stable cubic crystalline form (ic). this molecular...
TRANSCRIPT

D/H equilibrium fractionation
in ices A. Faure1, M. Faure1, E. Quirico1
P. Theulé2, B. Schmitt1
1IPAG, Grenoble; 2PIIM, Marseille
Fractionation of isotopes in space Firenze, 10-13 october 2016

Outline
• The methanol puzzle • Experiment • Model • Results • Conclusions & perspec:ves
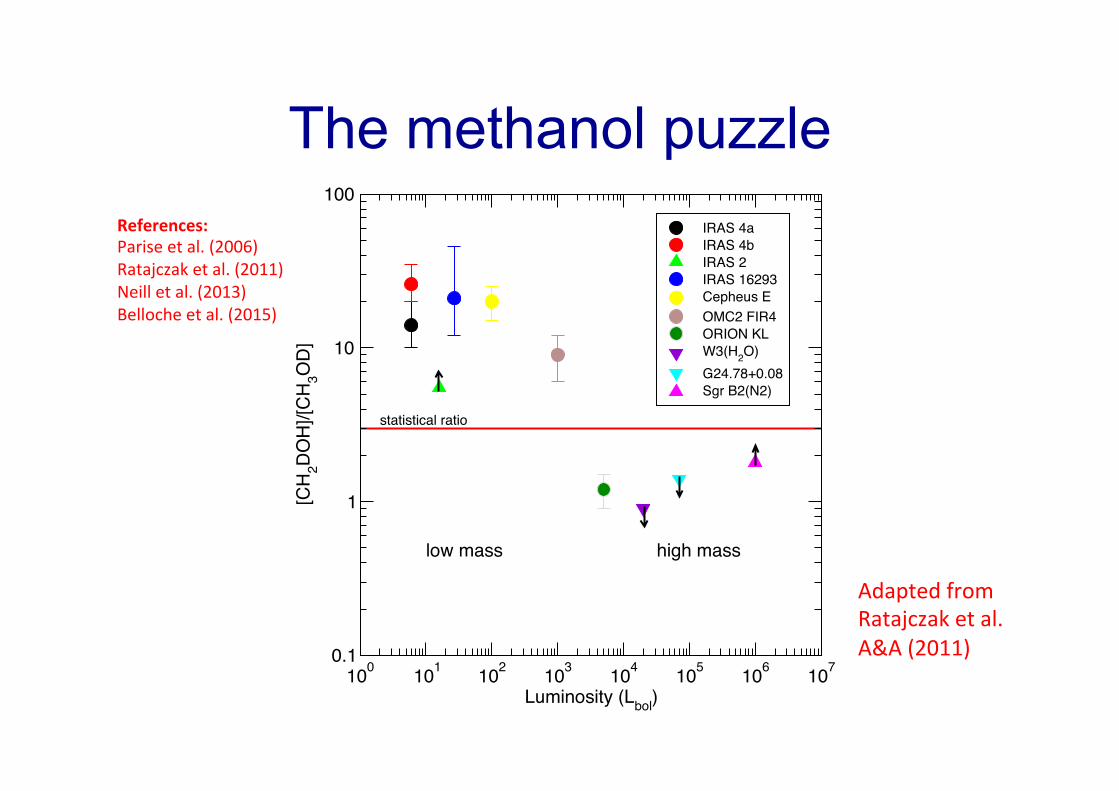
The methanol puzzle
Adapted from Ratajczak et al. A&A (2011)
References: Parise et al. (2006) Ratajczak et al. (2011) Neill et al. (2013) Belloche et al. (2015)
100 101 102 103 104 105 106 107
Luminosity (Lbol)
0.1
1
10
100
[CH 2DO
H]/[C
H 3OD]
IRAS 4aIRAS 4bIRAS 2IRAS 16293Cepheus EOMC2 FIR4ORION KLW3(H2O)G24.78+0.08Sgr B2(N2)
low mass high mass
statistical ratio

ν2+νL
H/D exchanges in ice
• Thin films (1 μm) of H2O:CD3OD ice mixtures are monitored by FTIR spectroscopy
• Rapid (~ hrs) H/D exchanges are observed above T=120K on the -‐OH func:onal group
A. Ratajczak et al.: hydrogen/deuterium exchange in interstellar ice analogs L23
!"#
!"$
$"%
$"&
$"'
$"#
$"$
()*+,)-./0
#1$$ #&$$ #2$$ #'$$ #3$$ ##$$ #!$$ #$$$4-50.67)0,*89/7:!;
!"#$%&!'
()*!+,-
./0*/!+,-
!"#$)&!'!!1#!$2!3
!"#$)&!'!!1#&
Fig. 1. First experiment (90–170 K). The isotopic exchange is moni-tored up to the complete evaporation of CD3OD. The remaining crys-talline (Ic) H2O ice film is enriched in HDO. At 120 K, rapid H/Dexchange occurs. The experiment shows H/D exchange located on thehydroxyl functional group. Spectra are vertically o!set to ensure clarityin the figure.
HDO appeared as a band peaking at 2425 cm!1, growing withincreasing time and heating (left panel of Fig. 2). The librationalwater mode !L, which is a tracer of the crystalline state (Hagen& Tielens 1982), was used to indicate that i) water ice has expe-rienced the phase transition (Ial)" (Ic) at 120 K and that ii) thisphase transition was not completed when the H/D exchange wassignificantly advanced (right panel of Fig. 2).
Finally, it should be noted that besides the increasing in-tensity of the HDO !OD vibrational mode, in both experiments,complex spectral variations were observed in the spectra, includ-ing splitting, peak shifting, and variations in band intensities. Itis not the purpose of this Letter to discuss those spectral vari-ations in detail. They are definitely controlled by a variety offactors, in particular the degree of crystallinity and the degree ofclustering of CD3OD molecules (Quirico & Schmitt 1997a,b).
4. Discussion
The deuteration and the formation process of methanol are ma-jor issues in interstellar chemistry. Current gas-phase models donot account for the synthesis of methanol (Garrod et al. 2006).Therefore, formation routes onto and/or inside the icy mantles ofinterstellar grains have been proposed. Photolysis and radiolysis
!"$
$"%
$"&
$"'
$"#
$"$
()*+,)-./0
#&$$ #'$$ ##$$4-50.67)0,*89/7:!;
!"#$0&!'!"#$0&!'!"#$)&!'!"#$)&!'
#"2
#"$
!"2
!"$
$"2
$"$!$$$ <$$ %$$ 1$$ &$$
4-50.67)0,*89/7:!;
=,>*?-@@AB-?A+.
Fig. 2. Second experiment (110–130 K). Left: the isotopic H/D ex-change between H2O and the hydroxyl functional group of CD3OD istraced by the HDO !OD band at 2425 cm!1. Right: the libration water icemode !L, used as a tracer of the crystalline state. H/D exchange occursbefore the completion of crystallization. Spectra are vertically o!set toensure clarity in the figure.
experiments of interstellar ice analogs show that methanol is ef-ficiently formed from CH4:H2O or CO:H2O mixtures (Hudson& Moore 1999; Wada et al. 2006). However, it is uncertain thatsuch photolysis/radiolysis solid-state chemistry produces highH/D fractionation. In particular, the HDO/H2O ratio of waterice is very low (Parise et al. 2003; Dartois et al. 2003) and thedeuteration of CH4 or CH+3 species is mostly unknown. Anotherpossible chemical route is the reaction of D atoms at the surfaceof the grains, coming from a D-rich atomic gas produced by gas-phase chemistry fractionation (D/H # 0.1) (Watanabe & Kouchi2002; Nagaoka et al. 2005). As mentioned in the Introduction,the experiments of Nagaoka et al. (2005) have demonstrated thatsingly, doubly, and triply deuterated methanol isotopologues,with D atoms located in the methyl group, can be produced viaH-D substitution in solid methanol.
Our experiments are complementary to these works, as theyhave focused on the loss of deuterium in ice mixtures, i.e. asolid-state depletion mechanism. They clearly demonstrate thatH/D exchange between the hydroxyl group of CD3OD and H2Onecessarily occurs when ices are heated above 120 K, during thecrystallization of water. It should be noted that thermally acti-vated H/D exchange between D2O and CH3OH had been ob-served previously by Kawanowa et al. (2004) at temperaturesabove 140 K, often described as a critical temperature. We alsonote that some controversy exists in the detailed mechanismof the H/D exchange (see e.g., Lee et al. 2007, and referencestherein). In our experiments, exchange was found to occur onlyin intimate molecular mixtures, i.e. in couples of molecules spa-tially closely related. We thus conclude that long scale proton
νOD(HDO)
Ratajczak et al. A&A (2009)
νCD3 νOD

Kinetics experiment
t=ta, where ta is the time required to reach a specified conversion(e.g., a ! 0:5), can be used instead of the time t, to compare theplots a versus t=ta at each temperature. A similar shape of theseplots provides direct evidence for a unique kinetic model overthe whole considered temperature range. The accuracy of eachmodel can then be evaluated by performing a linear fit of the plotsgi"a# versus t=ta. A standard v2-test on these linear fits is used toselect the best model. The reduced v2 associated with the kineticmodel i (v2
ri) is the average of the reduced v2 obtained for this
model at different temperatures (v2ri"T#). The lowest v2
rigives our
best model. The rate constant ki"T# at each temperature is simplyevaluated as the slope of the plot gi"a# versus t=ta. Finally, theArrhenius parameters (EAi and Ai) are deduced from an Arrheniusdiagram, ln"k"T## versus 1=T.
3.3. Kinetics of H/D exchange
The formation of HOD molecules in the sample results from theprocess of H/D exchange between the deuterated organic molecule(R—D) and water "H2O# in large excess.
R—D$H2O ! R—H$HOD "4#
The integrated absorbance of the mOD stretching band of HOD is pro-portional to the fraction of HOD molecules (the mOD stretching bandis unsaturated as the maximal absorbance for this band is under0.2). Thus, this band was employed as a tracer of H/D exchanges.The degree of conversion for H/D exchanges can be described by:
a !ItOD "t#ItOD "t1#
"5#
where ItOD "t# is the integrated absorbance of the mOD stretching bandat a time t and ItOD "t1# is the integrated absorbance of the mODstretching band at the end of the experiment, when the integratedabsorbance no longer increases. The superposition of the plots aversus t=ta at different temperatures is shown in Fig. 4. The dataoverlap within error bars, therefore indicating that a unique kineticmodel can be employed for temperatures between 110 K and 135 K.The displayed error bars correspond mainly to the correction forother band contributions to the integrated absorbance of the mODstretching band. Indeed, the mOD stretching band is mixed withother vibrational bands in the spectra, mainly the combination
mode m2 + mL of water (see Fig. 1). The plots of gi"a# versus timefor different kinetic models were linearly fitted, as plotted inFigs. A1 and A2. The corresponding v2
riare shown in Fig. A3. It is
clear that pseudo second and third order (O2 and O3) kinetic mod-els, with v2
ri% 1, are the most accurate to describe the H/D
exchanges in both mixtures (H2O:CD3ND2 and H2O:CD3OD).Kinetic constants were derived from the simplest O2 kinetic modelto draw the Arrhenius diagrams shown in Fig. 5. The obtained acti-vation energy EA and frequency factor A values are listed in Table 3.Activation energies are 4300 ± 900 K and 3300 ± 100 K for H2O:CD3OD and H2O:CD3ND2 ice mixtures, respectively. The larger errorbars for the H2O:CD3OD ice mixture are due to the higher spectralcongestion (extracting the mOD stretching band of HOD was trickierthan in the case of methylamine) and sublimation effects. Theseactivation energies are similar to those derived for the H2O:D2Omixture, which range between 3000 K and 5000 K (Collier et al.,1984; Fisher and Devlin, 1995; Lamberts et al., 2015).
Although the best models for the two H/D exchange reactionsare O2 and O3, it should be noted that astrochemical models gen-erally adopt a pseudo first-order (O1) formulation for bimolecularreactive processes (a total second-order with partial first-orderfor each molecule) (e.g. Hasegawa et al., 1992). Kinetic parame-ters deduced from pseudo second-order models are obviouslynot applicable in such models. To circumvent this problem weprovide Arrhenius parameters assuming a pseudo first-orderkinetic model (Table 3) for the organic molecule. The activationenergies are 4100 ± 900 K and 3350 ± 100 K for H2O:CD3OD andH2O:CD3ND2 ice mixtures, respectively. These values are thusvery similar to those obtained using the pseudo second-ordermodel. In particular, the difference in the activation energiesbetween the two ice mixtures remains significant. We note, how-ever, that in the case of methanol the pre-exponential factor islarger by a factor of %7 in the O2 model with respect to theO1 model.
3.4. Kinetics of crystallization
In the range of temperature where H/D exchanges occur(110–150 K), crystallization of the sample is observed. This wellstudied process consists in the physical transformation of a meta-stable phase of water ice, the amorphous solid water (ASW), to thestable cubic crystalline form (Ic). This molecular reorganizationmay be intimately related to the feasibility of isotopic exchangein amorphous solid water, as discussed by Devlin (2001). Here,the kinetics of crystallization of the H2O:CD3OD and H2O:CD3ND2
ice mixtures is described using the formalism employed abovefor H/D exchanges. The rate of crystallization of pure ASW has beeninvestigated in many previous studies (Schmitt et al., 1989;Dohnálek et al., 1999, 2000; Hage et al., 1994, 1995; Jenniskensand Blake, 1996; Maté et al., 2012; Safarik et al., 2003; Safarikand Mullins, 2004; Smith et al., 2011). The kinetics has been shownto follow nucleation models but a large variation in the Avramiexponents and in the activation energies (from %5000 K to10,000 K) was observed. Thus, in order to compare the two ice mix-tures crystallization with pure ASW ice crystallization under thesame experimental conditions, isothermal experiments on pureASW were performed in the same temperature range.
Our approach to measure the crystallization kinetics consists ofassuming that the blended water stretching band [m1 and m3] at%3250 cm&1 is a linear combination of an amorphous spectrumand a crystallized spectrum, as shown in Fig. A4. The degree of con-version a for the crystallization is then simply described by the lin-ear combination coefficient. The superposition of the plots a versust=ta for different temperatures is shown in Fig. 6. The displayed error
Fig. 11. Degree of conversion for H/D exchange and crystallization versus time of amixture of H2O:CD3ND2 at 125 K. A fit of a second order kinetic model (line) and anAvrami (n = 2) kinetic model (dotted line) is plotted for each process respectively.We note that H/D exchanges already occur during the induction period. Thestructural evolution of the sample during this period (formation of small nuclei) issimilar to the structural evolution of the sample during the crystallization process(formation and growth of larger nuclei). Thus, the ‘‘hop-and-turn” process, and soH/D exchanges, can occur in both processes.
M. Faure et al. / Icarus 261 (2015) 14–30 21
• Exchanges are observed in H2O:CD3OD and H2O:CD3ND2, but not in D2O:HCN
• Ac:va:on energies are similar for exchanges and crystallisa:on (~ 4000 K)
H2O:CD3ND2 @ T=125K
[See Faure M. et al. Icarus 261 14 (2015)]

The model
Surface species considered: – H2O – HDO – D2O – CH3OH, CH3OD – CH2DOH, CHD2OD
– CD2HOH, CD2HOD – CD3OH, CD3OD
• Grain surface chemical model (rate equa:ons) as in Hasegawa et al. ApJ (1992)
• Chemistry is limited to H/D exchanges + accre:on + thermal sublima:on
• No diffusion on grains and no post-‐evapora:ve gas-‐phase chemistry
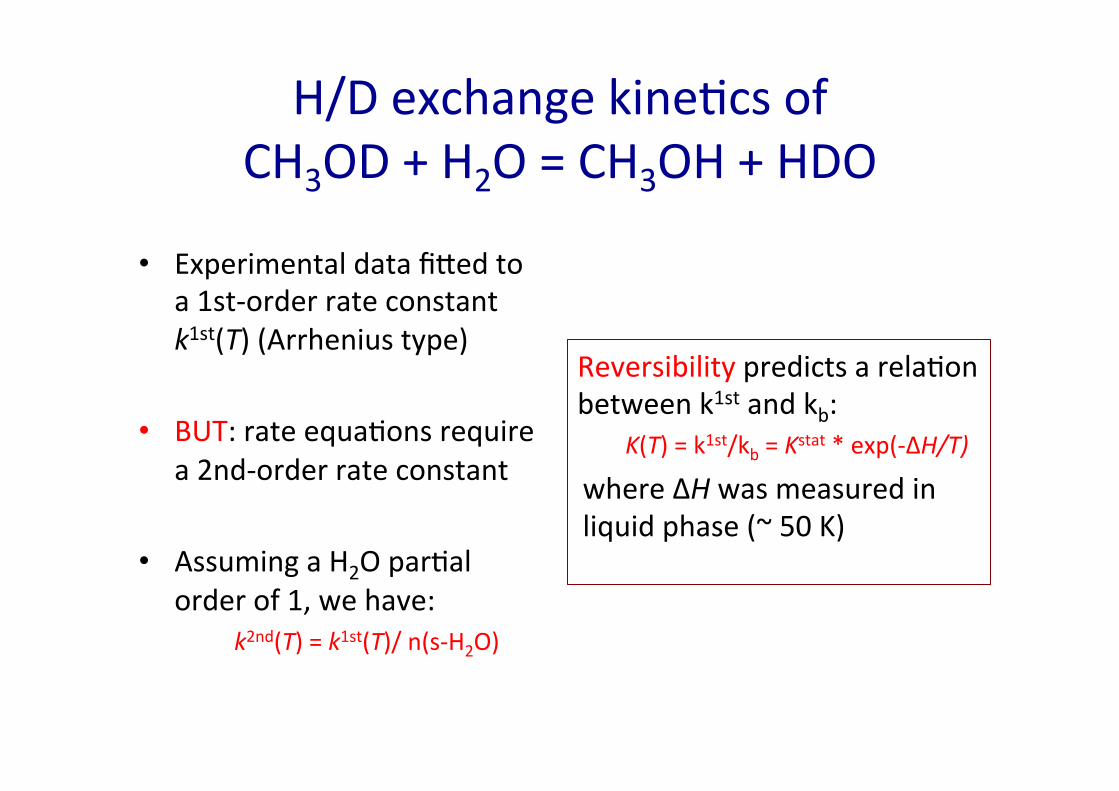
H/D exchange kine:cs of CH3OD + H2O = CH3OH + HDO
• Experimental data fijed to a 1st-‐order rate constant k1st(T) (Arrhenius type)
• BUT: rate equa:ons require a 2nd-‐order rate constant
• Assuming a H2O par:al order of 1, we have:
k2nd(T) = k1st(T)/ n(s-‐H2O)
Reversibility predicts a rela:on between k1st and kb:
K(T) = k1st/kb = Kstat * exp(-‐ΔH/T)
where ΔH was measured in liquid phase (~ 50 K)
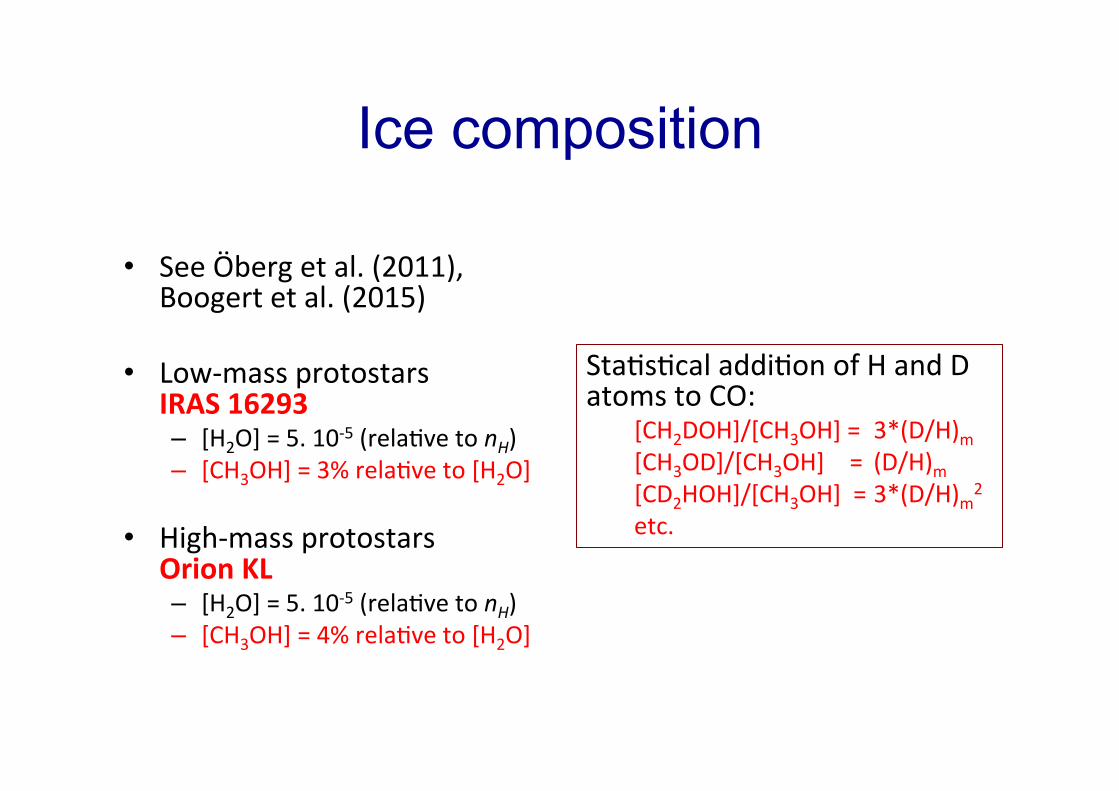
Ice composition
• See Öberg et al. (2011), Boogert et al. (2015)
• Low-‐mass protostars IRAS 16293 – [H2O] = 5. 10-‐5 (rela:ve to nH) – [CH3OH] = 3% rela:ve to [H2O]
• High-‐mass protostars Orion KL – [H2O] = 5. 10-‐5 (rela:ve to nH) – [CH3OH] = 4% rela:ve to [H2O]
Sta:s:cal addi:on of H and D atoms to CO:
[CH2DOH]/[CH3OH] = 3*(D/H)m [CH3OD]/[CH3OH] = (D/H)m [CD2HOH]/[CH3OH] = 3*(D/H)m2 etc.

Ini:al condi:ons • Accre:ng (D/H)m atomic
ra:o is fixed by CH2DOH frac:ona:on: – IRAS 16293: (D/H)m = 12% – Orion-‐KL: (D/H)m = 0.2%
• Water deutera:on (D/H)w is our (unique) free parameter
• nH=2*107 cm-‐3, Tg=Td= 100 K à instantaneous jump + steady-‐state solu:ons
A. Faure et al.: Hydrogen isotope exchanges in interstellar ices
Table 1. Initial conditions for the ice composition in IRAS 16293-2422. The fractionation ratios of the deuter-
ated isotopologues of methanol are purely statistical assuming an accreting ratio !m of 0.12. Numbers in
brackets denote the power of ten, e.g. 1.0(!4) = 1.0 " 10!4.
Species Abundance Isotopologue Fractionation
H2O 5.0(-5) HDO 1.0(-4)!1.1(-1)
D2O 2.5(-9)!2.8(-3)
CH3OH 1.5(-6) CH3OD 1.2(-1)
CH2DOH 3.6(-1)
CH2DOD 4.3(-2)
CD2HOH 4.3(-2)
CD2HOD 5.2(-3)
CD3OH 1.7(-3)
CD3OD 2.1(-4)
Table 2. Initial conditions for the ice composition in Orion KL. The fractionation ratios of the deuterated
isotopologues of methanol are purely statistical assuming an accreting ratio !m of 2 " 10!3.
Species Abundance Isotopologue Fractionation
H2O 5.0(-5) HDO 1.0(-4)!1.1(-1)
D2O 2.5(-9)!2.8(-3)
CH3OH 2.0(-6) CH3OD 2.0(-3)
CH2DOH 6.0(-3)
CH2DOD 1.2(-5)
CD2HOH 1.2(-5)
CD2HOD 2.4(-8)
CD3OH 8.0(-9)
CD3OD 1.6(-11)
3. Results
The coupled set of rate equations (23)-(24) was solved subject to the initial conditions listed in
Tables 1 and 2 for IRAS 16293-2422 and the Orion Compact Ridge, respectively. The density was
fixed at nH = 2 " 107 cm!3 for both sources, which is typical of hot core regions. The (equal) gas
and dust temperatures, Tg and Td, were varied between 60 and 140 K, assuming an instantaneous
temperature jump. For grain temperatures above 90 K, the steady-state was reached in less than
103 yr, which is shorter than the duration of the hot core phase. Only the steady-state solutions will
be therefore discussed in the following.
3.1. Low-mass protostar: IRAS 16293-2422
The steady-state gas- and ice-phase abundances of CH3OH in IRAS 16293-2422 are plotted in
Fig. 1 as a function of dust temperature. In this plot, the initial solid water fractionation ratio
is taken as [s-HDO]/[s-H2O]=1%. We can observe that for temperatures lower than 85 K, the
gas-phase abundance of CH3OH (relative to nH) is almost negligible, i.e. below 10!9. However,
above this “critical” temperature, the abundance increases sharply and solid methanol is entirely
sublimated for temperatures higher than 110 K. It can be noticed that the high temperature gas-
10
IRAS-‐16293
Orion-‐KL

Gas-phase D-methanol
IRAS-16293 [s-HDO]/[s-H2O] ~2%
Orion-KL [s-HDO]/[s-H2O] ~ 0.6%
A. Faure et al.: Hydrogen isotope exchanges in interstellar ices
10-3
10-2
10-1
Initial [s-HDO]/[s-H2O]
0
10
20
30
40
50
60
[g-CH2DOH]/[g-CH 3OD]
Fig. 2. Gas-phase abundance ratio of the singly deuterated isotopo-logues of methanol, [g-CH2DOH]/[g-CH3OD], as function of the ini-tial water ice deuteration. The dust temperature is taken as 100 K.The dotted line corresponds to Eq. (36). The ratio observed towardsIRAS 16293-2422 is represented by the orange hatched zone (Pariseet al. 2004).
Equation (36) is plotted in Fig. 2 as a dotted line. We can observethat it reproduces very well the ratio [g-CH2DOH]/[g-CH3OD]for initial water deuteration larger than ! 5"10#2. In this regime,the main reservoir of exchangeable deuterium atoms in the ice iswater ([s-HDO]> 2.5 " 10#6) and the HDO abundance is notmodified by H/D exchanges with methanol since the (initial)CH3OD abundance is only 1.8 " 10#7. In contrast, at lower ini-tial water deuteration, i.e. [s-HDO]/[s-H2O]! 5 " 10#2, the rela-tive amount of deuterium atoms in CH3OD becomes significant.In this regime, water gets enriched in deuterium through H/Dexchanges with CH3OD and the model deviates from Eq. (36)since the solid HDO abundance has increased.
In order to illustrate this last point, in Fig. 3 we plotted theD/H ratio of gaseous water as function of the initial D/H ratio ofwater ice. If the D/H ratio of water ice was conserved during thesublimation process, i.e. if there was no H/D exchange, then thecurve would follow the y = x function represented by the dashedline. As expected, however, when the initial [s-HDO]/[s-H2O]is lower than ! 5 " 10#2, the gas-phase ratio is systematicallyincreased with respect to the initial ice-phase value, by up to afactor of 50 at [s-HDO]/[s-H2O]=10#4. For the best value [s-HDO]/[s-H2O]=2% (see Fig. 2), the [g-HDO]/[g-H2O] values isfound to be 2.5 " 10#2. As shown in Fig. 3, this is consistentwith the range of observational ratios [g-HDO]/[g-H2O] mea-sured in the hot corino of IRAS 16293 by Coutens et al. (2013).We emphasize that observational uncertainties are large owing tooptical thickness problems. In any case, if the post-evaporativechemistry has no significant e!ect on the deuterium and waterchemistry, as assumed here, our model then predicts a D/H ratiofor gaseous water of ! 2.5% in the hot corino of IRAS 16293-2422. This value is in good agreement with the best-fit value of1.8 % derived by Coutens et al. (2013) from their multi-line anal-ysis. On the other hand, if the low value of 9.2±2.6"10#4 derivedfrom the interferometric observations of Persson et al. (2013) isconfirmed, then our model suggests that a significant additionalproduction of gaseous H2O must occur during the (short) hotcore phase.
10-4
10-3
10-2
10-1
Initial [s-HDO]/[s-H2O]
10-4
10-3
10-2
10-1
[g-HDO]/[g-H2O]
Fig. 3. Gas-phase deuterium fractionation of water, [g-HDO]/[g-H2O],as function of the initial water ice deuteration. The ratio observed to-wards IRAS 16293-2422 is represented by the orange hatched zone(Coutens et al. 2013).
Finally, in Table 3, we summarize the results of our bestmodel, corresponding to an initial [s-HDO]/[s-H2O] of 2%. Agood agreement with the observations is obtained, including themultiply deuterated isotopologues. The next isotopologue to bediscovered is obviously CH2DOD, for which our model predictsa column density of ! 1.2" 1015 cm#2 or an abundance (relativeto nH) of 5.8 " 10#9. To the best of our knowledge, however, ex-perimental frequencies in the millimetre range are not availablefor this isotopologue. We can also notice that the fractionationratio of D2O predicted by our model (1.7"10#4) agrees within afactor of !2 with the best-fit value of 7"10#5 derived by Coutenset al. (2013) The value quoted in Table 3 is the upper limit at 3!.
3.2. High-mass protostar: Orion Compact Ridge
The steady-state gas- and ice-phase abundances (relative to nH)of CH3OH in the Compact Ridge are plotted in Fig. 4 asa function of dust temperature. In this plot, the initial waterfractionation ratio is again taken as [s-HDO]/[s-H2O]=1%. Asobserved previously, the CH3OH abundance increases sharplyabove 90 K and solid methanol is entirely sublimated for tem-peratures higher than 110 K. The CH3OH abundance in theCompact Ridge is estimated as ! 7.5"10#7, with a column den-sity of 6.0 " 1017 cm#2 (Neill et al. 2013). The orange hatchedzone in Fig. 4 depicts the corresponding uncertainty of a factorof 2. It is found that the observed abundance is consistent with adust temperature of ! 100 K. Thus, in contrast to IRAS 16293-2422, our model suggests that a large fraction (" 40%) of the icemantles has evaporated in the compact ridge (assuming that theice composition in the Compact Ridge is typical of high-masssources). In the following, a standard hot-core dust temperatureof 100 K is employed.
The gas-phase ratio [g-CH2DOH]/[g-CH3OD] obtained withour model is plotted in Fig. 5 as function of the initial waterice deuteration [s-HDO]/[s-H2O]. It is found to be below thestatistical value of 3, as soon as the initial water deuterationis larger than ! 3 " 10#3. Thus, isotopic H/D exchanges be-tween methanol and water can also quantitatively explain thesmall [g-CH2DOH]/[g-CH3OD] ratios observed in high-mass
7
A. Faure et al.: Hydrogen isotope exchanges in interstellar ices
Table 3. Comparison between observational fractionation ratios in the IRAS 16293-2422 hot corino source and our best model. Numbers inbrackets denote the power of ten.
Species Best model Observations ReferencesHDO 2.5(-2) 6.6(-4)-5.0(-2) Coutens et al. (2013)
Persson et al. (2014)D2O 1.7(-4) !3.0(-4) Coutens et al. (2013)CH3OD 2.0(-2) 1.8+2.2
"1.2(-2) Parise et al. (2006)CH2DOH 3.6(-1) 3.7+3.8
"1.9(-1) Parise et al. (2006)CH2DOD 7.2(-3) - -CD2HOH 4.4(-2) 7.4+8.4
"4.4(-2) Parise et al. (2006)CD2HOD 8.8(-4) - -CD3OH 1.8(-3) 8.0+6.0
"6.0(-3) Parise et al. (2004)CD3OD 3.5(-5) - -
60 70 80 90 100 110 120 130 140Grain temperature (K)
10-8
10-7
10-6
10-5
[CH3OH]
ice gas
Fig. 4. Gas phase and ice abundance of CH3OH as a function of graintemperature. The abundance towards Orion KL is represented by theorange hatched zone (Neill et al. 2013). The solid vertical dashed linedenotes Td = 100 K. See text for details.
protostars. In particular, our model matches the observationalratio towards the Compact Ridge (# 1.2 ± 0.3) for an initial[s-HDO]/[s-H2O] in the range 5 " 8 $ 10"3. Again, the deter-mined range of D/H ratios for water ice is consistent with the up-per limits derived towards high-mass protostars, i.e. [s-HDO]/[s-H2O]< 10"2 (Dartois et al. 2003). In contrast to IRAS 16293-2422, the deduced primitive D/H ratio of water ice ([s-HDO]/[s-H2O]# 0.6%) is similar to that of methanol (see Table 2)in thatit corresponds to a statistical deuteration with an accreting D/Hatomic ratio !m # !w # 2 " 3 $ 10"3.
As above, we can employ Eq. (35) for a dust temperatureTd = 100 K and !m = 2 $ 10"3, i.e.
[CH2DOH][CH3OD]
=0.0073
[HDO]/[H2O]. (37)
Equation (37), plotted in Fig. 5 as a dotted line, reproducesvery well the ratio [g-CH2DOH]/[g-CH3OD] for all initial waterdeuterations over the range 10"3 " 10"1. Indeed, in this case thedominant reservoir of exchangeable deuterium atoms in the iceis always water ([HDO]> 5 $ 10"8 while [CH3OD]=4 $ 10"9).Hydroxyl-deuterated methanol thus gets enriched in deuterium
10-3
10-2
10-1
Initial [s-HDO]/[s-H2O]
0
1
2
3
4
5
[g-CH2DOH]/[g-CH 3OD]
Fig. 5. Gas-phase abundance ratio of the singly deuterated isotopo-logues of methanol, [g-CH2DOH]/[g-CH3OD], as function of the initial(cold) water ice deuteration. The dotted line corresponds to Eq. (37).The ratio towards Orion KL is represented by the orange hatched zone(Neill et al. 2013).
through H/D exchanges with HDO, except when [s-HDO]/[s-H2O]! 3 $ 10"3 where the ratio [g-CH2DOH]/[g-CH3OD] ex-ceeds 3.
In Fig. 6 we plotted the D/H ratio of gaseous water as func-tion of the initial D/H ratio of water ice. As expected, the gas-phase ratio is only (and slightly) increased with respect to theinitial ice-phase value when the initial [s-HDO]/[s-H2O] is lowerthan # 10"3. For the best value [s-HDO]/[s-H2O]=0.6%, the [g-HDO]/[g-H2O] ratio is thus found to be 6.0 $ 10"3. This is ingood agreement with the observational values derived by Neillet al. (2013) in the Compact Ridge, [g-HDO]/[g-H2O]=3.8+3.6
"2.5 $10"3. As a result, in this source, the post-evaporative chemistryof water seems negligible.
Finally, in Table 4, we summarize the results of our bestmodel, corresponding to an initial [s-HDO]/[s-H2O] of 0.6%. Avery good agreement with the observations is obtained again, butwe stress that no multiply deuterated isotopologues are detectedin the Compact Ridge. Our model predicts in particular columndensities for CH2DOD and CD2HOH of # 2.2 $ 1013 cm"2 and
8
Parise et al. (2006) Neill et al. (2013)

Gas-phase HDO
IRAS-16293 Orion-KL
A. Faure et al.: Hydrogen isotope exchanges in interstellar ices
10-3
10-2
10-1
Initial [s-HDO]/[s-H2O]
0
10
20
30
40
50
60
[g-CH2DOH]/[g-CH 3OD]
Fig. 2. Gas-phase abundance ratio of the singly deuterated isotopo-logues of methanol, [g-CH2DOH]/[g-CH3OD], as function of the ini-tial water ice deuteration. The dust temperature is taken as 100 K.The dotted line corresponds to Eq. (36). The ratio observed towardsIRAS 16293-2422 is represented by the orange hatched zone (Pariseet al. 2004).
Equation (36) is plotted in Fig. 2 as a dotted line. We can observethat it reproduces very well the ratio [g-CH2DOH]/[g-CH3OD]for initial water deuteration larger than ! 5"10#2. In this regime,the main reservoir of exchangeable deuterium atoms in the ice iswater ([s-HDO]> 2.5 " 10#6) and the HDO abundance is notmodified by H/D exchanges with methanol since the (initial)CH3OD abundance is only 1.8 " 10#7. In contrast, at lower ini-tial water deuteration, i.e. [s-HDO]/[s-H2O]! 5 " 10#2, the rela-tive amount of deuterium atoms in CH3OD becomes significant.In this regime, water gets enriched in deuterium through H/Dexchanges with CH3OD and the model deviates from Eq. (36)since the solid HDO abundance has increased.
In order to illustrate this last point, in Fig. 3 we plotted theD/H ratio of gaseous water as function of the initial D/H ratio ofwater ice. If the D/H ratio of water ice was conserved during thesublimation process, i.e. if there was no H/D exchange, then thecurve would follow the y = x function represented by the dashedline. As expected, however, when the initial [s-HDO]/[s-H2O]is lower than ! 5 " 10#2, the gas-phase ratio is systematicallyincreased with respect to the initial ice-phase value, by up to afactor of 50 at [s-HDO]/[s-H2O]=10#4. For the best value [s-HDO]/[s-H2O]=2% (see Fig. 2), the [g-HDO]/[g-H2O] values isfound to be 2.5 " 10#2. As shown in Fig. 3, this is consistentwith the range of observational ratios [g-HDO]/[g-H2O] mea-sured in the hot corino of IRAS 16293 by Coutens et al. (2013).We emphasize that observational uncertainties are large owing tooptical thickness problems. In any case, if the post-evaporativechemistry has no significant e!ect on the deuterium and waterchemistry, as assumed here, our model then predicts a D/H ratiofor gaseous water of ! 2.5% in the hot corino of IRAS 16293-2422. This value is in good agreement with the best-fit value of1.8 % derived by Coutens et al. (2013) from their multi-line anal-ysis. On the other hand, if the low value of 9.2±2.6"10#4 derivedfrom the interferometric observations of Persson et al. (2013) isconfirmed, then our model suggests that a significant additionalproduction of gaseous H2O must occur during the (short) hotcore phase.
10-4
10-3
10-2
10-1
Initial [s-HDO]/[s-H2O]
10-4
10-3
10-2
10-1
[g-HDO]/[g-H2O]
Fig. 3. Gas-phase deuterium fractionation of water, [g-HDO]/[g-H2O],as function of the initial water ice deuteration. The ratio observed to-wards IRAS 16293-2422 is represented by the orange hatched zone(Coutens et al. 2013).
Finally, in Table 3, we summarize the results of our bestmodel, corresponding to an initial [s-HDO]/[s-H2O] of 2%. Agood agreement with the observations is obtained, including themultiply deuterated isotopologues. The next isotopologue to bediscovered is obviously CH2DOD, for which our model predictsa column density of ! 1.2" 1015 cm#2 or an abundance (relativeto nH) of 5.8 " 10#9. To the best of our knowledge, however, ex-perimental frequencies in the millimetre range are not availablefor this isotopologue. We can also notice that the fractionationratio of D2O predicted by our model (1.7"10#4) agrees within afactor of !2 with the best-fit value of 7"10#5 derived by Coutenset al. (2013) The value quoted in Table 3 is the upper limit at 3!.
3.2. High-mass protostar: Orion Compact Ridge
The steady-state gas- and ice-phase abundances (relative to nH)of CH3OH in the Compact Ridge are plotted in Fig. 4 asa function of dust temperature. In this plot, the initial waterfractionation ratio is again taken as [s-HDO]/[s-H2O]=1%. Asobserved previously, the CH3OH abundance increases sharplyabove 90 K and solid methanol is entirely sublimated for tem-peratures higher than 110 K. The CH3OH abundance in theCompact Ridge is estimated as ! 7.5"10#7, with a column den-sity of 6.0 " 1017 cm#2 (Neill et al. 2013). The orange hatchedzone in Fig. 4 depicts the corresponding uncertainty of a factorof 2. It is found that the observed abundance is consistent with adust temperature of ! 100 K. Thus, in contrast to IRAS 16293-2422, our model suggests that a large fraction (" 40%) of the icemantles has evaporated in the compact ridge (assuming that theice composition in the Compact Ridge is typical of high-masssources). In the following, a standard hot-core dust temperatureof 100 K is employed.
The gas-phase ratio [g-CH2DOH]/[g-CH3OD] obtained withour model is plotted in Fig. 5 as function of the initial waterice deuteration [s-HDO]/[s-H2O]. It is found to be below thestatistical value of 3, as soon as the initial water deuterationis larger than ! 3 " 10#3. Thus, isotopic H/D exchanges be-tween methanol and water can also quantitatively explain thesmall [g-CH2DOH]/[g-CH3OD] ratios observed in high-mass
7
A. Faure et al.: Hydrogen isotope exchanges in interstellar ices
Table 4. Comparison between observational fractionation ratios in the Orion Compact Ridge hot core source and our best model. Numbers inbrackets denote the power of ten.
Species Best model Observations ReferencesHDO 6.0(-3) 3.8+3.6
!2.5(-3) Neill et al. (2013)D2O 1.0(-5) - -CH3OD 4.9(-3) 5.0+1.0
!1.0(-3) Neill et al. (2013)CH2DOH 6.0(-3) 5.8+1.2
!1.2(-3) Neill et al. (2013)CH2DOD 2.9(-5) - -CD2HOH 1.2(-5) - -CD2HOD 2.5(-8) - -CD3OH 8.2(-9) - -CD3OD 1.7(-11) - -
10-4
10-3
10-2
10-1
Initial [s-HDO]/[s-H2O]
10-4
10-3
10-2
10-1
[g-HDO]/[g-H2O]
Fig. 6. Gas-phase deuterium fractionation of water, [g-HDO]/[g-H2O],as function of the initial water ice deuteration. The ratio observed to-wards Orion KL is represented by the orange hatched zone (Neill et al.2013).
" 9.2 # 1012 cm!2, respectively, corresponding to abundances(relative to nH) of 2.7 # 10!11 and 1.2 # 10!11.
4. Discussion
The above chemical kinetics model can be summarized by thefollowing three phases: first, the cold accretion phase, corre-sponding to the prestellar stage of star formation. In this ini-tial phase, we have assumed that the D/H ratio of both waterand methanol is statistical and proceeds in the ice through theaddition of H and D atoms on solid O and CO, respectively.This deuteration process takes place when the dust tempera-ture is around 10 K and water ice is amorphous. The key pa-rameter during this phase is the accreting D/H gas-phase ratio,which controls the level of deuteration in the ice. This param-eter was fixed for methanol by assuming that the fractionationof the gas-phase CH2DOH, as observed in hot cores, reflects theprimitive methanol ice deuteration. As the accreting D/H ratioincreases with time (see below), as well as the O and CO deple-tion onto grains, a di!erent fractionation for water was explored.At this stage, the ratio [s-CH2DOH]/[s-CH3OD] is equal to 3,which is the statistical value. In the second stage, the warm-up
phase, the dust mantles are heated by the nascent protostar. Inour model, the temperature jumps from 10 K to 100 K are in-stantaneous. During this phase, amorphous water is convertedto the stable cubic crystalline form and this reorganization pro-cess is accompanied, in its very initial phase, by the mobility ofwater and the lability of protons and deuterons. Hydrogen iso-tope exchanges are triggered during this phase, as demonstratedexperimentally by Faure et al. (2015). At this stage, the ratio[s-CH2DOH]/[s-CH3OD] is no longer equal to 3 because the -OH groups of methanol have equilibrated with water ice. The [s-CH2DOH]/[s-CH3OD] ratio is therefore inversely proportionalto the [s-HDO]/[s-H2O] ratio. In the third stage, the hot corephase, the mantles are (partially or entirely) sublimated and the[g-CH2DOH]/[g-CH3OD] ratio established in the ice during thewarm-up phase is transferred (and conserved) into the gas phase.
The main result of this work is that except for the -CH func-tional groups, the gas-phase molecular D/H ratios measured inhot cores cannot be employed to infer the primitive deutera-tion in the ices. Molecules with functional groups able to es-tablish hydrogen bonds (e.g. -OH or -NH) are indeed expectedto equilibrate with water ice during the warm-up phase, withshort timescales with respect to desorption. For these species,the fractionation ratio [XD]/[XH] should scale inversely with thefractionation of water through the equilibrium constant. We haveshown that this is the case for hydroxyl-deuterated methanol andthat the [g-CH2DOH]/[g-CH3OD] ratios measured in hot coresreflect H/D equilibrium in water ice: ratios above the statisticalvalue of 3 show evidence of a large fractionation of methanolrelative to water, while values below 3 attest a similar fraction-ation for methanol and water. As a result, the [g-CH2DOH]/[g-CH3OD] ratio is a very sensitive probe of the [s-HDO]/[s-H2O]ratio, for which only upper limits can be determined observation-ally (Galvez et al. 2011). This result certainly extends to other in-terstellar molecules containing di!erent functional groups, suchas formic acid (HCOOH), methylamine (CH3NH2), formamide(HCONH2), etc. We emphasize that the H/D exchange rate con-stant between methylamine and water has been measured inthe laboratory by Faure et al. (2015). The activation energywas found to be even lower (" 3300 K) than in the case ofmethanol. To the best of our knowledge, however, the deuter-ated isotopologues of CH3NH2 have not been detected yet in theISM. Another interesting candidate is ammonia (NH3), which isabundant in ice (" 5% with respect to water) and for which allmultiply-deuterated isotopologues have been identified (Roue!et al. 2005). H/D exchanges between NH3 and D2O have beenobserved recently by Lamberts et al. (2015). H/D exchanges be-tween water and -NH bearing molecules will be adressed in a
9
Coutens et al. (2013)
Neill et al. (2013))
Persson et al. 2014
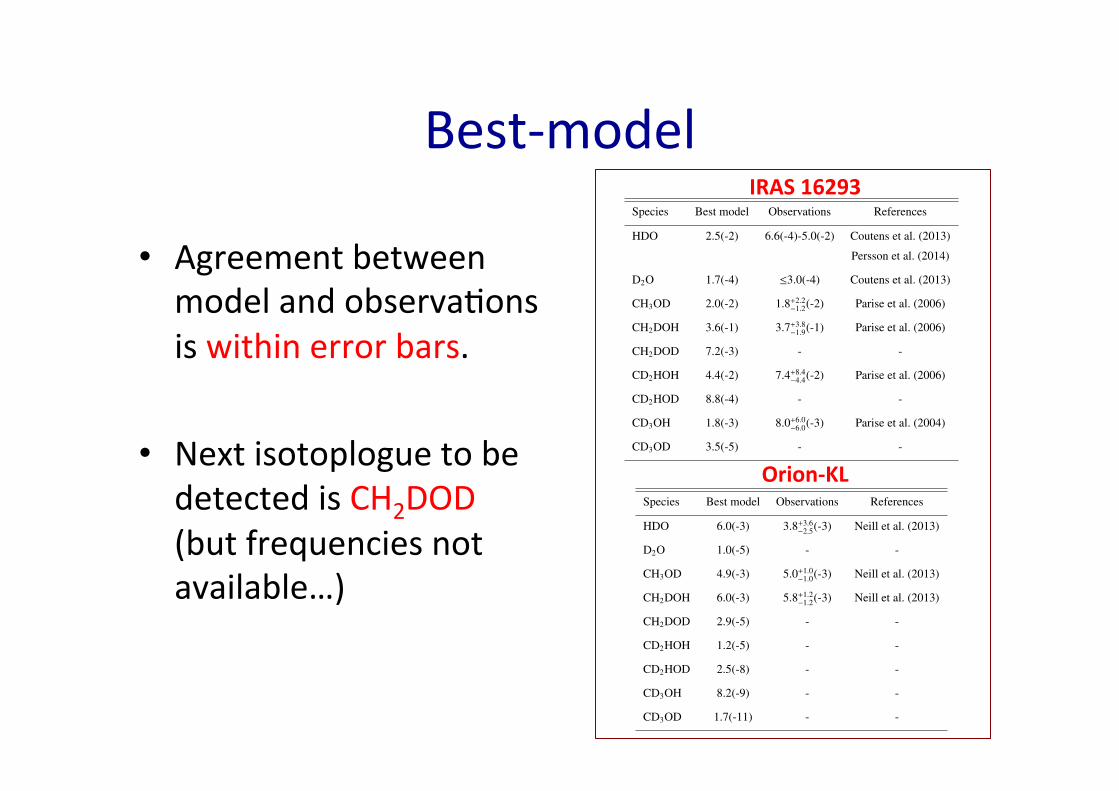
Best-‐model
• Agreement between model and observa:ons is within error bars.
• Next isotoplogue to be detected is CH2DOD (but frequencies not available…)
A. Faure et al.: Hydrogen isotope exchanges in interstellar ices
10-4
10-3
10-2
10-1
Initial [s-HDO]/[s-H2O]
10-4
10-3
10-2
10-1
[g-HDO]/[g-H2O]
Fig. 3. Gas-phase deuterium fractionation of water, [g-HDO]/[g-H2O], as function of the initial water ice
deuteration. The ratio observed towards IRAS 16293-2422 is represented by the orange hatched zone (Coutens
et al. 2013).
Table 3. Comparison between observational fractionation ratios in the IRAS 16293-2422 hot corino source
and our best-model. Numbers in brackets denote the power of ten.
Species Best model Observations References
HDO 2.5(-2) 6.6(-4)-5.0(-2) Coutens et al. (2013)
Persson et al. (2014)
D2O 1.7(-4) !3.0(-4) Coutens et al. (2013)
CH3OD 2.0(-2) 1.8+2.2"1.2(-2) Parise et al. (2006)
CH2DOH 3.6(-1) 3.7+3.8"1.9(-1) Parise et al. (2006)
CH2DOD 7.2(-3) - -
CD2HOH 4.4(-2) 7.4+8.4"4.4(-2) Parise et al. (2006)
CD2HOD 8.8(-4) - -
CD3OH 1.8(-3) 8.0+6.0"6.0(-3) Parise et al. (2004)
CD3OD 3.5(-5) - -
a dust temperature of # 100 K. Thus, in contrast to IRAS 16293-2422, our model suggests that
a large fraction (! 40%) of the ice mantles has been evaporated in the compact ridge (assuming
that the ice composition in the Compact Ridge is typical of high-mass sources). In the following, a
standard hot-core dust temperature of 100 K will be employed.
The gas-phase ratio [g-CH2DOH]/[g-CH3OD] obtained with our model is plotted in Fig. 5 as
function of the initial water ice deuteration [s-HDO]/[s-H2O]. It is found to be below the statistical
value of 3, as soon as the initial water deuteration is larger than # 3 $ 10"3. Thus, isotopic H/D
exchanges between methanol and water can also explain quantitatively the small [g-CH2DOH]/[g-
CH3OD] ratios observed in high-mass protostars. In particular, our model matches the observa-
14
A. Faure et al.: Hydrogen isotope exchanges in interstellar ices
Table 4. Comparison between observational fractionation ratios in the Orion Compact Ridge hot core source
and our best-model. Numbers in brackets denote the power of ten.
Species Best model Observations References
HDO 6.0(-3) 3.8+3.6!2.5(-3) Neill et al. (2013)
D2O 1.0(-5) - -
CH3OD 4.9(-3) 5.0+1.0!1.0(-3) Neill et al. (2013)
CH2DOH 6.0(-3) 5.8+1.2!1.2(-3) Neill et al. (2013)
CH2DOD 2.9(-5) - -
CD2HOH 1.2(-5) - -
CD2HOD 2.5(-8) - -
CD3OH 8.2(-9) - -
CD3OD 1.7(-11) - -
4. Discussion
The above chemical kinetics model can be summarized by the following three phases: first, the
cold accretion phase, corresponding to the prestellar stage of star formation. In this initial phase,
we have assumed that the D/H ratio of both water and methanol is statistical and proceeds in the ice
through the addition of H and D atoms on solid O and CO, respectively. This deuteration process
takes place when the dust temperature is around 10 K and water ice is amorphous. The key param-
eter during this phase is the accreting D/H gas-phase ratio, which controls the level of deuteration
in the ice. This parameter was fixed for methanol by assuming that the fractionation of the gas-
phase CH2DOH, as observed in hot cores, reflects the primitive methanol ice deuteration. As the
accreting D/H ratio increases with time (see below), as well as the O and CO depletion onto grains,
a di!erent fractionation for water was explored. At this stage, the ratio [s-CH2DOH]/[s-CH3OD] is
equal to 3, the statistical value. In the second stage, the warm-up phase, the dust mantles are heated
by the nascent protostar. In our model, the temperature jumps from 10 K to 100 K are instanta-
neous. During this phase, amorphous water is converted to the stable cubic crystalline form and
this reorganization process is accompanied, in its very initial phase, by the mobility of water and
the lability of protons and deuterons. Hydrogen isotope exchanges are triggered during this phase,
as demonstrated experimentally by Faure et al. (2015). At this stage, the ratio [s-CH2DOH]/[s-
CH3OD] is no longer equal to 3 because the -OH groups of methanol have equilibrated with water
ice. The [s-CH2DOH]/[s-CH3OD] ratio is therefore inversely proportional to the [s-HDO]/[s-H2O]
ratio. In the third stage, the hot core phase, the mantles are (partially or entirely) sublimated and
the [g-CH2DOH]/[g-CH3OD] ratio established in the ice during the warm-up phase is transferred
(and conserved) into the gas-phase.
The main result of this work is that except for the -CH functional groups, the gas-phase molec-
ular D/H ratios measured in hot cores cannot be employed to infer the primitive deuteration in the
ices. Molecules with functional groups able to establish hydrogen bonds (e.g. -OH or -NH) are
indeed expected to equilibrate with water ice during the warm-up phase, with short timescales with
respect to desorption. For such species, the fractionation ratio [XD]/[XH] should scale inversely
with the fractionation of water through the equilibrium constant. We have shown that this is the
17
IRAS 16293
Orion-‐KL

Analy:cal solu:on
• D-methanol [CH2DOH]/[CH3OD] = 3*(D/H)m*exp(-‐ΔH/T)/(D/H)w ~ (D/H)m/(D/H)w
[See Faure et al. A&A 583 A98 (2015)]
• Statistical deuteration [CH2DOH]/[CH3OH] = 3*(D/H)m
• Reversibility [CH3OH]/[CH3OD] = 2*exp(-ΔH/T)*[H2O]/[HDO] = exp(-ΔH/T)/(D/H)w

Conclusions • Molecules with –OD or –ND bonds (not –CD) can isotopically equilibrate with water ice
• D/H ra:os measured in hot cores may not be representa:ve of the original mantles
• D-‐methanol is a poten:al probe of water deutera:on in the ice

Perspectives
• D-‐methanol in cold cores (Bizzocchi et al. 2014) and Sgr B2(N2) (Belloche et al. 2015)
• D-‐isotopologues of NH2CHO and CH2OH-‐CHO recently detected with ALMA (talk by A. Coutens)
• Inves:gate other (non thermal) desorp:on mechanisms, i.e. UV and cosmic ray impact.